Task forces on HOUSING AND URBAN DEVELOPMENT, Planning ...
531
TASK FOR"CES ON HOUSING AND URBAN DEVELOPMENl PLANNING OF URBAN DEVELOPMENT PLANNING COMMISSION GOVERNMENT OF INDIA NEW DELHI SEPTEMBER 1983 ?ol 'JorJ'J,:r1" T "
Transcript of Task forces on HOUSING AND URBAN DEVELOPMENT, Planning ...
TASK FOR"CES ON HOUSING AND URBAN DEVELOPMENl
PLANNING OF URBAN DEVELOPMENT
PLANNING COMMISSION
GOVERNMENT OF INDIA
NEW DELHI
SEPTEMBER 1983
?ol 'JorJ'J,:r1" T J1~ "
TASK FORCES ON
HOUSING AND URBAN DEVELOPMENT
I PLANNING OF URBAN
DEVELOPMENT
PLANNING COMMISSION
GOVERNMENT OF INDIA
NEW DELHI
SEPTEMBER .1983
CONTENTS
Page
SUMMARY OF FINDINGS AND RECOMMENDATION~. (vii)
Preiace • taxi)
A-THE PLANNING OF URBAN DEVELOPMENT
I. URBAN DEVELOPMENT IN INDIA: REASONS"AND OBJECTIVES
The Longer Term 1
The Shorter Term 4
II. URBANIZATION IN INDIA: THE RECORD
Introduction 6
The Record since 1901 8
The Size Distribution of Town and Cities 12
The Regional Pattern of Urban Growth and Economic Development . . 19
I.
The Urban Rural Distribution of Income and Employment 26
Appendix A 2.1 32
Appendix A2.2 34
Appendix Tables A 2.1 to A 2.6 38
III. URBANISATION IN THE YEAR 2001
Introduction 44
Population Projections • 44
The Disaggregation of Urban Population Projections 49
The Growth of Employment and Labour Force 56
The Growth of Urban Income 60
Appendix Tables A 3.3 to A 3.7 .
IV. MECHANISMS FOR THE PLANNING OF URBAN DEVELOPMENT
Themes in Indian Urban Policy 68
Urban Development Planning : Suggestions for a New Approach 76
Recommendations for Institutional Changes . 83
(ii)
Page
V. PLANNING FOR METROPOLITAN AREAS
Problems in the Existing Approaches to Metropolitan Planning 93
Towards Better Planning
Approaches to Metropolitan Development 96
Suggested Procedures for Realistic Metropolitan Planning 98
VI. COORDINATION DEVELOPEMT
Introduction
OF INDUSTRIAL AND URBAN
102
Local Level Links .'
Higher Level Links
103
1°9
VII. THE URBANISATION OF NEW AREAS
Introduction
The Pattern of Urbanisation by Sub-Regions. II3
Regional Urban Growth lIB
Appendix Tables A 7.1 to A 7· 3 120
B-URBAN LAND POLICY
VIII. URBAN LAND POLICY IN INDIA: A REVIEW CRITIQUE
Background : Principles of Urban Land Policy
AND
128
Existing Approaches to Land Policy
What has gone wrong?
The Need for a New Approach
IX. URBAN LAND POLICY: SOME NEW DIRECTIONS
Introduction 143
A Review of Legislation Affecting Urban Land
Assembly and Development of Urban Land: What can be done?
143
146
Urban Renewal and Redensification 149
X .. INNOVATIVE METHODS OF LAND ASSEMBLY AND DEVELOPMENT : LAND READJUSTMENT AND TOWN PLANNING SCHEMES
Introduction 152
The Land Readjustment System 152
Town Planning Schemes 154
Land Readjustment and Town Planning Schemes Compared 156
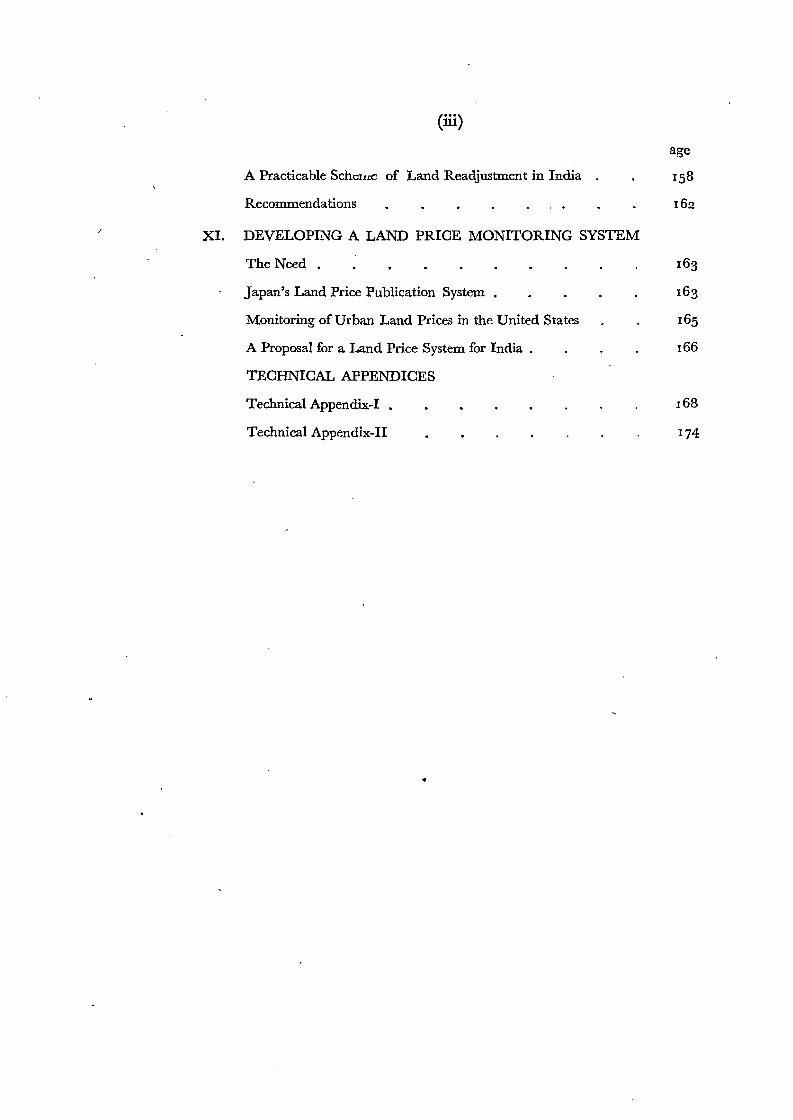
(iii)
A Practicable SChCltLG of Land Readjustment in India
Recommendations
XI. DEVELOPING A LAND PRICE MONITORING SYSTEM
The Need • 163
Japan's Land Price Publication System 163
Monitoring of Urban Land Prices in the United States 165
A Proposal for a Land Price System for India . 166
TECHNICAL APPENDICES
Technical Appendix-I • 168
Technical Appendix-II 174
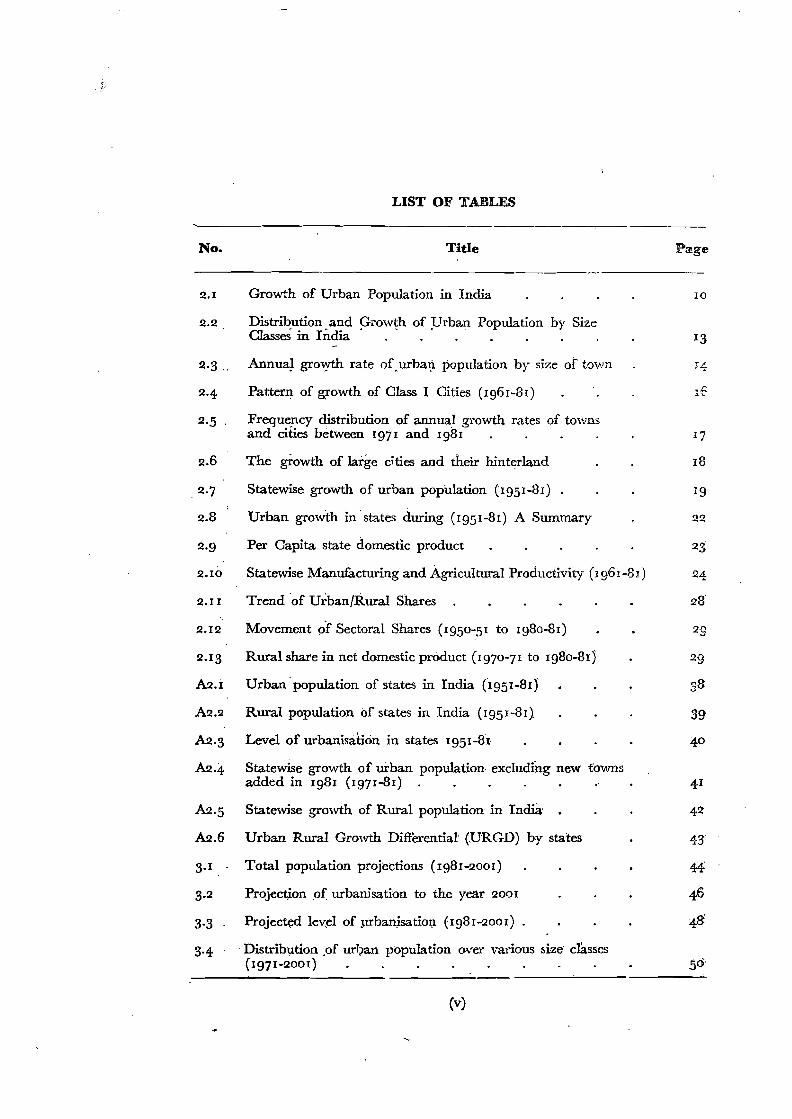
LIST OF TABLES
No. Title Page
2.1 Growth of Urban Population in India 10
2.2 Distribution .and 9row1;h of Urban Population by Size Classes in India . . . . .
2.3.. Annual growth rate of'urban population by size of town
2.4 Pattern of growth of Class I Cities (1961-81)
2.5 Frequency distribution of annuai growth rates of towns and cities between 1971 and 1981 . . . . 17
2.6 The growth of large cities and their hinterland 18
,2.7 Statewise growth of urban population (1951-81) 19
2.8 Urban growth instates during (1951-81) A Summary 22
2.9 Per Capita state domestic product
2.10 Statewise Manufacturing and Agricultural Productivity (>961-81)
2.11 Trend 'of Urban/Rural Shares
2.12 Movement 9f Sectoral Shares (1950-51 to 1980-81)
2.13 Rural share in net domestic product (1970-71 to 1980-8r)
A2.i Urban' population of states in India (1951-81)
A2.2 Rural population of states in India (1951-81). 39
A2.3 Level of urbanisation in states 1951-81
A2.4 Statewise growth of urban population excluding new towns added in 1981 (1971-81)
A2'5 Statewise growth of Rural population in India'
A2.6 Urban Rural Growth Differential' (URGD) by states
3.1 Total population projections (1981-2001)
3.2 Projection of urbanisation to the year 2001
3.3 Projected Ievel of urbanisation (1981-2001) .
3.4 'Distribution ,of urban population over various size' classes (1971-2001)
(v)
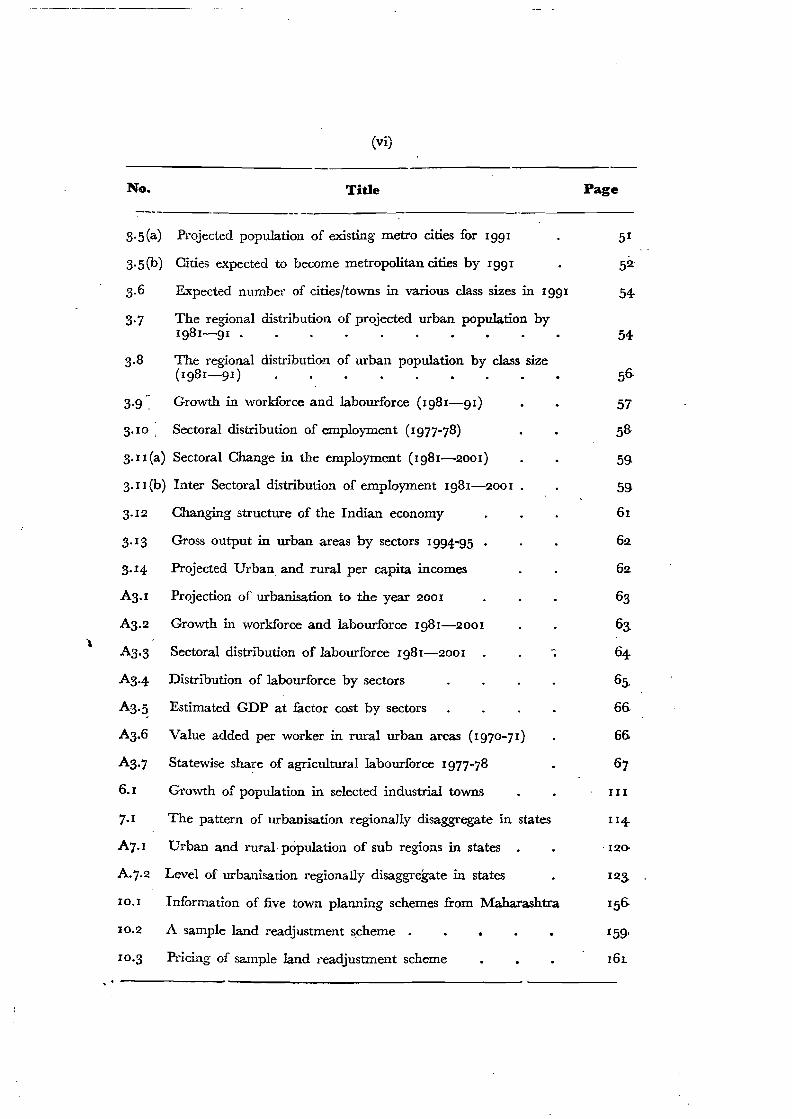
(vi)
No. Title Page
S·5(a) Projected population of existing metro cities for 1991 51
S'5(b) Cities expected to become metropolitan cities by 1991 52:
S.6 Expected number of cities/towns in various class sizes in 1991 54
S.7 The regional distribution of projected urban population by 1981--91 . 54
S.8 The regional distribution of urban population by class size (1981- 91) 56
S·9 . Growth in workforce and labourforce (1981-91) 57
3.10, Sectoral distribution of employment (1977-78) 58
3.II (a) Sectoral Change in the employment (1981-2001)
3·Il (b) Inter Sectoral distribution of employment 1981--2001
3. 12 Changing structure of the Indian economy 61
3. 13 Gross output in urban areas by sectors 1994-95
3. 14 Projected Urban and rural per capita incomes
AS·I Projection of urbanisation to the year 2001
AS·2 Growth in workforce and labourforce 1981--2001
AS·3 Sectoral distribution of labourforce 1981--2001 "' AS·4 Distribution of labourforce by sectors
AS'S Estimated GDP at factor cost by sectors
A3·6 Value added per worker in rural urban areas (1970-71) 66
AS·7 Statewise share of agricultural labourforce 1977-78 67
6.1 Growth of population in selected industrial towns III
7.1 The pattern of urbanisation regionaJIy disaggregate in states 114
A7·1 Urban and rural population of sub regions in states -120
A.7· 2 Level of urbanisation regionally disaggregate in states 12S.
10.1 Information of five town planning schemes from Maharashtra 156
10.2 A sample land readjustment scheme . 159'
10·3 Pricing of sample land readjustment scheme 16L
,
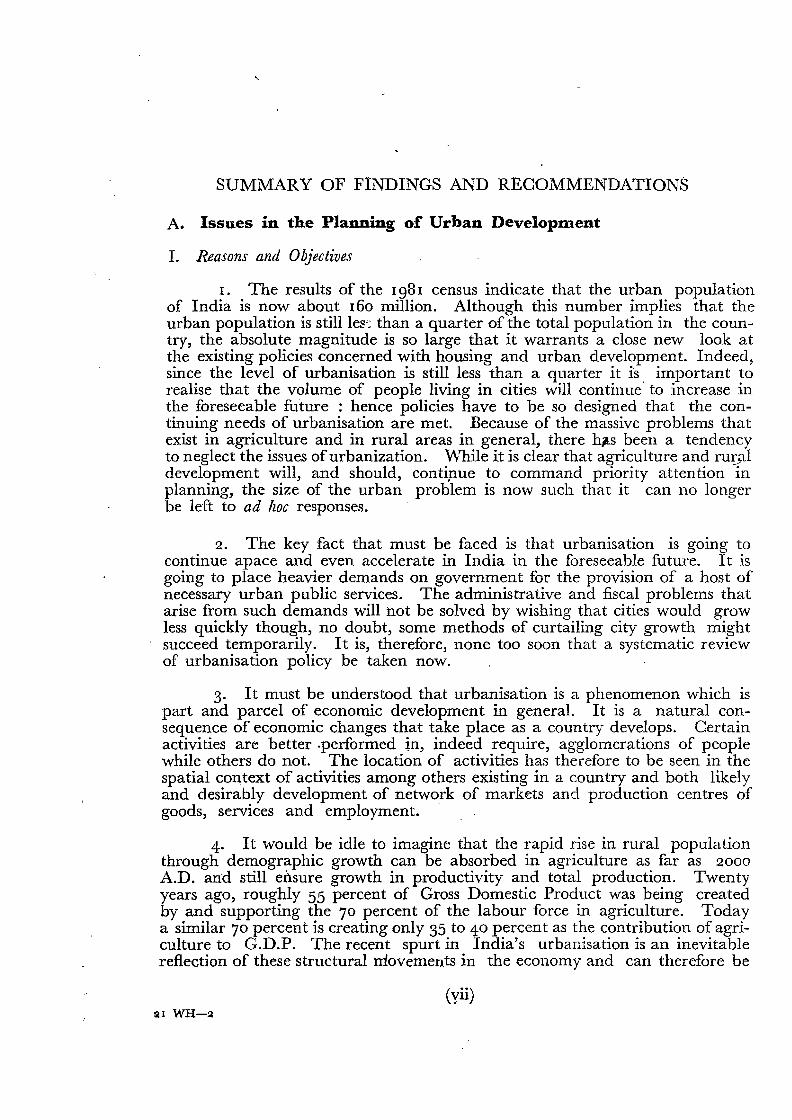
SUMMARY OF FINDINGS AND RECOMMENDATIONS
A. Issues in the Planning of Urban Developm.ent
1. Reasons and Objectives
I. The results of the 1981 census indicate that the urban population of India is now about 160 million. Although this number implies that the urban population is still les: than a quarter of the total population in the country, the absolute magnitude is so large that it warrants a close new look at the existing policies concerned with housing and urban development. Indeed, since the level of urbanisation is still less than a quarter it is. important to realise that the volume of people living in cities will continue to increase in the foreseeable future : hence policies have to be so designed that the continuing needs of urbanisation are met. Because of the massive problems that exist in agriculture and in rural areas in general, there has been a tendency to neglect the issues ofurbanization. v\Thile it is clear that agriculture and rUG'Ll development will, and should, continue to command priority attention in planning, the size of the urban problem is now such that it can no longer be left to ad hoc responses.
2. The key fact that must be faced is that urbanisation is going to continue apace and even accelerate in India in the foreseeable future. It is going to place heavier demands on government for the provision of a host of necessary urban public services. The administrative and fiscal problems that arise from such demands will hot be solved by wishing that cities would grow less quickly though, no doubt, some methods of curtailing city growth might succeed temporarily. It is, therefore, none too soon that a systematic review of urbanisation policy be taken now.
3. It must be understood that urbanisation is a phenomenon which is part and parcel of economic development in general. It is a natural consequence of economic changes that take place as a country develops. Certain activities are better .performed in, indeed require, agglomerations of people while others do not. The location of activities has therefore to be seen in the spatial context of activities among others existing in a country and both likely and desirably development of network of markets and production centres of goods, services and employment.
4. It would be idle to imagine that the rapid rise in rural population through demographic growth can be absorbed in agriculture as far as 2000
A.D. and still ensure growth in productivity and total production. Twenty years ago, roughly 55 percent of Gross Domestic Product was being created by and supporting the 70 percent of the labour force in agriculture. Today a similar 70 percent is creating only 35 to 40 percent as the contribution of agriculture to G.D.P. The recent spurt in India's urbanisation is an inevitable reflection of these structural movements in the economy and can therefore be
(yii) a r WH-2
(viii)
expected to continue in a similar direction and speed. In the interest of keeping urban/rural and income disparities to a minimum, policy towards urbanisation should be positive, encouraging the sharing ofurban income among a larger proportion of people. This thrust should consist of a rapid expansion of non-agricultural livelihoods and employment assisted by the promotion of education and technological skills at urban and semi-urban nodes.
II. Urbanisation in India : The Record
5. It should be clear that India is not faced with an "urban explosion" as compared with trends in the rest of the world. In 30 years, its level of urbanisation has increased from about 17 percent in Ig51 to only about 23.7 percent in 198!. This, however, is no ground for complacency. In absolute terms, India's urban population increased by about 50 million people over the last decade. This increase itself is larger than the total urban population in all countries in the world except China, the Soviet Union, the United States, Japan and Brazil. Indeed, it is likely that India's urban population will be greater than that in all countries except China by 1985'
6. Although total urban population increased six-fold between Ig01
and 1981, from about 26 million to about 160 million, the number of settlements increased by only about 80 percent to 3245. Thus most of the growth was because of the enlargement of existing towns at every level and not merely because of the addition of new towns. The majority of settlements now classified as towns have exhibited urban characteristics for a very long time. There is some, evidence that the number of settlements regarded as towns was not very different as early as the sixteenth century. The spatial distribution and number of settlements therefore reflects a long and stable history. At the margin, however, there is considerable movement of settlements between urban and rural categories between censuses. This stable, rather static situation has resulted in vast areas of the country still continuing to be devoid ofurban settlements of any size leading to extremely low levels of urbanisation of 5-10
percent in these regions. A larger number of new towns should be encouraged to appear in these areas so that income and population growth can take place.
7. It is generally believed that (i) large cities have grown faster than and at the expense of small and medium towns; (ii) that this is undesirable and (iii) measures should be taken to retard large city growth. and that this can be done by placing greater investments in small and medium towns. First, it is not true that large cities have grown much faster, on an average, than small and medium towns. Second, the arithmetic of the growth and distribution of settlements is such that higher growth of small and medium towns will have little effect in magnitude on the growth of large cities. Third, fast growing small and medium towns soon become large cities. It must be understood that the growth of towns and cities has little to do with their size : explanations for differential growth rates are more likely to be found in their own particular economic characteristics and that of their regions.
8. This, however, is not the whole picture, since these average growth rates can be somewhat misleading. A higher proportion of larger cities is found to have higher growth rates than small ones and there is a tendency for a larger proportion of small towns to be slow growing. The variance in growth rates is
(ix)
much higher at the low end of the settleme!1t scal~. Howeve.r, the slow growing tO~8 have beer: found to be concentrated In pCl;rncular re~ons of the country which have vaned from decade to decade. It IS therefore Important that this phenomenon be investigated carefully.
9. There is considerable variation between states in their experience of urbanisation and economic development and this does not seem readily explicable at first sight. There has been a perceptible increase in interstate inequality as measured by per capita state domestic product. This has been caused largely by the relative sluggishness in agricultural productivity in the whole Eastern, Central Eastern and South Eastern regions. There have been notable increases in factory production in all states and particularly so, in relative terms, in the hitherto backward states. The combination of increased manufacturing' production' and agricultural stagnation in parts of the poorer states is likely to have caused the significant acceleration in urbanisation in the last decade. The richer agriculturally advanced area of Punjab, Haryana and Western Uttar Pradesh have also shown an acceleration in urbanisation in the last decade, after slow urban growth in the 1961-1971 decade. The indications, therefore, are that after initial labour absorption which occurs with green revolution type changes in agriculture, as income increases subsequently and further productivity changes occur, the rate of urbanisation is expected to accelerate. Hence, the evidence, particularly from the last decade, suggests that both agricultural growth and relative lack of it are likely to contribute towards further urbanisation in the foreseeable future.
III. Urbanisation in the Year 2001
10. It is expected that the total population of India will be in the range 850 to 860 million by 1991 and 990 to 1020 million by the year 2001. For all practical purposes we may regard 1000 milliom as the approximate expected population by the end of the century.
11. The level of urbanisation is expected to be between 27 and 28 percent in 1991 and between 31 and 32 percent in 2001. This implies an absolute increase in urban population of about 70 million in the current decade to about 235 million in 1991 and a further 80 to 85 million increase to about 315 to 320 million by the year 2001. The absolute increments in population in the second decade will therefore be about equal in rural and urban areas.
12. The number of cities with I million population and above is likely to increase to about 20 to 22 with a total population of 65-70 million by 1991 if there is some slow down in their current rates of growth. If current rates of growth continue, th~ir total population is likely ~C! be b~tween 70 t,o 75 million in 1991. Corresp~n~Ingly, t?e othe: Class .1 cItIes. WIth pop~I1atlOn betw~~n 100000 and I million are hkely to increase In number from Just over 200 In
198'1 to over 300 in 1991, with a ~'?tal ,Population of about 8~ mill~o~. This implies that the share ,?f Class I citres In tot~l urban pC!pulatlOn WIll Increase from about 60 percent III 1981 to 65 percent In 1991, while the share of metropolitap. cities alone will increase marginally from 27 to 28 percent.
\ I
(x)
13. The .population in towns expected to be in the Class II and Class III Categories (in the population range 20,000 to 100,000) can also be predicted with some confidence since almost all these towns exist already. This is likely to be in the range of 55 to 65 million (about 23 to 27 per cent of total urban population) depending on the emerging pattern of urbanisation. The population of the remaining towns of under 20,000 population is difficult to predict since many of these towns will be those newly classified as such. If past trends continue, their total population is likely to be about 25-30 million (about 10 to 13 per cent of total urban population), These ranges are indicative of the effect of urban policies on urban population distribution.
14. The implications of this rate of change in urban population are very striking for the rise in urban labour force. It is expected that while the absolute increase in rural labour force in the next three or four quinquennia will remain stable at about 22 million in each quinquennium, the net additions to urban labour force will keep increasing from about I3-I4 million in 1981-86 to I9-20 million in I996-2000. Thus, the net additions to rural and urban labour force will be almost comparable towards the end of the period. This reflects the rising weight of urban population increases in the total towards the end of the period, despite the relatively lower urban labour force participation rates. During the Seventh Plan itselfover 3 million urban jobs will have to be created annually. This calls for special attention to the problems of urban employment in the next IS years, relative to the past.
IS. The intersectoral changes in the distribution of labour force consistent with these projections imply a change in the share of agricultural population (including forestry and fisheries) from about 69.5 percent in 1981 to 66.9 per cent in 1991 and 64.5 per cent in 2001. The share ofmining and manufacturing during the same periods is expected to increase from about I I per cent to about 11.7 and and 12.5 per cent.
IV. Mechanisms for the Planning of Urban Development
I 6. Planning for urban development should essentially be supportive of economic development in the country, state or sub-region, be it in agriculture, extractive industries, manufacturing industry or in the tertiary sector. The provision of services and infrastructure removes constraints to the growth of these sectors or in some cases, promotes it. However, the provision of urban services such as transport, communication, water, sanitation, etc. and shelter alone is usually unlikely to stimulate large scale urban development. It is important to time investments in urban services and shelter to coincide with investments in agriculture and industry, mining and commerce which provide permanent sources of erriployment so that these types of investments can be fully productive. This should be the key objective of urban development planning. .
Modes of Urhan Planning
. 17· There has been very little by way of explicit urban policy at the n~tlOnal. lev.el. The approaches that have been followed can, at best, be described as piecemeal and desultory. Even schemes which were called "Integrated", e.g. "Integrated Urban Development Programme" (IUDP) and "Integrated Development of Small and Medium Towns" (IDSMT), were focussed on towns of different sizes : cities over 3 lakhs population in the case of LU.D.P. and towns under I lakh population in the case of IDSMT. The selection of
(xi)
towns was then quite erractic and little attempt has been made at planning of urban development as a whole. As mentioned, another major scheme was the preparation of Master Plans for a large number of cities but these were largely infructuous because of the lack of connection in the preparation of these physical plans with investment planning at the city, state and national levels. The other main interventions have been the metropolitan city and State capital projects and the various slum clearance and improvement schemes. In these cases, investments were made in response to major service deficits which could no longer be ignored or, in the case of the new State capitals, investments were made relatively lavishly in the provision of a very high level of infrastructure. Other lavish investments have been made in the establishment of new townships for large public sector enterprises such as the steel plants and heavy electrical plants.
18. The planning of urban development should be done at a regional or sub-regional level, though this has to be distinguished from regional planning as a whole. Regional urban systems can be identified according to their economic, climatic, geographical and transportation characteristics. Planning for urban development can thereafter be done on the basis of such regions according to the relative need and function of each town in its regional context. Thus, within each planning zone there would be no allocation to towns because of their size but more because of their function and need with particular emphasis on their respective industrial and employment potential. The physical and inves tment plans can then be dovetailed at the regional level and then fed into the State level plans which are; in turn, coordinated with the national plans. Recognition should be made of the metropolitan cities with regional, national & international functions, since these cities are not wedded to their regions for their existence and perform national level functions. '
19. , "",,'ithin towns and cities there is a much greater need for community participation as well as the exercise of private initiative and investment in urban development than exists at present. The delivery of the basic public services to everyone is not feasible without such an approach. At present there is little interaction between the citizen and city government, and sometimes even the state government. What is needed is community level institution building such that the needs of the community can be expressed in an organised manner as 'well as services provided in this fashion.
I
20. In order to accomplish this change in approach a number of institutional modifications have to be made to strengthen the procedures of urban development planning at the national, state and local levels. The key to the new approach is two-fold. First is the dialogue between physical and investment planning and second is the preparation of regional and sub-regional urban development plans to make the first possible. What is envisaged is that overall costing and allocation of resources to urban development should be done at the' national level between the Planning Commission and the Ministry of Works and Housing acting as the nodal Ministry, and other concerned ministries. Unlike the present ad hoc system of schemes, stases should be asked to prepare comprehensive state and regional urban development plans to qualify for urban investment allocation, given the overall cost standards. The latter .shouldjake account of different kinds of inter..regional variation.
(xii)
Recommendations for Institutional Changes
(a) National Level
(i) Planning Commission
Perspectioe Planning : Need for Integration of Urban Projects
2 I. At present there is no mechanism in the plan process to work out spatial (regional as well as urban/rural) implications of the sectoral pattern of in vestment that is envisaged in each five year plan. Before industrialisation the interlinkages between different parts of the economy were weak enough to be ignored in formal economic modelling. As the economy develops denser inter-sectoral as well as spatial linkages it becomes necessary to do this more systematically. There should therefore be a more conscious effort to integrate urban projections with economic modelling exercise. Such a procedure would also have important feed-back effects in working out the infrastructure and housing implications of the planned sectoral activities alongwith the implied demands for building materials.
Urban Impact qj Projects
22. A great number of industrial and other investment decisions have a m.ajor bearing on urban development. It is therefore suggested that just as projects over Rs. 10 crores are subject to project evaluation by the Project Appraisal Division, large projects generating direct employment of over 1000
persons or over Rs. 50 crores should also be required to file "Spatial Impact" or "Urban Impact" statements. These statements would detail the implied direct and indirect costs of urban infrastructure made necessary by these investments. These impact statements should include the most obvious implications of each project on employment (direct and indirect) basic services necessary for the implied employment social amenties for the n~V\l settlements, communications networks. housing, water supply, etc.
Housing and Urban Development Division.
23. If the suggestions made above are accepted it would also be necessary to uprgade the Housing and Urban Development Division technically to be able to use the information provided by the perspective plan projections and the "Urban Impact" statements for conversion to specific urban development programmes, projects and schemes. At present, the Housing and Urban Development Division is one of the smallest in the Commission. With increasing urbanisation and the need for more systematic planning it is suggested that the Division be strengthened technically with a whole-time technical Adviser made exclusively responsible for these activities. As at present, "Water Supply" should be included with this portfolio, since a considerable portion of urban infrastructure investment is due to water supply provision. Already 6-7% of Plan investment is covered by these sectors and this can be expected to increase in the future to about 10%.
(ii) The Ministry of T1101"ks and Housing
24· The responsibility for more detailed urban planning and developm.ent should rest with the Ministry of Works and Housing. This would become clearer
(xill)
if the Ministry is redesignated as the Ministry f9-r Human Settlements as has already been proposed. However, this new role would have to be properly defined and the Minirtry would have to be strengthened if it has to play an effective role in overseeing urban planning and development at the national level. It should be the nodal organisation for coordinating action in the matter of major investment decsion having key spatial implications. The Ministry would be responsible for working out the detailed urban investment implications of projected urbanisation at least the state level. This implies technical strengthening of the Ministry as well as of other technical organisations on whose expertise it can draw.
25. The Town and Country Planning Organisation should be re-oriented and enlarged as a strong technical arm of the Ministry. Its functions should be so extended that it can develop capability in and be responsible for (i) investment planning for urban developmentIii) appraisal of urban projects (iii) setting and monitoring of standards in urban projects (iv) evaluation of urban projects (v) constant search and review ofinnovative urban programmes (vi) organisation of an urban information system (vii) training needs in urban development planning and (viii) stimulating research on urban development in-house as well as in other institutions. In order to do this its interdisciplinary character should be strengthened and it could be redesignated as the "Human Settlements Planning Organisation" or equivalent. It would need even representation of economists, financial analysts, and town planners, along with support from demographers, geographers and statisticians It could continue some of its consultancy activities in physical planning.
Centrally Sponsored Scheme on Urban Development Planning
26. A re-orientation of urban development planning will not take place by mere re-naming of institutions. It is therefore necessary to launch a Ceniral Sponsored Schemefor funding the development of new urban development planning capability such that the integration ofphysical, investment andfinancial planning as envisaged can take place. The scheme would cover training and institutional needs arising from this reorientation at both the central and state levels.
Urban Research
27. There is great need for both basic as well as applied research on all issues connected with urbanisation. It is therefore necessary that urban research be strengthened and institutions carrying out such research supported in a systematic manner. There is a wide variety of institutions conducting urban research: SChools of planning, economics research institutes, institutes of management, the institutes of technology and universities. It is noted that the Ministry of Works and Housing has designated the National Institute of Urban Affairs as the nodal institution responsible for urban research. Its role as a clearing house of urban search and collection of data can be strengthened and systematised. At the same time, care should be taken to encourage the existing institutions conducting research in various aspects of migration and urbanisation to improve the quality of their work and their capability for undertaking different facets of planning for urban development. It is recommended that the new Ministry of Human Settlements should' work out procedures for the systematic strengthening of urban research in selected institutions around the country.
(xiv)
(b) The State Level
Coordination of Urban Development
28. An arrangement similar to the one suggested above for the centre may be suggested at the state level as well. It is important that machinery be established for the coordination of functions connected with urban development. This call, {or example, be done by consolidating the various fragmented responsibilities for urban development under one Department ofHuman Settlements. This has been attempted in one state where there is one Secretary for Housing, Local Self Government and Environment. The Department of Housing has under it a Housing Board, the Department of Environment is responsible for the Town and Country Planning Department, Development Authorities, Pollution Control Board, and the State Slum Clearance Board; the Department of Local Bodies is responsible for all the municipal corporations, municipalities and notified area committees. Even the happy event of one Secretary overseeing all the departments may not be able to achieve the vital interaction between them so necessary to eliminate wasteful expenditure and enterprise. The important thing is to ensure appropriate interaction so that the left hand knows what th e right hand has done and to be able to even stay it, if necessary.
29- As suggested for the T. C. P. O. at the Central Level the Town and Country Planning Departments (T. C. P. Ds) should be strengthened technically to perform the following functions:
(i) The preparation of the Five Year Urban Development Plan and Annual Plans for the State. This would mainly include the State-wide investment allocations for different components ofurban infrastructure.
(ii) The preparation of Regional Urban Development Plans for regions in the State.
(iii) The preparation of physical land use and other plans for smaller towns which do not have their own capability.
(iv) Advising 011 physical plans, site and layout plans prepared by development authorities and local bodies.
(v) Monitoring and evaluation of urban development projects.
(vi) The construction ofa data base for each town or city, including demographic, social, economic topographic and land use data.
(vii) Enforcement of standards, urban regulations, etc.
30. A Centrally Sponsored Scheme for funding the development of urban development planning capability has already been recommended in para 26. This must .be extended to the state level systematically just as the preparation of the original Master Plan was funded under a Centrally Sposnored Scheme. This could be on a pilot basis in about 6-7 states which are facing more serious urban problems.
(xv)
(c) The Local Level
31. At the local level, the recommendations for metropolitan planning are given separately below. The accompanying Task Force on "Management of Urban Development" is also giving specific recommendations for planning at the local level. There is consensus that municipal bodies should be strengthened for the planning needs of each town. Once the regional dimensions are spelt out by the State Level planning body, the responsibility as well as authority for planning at the local level should rest with the local body. It will be possible for the local bodies in many of the larger cities to develop their own planning capability in terms of qualified staff. Now that there are 216 Class I cities already and that this number is expected to increase to over 300 by 1991, a large proportion of the urban population will be covered by these local bodies. It will, however, be difficult for most of the local authorities in the small and medium towns to afford their own planning staff. It is recommended that the newly revamped and strengthened State Level T.C.P.Ds develop special wings which would act as technical consultants for the local planning and organisational needs of the smaller towns.
32. Some observations are called for for planning at the intra-city or zonal level. Much of city level planning has been of the top-down variety and has often borne little relationship with the needs of people at the neighbourhood level. This has been particularly true for the needs of slum dwellers, who have little say in the pattern of delivery of services to them. The Task Forces on "Shelter for the Urban Poor and Slum Improvement" and on "Management ofUrban Development" are commending the widespread adoption of the Urban Community Development Programme as a means of delivering services to the poor and of eliciting their participation in planning at the sub-local level. Details of such an approach are provided in the reports of these Task Forces. It is recommended that the principles of the urban community development programme be adopted. widely as a means of increasing citizen participation in urban planning at the sub-local level.
Training Needs
33. The re-orientation of urban development planning from a largely physical approach to a coordinated physical, economic and financial approach implies an expapsion in and change of training facilities for urban planning. Two kinds of needs may be distinguished
(i) Training qf New Planners
Existing town planning courses in the planning schools should be made broader; management training fOT urban development planning should be introduced at the Indian Institute of Management and at the L.B. Shastri Academy for Administration; serious consideration should be given to the introduction of urban economics at leading economics departments in selected universities at the M.A. Level. These measures would help in producing a wider variety of urban planners with appropriate technical and managerial background. 21 W.'·H.-3
(xvi)
(ii) Mid Career Training
There should be a network of institutions to undertake training of personnel in existing institutions in:
a. techniques in urban planning integrating economic and physical approaches;
b. transportation planning;
c. land management and land pricing
d. municipal organisation, administration and management;
e. municipal finances and taxation ;
f. urban project p~eparation, monitoring and management.
ItJisltherefore recommended that the Ministry of Works and Housing, in conjunction with the Ministry of Education and the Department of Personnel devise a specific plan for the expansion of training for urban development planning on the above lines during the Seventh Plan, along with an allocation of specific funds for this purpose.
Information System for Urban Development Planning
34. Urban development planning within the framework ofoverall develop. ment planning in India would necessitate the setting up of an Urban Information System (UREIS). The system, may start its work by compiling systematically the data available with the centrallevel data collection/compilation agencies like the Census, Central Statistical Organisation (CSO) etc. There are serious problems of intertemporal as well as inter-state comparability with regard to a segment of this information base. The data on workforce, its distribution among various industrial categories (at the two digital level of NIC classification) the distribution of industrial establishments amo~g these categories, may be mentioned as illustrations. URBIS would have to retabulate the data on the basis of highly disaggregated information and by using comparable definitions ofvarious concepts at different points of time. One other task ofURBIS would be to procure from various Central and State government departments and local authorities data that are collected for various administrative purposes but never published nor used in the planning process. These data should be systematised and published.
V. Planning for Metropolitan Areas
35. Planning in metropolitan areas as is currently practised largely consists ofland-use planning as an aid to development control. This approach has suffered from two key problems. First, there is no connection between the investment im- ' plications of a Master Plan and resource availablity. Second, the land use allocation exercise and the standards used do not deal adequately with the prevailing socio-economic conditions in the city: where people live, what they do and where they work. The net result of these problems is that Master Plans often retain pretty pictures on paper and are seldom capable of being implemented effectively. All these shortcomings are not mere!y the result ofthe methodology ofplanning followed.
(xvii)
they also result from the existing institutional set up for urban planning and resource allocation and the social class and sympathies from which the bulk of the technical personnel aredrawn, which is not conducive to an integration of physical and investment planning. It would therefore be desirable that metropolitan planning in the future is re-oriented to take account of such key shortcomings.
36. The 12 existing metropolitan cities are conveniently located in a mosaic of geographical regions in the country. The addition of 8 or 9 more cities into this group by 199I will further improve their geographical distribution so that each region will then be served by a large city. It is therefore important that detailed geographic and economic analysis of these metropolitan regions be initiated on the following lines:
(a) Integration of communication, transport, energy and other infrastructure in the region to bring about better interdependence in the hierarchical structure of the different areas of the region.
(b) assessment of the types of industries and other activities that are more suitable for location in metropolitan areas. The present policy ofbanning the location or expansion of industry in cities with population exceeding 5 lakhs can then be modified on this basis.
(c) assessment of the type of industries and institutions that should be assisted to take root in smaller cities and towns of the region, that would inter-lock with each other and the rural hinterland and make optimum use of locally available resources.
(d) above all, the employment that is likely to grow with the planning and implementation of (c) and the provision of housing and shelter as close as possible to their respective places of work of the populations that will man these industries or establishments in the formal and informal sectors.
This should preferably be done under the auspices of the Planning Commission which may seek the collaboration ofbodies like the ICSSR, IITs,I1Ms, Universities, research institutes and other special foundations interested in this issue.
Coordination of State and Metropolitan Planning
37. A more organised dialogue needs to be established between metropolitan authorities and State Governments. In order to make this possible, the State Plans should include a Metropolitan Sub-Plan for metropolitan cities in each state. It would therefore be necessary for the State Government to direct the quasi-autonomous functional agencies to prepare capital investment plans for the metropolitan areas based on the availablitiy of resources as indicated by State Governments as well as the availability of institutional finances. The necessity of preparing such a plan would automatically induce a dialogue between the local metropolitan authorities and the various functional agencies (including agencies responsible for power, telecommunications, transportation, etc.). It has been suggested above that an urban development plan be prepared for each State on regional lines. The suggeslion for a metropolitan, sub-head in the State Plan is pertinent in this context since
(xviii)
each metropolitan area would merely constitute a region among the various regions delineated.
Coordination of Physical, Financial and Investment Planning at the State Level
38. There is currently a wide variety in the types of metropolitan level authorities that exist in the different metropolitan cities in the country. It is therefore difficult to provide a uniform institutional recommendation for all the metropolitan cities. It is clear, however, that there is need for a metropolitan planning authority (M.P.A.) which accomplishes all the coordinating tasks necessary in a metropolitan area. For such a process to be feasible it will be necessary for State Governments to vest M.P.A.'s with sufficient authority to achieve this co-ordination.
39. As suggested by the Task Force on "Management of Urban Development", such an authority should not be an executing agency : the capital works implied in a plan should be carried out by the relevant municipal or functional bodies as applicable. The function of the M.P.A. should be to prepare a Five Year Plan co-terminus with National and State Five Year Plan, as well as Annual Plans. This may be done within the context of a long term perspective structure plan for the city which lays out the broad developments expected over 10 to 20 year period. The physical plan should be converted into an investment plan for the 5 year period and consequently a financial plan. This should include capital investment and financial plans prepared by each local authority and functional
',body in the metropolitan area. These plans should take account of all the financial resources, expected to be available. The M.P.A. should then coordinate with the State authorities to reconcile the sectoral allocations and priorities at the State level. The key to the success in such planning coordination lies in the match~ng of costs. of development to the availability of resources and the subsequent revision. .of priorities and ranges of standards consistent with the resources. The assessment of resources should include the expected private investments in urban
.infrastructure along with the contributions that private citizens can be expected to make.
~ 40. In order to achieve the coordination between physical and investment plans that is suggested above, the detailed procedures of planning need to be examined and guidelines issued. A Centrally Sponsored Scheme for the development of urban development planning expertise at the Central and State Level has already been recommended. This scheme should specifically include the promotion of techniques and personnel for metropolitan planning on the above lines. Model procedures for metropolitan planning should then be worked out so that they can be institutionalised in M.P.As as experience is developed.
.. Ciry Surveys
4 I . A crucial issue in planning is how to ensure that metropolitan planing caters to the need of all income groups of the population with respect to shelter, employment as well as the distribution of public services. It is therefore necessary for information to be collected in a comprehensive household/employment sample survey which should be conducted in each of the metropolitan cities every 5 years, pr,eparatory to the planning exercise, The Centrally Sponsored Scheme suggested.. . . .. . ~
(xix)
above for the strengthening of urban development planning capability should include provision for pilot household surveys in selected cities over the Seventh Plan period. It is also necessary to take steps to improve the access of metropolitan ::uthorities to City Level data from .national so?rces of information such as the National Sample Survey, the decennial population census, and the Central Statistical Organisation. In particular, it is important that access be given to the 1981 Economic Census at the city level before it is outdated.
VI. COORDINATION OF INDUSTRIAL AND URBAN PLANNING
42. The link between urbanisation and industrialisation is demonstrated and substantiated in this Report. It is therefore obvious that it is necessary to have much greater co-ordination of industrial and urban development than has hitherto been the case. There is little linkage between the planning of urban infrastructure, both physical and social and that of industry. Policies concerned with the location of industry are not coordinated with the provision and funding of urban services, nor with associated communication and transport facilities. The converse is also true. The selection of towns under the Integrated Development of Small and Medium Towns (IDSMT) has not been linked with any industrial dispersal schemes. Similarly, the urban development projects in Calcutta, Madras and Kanpur have had little linkage with the requirements of industry in these
-cities. In view of all this, given the links between the provision of social and p hysical infrastructure and the location of industry, it is imperative that industrial location measures and measures for housing and shelter for population working for these industries should be linked with urban development programmes. This can be done through regional and subregional urban development plans so that the needs for different kinds of investment are coordinated. This reinforces the recommendations made above concerning the preparation of urban development plans at the State and sub-regional level. Only if this is done will it be possible to take into account the requirements of planned industrial activities in the allocation of urban infrastructure investments. However, some infrastructure require commitment ofa large quantum of scare resources and are lumpy in nature In other words, the policy for provision of physical and social infrastructure involves larger issues which are "beyond the competence of sectoral and city/town 'decision-making levels. The recommendation for cooradination are therefore divided into two ~eads: lower level links and higher level lin~s.
Lower Level Links
43. The possibility of forging a link between industrial and urban planing depends on the extent to which the two processes can be controlled by public authorities. This possibility of control varies from case to case, and therefore different recommendations are given for each type of industrial town.
Steel Towns
44. A large integrated steel plant typically employs 20,000 to 30,000 workers who, along with their dependents, may constitute a fair sized town. Hence, the establishment of a new town and arrangements for planning this new town have to be built into the project planning exercise. Until now, this has been limited to the planning ofhousing, social welfare facilities and neighbourhood shoppingrequired by direct employees of the steel plant. This is quite inadequate since it ignores
(xx)
the need of all the indirectly generated employment and population in these rapidly growing cities. It is therefore essential that the planning exercise for such new industrial towns linked to steel plants (or similar projects) must (a) allow for a population size much larger than that attributable to the steel plant (b) a large range of economic activities linked to but not a part of steel plant. One possibility would be to undertake the new town development as a separate project which would be planned, executed and administered by a separate authority constituted in the same manner as other urban development and planning authorities. The responsibility for infrastructure development would rest with this authority. In order to ensure that this authority is adequately funded, a part of the sum that would normally constitute usual township costs may be provided directly to the authority by the Central Government and earmarked for specific activities. Moreover, to ensure coordination, the steel plant management could be included in the controlling Committee of the UDA. If such an arrangement can be effected there may be a greater degree of coherence in the planning ofnew towns linked to steel plants. Procedures should also be laid down for the municipalization of these towns over time.
Other Towns with Major Projects
45. Major projects other than steel do not generally involve the establishment of a large new town in a virgin area. The cases covered under this category generally involve the establishment of a township near the project site which is often in the outskirts of the nearby urban centre. This sort of development of relatively isolated township can be seen in Baroda, Hyderabad and Bangalore. Water supply, sanitation and social services for these two townships is also planned in isolation from what is happening in the urban centre. This isolation has several consequences. Firstly, the township cannot use effectively the service facilities available in the urban centre, particularly in the central area. Secondly, the urban centre cannot benefit from the facilities created to service the township. There is therefore a need in such cases for a systematic assessment of the likely impact of the project on in-migration, generation of direct and indirect employment, transportation and other service activities and the implied infrastructure requirements. The responsibilities for undertaking these investments have then to be apportioned between the existing city and the project management. The integration will have to be secured by negotiations and collaborative efforts at planning by the local authority and the project management. As for funding there IS a case for setting up a Central Scheme for project-linked urban development which can provide resources to the local authority undertaking its part of the assigned responsibility. The project authority would obtain the funds for its responsibilities as part of the project costs.
Towns with Intensive Industrial Area Development and Small and Medium Industries
46. This category is similar to the second in that an influx of medium and large industries leads to rapid urban growth. It differs, however, in the fact that the impact is not that of one or two very large projects but of several smaller ones. Hence, a linkage based on collaborative effort by project managements and the local authority may not be workable. The rational answer to the :planning problem in these cases lies in integrated planning of Industria]
(xxl)
and urban infrastructure in the context of an overall urban development plan. The entire exercise should 'be undertaken by one agency which should be the local authority. The industrial promotion organisation would be given some land by the local authority. The development of housing, commuter transport facilities, water supply, sanitation, etc. would be undertaken by the local authority which would be specifically funded for this purpose. If necessary special state level.schemes for Urban Development in Industrial Areas may be set up to provide a channel for such funding. As has been recommended earlier the coordination of these investments as well as allocation should be done at the state level in the preparation of the regional and state level urban development plans.
Higher Level Linkage Industrial Dispersal
47. Decentralisation of industry has been an explicit aim of the government for a long time. Yet, extensive decentralisation of industry has not taken place as a result of all the decentralisation measures. The issue, however, is more complex than is generally supposed. It can be asserted with some confidence now that considerable dispersal of industry has taken place in the last fifteen to twenty years, which has at least partly been a direct result of these policy measures. But the pattern of dispersal may not have been as planned or as had been hoped. The Indian performance on dispersal compares well with that of most industrial countries in the world. The proportion of value added in manufacturing to State Domestic Product has gone up in every state. There is, therefore, a trend toward equalisation of these ratios among these states. At the same time, there is no evidence of a shift of industry from larger cities to smaller towns for India as a whole though the picture does vary from state to state. But the increase in the number of large cities with some industrial concentration has been such that the concentration of industry in the four largest metropolitan areas has decreased.
48. The National Committee on The Development of Backward Areas has made a step in the right direction by identifying 100 centres which ought to be considered as industrial growth centres. The selection of these centres should be done on a region based need and fraction exercise rather than mechanical criteria concerning population size and number of industrial workers. The availability of fiscal incentives for dispersal have to be accompanied by the provision of physical infrastructure-transport, communication, institutions, warehousing, power, water, etc.-for dispersal to be successful, Given that there are now over 200 cities with over 100,000 population, and likely to be over 300 by 199I, the existing infrastructure, physical as well as social, should be better utilised. This suggests two courses of action. First, among these cities, those which have low levels of industrial activity and employment could be considered for selection as industrial growth centres. But care could be taken to assess their industrial potential given the regional characteristics and availability of facilities, etc. Second, in the more backward areas, where these cities may not.exist, a judicious selection of a small number of centres should be made so that all the required facilities may be provided.
49. It is, therefore, clear that since many of the decisions on outlays and strategies for urban as well as industrial development are made at a higher
(xxii) <,
level in the State and Central planning apparatus, some links between urban and industrial planning is required in the methods and organisational arrangements for plan formulation. The linkage that is really required in central and state plans relates basically to public sector outlays and policies on industrial location and urban development. Some suggestions have already been given on this account in the suggestions for urban development planning at the central and statee levels-particularly the suggestions for coordination within the Planning Commission. Another specific recommendation for large public sector projects which has been mentioned, is that such projects which are likely to generate permanent employment of over 1000 persons or whose investment costs are over Rs. 50 crares should be required to file "urban impact" statemen ts that their urban development implications can be worked out and the required investments planned.
VII. The Urbanisation of new areas ' Rapdi{v Developing Areas
50. Different areas of the country have different needs in terms of urban infrastucture and facilities. On the one hand are many areas where the pace of development of agricultural and other activities has been quite rapid. These areas also happen to be served by a well distributed network of towns and cities of different sizes which act as growth centres for these regions. The need in the towns and cities of these regions is for the provision of basic urban infrastructure in terms of water supply, sanitation, sewerage, roads, drainage, land development, etc. so that their lack does not hamper growth. Essentially, infrastructure has to follow, the existing growing activities in these regions. It is, however, necessary to indentify some key growth centres in each State, within the context of the industrial dispersal and State and regional urban development plans suggested earlier, for development as lead centres for their regions.
Slowly Developing Areas
51. There are other vast areas in the country such as Northern Bihar, Eastern Uttar Pradesh, parts of Orissa and Andhra Pradesh and others, which can be identified and which have extremely low levels of urbanisation of about 5-10 per cent. In such areas the growth of all economic activity, both industrial as well as agricultural, has been slow. It is in these areas that special efforts have to made to provide an impetus to urban growth through the provision of urban services, infrastructure and activities. These areas have vast tracts with no urban settlements which can act as marketing or service centres. Here infrastructure provision has to be made in selected settlements which can be expected to lead the growth of urban activities. It is therefore recommended that :
(i) a special scheme be designed in the Seventh Plan to identify the regions and centres;
(ii) funds be earmarked from the Central Sector which may be devoted to the development of these sectors over and above the investments emerging from the state and regional level plans.
(xxiii)
This report provides some pointers to the identification of these regions but this has to be done more systematically than has be~n. done here. Many of the selected centres would, for example, be those which would develop as mandi (regulated markets), tehsil, taluka or district centres in the future.
B. Issues in Urban Land Policy
VIII. Review and critique of existing policy
52. The objectives of urban land policy are : ~
(i) to achieve an optimum social use of urban land
(ii) to make land available in adequate quantity at the right time and for reasonable prices to both public authorities as well as individuals
(iii) to encourage cooperative community effort and bonafide individual builders in the field of land development, housing and construction.
(iv) to encourage the socially and economically efficient allocation of urban land such that land development is done in a resource conserving manner and that the magnitude of land used is optimal.
(v) to widen the base of land ownership in order to specially safeguard the interest of the poor and underprivileged sections of urban society.
(vi) to promote flexibility in land use in response to changes resulting from a growing city.
53. The major problem of urban land policy is a serious imbalance in the supply of and demand for serviced land. Hence, the achievement of the above objectives depends in large measure on the supply of serviced land:
(i) in adequate quantity
(ii) at the right locations
(iii) at the right time
(iv) at the right price
With the rising pace of urbanisation, extensive participation of the public sector is essential, such that the required tracts of land get developed speedily and access of the poor, in particular, to the land for shelter and employment is assured.
54. Public participation in the land market includes policies for:
(i) acquisition of land for development
(ii) the standards used for development
(iii) extent of public control over urban land
(iv) extent of public ownership of urban land
(v) regulation of trade in urban land
21 W. H.-4
l
(xxiv)
55. Policies related to the urban land market may be disti.nguished between:
(i) Developed urban land (i.e. land in built up areas).
(ii) Undeveloped urban land (i.e. undeveloped urbanised land within . city limits).
(iii) Land within urbanisable Iimirs. (yet undeveloped but likely to be urbanised within 10 or IS years).
(iv) Land beyond urbanised' limits.
(v) Land for green belt and community pnrposeiS.
56. Public control and ownership oCurhan land can be helpful tor mainly three purposes:
(i) Organisation of orderly development of a city as it expands;
(ii) Land must be available for public purposes: roads, parks, schools, hospitals, community centres, etc.; .
(iii) Provision of shelter and employment for the poor;
57. Acquisition of land in the urban fringe at low agricultural use prices for high income housing, commercial development or beautification of the city cannot be justified in terms of public purpo:;es.
58. Public control of land does not necessarily mean that all this land should be developed exclusively by public authorities. In fact, the authority responsible for development and construction should, as far as possible, be different 6:0111 the authority which owns or controls the land.
Accouniability rif Urban Denelopmeni and Local Authorities
59. The activities carried out by urban development authorities and other local authorities are done so in the name of "public interest". Frequently, irrational decisions or decisions favouring specific interest groups are also justi fied by urban authorities on the basis of their supposed public interest. Some such examples are frequent removal of "slums" or "low income settlements" [tom certain locations to place the same land under usc as gardens or upper! middle income housing or commercial and industrial uses. The concept of "public interest" needs to be defined more clearly so that interests of all sections of the public are given due weightage. The following measures may be considered for better monitoring and accountability of these authorities in serving the public interest:
(i) Urban ,development authorities and other local authorities involved in developmental works should be required to prepare annual statements which give an accounting of their activities during the relevant year. This may specifically include an accounting of the land that has been developed during the year and its allocation to different income groups-for both shelter as well as employment purposes.
(:n:v)
(ii) State Governments may appoint an overseeing panel which scruti nises these annual reports in relation to declared plans and objectives of these authorities and evaluate their service in the public interest. These repo:r;ts and scrutiny should be made public. '
(iii) Preferential access to land through non-market concessional channels to privileged groups should be discontinued so that the poor have better access to the publicly developed land made ayailable..
(iv) An account of the number of new establishments set up in the secondary and tertiary sectors and the extra employment generated in them.
(v) An account of proximity or otherwise of housing and shelter of those employed to their places of work with reference to (iv).
The Experience qf the Delhi Development Authority
60. The Delhi Development Authority has gathered unique experience in many fields which awaits an objective assessment which would be of immense benefit to other cities. A partial assessment has been offered ill this report but this is based on fragmentary published data. It is recommended that a systematic review of the operation of D.D.A. be made to derive useful lessons on:
(a) the importance of adhereing to the social and economic objectives of a Master Plan of development which tends to be diluted or distorted in the rough and tumble of day to day operations.
(b) DDA's experience in (i) the operation of freehold and leasehold land
(ii) dispersal and redensification (iii) land zoning (iv) land pricing and sale instrument of predetermined pricmg, re
serve pricing and open auction. (v) taxation, development levies etc.
'(vi) looking after the diverse and often conflicting interests of social and economic groups, industrial and commercial demands.
Dr. Urban Land Policv: some Neto Directions Legislation Regulating Urban Land .
GI. A host of multifarious and variegated legal tools including the Land Acquisition Act, State Town and Country Planning Acts, municipal enactments, Slum Areas Legislation, The Urban Land Ceiling Act and others dealinu
~ ~ ~
with development control have precipitated overlapping, and, at times, inconsistent legal provisions in urban areas. Comprehensive legislation that integrates economic development with settlement planning should be promoted and the Model Urban and Regional Planning 4111(1 Development Ad which has bern recommended by the Central Government to all States If) enact should
. be pursued with renewed vigour, preferably in lieu of existing lr.gislatio.n but at least supplementary to such legislation Where existing State and local government situations necessitate adjust.ments. In this connection, the Central
(xxvi)
Government has also issued a Model State Zone Act in 1970 and supplemented it by the Model Land Use Zoning Regulations in 1971 so as to include mixed land uses as an integrated component of the urban land development process. It is recommended that these Model Acts and Regulations be re-examined to ensure that their provisions do not hamper the access of the poor to land for affordable shelter and employment and reissued to States to enforce subsequently.
Town Planning and Building Regulations
62. Many of the standards set in such regulations are unsuitable and even economically unattainable for settlement patterns of a large' proportion of urban dwellers with low incomes. Such standards make illegal, by definition, any shelter affordable by low income families. There is urgent need for their modification and a range of standards may be recommended taking into account the different needs of the old core cities, newly developing areas, urban and rural villages, etc.
Land Assembly and Deoelopment
63. The modalities for achieving public control of land can involve several elements and a combination of approaches to the assembly, development and disposal of urban land will have to be followed in order to accelerate the supply of serviced land
Land Acquisition
64. Some part can be acquired under the Land Acquisition Act. But land notified at any given time should be acquired within a frame of 2-3 years. Large tracts of land should therefore not be notified at a certain time and actual acquisition conducted years later at the grave expense of agriculturalists. Any land acquisition activity must make adequate provision for reasonable compensation of the farmers whose land is acquired and, more important, for programmes for their rehabilitation through training and employment, and share in developed land.
Land Readjustment
65. Land development through public control can also be done through ':l process of "land readjustment" schemes or other methods on similar principles. The core of the idea is to compensate originalowners of acquired land in kind by returning portions of the serviced developed land. In brief, a land readjustment is a process whereby a public authority assembles numerous small parcels of raw land without paying monetary compnsation to the owners, services and' subdivides the land for urban use, returns a portion of the resulting building sites to the original owners in proportion to the value of their land contributions and sells the remaining sites to cover all public costs. Hence, land read justment is .a temporary form of public ownership to achieve unified control over large areas and means of financing public service installation during the crucial land development stage of urban. growth. Such schemes, with variations, have been used very effectively in Korea, Taiwan, Japan and Australia (where it is known as land pooling). A number of variations are possible: owners can be
.(xxvii)
given equity participation in the serviced land as opposed to actual land; the proportions of land returned can be varied according to social policy; some plots can be auctioned for recovery of development costs, etc.
Right of Pre-emptive Purchase
66. As a measure against speculation and the future registration of land transactions at the fringe, the public authority should have the right of 'Preemptive purchase" whereby. it would have the right to purchase any transacted plot at the stated price plus a designated X per cent, say 15-20 per cent.
67. Thus, the approach toward land development should be reoriented to enlist the participation and cooperation of people rather than proceed in an authoritarian manner.
Urban Renewal
68. In the continuously ageing urban centres of India, obsolescence is an on-going process and its magnitude at any given time is extremely large and usually beyond the capabilityof local public authorities to effect renewal. .Apart from a few initiatives in Maharashtra there has hardly been any effort to consider and design strategies which can help tackle this problem. It has to be recognised that existing laws may not be adequate to achive the disired ends. Furthermore, legal tools alone would not suffice to tackle these extremely complex tasks. A combination of laws, fiscal inputs, administrative strategies, etc,. would be indispensible.. Hence, two of the major tasks that will increasingly engage the attentioin of metropolitan authorities are (I) urban redensification andfzjurban renewal. These are areas which thave hitherto been neglected and need wide discussion both among appropriate auhorities as well as institutions interested in economic efficiency, social equity and environmental improvement. It is important to proceed to organise instruments and institutions of organised debate and frequent exchage of information on these areas to facilitate the evolution of desirable policies and the relevance of organising suitable financing, planning and executing authorities under public control.
69. It is recommeded that the Ministry of "Vorks and Housing initiate procedures immediately so that the suggestions incorporated in paragraphs 64,65,66 and 68 are implemented during the Seventh Plan period. Detailed consul tation with the Law Ministry and State Governments would be necessary to make these measures feasible. It may be desirable to formulate pilot schemes to initiate the implementation of these suggestions.
x. Deoeloping Urban Land Information Systems
.' 70. Some of the measures suggested above require an improved system of land records in terms of both prices as well as owners,
(xxviii)
7I. Information onFringe Lands :
(i) Register of Original Holders
If a land readjustment scheme is to operate with the objective of compensating farmers adequately, a detailed land record of original holders on the fringe of designated urban areas has to be kept.
(ii) Standard Price System
Both for purposes of land acquisition and land readjustment it is important: to regulate the agricultural land prices prevailing on the fringe. Areas on the fringe ofurban areas can be disignated in rings and zones and a "standard price" announced (based on actual value) for each area in base year. Subsequent to that, inflation adjustmens can be indexed and announced every year alongwithother real price rises that are observed to occur around the notified areas. It is recommended that such a system may start with the 12 metropolitan cities and. as experience improves, extended to other Class I cities and further. This woo ld be useful for curbing speculation in the fringe areas,
72. Information on Already Deoeloped Areas:
(i) Register of Owners
The existing system of land records in urban areas is quite inadequate in most cities. There are no authoritative records of existing owners of the different plots in cities. It is therefore necessary to initiate a system of land ownership records. Since this would be a very large and expensive exercise, a beginning may be made with systematic registration of all new transactions. Schemes may also be begun in selected cities for preparing a' comprehensive register of all land owners.
(ii) Laud Price .':iYstem
A'Jand price system for already urbanised areas is intended to provide a reliable pricing guide to those proceeding to land transactions by regularly publishing adequate land prices for the purposesof formulating rational land prices. Representative land tracts may be chosen in a grid in urban areas. A representative lanel tract may be defined as a unit of land where utilisation and environmental conditions are considered normal and which is found in an area where natural and social conditions make it evenly usable for common purposes. In such an intensive area, a unit of land is chosen as representative and its price observed and published. Once the land prices are published every year, the price in every land transaction should be certified by a licensed land appr.aiser who has taken into account the published price of a similar plot in qu;estion. Public authorities also then have to respect the published land pnce~.
This system may be started ona pilot basis in the four largest rnetropolitan cities: Calcutta, Bombay, Delhi and Madras during the immediate Seventh PIa r' Iieriod. Again, as experience develops, it can be extended to other urban
(xxix)
areas over the next 15 years. it will be necessary to take steps to initiate a system whereby a corps of trained and licensed land value appraisers can emerge over the country.
Gooernment Land
~ 73. At present large tracts of urban land are owned by different government agencies and there is no accounting of the total amount of land currently owned by the government in each city. In many cases much of ·this land is frozen in sub-optimal uses and often in prime areas of the city. It is recommended that the local public authority should identify all lands owned by the government and its different" agencies and examine their existing land use and efficiency of such use. Machinery should also be set up for issuing guidelines for the better allocation of government lands once their existing uses are known. ~
,,~ '.
~';·t ".
I~~
The results of the 1981 Census point to the signs of a continuing structu'L1r~l;~haqge:1i.n;'~h.e f.~~-;W1b~:~attjo,ofQ1,1r.pppqla,tion and economic enterprise, ~;Th~:;p:r.(ibwp:1&'9f..~J..cll:b;W;~.and-rural-development.and of other .core sectors have quite rightly claimed priority attention'in the .past, 'But 'the new pace of urbanisation along with growth in the secondary and tertiary sectors of the
j ~~C;mpI.I;lK~m~qd;':fr~s.hthmlQHg in.' oururban .policies.
,-It W!1s;with,,4;he$e,'eonsiderations.in .view that Dr. Manmohan Singh, f,~then.~wber..:S~c~etary;;.of.',jthe, PlanI.:ting 'Commissionvcalled an ad-hoc meeting on June 25, 1982, to discuss abackground paper on "Strategy of Housing and
.JJmaIlJ)ey.elop:meQt::SQIlJ.e>:New Perspectives" "prepared in the Planning Com,;~~jpn. .""A. f·.Wide _Jl:1-:Qge .of .acaderriics .. 'and administrators, with experience in .ptban•.a:tf~irs ~d economics, were inVited to attend-and suggest steps that
, ~hQyJd,pe:: t~k~non..t~:Js~tle.;The .list 'of invitees .is given-in AnnexP. I. The ~~¢fulg"w.as.J~b~ir.¢d.~y "-:r..rc)f..~i~~G~1(. Menon; ;Member;·Planning Commission, and attended also 'by "Prof 'C~H. "Hanumantha -Rac.Member, and Dr. Man
}mohan .Smgh, .;Merob.er:"Se~J,"etary along with Advisers in the Planning . Qo~~ioI)..
~ The -main -reeommendation .rthat-emerged .from this meeting was that a -number. df-e,Task Eorees.sbe appointed.without delay by the Planning Commis"sion·'to.-'evolve;;ado:ngo;"termperspective on 'housing and urban development :;c;issues. ;'CoIlsequeIitly,' rthe Planning Gommission appointed 4 Task Forces on
{i)~"Planning· .of'.Unban .Development (Chairman, Professor -AsokiMitra)
.{ii);FinancWg·.of ·l)Eban, Development (Ghainnan,' "Pr.:ofessor Raja Chelliah)
>Giii)'i:M;anage.ment \of ~UJ:lban.J;)ev~.lQPI1'l.~nt (c;(~h~~,:iSri,~~C...:Siv~amala.:~sbpan)
({iv).'~8kelter~for ~he) Urban Poor and-Slum Improvement f:(Gh~innan,~~Sri :!,L.M.'.M:~n.~j(;es)
Member-Secretary to all the Task Forces Dr. Rakesh Mohan, ;S~~i~r~Gt>ll;Sliltant,:/Plap.ping:·~Qrnmissiqn.
.iThe-nofifi:cation''Setting·up·:these'~ask;Forees..alongcWith their composition and terms of references is given as Annex P. 2.
The Task Force' on "Planning of Urban Development" with Professor Asok Mitra ofJawaharlal Nehru University, formerly Secretary, Planning €ommission and Registrar General and Census Commissioner of India, as
'II W.H.-s
(un)
(xxxii)
Chairman, was constituted with members with a wide range of experience in urban planning, development administration, voluntary work and economics research from different parts of the country. All members of the Task Force gave generously of their time and energies voluntarily to the work of Task Force.
The term of the Task Force was originally fixed up to June 15, 1983 but was extended up to. September 30, 1983. This Report is being submitted well within the stipulated time.
The work of the Task Force was inaugurated on February 25, 1983 by Professor A.M. Khusro, Member, Planning Commission, responsible for the area of Housing and Urban Development. The Task Force held three additional meetings on April IS and 16, June 22 and 23 and August 22 and 23, 1983.
At the start of its work the Task Force decided to ask the different members to prepare background notes on specific terms of reference which were carefully drawn up by the Member-Secretary Dr. Rakesh Mohan. The papers received were issued as "Urban Development Task Force Papers" and are listed in Annex P. 3. Other shorter notes were also received and these are also listed.
All members have contributed to the work of the Task Force. At- the outset, the Task Force would like to express its gratitude to Professor A.M. Khusro, Member, Planning Commission, who initiated the work of the Task Force with his characteristic sweep and insight. His continued interest in this area and his support and participation in the deliberations of the Task Force has been a source of inspiration. The Task Force is grateful to Sri L.M. Menezes, Joint Secretary, Ministry of Works and Housing, and Sri E.F.N. Ribeiro, Chief Planner, Town & Country Planning Organisation (TCPO) for providing the core Secretariat Staff. Sri M.B. Mathur and Sri V.P. Upadhyaya who were loaned by the T.C.P.O. for this work have worked very hard and helped greatly in expediting the work of the Task Force. For stenographic help we are grateful to Sri B.K. Khera, P.A. (of Planning Commission) and- Sri O.P. Madan (of T.e.p.O.) who have bor~e the brunt of the burden, supported by Sarvashri Kimti Lal, B.C. Sharma and M.L. Sharma (PC). Other able secretariat help has been provided by Sarvashri Setia and Krishan Gopal along with Sri Hari Singh Yadav. The Task Force is grateful to all members of the secretariat staff for the diligence and dedication with which they have fulfilled their duties. Above all, all members and particularly the Chairman, are indebted to Dr. Rakesh Mohan, Member-Secretary, for relentlessly keeping them on the ball.
This report, apart from the merit that it possesses, is a tribute to the dedicated work of all the members, who gave of their time so generously and voluntarily to complete their task well within six months from the start.
......?
.~.
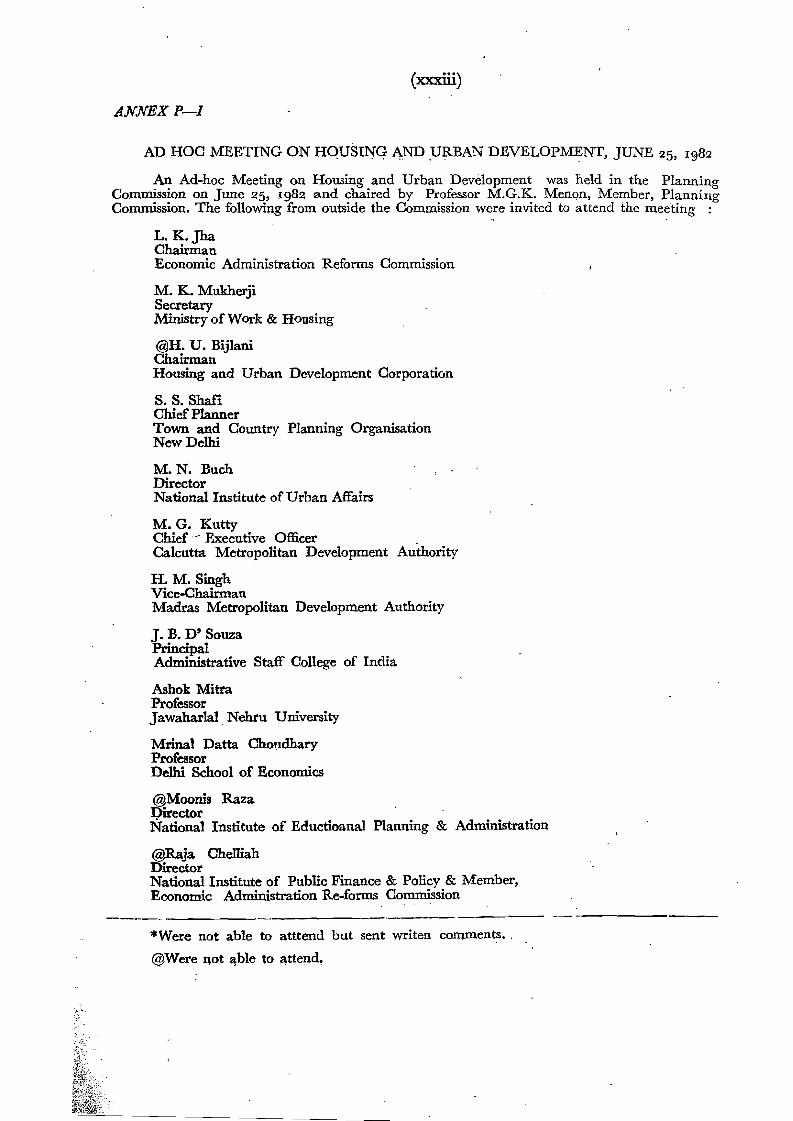
(xxxiii)
ANNEX P-I
AD HOC MEETING ON HQUSING AND :URBAN DEVELOPMENT, JUNE 25, 1982
An Ad-hoc Meeting on Housing and Urban Development was held in the Planninz Commission on June 25, Jg82 and chaired by Professor M.G.K. Menon, Member, Planning Commission. The following from outside the Commission were invited to attend the meeting :
L. K.Jha Chairman Economic Administration Reforms Commission
M. K. Mukherji Secretary Ministry of Work & Housing
@H. U. BijJani Chairman Housing and Urban Development Corporation
S. S. Shafi Chief Planner Town and Country Planning Organisation New Delhi
M. N. Buch Director National Institute of Urban Affairs
M. G. Kutty Chief - Executive Officer Calcutta Metropolitan Development Authority
H. M. Singh Vice-Chairman Madras Metropolitan Development Authority
J. B. D'Souza Principal Administrative Staff College of India
Ashok Mitra Professor Jawaharlal. Nehru University
Mrinal Datta Choudhary Professor Delhi School of Economics
@Moonis Raza Qirector National Institute of Eductioanal Planning & Administration
@Raja Chelliah Director National Institute of Public Finance & Policy & Member, Economic Administration Re-forms Commission
--.._-----*Were not able to atttend but sent writen comments..
@Were not abletoattend,
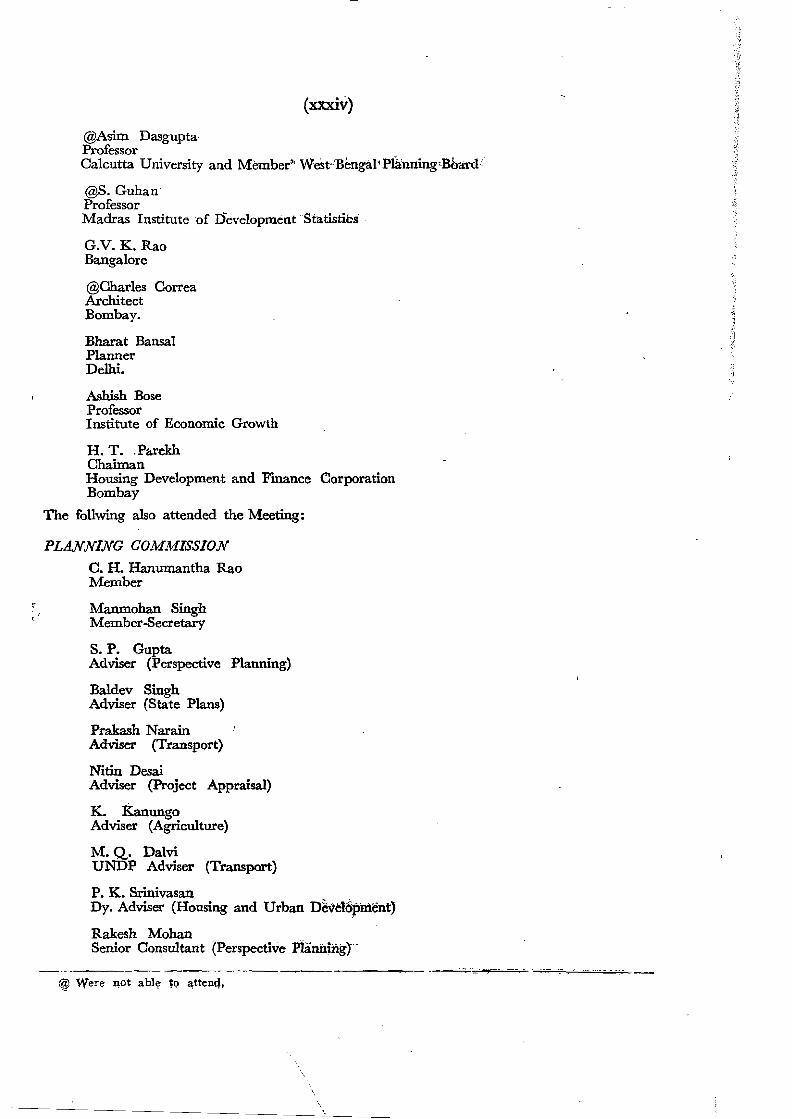
(xxxiv)
@Asim Dasgupta Professor Calcutta University and Member" West"Bertgal,pianningtB&a:Td'
@S. Guhan Professor :~
Madras Institute of r)eve!opmentStatistics. '""
G.V. K. Rao Bangalore
@Charles Correa Architect Bombay.
Bharat Bansal Planner Delhi.
Ashish Bose Professor Institute of Economic Growth
H. T..Parekh Chaiman Housing Development and Finance Corporation Bombay
The follwing also attended the Meeting:
PLANNING COMMISSION
C. H. Hanumantha Rao Member
Manmohan Singh Member-Secretary
S. P. Gupta Adviser (Perspective Planning)
Baldev Singh Adviser (State Plans)
Prakash Narain Adviser (Transport)
Nitin Desai Adviser (Project Appraisal)
K. Kanungo Adviser (Agriculture)
M. Q. Dalvi UNDP Adviser (Transport)
P. K. Srinivasan Dy. Adviser (Housing and Urban Dave!Opment)
Rakesh Mohan Senior Consultant (Perspective Planning)'
--------~-.--,
@ Were not able tQ attend,
----:::-,.:: ..-:;-..-.
-. ,
(xxxv)
Syed Mtab Ahmed Information Officer
OTHERS
L. M; Menezes _ Joint Secretary, Ministry of Works & Housing
P. S. A. Sundaram Director (Urban Development) Ministry of "':<:>rb & Housing
!\iLK: Moitra Director '(Housing) Ministry of Works & Housing
S. S. Ahuja Chief (Finance) Housing & Urban Development Corporation
Deepak Parekh Deputy. General Manager Housing Development Finance" Corporation
Nasser MUJUee Economist
. HousingDevelopment Finance Corpn•
.Venkatachalam Housing Development Finance ·Corporation Delhi.
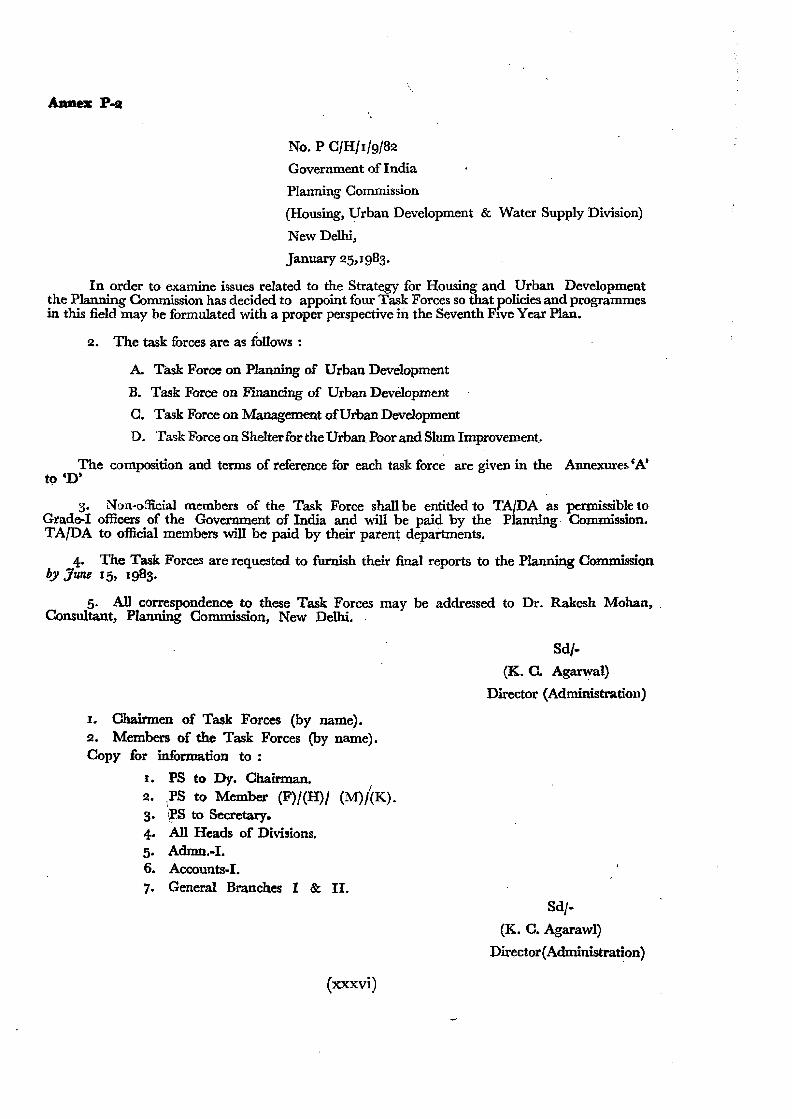
Aanex P-a
No. P C/H/I!9!82 Government of India
Planning Commission
(Housing, Urban Development & Water Supply Division)
New Delhi,
January 25,1983.
In order to examine issues related to the Strategy for Housing and Urban Development the Planning Commission hasdecided to appoint four Task Forces so that policies and programmes in this field may be formulated with a proper perspective in the Seventh Five Year Plan.
2. The task forces are as follows :
A. Task Force on Planning of Urban Development
B. Task Force on Financing of Urban Development
a. Task Force on Management ofUrban Development
D. Task Force on Shelterfor the Urban. Poor and Slum Improvement.
The composition and terms of reference for each task force are given in the Annexures 'N to 'D'
3. Non-official members of the Task Force shall be entitled to TA/DA as permissible to Grade-I officers of the Government of India and will be paid by the Planning Commission. TA/DA to official members will be paid by their parent de.partInents.
4. The Task Forces are requested to furnish their final reports to the Planning Commission by june 15, 1983.
5· All correspondence to these Task Forces may be addressed to Dr. Rakesh Mohan, . Consultant, Planning Commission, New Delhi. .
Sd/.
(K. C. Agarwal)
Director (Administration)
I. Chairmen of Task Forces (by name). 2. Members of the Task Forces (by name). Copy for information to:
I. PS to Dy. Chairman. 2. "PS to Member (F)/(H)/ (M)/(K). 3. WS to Secretary. 4. All Heads of Divisions. 5. Admn.-I. 6. Accounts-L 7. General Branches I & II.
Sd/
(K. c. AgarawI)
Director(Administration)
(xxxvi)
~ ,.' (xxxvli) ,
No. PC/H/I/9/82. , '.
Government of India
Planning Commission
(Housing, U.D. & Water Supply.Division)
Yojana Bhavan New Delhi
2 July, 1983.
In pursuance of Planning Commission Office Memorandum of even number dated 25-11983 regarding the Task Forces on (a) Planning of Urban Development, (b) Financing of Urban Development, (c) Management of Urban Development and (d) Shelter for the Urban Poor and Slum Improvement, it has been decided to extend the term of these Task Forces till the goth September, 1983.
Sd/(K.C. Agarwal)
Director (Administration)
I. Chairmen of Task Forces (by name).
2. Members of the Task Forces (by name).
Copy for information to :
I. PS to Dy, Chairman. 2. PS to Member (F)/(H)/(M)/(K). 3. PS to Secretary. 4. All Heads of Divisions. 5. Admn. 1. 6. Accounts-I, 7. General Branches I & II.
Sd/(K.C. Agarwal)
Director (Administration)
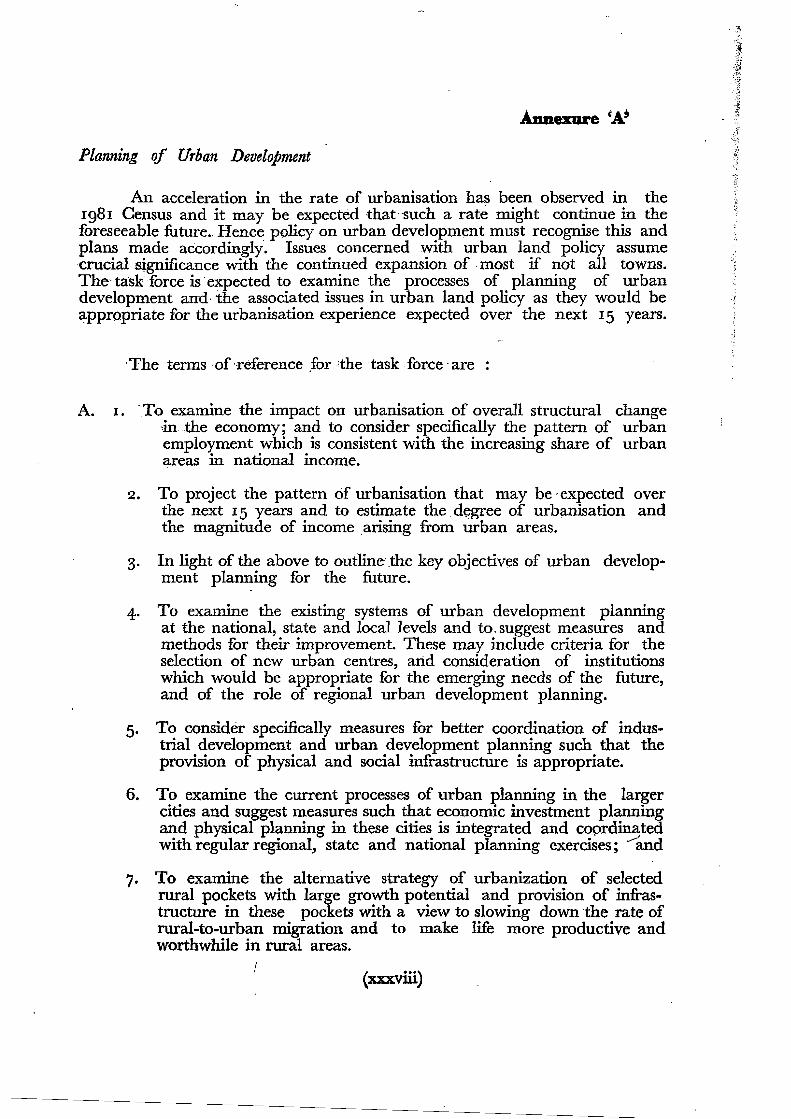
Planning of Urban Development
An acceleration in the rate of urbanisation has been observed in the Ig81 Census and it may be expected that 'such a rate might continue in the foreseeable future.. Hence policy on urban development must recognise this and plans made accordingly'. Issues concerned with urban land policy assume crucialsignificance with the continued expansion of most if not all towns. The- task force is'expected to examine the processes of planning of urban development and- the associated issues in urban land policy as they would be :.f
appropriate for the.urbanisation experience expected over the next 15 years.
'The terms -of'reference for the 'task ,force "are :
A. I. 'To examine the impact on urbanisation of overall structural change in the economy; and to consider specifically the pattern of urban employment which is consistent with the increasing share of urban areas in national income.
2. To project the pattern of urbanisation that may be-expected over the next 15 years and to estimate the degree of urbanisation and the magnitude of income arising from urban areas.
3. In light of the above to outline "the key objectives of urban development planning for the future.
4. To examine the existing systems of urban development planning at the national, state and local levels and to, suggest measures and methods for their improvement. These may include criteria for the selection of new urban centres, arid consideration of institutions which would be appropriate for the emerging needs of the future, and of the role of regional urban development planning.
5. To consider specifically measures for better coordination of industrial development and urban development planning such that the provision of physical and social infrastructure is appropriate.
6. To examine the current processes of urban planning in the larger cities and suggest measures such that economic investment planning and physical planning in these cities is integrated and coordinated with regular regional, state and national planning exercises; ...--'and
7. To examine the alternative strategy of urbanization of selected rural pockets with large growth potential and provision of infrastructure in these pockets with a view to slowing down the rate of rural-to-urban migration and to make life more productive and worthwhile in rural areas.
(xxxviii)
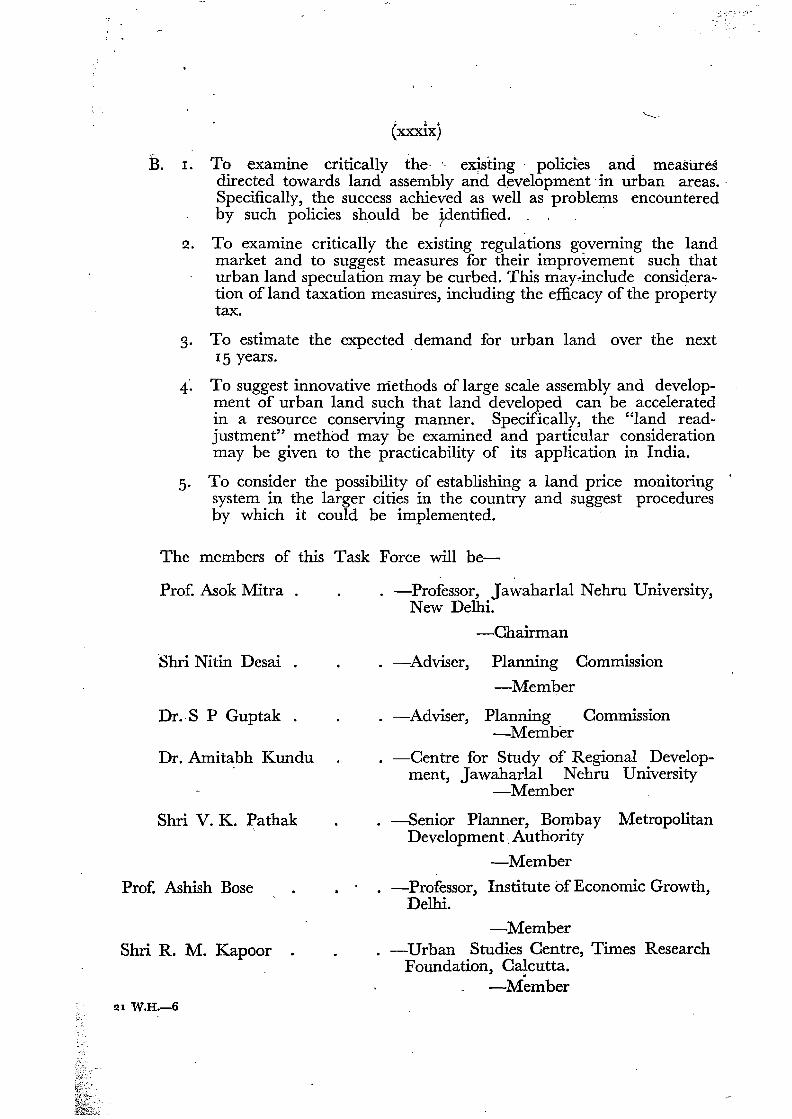
'--.
B. I. To examine critically the- ', existing· policies and. measures directed towards land assembly and development in urban areas.' Specifically, the success achieved as well as problems encountered by such policies should be ~entified. . . . .
2. To examine critically the existing regulations governing the land market and to suggest measures for their improvement such that urban land speculation may be curbed. This may-include consideration of land taxation measures, including the efficacy of the property tax.
3. To estimate the expected demand for urban land over the next 15 years.
4. To suggest innovative methods of large scale assembly and development of urban land such that land developed can be accelerated in a resource conserving manner. Specifically, the "land readjustment" method may be examined and particular consideration may be given to the practicability of its application in India.
5. To consider the possibility of establishing a land price monitoring system in the larger cities in the country and suggest procedures by which it could be implemented. '
The members of this Task Force will be-
Prof. Asok Mitra . -Professor, Jawaharlal Nehru University, New Delhi.
-Chairman
Shri Nitin Desai . -Adviser, Planning Commission
-Member
Dr. S P Guptak . . -Adviser, Planning Commission -Member
Dr. Amitabh Kundu . -Centre for Study of Regional Development, Jawaharlal Nehru University
-Member
Shri V. K. Pathak . -Senior Planner, Bombay Metropolitan Development" Authority
-Member
Prof. Ashish Bose -Professor, Institute of Economic Growth, Delhi.
-Member Shri R. M. Kapoor -Urban Studies Centre, Times Research
Foundation, Calcutta, -Member
~I W.H.-6
(xl)
Ms Madhu Sarin -Urban Planner, Chandigarh.
-Member
Shri M. Shankar . -Director (Lands), Ministry of Works & Housing.
-Member
Prof. Waheeduddin Khan -Director, Centre for Economic and Social Studies, Hyderabad.
-·Member
Dr Rakesh Mohan . -Senior Consultant•
The following were .also appointed as Members of the Task Force prior to the First Meeting of the Task Force :
I. Mr. E.F.N. Ribe!o Chief Planner, Town & Country Planning Organisation, New Delhi.
2. Mr. Anand Sarup . Adviser, Evaluation, Planning Commission (now Additional Secretary, Ministry of Commerce, Govt. of India, New Delhi.)
3. Pro£]. Krishnamurthy. Reader, Delhi School ofEconomic, Delhi.
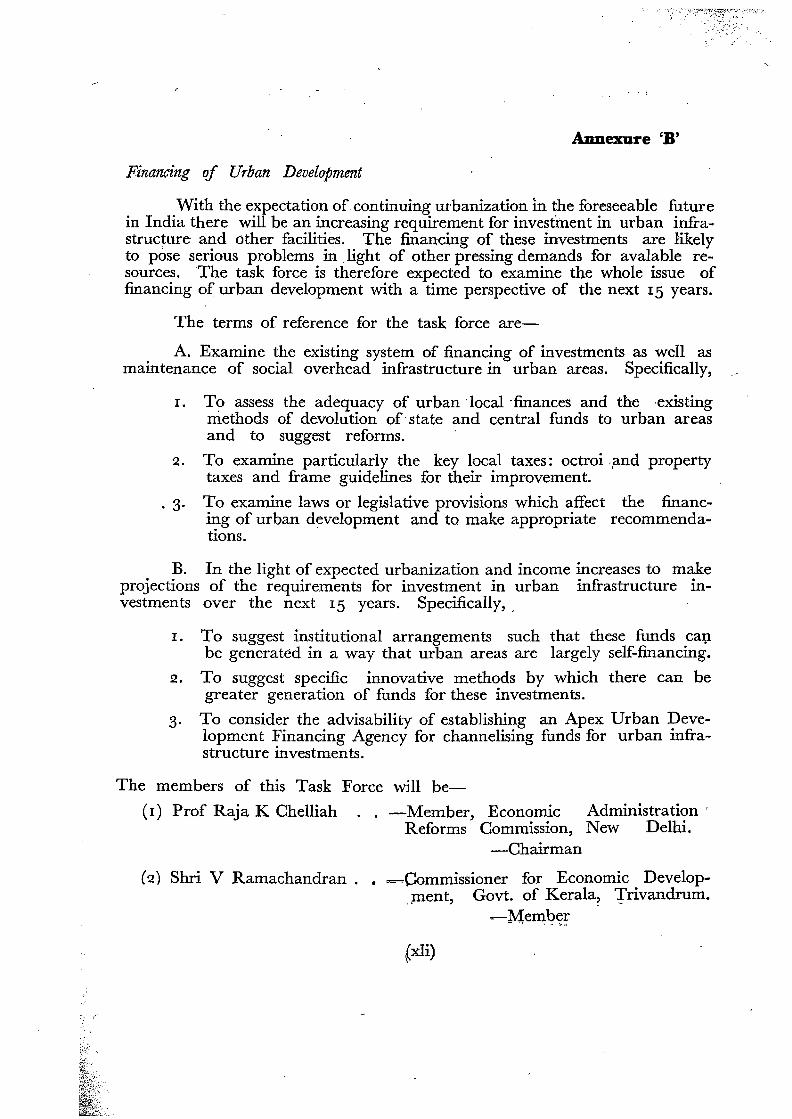
Annexure 'B'
Financing of Urban Development
With the expectation of continuing urbanization in the foreseeable future in India there will be an increasing requirement for investment in urban infrastructure and other facilities. The financing of these investments are likely to pose serious problems in .Iight of other pressing demands for avalable resources. The task force is therefore expected to examine the whole issue of financing of urban development with a time perspective of the next 15 years.
The terms of reference for the task force are-
A. Examine the existing system of financing of investments as well as maintenance of social overhead infrastructure in urban areas. Specifically,
I. To assess the adequacy of urban 'local "finances and the·existing methods of devolution of' state and central funds to urban areas and to suggest reforms.
2. To examine particularly the key local taxes: octroi "and property taxes and frame guidelines for their improvement.
. 3. To examine laws or legislative provisions which affect the financing of urban development and to make appropriate recommendations.
B. In the light of expected urbanization and income increases to make projections of the requirements for investment in urban infrastructure investments over the next 15 years. Specifically,.
I. To suggest institutional arrangements such that these funds can be generated in a way that urban areas are largely self-financing.
2. To suggest specific innovative methods by which there can be greater generation of funds for these investments.
3. To consider the advisability of establishing an Apex Urban Development Financing Agency for channelising funds for urban infrastructure investments.
The members of this Task Force will be
(I) Prof Raja K Chelliah -Member, Economic Administration' Reforms Commission, New Delhi.
-Chairman
(2) Shri V Ramachandran. • =Commissioner for Economic Develop.ment, Govt. of Kerala, Trivandrum.
~Member- '. . - "' ...
~xli)
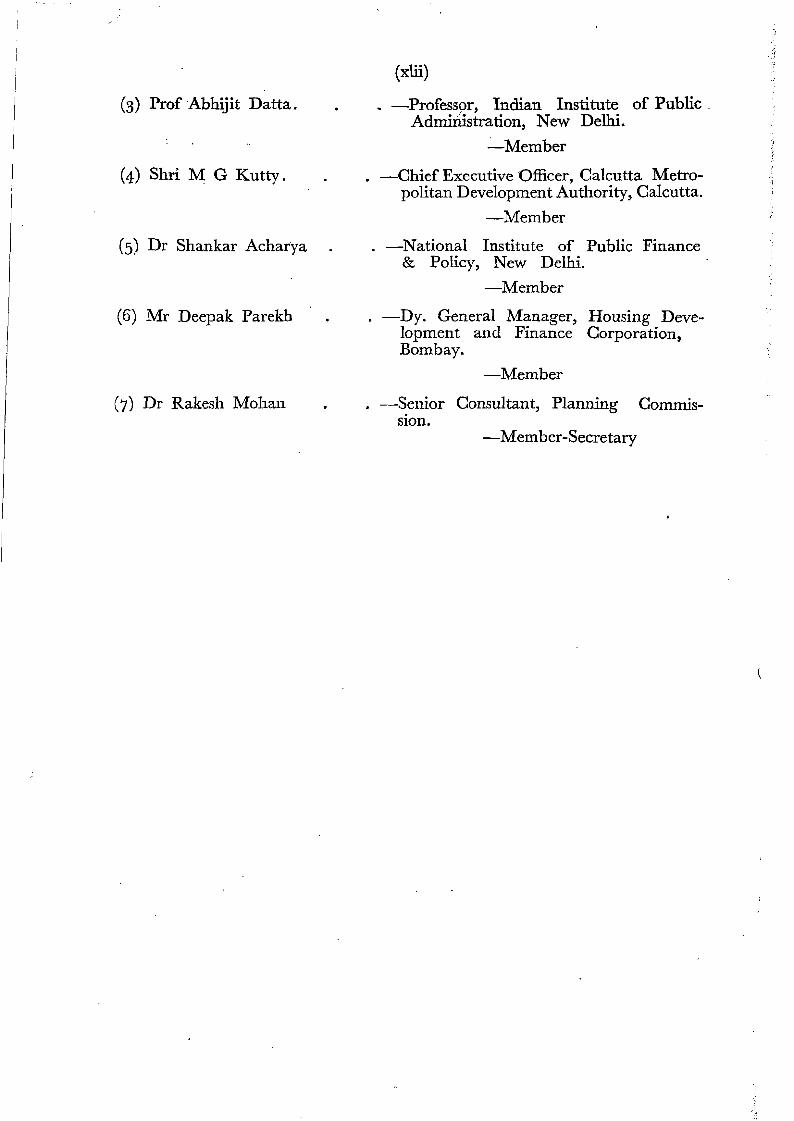
(xlii)
(3) Prof Abhijit Datta. . -Profess()r, Indian Institute of Public Administration, New Delhi.
_.Member
(4) Shri M G Kutty. . -Chief Executive Officer, Calcutta Metropolitan Development Authority, Calcutta.
-Member
(5) Dr Shankar Acharya . -National Institute of Public Finance & Policy, New Delhi.
-Member
(6) Mr Deepak Parekh -Dy. General Manager, Housing Development and Finance Corporation, Bombay.
-Member
(7) Dr Rakesh Mohan . -Senior Consultant, Planning Commission.
-Member-Secretary
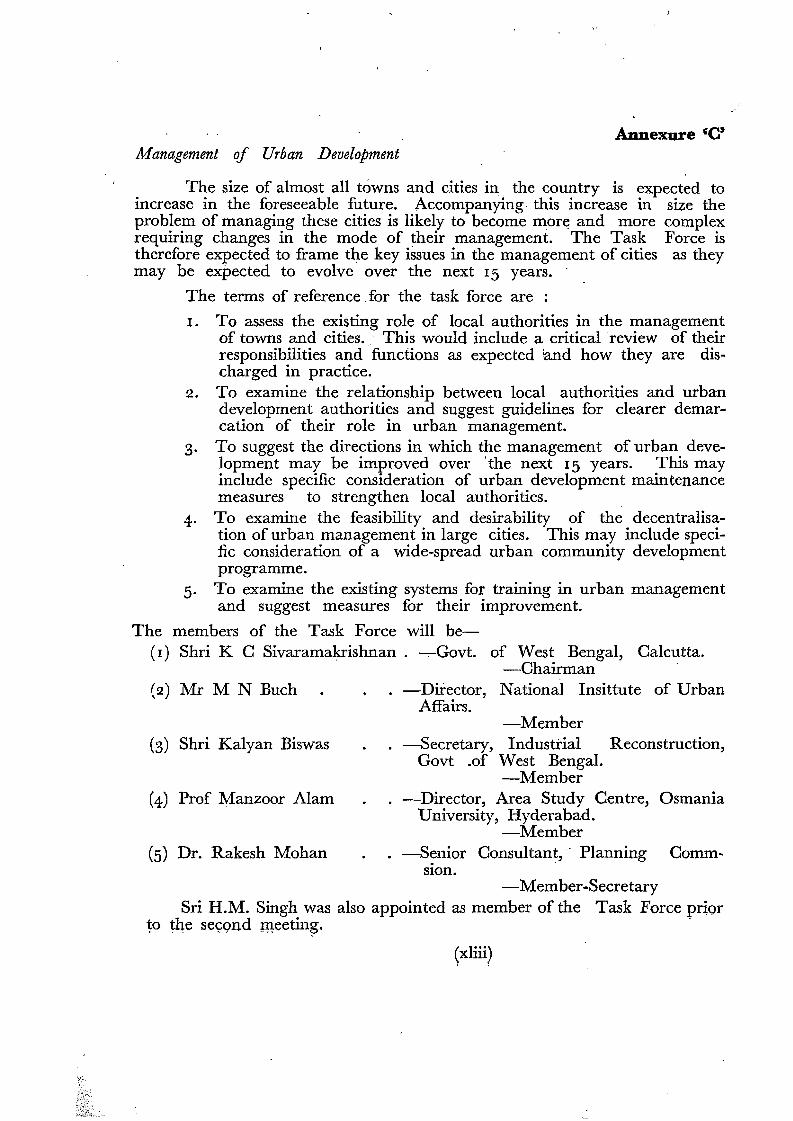
Annexure 'c' Management of Urban Development
The size of almost all towns and cities in. the country is ~xpected to increase in the foreseeable future. Accompanying. this increase III size the problem of managing these cities is likely to become more and more complex requiring changes in the mode of their management. The Task Force is therefore expected to frame the key issues in the management of cities as they may be expected to evolve over the next IS years..
The terms of reference. for the task force are :
I. To assess the existing role of local authorities in the management of towns and cities.' This would include a critical review of their responsibilities and functions as expected and how they are discharged in practice.
2. To examine the relationship between local authorities and urban development authorities and suggest guidelines for clearer demarcation of their role in urban management.
3. To suggest the directions in which the management of urban development may be improved over 'the next I S years. This may include specific consideration of urban development maintenance measures to strengthen local authorities. ,
4. To examine the feasibility and desirability of the decentralisation of urban management in large cities. This may include specific consideration of a wide-spread urban community development programme.
S. To examine the existing systems for training in urban management and suggest measures for their improvement.
The members of the Task Force will be( I ) Shri K C Sivaramakrishnan . -.Govt. of West Bengal, Calcutta.
-Chairman (2) Mr M N Buch . -Director, National Insittute of Urban
Affairs. -Member
(3) Shri Kalyan Biswas -Secretary, Industrial Reconstruction, Govt .of West Bengal.
-Member (4) Prof Manzoor Alam . -Director, Area Study Centre, Osmania
University, Hyderabad. -Member
(s) Dr. Rakesh Mohan . -Senior Consultant,' Planning Commsron,
-Member-Secretary Sri H.M. Singh was also appointed as member of the Task Force prior
to the second meetin~. .
(xliii)
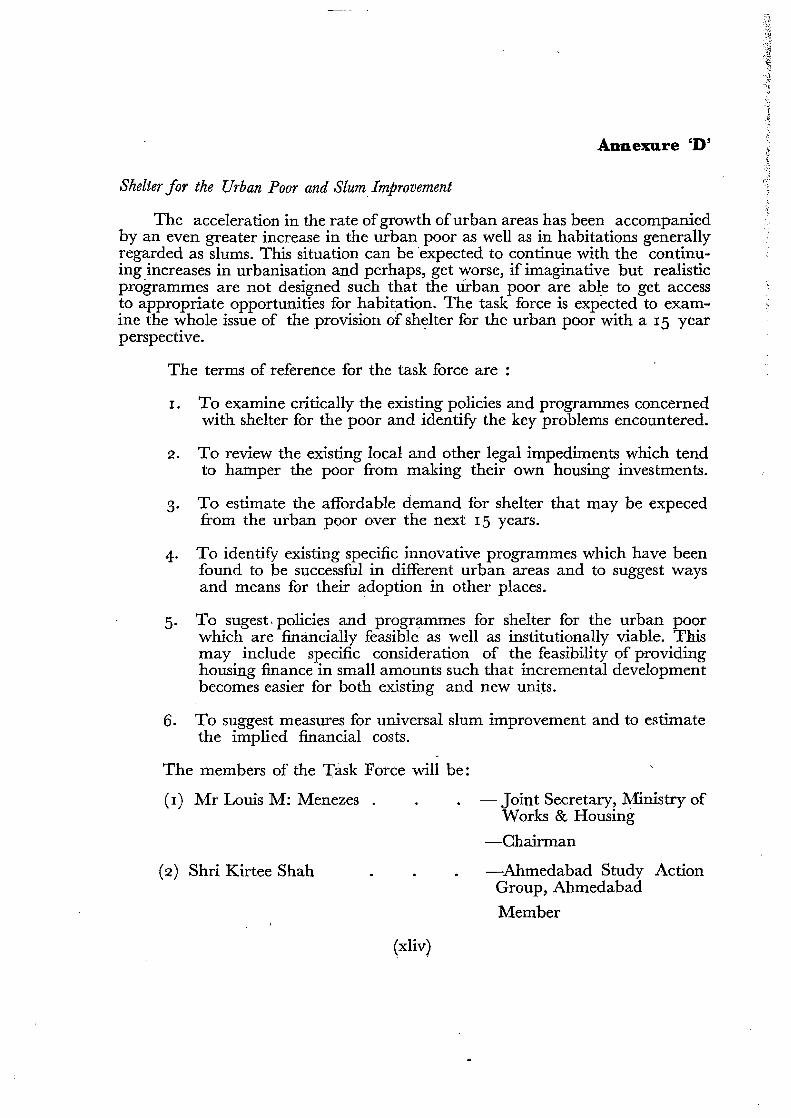
Annexure 'D'
Shelter for the Urban Poor and Slum Improvement
The acceleration in the rate ofgrowth ofurban areas has been accompanied by an even greater. increase in the urban poor as well as in habitations generally regarded as slums. This situation can be 'expected to continue with the continuing increases in urbanisation and perhaps, get worse, if imaginative but realistic programmes are not designed such that the urban poor are able to get access to appropriate opportunities for habitation. The task force is expected to examine the whole issue of the provision of shelter for the urban poor with a 15 year perspective.
The terms of reference for the task force are :
I. To examine critically the existing policies and programmes concerned with shelter for the poor and identify the key problems encountered.
2. To review the existing local and other legal impediments which tend to hamper the poor from making their own housing investments.
3. To estimate the affordable demand for shelter that may be expeced from the urban poor over the next 15 years.
4. To identify existing specific innovative programmes which have been found to be successful in different urban areas and to suggest ways and means for their adoption in other places.
5. To sugest. policies and programmes for shelter for the urban poor which are financially feasible as well as institutionally viable. This may include specific consideration of the feasibility of providing housing finance in small amounts such that incremental development becomes easier for both existing and new units.
6. To suggest measures for universal slum improvement and to estimate the implied financial costs.
The members of the Task Force will be:
(I) Mr Louis M: Menezes . - Joint Secretary, Ministry of Works & Housing
-Chairman
(2) Shri Kirtee Shah -Ahmedabad Study Action Group, Ahmedabad
Member
(xliv)
\.
(3) Dr. Meera Bapat
/'
(4) Shri S. S. Tinaiker
(5) Dr. Rakesh Mohan
(xiv) .
.'
...
-'Centre for Development Studies & Activities, Poona,
-Me~ber,
-Secretary, Housing De. partment, Govt. of Maha
rashtra, Bombay.
-Member
-Senior Consultant, Planning Commission, MemberSecretary
Shri H.D. Bijlani was also appointed as Member of the Task Force prior to the first meeting.
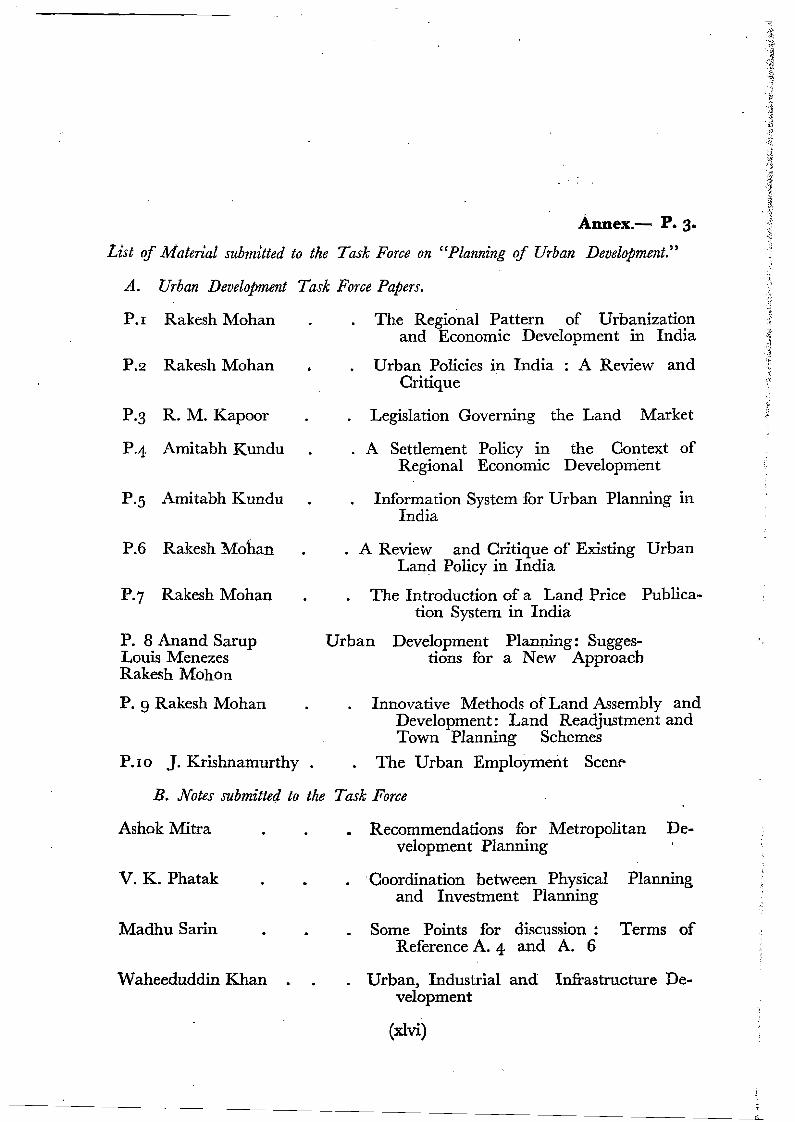
Annex.- P. 3.
List of Material submitted to the Task Force on "Planning of Urban Development."
A. Urban Development Task Force Papers.
P. I Rakesh Mohan The Regional Pattern of Urbanization and Economic Development in India
P.2 Rakesh Mohan Urban Policies in India : A Review and Critique
P.3 R. M. Kapoor Legislation Governing the Land Market
P.4 Amitabh Kundu A Settlement Policy in the Context of Regional Economic Development
P.5 Amitabh Kundu Information System for Urban Planning in India
P.6 Rakesh Mohan . A Review and Critique of Existing Urban Land Policy in India
P.7 Rakesh Mohan The Introduction of a Land Price Publication System in India
P. 8 Anand Sarup Urban Development Planning: SuggesLouis Menezes tions for aNew Approach Rakesh Mohon
P. 9 Rakesh Mohan Innovative Methods of Land Assembly and Development: Land Readjustment and Town Planning Schemes
P.IO ]. Krishnamurthy . The Urban Employment Scene
B. Notes submitted to the Task Force
Ashok Mitra Recommendations for Metropolitan Development Planning
V. K. Phatak Coordination between Physical Planning and Investment Planning
Madhu Sarin Some Points for discussion: Terms of Reference A. 4 and A. 6
Waheeduddin Khan Urban, Industrial and Infrastructure Development
(xlvi)
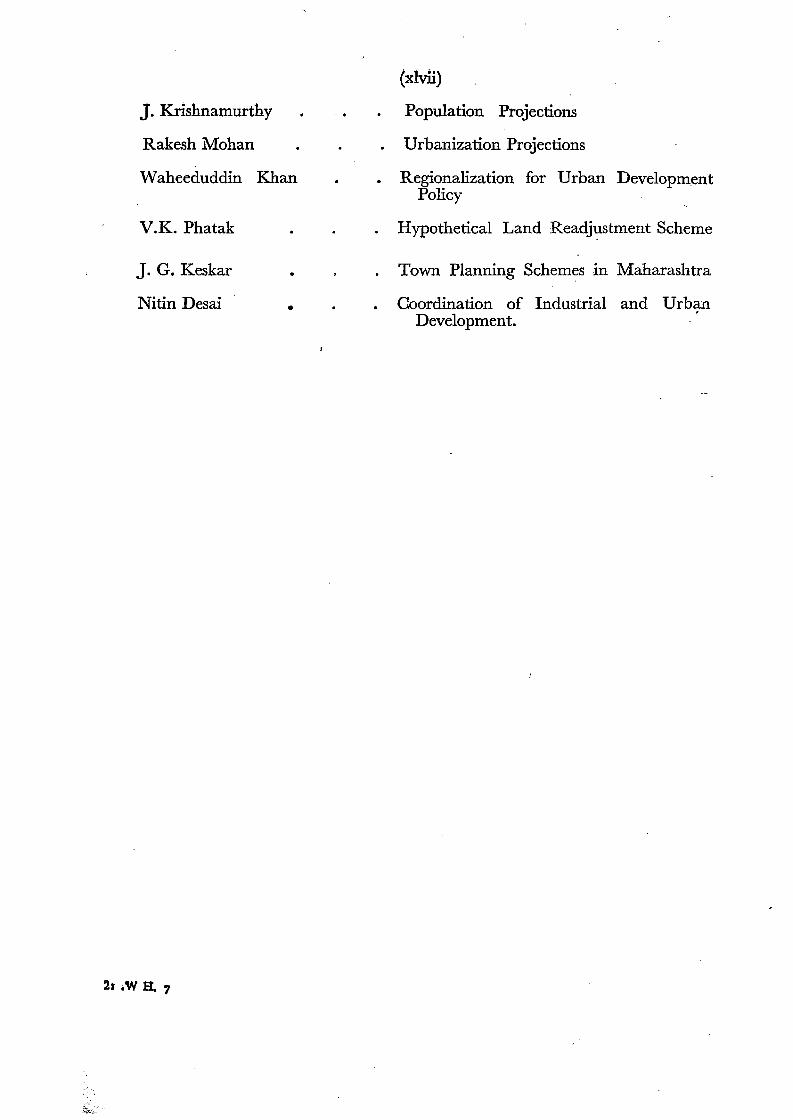
J. Krishnamurthy
Rakesh Mohan
Waheeduddin Khan
V.K. Phatak
J. G. Keskar
Nitin Desai •
(xlvii)
Population Projections
Urbanization Projections
Regionalization for Urban Development Policy
Hypothetical Land Readjustment Scheme
Town Planning Schemes in Maharashtra
Coordination of Industrial and Urban Development.
2r .w H. 7
I. URBAN DEVELOPMENT IN INDIA : REASONS & OBJECTIVES
The Longer Term
r , t The national targets. that have been set for agricultural production for 2000 demand a steep increase in productivity per unit of land as well as per unit of labour. Intermediate technologies of labour-intensive cultivation must repidly give way to increasing investment per unit of land in terms of inputs and farm machinery. It would be idle to imagine that the rapid rise in rural population through demographic growth can be absorbed in agriculture as far as 2000 AD and still ensure its growth in productivity and total production. Twenty years ago roughly 55 percent of Gross Domestic Product was being created by 70 percent of the labour force in agriculture. Today a similar 70 percent is creating only 35 to 40 percent as the contribution of agriculture to GDP. Land under cultivation has not significantly increased. On the contrary the constant proportion of70 percent ofpopulation. means an additional burdenofabout rfio million persons on the same quantity of land after 20 years. Even the most massive foodfor-work programmes, continued steadily up to 2000 AD, will hardly suffice to keep our excess population productively engaged. This is gross proof of how seriously agriculture is encumbered today.
1.2 This apart, it has to be acknowledged as a major instrument of public policy that rural prosperity can no longer be contained in rural areas. The recent spurt in India's urbanization is an inevitable reflection of the changing structure of the economy towards the secondary and tertiary sectors. Throughout modern history rural agricultural push has been almost as strong as urban and industrial pull. Rural prosperity will bring about more accumulation of material and human capital than agriculture can absorb. Agricultural profits will demand diversifiction in non-agricultural portfolios. Improvement in rural human resources through growth'in education, health, skills and institutions, must find play in urban, non-agricultural enterprise.
1.3 Despite the still appalling isolation of innumerable villages and rural settlements, particularly in backward regions, the urge to secure a place for each in the national or regional market network of goods and services and wages has grown irresistibly in the last twenty years. There can be no two opinions that a town, however small, or a semi-rural growth centre or mandi, is the visible symbol and instrument of a national or regional market network. In most countries of the w rid today-not excluding Africa-the ratio of the urban population is far greater than India's paltry 24 percent. In most countries the ratio of rural to urban settlements ranges between 6 and 20 to I. But in India this ratio is still at least as high as 180 to I. TJ,lls figure alone tells volumes about the state of access of 0ur rural areas to the national and regional markets. The prospective toll of this situation on agricultural growth and rural prosperity can only be imagined. Besides, urban household and non-household manufacturing and services cry out to be rapidly expanded to stimulate rural demands for goods and services. Continuous rise of effective demand in rural areas will be" the abiding guarantee of growth in agricultural :productivity. We have r cached
the stage where further neglect of the urbanization process, and attempts to thwart its rapid articulation will kill the goose that promises the golden egg of agricultural self-sufficiency.
1.4 The Second Plan set the national aim as attainment of the good life.: This goal will elude us in -the foreseeable future. Stricltly speaking, except for the happy' few, the rest, even in Delhi, not to speak of other metropolitan cities', non-metropolitan towns, growth centres or mandis, do not enjoy even the minimum urban amenities available in Europe or North America or the East Asian seaboard. Every urban amenity in India, even in metropolitan areas, is available at far less than commonly' accepted norms to the common citizen : sewerage and sanitation, potable water, education, health, transportation, environmental sanitation, permissible pollution, housing, energy supply, institutional facilities. Communication, a practical yardstick ofurban amenity and efficiency, does not work. Many countries now can directly get a village or city on the telephone from one end to other in a matter of seconds. The telephone is available to a small fraction of urban areas. It takes, if one is lucky, half an hour to make an intracity telephone call in Delhi. This is the state of our national communication network. No institutional facility is available as a matter of course and right to a private citizen. It is always a hard and fearfully earned favour.
1.5 The see-saw of political fortunes in the last twenty years-manifested mainly through the popular vote-point to the extreme necessity of securing complementarity between rural and urban areas. This is essential for securing the political stability and unity of the country. Attitudes towards the urbanisation process in the next twenty years must therefore be guided not by jmattainable dreams of conspicuous expenditure on a small number of urban areas, but by practical, hardheaded considerations.
1.6 Some of these considerations are
(i) Rapid expansion of non-agricultural livelihoods and employment assisted by the promotion of education and technological skills at urban and semiurban nodes that will offer economies of scale in the exploitation of physical and institutional infrastructure and provide competitive markets for wages and skills. Further economic growth will be difficult without a restructuring of our future working force which is more in consonance with the composition of our GDP.
(ii) Rapid articulation of a very large number of growth centres or mandi settlements each of which will enjoy a minimum infrastructure of energy installation, financial, servicing and counselling institutions, communications connecting neighbouring villages to the regional network, sites or locations for setting up warehousing, industries and services for local and regional needs, minimum telecommunication, education, housing and welfare facilities. In short, amenities that will connect the surrounding rural areas to the national or regional, market network of wages, industrial products, spares and consumer goods and reduce the present urban-rural settlement ratio of 180 to I to a possible 25/30 to 1. These settlements will serve partly as outlets for investment of surplus capital and human resources of rural population and for upgrading human skills and productivity. . - -
3
. . (iii) Fresh and renewed endeavour at. recreating regional networks of 'infrastructure is needed for securing interdependencies between size hierarchies of rural and urban settlements in defined spaces. At present these interdependencies exist more in terms of one-way distribution outlets of goods and services from larger to smaller settlements rather than the other way round in terms of industrial and raw material supplies or of supply of. ancillaries or even labour from the smaller to the larger .settlements. Establishment of two-way hierarchy networks will be facilitated only when the kind of infrastructure mentioned in the case of growth centres or mandi towns is proportionately augmented in the larger size classes. .
(iv) The existing network of state capital city, major intra-state urban nodes, district, subdivisional, tehsil and mandi towns awaits to be strengthened with expansion of infrastructure proportionate to the size class importance ofeach link. The object in each case should be more the expansion of non-agricultural investment opportunities and employment, improvements in human resources and skills, markets and goods and services rather than the pursuit of unrealisable norms ofurban amenities at state expense. This is not to suggest that urban' amenities should be neglected (in fact, urban amenities act as a potent and abiding pull factor and determinant of higher urban .and industrial productivity) but that wealthgenerating sectors in urbanization investments should receive at least ·as much priority for the next several decades as consumption investments. There has been a marked tendency in recent decades towards improvements in urban amenities to the implied neglect of urban production investment and employment. Recent trends in metropolitan development have set the pace in this regard. This needs to be corrected.
I.7 It is possible to think of a fair number of small towns where some urban amenities are available. On the other hand, one can think of very few lower order urban centres in India that can boast of brand-new, modern-technology non-Iocal-raw material-based factories. While more sharing of scarce urban amenities and even outright deprivation seem inescapable for some time to come, there is a case for augmenting and distributing more urban employment opportunities. Rural and Urban, agricultural and industrial, political lobbies should recognise the logic of complementarity of rural-urban, agricultural-industrial growth and employment as the obvious answer to the stability as well as economic and social growth of our country.
I.8 This may well constitute the task ofurban development in the coming decades. First, stimulating the growth of a large .number of growth centres or mandi towns linked to the network oflarger national and regional markets, which will reduce the proportion ofthe population dependent on cultivation and enhance the proportion ofsettlements that will have the effective characteristics of urban nodes-densification of population, dominant secondary and tertiary sector working force, a realistic array of manufacturing, trade and commerce, transport and services, provision for expansion of non-agricultural enterprise, formal and technical education, social welfare, administrative and financial institutions, provision of energy, warehousing, and above all housing. These may not come up to modern urban standards but the aim should be quickening of economic enterprise, expansion of a wide spectrum of employment and skills, accessibility to wider networks, with provision for establishing better civic services and condi
4
tions as opportunities arise. Even if desirable urban amenities are not available and will elude us for a long time, the fact remains that India's cities and towns, as in all other climes and times, are the cradle of all creative enterprise and the home ofall cultural, scientific, industrial, and technolo gical progress and strength..
The Shorter Term
I.g In the short run, however, over the n.ext two plan periods, at any rate, urgent attention and investment is necessary to enable the existing national, metropolitan and existing regional state and district urban nodes to receive the urbanward migration that will continue to take place. It is important to recognise thatnot a.single metropolitan city-s-not even Bombay or Calcutta if one examines them closely-not to speak of 200 odd I lakh urban nodes-has yet started manifesting diseconomies of scale. Density of all kinds still provides hospitality to every kind of enterprise in both formal and informal secondary and tertiary sectors. With wisely conceived schemes of reconstruction and redensification of city cores and peripheries they will continue to thrive indefinitely. Here, too, as in everything else in our country, equity is of the essence in our plans and men and women must have shelter and the minimum amenities of life. Connecting facilits should be made available for useful productive work, should it prove impossible in certain cities to house low income workers close to their place of work. '
1.10 The magnitude of the task in the next two Plan periods will appear from the fact that the number of metropolitan cities (I million plus) will grow from 12 in 198 I to at least 20 in 199 I ; of cities of I lakh to I million from 204 to at least 300 ; of class II towns from 270 to 350. The population in million plus cities Will grow from 42 million to about 65 million, of class I cities from 52 to 85 million; ofclass II towns from 18 to 27 million (many class II towns will graducate to class I in the current decade). These projections have been made on the basis ofpast trends and known historical patterns of urbanisation. Suitable policy and appropriate programme interventing can alter some of these magnitudes at the margin, particularly in some regions which need a more beneficent network and spatial distribution of population.
I. I I Taking an across the board proportion of the working force at 30 percent of the total population, the growth in working force in urban areas alone will be 30 per cent of 70 million orz I million. These are daunting figutesas every absolute figure is in this country-but, given the will, the task may not prove insuperable if fancy frills are eschewed and consideration of material and human capital growth are kept in the forefront along with equity. Scarcity will have to be shared.
1.12 Adequate housing for the backlog and the additional 70 million may prove difficult but not insuperable given the right policies. Here to equity and careful husbanding of new and old housing stock can be made to play a very benign role. Besides, the magnitude of the task varies from one zone to another in India and a variety of innovative practices tailored to each Zone's particular problems and requriements and ecological preferences for house designs and building materials will be called for. It is also important to decide upon questions of strategy: whether centralised sewerage and sanitation, water supply, etc. should be undertaken for a city as a whole or a city should be divided in to clearly
:.... :
demarcated neighbourhoods and have decentralised smaller subsystems to be integrated when times and finances are mote propitious. The latter may cost a fraction more than centralised systems but unayprove to be more economical to maintain and quicker to set up. These general considerations about the direction of overall development in India have guided this Task Force in its approach to urban development in India. The report offers a systematic assessment of the current urban situation in India; a realistic forecast ofwhat may be expected in terms ofurbanisationupto the year 2000 ;' and a suggested reorientation of urban policy in the light of these findings.
D. URBANISATION IN INDlA: THE RECORD
2. I Introduction
The results of the 198I Census indicates that the urban population of India is now about 160 million. Although this number implies that the urban population is still less than a quarter of the total population in the country, the absolute magnitude is so large that it warrants a fresh and close look at the existing policies concerned with housing and urban development. Indeed, since the level ofurbanisation is still less than a quarter, it is important to realise that the volume of people living in cities will continue to increase in the foreseeable future. Hence policies have to be designed such that the continuing needs of urbanisation are met. While it is clear that agriculture and rural development will, and should.. continue to command priority attention in planning, the size of the urban problem is now such that it can no longer be left to chance while hoping for the best.
2.2 The key fact that must be faced is that urbanisation is going to continue apace in India in the foreseeable future. It is going to place heavier demands on government for the provision of a host of necessary urban public services. The administrative and fiscal problems that arise from such demands will not be solved by wishing that cities would grow less quickly though, no doubt, some method of curtailing city growth might succeed temporarily. Yet, ever since the III Plan this is exactly what we have been wishing despite all the evidence available which indicates that most cities and towns have been growing uniformly at rates varying between three to four percent a year. There have been cities which have grown faster such as Delhi, Bangalore, Bhubaneshwar, Bhopal, Durgapur, Bhilai, etc., but these have almost always been cities with massive public investments like the steel towns and the various state· capitals. There have also been some others such as Faridabad, near (Delhi) and Surat, in Gujarat, which have also grown very fast, thanks again to investment on high industrial growth. "Decongestion" of cities and industrial dispersal have been mentioned as an objective in all the plans since at least the III Plan document. It is, therefore, important now, after 30 years of planned development, to make a systematic revie~ of urbanisation policy.
2.3 Urbanisation is a determinant as well as a consequence of economic development in general. It is a natural consequence of economic changes that take place as a country develops. Certain activities are better performed in, indeed require, certain densities in agglomerations of people while others. do not. The location of activities has therefore to be seen in the total context of activities existing in a country and their likely development in the future.
2.4 In attempting to understand why certain activities locate in urban areas and others do not, it is necessary to look into the nature of different kinds of economic activities. The distinguishing characteristic of urban areas is the existence of concentrations of people and activities in relatively
0 •.. 6 shoulnoe U1.lu,\
7
.small areas. This means activities which can substitute other inputs,m~y capital, for land are likely to concentrate in space. Technicauy, .high elasti
. cities of substitution between land and non-land inputs would lead to urban concentration. Thus, although farm mechanisation and irrigation does enable greater land/non-land substitution in agriculture, the potential for such substitution is severely limited by technology. But service activities based on offices have high substitution elasticities. Large modern industries, particularly continuous process industries, have lower elasticities than small batch production industries. Thus, office activities will and do tend to concentrate heavily in central cities while large modern industries with inescapable demand for land for optimum processing layout tend to locate on peripheries of cities or in new cities where land is available at comparatively low value.
2.5 But high land/non-land substitution elasticities are not by themselves enough to produce urban concentrations. It is the existence of other scale economies-both manufacturing and services-which also contributes to concentration. When there are scale economies in a few activities, the multiplier effect of those activities would produce a concentration of other acti vities which are necessary for their functioning. The exigency of transportation costs of labour, raw materials, and finished products necessitates the location of complementary activities in close proximity 'to the industries 01'
services which exhibit scale economies. It is these factors that make it more economical and profitable for small and even artisanal industries both in the formal and informal sectors, to thrive more in densely populated cities than, as is often fondly imagined, in smaller cities or towns. Hence, it is the combined effect of scale economies, transportation costs and relatively high substitution eleasticities between land/non-land inputs in non-agricultural activities which produces urban concentrations. It is this process that contributes to the transformation of a largely agricultural to a non-agricultural economy.
2.6 As income rises there is a general shift in demand from food goods to non-food goods. In a country as poor as India this effect is still somewhat muted because for the poorer half of the population small increases in income would not appreciably lower the proportion of their incomes spent on food. However, according to the National Sample Survey the decline in proportion of consumption expenditure spent on food begins at about the soth percentile. In other words, even for the very poor Engel demand effects are noticeable. Hence, as per capita income rises the increase in the proportionate demand for non-food goods accelerates. Consequently, the demand for labour for non-agricultural activities increases and this increased demand for labour stimulates urbanisation.. The whole process has invariably been triggered in. modern history by an initial increase in agricultural productivity. Increasing investible rural incomes are therefore likely to accelerate urbanisation.
2.7 The association between per capita incomes and levels of urbanisation is apparent even on rough scrutiny. Over 75 per cent of the variance between levels of urbanisation observed for the 110-120 countries for which data are readily available is explained merely by the use of per capita income differences betwen these countries. I VVhat is interesting is that India lies quite clos~ to the regression line : hence the level of urbanisation in India
lSee Technical Appendix I for such an estimation. 21 WH-8
01: " t'
8
can he regarded as being quite consistent with the experience of other' countries in the world. What is even more interesting is that the different states of India with different levels of per capita income fall close to those areas of urbanisation levels that accommodate other countries with equivalent per capita incomes.
2.8 It must be made unequivocally clear that India is not faced with an "urban explosion" as compared with trends in the rest of the world. In 30 years, its level of urbanisation has increased from about I7 per cent in I95 1
to only about 23.7 per cent in Ig81. Consistent with its low per capita income, India's level of urbanisation is about 90th in rank : there are only about 30 countries with levels of urbanisation lower than ours. Moreover, the rate of growth of urban population in India is also among the lower rates ofgrowth in the world. This is in woeful contrast to India's overall industrial, cultural, scientific and technological might among the nations of the world, and is indication of the kind of feet of clay on which this colossus stands.
2.g Clearly, there is no ground for complacency although, in absolute terms, India's urban population increased by about 50 million people over the last decade. This increase itself is larger than the total urban population in all countries except China, The Soviet Union, The United States of America, Japan and Brazil. Indeed, it is likely that India's urban population will be greater than that in all countries except China by I985. Still the urban ratio is not good enough for India's legitimate future. This prognosis along with the absolute magnitude of India's urban population implies that policies toward urban development need to be reconsidered urgently.
The Record since I 90 I
2.IO Table 2. I gives the record since I901. India's urban ratio was relatively static upto I921. Since I92I the level of urbanisation has slowly" inched up from about I I.3 per cent of total population to 23.7 percent in I98I. During the same time, however, because of India's large population base, the urban population however in absolute terms has increased about six-fold. In the last decade, in particular, the increase has been particularly large, about 50 million people. .
2. I I One of the problems in the interpretation of data related to urbanisation is that the growth of urban population as revealed in any census is composed of three distinct components. First is the natural growth ofpopulation already residing in urban areas. Second is the reclassification as urban areas of settlement hitherto classified as rural areas and vice versa. This happens in two ways. Large towns and cities extend their boundaries to include villages. Secondly, with population growth, as large villages grow and acquire "urban characteristics" they get reclassified as towns. Some areas injudiciously classified urban in one census are often declassified in the next. It is important to disaggregate these three components in order to understand the process underlying
lThe gradual nature of this growth may be gauged from the fact that China has experienced a similar change from about II per cent to over 20 perc ent urbanisation in just the last 30 years.
9
urbanization i.e. rises in the proportion of population classified as urban. The Indian Census now has a relatively strict definition of places classified as urban . areas.
2.12 The key ideas underlying the concept "urban" are (i) discernible 0urb.an attributes, (ii) high density of population and (iii) the dominance of non
agricultural pursuits. The census combines these two ideas and settlements are classified as urban areas if either
(a) they have a municipality, corporation, cantonment board, notified town areas committee, etc.
or (b) they have (i) a minimum population of 5000 and (ii) a density of at
least 400 people per sq. km. and (iii) at least 75 percent of the male labour force is in non-agriculture.
2.13 A certain arbitrariness arises as a result of definition (a) since that is subject to administrative as well as political vagaries. Definitional problems arise at the margin but it is important to keep them in mind in the interpretation of data- especially at the regional level.
2.14 Urbanisation can be measured in a number of different ways. The first is to examine changes in the level of urbanisation i.e. changes in the proportion of population living in urban areas. A second measure is the "urbanrural growth differential" (URGD). This is merely the difference between the rates of annual population growth between urban and rural areas. Since urban and rural natural population growth rates have not differed widely uptil now, this measure gives a good sense of the magnitude of the rural-urban transformation that is taking place. A third measure of urbanisation is the share of net migration in the total growth in urban population. This, of course, is a difect measure of the transfer of population from rural to urban areas. The fourth measure is the growth of urabn population itself
2.15 A problem generic in any interpretation of urbanisation trends is that urban population growth rates are usually computed between two quantities that have somewhat different bases at two census points. To illustrate: the urban population of India in 1971 resided in 2531 towns while that for 1981 was in 3245 towns. Thus the base for 1981 is different from that in 1971. Similarly,the growth ofbig cities between two points of time often incorporates the addition due to extension of boundaries. Although in Table 1.1 we have attempted to distinguish increases in urban population as a result of population increase in already existing towns and that which result from addi.. nons of new towns or extensions of boundaries, the result has not been entirely satisfactory. For one thing, population of areas classified in a previous census but declassified in the next have not been subtracted, although the .error would be small. For another, we do not yet possess the information for 1981 by means ofwhich we could have computed on citysize being kept constant-either within the earlier boundaries or within the new boundaries.
2.16 A glance at the difierent indices given in Table 2. I indicates that the pace of urbanisation was steady until about 1951. It deereased in the 1951--1961 decade but the latest census shows an acceleration once again. Although the
0
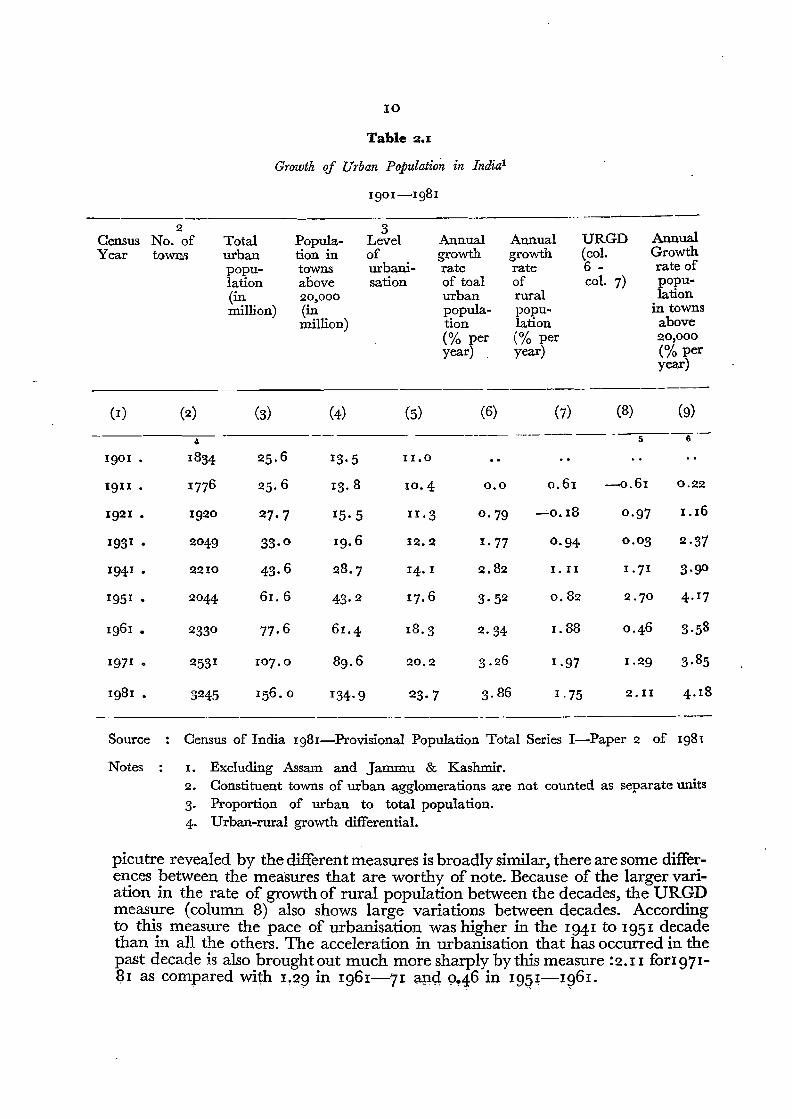
picutre revealed by the different measures is broadly similar, there are some differences between the measures that are worthy of note. Because of the larger variation in the rate of growth of rural population between the decades, the URGD measure (column 8) also shows large variations between decades. According to this measure the pace of urbanisation was higher in the 1941 to 1951 decade than in all the others. The acceleration in urbanisation that has occurred in the past decade is also brought out much more sharply by this measure =2.11 for197181 as compared with 1!29 in 1961-71 and 9~46 in 19QI-1961.
II
2.17 The slowing down of urbanisation during 1951--61 has sometimes been explained in terms of the declassification of about 800 towns in 1961.as a result of a stricter application of the criterion for urban places.' Indeed it is only since the 1961 census that the definition of urban areas has been systematised and made uniform across all states, although as we have already mentioned, an element of arbitrariness has lingered. This arbitrariness is particularly noticeable in the classification of towns at the lower end of the scale since at this level the distinction between village and town would necessarily involve judgment and discretion even in applying the more rigorous definition of urbanisation. Since the urban character of bigger towns is more easily recognisable, classification problems are not likely to be as important for them. Hence, column 9 in Table 2. I recomputes the growth rate of urban population in towns of over 20,000population, the norm sometimes taken for international comparisons.
2.18 The picture is again broadly similar to that of the usual definition except that the rates of change are somewhat higher. Two points stand out. First, the deceleration in the 1951-61 decade remains. It was thus not a purely declassification problem but something real. Second, the rate of change in the 1931 to 1941 period was similar to that in 1961-1971 and that in 1941-1951 to 1971-1981. It is reassuring to observe that the broad pattern ofchange is not altered drastically by adopting a different definition.
2. 19 Another feature which stands out from Table 2. I is the very stable structure of settlements. While total urban population increased six-fold between 1901 and 1981, the number of settlements increased by only Bopercent. Thus most of the growth was more due to the growth of existing towns at every level than to the addition of new towns. The majority of settlements now classified as towns have exhibited urban characteristics for a very long time. There were, for example, 3200 towns and-reo cities in India as early as 15863 which is quite similar to the number now. The majority of regions in India have had settled cultivation for a very long time. The spatial distribution and number of settlements therefore reflects a long and stable central plan network. With the low growth in population until the earlier part of this century, the majority of settlements had remained at the same size for long periods of time until recently. The function of most small towns is essentially that of servicing the rural surroundings as market and service centres. Thus, their number and spatial distribution reflects the magnitude or rather long duration stagnation of demand for their services from the surrounding areas. There is then a hierarchy of settlements in each region and sub-region and it appears that this hierarchy has remained relatively stagnant miniscule towns appearing and disappearing at themargin from time to time.
lBut about 500 towns were added at the same time which had not been classified as towns earlier.
2That this could make a significant difference is evident from the fact that in 1971 there were as many as 55 million people residing in settlements classified as rural but with populations greater than 5000-a figure comprising about half the total urban population in the country in 1971. Of these, about 22 million lived in 1358 villages with population greater than 10,000 (IS million in Kerala alone) and the rest in about 5000 villages in the 5000-10000 size range.
3Moonis Raza et. al. "India : Urbanization and National Development". in M. Honjo (ed.) Urbanization and Regional Development. Singapore : Maruzen Books 1982,
12
Furthermore, despite this long settlement history, there are vast areas in the country which are devoid of urban settlements of any size leading to the extremely low levels of urbanisation of 5-10 percent in these regions. In such areas, where the distribution of existing towns is sparse, a large number of new towns can be expected to appear and, indeed encouraged to do so in the next few decades.
The Size Distribution ofTowns and Cities
2.20 There is a widespread erroneous belief that large towns and cities have been growing much faster than smaller cities and towns in India and that the latter have suffered and even declined as a result (see Table 2.2). This is simply not true. What is true is the proportion of total urban population which lives in cities and towns above any cut off point continues to increase because of the relatively stable structure of the Indian settlement pattern. Thus most of the urban growth takes place by accretion to existing towns and only a small portion by the reclassification of villages into towns and by the emergence of new towns. Large towns and cities are not as a rule growing any faster than small towns in general, although there is naturally a great variety of growth experience between cities and regions. The belief about faster growth of larger cities persists because tabulations are usually based not on individual cities but on size classes, which does not take into account intercensal movement of towns between one class range to another.
2.21 Table 2.2 is an example of the kind of table that is usually used to show that larger cities are growing faster than smaller towns. The number of cities in each size class changes between censuses. Naturally, in the highest size class {Class I cities), no cities devolve out of it while many graduate into it. This feeds an illusion as if cities in the higher size classes are growing very fast. For example, the growth rate computed for Class I cities is between the population of 145 cities in 1971 and the population of 216 cities in 198r. These are in effect non-comparable bases. This applies to lower size classes as well as on account of intercensal promotions from below. But additions to the lower size classes involve smaller magnitued of population than in the upper ones. It has also to be borne in mind that the faster growing towns graduate more quickly than slow growing ones.
2.22. Tables 2.3 and 2.4 give the deflated tabulation that should be used in comparing the real growth experience of different sized cities and towns. Table 2.3 takes towns according to their classification in 1971 and computes growth rates by comparing the total population of townsin each class in 1971 with the total population of the same towns in 198! irrespective of their classification in the Ig81 Census. (All towns in Assam and Jammu & Kashmir have been excluded from these tabulations since they were not enumerated at the same time as the rest of the country. Assam is yet to be enumerated).
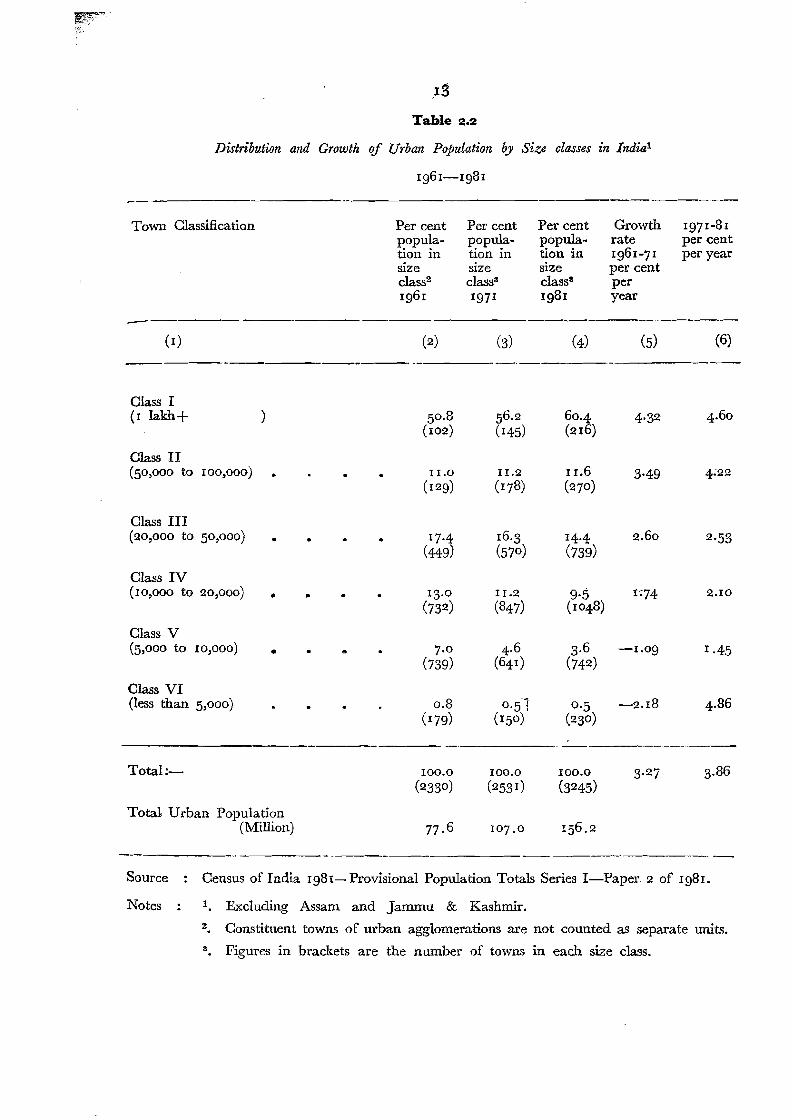
Table 2.2
Distribution and Growth of Urban Population by Size classes in India l
1961-1981
Town Classification
(I)
Per cent population in size class" 1961
(2)
Per cent Per cent Growth 1971-81 popula popula rate per cent tion in tion in 1961-71 per year SIze size per cent class" class" per 1971 1981 year
-----(3) (4) (S) (6)
---------
Class I (I Iakh-l-
Class II (5°,000 to 100,000)
so.8 (102)
II-O (129)
56.2 (14S)
11.2 (178)
60·4 (216)
11.6 (270)
4·32
3·49
4.60
4~22
Class III (20,000 to 50,000)
Class IV (10,000 to 20,000)
Class V (S,ooo to 10,000)
Class VI (less than 5,000)
•
•
•
17·4 (449)
13.0 (732)
7.0 (739)
0.8 (179)
16,3 (570)
1I-2 (847)
4.6 (641)
o·s-l (150)
14·4 (739)
9·5 (1048)
3.6 (742)
0·5 (230)
2.60
1;74
-LOg
-2.18
2·S3
2.10
1.45
4.86
Total: 100.0 (2330 )
100.0 (253 1)
100.0 (3245)
3.27 3.86
Total Urban Population (Million) 77. 6 107.0 IS6.2
Source Census of India 1981- Provisional Population Totals Series I-Paper 2 of Ig81.
Notes 1 Excluding Assam and Jammu & Kashmir.
z, Constituent towns of urban agglomerations are not counted as separate units.
3, Figures in brackets are the number of towns in each size class.
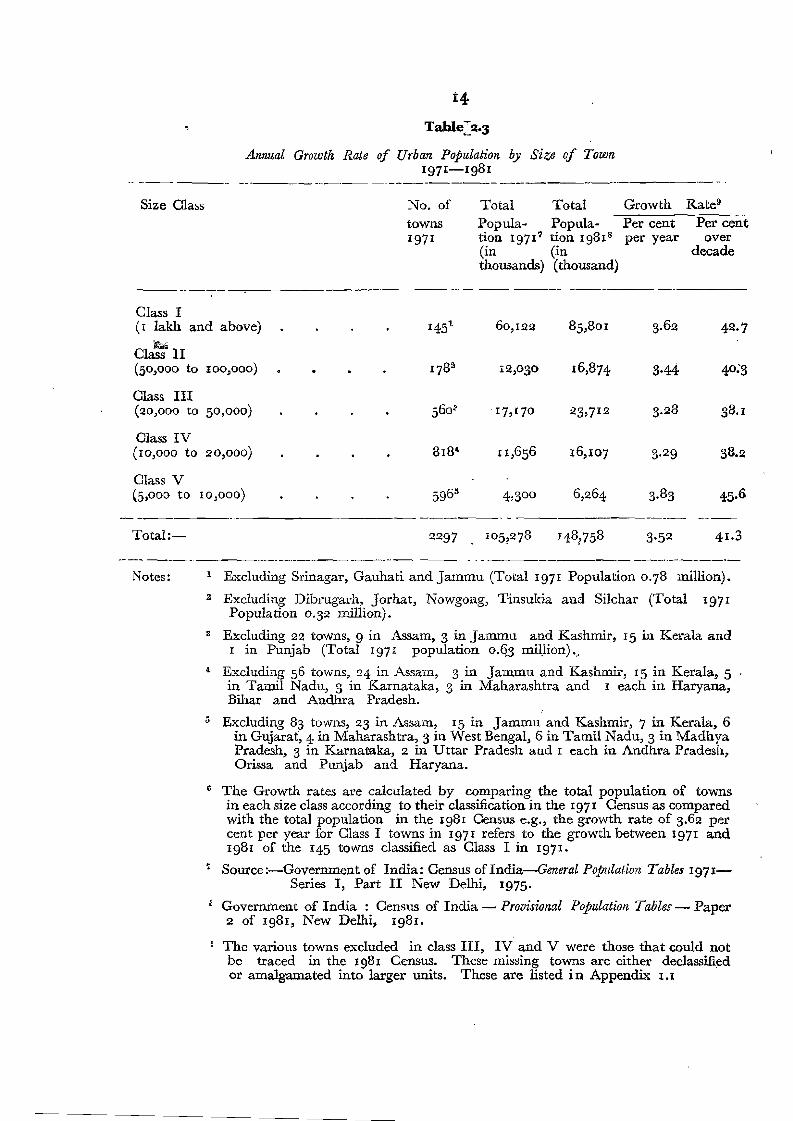
i4
Table:::2'3
Annual Growth Rate of Urban Population by Size of Town 1971-1981
.. -------- -_._---_..._._-~
Size Class No. of Total Total Growth Rate9
towns Popula- Popula- Per cent Per cent 197 1 tion 19717 tion 19818 per year over
(in (in decade thousands) (thousand)
---_._----~----
Class I (I 1a.kh and above) 1451 60,122 85,801 3.62 42·7 ~
Class 1I (50,000 to 100,000) 17821 :;:2,030 16,874 3·44 4°:3
Class III (20,000 to 50,000) 560~ .17,170 :23,712 3.28 38.1
Class IV (10,000 to 20,000) 8r8" [ r,656 16,107 3.29 38.2
Class V (5,000 to 10,000)
---_._-_. .5965
_-------4,3°0
-_.. 6,264 3.83 45.6
Total: 2297 1° 5,278 148..758 3.52 41.3
-_._---_.Notes: 1 Excluding Srinagar, Gauhati and Jammu (Total 1971 Population. 0.78 million).
2 Excluding Dibrugarh, Jorhat, Nowgong, Tiusukia and Silchar (Total 1971 Population 0.32 million).
3 Excluding 22 towns, 9 in Assam, 3 in Jammu and Kashmir, 15 in Kerala and I in Punjab (Total 1971 population 0.Q3 million) ...
.. Excluding 56 towns, 24 in Assam, 3 in Jammu and Kashmir, IS in Kerala, 5 in Tamil Nadu, 3 in Karnataka, 3 in Maharashtra and I each in Haryana, Bihar and Andhra Pradesh.
5 Excluding 83 towns, 23 in Assam, 15 in Jammu and Kashmir, 7 in Kerala, 6 in Gujarat, 4 in Maharashtra, 3 in West Bengal, 6 in Tamil Nadu, 3 in Madhya Pradesh, 3 in Karnataka, 2 in Uttar Pradesh and 1 each in Andhra Pradesh, Orissa and Punjab and Haryana,
6 The Growth rates are calculated by comparing the total population of towns in each size class according to their classification in the 1971 Census as compared with the total population in the 1981 Census e.g., the growth rate of 3.62 per cent per year for Class I towns in 1971 refers to the growth between 1971 and 1981 of the 145 towns classified as Class I in 1971.
Source:-Government of India: Census ofIndia-General Population Tables 1971Series I, Part II New Delhi, 1975.
l Covernment of India : Census of India - Provisional Population Tables - Paper 2 of 1981, New Delhi, 1981.
The various towns excluded in. class III, IV and V were those that could not be traced in the 198 I Census. These missing towns are either declassified or amalgamated into larger units. These are listed in Appendix 1.1
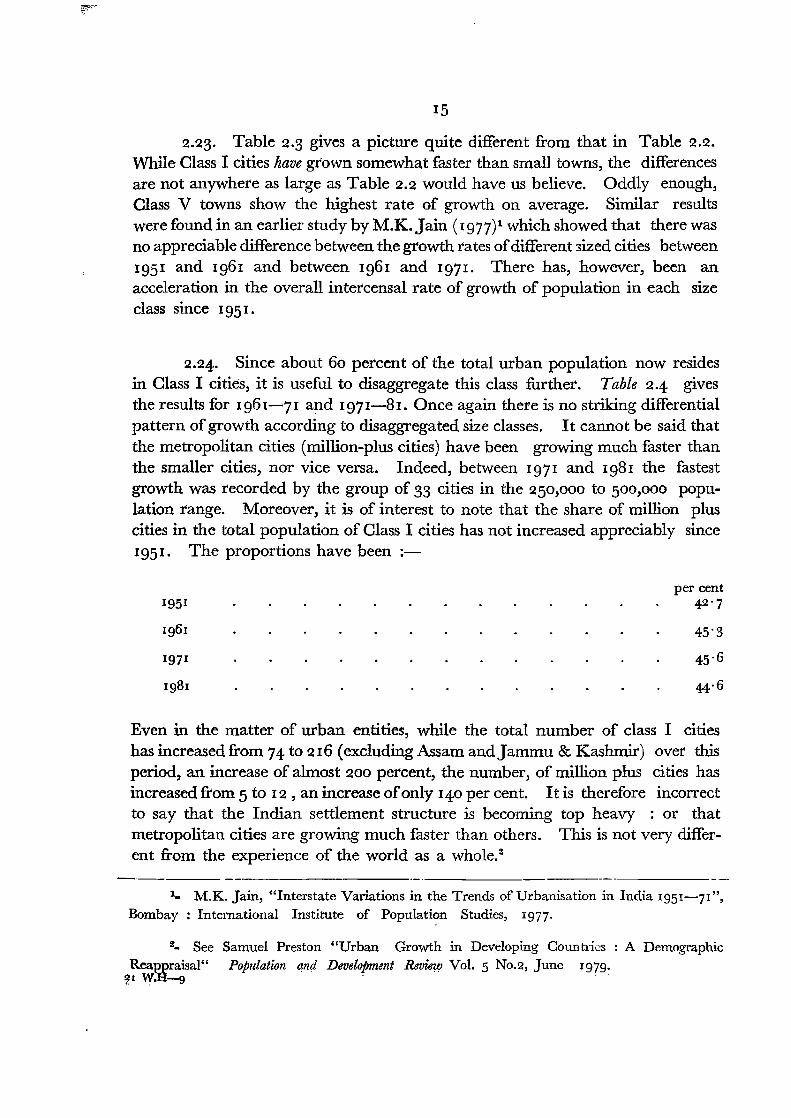
15
2.23. Table 2.3 gives a picture quite different from that in Table 2.2.
While Class I cities have grown somewhat faster than small towns, the differences are not anywhere as large as Table 2.2 would have us believe. Oddly enough, Class V towns show the highest rate of growth on average. Similar results were found in an earlier study by M.K. Jain (1977)1 which showed that there was no appreciable difference between the growth rates ofdifferent sized cities between 1951 and 1961 and between 1961 and 1971. There has, however, been an acceleration in the overall intercensal rate of growth of population in each size class since 195I •
2.24. Since about 60 percent of the total urban population now resides in Class I cities, it is useful to disaggregate this class further. Table 2.4 gives the results for 1961-71 and 1971-81. Once again there is no striking differential pattern of growth according to disaggregated size classes. It cannot be said that the metropolitan cities (million-plus cities) have been growing much faster than the smaller cities, nor vice versa. Indeed, between 197 I and 1981 the fastest growth was recorded by the group of 33 cities in the 250,000 to 500,000 population range. Moreover, it is of interest to note that the share of million plus cities in the total population of Class I cities has not increased appreciably since 1951. The proportions have been :
per cent 1951 42'7
1961 45"3
1971 45- 6
1981 44. 6
Even in the matter of urban entities, while the total number of class I cities has increased from 74 to 216 (excluding Assam and Jammu & Kashmir) over this period, an increase of almost 200 percent, the number, of million plus cities has increased from 5 to 12 , an increase ofonly 140 per cent. I t is therefore incorrect to say that the Indian settlement structure is becoming top heavy : or that metropolitan cities are growing much faster than others. This is not very different from the experience of the world as a whole."
_._--
1_ M.K. Jain, "Interstate Variations in the Trends of Urbanisation in India 1951-71", Bombay: International Institute of Population Studies, 1977.
2_ See Samuel Preston "Urban Growth in Developing Countries: A Demographic Reappraisal" Population and Development Review Vol. 5 No.2, June 1979: ~I W.H-g
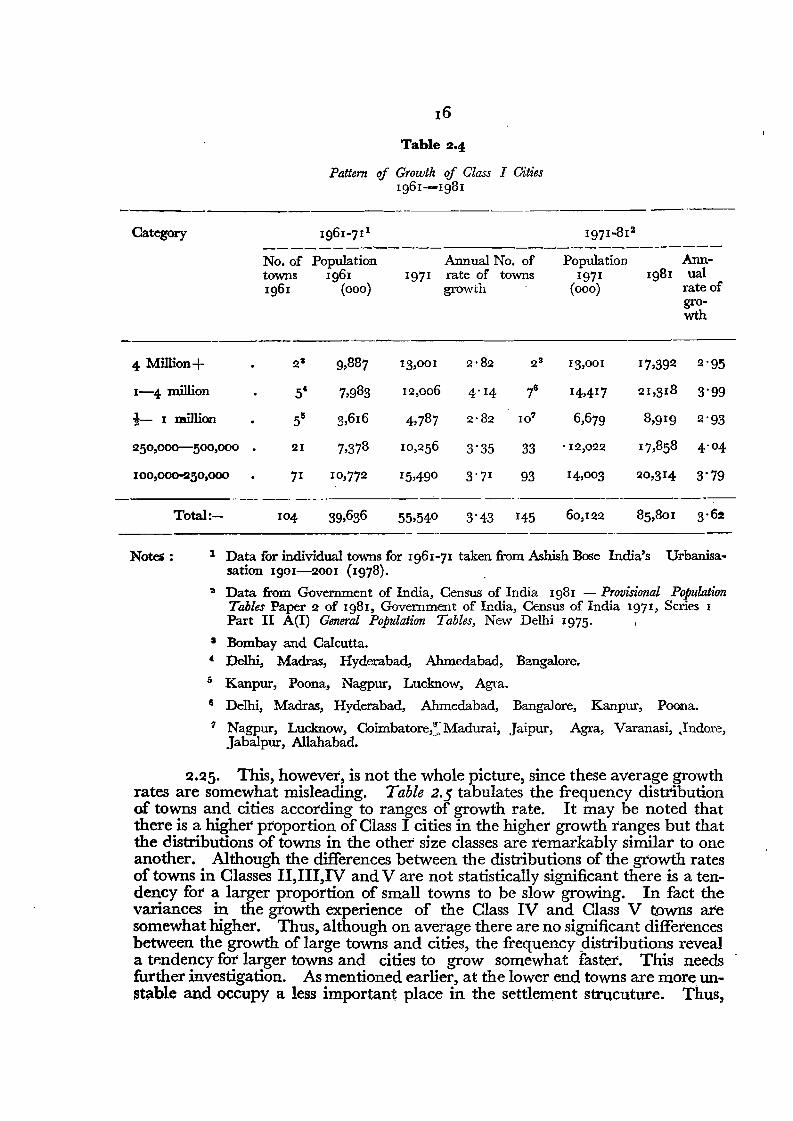
16
Table 2.4
Pattern of Growth of Class I Cities 1961--lg81
------_. ----- Category 1961-711 1971-812
-------_._------ ---------- No. of Population Annual No. of Population Ann-towns 1961 1971 rate of towns 1971 1981 ual 1961 (000) growth (000) rate of
growth
4 Million+ 23 9,887 13,001 2,82 23 13,001 17,392 2'95
1-4 million 5' 7,983 12,006 4'14 76 14,417 21,318 3'99
l- I million 55 3,616 4,787 2,82 107 6,679 8,9 19 2'93
250 ,000-300,000 . 21 7,378 10,256 3'35 33 . 12,022 17,858 4'04
100,000-:1150 ,000 71 10,772 15,490 3'71 93 14,003 !l0,314 3'79
Total:- 104 39,636 55,540 3'43 145 60,122 85,801 3. 62
Notes : 1 Data for individual towns for 1961-71 taken from Ashish Bose India's Urbanisasation 1901-2001 (1978).
111 Data from Government of India, Census of India 1981 - Provisional Population Tables Paper 2 of Ig81, Government of India, Census of India 1971, Series I Part II A(I) General Population Tables, New Delhi 1975.
I Bombay and Calcutta. , Delhi, Madras, Hyderabad, Ahmedabad, Bangalore.
5 Kanpur, Poona, Nagpur, Lucknow, Agra.
8 Delhi, Madras, Hyderabad, Ahmedabad, Bangalore, Kanpur, Poona.
'I Nagpur, Lucknow, Coimbatore,:;Madurai, Jaipur, Agra, Varanasi, .Indore, Jabalpur, Allahabad.
2.25. This, however, is not the whole picture, since these average growth rates are somewhat misleading. Table 2.5 tabulates the frequency distribution of towns and cities according to ranges of growth rate. It may be noted that there is a higher proportion of Class I cities in the higher growth ranges but that the distributions of towns in the other size classes are remarkably similar to one another. Although the differences between the distributions of the growth rates of towns in Classes II,III,IV and V are not statistically significant there is a tendency for a larger proportion of small towns to be slow growing. In fact the variances in the growth experience of the Class IV and Class V towns are somewhat higher. Thus, although on average there are no significant differences between the growth of large towns and cities, the frequency _distributions reveal a tendency for larger towns and cities to grow somewhat faster. This needs further investigation. As mentioned earlier, at the lower end towns are more unstable and occupy a less important place in the settlement strucuture. Thus,
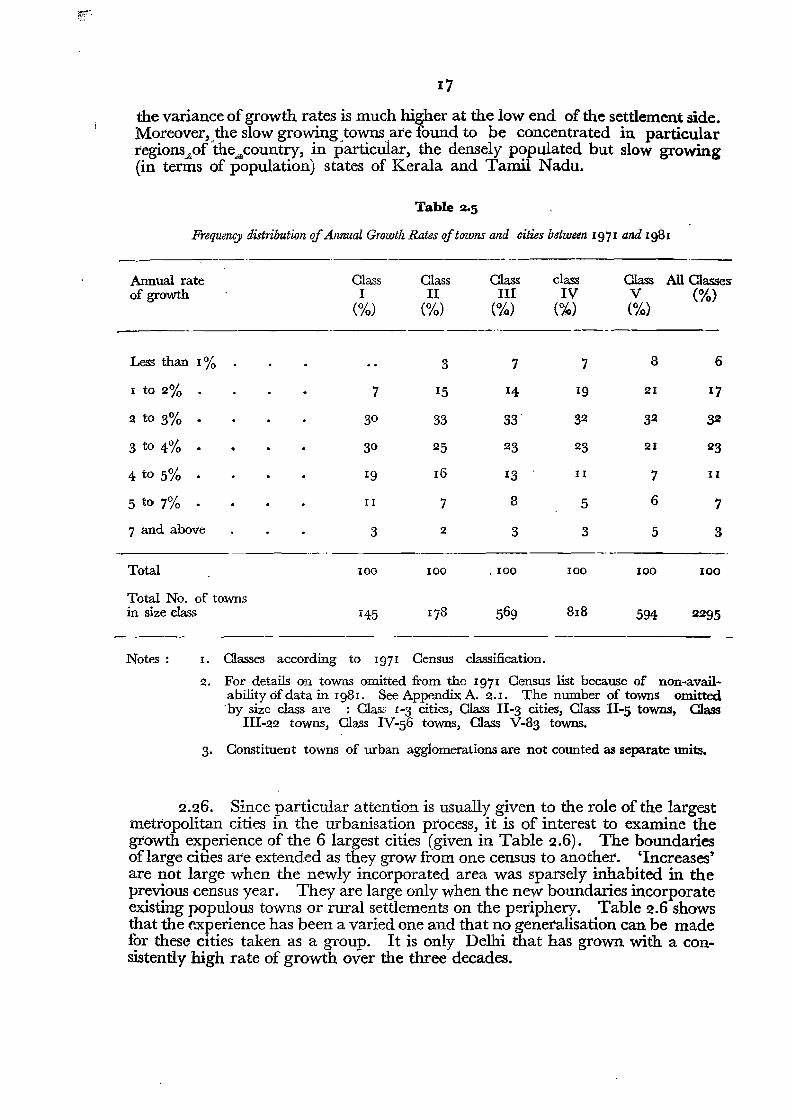
~;'.
17
the variance ofgrowth rates is much higher at the low end of the settlement side. Moreover.the slow growing"townsare found to be concentrated in particular regionsjofthejcountry, in particular, the densely populated but slow growing (in terms of population) states of Kerala and Tamil Nadu.
Table 2.5
Frequency distribution ofAnnualGrowth Ratesoftowns and cities between 1971 and Ig81
Annual rate Class Class Class class Class All Classes of growth I
(%) II
(%) III
(%) IV
(%) V (%)
(%)
--- ---_.
Less than 1% 3 7 7 8 6
I to 2% · 7 15 14 19 21 17
2 to 3% · 30 33 33 32 32 32
3 to 4% · 30 25 23 23 21 23
4 to 5% 19 16 13 II 7 II
5 to 7% · II 7 8 5 6 7
7 and above 3 2 3 3 5 3
Total 100 100 . 100 100 100 100
Total No. of towns in size class 145 178 569 818 594 !.il295
----
Notes : 1. Classes according to 1971 Census classification.
2. For details on towns omitted from the 1971 Census list because of non-availability of data in 1981. See Appendix A. 2.1. The number of towns omitted 'by size class are : Class 1-3 cities, Class 11-3 cities, Class II-5 towns, Class
III-22 towns, Class IV-56 towns, Class V-83 towns.
3. Constituent towns of urban agglomerations are not counted as separate units.
2.26. Since particular attention is usually given to the role of the largest metropolitan cities in the urbanisation process, it is of interest to examine the growth experience of the 6 largest cities (given in Table 2.6). The boundaries oflarge cities are extended as they grow from one census to another. 'Increases' are not large when the newly incorporated area was sparsely inhabited in the previous census year. They are large only when the new boundaries incorporate existing populous towns or rural settlements on the periphery. Table 2.6 shows that the experience has been a varied one and that no generalisation can be made for these cities taken as a group. It is only Delhi that has grown with a consistently high rate of growth over the three decades.
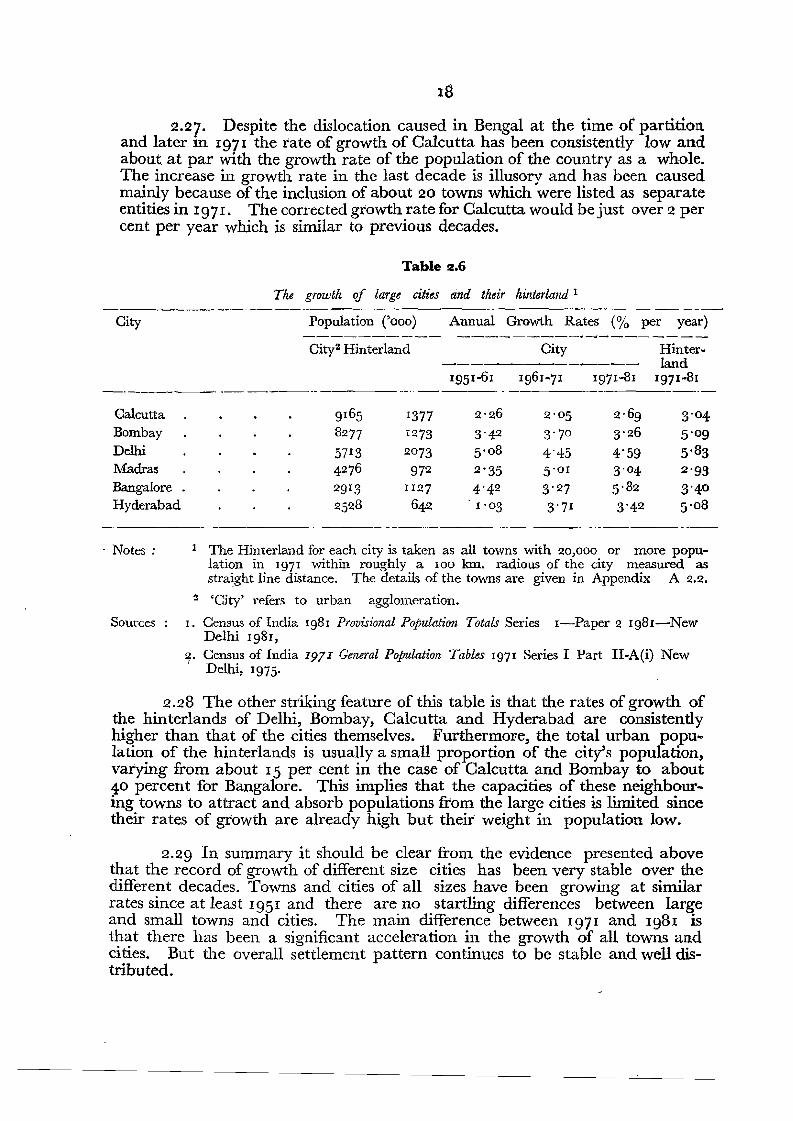
2.27. Despite the dislocation caused in Bengal at the time of partition and later in 1971 the rate of growth of Calcutta has been consistently low and about at par with the growth rate of the population of the country as a whole. The increase in growth rate in the last decade is illusory and has been caused mainly because of the inclusion of about 20 towns which were listed as separate entities in 1971. The corrected growth rate for Calcutta would be just over 2 per cent per year which is similar to previous decades.
Table 2.6
The growth oJ large cit£~s and their hinterland 1 _._------ -_._----_ .._--- ---_.....- ----_. - --
City Population ('000) Annual Growth Rates (% per year)
City2 Hinterland City Hinter---- land
1961-71 1971-81 1971-81 ---_ .._.. _--_..
Calcutta 9165 1377 2'26 2'°5 2,69 3'°4 Bombay 8277 1273 3'42 3'70 3'26 5'°9 Delhi 5713 2073 5'08 4'45 4'59 5. 83 Madras 427 6 972 2'35 5'01 3'04 2'93 Bangalore 2913 1127 4'42 3'27 5,82 3'40
Hyderabad 2528 642 1'03 3'71 3'42 5'°8 ---_. ---- --_..._--
.. Notes: 1 The Hinterland for each city is taken as all towns with 20,000 or more population in 1971 within roughly a 100 krn. radious of the city measured as straight line distance. The details of the towns are given in Appendix A 2.2.
2 'City' refers to urban agglomeration,
Sources I. Census of India Ig81 Provisional Population Totals Series I-Paper 2 Ig81-New Delhi 1981,
2. Census of India 1971 General Population Tables 1971 Series I Part II-A(i) New r Delhi, 1975.
2.28 The other striking feature of this table is that the rates of growth of the hinterlands of Delhi, Bombay, Calcutta and Hyderabad are consistently higher than that of the cities themselves. Furthermore, the total urban population of the hinterlands is usually a small proportion of the city's population, varying from about 15 per cent in the case of Calcutta and Bombay to about 40 percent for Bangalore. This implies that the capacities of these neighbouring towns to attract and absorb populations from the large cities is limited since their rates of growth are already high but their weight in population low.
2.29 In summary it should be clear from the evidence presented above that the record of growth of different size cities has been very stable over the different decades. Towns and cities of all sizes have been growing at similar rates since at least 1951 and there are no startling differences between large and small towns and cities. The main difference between 1971 and Ig81 is that there has been a significant acceleration in the growth of all towns and cities. But the overall settlement pattern continues to be stable and well distributed.
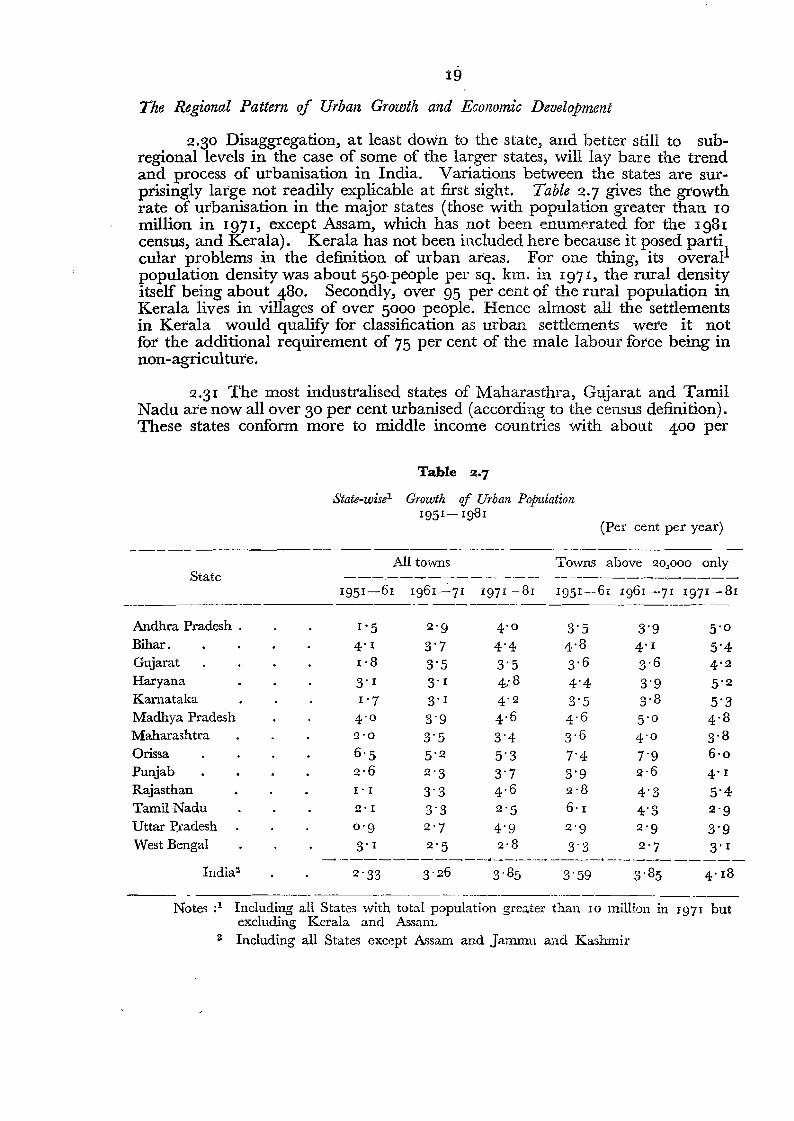
i9
The Regional Pattern of Urban Growth and Economic Development
2.30 Disaggregation, at least down to the state, and better still to subregional levels in the case of some of the larger states, will lay bare the trend and process of urbanisation in India. Variations between the states are surprisingly large not readily explicable at first sight. Table 2.7 gives the growth rate of urbanisation in the major states (those with population greater than 10 million in 197I, except Assam, which has not been enumerated for the 198 I
census, and Kerala), Kerala has not been included here because it posed parti cular problems in the definition of urban areas. For one thing, its overall population density was about 550-people per sq. km, in 1971, the rural density itself being about 480. Secondly, over 95 per cent of the rural population in Kerala lives in villages of over 5000 people. Hence almost all the settlements in Kerala would qualify for classification as urban settlements were it not for the additional requirement of 75 per cent of the male labour force being in non-agriculture.
2.31 The most industralised states of Maharasthra, Gujarat and Tamil Nadu are now all over 30 per cent urbanised (according to the census definition). These states conform more to middle income countries with about 400 per
Table 2·7
State-wise1 -Growth of Urban Population 1951- 1981
(P.er cent per year)
------ -_._-- --_. -------_. All towns Towns above 20,000 only
State ---.------_. -~- -----_._-~-:---..---
1951-61 1961'--::' 71 1971 -81 1951-61 1961-71 1971-81 ----._-------_.- ._-------
Andhra Pradesh 1·5 2'9 4'0 3'5 3'9 5'0 Bihar. 4' 1 3'7 4'4 4,8 4' 1 5'4 Gujarat 1,8 3'5 3'5 3,6 3,6 4'2 Haryana 3' I 3' I 4: 8 4'4 3'9 5'2 Karnataka r- 7 3' I 4'2 3'5 3,8 5'3 Madhya Pradesh 4'0 3'9 4,6 4,6 5'0 4,3 Maharashtra 2'0 3'5 3'4 3,6 4'0 3,8 Orissa 6'5 5'2 5'3 7'4 7'9 6'0 Punjab 2,6 2'3 3'7 3'9 2,6 4' I Rajasthan r- I 3'3 4,6 ~'3 4'3 5'4 Tamil Nadu 2' 1 3'3 2'5 6, I 4'3 2'9 Uttar Pradesh 0'9 2'7 4'9 2'9 2'9 3'9 West Bengal 3' I ~·5 ~'8 3'3 2'7 3' I
India- 2'33 3'26 3,85 3'59 3,85 4' 13 ------_.._---------------.-- -. - _._--._----- ----.. -_._-
Notes c! Including all States with total population greater than 10 million in 1971 but excluding Kerala and Assam,
2 Including all States except Assam and Jammu and Kashmir
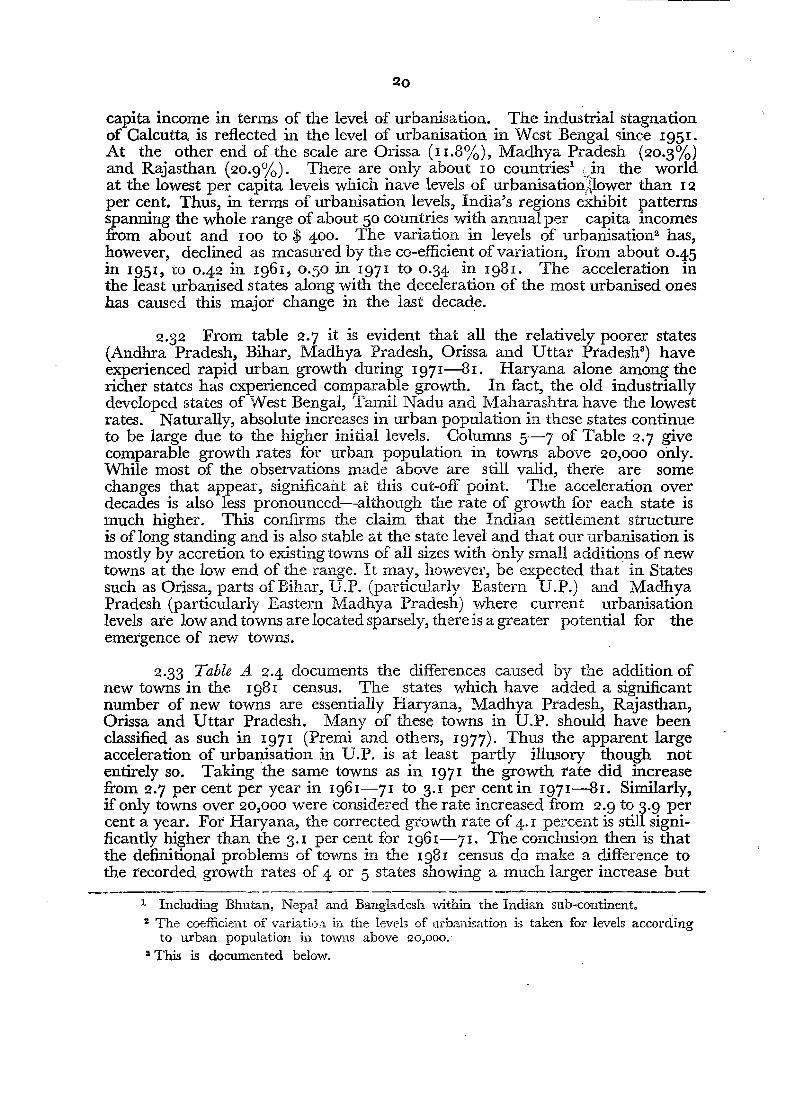
20
capita income in terms of the level of urbanisation. The industrial stagnation of Calcutta is reflected in the level of urbanisation in West Bengal since 1951. At the other end of the scale are Orissa (II.8%), Madhya Pradesh (20.3%) and Rajasthan (20.9%). There are only about IO countriesv jin the world at the lowest per capita levels which nave levels of urbanisation'[lower than 12 per cent. Thus, in terms of urbanisation levels, India's regions exhibit patterns spanning the whole range of about 50 countries with annual per capita incomes from about and 100 to $ 400. The variation in levels of urbanisation- has, however, declined as measured by the co-efficient ofvariation, from about 0.45 in 1951, to 0.42 in 1961, 0.50 in 1971 to 0.34 in 1981. The acceleration in the least urbanised states along with the deceleration of the most urbanised ones has caused this major change in the last decade,
2.32 From table 2.7 it is evident that all the relatively poorer states (Anclhra Pradesh, Bihar, Madhya Pradesh, Orissa and Uttar Pradesh") have experienced rapid urban growth during 1971-81. Haryana alone among the richer states has experienced comparable growth. In fact, the old industrially developed states of West Bengal, Tamil Nadu and Maharashtra have the lowest rates. Naturally, absolute increases in urban population in these states continue to be large due to the higher initial levels. Columns 5-7 of Table 2.7 give comparable growth rates for urban population in towns above 20,000 only. While most of the observations made above are still valid, there are some changes that appear, significant at this cut-off point. The acceleration over decades is also less pronounced-although the rate of growth for each state is much higher. TIns confirms the claim that the Indian settlement structure is of long standing and is also stable at the state level and that our urbanisation is mostly by accretion to existing towns of all sizes with only small additions of new towns at the low end of the range. It may, however, be expected that in States such as Orissa, parts of Bihar, D.P. (particularly Eastern D.P.) and Madhya Pradesh (particularly Eastern Madhya Pradesh) where current urbanisation levels are low and towns are located sparsely, there is a greater potential for the emergence of new towns.
2.33 Table A 2.4 documents the differences caused by the addition of new towns in the 1981 census. The states which have added a significant number of new towns are essentially Haryana, Madhya Pradesh, Rajasthan, Orissa and Uttar Pradesh. Many of these towns in U.P. should have been classified as such in 1971 (Premi and others, 1977). Thus the apparent large acceleration of urbanisation in D.P. is at least partly illusory though not entirely so. Taking the same towns as in 1971 the growth rate did increase from 2.7 per cent per year in 1961-71 to 3.1 per cent in 1971-81. Similarly, if only towns over 20,000 were considered the rate increased from 2.9 to 3.9 per cent a year. For Haryana, the corrected growth rate of 4. I percent is still significantly higher than the 3.1 per cent for 1961-71. The conclusion then is that the definitional problems of towns in the Ig81 census do make a difference to the recorded growth rates of 4 or 5 states showing a much larger increase but
_..-.
1 Including Bhutan, Nepal and Bangladesh within the Indian sub-continent. % The coefficient of variation in the levels of urbanisation is taken for levels according
to urban population in towns above 20,000.
3 This is documented below.
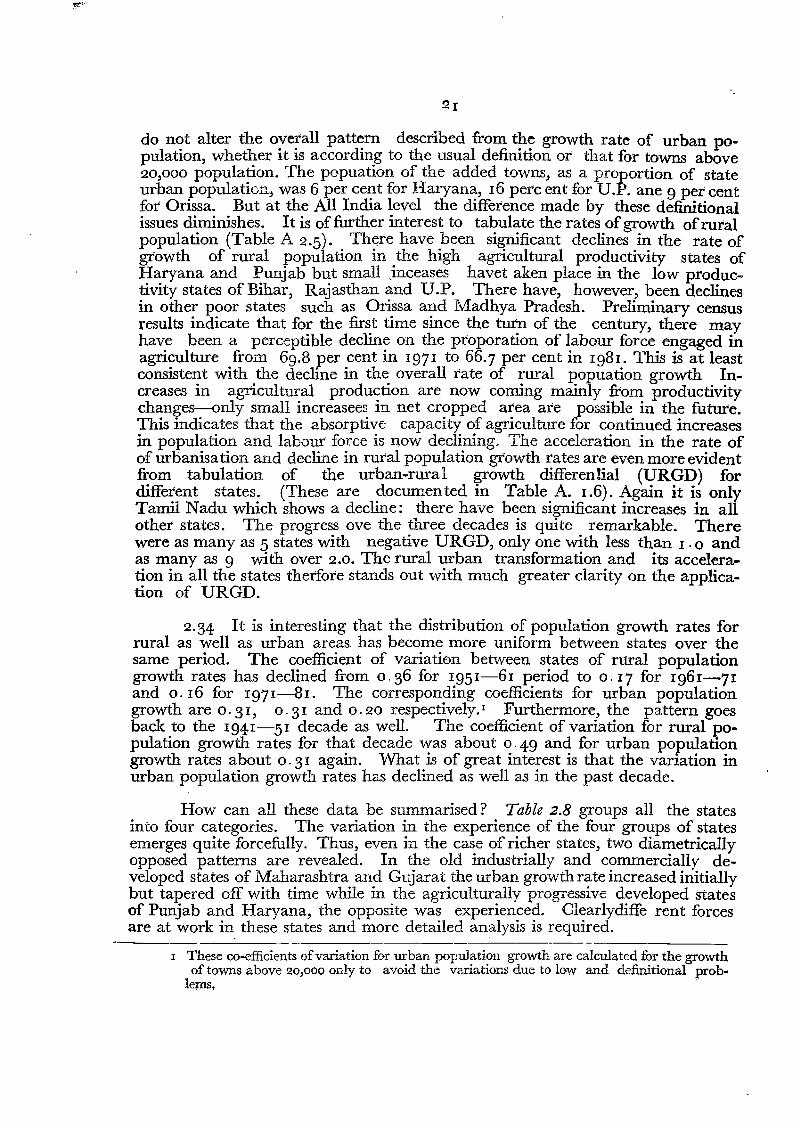
F
21
do n<?t alter the oye:a11 patt~rn described from t!I~ growth rate of urban population, wheth.er It IS according to the usual definition or that for towns above 20,000 population. The popuation of the added towns, as a proportion of state urban population, was 6 per cent for Haryana, 16 perc ent for D.P. ane 9 per cent for Orissa. But at the All India level the difference made by these definitional issues diminishes. It is offurther interest to tabulate the rates of growth ofrural population (Table A 2.5). There have been significant declines in the rate of growth of rural population in the high agricultural productivity states of Haryana and Punjab but small jnceases havet aken place in the low productivity states of Bihar, Rajasthan and U.P. There have, however, been declines in other poor states such as Orissa and Madhya Pradesh. Preliminary census results indicate that for the first time since the turn of the century, there may have been a perceptible decline on the proporation of labour force engaged in agriculture from 69.8 per cent in 1971 to 66.7 per cent in 1981. This is at least consistent with the decline in the overall rate of rural popuation growth Increases in agricultural production are now coming mainly from productivity changes-only small increasees in net cropped area are possible in the future. This indicates that the absorptive capacity of agriculture for continued increases in population and labour force is now declining. The acceleration in the rate of of urbanisa tion and decline in rural population growth rates are even more evident from tabulation of the urban-rural growth differen!ial (URGD) for different states. (These are documented in Table A. 1.6). Again it is only Tamil Nadu which shows a decline: there have been significant increases in all other states. The progress ove the three decades is quite remarkable. There were as many as 5 states with negative URGD, only one with less than 1.0 and as many as 9 'with over 2.0. The rural urban transformation and its acceleration in all the states therfore stands out with much greater clarity on the application of URGD.
2.34 It is interesting that the distribution of population growth rates for rural as well as urban areas. has become more uniform between states over the same period. The coefficient of variation between states of rural population growth rates has declined from 0.36 for 1951-61 period to 0.17 for 1961-71 and 0.16 for 1971-81. The corresponding coefficients for urban population growth are 0'31, 0.31 and 0.20 respectively. I Furthermore, the pattern goes back to the 1941-51 decade as well. The coefficient of variation for rural population growth rates for that decade was about 0.49 and for urban population growth rates about o. 31 again. VVhat is of great interest is that the variation in urban population growth rates has declined as well as in the past decade.
How can all these data be summarised? Table 2.8 groups all the states into four categories. The variation in the experience of the four groups of states emerges quite forcefully. Thus, even in the case of richer states, two diametrically opposed patterns are revealed. In the old industrially and commercially developed states of Maharashtra and Gujarat the urban growth rate increased initially but tapered off with time while in the agriculturally progressive developed states of Punjab and Haryana, the opposite was experienced. Clearlydiffe rent forces are at work in. these states and more detailed analysis is required.
I These co-efficients ofvariation for urban population growth are calculated for the growth of towns above 20,000 only to avoid the variations due to low and definitional prob
lems, .
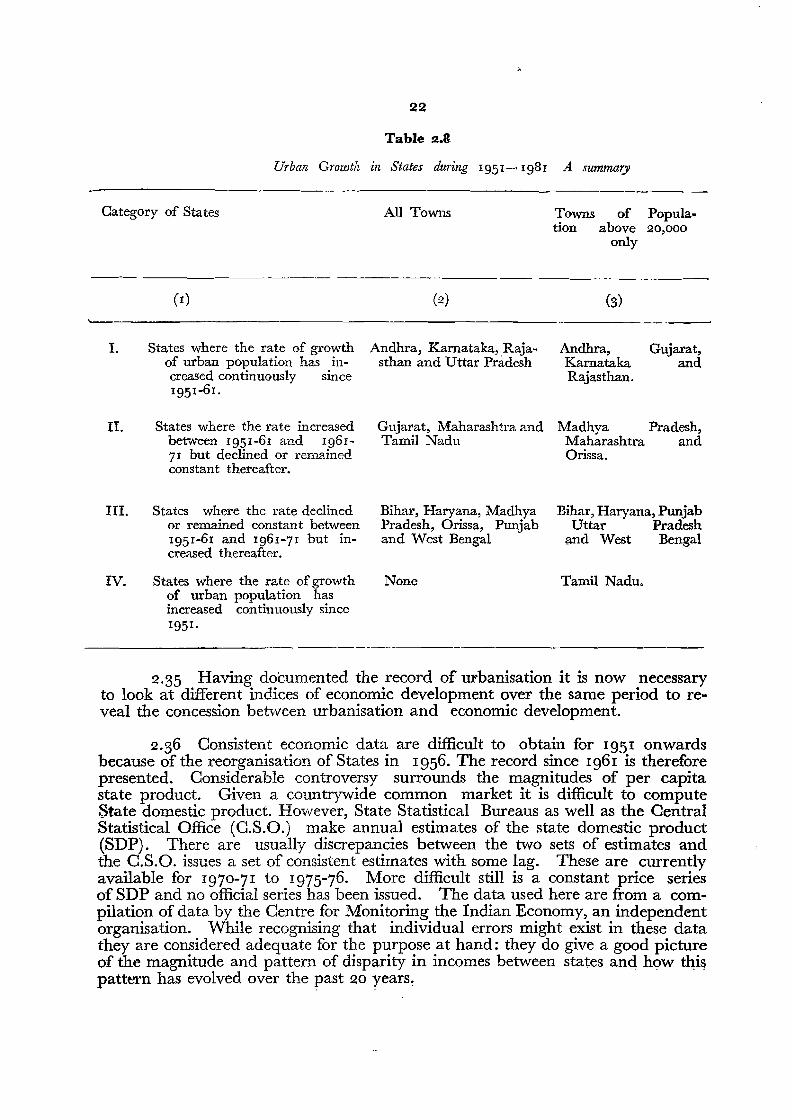
Urban Growth
22
Table 2.8
in States during 1951--' 1981 A summary
Category of States
--
(I)
._----
All Towns
---_._--
(2)
Towns of Population above 20,000
only
---- ---------
(3)
1. States where the rate of growth of urban population has in-
Andhra, Karnataka, Rajasthan and Uttar Pradesh
Andhra, Karnataka
Gujarat, and
creased continuously 1951-61.
since Rajasthan.
II. States where the rate increased Gujarat, Maharashtra and Madhya Pradesh, between 1951-61 and 1961 Tamil Nadu Maharashtra and 71 but declined or remained Orissa. constant thereafter.
III. States where the rate declined or remained constant between 1951-61 and 1961-71 but increased thereafter.
Bihar, Haryana, Madhya Pradesh, Orissa, Punjab and West Bengal
Bihar, Haryana, Punjab Uttar Pradesh
and West Bengal
IV. States where the rate of growth of urban population has increased continuously since 1951.
None Tamil Nadu,
2.35 Having documented the record of urbanisation it is now necessary to look at different indices of economic development over the same period to reveal the concession between urbanisation and economic development.
2.36 Consistent economic data are difficult to obtain for 1951 onwards because of the reorganisation of States in 1956. The record since 1961 is therefore presented. Considerable controversy surrounds the magnitudes of per capita state product. Given a countrywide common market it is difficult to compute State domestic product. However, State Statistical Bureaus as well as the Central Statistical Office (C.S.O.) make annual estimates of the state domestic product (SDP) . There are usually discrepancies between the two sets of estimates and the C.S.O. issues a set of consistent estimates with some lag. These are currently available for 1970-71 to 1975-76. More difficult still is a constant price series of SDP and no official series has been issued. The data used here are from a compilation of data by the Centre for Monitoring the Indian Economy, an independent organisation. While recognising that individual errors might exist in these data they are considered adequate for the purpose at hand: they do give a good picture of the magnitude and pattern of disparity in incomes between states and how this pattern has evolved over the past 20 years.
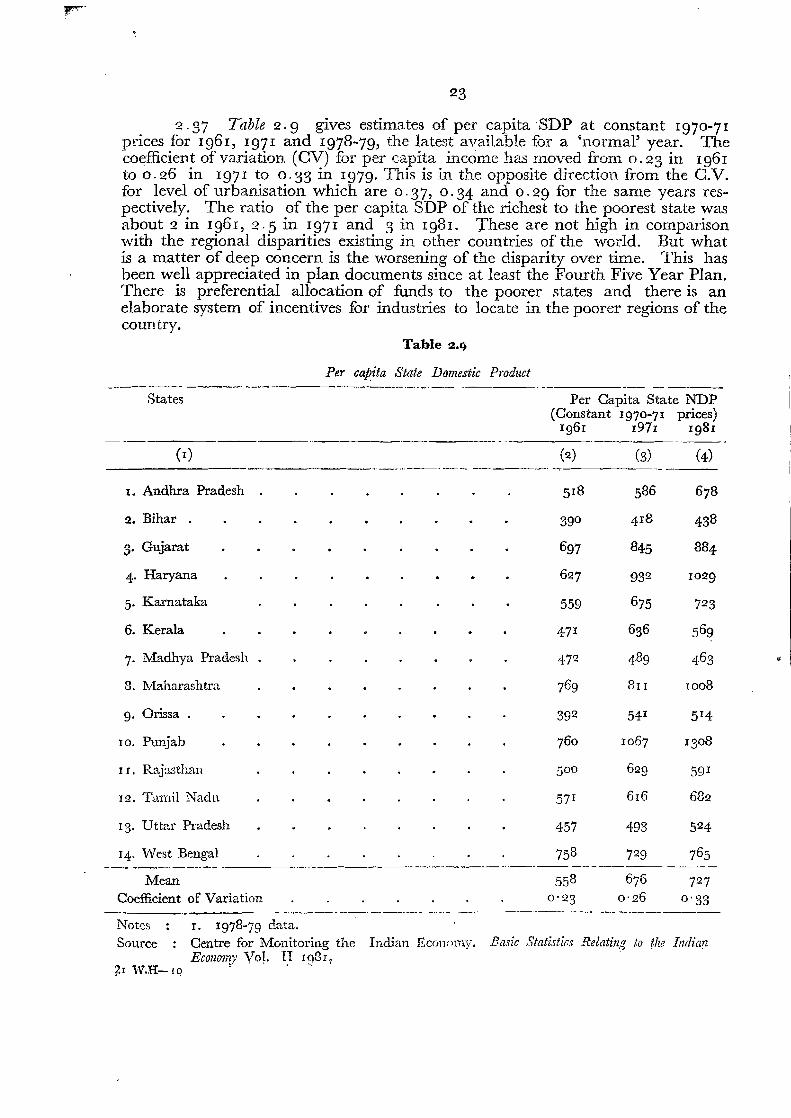
F
23
2·37 Table 2·9 gives estimates of per capita SDP at constant 1970-71 prices for 1961, 1971 and 1978-79, the latest available for a 'normal' year. The coefficient of variation (OV) for per capita income has moved from 0,23 in Ig61 to 0.26 in 1971 to 0, 33 in Ig79. This is in the opposite direction from the C.V. for level of urbanisation which are o. 37, o. 34 and 0, 29 for the same years respectively. The ratio of the per capita SDP of the richest to the poorest state was about 2 in 1961, 2·5 in 1971 and 3 in Ig8!. These are not high in comparison with the regional disparities existing in other countries of the world. But what is a matter of deep concern is the worsening of the disparity over time. This has been well appreciated in plan documents since at least the Fourth Five Year Plan. There is preferential allocation of funds to the poorer states and there is an elaborate system of incentives for industries to locate in the poorer regions of the country.
Table 2.9
Per capita State Domestic Product -_._--_.- ---- _.._-_......_-._ .._.._- . ..-- -
States Per Capita State NDP (Constant 197°-71 prices)
Ig61 1971 1981 --' -- .
(I) (2) (3) (4) __ H'_~' __"' __ ._. -..,.._-----._-
I. Andhra Pradesh 518 586 678
2. Bihar . 418 39° 438
3. Gujarat 697 845 884
4. Haryana 627 932 1029
5. Karnataka 559 675 723
6. Kerala 471 636 569
~7. Madhya Pradesh 472 489 4.63
8. Maharashtra 769 81 I 1008
9. Orissa. 392 541 514
10. Punjab 760 1067 13°8
I r . Rajasthan 5°0 629 591
12. Tamil Nadu 57r 6r6 682
13. Uttar Pradesh 457 493 524
14. 'Nest Bengal 758 729 765 --'- -------_.-.- .----
Mean 558 676 727
Coefficient of Variation -----_.._------ _.._-_..-- -., ...
Notes : I. 1978-79 data. ------ - ..•
0'23 - .._..-.__._-----0'26 0'33
Source :
~I W.H:-Iq
Centre for Monitoring the Economy Vol. IT IQ8r.
" - .'
Indian Economy. Basic Statistics Relating to the Indian .
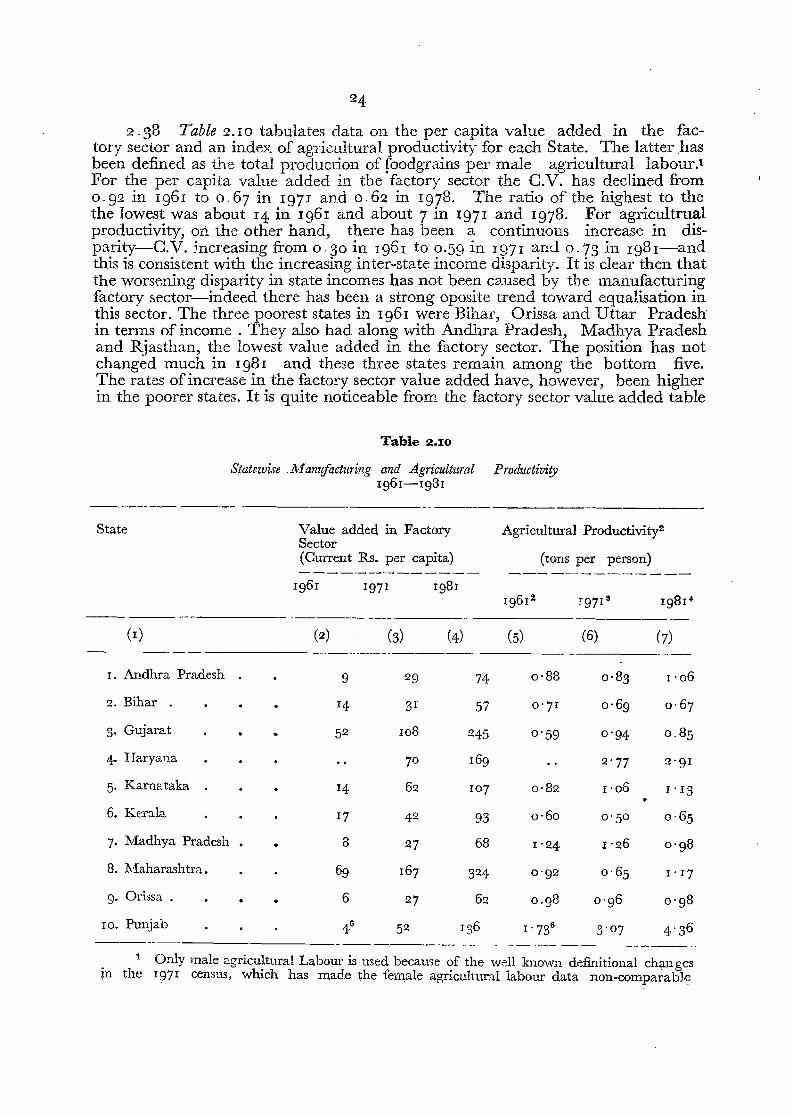
24
2038 Table 2.10 tabulates data 011 the per capita value added in the factory sector and an index of agricultural productivity for each State. The latter has been defined as the total production of foodgrains per male agricultural labour.t For the per capita value added in the factory sector the C.V. has declined from 0092 in 196 I to o .67 in 1971 and 0062 in 1978. The ratio of the highest to the the lowest was about 14 in 1961 and about 7 in 1971 and 1978. For agricultrual productivity, on the other hand, there has been a continuous increase in disparity-s-C.V. increasing from 0 -30 in 196 I to 0.59 in r 97 I and 0·73 in 198I-and this is consistent with the increasing inter-state income disparity. It is clear then that the worsening disparity in state incomes has not been caused by the manufacturing factory sector-s-indeed there has been a strong oposite trend toward equalisation in this sector. The three poorest states in 196 I were Bihar, Orissa and Uttar Pradesh in terms of income . They also had along with Andhra Pradesh, Madhya Pradesh and Rjasthan, the lowest value added in the factory sector. The position has not changed much in 198 I and these three states remain among the bottom five. The rates of increase in the factory sector value added have, however, been higher in the poorer states. It is quite noticeable from the factory sector value added table
Table ~MO
Statezoise .M.anzifacturing and Agricultural 1961-r981
Productioity
__ 0. . _
State Value added in Factory Sector (Current Rs. per capita)
Agricultural Productivity'[
(tons per person)
1961 1971 1981 19612 1971 3 19814
(I)
I. Andhra Pradesh
2. Bihar .
3. Gujarat
4. Haryana
5. Karnataka
6. Kerala
7. Madhya Pradesh
8. Maharashtra ,
g. Orissa.
•
_.._-_..._~ ..._- .-------- (2)
9
14
52
14
17
8
69
6
(3)
29
31
108
7°
62
42
27
167
27
(4)
74
57
245
169
1°7
93
68
324
62
(5)
0·88
0'7 1
0-59
0·82
0-60
1'24
0'92
0,98
(6)
0·83
0·69
0'94
2'77
1'06
0-50
1-26
0- 65
0-96
(7)
1'06
0- 67
0.85
2'91
1-13
0·65
0-98
r -17
0-9 8
10. Punjab 46 52 136 1-736 3-07 4-36 ----- .. -- ------_._.-_.... _~
1 Only male agricultural Labour is used became of the well known definitional changes m the 197r census, which has made the female agricultural labour data non-comparable
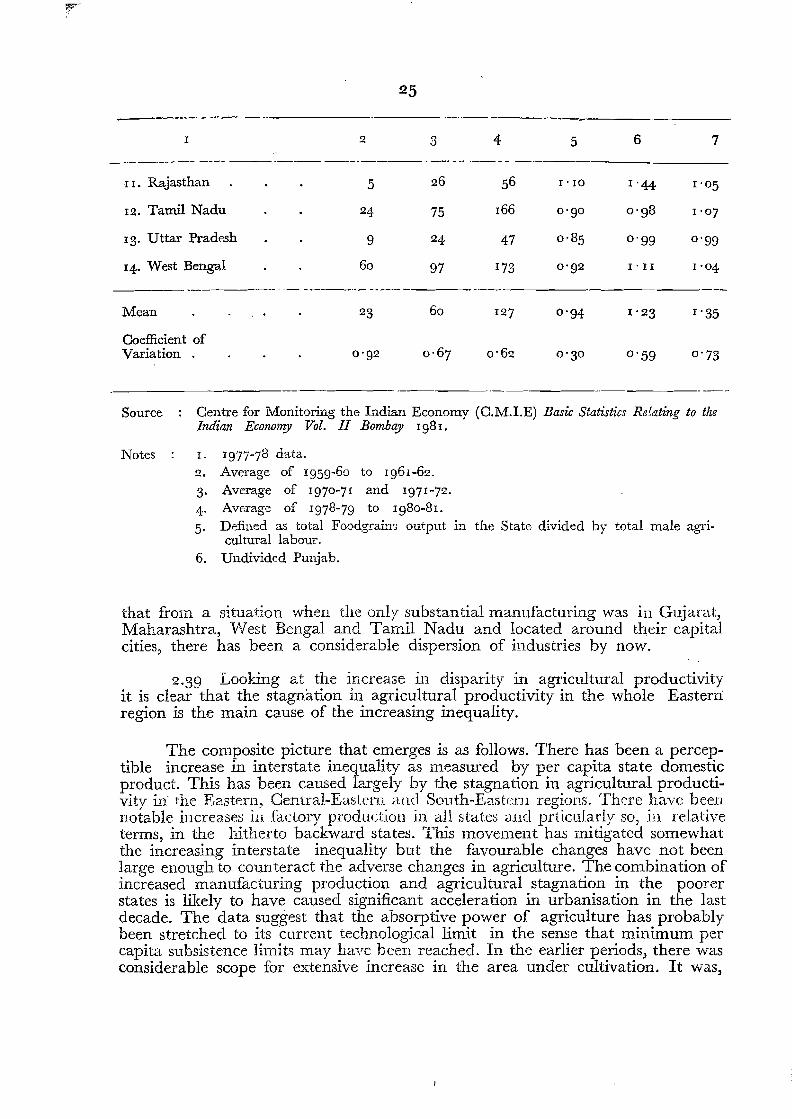
~--
25 ------------ --------- .__._-----_._---_._~-_._-~--
1 2 3 4 5 6 7
--_.._--- ---- -- -- ----_.--_ .•_- .. -- .._-- .. _._ -I I. Rajasthan 5 26 56 1'10 1'44 1'05
12. Tamil Nadu 24 75 166 0'90 0'g8 1'07
13. Uttar Pradesh 9 24 47 0·85 0'99 0'99
14. West Bengal 60 97 173 0'92 I'll 1'04
.-------_._--
Mean 23 60 127 0'94 1'23 1'35
Coefficient of Variation . 0'92 0·67 0'62 0'30 0'59 0'73
_.--------
Source Centre for Monitoring the Indian Economy (C.M.I.E) Basic Statistics Re!ating to the Indian Economy Vol. II Bombay 1981.
Notes I. 1977-78 data. 2. Average of 1959-60 to 1961-62, 3. Average of 1970-71 and 1971-72. 4. Average of 1978-79 to Ig80-81. 5. Defined as total Foodgrains output in the State divided by total male agri
cultural labour. 6. Undivided Punjab.
that from a situation when the only substantial manufacturing was in Gujarat, Maharashtra, West Bengal and Tamil Nadu and located around their capital cities, there has been a considerable dispersion of industries by now.
2.39 Looking at the increase in disparity in agricultural productivity It is clear that the stagnation ill agricultural productivity in the whole Easterri region is the main cause of the increasing inequality.
The composite picture that emerges is as follows. There has been a perceptible increase in interstate inequality as measured by per capita state domestic product. This has been caused largely by the stagnation in agricultural producti vity in the Eastern, Central-Eastern and South-Eastern regions. There have been notable increases ill factory production in all states and prticularly so, in relative terms, in the hitherto backward states. This movement has mitigated somewhat the increasing interstate inequality but the favourable changes have not been large enough to counteract the adverse changes in agriculture. The combination of increased manufacturing production and agricultural stagnation in the poorer states is likely to have caused significant acceleration in urbanisation in the last decade. The data suggest that the absorptive power of agriculture has probably been stretched to its current technological limit in the sense that minimum per capita subsistence limits may have been reached. In the earlier periods, there was considerable scope for extensive increase in the area under cultivation. It was,
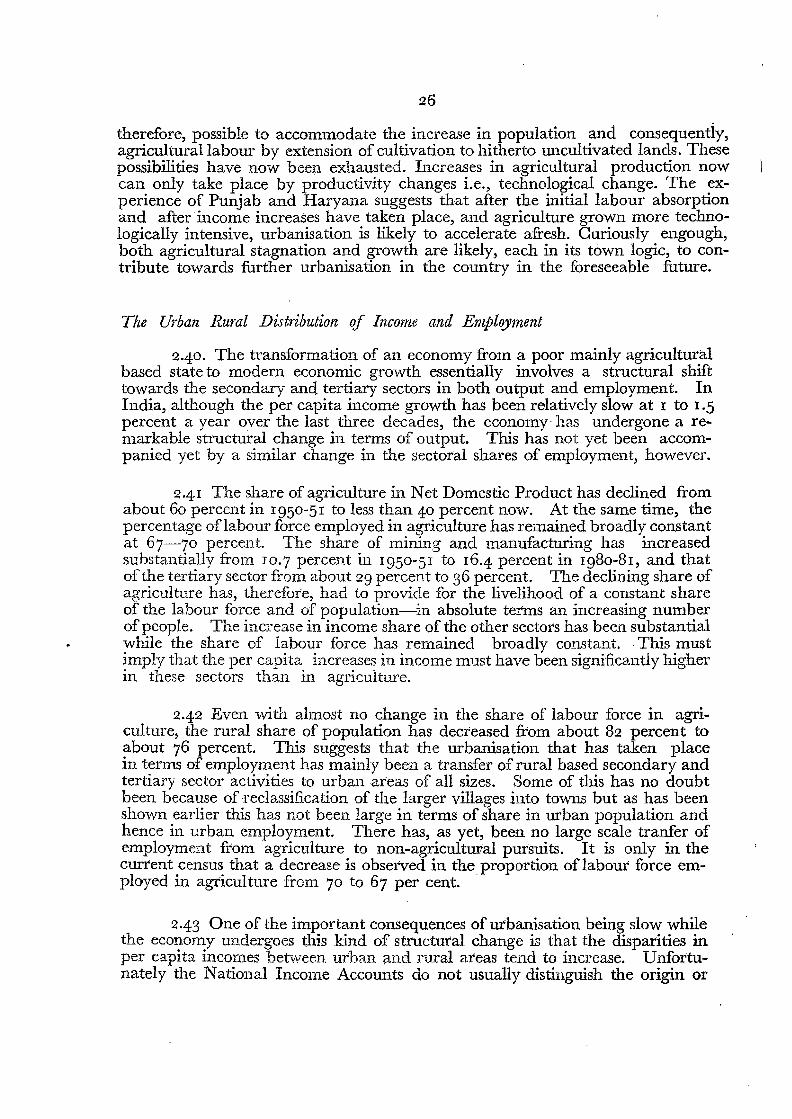
26
therefore, possible to accommodate the increase in population and consequently, agricultural labour by extension of cultivation to hitherto uncultivated lands. These possibilities have now been exhausted. Increases in agricultural production now can only take place by productivity changes i.e., technological change. The experience of Punjab and Haryana suggests that after the initial labour absorption and after income increases have taken place, and agriculture grown more technologically intensive, urbanisation is likely to accelerate afresh. Curiously engough, both agricultural stagnation and growth are likely, each in its town logic, to contribute towards further urbanisation in the country in the foreseeable future.
The Urban Rural Distribution qf Income and Employment
2-{0. The transformation of an economy from a poor mainly agricultural based state to modern economic growth essentially involves a structural shift towards the secondary and tertiary sectors in both output and employment. In India, although the per capita income growth has been relatively slow at 1 to 1.5
percent a year over the last three decades, the economy has undergone a remarkable structural change in terms of output. This has not yet been accompanied yet by a similar change in the sectoral shares of employment, however.
2.4 I The share of agriculture in Net Domestic Product has declined from about 60 percent in 1950-51 to less than 40 percent now. At the same time, the percentage oflabour force employed in agriculture has remained broadly constant at 67-70 percent. The share of mining and manufacturing has increased substantially from 10.7 percent in r950-51 to r6-{ percent in 1980-8r, and that of the tertiary sector from about 29 percent to 36 percent. The declining share of agriculture has, therefore, had to provide for the livelihood of a constant share of the labour force and of population-in absolute terms an increasing number ofpeople. The increase in income share of the other sectors has been substantial while the share of labour force has remained broadly constant. .This must imply that the per capita increases in income must have been significantly higher in these sectors than in agriculture.
2.42 Even with almost no change in the share of labour force in agriculture, the rural share of population has decreased from about 82 percent to about 76 percent. This suggests that the urbanisation that has taken place in terms of employment has mainly been a transfer of rural based secondary and tertiary sector activities to urban areas of all sizes. Some of this has no doubt been because of reclassification of the larger villages into towns but as has been shown earlier this has not been large in terms of share in urban population and hence in urban employment. There has, as yet, been no large scale tranfer of employment from agriculture to non-agricultural pursuits. It is only in the current census that a decrease is observed in the proportion of labour force employed in agriculture from 70 to 67 per cent.
2·43 One of the important consequences of urbanisation being slow while the economy undergoes this kind of structural change is that the disparities in per capita incomes bet-ween urban and rural areas tend to increase. Unfortunate1 y the National Income Accounts do not usually distinguish the origin or
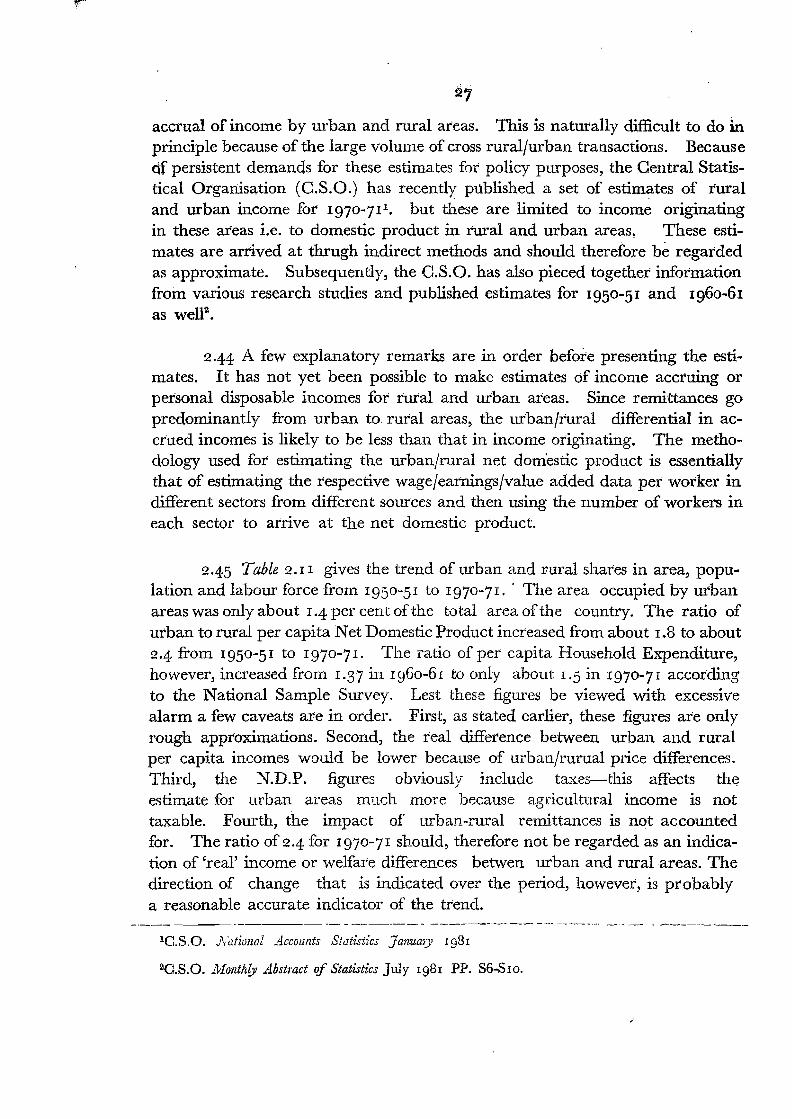
r
2; accrual of income by urban and rural areas. This is naturally difficult to do in. principle because of the large volume of cross rural/urban transactions. Because df persistent demands for these estimates for policy purposes, the Central Statistical Organisation (C.S.O.) has recently published a set of estimates of rural and urban income for 1970-711. but these are limited to income originating in these areas i.e. to domestic product in rural and urban areas. These estimates are arrived at thrugh indirect methods and should therefore be regarded as approximate. Subsequently, the C.S.O. has also pieced together information from various research studies and published estimates for 1950-51 and 1960-61 as well",
2.44 A few explanatory remarks are in order before presenting the estimates. It has not yet been possible to make estimates of income accruing or personal disposable incomes for rural and urban areas. Since remittances go predominantly from urban to rural areas, the urban/rural differential in accrued incomes is likely to be less than that in income originating. The methodology used for estimating the urban/rural net domestic product is essentially that of estimating the respective wage/earnings/value added data per worker in different sectors from different sources and then using the number of workers in each sector to arrive at the net domestic product.
2.45 Table 2.I! gives the trend of urban and rural shares in area, population and labour force from 1950-51 to 1970-71. . The area occupied by urban areas was only about 1.4 per cent of the total area ofthe country. The ratio of urban to rural per capita Net Domestic Product increased from about 1.8 to about 2.4 from 1950-51 to 1970-71. The ratio of pet capita Household Expenditure, however, increased from 1.37 in 1960-61 to only about I,5 in 1970-71 according to the National Sample Survey, Lest these figures be viewed with excessive alarm a few caveats are in order. First, as stated earlier, these figures are only rough approximations. Second, the real difference between urban and rural per capita incomes would be lower because of urbau/rurual price differences. Third, the N.D.P. figures obviously include taxes-this affects the estimate for urban areas much more because agricultural income is not taxable. Fourth, the impact of urban-rural remittances is not accounted for. The ratio of 2.4 for 1970-71 should, therefore not be regarded as an indication of 'real' income or welfare differences betwen urban and rural areas. The direction of change that is indicated over the period, however, is probably a reasonable accurate indicator of the trend.
--------------- ----------- ------------ --- -----_.._- --... -- - ---------10.S.0. National Accounts Statistics JanuaiY 1981
20.8.0. l\llont1z/y Abstract of Statistics July 1981 PP. 86-3ro.
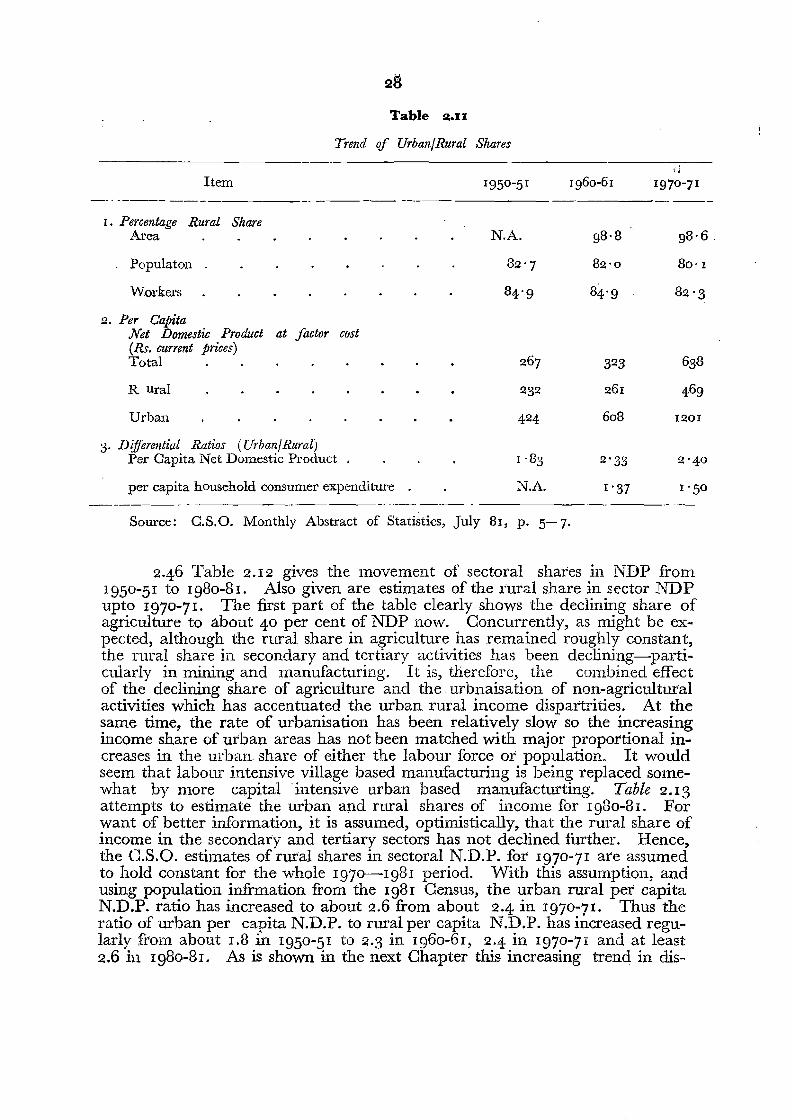
28
Table 2.11
Trend of Urban/Rural Shares
d Item 1950-5 1 1960-61 1970-71
. ------- ------------ ..-- 1. Percentage Rural Share
Area N.A. 98. 8 98- 6.
Populaton 82-7 82'0 80- 1
Workers 84'9 84'9 82'3
2. Per Capita Net Domestic Product at factor cost (Rs. current prices) Total 267 323 638
Rural 232 261 469
Urban 424 608 1201
3. Differential Ratios iUrbanl Rural) Per Capita Net Domestic Product , 1-83 2'33 2'40
per capita household consumer expenditure N.A. 1'37 1'50 ----_ ...._- --_. - --- .--
Source: C.S.O. Monthly Abstract of Statistics, July 81, p. 5-7.
2.46 Table 2.12 gives the movement of sectoral shares in NDP from 1950-51 to 1980-81. Also given are estimates of the rural share in sector NDP upto 1970-71. The first part of the table clearly shows the declining share of agriculture to about 40 per cent of NDP now. Concurrently, as might be expected, although the rural share in agriculture has remained roughly constant, the rural share in secondary and tertiary activities has been declining-parti cularly in mining and manufacturing. It is, therefore, the combined effect of the declining share of agriculture and the. urbnaisation of non-agricultural activities which has accentuated the urban rural income dispartrities. At the same time, the rate of urbanisation has been relatively slow so the increasing income share of urban areas has not been matched with major proportional increases in the urban share of either the labour force 01' population. It would seem that labour intensive village based manufacturing is being replaced somewhat by more capital "intensive urban based manufacturting. Table 2.13 attempts to estimate the urban and rural shares of income for 1980-81. For want of better information, it is assumed, optimistically, that the rural share of income in the secondary and tertiary sectors has not declined further. Hence, the C.S.O. estimates of rural shares in sectoral N.D.P. for 1970-71 are assumed to hold constant for the whole 1970-1981 period. With this assumption, and using population infrmation from the 1981 Census, the urban rural per capita N.D.P. ratio has increased to about 2.6 from about 2.4 in 1970-71. Thus the ratio of urban per capita N.D.P. to rural per capita N.D.P. has increased regularly from about 1.8 in 1950-51 to 2.3 in 1960-61, 2.4 in 1970-71 and at least 2.6 in 1980-81. As is shown in the next Chapter this increasing trend in dis
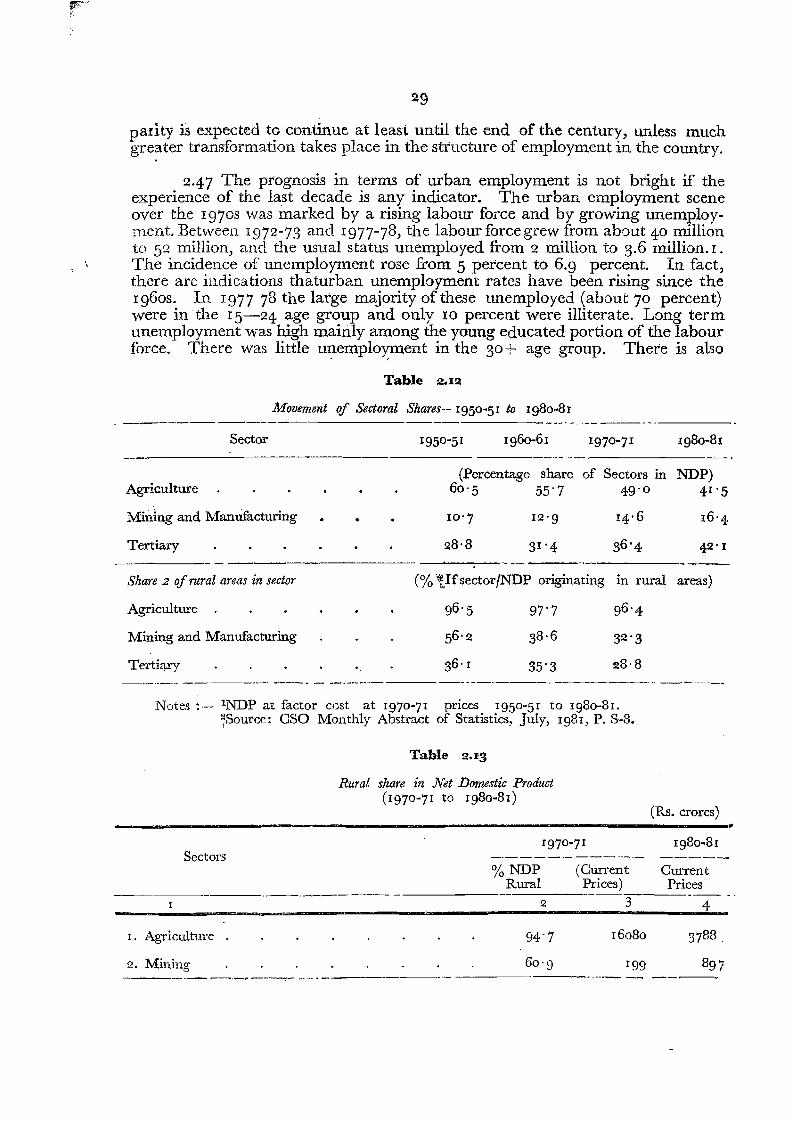
----
F
29
padty is expected t? continue at l~as'i. until the end of the centur~, unless much greater transformation takes place 111 the structure of employment In the country.
2-47 The prognosis in terms of urban employment is not bright if the experience of the last decade is any indicator. The urban employment scene over the I970S was marked by a rising labour force and by growing unemploymerit. Between I972-73 and I977-78, the labour force grew from about 40 million to 52 million, and the usual status unemployed from 2 million to 3.6 million. I . The incidence of unemployment rose from 5 percent to 6.9 percent. In fact, there are indications thaturban unemployment rates have been rising since the I960s. In I977 78 the large majority of these unemployed (about 70 percent) were in the I5-24 age group and only IO percent were illiterate. Long term unemployment was high mainly among the young educated portion of the labour force. There was little ur:emplo>:ment in the 30+ age group. There is also
Table 2.12
Movement if Sectoral Shares--1950-51 to 1980-81 ._-----.
Sector 1950-51 1960-61 1970-71 1980-81 - .~- --~
(Percentage share of Sectors in NDP) Agriculture 60'5 55'7 49"0 41"5
Mining and Manufacturing 10'7 12'9 14. 6 16'4
Tertiary 28,8 31 '4 36 ' 4 42'1 ..- .....-.
Share 2 ofrural areas in sector (% 'If,Ifsector/NDP originating in rural areas)
Agriculture 96'5 97'7 96'4
Mining and Manufacturing 56'2 38 ' 6 32 ' 3
Tertiary '. 36" 1 35"3 28·8 --_ ..__. ----_._. --- - --.-------- --------. ..._--
Notes ;.- lNDP at factor cost at 1970-71 prices 1950-51 to 1980-81. 7Source: csa Monthly Abstract of Statistics, July, Ig81, P. S-8.
Table 2.1:3
Rural share in Net Domestic Product (1970-71 to 1980-81)
(Rs. crores) ,
197°-7 1 Ig80-81 Sectors -.-----------,- ----
%NDP (Current Current Rural Prices) Prices ----- ..--._----- -------- --- _.
2 31 4
1. Agriculture ~14" 7 16080 3788.
2. Mining 60"9 199 897 _._---_._---._,.----.- --'-."-'--.---.-----._--. ..._-- -- ------
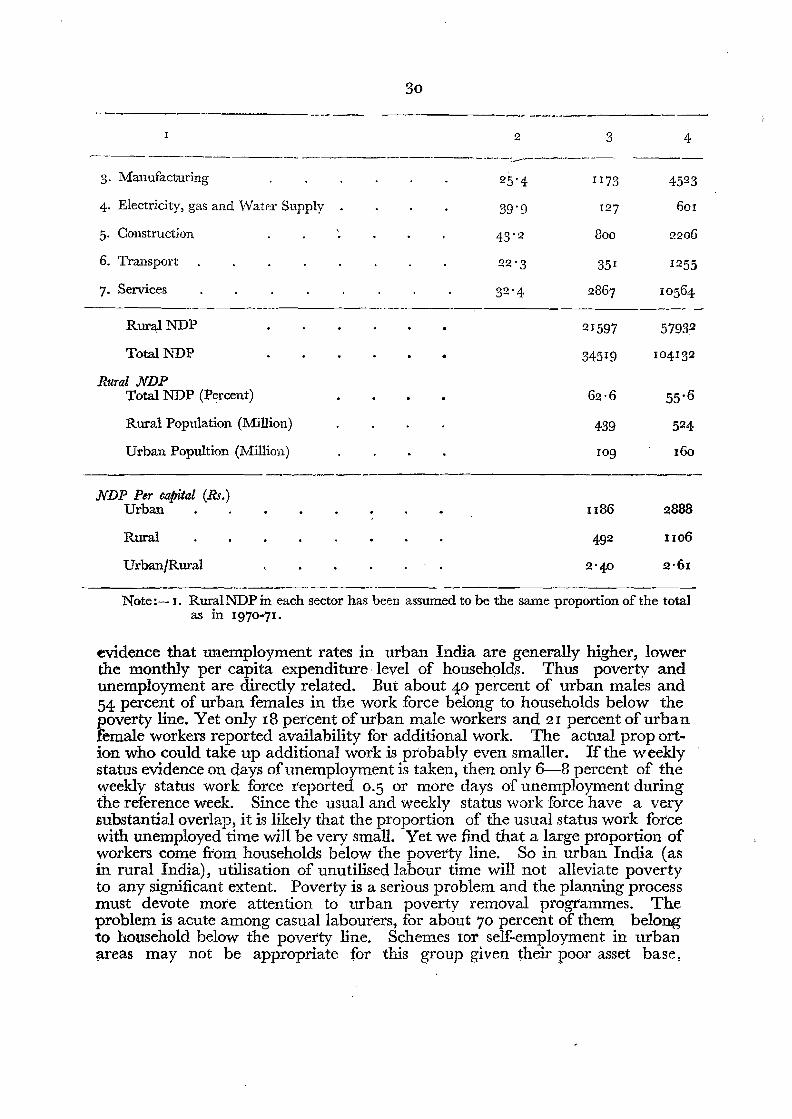
-----------------I
30
2 3 4 --------... _--_._-..--.----_._------------
3. Manufacturing 25'4 1173 4523
4. Electricity, gas and "Vater Supply . 39'9 12 7 601
5. Construction 4"' f).:> ~ 800 2206
6. Transport 22'3 351 1255
7. Services 32'4 2867 10564 -----_._------ -
RuralNDP 21597 57932
Total I\TDP 34519 1°4132
Rural NDP Total NDP (Percent) 62·6 55.6
Rural Population (Million) 524439
Urban Popultion (Million) 109 160
-------------------.-._-------_. NDP Per capital (Rs.)
Urban II86 2888
Rural no6492
Urban/Rural 2'40 2·61
Note:- I. RuralNDPin each sector has been assumed to be the same proportion of the total as in 1970-71.
evidence that unemployment rates in urban India are generally higher, lower the monthly per capita expenditure -level of households. Thus poverty and unemployment are directly related. But about 40 percent of urban males and 54 percent of urban females in the work force belong to households below the poverty line. Yet only 18 percent of urban male workers and 21 percent of urban female workers reported availability for additional work. The actual prop ort ion who could take up additional work is probably even smaller. If the weekly status evidence on days ofunemployment is taken, then only 6-8 percent of the weekly status work force reported 0.5 or more days of unemployment during the reference week. Since the usual and weekly status work force have a very substantial overlap, it is likely that the proportion of the usual status work force with unemployed time will be very small. Yet we find that a large proportion of workers come from households below the poverty line. So in urban India (as in rural India), utilisation of unutilised labour time will not alleviate poverty to any significant extent. Poverty is a serious problem and the planning process must devote more attention to urban poverty removal programmes. The problem is acute among casual labourers, for about 70 percent of them belong to household below the poverty line. Schemes tor self-employment in urban areas may not be appropriate for this group given their poor asset base,
3I
Also the proportion of casual labourers to the usual work force has been rising over time from IO percent to I3 percent for males and from 24 to 26 percent for females between I972-73 and I977-78.
2.48 Our projections given in the next chapter show that the expansion of the urban labour force will be rapid as labour force participation rates rise and as the urbanisation process operates to increase the size of the urban population. Each year 2-3 million more will join the labour force and jobs have to be found for them. This is only part of the problem; already the urban employment situation has deteriorated progressively since the I960's. It would require a very rapid increase in the expansion of employment opportunities to counter these trends. In particularly, unemployment is allready much more open in urban India, and this is likely to become more so with socio-economic development and a rise in the proportion of casual labour households overtime. Also the unemployed are typically young, and many are educated. Unless concerted steps are taken, a very explosive situation is likely to materialise in urban India.
l!l W-H-ll
\\
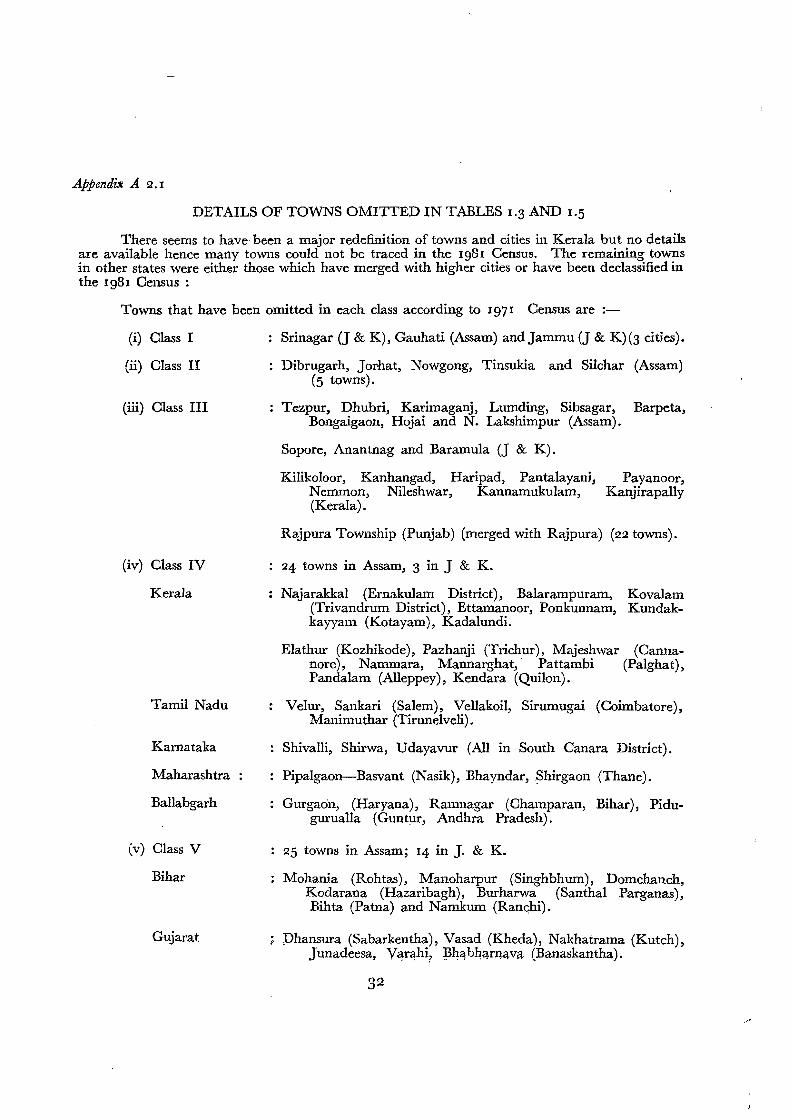
Appendix A 2.1
DETAILS OF TOWNS O~vnTTEDIN TABLES 1.3 AND 1.5
There seems to have been a major redefinition of towns and cities ill Kerala but no details are available hence many towns could not be traced in the 1981 Census. The remaining tow-ns in other states were either those which have merged with higher cities or have been declassified in the 1981 Census :
Towns that have been omitted in each class according to 1971 Census are :
(i) Class I
(ii) Class II
(iii) Class III
(iv) Class IV
Kerala
Tamil Nadu
Karnataka
Maharashtra
Ballabgarh
(v) Class V
Bihar
Gujarat
Srinagar (J & K), Gauhati (Assam) and Jammu (J & K)(3 cities).
Dibrugarh, Jorhat, Nowgong, Tinsukia and Silchar (Assam) (5 towns).
Tezpur, Dhubri, Karimaganj, Lumding, Sibsagar, Barpeta, Bongaigaon, Hojai and N. Lakshimpur (Assam).
Sopore, Anantnag and Baramula (J & K).
Kilikoloor, Kanhangad, Haripad, Pantalayani, Payanoor, Nemmon, Nileshwar, Kannamukulam, Kanjirapally (Kerala),
Rajpura Township (Punjab) (merged with Rajpura) (22 towns).
24 towns in Assam, 3 in J & K.
Najarakkal (Ernakulam District), Balarampuram, Kovalam (Trivandrum District), Ettamanoor, Ponkunnam, Kundakkayyam (Kotayam), Kadalundi.
Elathur (Kozhikode), Pazhanji (Trichur), Majeshwar (Cannanore) , Nammara, l\fannarghat,' Pattambi (palghat), Pandalam (Alleppey), Kendara (Quilon),
Velur, Sankari (Salem), Vellakoil, Sirumugai (Coimbatore), Manimuthar (Tirunelveli).
Shivalli, Shirwa, Udayavur (All in South Canara District).
Pipalgaon-Basvant (Nasik), Bhayndarv Shirgaon (Thane).
Gurgaon, (Haryana), Ramnagar (Champaran, Bihar), Pidugurualla (Guntur, Andhra Pradesh).
25 towns in Assam; I4 in J. & K.
Mohania (Rohtas), Manoharpur (Singhbhum), Domchanch, Kodarana (Hazaribagh), Burharwa (Santhal Parganas), Bihta (Patna) and Namkum (Ranchi),
Dhansura (Sabarkentha), Vasad (Kheda), Nakhatrama (Kutch), J unadeesa, Yarahi, Bhabharnava (Banaskantha),
32
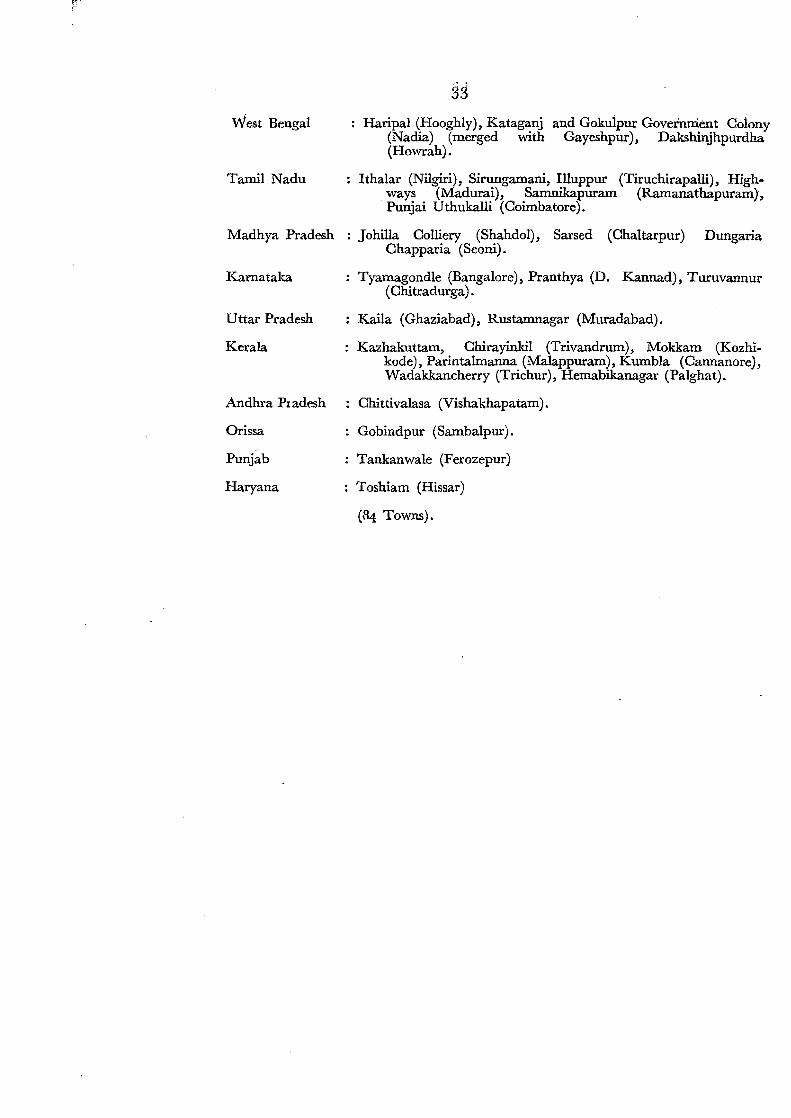
F
West Bengal
Tamil Nadu
Madhya Pradesh
Karnataka
Uttar Pradesh
Kerala
Andhra PI adesh
Orissa
Punjab
Haryana
33 Haripal (Hooghly), Kataganj and Gokuipur Government Colony
(Nadia) (merged with Gayeshpur), Dakshinjhpurdha (Howrah).
Ithalar (Nilgiri), Sirungamani, Illuppur (Tiruchirapalli), Highways (Madurai), Samnikapuram (Ramanathapuram),
. Punjai Uthukalli (Coimbatore).
: Johilla Colliery (Shahdol), Sarsed (Chaltarpur) Dungaria Chapparia (Seoni).
Tyamagondle (Bangalore), Pranthya (D. Kannad), Turuvannur (Chitradurga).
Kaila (Ghaziabad), Rustamnagar (Muradabad),
Kazhakuttam, Chirayinkil (Trivandrum), Mokkam (Kozhikode), Parintalmanna (Malappuram), Kumbla (Cannanore), Wadakkancherry (Trichur), Hemabikanagar (Palghat).
Chittivalasa (Vishakhapatam),
Gobindpur (Sambalpur).
Tankanwale (Ferozepur)
Toshiam (Hissar)
(84 Towns).
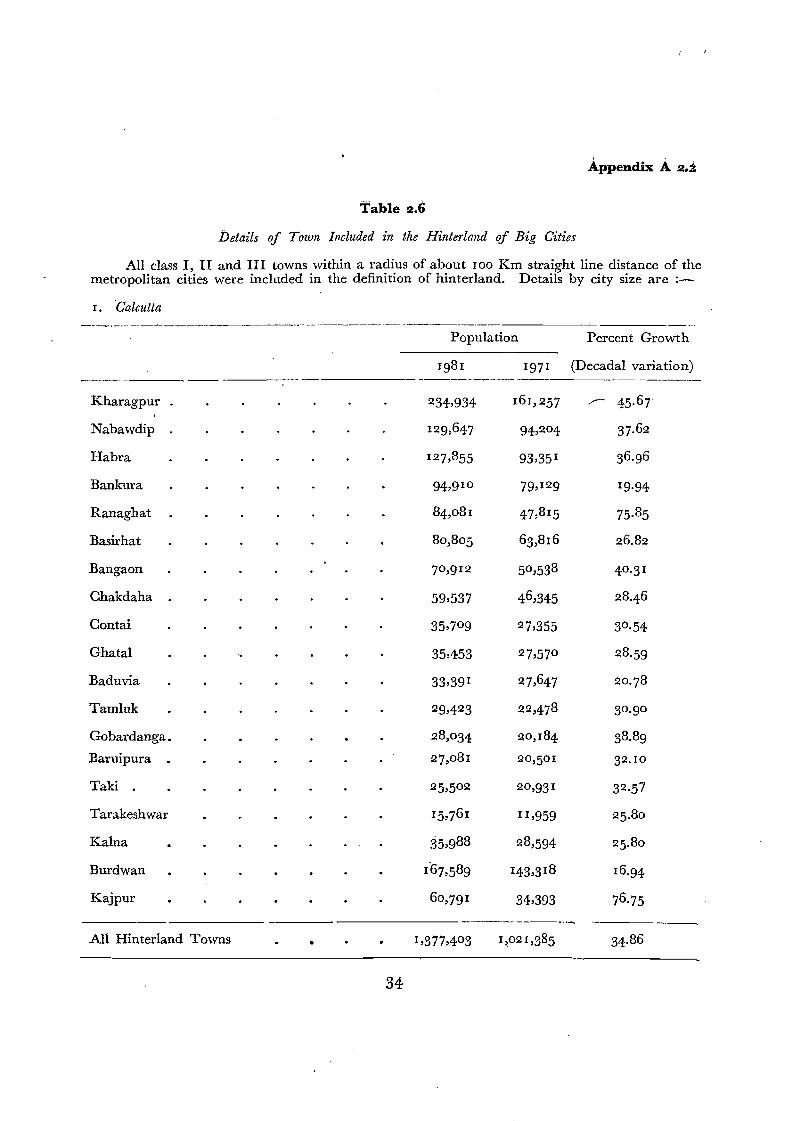
Appendix A 2.~
Table 2.6
Details of Town Included in the Hinterland of Big Cities
All class I, II and III towns within a radius of about 100 Km straight line distance of the metropolitan cities were included in the definition of hinterland. Details by city size are :
I. ·Calcutta ----.----~---_._-----~------_ ....- --------- .._-- --~-~-_.
Population Percent Growth
198 1 1971 (Decadal variation) --- --------- ---_._
Kharagpur . 234,934 161,257 ..,- 45. 67
Nabawdip 129,647 94,2°4 37.62· · · Habra 127,855 93,35 1 36.96 · Bankura · 94,910 79, 129 19·94
· · · ·· ·
Ranaghat 84,081 47,815 75.85· · · Basirhat 80,8°5 63,816 26.82· · · · Bangaon · 70,9 12 5°,538 4°.3 1· · Chakdaha · · · · · · 59,537 46,345 28.46
Contai 35,7°9 27,355 30.54· Ghatal .. 35,453 27,57 0 28.59
· · ·· · · ·
Baduvia 33,391 27,647 20.7 8· · · · Tamluk · · · · · · 29,423 22,47 8 3°·9°
Gobardanga. 28,°34 20, 184 38.89 · ·· · · Baruipura 27,081 20,5°1 32 •10· · · · ·· Taki . 25,5°2 20,93 1 32.57· · · ·· · · Tarakeshwar 15,761 11,959 25.80 ·· · · · · Kalna 35,988 28,594 25.80 · · · · · ·· Burdwan 1"67,589 143,3 18 16·94·· · · · · Kajpur 60,791 34,393 76.75· · · · · ·
-------- ..- -- All Hinterland Towns 1,377,403 1,021,385 34.86 · ·· ·
34
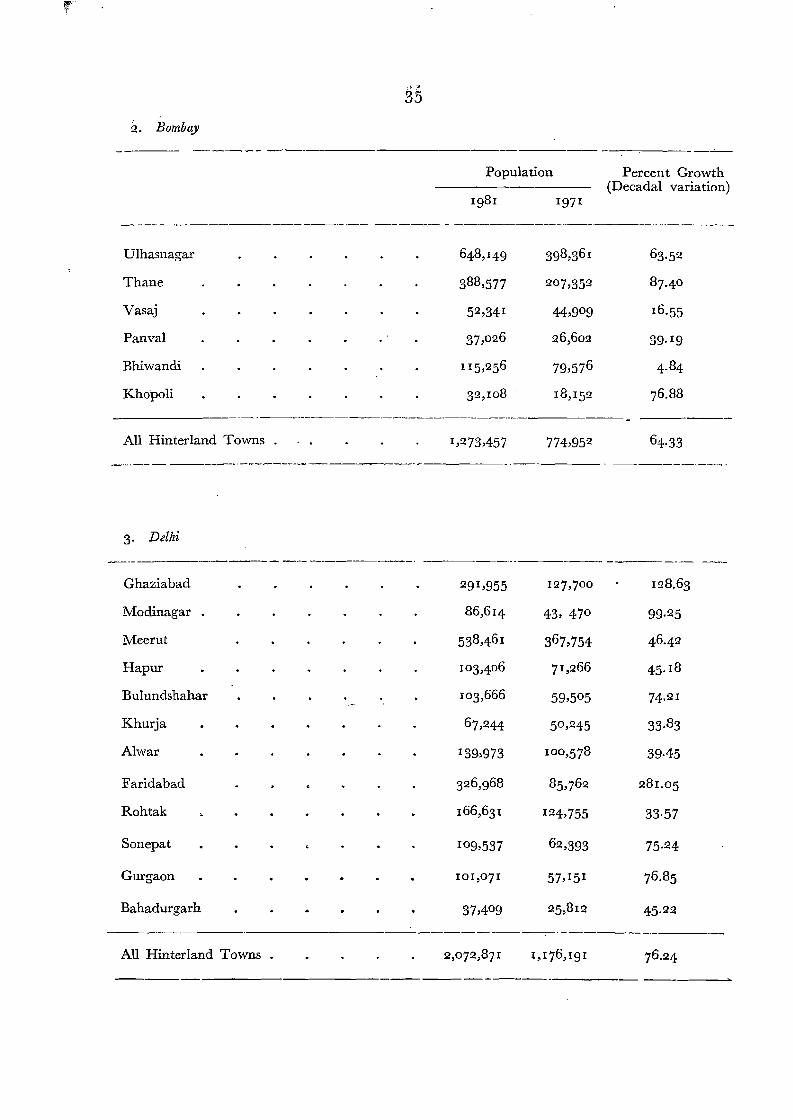
---- -
f'
35 2. Bombay
._-~-------~ -- ------------- Population Percent Growth
(Decadal variation) 1981 1971
Ulhasnagar 648,149 398,361 63.52
Thane 388,577 207,352 87·4°
Vasaj 52,341 44,9°9 16·55
Panval 37,026 26,602 39. 19
Bhiwandi 115,256 79,576 4.84
Khopoli 32 ,108 18,152 76.88
All Hinterland Towns . 1,273,457 774,952 64·33 - -----------...--.-.-.
3. Delhi
._------ -------_. Ghaziabad 291,955 127,7° 0 128.63
Modinagar 86,614 43, 470 99·25
Meerut 538,461 367,754 46.42
Hapur 103,4°6 71,266 45. 18
Bulundshahar 103,666 59,5°5 74.21
Khurja 67,244 5°,245 33.83
Alwar 139,973 100,578 39·45
Faridabad 326,968 85,762 281.05
Rohtak 166,631 124,755 33·57
Sonepat 109,537 62,393 75.24
Gurgaon 101,°71 57,15 1 76.85
Bahadurgarh 37,409 25,312 45·22 ----.---------_. ---_._---.-..------._.
All Hinterland Towns 2,072,87 1 1,176,191 76.24
------------------- --------
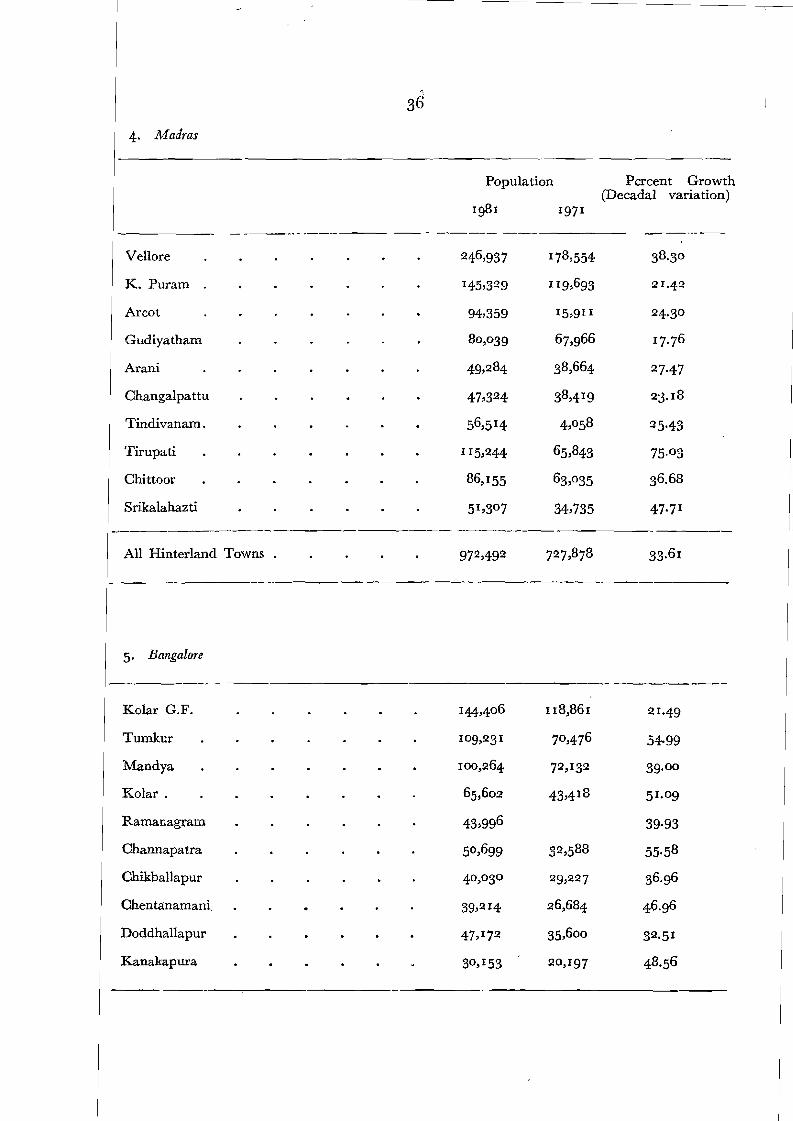
36
4..Madras
Population Percent Growth (Decadal variation)
1981 1971
------ ------ ------------- -------_._- -----
Vellore 246,937 178,554 38.3°
K. Puram 145,329 119,693 21.42
Arcot 94,359 15,gII 24·3°
Gudiyatham 80,039 67,966 17.76
Arani 49,284 38,664 27·47
Changalpattu 47,324 38,419 2:3. 18
Tindivanam. 56,514 4,°58 25·43
Tirupati II5,244 65,843 75.03
Chittoor 86,155 63,°35 36.68
Srikalahazti 51,3°7 34,735 47.7 1
.. _--
All Hinterland Towns . 972,492 727,878 33.61
----- .__..•_-----
Bangalore5·
-.
Kolar o.r. · · · · 144,4°6 II8,861 ~:n·49
Tumkur · · · · · · · 109,231 7°,476 54·99
Mandya · · 100,264 72,132 39.00
Kolar. · · · · 65,602 43,4 18 51.°9
Ramanagram · · · · 43,996 39·93
Channapatra · · · 50,699 32,588 55.58
Chikballapur · · · · · 4°,°3° 29,227 36.96
Chentanamani, · · · · · 39,214 26,684 4 i·96
Doddhallapur · · · · · . 47,172 35,600 32.51
Kanakapura · · · · · · 30,153 20,197 48.56
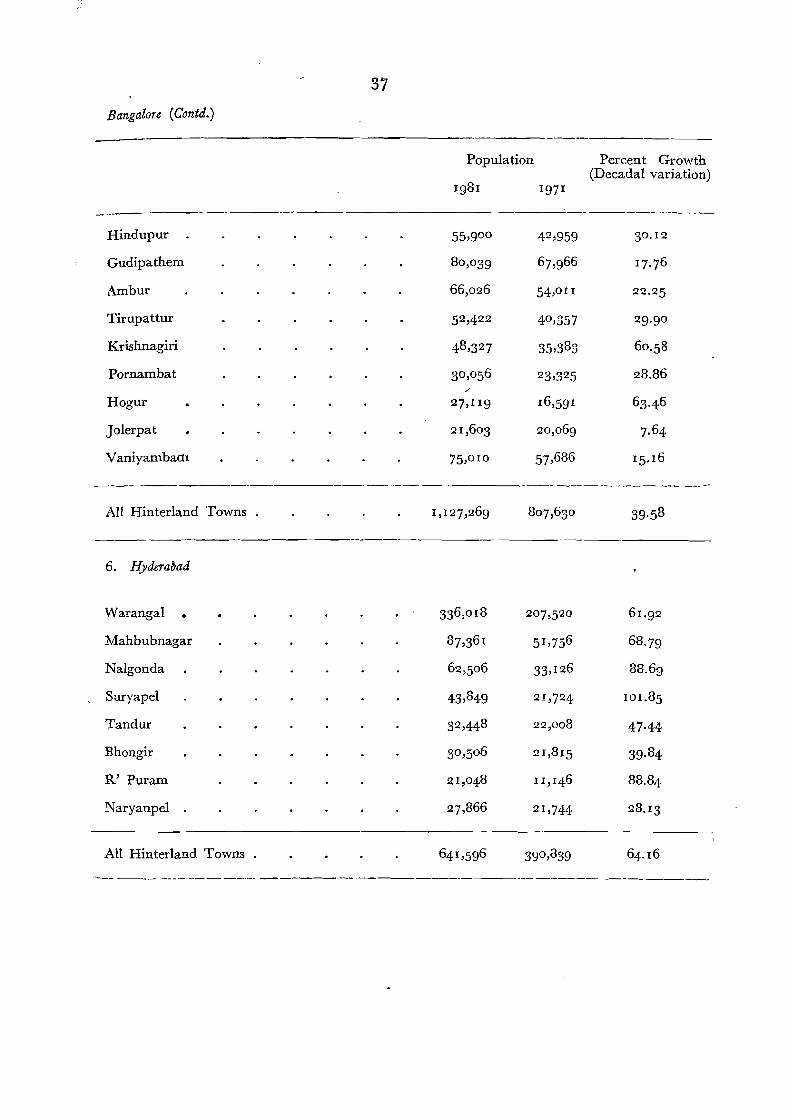
F
6. Hyderal>ad
Warangal •
Mahbubnagar
Nalgonda
Suryapel
Tandur
Bhongir
R' Puram
Naryanpel
336,018
37,3 61
62,5°6
43,849
32,448
3°,5°6
21,048
27,866
207,520 61.92
51,756 68·79
33,126 88.69
2!,724 101.85
22,008 47·44
21,815 39.84
II,146 88.84
21,744 28.13
AU Hinterland Towns . 64 1,596 390,839 64. 16
---------_. --- _.__._-- "._-_._--
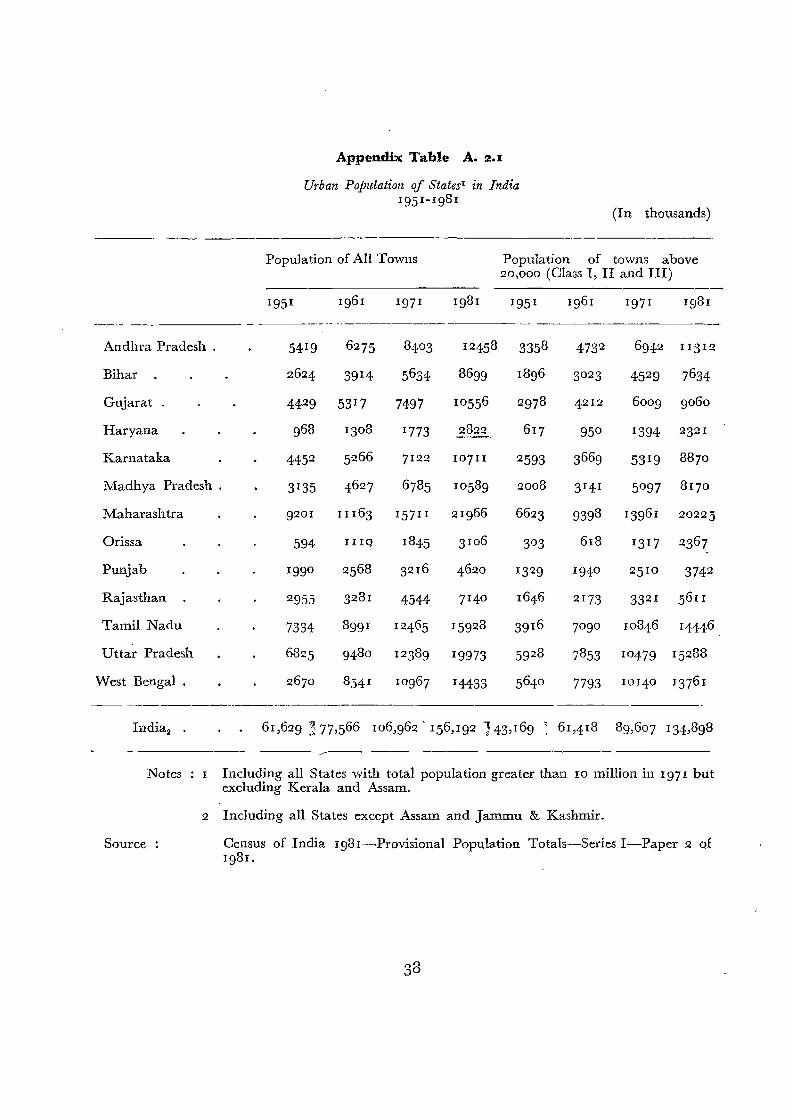
Appendix Table A. 2.I
Urban Population of States- in India 195 I - I 981
(In thousands)
_._ -Population of All Towns Population of towns above
20,000 (Class I, II and III)
1951 1961 1971 1981 1951 1961 1971 Ig81
- - -~---_.- _._------
Andhra Pradesh . 5419 6275 8403 12458 3358 4732 6942 11312
Bihar . . 2624 39 14 5634 8699 1896 3023 4529 7634
Gujarat . 4429 5317 7497 1°556 2978 4212 600g 9060
Haryana · 968 1308 1773 2822 617 95° 1394 232 1
Karnataka · 4452 5266 7122 107II 2593 3669 53 19 8870
Madhya Pradesh . . 3135 4627 6785 10589 2008 3141 5°97 817°
1vlaharashtra 9201 I I 163 157II 21966 6623 9398 13961 2022 5
Orissa 594 IIIQ 1845 3106 3°3 618 1317 2367
Punjab 1990 2568 3216 4620 1329 194° 25 10 374 2
Rajasthan 2955 328 1 4544 714° 1646 2173 3321 561 I
Tamil Nadu 7334 899 1 12465 15928 39 16 7°9° 10846 14446
Uttar Pradesh · 6825 9480 12389 19973 5928 7853 10479 15288
West Bengal . 2670 854 1 10967 14433 5640 7793 1° 14° 13761
.-----_.~------_. __._----
India, . 61,629 ~ 77,566 106,962' 156,19 2 143,169 ~ 61,/p8 89,607 134,898
/--- ~.- ---- -----.-----
Notes: I Including all States with total population greater than 10 million in 1971 but excluding Kerala and Assam.
2 Including all States except Assam and Jammu & Kashmir.
Source Census of India 198r-Provisional Population Totals-Series I-Paper 2 of Ig81.
33
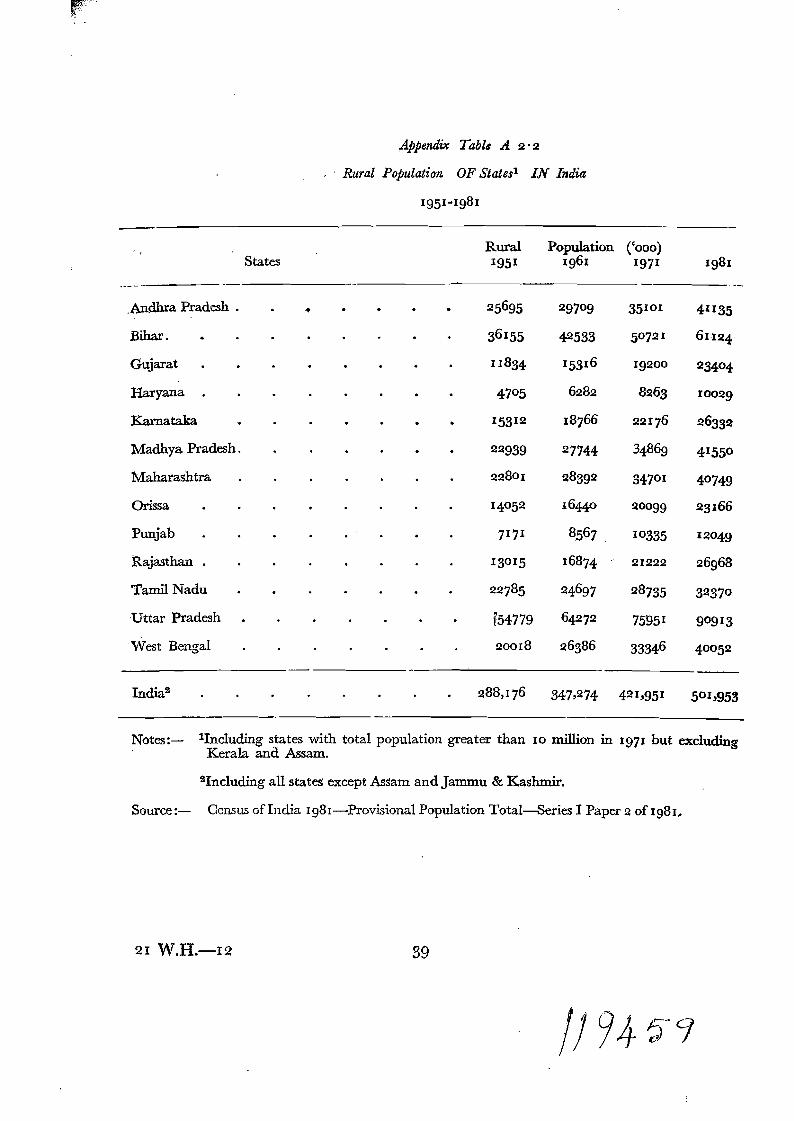
~-
4ppendix Table A 2' 2
.. Rural Population OF Statesl IN India
1951-1981
Rural Population ('000) States 1951 1961 1971 1981
_.__. -.
.A,ndhra Pradesh . · " · . · · 25695 297°9 35101 41135
Bihar. · · · · · · · 36155 42533 5°721 6II24
Gujarat · · · · · · · · II834 15316 19200 234°4
Haryana · · · · · · · 47°5 6282 8263 10029
Karnataka · · · · · · · 15312 18766 22176 26332
Madhya Pradesh. · · · · · · 22939 27744 34869 4155°
Maharashtra · · · · · 22801 28392 347°1 4°749
Orissa · · · · · · · 14°52 16440 !20099 23166
Punjab · · · · · 7171 8567 1°335 12°49
Rajasthan . · · · · · 13°15 16874 21222 26968
Tamil Nadu · · · · · · · 22785 24697 28735 3237°
Uttar Pradesh . . . . . . f54779 64272 75951 9°9 13
West Bengal . 20018 26386 33346 4°°52
----- --
India2 288,176 347,274 421,951 5°1,953
Notes:- lInc1uding states with total population greater than 10 million in 1971 but excluding Kerala and Assam.
SIncluding all states except Assam and Jammu & Kashmir.
Source:- Census ofIndia 1981-Provisional Population Total-Series I Paper 2 Of1981.
2I W.H.-I2 39
/J 94 1j·9
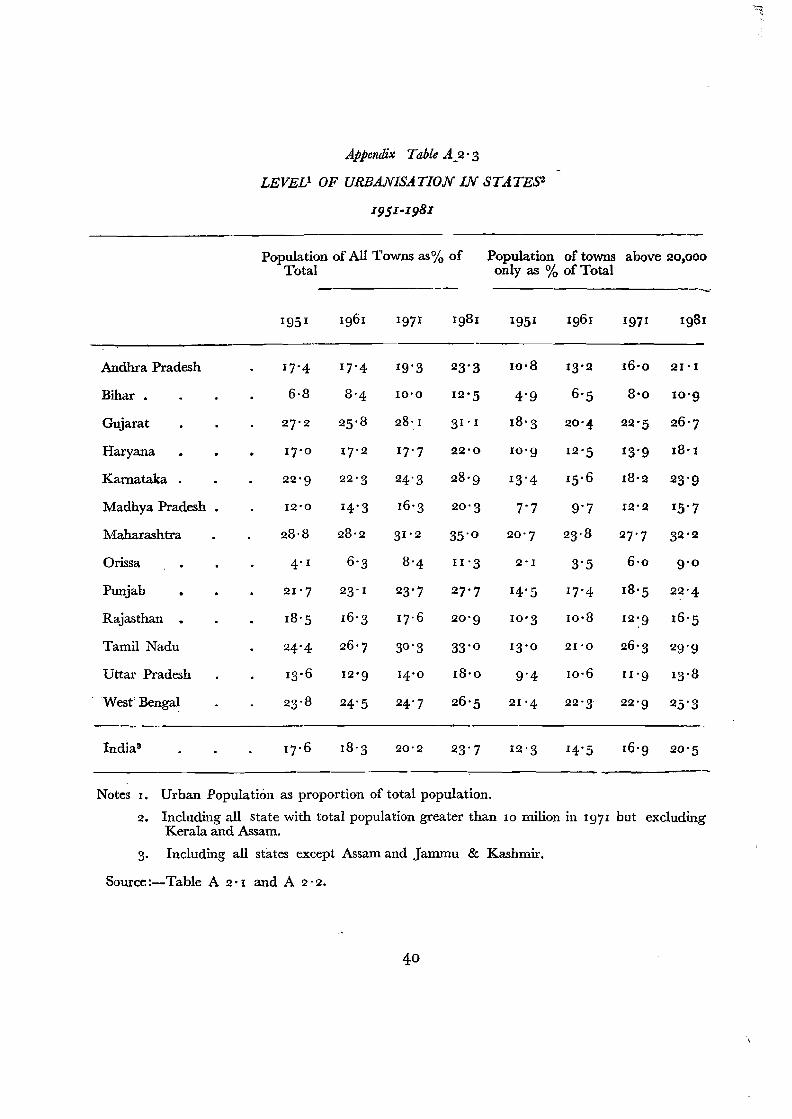
~ '.
Appendix Table A_2' 3
LEVELl OF URBANISATION IN STATES2
1951-1981
Andhra Pradesh
Bihar. ,
Gujarat ,
Haryana · Karnataka ,
Madhya Pradesh
Maharashtra
Orissa · Punjab · Rajasthan · Tamil Nadu
Uttar' Pradesh
West' Bengal
_.--~ -~_.
India3 ,
,
· · · •
· . . ,
,
,
Population of All Towns as% of Population of towns above 20,000 Total only as % of Total ._
1951 1961 1971 Ig81 1951 1961 Ig71 Ig8!
-- -, 17'4 17'4 19'3 23'3 10,8 13'2 16'0 21'1
, 6·8 8'4 10'0 12'5 4'9 6'5 8'0 10'9
, 27'2 25'8 28, I 31'1 18'3 20'4 22'5 26'7
· 17'0 17'2 17'7 22'0 lO'g 12'5 13'9 18' I
, 22'g 22'3 24'3 28'g 13'4 15'6 18'2 23'9
12'0 14'3 16'3 20'3 7'7 9'7 12'2 15'7
. 28,8 28'2 31'2 35'0 20'7 23'8 27'7 32'2
, 4' I 6'3 8'4 II '3 2' I 3'5 6'0 9'0
· 21'7 23' I 23'7 27'7 14'5 17'4 18'5 2~'4
· 18'5 16'3 17'6 20'9 10'3 10,8 12:9 16'5
· 24'4 26'7 30'3 33'0 13'0 21 '0 26'3 29'9
, 13'6 12'9 14'0 18'0 9'4 10,6 11 'g 13,8
23'8 24'5 24'7 26'5 21 '4 22'3 22'9 25'3
17'6 18'3 20'2 23'7 12'3 14'5 16'9 20'S
Notes I, Urban Population as proportion of total population,
2. Including all state with total population greater than 10 milion in 1971 but excluding Kerala and Assam,
3, Including all states except Assam and Jammu & Kashmir,
Source:-Table A 2' 1 and A 2' 2,
40
\
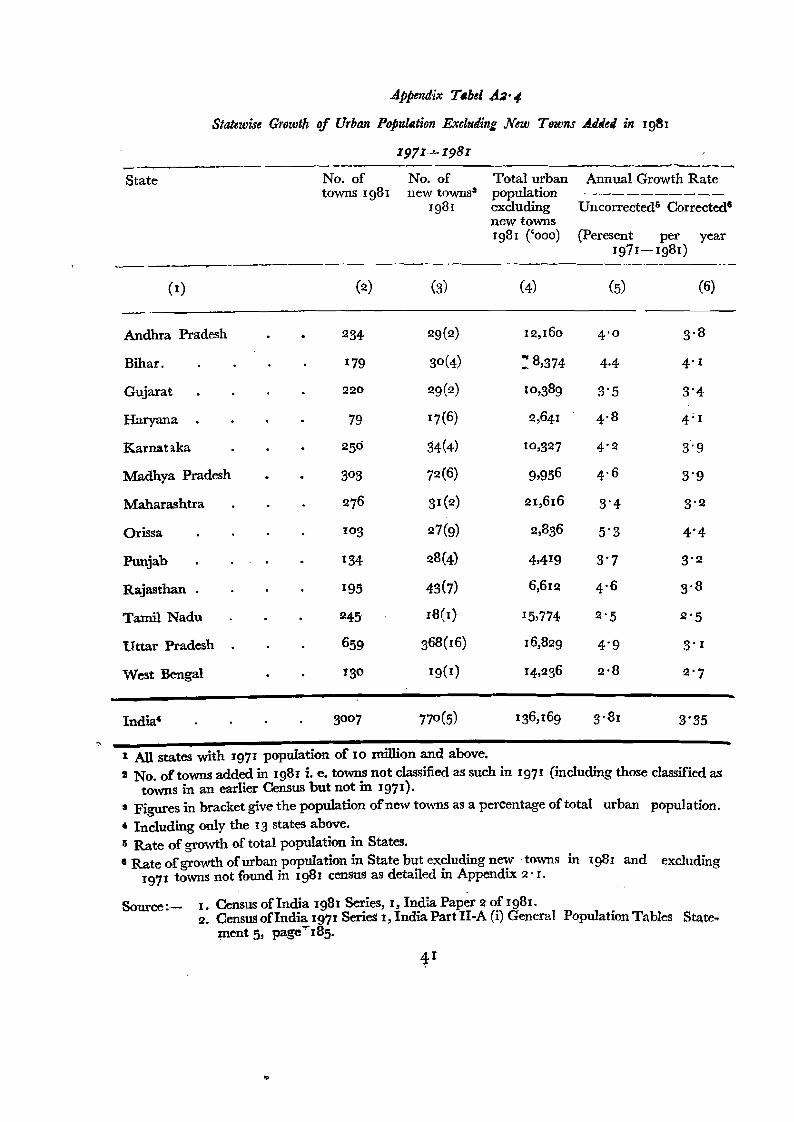
--------------------
Appendix T.bel.A3·",
Stauwise Growth of Urban Popttlfltion Excludin: New T811.ms Aliei in 1981
1971...J-I98I
State No. of towns Ig81
No. of new towns"
Ig81
Total urban population excluding new towns 1981 ('000)
Annual Growth Rate
Uncorrected- Corrected'
(Peresent per year 1971-1981)
(I) (2) (3) (4) (5) (6)
Andhra Pradesh
Bihar.
Gujarat
Haryana
Karnat aka
Madhya Pradesh
Maharashtra
Orissa
Punjab
Rajasthan
Tamil Nadu
Uttar Pradesh
West Bengal
234
179
220
79
25°
3°3
276
1°3
134
195
245
659
13°
29(2)
3°(4)
29(2)
17(6)
34(4)
72(6)
31(2)
27(9)
28(4)
43(7)
18(1)
368(16)
19(1)
12,160
~ 8,374
10,389
2,641
10,32 7
9,956
21,616
2,836
4,419
6,612
15,774
16,829
14,236
4'0
4·4
3"5
4. 8
4'2
4,6
3'4
5"3
3·7
4. 6
2'5
4'9
2,8
3. 8
4' I
3'4
4; 1
3"9
3'9
3"2
4'4
3'2
3,8
2'5
3' I
2'7
India· 3°°7 77°(5) 136,169 3"81 3'35 ~
1 All states with 1971 population of 10 million and above. s No. of towns added in 1981 i. e. towns not classified as such in 1971 (including those classified as
towns in an earlier Census but not in 1971). S Figures in bracket give the population ofnew towns as a percentage of total urban population.
• Including only the 13 states above. 5 Rate of growth of total population in States. • Rate ofgrowth ofurban population in State but excluding new towns in 1981 and excluding
1971 towns not found in 1981 census as detailed in Appendix 2" I.
Source:- I. Census ofIndia 1981 Series, I, India Paper 2 of 1981. 2. Census oflndia 1971 Series I, India Part II-A (i) General Population Tables State
ment 5, page....18s. . -p
<9
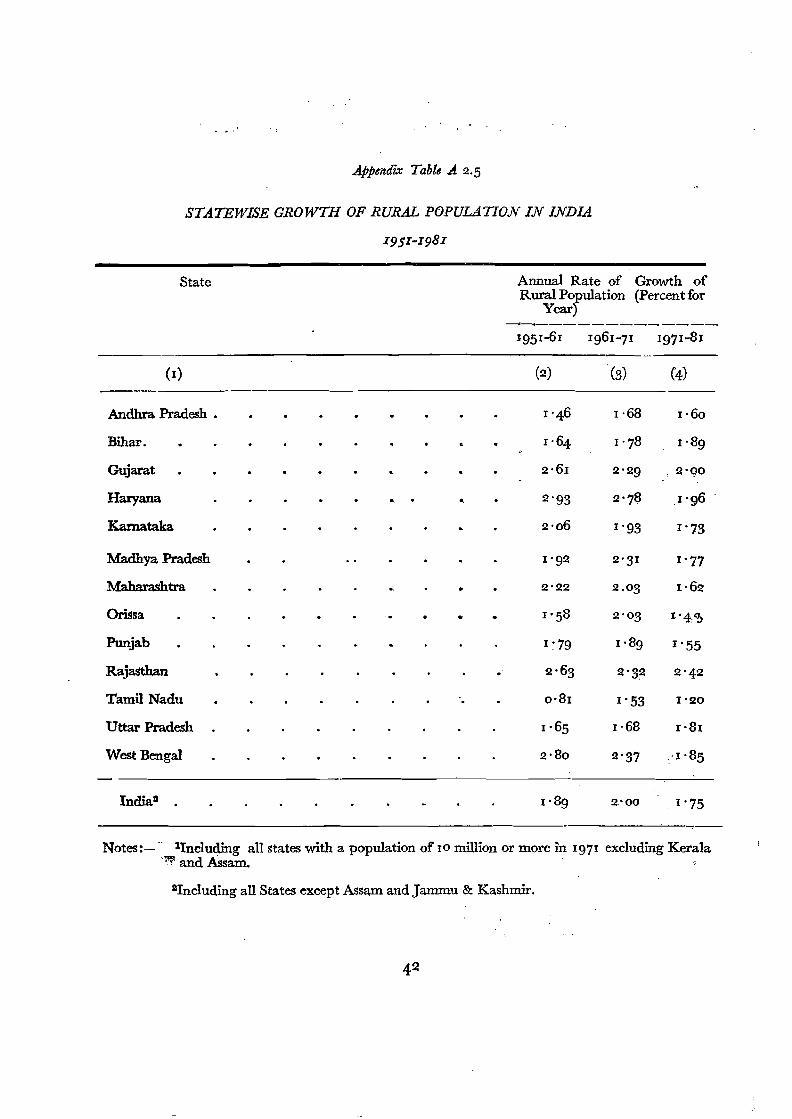
Appendix Table .A 2,5
STATEWISE GROWTH OF RURAL Po.PULATION IN INDIA
I9SI-I98I
State Annual Rate of Growth of Rural Population (Percent for
Year) ----.1_-____________
J95 1-61 1961-71 1971-81 _.
(I) (2) (3) (4)
Andhra Pradesh •
Bihar.
Gujarat
Haryana
Kamataka
Madhya Pradesh
MaharalIhtra
Orissa
Punjab
Rajasthan
Tamil Nadu
Uttar Pradesh
West Bengal
1'46 1·68 1·60
1,64 1'78 1-89
2,61 2'29 ,2'(.10
.. . .. 2'93 2'78 .1'96
2'06 1'93 1'73
1'92 2'31 1'77
2'22 2,03 1,62
• 1'58 2'03 I'4'?>
1:79 1,89 1'55
. 2,63 Q'32 2'42
0,81 1'20I' 53
1·65 1,68 r'8I
2,80 2'37 :'1 ,85
Indial 1·89 2'00 _1'75
Notese->" lIncluding all states with a population of 10 million or more in 1971 excluding Kerala '". and Assam,
llIncIuding all States except Assam and Jammu & Kashmir,
42
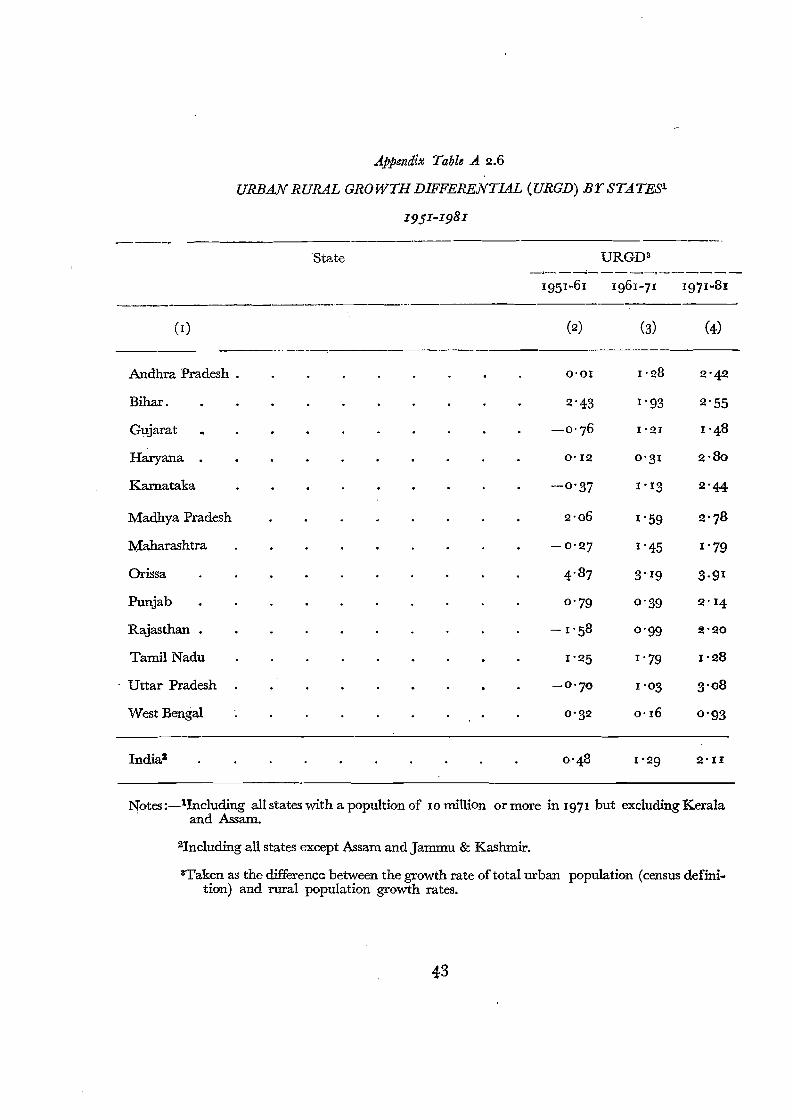
Appendix Table A. 2.6
URBAN RURAL GROWTH DIFFERENTIAL (URGD) BY STATESl
(I)
Andhra Pradesh .
Bihar.
Gujarat
Haryana •
Karnataka
Madhya Pradesh
Maharashtra
Orissa
Punjab
Rajasthan
Tamil Nadu
. Uttar Pradesh
West Bengal
Indial
Notes i-i-Hncluding all states with a popultion of IO million or more in 1971 but excluding Kerala and Assam.
ZIncluding all states except Assam and Jammu & Kashmir.
sTaken as the difference: between the growth rate of total urban population (census definition) and rural population growth rates.
43
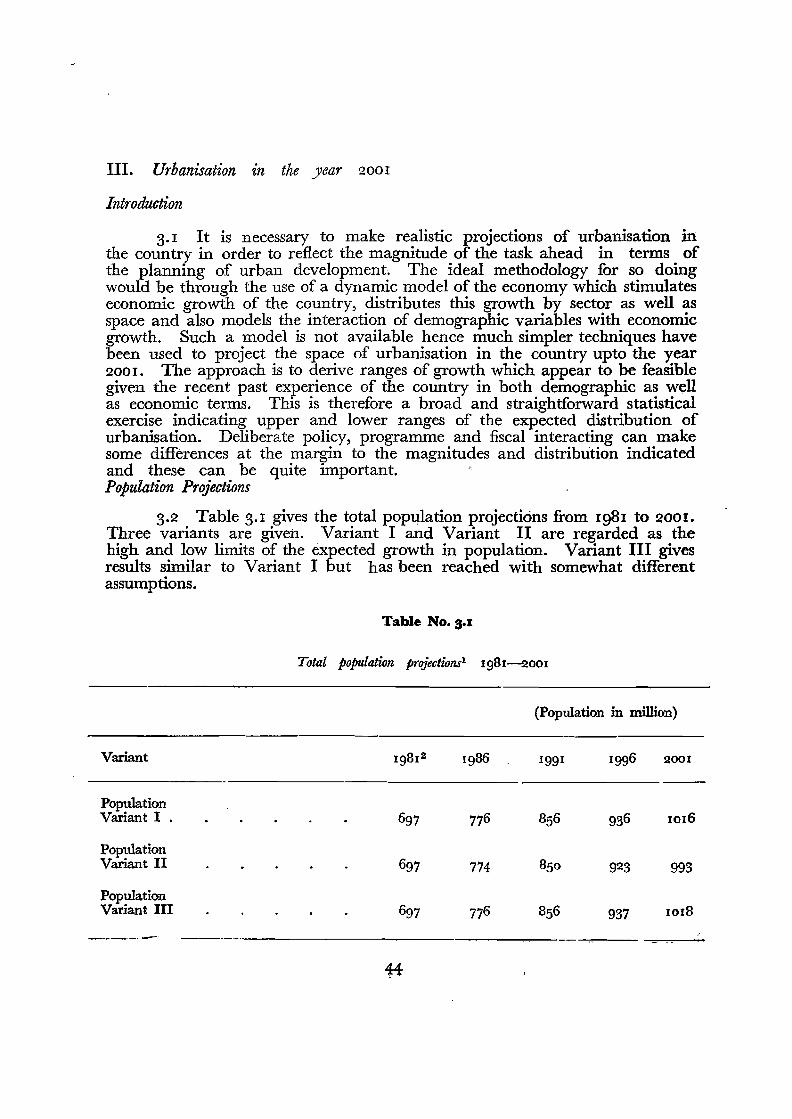
III. Urbanisation in the year 2001
Introduction
3.1 It is necessary to make realistic projections of urbanisation in: the country in order to reflect the magnitude of the task ahead in terms of the planning of urban development. The ideal methodology for so doing would be through the use of a dynamic model of the economy which stimulates economic growth of the country, distributes this growth by sector as well as space and also models the interaction of demographic variables with economic growth. Such a model is not available hence much simpler techniques have been used to project the space of urbanisation in the country upto the year 2001. The approach is to derive ranges of growth which appear to be feasible given the recent past experience of the country in both demographic as well as economic terms. This is therefore a broad and straightforward statistical exercise indicating upper and lower ranges of the expected distribution of urbanisation. Deliberate policy, programme and fiscal interacting can make some differences at the margin to the magnitudes and distribution indicated and these can be quite important. Population Projections
3.2 Table 3.1 gives the total population projections from 1981 to 2001. Three variants are given. Variant I and Variant II are regarded as the high and low limits of the expected growth in population. Variant III gives results similar to Variant I but has been reached with somewhat different assumptions.
Table No. 3.:1
Total population projectionsl 1981-2001
(Population in million)
Variant 198 12 1986 1991 1996 2001
Population Variant I . 697 776 856 936 1016
Population Variant II 697 774 850 923 993
Population Variant III 697 776 856 937 1018
-------44
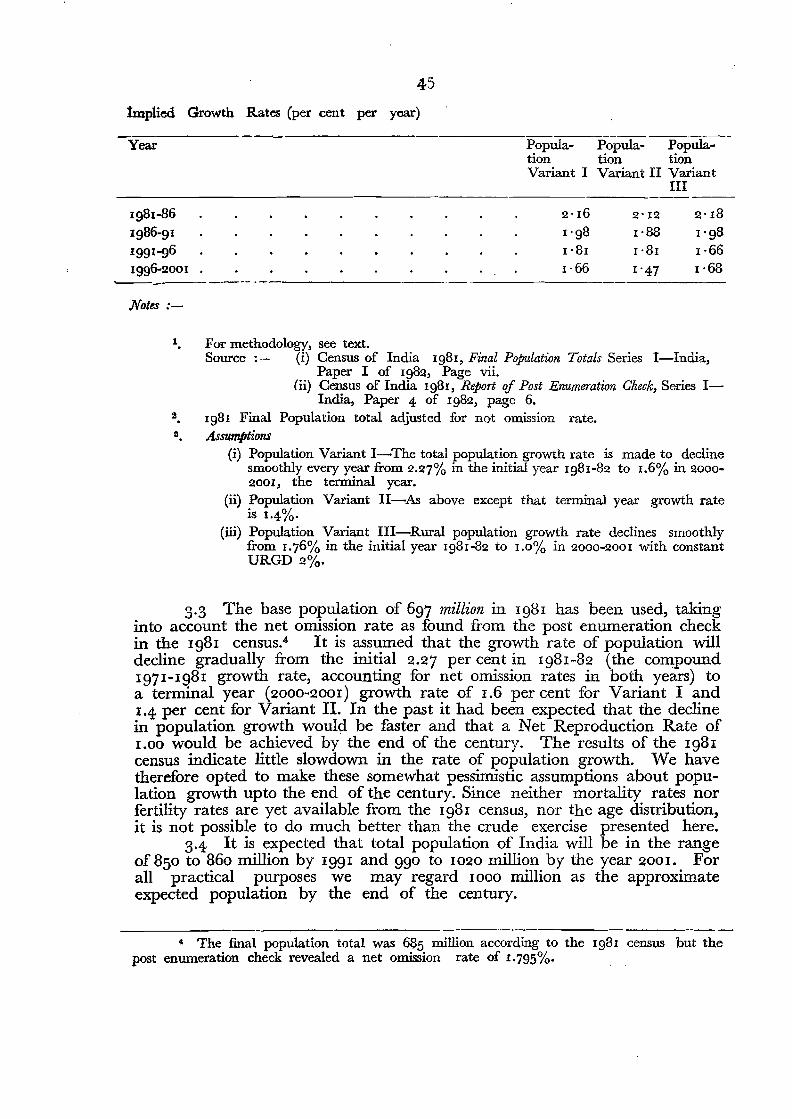
Implied Growth Rates (per cent per
45
year)
Year Population Variant I
Popula- ----popula-=-tion tion Variant II Variant
III
1981-86 2" 16 2' 12 2' 18
1986-9 1
1991-g6
1996-2001 ~- ..._--~- .--
1"g8 1·81 1·66
1"88 1"81
1"47
1"98 1·66 1·68
Notes :
1 For methodology, see te...ct. Source:- (i) Census of India Ig81, Final Population Totals Series I-India,
Paper I of Ig82, Page vii. (ii) Census of India Ig81, Report of Post Enumeration Check, Series 1
India, Paper 4 of 1982, page 6. 2 1981 Final Population total adjusted for not omission rate. 8. Assumptions
(i) Population Variant I-The total population growth rate is made to decline smoothly every year from 2.27% in the initial year 1981-82 to 1.6% in 20002001, the terminal year.
(ii) Population Variant II-As above except that terminal year growth rate • 0/IS 1.4/0'
(iii) Population Variant III-Rural population growth rate declines smoothly from 1.76% in the initial year 1981-82 to 1.0% in 2000-2001 with constant URGD 2%.
3.3 The base population of 697 million in 1981 has been used, taking into account the net omission rate as found from the post enumeration check in the 1981 census," It is assumed that the growth rate of population will decline gradually from the initial 2.27 per cent in 1981-82 (the compound 1971-1981 growth rate, accounting for net omission rates in both years) to a terminal year (2000-2001) growth rate of 1.6 per cent for Variant I and 1.4 per cent for Variant II. In the past it had been expected that the decline in population growth would be faster and that a Net Reproduction Rate of 1.00 would be achieved by the end of the century. The results of the 1981 census indicate little slowdown in the rate of population growth. We have therefore opted to make these somewhat pessimistic assumptions about population growth upto the end of the century. Since neither mortality rates nor fertility rates are yet available from the 1981 census, nor the age distribution, it is not possible to do much better than the crude exercise presented here.
3.4 It is expected that total population of India will be in the range of 850 to 860 million by 1991 and 990 to 1020 million by the year 2001. For all practical purposes we may regard 1000 million as the approximate expected population by the end of the century.
4. The final population total was 685 million according to the Ig81 census but the post enumeration check revealed a net omission rate of 1.795%.
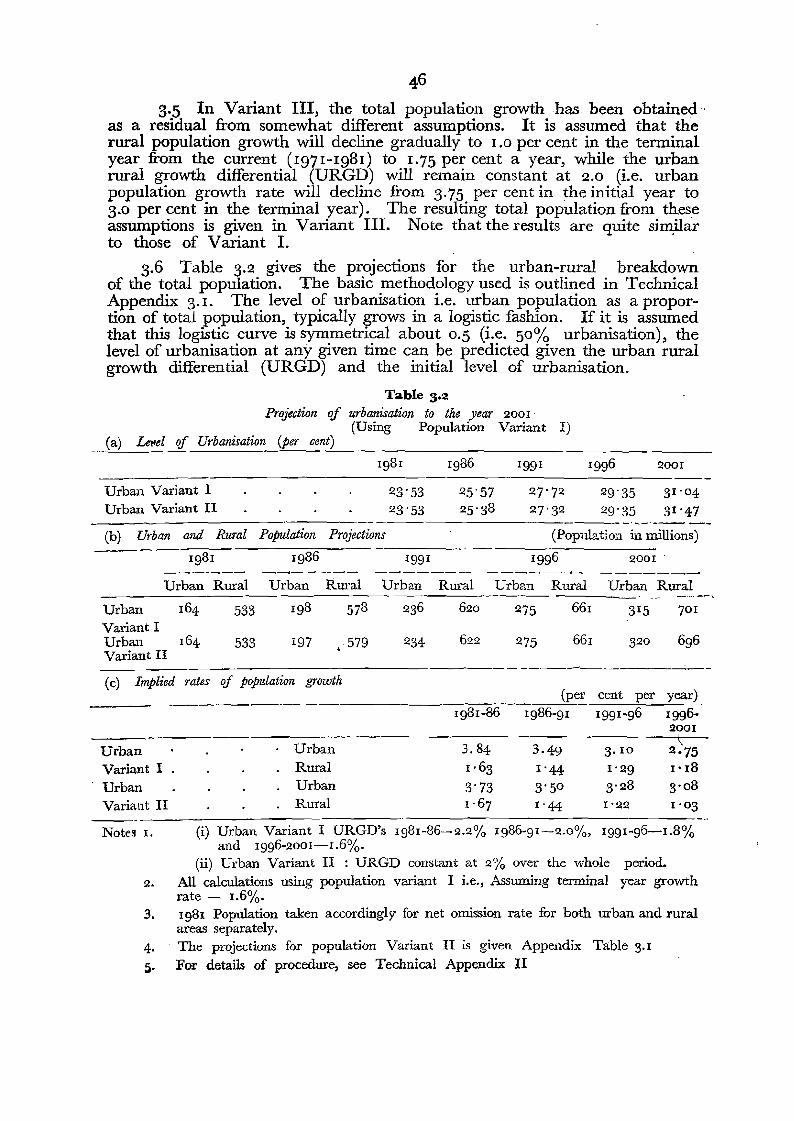
------- ------- --------
--------
46
3.5 In Variant III, the total population growth has. been obtained as a residual from somewhat different assumptions. It is assumed that the rural population growth will decline gradually to 1.0 per cent in the terminal year from the current (1971-1981) to 1.75 per cent a year, while the urban rural growth differential (URGD) will remain constant at 2.0 (i.e. urban population growth rate will decline from 3,75 per cent in the initial year to 3.0 per cent in the terminal year). The resulting total population from these assumptions is given in Variant III. Note that the results are quite similar to those of Variant 1.
3.6 Table 3.2 gives the projections for the urban-rural breakdown of the total population. The basic methodology used is outlined in Technical Appendix 3.!. The level of urbanisation i.e. urban population as a propor~ tion of total population, typically grows in a logistic fashion. If it is assumed that this logistic curve is symmetrical about 0.5 (i.e. 50% urbanisation), the level of urbanisation at any given time can be predicted given the urban rural growth differential (URGD) and the initial level of urbanisation.
Table 3.2 Projection of urbanisation to the year 200 I .
(Using Population Variant I) (a) Let1el of Urbanisatio:: (per cent)
1981 1986 1991 1996 2001
Urban Variant I 23'53 25'57 27'72 29'35 31' °4 Urban Variant II 23'53 25'38 27'32 29'35 31'47
_. __ 0 _____
(b) Urban and Rural Population Projections (Population in millions) --- --1-9-8-1--~---------
19~\) 1991 "-
1996 2001 . -----~-
Urban Rural Urban Rural Urban Rural Urban Rural Urban Rural -
Urban 164 533 198 578 236 620 ~75 661 315 ...
701 Variant I Urban 164 533 197 • 579 234 622 275 661 320 696 Variant II
--~--
(c) Implied rates of population growth (per cent per year)
1981-86 1986-91 1991-96 19962001 ,
\
Urban Urban 3,84 3·49 3. 10 2·'75 Variant I Rural 1,63 1'44 1'29 1'18
Urban Urban 3'73 3'50 3. 28 3-08
Variant II Rural 1 ·67 1'44 1'22 1-03
Notes 1. (i) Urban Variant I URGD's 1981-86-2.2% 1986-91-2.°%, 1991-96-1.8% and 1996-2001-1.6%.
(ii) Urban Variant II : URGD constant at 2% over the whole period. 2. All calculations using population variant I i.e., Assuming terminal year growth
rate - 1.6%. 3. 1981 Population taken accordingly for net omission rate for both urban and rural
areas separately, 4. . The projections for population Variant II is given Appendix Table 3.1 5. For details of procedure, see Technical Appendix II
11"
47
3.7 The URGD for 1971 and 1981 was 2.II for the country as a whole with the rate of urban population growth being 3.86 per cent a year and that of rural population growth 1.75 per cent. Two variants of URGD have been used over the projection period. Urban Variant I first increases URGD to 2.2 for the first quinquennium and then makes it decline gradually to 2.0 from 1986-1991, 1.8 for 1991 to 1996 and 1.6 from 1996 to 2001. Urban' Variant II assumes URGD to remain constant at 2.0 over the whole period. There is no good basis for projecting the behaviour of URGD. As was shown in the Chapter I, URGD has varied from 0.46 in 1951-1961 to 1.29 in 19611971 to 2.11 in 1971-1981. These changes have been mainly due to changes in the rate of urban population growth while the rate of rural population growth expected has remained relatively steady (1.88, 1.97, 1.75 per cent per year in the last three decades respectively). The last decade witnessed a significant decline in the rural growth rate. As was shown in the last chapter, the share of agriculture in the national economy has declined to about 37 per cent and can be expected to continue to decline upto the end of the century. One can expect an attendent decline in rural population growth rates over the projection period. As shown' in Table 3.2, the rural growth rates resulting from the projection assumptions imply a decline to about I.I per cent in the terminal year, when total population growth is 1.6. per cent in that year; and 0.9% when the terminal year population growth is 1.4 per cent. It would seem unrealistic for these growth rates to decline much further by the end of the century. This is the rationale for not expecting a further increase in URGD as has occurred over the past three decades. Moreover, our preferred Variant is Variant I where URGD is assumed to decline roughly in accordance with the decline in total population growth.
3.8 The results of this exercise indicate the following:
(i) The level of urbanisation is expected to be between 27 and 28 per cent in 1991; and between 31 and 32 per cent in 2001.
(ii) This implies as absolute increase in urban population by about 70 million in the current decade to about 235 millionin 1991 'and a further 80 to 85 million increase to about 320 million by 2001.
3.9 The relationship between urbanisation and economic development is explored in Technical Appendix I. A regression relating the level of urbanisation to national per capita income was found to explain the variation of urbanisation levels between countries quite well. This relationship is used here to predict the urbanisation experience over the next 15 years by assuming certain rates of growth in per capita income and decreases in the proportion of labour force devoted to agriculture. Table 3.3 reports the results of this exercise. It is found that the level of urbanisation predicted is somewhat less than that in Table 3.2 above, but is still similar in broad orders of magnitude. This gives confidence in the projections given above. The somewhat lower predicted levels of urbanisation also indicate that if the pattern of urbanisation projected in Tahle 3.2 is to be consistent with world urbanisation trends, the pace of structural transformation of the economy in terms of both income growth and shift from agriculture will have to be somewhat more rapid than indicated in Table 3.3. 21 W~a~-13!
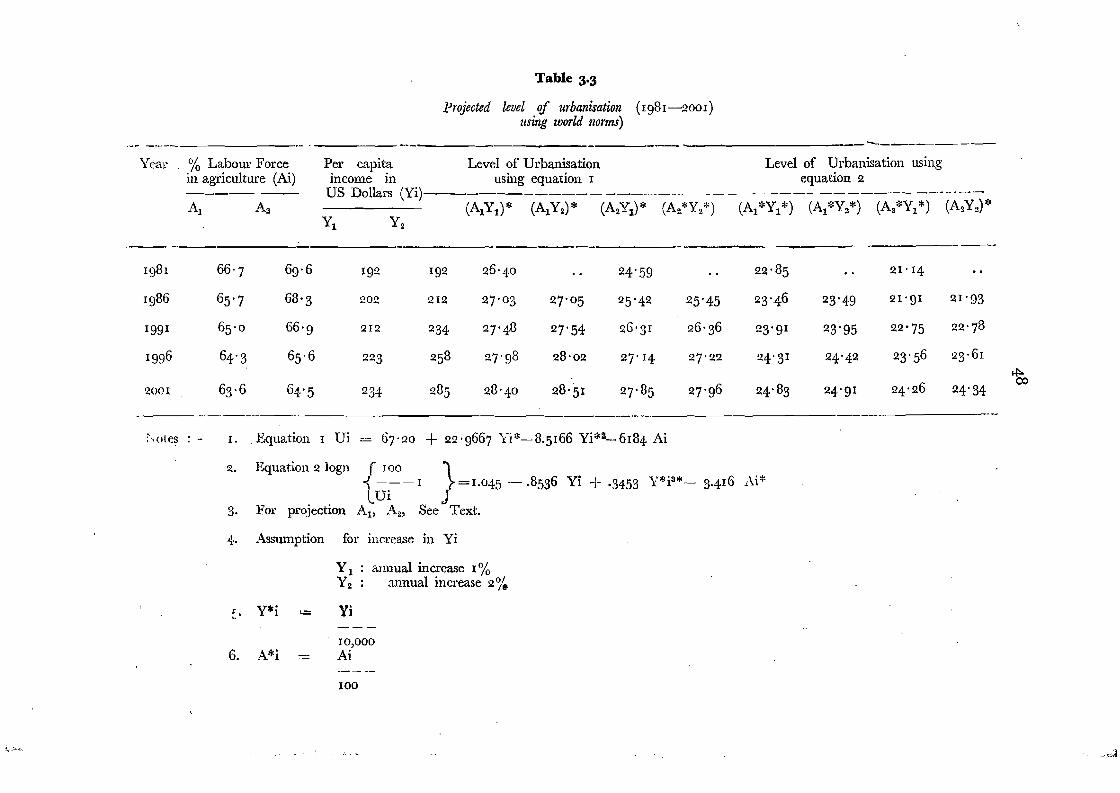
------
Table 3-3
Projected level of urbanisation (1981-2001) using world norms)
-._------Level of Urbanisation Level of Urbanisation using
using equation I equation 2 ..........------------------.---~---"------------_... - .. - ..
(A1Y1)* (A1Y2) * (A2Y1) * (A~*Y2*) (A1*Y1*) (A1*Y2*) (A2*Y1*) (A2Y2)*
192 26'4° , . 24'59 ' , 22'85 ., 21' 14
212 27' °3 27' °5 2 5'42 25'45 23'46 23' 49 21 '91 21 '93
234 27'48 27' 54 26'31 26'36 ~3'91 23' 95 22'75 22'78
258 27'g8 28'02 27' 14 27'22 24 ' 31 24'42 23' 56 23' 61
285 28'4° 28'5 1 27' 85 27'96 24'83 24' 91 24' 26 24' 34 ~ OJ
-------_._--------..
:\()tes : - 1.. Equation 1 Ui = 67'20 + 22'9667 Yi*-8.5166 Yi*a-6184 Ai
2, Equation 2 logn r 100 "' ~ ---I }-=I.045 -,8536 Yi -I- .3153 Y*is*_ 3,416 Ai* lUi J
3· For projection AI' .-'\2' See Text.
4. Assumption for increase in Yi
y 1 : annual increase 1% Y2: annual increase 2%
[.. Y*i '-= Yi
10,000 6. A*i Ai
100
~: ·'0,,\ .,",,,A
-·49
The Disaggregation of Urban Population Projections
The Distribution of Urban Population by GiDJ Size
3.10 It is important to distribute the growth in urban population by city size. The principle of the method used here is similar to that used for projection of urban population as a whole. The pattern of growth of the population in urban settlements above any cut offpoint is assumed to be logistic as a proportion of the total population. One can start with over I million population and predict their population in the future by utilising their growth record in the past decade. Once this is obtained, this predicted population is subtracted from the total population. Using this remainder, the same procedure is applied to the next class size i.e. Class I cities less than I million, and so on", until the rural population is reached. This is called the "Downward Procedure". In the "Upward Procedure", the rural population is first obtained, then the lowest class size (Class VI) and so on, until the metropolitan population is reached..
3. I I This procedure was utilised to predict the distribution of population by Class Size for I97 I, using I95 I and Ig6 I data and for 198I using Ig6I and 1971 data. The results are presented in Table 3.4 which show that the predicted populations are remarkably close to the actual populations. This method was therefore regarded as reliable and projections are made for Ig8I and 2001 which are displayed. in Table 3.4
3.12 It may be noted that the proportion of total urban population, residing -in metropolitan cities is expected to increase only marginally from abo~t 27 per cent-in Ig8I to 28 per cent in IggI but that in Class I. cities as a whole is expected to increase from about 60 per cent in Ig8I to about 64.5 per.cent in Igg1. (These projections include the population added in each Class size due to towns jumping class size from one period to the next). These projections may be regarded as quite firm for the upper class sizes upto about Class III since the towns that comprise these classes already exist. The ·natural population growth of these towns and the expected migration over the next decade, based on patterns largely similar to the '-past, yields these results.
--------------- ----------._------------I. For details of procedure; see Technical Appendix II.
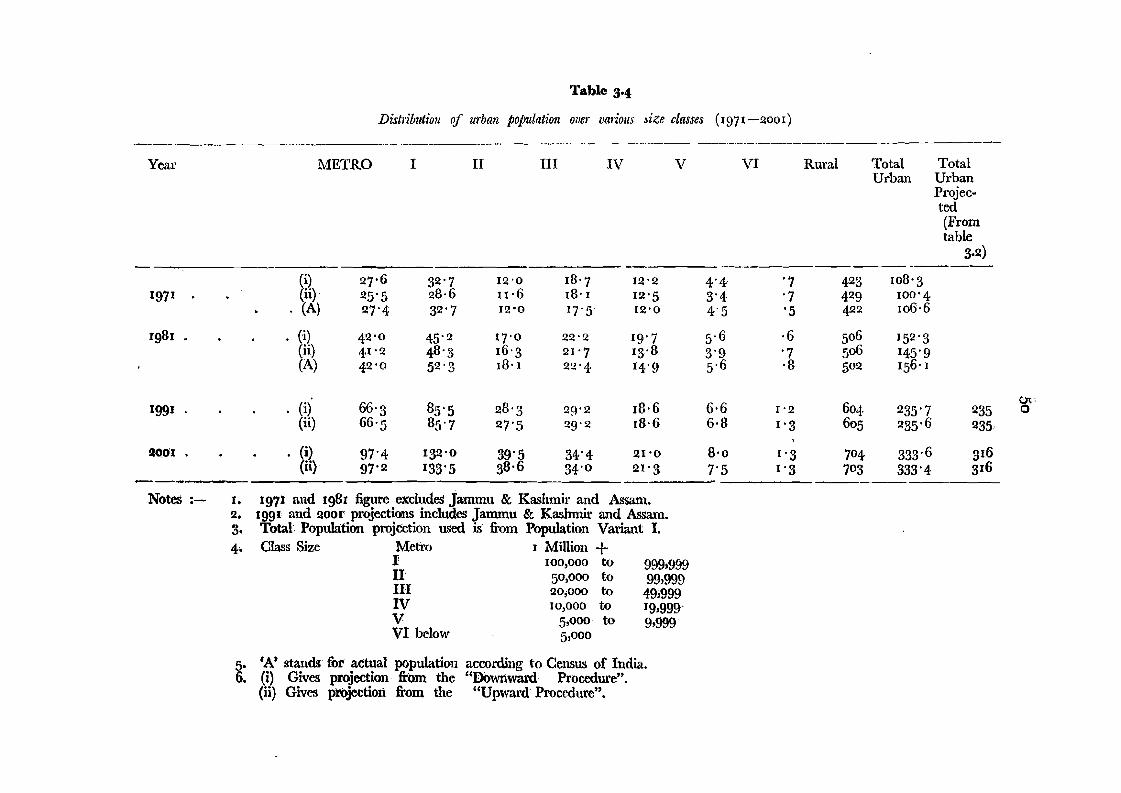
Table 3'4
Distribudou if urban population over various size classes (197 I -200I)
----------- ----------------.----------- ---- --------------.----------------------------------------Year
1971
1981
METRO
(i) 27'6 (ii). 25'S
, (A) 27'4
(i) 42 ' 0 (ii) 41 '2 (A) 42 0
I
32'7 28·6 32'7
45'2 4 8 ' 3 52'3
II
12'0 II'6 12'0
17'0 16'3 18, I
III
18-7 18' I 17'5
22'2 21 '7 22'4
IV
12'2 12'5 12'0
19'7 13'8 14'9
V
4'4 3'4 4'5
5. 6 3'95,6
VI
'7 '7 '5
-6 '7 '8
Rural
4 2 3 4 29 422
506 506 5°2
Total Total Urban Urban
Projected (From table
3·2)------108'3 100'4 106-6
152 ' 3 145'9 156' I
1991
2001 ,
(i) 66'3 (ii) 66,S
(i) 97-4 (ii) 97'2
85'S 28'3 18,629'2 85'7 27'S 29'2 18,6
132 ' 0 39'S 34'4 21 '0
133'5 38'6 34'0 21 '3 --------------------------
Notes: I. 1971 and 1981 figure excludes Jammu & Kashmir and Assam, 2. 1991 and 2001' projections includes Janunu & Kashmir and Assam, 3. Total Population projection used is from Population Variant 1 4.. Class Size Metro 1 Million +
r 100,000 to 999,999 II 50,000 to 99,999 III 20;000 to 49,999 IV 10,000 to 19,999' V 5,000 to 9,999 VI below 5,000
6·6 6·8
8'0
7'5
1'2 1'3
1 'S 1 '3
604 605
7°4 7°3
235'7 235'6
333'6 333'4
235 235
316 316
C:1li-' 0
5. 'A' stands for actual population according to Census of India. 6. (i) Gives projection- from the "DOwnward Procedure",
(ii) Gives projection from the "Upward- Procedure".
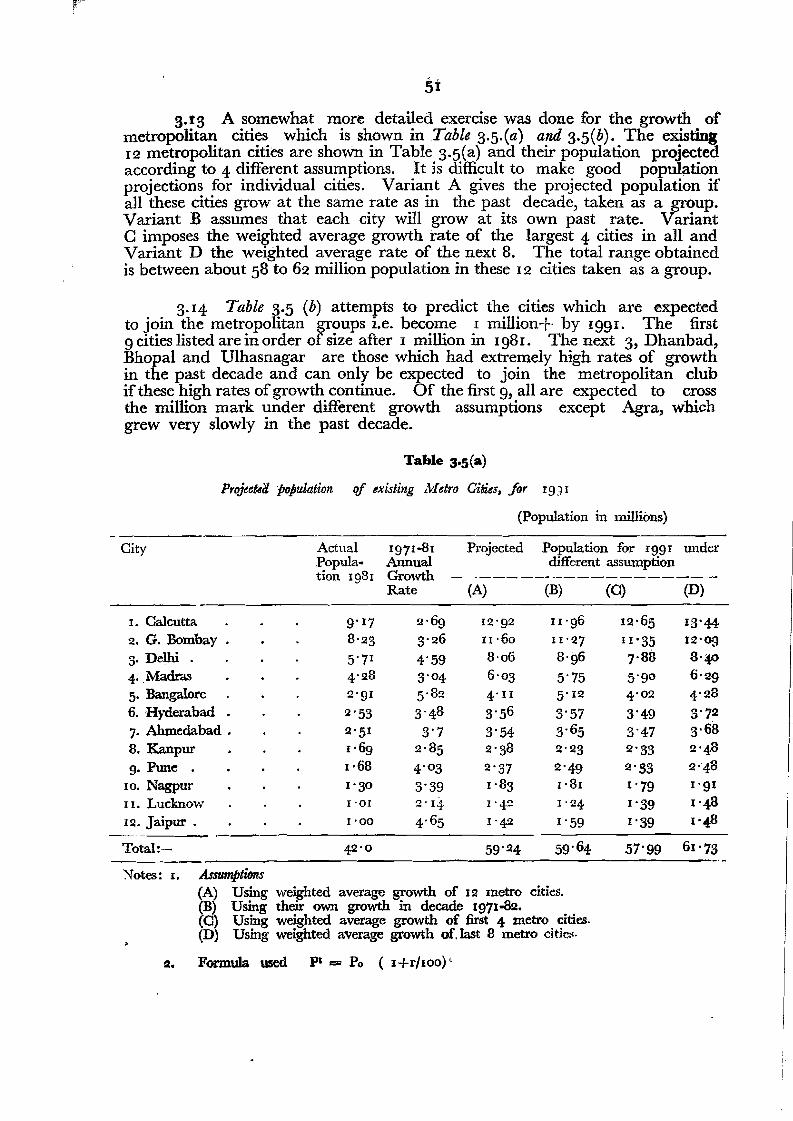
Ai
!!F'.
3.t3 A somewhat more detailed exercise was done for the growth of metropolitan cities which is shown in Table 3.5.(a) and 3.5(h). The existing 12 metropolitan cities are shown in Table 3.s(a) and their population projected according to 4 different assumptions. It is difficult to make good population projections for individual cities. Variant A gives the projected population if all these cities grow at the same rate as in the past decade, taken as a group. Variant B assumes that each city will grow at its own past rate. Variant C imposes the weighted average growth rate of the largest 4 cities in all and Variant D the weighted average rate of the next 8. The total range obtained is between about 58 to 62 million population in these 12 cities taken as a group.
3.14 Table 3.5 (b) attempts to predict the cities which are expected to join the metropolitan groups I.e. become I million-]- by 1991. The first 9 cities listed are in order of size after 1 million in 1981. The next 3, Dhanbad, Bhopal and Ulhasnagar are those which had extremely high rates of growth in the past decade and can only be expected to join the metropolitan club if these high rates ofgrowth continue. Of the first 9, all are expected to cross the million mark under different growth assumptions except Agra, which grew very slowly in the past decade.
Tahle 3.5(a)
Projecud population of existing ,-'vIetro Cities, for 19J1
(Population in millions)
City Actual Population Ig81
1971-81 Annual Growth
Projected Population for 1991 under different assumption
---- --.------------ Rate (A) (B) (0) (D)
I. Calcutta - , 9' 17 2,69 12'92 II "96 12'65 13'442, G. Bombay . · ~h!3 3'26 II ,60 II '27 11'35 12'09 3. Delhi . · 5'71 4'59 8'06 8'96 7-88 8-:(.0
4.. Madras · , 4"28 3'04 6'03 5"75 5'90 6'29 5. Bangalore · 2'91 5,82 4'11 5' 12 4'02 4'28 6. Hyderabad . , 2'53 3'48 3'56 3'57 3'49 3'72 7. Ahmedabad . · , 2'51 3"7 3'54 3-65 3"47 3,68 8. Kanpur · , 1'6g 2,85 2'38 2'23 2'33 2'48 9. Pune . · · 1·68 4'03 2-37 2'49 2"33 2'48
10. Nagpur · · 1'30 3'39 1,83 1,81 1'79 1'91 II. Lucknow 1"01 2' L} 1"42 1'24 1'39 1'48 12. Jaipur , , 1'00 4,65 I"¥ 1"59 1'39 1'48
Total: 42'0 59'24 59'64 57'99 61'73
Notes: I. Assumptions (A) Using weighted average growth of 12 metro cities, (B) Using their own growth in decade 1971-82. (0) Using weighted average growth of first 4 metro cities. (D) Using weighted average growth of.last 8 metro cities.
lit. Formula used pt = Po ( I+r/IOO) f.
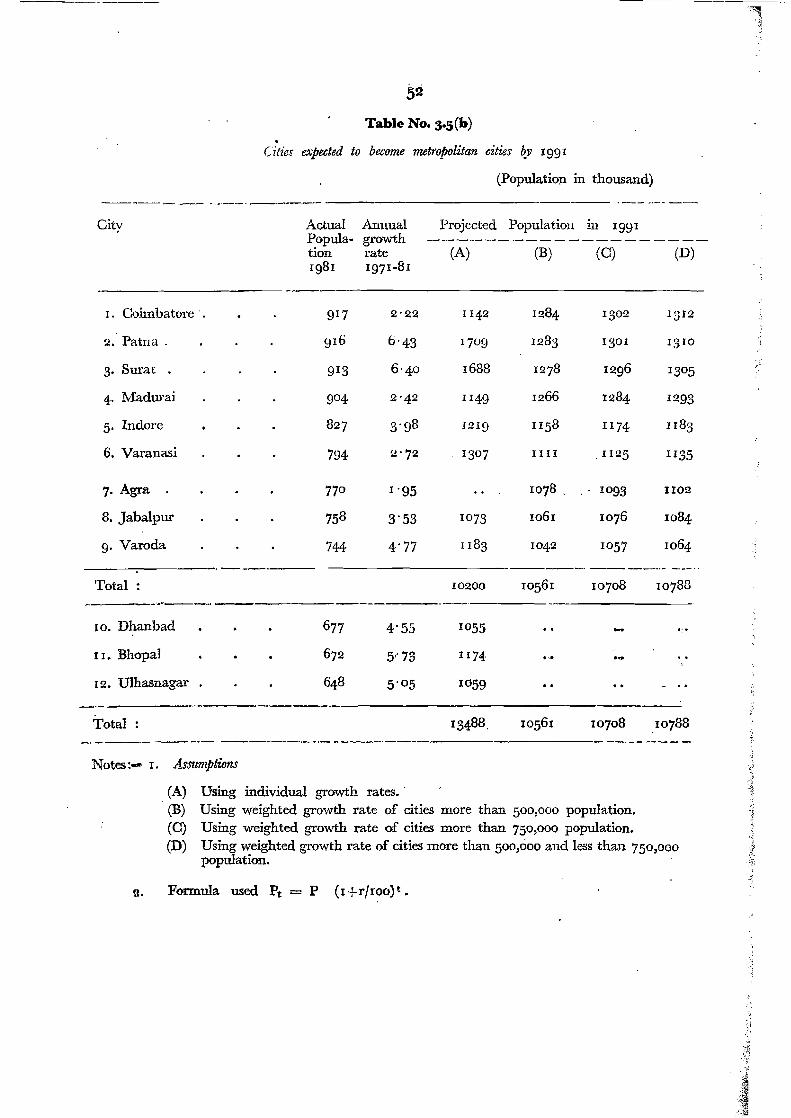
--
"
.~
52 Table No. 3'S(b)
· Cities expected to become metropolitan cities ~JI 1991
(Population in thousand) __----_._- .....-_._------ ._- •••_0
Oity Actual Annual Projected Population 111 1991 Popula- growth ----_._------ ------ ----
tion rate (A) (B) (0) (D) 1981 1971-81
,
I. Coimbatore'. 917 2'22 1142 1284 13°2 1312 ·· 2. Patnu . 916 6'43 17°9 1283 13°1 13IO
3. Surat . 913 6'40 1688 1278 1296 13°5
4. Madurai 2'42 1149 1266 1284 12939°4
5. Indore . 827 3'g8 1219 II58 1174 II83· · 6. Varanasi · · 794 '2'72 1307 I III . 11 25 !I35
7. Agra . 77° 1'95 .. 1078 . 1093 II02· · 8. Jabalpur · · 758 3'53 1073 lOG I 1076 1084
9. Varoda · · 744 4'77 II83 1042 1057 1064 ,--_. ----_._.. .... --...-....------~
Total : 10200 10561 107°8 10788 -----_...._--
10. Dhanbad . . 677 4'55 1°55 .. .- ...· II. Bhopal . . · 672 5"73 1174·
12. Ulhasnagar . · 648 S'05 1°59 '.-----
Total : 13488. 10561 10708 10788 _. ------- ------.-_..- ... _------,--. ---- ------
.I, ,·i.Notest-- I. Assumptions .' )
(A) Using individual growth rates.' J . (B) Using weighted growth rate of cities more than 5°0,°00 population.
\(0) Using weighted growth rate of cities more than 750,000 population. ,.' . .~!
.,,~(D) Using weighted growth rate of cities more than 500,000 and less than 750,000 ..~' ,.population. . ':i', ,
e. Formula used Pt = P (I +r/roo)t •
~h
53
3'15 Adding the total population of the existing 12 metropolitan cities to that ofthe new additions, the range obtained is about 70 to 75 million as compared with 66 million predicted in Table 3.4. This indicates that the projections of Table 3.4 have built into them a certain slowing down of some of the largest cities. If the decline in growth of the largest cities (Calcutta, Bombay, Madras) Continues, this result is quite plausible. If, however,. the largest 2'0-24 cities-continue to grow at their current rates, their total population and, consequently, their share in total urban population, will be higher than that projected in Table 3-4. At any rate, it can be asserted with some confidence that the population in million plus cities is extremely unlikely to be less than 65.0 million in 1991.
3.16 It now remains to project the number of towns in each category. This is given in Table 3.6. The methodology used is to use the pareto distribution to generate the number of towns in each size class (Details are given in Technical Appendix II).
3.17 This method is quite good at predicting the number of towns upto the Class II category, but it tends to under-estimate the number of towns in the lower size classes. This is therefore done by a more crude method for Class III and Class IV. If it is assumed that the average growth rate of urban population in the 1981-1991 decade is about 45 percent and that, as in the past, the growth rate of towns in each size is similar, on average, the number of towns in Class III and Class IV can be predicted by merely examining the number of existing towns which can be expected to cross over into these categories by 1991 by such growth. Thus most towns with 14,000 and above population in 1981 can be expected to cross over 20,000 in 1991 and those between 7,000 and 10,000 can be expected to cross over 10,000 over the same period. Since the number of these towns is large it may be expected that the slower than average growers will be compensated by the fast growers which are not accounted for here-thus yielding broadly similar figures. It is not possible to predict the number of Class V and Class VI towns in a similar manner since they are likely to be subjected to reclassification of villages into towns and vice versa.
The regional Distribution of Urban Population
3.18 It is also useful to disaggregate the expected urban population by region. This is done in Table 3.7. The methodology used is the same as for country-wide projections except that the URGD taken for each region is the same as its own URGD in 1971-81. It turns out that the total urban population predicted by this procedure is about 230 million in 1991 which is quite close to the overall projection. It should be noted that the method used does not ensure consistency with the over-all totals!
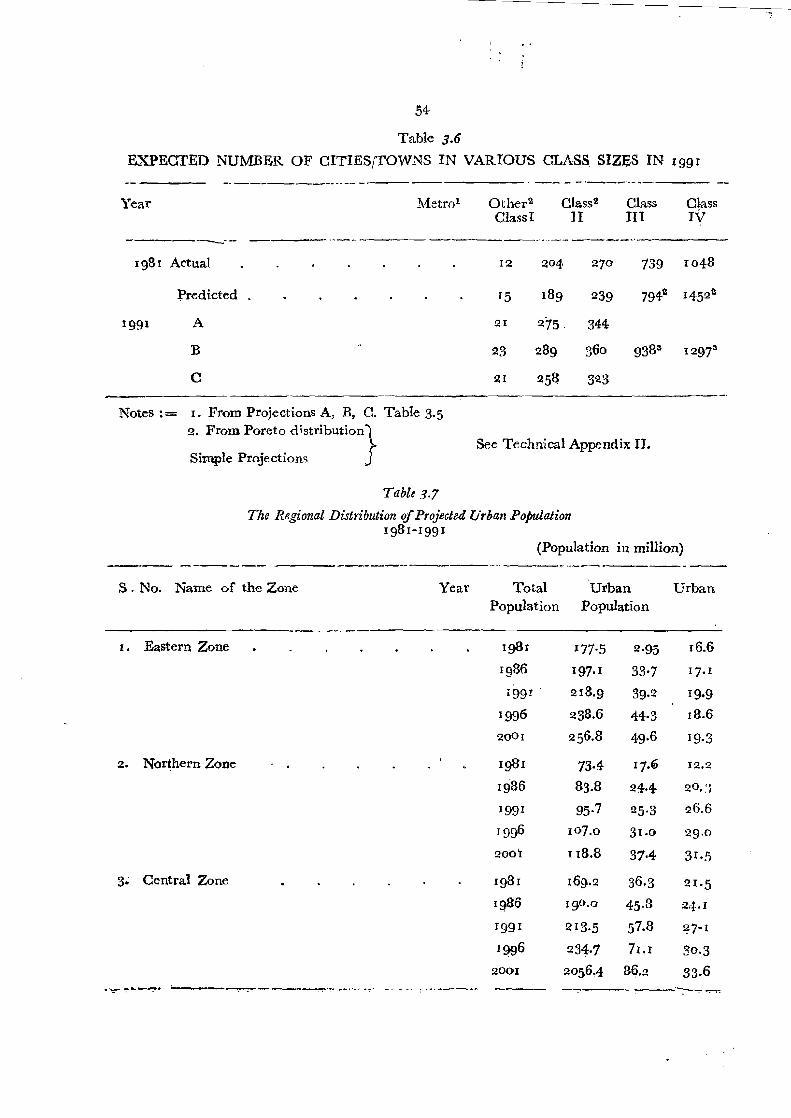
54
Table 3.6
E...XPECTED NUMBER OF CITIESrrOWNS IN VARIOUS CLASS SIZES IN 1991
-. ------.._--- ... _- ---Year Metro- Other2 Class2 Class Class
Class I II III IV .-----_._-- -------- ..__. --------- -'_ ..--- -----~.
1981 Actual 12 204 270 139 1048
Predicted 15 189 239 794-2 1452 2
1991 A 21 275. 344
B 23 289 360 9383 12973
C 21 258 323
Notes: = I. From Projections A, B, C. Table 3.5 2. From Poreto distribution")
j See Technical Appendix II. Simple Projections
Table .1.7
The Regional Distribution qfProjected Urban Population 198 1-199 1
(Population in million) - ------ .. _----------~---------------~._---------
S . No. Name of the Zone Year Total Urban Urban Population Population
I • Eastern Zone IgB1 177·5 2·95 r6.6
1986 197. 1 33·7 17· r
.99 1 218·9 39.2 19·9
1996 233.6 44·3 18.6
2001 256.8 49. 6 19·3
2. Northern Zone Ig81 73·4 17.0 12.2
1986 83.8 24·4 ,,0 tJ _ t.1
199 1 95.7 25·3 26.6
J996 107.0 31.0 29. 0
2001 rr8.8 37·4 31·5
3~ Central Zone 1981 169.2 36·3 21·5
1986 19°·0 45. 3 2,:!-. I
199 1 !H3·5 57.8 ~7-1
1996 234·1 7r.l 30·3
.'~ ~"'_~.lo ,-. "-::.. :--~._ ... :--" .~.. - -. : ...._- 2001 2056.4 36.2 33.6 ---_.~~'";
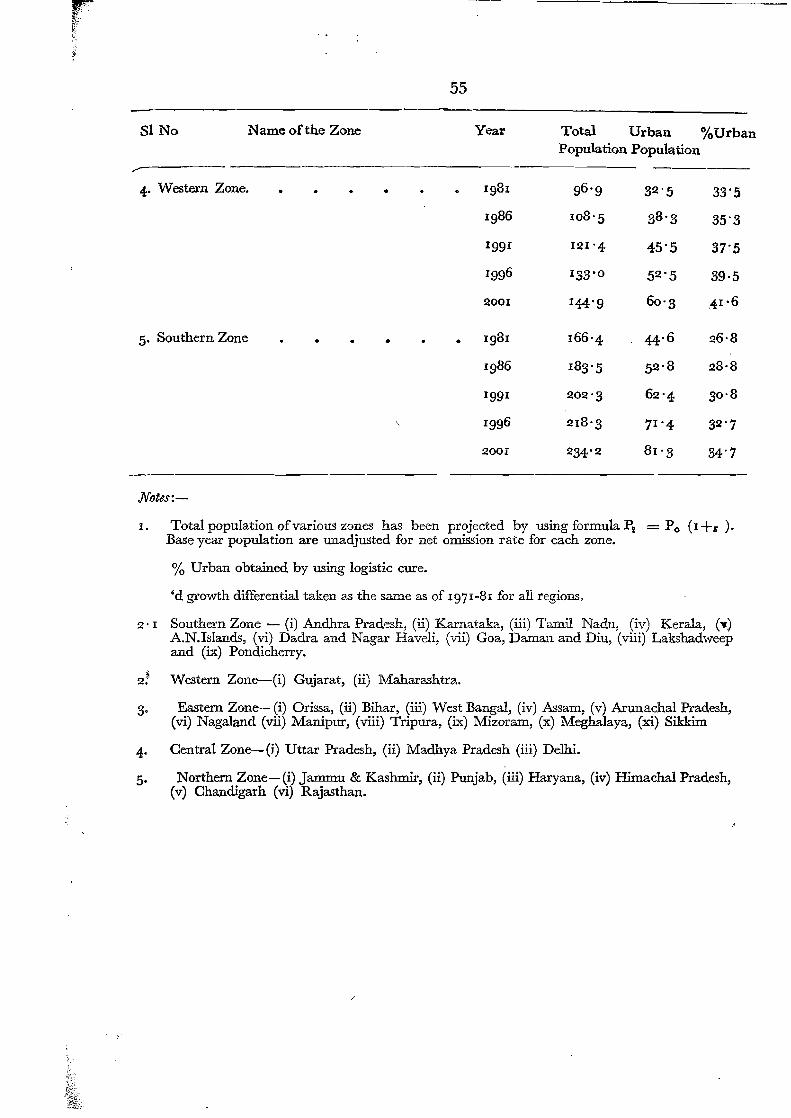
~
~~ .
1.-0,
55
81 No Name of the Zone Year Total Urban %Urban Population Population
.--
4- Western Zone. . . . . . . 1981 96'9 32"5 33'5
1986 108'5 38'3 35"3
1991 121 "4 45'5 37'5
1996 133'° 52'5 39'5
2001 144'9 60'3 .41. 6
5. Southern Zone . . . • . • 1981 166'4 44,6 26,8
1986 183 '5 52 ' 8 28,8
1991 202'3 62'4 30"8
1996 218'3 71 ' 4 32'7
2001 234'2 81 '3 34'7
Notes:
1. Total population ofvarious zones has been projected by using formula PI = Po (I +1' ). Base year population are unadjusted for net omission rate for each zone.
% Urban obtained by using logistic cure.
'd growth differential taken as the same as of 1971-81 for all regions.
2' 1 Southern Zone - (i) Andhra Pradesh, (ii) Karnataka, (iii) Tamil Nadu, (iv) Kerala, (...) A.N.Islands, (vi) Dadra and Nagar Haveli, (vii) Goa, Daman and Diu, (viii) Lakshadweep and (ix) Pondicherry,
2:;; Western Zone-(i) Gujarat, (ii) Maharashtra.
Eastern Zone- (i) Orissa, (ii) Bihar, (iii) West Bangal, (iv) Assam, (v) Arunachal Pradesh,3· (vi) Nagaland (vii) Manipur, (viii) Tripura, (ix) Mizoram, (x) Meghalaya, (xi) Sikkim
Central Zone-(i) Uttar Pradesh, (ii) Madhya Pradesh (iii) Delhi.4
Northern Zone-(i) Jammu & Kashmir, (ii) Punjab, (iii) Haryana, (iv) Himachal Pradesh,5· (v) Chandigarh (vi) Rajasthan.
,.
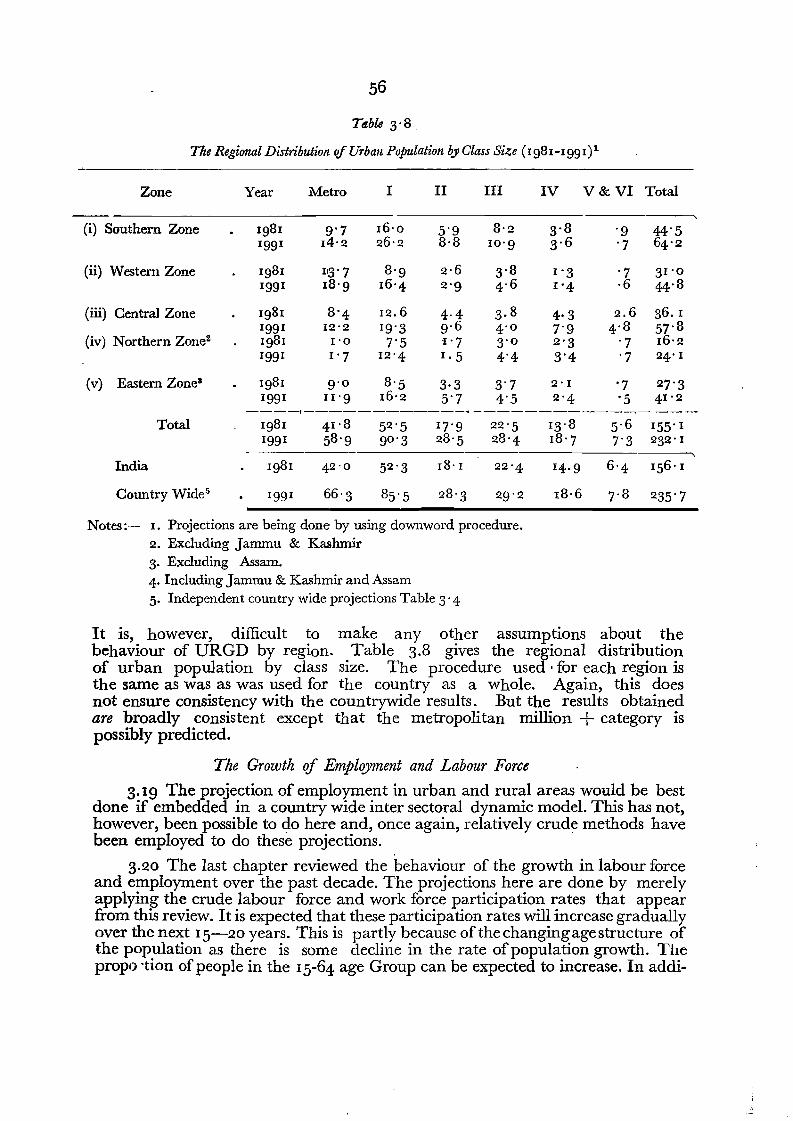
56
Table 3'8.
The Regional Distribution ofUrban Population byClass Size (1981-1991)1
Zone Year Metro I II III IV V & VI Total
------(i) Southern Zone . 1981 1991
9'7 14'2
16'0 26'2
5'9 8'8
8'2 10'9
3,8 3,6
'9 '7
44'S 64'2
(ii) Western Zone 1981 1991
113' 7 18'9
8'9 16'4
2,6 2'9
3,8 4-6
1'3 1'4
'7,6
31'0 44'8
(iii) Central Zone
(iv) Northern Zone"
Ig81 1991 Ig81 1991
8'4 12'2 1'0 I' 7
12.6 19'3 7'5
12'4
4-4 g-6 1'7 1.5
3. 8 4'0 3'0 4'4
4·3 7'9 2'3 3'4
2,6 4,8
'7 '7
36. I 57'8 16'2 24' I
(v) Eastern Zone" . 1981 1991
9'0 II '9
8'5 16'2
3·3 5'7
3-7 4'5
2' I 2'4
'7 'S
27'3 41'2 ----,-----------0-4 ___________---..____
Total 1981 41,8 52'S 17'9 22'S 13,8 5,6 155'1 1991 58'9 gO'3 28,S 28'4 18'7 7-3 232'1
India . 1981 42-0 52'3 18, I . 22'4 14·9 6'4 IS6' I
Country Wide5 . 1991 66'3 85'S 28-3 29'2 18'6 7,8 235'7
Notes:- I. Projections are being done by using downward procedure. 2. Excluding Jammu & Kashmir 3. Excluding Assam. 4. Including Jammu & Kashmir and Assam S. Independent country wide projections Table 3' 4
It is, however, difficult to make any other assumptions about the behaviour of URGD by region. Table 3.8 gives the regional distribution of urban population by class size. The procedure used, for each region is the same as was as was used for the country as a Whole. Again, this does not ensure consistency with the countrywide results. But the results obtained are broadly consistent except that the metropolitan million + category is possibly predicted.
The Growth of Employment and Labour Force
3.19 The projection of employment in urban and rural areas would be best done if embedded in a country wide inter sectoral dynamic model. This has not, however, been possible to do here and, once again, relatively crude methods have been employed to do these projections.
3.20 The last chapter reviewed the behaviour of the growth in labour force and employment over the past decade. The projections here are done by merely applying the crude labour force and work force participation rates that appear from this review. It is expected that these participation rates will increase gradually over the next 15-20 years. This is partly because of the changingagestructure of the population as there is some decline in the rate ofpopulation growth. The propo ,tion of people in the 15-64 age Group can be expected to increase. In addi
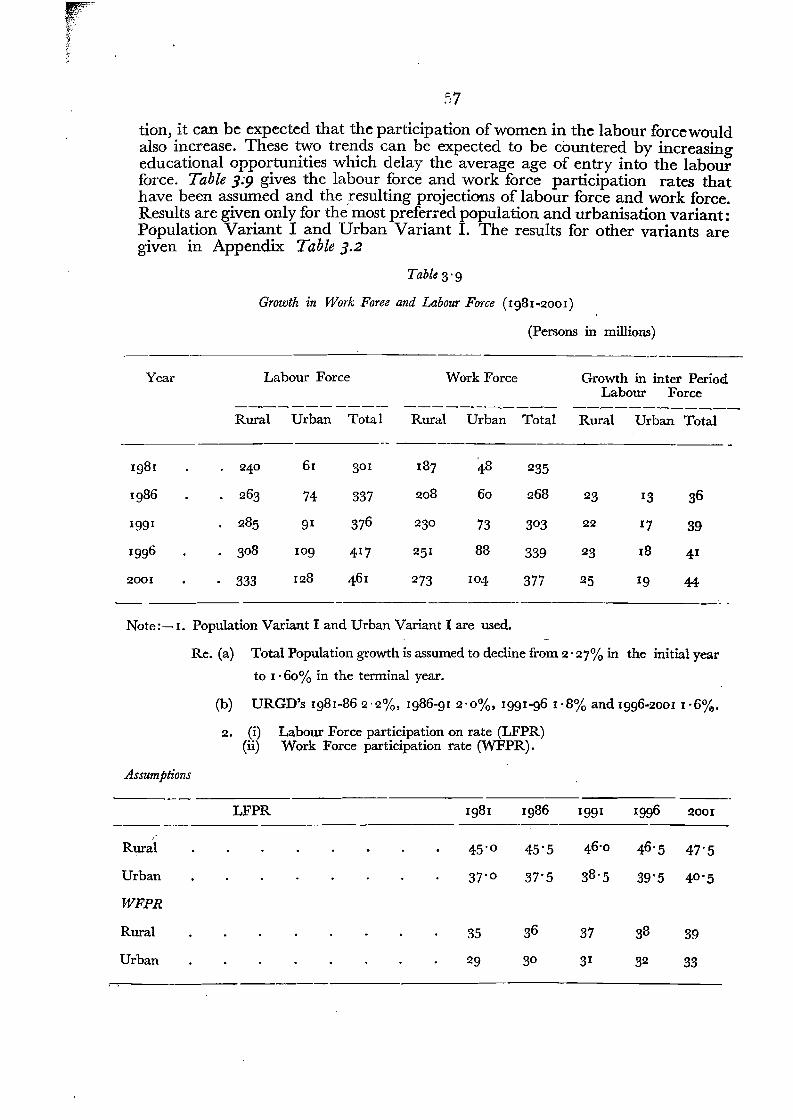
F'g,
1: "
~'7"
tion, it can be expected that the participation of women in the labour forcewould also increase. These two trends can be expected to be countered by increasing educational opportunities which delay the average age of entry into the labour force. Table 3.9 gives the labour force and work force participation rates that have been assumed and the .resulting projections of labour force and work force. Results are given only for the most preferred population and urbanisation variant: Population Variant I and Urban Variant 1. The results for other variants are given in Appendix Table 3.2
Table 3'9
Growth in Work Foree and Labour Force (1981-2001)
(Persons in millions)
-Year Labour Force
--...----~-----Rural Urban Total
Work Force
----.. --;---Rural Urban Total
Growth in inter Period Labour Force
--.----------..-
Rural Urban Total
1981 24° 61 301 187 48 235
1986 263 74 337 208 60 268 23 13 36
1991 285 91 376 23° 73 3°3 22 17 39
1996 . 308 109 417 251 88 339 23 18 41
2001 . . 333 128 461 273 1°4 377 25 19 44
Note:- I. Population Variant I and Urban Variant I are used.
Re. (a) Total Population growth is assumed to decline from 2' 27% in the initial year
to I '60% in the terminal year.
(b) URGD's 1981-862' 2%, 1986-91 2'0%, 1991-96 I '8% and 1996-2001 1,6%.
2. (i) (ii)
Labour Force participation on rate (LFPR) Work Force participation rate (WFPR).
Assumptions
LFPR 1981 1986 1991 1996 2001
, Rural
Urban
45'0
37-0
45'S
37'S
46' 0
38'S
46'S
39'5
47'S
40'5
WFPR
Rural 35 36 37 38 39
Urban 29 3° 31 32 33
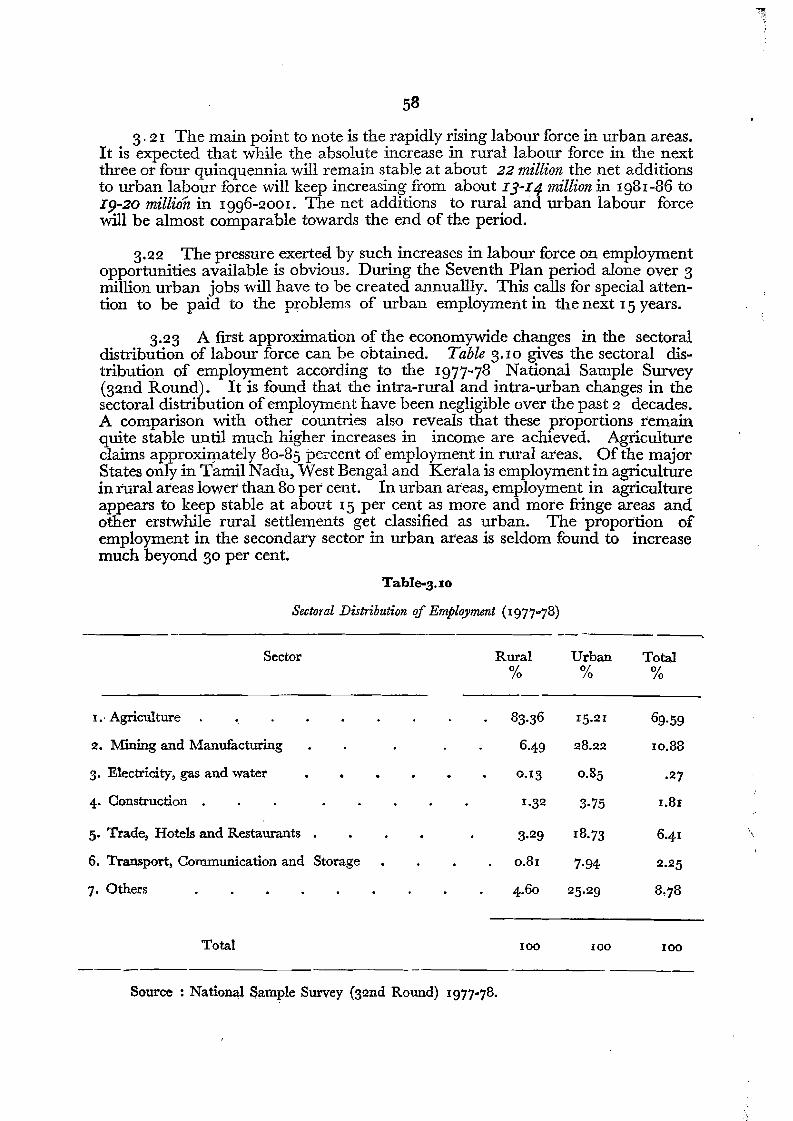
---------------------------
,
58
3.21 The main point to note is the rapidly rising labour force in urban areas. It is expected that while the absolute increase in rural labour force in the next three or four quinquennia will remain stable at about 22 million the net additions to urban labour force will keep increasing from about I3-I4 million in 1981-86 to I9-20 million in 1996-2001. The net additions to rural arid urban labour force will be almost comparable towards the end of the period.
3.2 2 The pressure exerted by such increases in labour force on employment opportunities available is obvious. During the Seventh Plan period alone over 3 million urban jobs will have to be created annuallly. This calls for special attention to be paid to the problems of urban employment in the next 15 years.
3.23 A first approximation of the economywide changes in the sectoral distribution of labour force can be obtained. Table 3.10 gives the sectoral distribution of employment according to the 1977-78 National Sample Survey (32nd Round). It is found that the intra-rural and intra-urban changes in the sectoral distribution of employment have been negligible over the past 2 decades. A comparison with other countries also reveals that these proportions remain quite stable until much higher increases in income are achieved. Agriculture claims approximately 80-85 percent of employment in rural areas. Of the major States only inTamil Nadu, West Bengal and Kerala is employment in agriculture in rural areas lower than 80 per cent. In urban areas, employment in agriculture appears to keep stable at about 15 per cent as more and more fringe areas and other erstwhile rural settlements get classified as urban. The proportion of employment in the secondary sector in urban areas is seldom found to increase much beyond 30 per cent,
Table-3· I O
Sectoral Distribution of Employment (1977-78)
Sector Rural Urban Total % % %
I.' Agriculture 83.36 15·21 69·59
2. Mining and Manufacturing 6·49 28.22 10.88
3. Electricity, gas and water 0.13 0.85 .27
4. Construction . 1.32 3·75 1.81
5. Trade" Hotels and Restaurants 3.29 18·73 6.41 \
6. Transport, Communication and Storage 0.81 2.257·94
7. Others 4.60 25.2 9 8.78
Total 100 100 100
Source: National Sample Survey (32nd Round) 1977-78.
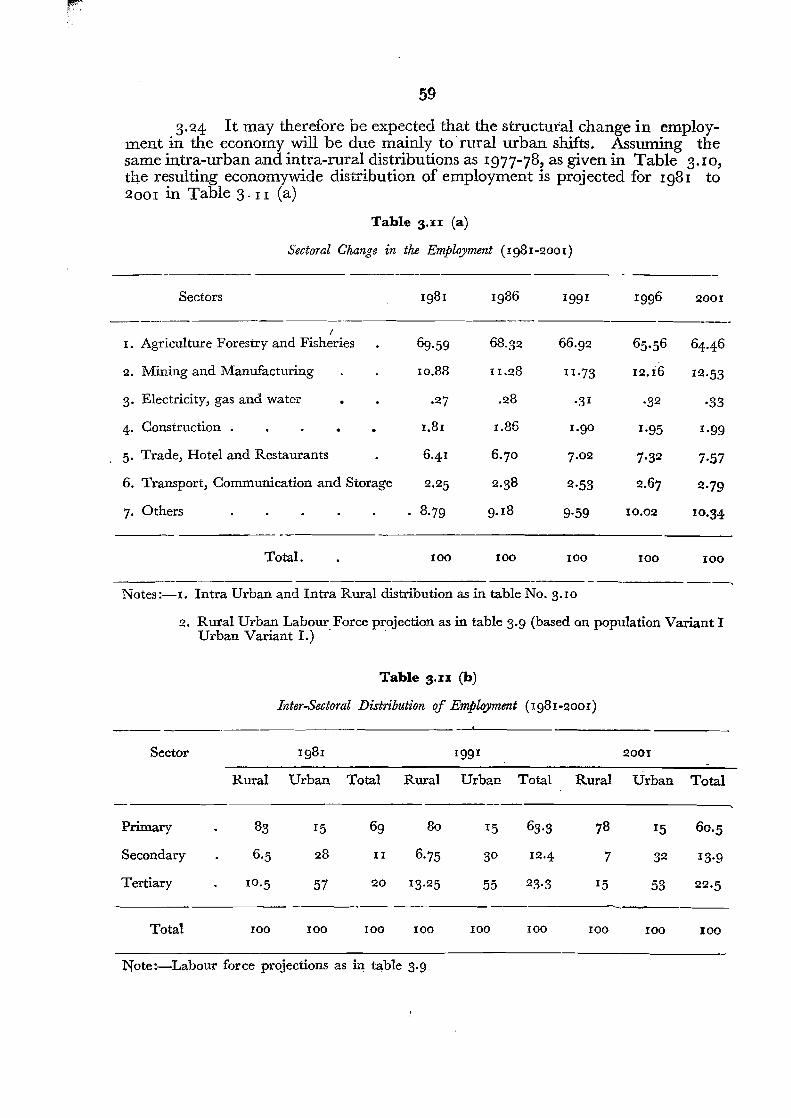
------- ------
---
F'~
59
3.24 It may therefore be expected that the structural change in employment in the economy will be due mainly to rural urban shifts. Assumirig the same intra-urban and intra-rural distributions as 1977-78, as given in Table 3.10, the resulting economywide distribution of employment is projected for 1981 to 2001 in Table 3·11 (a)
Table 3.u (a)
Sectoral Change in the Employment (1981-2001)
1991 1996 2001
66,9 2 65'56 64.46
11.73 12.16 12·53
.3 1 .32 ·33
1.90 1.95 1·99
7.02 7·32 7·57
2·53 2.67 2·79
10.029·59 10·34
100 100 100
.-----------------.--- - --- --~
Notes:-I. Intra Urban and Intra Rural distribution as in table No. 3.10
2. Rural Urban Labour Force projection as in table 3.9 (based on population Variant I Urban Variant L) . .
Table s.n (b)
Inter-Sectoral Distribution of Employment (198I-200 I)
--
Sector 1981 1991 2001
Rural Urban Total Rural Urban Total Rural Urban Total
Primary . 83 15 69 80 15 63·3 78 15 60·5
Secondary 6,5 28 II 6·75 30 12·4 7 32 13·9
Tertiary 10·5 57 20 13.25 55 23·3 15 53 22·5 _.- -
Total 100 100 100 100 100 100 100 100 100
Note s-i-Labour force projections as in table 3.9
60
Employment in agriculture (including forestry and fisheries) is found to decline very gradually from just under 70 percent in 1981 to about 64-65 percent by 2001. Although this change seems very minor it should be noted that in the Indian historical context such a shift will constitute a major change since this proportion has remained largely stable since th e beginning of the century. Appendix Table 3.3 gives the absolute sector distribution of labour force for 1981-2001.
3.25 The implication of minor changes in the intra-rural and intraurban distribution may also be noted. If the share of agriculture in the rural labour force is assumed to decline from the current 83 per cent to 78 percent by 2001 (with corresponding increases in the Secondary and Tertiary Sector) and the share of manufacturing in urban areas increases to 32 percent, the overall agriculture share will decline to about 60 percent. This scenario is regarded as somewhat unlikely since even the more advanced states do not at present show any systematic decline in the share of 'agricultural employment in rural areas. A 60 percent share of agriculture in overall employment can therefore be regarded as the outer limit to its decline by 2001. Table 3.II (b) gives these results. '
The Growth if Urban Income
3.26 The last chapter had shown the relatively rapid increases in urban incomes over the last 3 decades leading to a rise in the ratio of urban and rural per capita incomes. Once again, it should be emphasised that these estimates of urban and rural incomes are very crude because of the availability of direct data in the national accounts statistics. This section attempts to project the growth of urban and rural incomes, given that the growth in population and labour force has already been projected.
3.27 Table 3.12 gives the changing structure of the Indian economy as it is expected to grow over the next decade or so. The figures given take account of the revised targets for 1984-85 as given in the Sixth Plan Mid Term Appraisal of the Planning Commission. Further projections to 1989-90 and 1994~95 are done on the basis of the original perspective projections for each sector in the Sixth Plan. As in the past the share of agriculture continues to decline quite rapidly: this is when the assumed output growth is 3.75 percent a year~ from 1984~85 to 1994-95 which is higher than the trend growth achieved iii the last 3 decades. The growth rates assumed for the othersectors are also on the optimistic side: the changing proportions are then quite 'realistic.
3.28 It is difficult to project urban product or incomes from these data. A first approximation can, however, be made. We have already derived the urban and rural sectoral distributions of the labour force (given in Appendix Table A 3.4). We now assume that the ratio of urban and rural per worker productivity remains constant as calculated by the C.S.O. for 1970-71 (Appendix Table A 3.6). These are not unrealistic ratios : it is unlikely that they would move in favour of rural areas in the foreseeable future. The urban share of output is then calculated for each sector given all the above information and this is given in Table 3.13. The share of urban output in national gross output is projected to rise from. about 47 percent! in 198o~81 to 51 percent in 1984-85,
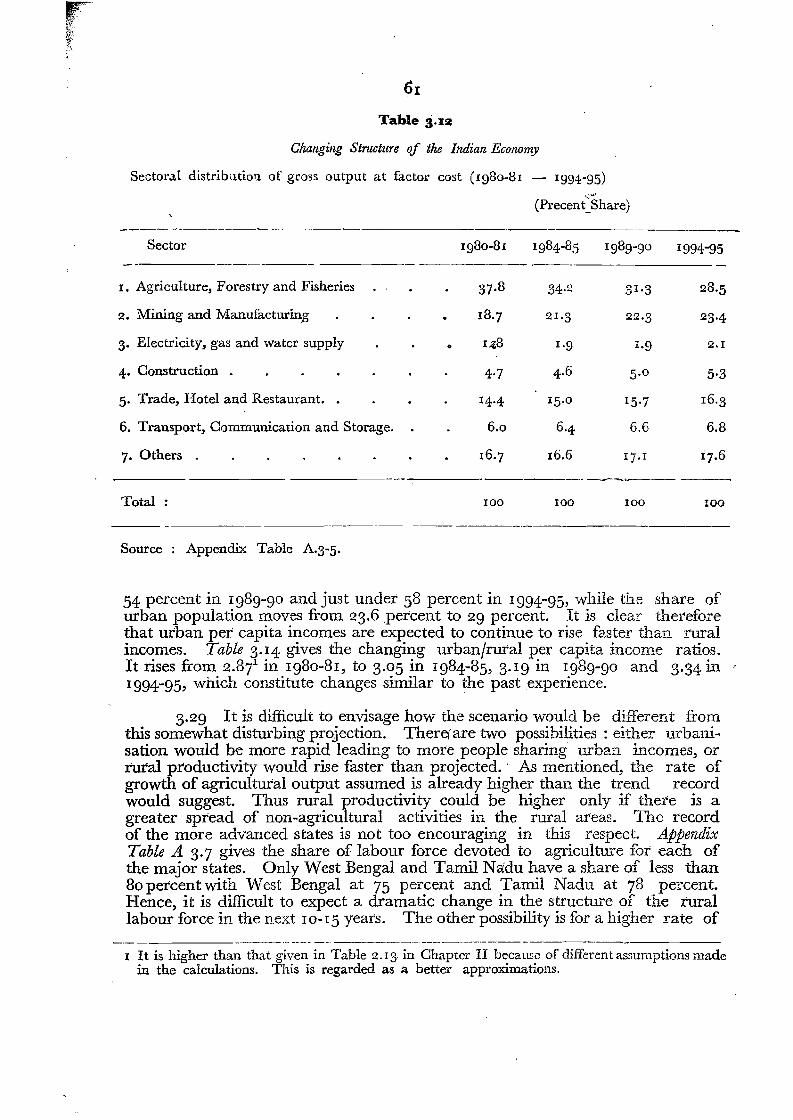
..".'Ie ,,~l·~;
t{
th
Table 3.J:2
Changing Structure of the Indian Economy
Sectora.l distribution of gross output at factor cost (lg80-81 1994-95) I,.<.l.~
(PrecentShare)
._Sector 1980-81 1984-85 I 989-go 1994-95
._------------_. .- ..
I. Agriculture, Forestry and Fisheries 37.8 34.2 31.3 28,5
2. Mining and Manufacturing r8·7 21.3 22·3 23-4
3. Electricity, gas and water supply 0 14:8 1.9 1·9 2.1
4. Construction . 4·7 4.6 5.0 5·3
5. Trade, Hotel and Restaurant. . 14·4 15.0 15·7 16,3
6. Transport, Communication and Storage. 6.0 6-4 6.6 6.8
7. Others 16,7 16.6 17. 1 17.6
--- -...---~------
Total 100 100 100 IOO
Source : Appendix Table A.3-5.
54 percent in I989-90 and just under 58 percent in I994-95, while the share of urban population moves from 23.6 .percent to 29 percent. It is clear therefore that urban per capita incomes are expected to continue to rise faster than rural incomes. Table 3.I4 gives the changing urban/rural per capita income ratios. It rises from 2.8i in I980-8I, to 3.05 in I984-85, 3. I9 in 1989-90 and 3.34 in ' 1994-95, which constitute changes similar to the past experience.
3.29 It is difficult to envisage how the scenario would be different from this somewhat disturbing projection. There/are two possibilities: either urbanisation would be more rapid leading to more people sharing urban incomes, or rural productivity would rise faster than projected.' As mentioned, L'J.e rate of growth of agricultural output assumed is already higher than the trend record would suggest. Thus rural productivity could be higher only if there is a greater spread of non-agricultural activities in the rural areas. The record of the more advanced states is not too encouraging in this respect. Appendix Table A 3.7 gives the share of labour force devoted to agriculture for each of the major states. Only West Bengal and Tamil Nadu have a share of less than 80 percent with West Bengal at 75 percent and Tamil Nadu at 78 percent. Hence, it is difficult to expect a dramatic change in the structure of the rural labour force in the next IO-I5 years. The other possibility is for a higher rate of
----- 00 - _". • ••_._•• _
1 It is higher than that given in Table 2.13 in Chapter II because of different assumptions made in the calculations. This is regarded as a better approximations.
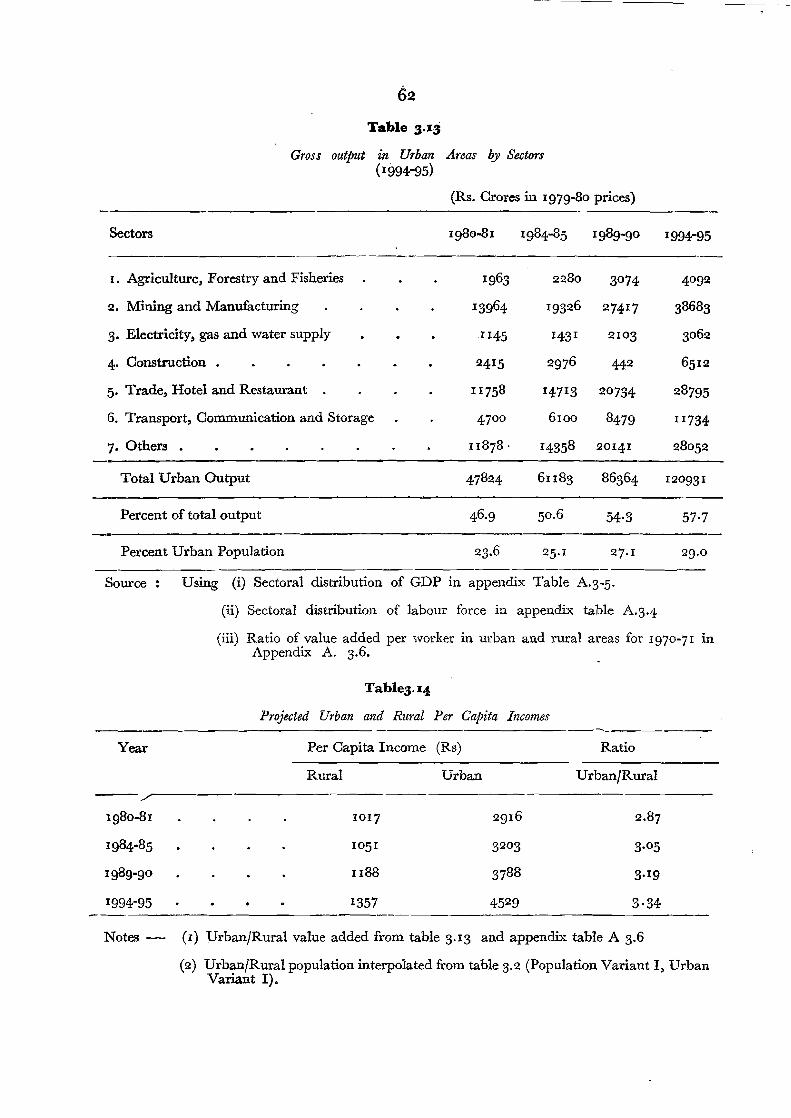
62 Table 3.13
Gross output in Urban Areas by Sectors (1994-95)
(Rs, Crores in 1979-80 prices)
Sectors 1980-81 1984-85 1989-90 1994-95
I. Agriculture, Forestry and Fisheries
2. Mining and Manufacturing . 3. Electricity, gas and water supply . 4. Construction . . . . . 5. Trade, Hotel and Restaurant . 6. Transport, Communication and Storage
7. Others . . . . . -
Total Urban Output
. · · · · ·
. . . . .
1963
13964
1145
2415
11758
47°0
II878·
47824
2280
19326
1431
2976
14713
6100
14358
61183
3°74 4°92
27417 38683
21°3 3062
442 6512
2°734 28795
8479 11734
2014 1 28052
86364 12°931
Percent of total output 46.9 50.6 54·3 57·7
Percent Urban Population 23.6 25. 1 27. 1 29.0
Source : Using (i) Sectoral distribution
(ii) Sectoral distribution
of GDP
of labour
in append
force in
ix Table A. 3-5.
appendix table A.3.4
(iii) Ratio of value added per worker in urban and rural areas for 1970-71 in Appendix A. 3.6.
Table3·14
Projected Urban and Rural Per Capita Incomes ~---------
Year Per Capita Income (Rs) Ratio
Rural Urban Urban/Rural ---/...-----_._--~--_._---
1980-81 1017 2916 2.87
1984-85 1051 32°3 3.05
1989-9 0 u88 3788 3.19
1994-95 1357 4529 3·34
Notes - (I) Urban/Rural value added from table 3.13 and appendix table A 3.6
(2) Urban/Rural population interpolated from table 3.2 (Population Variant I, Urban Variant I).
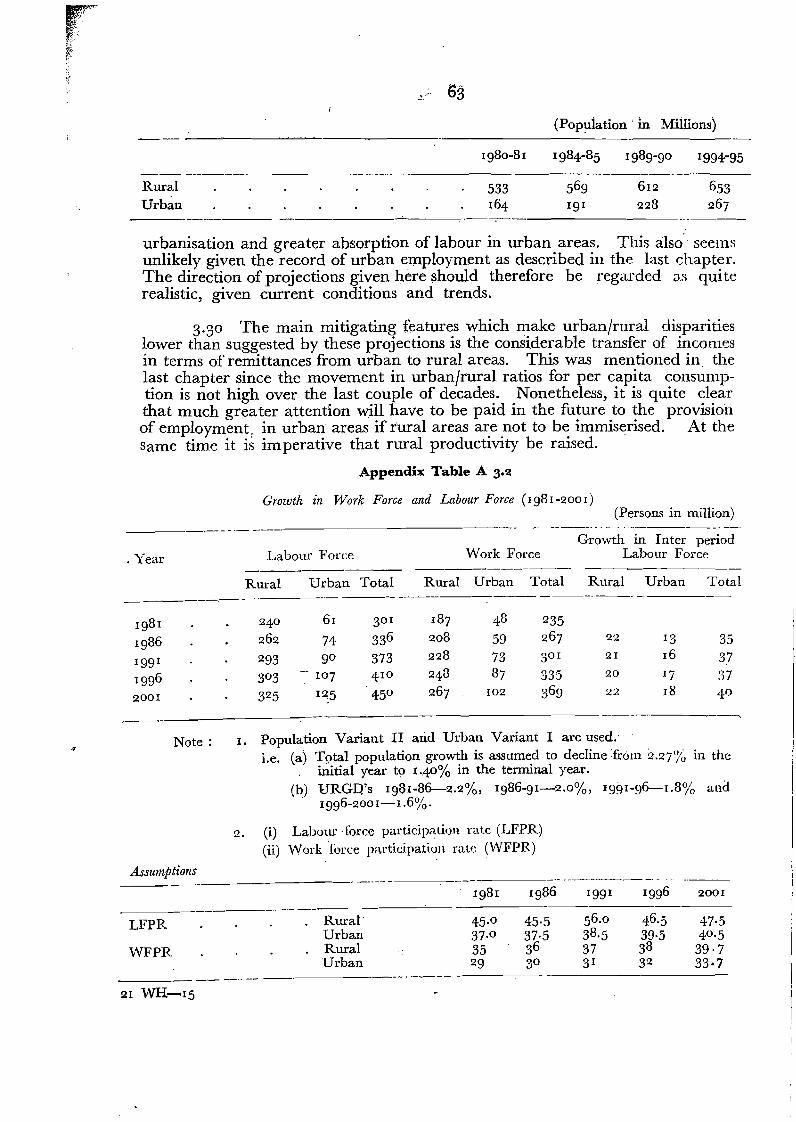
...... 63
(Population' in Millions)-_._1980-81 1984-85 1989-90 1994-95
._------- ----... --..... _---_.Rural 533 569 612 653 Urban 164 191 228 2 67
,------------...---
urbanisation and greater absorption of labour in urban areas. This also' seems unlikely given the record of urban employment as described in the last chapter. The direction of projections given here should therefore be regarded as quite realistic, given current conditions and trends.
3.30 The main mitigating features which make urban/rural disparities lower than suggested by these projections is the considerable transfer of incomes in terms of remittances from urban to rural areas. This was mentioned in the last chapter since the movement in urban/rural ratios for per capita consumption is not high over the last couple of decades. Nonetheless, it is quite clear that much greater attention will have to be paid in the future to the provision of employment, in urban areas if rural areas are not to be immiserised. At the Same time it is imperative that rural productivity be raised.
Appendix Table A 3.2
Growth in Work Force and Labour Force (1981-2001) (Persons in million)
.- - - -- ---_..------------ Growth in Inter period
Labour Force Work Force Labour Force . Year
Rural Urban Total Rural Urban Total Rural Urban Total -- -------------- -------------------.._--- -----
1981 24° 61 3°1 187 48 235
1986 262 74 336 208 59 267 22 13 35
1991 293 9° 373 228 73 3°1 21 16 37 .~. 107 410 248 87 335 20 17 371996 3°3
267 102 369 22 182001 325 1~5 45° 4°
I. Population Variant II arid Urban Variant I are used.'Note: q
i.e, (a) Total population growth is assumed to decline from 2.27(% in the initial year to 1.40% in the terminal year.
(b) URGO's 1931-86-2.2%, 1986-91-2.°%, 1991-96-1.8% and . 1996-2001-1.6%.
2. (i) Labour-force participation rate (LFPR) (ii) Work force participation rate (WFPR)
Assumptions -- . - ...
2001 ------------ ------,-- -----------
47·5 40.5
39·7 33·7
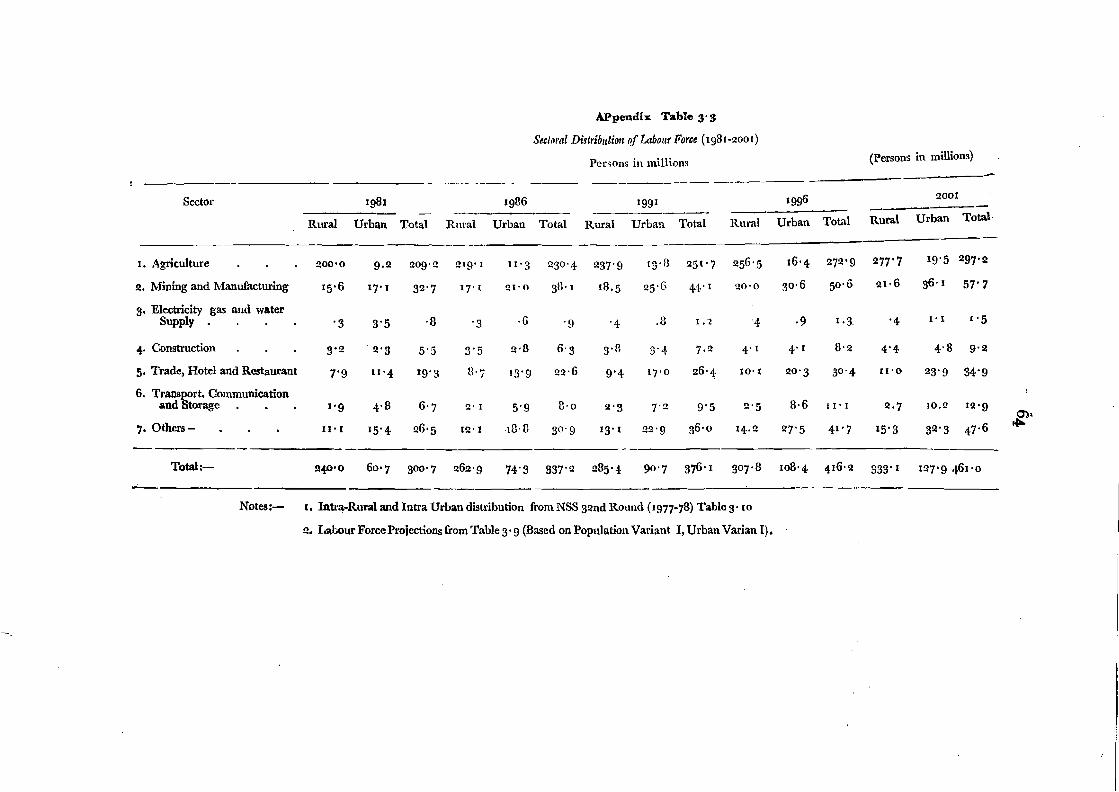
APpendix Table 3'3
Sec/oml Distribution qfLclbour Force (1981-2001)
Persons in millions (Persons in millions)
_ .._...._-- -.-._--
Sector
Rural
Ig81
Urban -
Total Rural
1986
Urban Total
1991 ----_._-Rural Urban Total Rural
1996
Urban Total -Rural
2001
Urban Total·
----------------
1. Agriculture !lOO'O 9,2 2°9' 2 219' I 1I'3 23°'4 237'9 13,H 251 ' 7 256'5 16'4 272'9 277'7 19'5 297'2
2, Mining and Manufacturing 15'6 17'1 32'7 17' I 21'0 38' J 18,5 25°6 44'1 20'0 30'6 50'6 21'6 36'1 57'7
3, Electricity gas and water Supply , " '3 3'5 '8 ,n., ,6 '9 '4 ,8 1, 'l '4 ,9 1.3. '4 1'1 I'5
4. Construction 3'2 . 2'3 5'5 3'5 2,8 6'3 3,H 3"4 7,2 4' I 4-' I 8'2 4'4 4'8 9'2
5, Trade, Hotel and Restaurant 7'9 11'4 19'3 g'7 13'9 22'6 9'4 17'0 26'4: 10'1 ~0'3 3°'4 lI'O 23'9 34'9
6. Transport, Communicationand Storage, , ,
,. Others , . ,
1'9
11'1
4,8
15'4
6'7
26'5
2' I
12' 1
5'9
I!HI
8'0
3°'9
2'3
13' I
7'2
22'9
9'5
36'0
2'5
14,2
8,6
27'5
II'I
41'7
2,7
15'3
10,2
32'3
12'9
47'6 0'),
I{lo
- . --Total: 240'0 60'7 3°0'7 262'9 74'3 337'2 285' 4 90'7 376, I 3°7'8 108'4 416'2 333' 1 127'9 t!6l'o
""-- - ~ .- ----~.-----Notes: I. Intra-Rural and Intra Urban distribution fromNSS 32nd Round (1977-78) Table 3' 10
2. Labour Force Projectionsfrom Table 3' 9 (Based on Population Variant I, Urban Varian I).
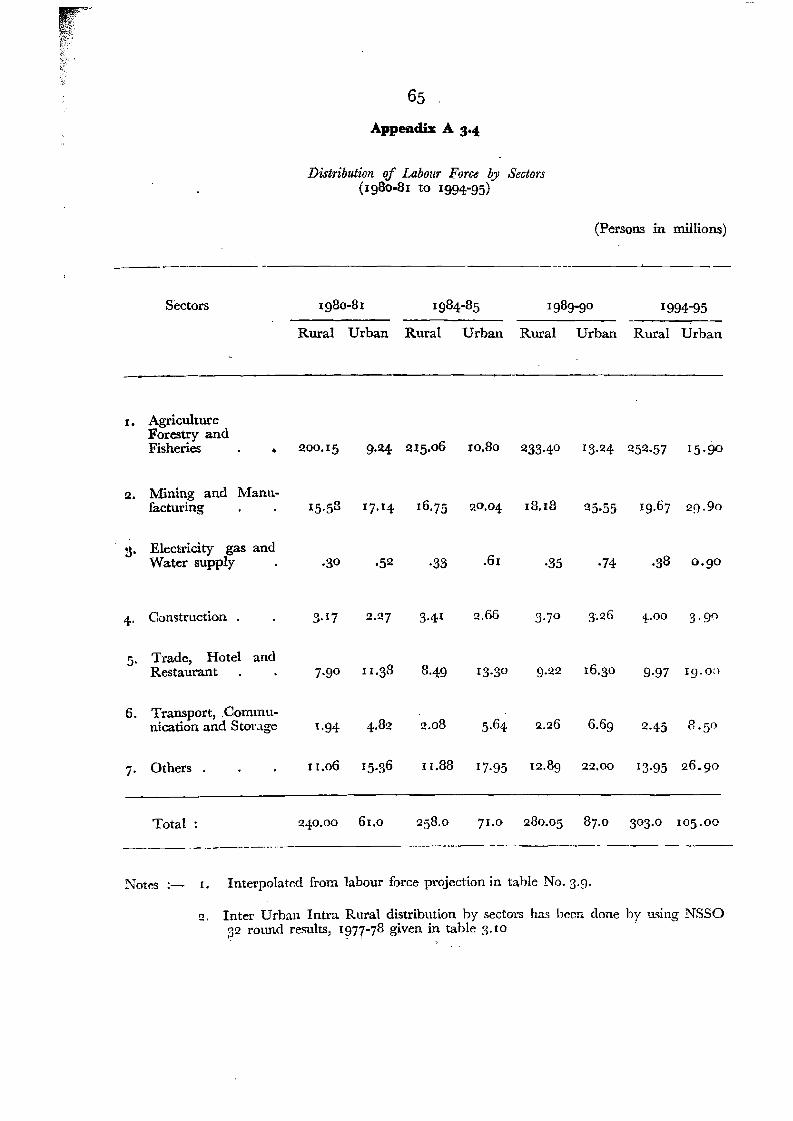
65 .
Appendix A 3-4
Distribution of Labour Force by Sectors (1980-81 to 1994-95)
(Persons in millions)
Sectors 1980-81 1984-85 1989-90 1994-95
Rural Urban Rural Urban Rural Urban Rural Urban
I. Agriculture Forestry and Fisheries • 200.15 9.24 215.06 10.80 233·4° 13.24 252 .57 15'go
2. Mining and Manufacturing 15.58 17.14 16·75 20.° 4 18.18 25·55 19.67 20·90
j. Electricity gas and Water supply .30 .52 ·33 .61 ·35 ·74 .38 0.90
Construction . 3. 17 2.27 g·4 1 2.66 3.70 3.26 +00 3.904·
Trade, Hotel and5· Restaurant . 7.90 II.gS 8.49 13.30 9.22 16.30 9·97 19. 0:)
6. Transport, .Communication and Storage 1.94 4.82 2.08 5.64- 2.26 6.69 2·4-5 fl.so
Others II.o6 15.36 11.88 17·95 12.89 22.00 13·95 26.907·
Total : 24°.00 61.0 258.0 71.0 280·°5 87.0 3°3.0 1°5.00
----.- ..-. -_.. ._-_---~~-.
._--.--.~~
Notes :- I. Interpolated from labour force projection in table No. 3.9'
2. Inter Urban Intra Rural distribution by sectors has been done by using NSSQ ~2 round results, I ~77-78 given in table 3. I 0
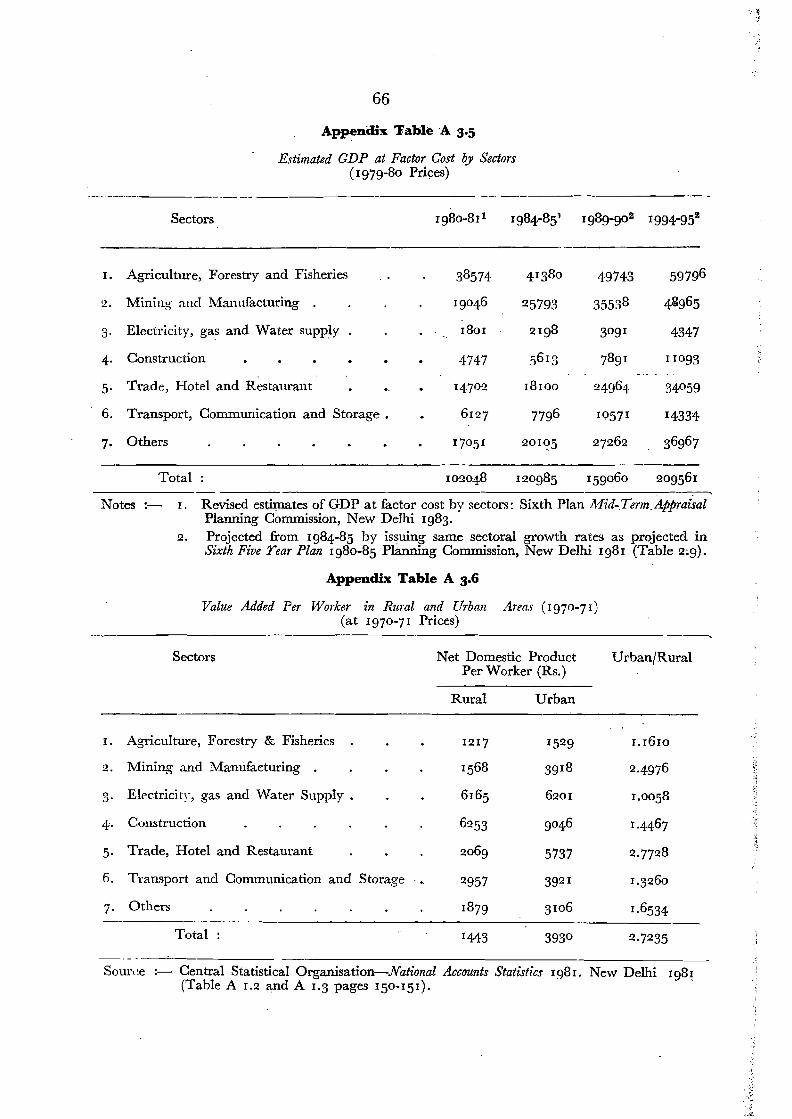
---
66
Appendix Table A 3.5
Estimated GDP at Factor Cost by Sectors (1979-80 Prices)
Sectors 1980-811 1984-851 1989-902 1994-952
I. Agriculture, Forestry and Fisheries 38574 4 1380 49743 59796
2. Mini llg and Manufacturing 19046 25793 35538 4lil965
0 .)' Electricity, gas and Water supply . · 1801 21g8 3°91 4347
4· Construction . . . · · · 4747 ;)613 789 1 11093
5· Trade, Hotel and Restaurant · .. · 147°2 l8TOO 24964 34°59
6. Transport, Communication and Storage • · 6127 7796 19571 14334
7· Others . . · · · 17°51 2010.5 27262 36967
Total: 102048 120985 159060 209561 ~
Notes :- I. Revised estimates of GDP at factor cost by sectors: Sixth Plan Mid-TermAppraisal Planning Commission, New Delhi 1983.
2. Projected from 1984-85 by issuing same sectoral growth rates as projected in Sixth Five rear Plan 1980-85 Planning Commission, New Delhi 1981 (Table 2;9).
Appendix Table A 3.6
Value Added Per Worker in Rural and Urban Areas (197°-71) (at 197°-71 Prices)
.._------------------------~
Sectors Net Domestic Product Urban/Rural Per Worker (Rs.)
Rural Urban
I. Agriculture, Forestry & Fisheries · . 1217 1529 1.1610
2. Mining and Manufacturing · 1568 3918 2·4976
3· Electrici ty gas and Water Supply. · . 6165 6201 1.0058
4· Construction 6253 9046 1.4467
5· Trade, Hotel and Restaurant · 2069 5737 2·7728
6. Transport and Communication and Storage ... 2957 3921 1.3260
7· Others
Total:
1879
1443
3106
393°
1.6534 ._----
2.7235 .:
Source :- Central Statistical Organisation-National Accounts Statistics 1981. New Delhi (Table A 1.2 and A 1.3 pages 150-151).
198~
,.
,.j';
....:5 .>~
~l
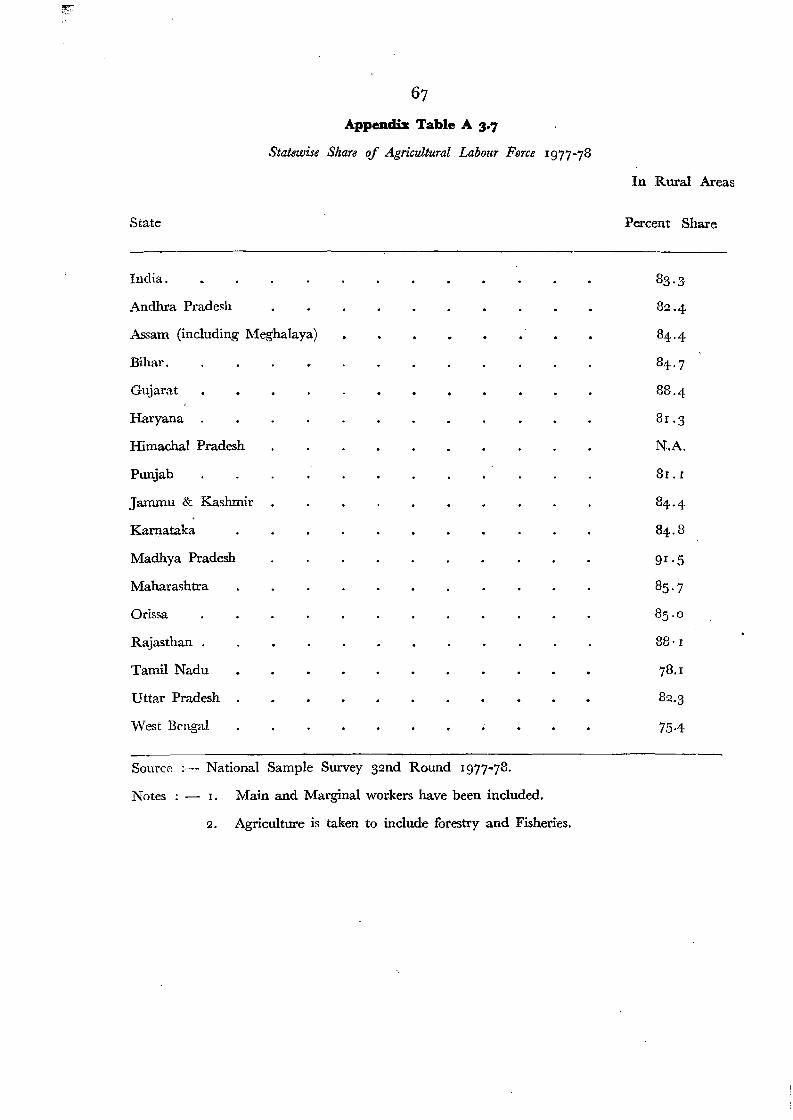
~
State
Stateioise
67
Appendiz Table A 3.7
Share of Agricultural Labour Perce 1977-78
In Rural Areas
Percent Share
India.
Andhra Pradesh
Assam (including Meghalaya)
Bihar.
Gujarat
Haryana
Himachal Pradesh
Punjab
Jammu & Kashmir
Karnataka
Madhya Pradesh
Maharashtra
Orissa
Rajasthan
Tamil Nadu
Uttar Pradesh
\Vest Bengal
83·3
82·4
84·4
84·7
88.l~
81.3
N.A.
81. 1
84·4
84. 8
91.5
85·7
85. 0
88· 1
78.1
82·3
75-4
Source :- National Sample Survey 32nd Round 1977-78.
Notes : - I. Main and Marginal workers have been included.
2. Agriculture is taken to include forestry and Fisheries.
IV. Mechanism for the Planning of Urban Development
Themes in Indian Urban" Policy
Introduction
4. I The previous chapters have documented that the Indian Urban System has exhibited remarkable stability characteristics as indeed has the Indian economy as a whole. There is little likelihood of an appreciable decline in the growth of urbanisation in. the foreseeable future. The distribution of city sizes in India is relatively even and the historical record suggests that no dramatic changes should be expected in. the normal course in the next two to three decades. "Vhat is needed therefore is a search for methods that will help cope with the growth of cities rather than an avoidance of this growth. The problems of different types of towns have to be dealt with according to their respective needs. What follows in this chapter is first a brief review of the kinds of urban policies and planning approaches that have been followed until now followed by suggestions for changes in the current approach•
National Economic Policies with Spatial Effects
4.2 It must be recognised at the outset that explicit spatial policies in India, such as restrictions on industrial location, incentives for industry to locate in backward areas, infrastructure investments in particular types of towns and cities, etc., have seldom been strong enough to alter existing spatial and hierarchical patterns. Policy and programme interventions have been half-hearted, loosely co-ordinated, to say the least, and even counter-productive. Spatial considerations have never received the attention they deserve. Policy has been half-hearted in as much as few of the points at which governments might intervene to manage urbanisation and affect its course and direction have been properly tackled. It is unco-ordinated in as much as national planning trends to be in terms of sectoral outlays while urban planning has been mainly linked with physical layouts. It is counterproductive in ~s much as the effort has been to divert, retard, or stop urban growth, and in particular to inhibit the expansion of metropolitan cities.
4.3 It will be useful here to document by way of illustration some of the unintended spatial effects of national economic policies. Industrial policy, for example, has had many unintended effects. One key element of the country's industrial policy has been its textile policy. A combination oflicensing control, excise duty policy and trade policy, favouring handlooms over powerlooms, over mills has led to a restriction of the mill sector expansion in textile production. The main objective of this policy has been to protect the employment potential of decentralised handloom industry. The effect has been to keep a large number of cities relatively stagnant in their spatial and technological industrial structure. As a result, some of the mill based cities have grown slower than they otherwise would have if production of mill cloth had been en
68
;Ii ;-~
P"-r:,.
69·
couraged, Simultaneously, some new centres with concentrations of powerlooms have sprung up. Some of these effects may be regarded as beneficial spatial effects of industrial and employment policy. They are given here to illustrate unintended spatial effects of policies which are essentially national economic policies.
4.4 Trade Policy has also had many unintended effects some of which have been beneficial. To the extent that some industries are more protected than others, the former tend to concentrate in a few locations. On the one hand an export oriented growth strategy promotes the location of industry (and hence population) in port cities like Bombay or those well connected by transport to those port cities. On the other hand strong import substitution policies have favoured industrial growth since the mid-fifties in inland cities such as Bangalore, Hyderabad, Delhi, Bhopal, Ludhiana and Jullundur. Again trade protectionist policies have contributed to the languishing of the port cities of Calcutta and Madras. At the same time, an industrial licensing system has favoured the promixity of industry, for at least of large corps of liaison personnel, to administrative centres of political and financial power where the licensing permits, etc. have to be obtained. This had led to somewhat faster growth of these governmental centres. Many of the State capitals have grown significantly faster in population than other cities. Particularly rapid has been the growth of Delhi, the national capital not all of it originally intended. Protection of industry involves an implicit subsidy: it brings about an effective transfer of resources into industry from other sectors which in turn results in a bias towards spatial concentration even of basic social services such as education, health and medical services. Under-investment in these services in dispersed areas increases to some extent the attraction of those areas where these services are concentrated.
4.5 Transport policies have had very strong spatial effects. Since the existing railway network has been altered little since independence it continues to reflect the colonial priorities of efficient transportation to the port cities. Industrial dispersal policies can only meet with limited success if transportation systems are lacking in the areas which are designed as recipients of the dispersed industries. A major effort, for example, has been made to develop the twin city of New Bombay on the mainland adjacent to Bombay island. But development has been slow in the absence of a tail link either to the new city and between it and its hinterland.
Policies on Industrial Dispersal
4.6 An example of explicit spatial policy is the decentralisation of industry which has been a declared aim of the government for a long time. Entrepreneurs are given attractive incentives to locate in backward areas. These incentives include low interest rates on loans from term-lending institutions, priority in the granting ofloans, income tax concessions, capital investment subsidies and transport subsidies. In addition, different state governments offer additional incentives to firms to encourage location in the backward areas of their states. Another measure for the decentralisation of industry has been the provision of industrial estates in outlying ~reas. The issue is more complex than is generally
~ , ~ ~
7p supposed. It can be asserted with some confidence now tha.tconsiderable dispersal of industry has taken place in the last fifteen to twenty years, which has at least partly been a direct result of these policy measures. But the pattern of dispersal may not have been as planned or up to expectations.
4.7 A large proportion of all industrial activity before independence was concentrated in Calcutta, Bombay, Madras, Ahmedabad and Kanpur, As mentioned earlier, substantial concentration has now taken place in inland cities such as Bangalore, Hyderabad, Delhi, Poona, and later in Bhopal, Ludhiana, Jullundur and the new steel towns-s-particular in Durgapur in West Bengal which has diversified considerably. A glance at the map of India reveals that there is now a major industrial centre in all regions of the country outside East Central India and the North East. Given the size of the Indian Industrial base it would have been unreasonable to expect any greater dispersal without incurring significantly higher costs. Bangalore, Ahmedabad and Hyderabad are fast developing into major metropolitan centres and should now be spoken of along with the traditional largest four cities of Bombay, Calcutta, Madras and Delhi as "national" cities. Over the next two decade, it is likely that Poona, Jaipur, Bhopal and Lucknow will also join this list. These may be cited as beneficial consequences of national policy.
7I
4.9 The Indian performance on dispersal compares well with any of these cmmtries. The proportion of value added in manufacturing to state Net Domestic Product has gone up in every state but faster in the less industrialised States. There is, therefore, a trend toward equalization of these ratios among States. A more systematic approach to measuring industrial decentralisation among States is to compute an inequality index of the distribution of industry among states, same as one might compute an inequality index of income distribution across states. The computation of such an index as done by Sekhar showed a marked decrease in the value of the inequality index. At the same time, it must be pointed out that there is no evidence of a shift of industry from larger cities to smaller towns of India as a whole though the picture does vary from State to State. If data are examined for the distribution of industrial employment (in household and non-household industry) among different classes of cities and towns in 1961 and 1971, it will appear that relative to population, employment in household industry tends to be more concentrated in the smaller classes of towns where the demand of the population for small quantities of simple manufactured products ate met by J:ouseh?ld p~"oduction units. Thus, whil~ about 15 per cent of the urban population resided ill towns of less than 20,000 In 1971 as much as 24 percent of the household industrial employment was found in these to\1\'11S. At the same time, less than 8 percent of non-household industrial employment would be found in these towns. The concentration of hous ehold industry in small towns was even greater in 196 I. Household industry has tended to move away from small towns in favour of somewhat larger towns although evidence is inconclusive on this point because of definitional changes regarding workers between the 1961 and 1971 census. On the other hand, there is not much evidence ofa marked change in the distribution ofnon-household industrial employment between small and large towns from 1961 to 1971-as measured by the inequality index comparing concentration of industrial employment with that of population. The picture is not uniform across States, however: there is evidence, for example, that there was some shift away from large cities in Maharasthra, Gujarat, Uttar Pradesh, Andhra Pradesh and Karnataka, On the whole, although there has not been deconcentration from large cities to small towns, the number of large cities itself has increased. r
4. 10 The designation of "Backward Areas", where the incentives for industrial location alluded to earlier could be taken advantage. of, vias done so liberally that as many as 247 districts (out of a total of about 350 in the country) qualified for these incentives. These districts cover about 60 percent of the population and 70 percent of the total area." As the current dispersal incentives are framed, industry has naturally taken" advantage of the incentives in the least backward areas and particularly those in the vicinity of metropoli tall areas. Almost go percent of the concessional investment funds went to as few as 22 districts in the country," Furthermore, at least three of the metropolitan cities (New Delhi, Bangalore, Hyderabad) had designated "Backward ~Areas" in their backyards in districts adjacent to them. Not surprisingly, private industry has been qUIte happy to take advantage of the incentives
1. AU the above evid·ence taken from Sekhar op. cit. 2 Government of India : National Council for the Developmcnt of Backward Areas
(NCDBA). Report on Industrial Dispersal. New Delhi : Planning Commission 1982,
~I M.}.I.,-I6
72
to locate in these areas probably resulting in the faster growth of these cities. This can be termed as an example of "unintended effects" of a spatial policy.
4.11 The N.C.D.B.A. has made a step in the right direction by identifying 100 centres which ought to be considered as industrial growth centres. Each of these centres has to satisfy the dual criterion of population over 50,000
(to ensure a minimum of agglomeration economies) but with fewer than 10,000
industrial workers. These centres are also not to be near existing industrial centres. The main deficiency in these suggestions is that selection is then done mechanically on the basis of these criteria rather than on a region-based need and function exercise. The aforementioned NCDBA "Report on Industrial Dispersal" also points out the importance ofsocial infrastructure in the locational decisions of firms. For dispersal to be successful, the availability of fiscal incentives for dispersal have to be accompanied by the provision of physical infrastructure-transport, communications, power, water, etc. Furthermore, the availability of good schools, medical facilities, etc. are crucial to attract skilled and high skilled labour and professionals. It is obvious that given the economy wide resource constraints it is currently not feasible to provide all these facilities in a large number of locations at once. This suggests two courses of action. First, given that there are now over 200 cities with over 100,000 population, and likely to be over 300 by Igg1, the existing infrastructure, physical as well as social, should be better utilised. Hence, among these cities, those which have low levels of industrial activity and employment could be considered for selection as industrial growth centres. But care should be taken to assess their industrial potential given the regional characteristics and availability of facilities, etc. Second, in the more backward areas, where these cities may not exist, a judicious selection of a small, number of centres should be made so that all the required facilities may be provided,
Modes <if Urban Planning
(a) Spatial Planning <if Cities
4.12 There was very little by way of explicit or direct "urban policies" or planning until about the Third Five Year Plan,. Considerable thinking on urban issues resulted from the preparation of the Delhi Master Plan ( I g6 1
to Ig81). The salient feature of this plan was the proposal for advance acquisition of all the projected urbanisable land for 20 years by the Government and subsequent disposal on a controlled and lease-hold basis. It also envisaged the development of Delhi as a "multi-nodal" city and proposed the construction of as many as 15 business centres so that commuting to the centre would be reduced and communities could be more self-contained. Consistent with this thinking of a "decentralised" city it was also suggested that the growth of Delhi be restricted by the development of "countermagnets" or ring towns around Delhi. The development of industry was to be restricted and only a few selected industries were to be allowed to develop. The old city was to be "decongested" and industries located there shifted out. '
4. 13 These ideas characterise the dominant thinking on urban planning and land use over the past twenty years even if they. may not have been effectively carried out in practice. Starting from the early sixties, town plann- -
IFIg~;' (.
73
ing organisations have been established in every state and statutory town plans have been prepared for the majority of cities of any substantial size., specially those with population of over 100,000. These are basically physical land use plans characterised by relatively strict separation of land uses. They have essentially followed British Town Planning traditions and especially as have been applied to the British New Towns. The result has been that their implied standards have been far too high for the economy of a low income country like India and the Master Plans have largely remained on paper. The key problem has been that these Master Plans are seldom linked with investment planning, and no institutional machinery was devised to link such plans with national and state level investment planning exercises.
4.14 The idea of developing ring towns or "countermagnets" has not met with marked success. A conspicuous failure has been Kalyani near Calcutta, which was fashioned in a way quite similar to British new towns. This was supposed to help in restricting the growth of Calcutta as of London, among other objectives. Similar attempts are being made near Madras, New Bombay adjacent to Bombay and around Delhi. The towns around Delhi have actually grown faster in population than Delhi but it is not clear whether they have had the effect of attracting population away from Delhi or adding to it. Perhaps, the concept itself is flawed. An understanding of metropolitan agglomeration economies would suggest that an alternative to a metropolitan centre is another metropolitan centre and not a nearby small town. It is quite likely that the development ofBangalore 200 miles from Madras has had the effect of slowing down the growth of Madras. Smilarly, it may be expected that the other emerging 'national' cities would have corresponding effects on the existing major metropolitan centres. Another issue is purely arithmetical, A slowdown by one percent a year in the rate of growth of a 5 million city would need 20 towns of 50,000 each to accelerate their growth by 5 percent each. This is clearly in excess of the nation's investment and other capabilties. Moreover, the number of nearby towns in anyone case is likely to be less than 20.
4.15 Apart from specific investment programmes devoted to the building of State capital projects, (Gandhinagar in Gujarat, Bhubaneshwar in Orissa, Bhopal in Madhya Pradesh, Chandigarh in Punjab/Haryana) substantial investment funds have gone into the World Bank aided urban development projects in Calcutta and Madras and now Kanpur. The other main' plan
,i schemes have been the "Integrated Urban Development Programme" which directed infrastructure investment to cities over 300,000 in the Fourth and Fifth Plans. A recent extension of this idea is the "Integrated Development of Small and Medium Towns". The latter scheme is expected to invest Rs. 1 crore in each of 200 towns with populations less than 100,000. The total funds invested in these efforts have been meagre and despite the use of th e term "Integrated" there has been little integrated planning of these schemes. The articulation of these schemes is more approximated by a response to shopping lists thrown up by different towns according to the guidelines provided. As is evident, the allegation that large cities have been favoured by planned investments is largely true despite rhetoric that concentrates on the stopping or arresting of growth of large cities.
74
(b) Planning for Slums
4.16 Within cities the main concern has been with the increasing numbers and magnitudes of slums. Early beginnings were made in the Second Plan period (1956-61) when the dominant idea was to "clear" slums and to house the "cleared" slum dwellers in multi-storeyed tenements. Such hinking continued until the late sixties despite its impracticability in the face
of estimates which show that as many as 20 percent of urban dwellers might be living in areas which may be defined as slums and about another 20 per cent in squatter settlements. Since 1972 wiser counsel has prevailed and a large scale programme of "Environmental Improvement of Slums" has been in progress. The idea is essentially to improve the basic physical environment of slums in situ by the paving of lanes, provision of piped water, latrines, storm water drainage and sanitation. Over 100 million slum dwellers should have benefited from these programmes by now. Associated with this are sites and services projects for assisting the poor to obtain shelter but these projects are still not widespread except in Calcutta, Delhi and Madras.
(c) Curbing real estate speculations
4· 17 Concern with curbing speculation in urban land has manifested itself in almost every plan document. The two main types of measures that have been used to accomplish this may have been counter-productive. The first is the idea of large scale acquisition of land by the Government for development and disposal. .rhe idea is to acquire large chunks of urbanisable lands in advance and to freeze land prices by so doing. The public sector is to then capture the unearned increments in land value after developing the land and disposing it at cost plus development plus prices to the public in an equitable manner. Such an approach has obviously facilitated urban planning in an organised manner. The second measure is the Urban Land Ceiling and Regulation Act which puts a ceiling on urban land ownership in all cities on a graduated scale starting from 500 sq. metres in the largest metropolitan cities. The idea is to thwart large land owners from undesirable speculation and to bring more land under government control for development in order to improve its access to the poor. The first measure has been used mainly in Delhi and in New cities like new Bombay and Chandigarh. While the idea is attractive in principle it has not worked out very well in practice. It has had the effect of restricting the total supply of urban land because of the monopoly of the public authority which finds it difficult to keep up with demand in physical and financial terms. The result has been very noticeable rises in land price. The continuing control of large amounts of land by a public authority also leads to two other undesirable effects.. The acquisition at prevailing agricultural prices brings the land at extremely low prices. Public use of the land so acquired becomes profligate reflecting this low price and what results is sprawling development sending up infrastructural, communication and commuting costs and shortage of available land at a later date. The other effect is the inevitable pressure of those in powerthe politicians, bureaucrats and other organised groups-for preferential access to land at low prices. The extension of these ideas to a host of other cities has led to frequent "land grab" scandals wherever the opportunity has arisen. The net result is that access of the poor to housing and building land been dismal. Nor have the rises in land prices slowed down. Public authorities have often behaved like private monopolists, with, of course, greater disregard of individual needs.
'to \:( ~,,'.
7.5
4.18 Similar problems have been encountered with the operation of the Urban Land Ceiling Act, which as proved extremely cumbersome to implement. The theoretical flaw in this legislation is two-fold. First, this is a one shot affair: even if the supply ofurban land is increased by this measure it does so only once. The supply in the future is then decreased. Second, it is horizontally inequitable since as is well known, within the same metropolitan areas the price of land can vary a hundred-fold depending on its location. This problem was recognised in the rural land ceiling measures by the definition of "standard acres" such that people with less valuable (and productive) land were allowed to retain larger plots of land. This is clearly impossible in urban areas because of the vast differences in values. Again, the net result has been an effective constriction in the supply of land which mayhave been responsible for the countrywide rapid escalation in land prices over the last few years.
4. 19 A common thread in many of these bold but ineffectual measures have been a lack of realism in the instruments available to the state and in an understanding of urban processes. The thinking behind these policies has' betrayed a fear of urbanisation that willIet in migrants who will threaten the privileges of settled city populations.
Urban Policies : Some New Directions
4. '20 Policy on urbanisation must shift its attention away from restrictionbe it on city sizes land transactions or industrial location. Policy should be oriented positively to enable an orderly transition from a predominantly agricultural and rural society to an increasingly urban one. The tertiary sector has already surpassed the agriculture sector in its overall contribution to the gross national products. Such emerging facts should be recognised and urban policy tailored accordingly.
4· 2 I Policy on urbanisation should shift from an adhoc approach todifferent problems and different towns to a more integrated approach toward investment and physical planning.
4· 22 The- planning ofurban development should be done at a regional and sub-regional level. This is to be distinguished from regional planning as a whole. What is being argued here is that regional urban systems can be identified according to their economic, climatic, geographical and transportation characteristics. The National Sample Survey, for example, defines economic regions Ll1 the country which are relatively homogeneous. Planning for urban development can be done on the bas is of such regions and according to the relative need and function of each town in its regional context. Thus, within a planning zone there would be no allocation to t owns because of their size but more because of their function and need. The physical and investment plans can then be dovetailed at the regional level and then fed into the State level plans which are, in turn, coordinated with the national plans. Recognition should be made of the metropolitan cities with regional and national functions. Again, this should not merely defer to size. In the North East, for example, there will not be a million plus city for quite some time to come but there is probably a need for one city, Gauhati, for example to perform the functionc of providing linkages with the rest of the national urban system. Since these metropolitan cities are not narrowly wedded to their regions for their existence and
7fJ
functions, they need more specific city level planning exercises which, again, should be physical and investment plans linked with the state and national plans.
4' 23 Within towns and cities there is a much greater need for community participation as well as the exercise of private initiative and investment in urban development than exists at present. The delivery of the basic public services to everyone is simply not feasible without such an approach. At present there is little between the citizen and city government, and sometimes even the state government. What is needed is community level institution building such that the needs of the community can be expressed in an organised manner as well as provided in this fashion. Slum improvement, sanitation, garbage removal, etc. can be orgaised and even paid for at the community level. Collection of user charges, loan repayments, taxes, etc. could also be improved in this manner. Unit ostsc of services could also decline. For the larger the city the more difficult it is for the city level authority to provide for the myriad needs of different areas of the city. It may also be hoped that such a people oriented approach will also lend more realism to urban policies and planning.
4' 24 The following sections suggest some changes in the modes of urban planning which would account [or s~me of the shortcomings of past approaches which have been documented III brief above.
Urban Detielopment Planning: Suggestions for a New Approach
Introduction
4.25 This section attempts to provide a brief description of the existing arrangements for urban development planning at the national, State and local levels. It then suggests measures and methods for improving these arrangements and considers the possibilities of new institutions for coping with the emerging needs of the future.
4.26 The last section provided an overview of the main approaches and plan schemes that have been followed in thy country over the past two or three decades. These approaches can, at best, be described as piecemeal and fragmented. Even schemes which were called "Integrated", e. g. "Integrated Urban Development Programme' (IUDP) and "Integrated Development of Small and Medium Towns" (IDSMT), were focussed on towns of different sizes: cities over 3 lakhs population in the case of 1. U. D. P. and towns under I lakh population in the case ofIDSMT. The selection oftowns was then quite a-rbitrary and little attempt has been made at planning of'urban development as a whole. As mentioned, a major hiatus was the absence ofeffort to link these physical plans with investment planning at the city, state and national levels. The main interventions have been in the metropolitan city and State capital projects and the various slum clearance and improvement schemes. In these cases, investments were made in response to major service deficits which could no longer be ignored or, in the case of the new State capitals, investments were made relatively lavishly for the provision of a very high level ofinfrastructure. Other lavish investments were made in the establishment of new townships for large public sector enterprises such as the steel plants and heavy electrical plants. Except for this last group, planning has not emphasised
~;~..
~;'-:
'1'
77
growth ofindustries , production and employment. It is clear from this brief'summary that there has been no attempt at any kind of integrated urban development planning at any level.
4.27 It should, perhaps, be made clear what is meant by urban development planning here. It is taken to include the planning of urban infrastructure and services for the growing urban population who will be employed in more production work, producing greater national wealth, while claiming and enjoying a share thereof These services consist of basic facilities like water supply, sanita tion, drainage, land development, solid waste disposal, roads, street lighting, etc.
4.28 The provision of these services is characteristically done by localbodies or state government appointed authorities. Other services like transport, power, communication, health and education arealso integral to urban development where provision should be linked with other infrastructure and services. In plan practice, however, they come under ill-coordinated different plan heads and illcoordinated grovernment departments. The problem ofurban development planning is then coordination ofthese services along with the core urban services mentioned above.
4.29 Planning for urban development should essentially be supportive of economic development in the country, state or sub-region, be it in agriculture, extractive industries, manufacturing industry or in the tertiary sector. The provision of'services and infrastructure removes constraints to the growth of these sectors or in some cases, promotes it. However, the provision ofurban services and shelter alone is usually unlikely to stimulate large scale urban development. It is important to time investments in urban services and shelter to coincide with investments in industry, mining and commerce which provide permanent sources of employment so that these types of investments can be fully productive. This should be the key objective of urban development planning.
Existing Arrangements for Urban Development Planning The National Level
4.30 At- the national level the main organisations concerned with urban planning in some form are the Planning Commission (P.C.), the Ministry of'Works and Housing (MOWH) and the Town and Country Planning Organisation (T.e. P.O.). At the same time other ministries and organisations of the Govt. of India (GOl) have an important role to play in the matter ofurban planning and development. Major investment decisions are taken by national level organisations which have various spatial implications Each oftheseorganisations have their own systems and methods of appraising projects and their own criteria for taking investment decisions. Furthermore, they themselves take action resulting from their own decisions and often have their own machinery for dealing with physical and infrastructural aspects of their major projects and programmes, which precludes consultations with appropriate bodies.
4-3I Decisions on transport have major effects on the growth (at lack of it) of urban areas. Investment in industrial estates or industrial growth centres often goes to waste if there is no matching and adequate investment in roads and .rail lines to serve them. Then: is for example, little chance ofNew Bombay succee
78
ding in attracting the projected volume ofpopula tion and activity until the railway line is extended there. Similarly, decisions concerning communication-extension of telecommunication services-r-are also crucial.
4.3 2 Large public sector industries characteristically provide housing and service infrastructure for their own direct employees and the township is then run like a company town. Little provision is made for all the indirect employment and resulting population growth that takes place. The existing local body or state government is then called upon to make infrastructure and service provision for the growing town. Durgapur and Rourkela are two examples ofhow not to set about such matters.
4.33 Food procurement and storage are now major activities ofthe government and government agencies. Mandi activity is seriously affected by decisions related to the location ofgodowns, the volume ofprocurement activity, etc. Consequently, the need for various types ofinfrastructure arises. Conversely, towns where such activity does not take place, get affected adversely by such decisions. Again, currently, there is little coordination of urban development planning with such activities.
Organisational Considerations at the National Leoel
4.34 One ofthe first things that requires to be done is proper coordination between :MinistriesfDepartments/Organisations at the national level in the matter of major' investment decisions and location of projects. Even looking at the most obvious implications, each project has to consider impact on employment (direct and indirect), basic services for large numbers of worker's and non-workers, social amenities for the new settlements which are likely to come up, communications net work and housing. Impact on existing settlements, both urban and rural, and the relationship between the new settlements and the existing ones would have to be considered also.'
4.35 The Planning Commission, as in other sectors, decides on the total auantum ofresources that are to be devoted to urban development for the country as a whole. It further allocates these resources between states and between schemes both for Central Sector and State Sector activites. Urban development investments are mainly in the State Sector except for some specific Central Sector Sohemes. It is not, however, clear on what basis the allocation of resources to urban development is done. At present it does not seem that there is anv systematic basis on which this is done. On existing schemes, the allocation is 'largely based on previous allocations. On World Bank assisted metropolitan and other projects, the allocations get determined by the size of the negotiated projects. New schemes, e.g. the IDSMT, which appear in a Five Year Plan, are allocated some ad hoc amount. In addition to the expenditures included in the head "Urban development" as mentioned earlier, many more expenditures under other heads are made in industrial townships, by the railways and other organisation which go towards augmenting the total volume of urban infrastructure. At present there is little coordination of these allocations within the Commission. The existing "Housing and Urban Development Division" is one of the smallest in the Commission consisting of just 3 officers : One Deputy Adviser, one Senior Research Officer and one Research Officer. As such, little technical work and forward
~~:-: &. r" ';>
't
79
pl3:nning get~ accomplis~ed, the p~essure of r~)U~ne work being what it is. There is little capacity for on gomg analysis of'urbanisation patterns, settlement patterns, evaluation of existing projects, etc.
4.36 The perspective Planning Division (PPD) is responsible for intersectoral consistency and coordination as well as for long term projections for the country as a whole, disaggergated sectorally. As yet there is no urban/rural dichotomy built into the perspective planning model though more consideration is now being given to regional disaggregation. The other division that has considerable responsibility for urban related issues is the Transport Division which is responsible for urban transport policy as well.
4.37 The Ministry ofWorks and Housing has one Division concerned with housing and urban development headed by a Joint Secretary and it performs essentially secretariat functions. AS it currently stands it has little technical capacity and is mainly administrative and policy making in nature. In terms of planning the Ministry is responsible for coordinating the proposals and schemes for urban development for consideration of the Planning Commission. Further, it is responsible for monitoring of the plan schemes once they are approved. It is not technically well equipped to do so currently.
4.38 The Town and Country Planning Organisation is the technical wing of the Ministry but currently plays a very limited role in influencing urban planning and development in the country as a whole. It was founded originally for the formulation of Delhi's Master Plan. Mter the formation of the D.D.A. it was transformed into a national organisation. In the sixties it was quite active in the promotion of State level town planning organisations as well as in the formulation of the master plans. Its decline in activity and importance has partly been a result of its success in forming its State level counterparts. Direct responsibilities for formulation of master plans, etc., has then devolved to the State level organisations and theT.e.P.O., it would appear, has not been successfulin adapting to its changed circumstances. Now it has direct responsibility only in respect of certain programmes financed by the Ministry. It also offers services to various public sector undertakings and other Government Departments on a consultancy basis. The Ministry also places some monitoring responsibilities with the T.C.P.O. for specific plan schemes. The scrutiny ofprojects under the IDSMT, for example is done by the T.e.p.O., as well as monitoring of progress of slum improvement schemes. Although the organisation has a multi-disciplinary staff its orientation has largely been that ofphysical planning. If the Ministry ofWorks and Housing has to playa greater role in urban planning and development at the national level, the T.e.p.O. could be developed as a strong technical arm of the Ministry for the appraisal ofmajor projects and advice on measures to be taken to deal with the consequences of major Central Government investments in the country.
4.39 The Institute of Urban Affairs is a body supported by the Ministry of Works and Housing. It has possibilities which are far from well articulated as yet. It is important to assist and enable it to assume an appropriate character and importance. . .
~I w.H.-17
:"c
80
The State and Local Level
4.40 At the State level the organisations dealing with urban development and planning are the State Secretariat Departments concerned, the Planning Boards or Departments wherever they exist and the Town Planning Departments. There is no unifrom pattern of the responsibilities of the Secretariat Departments. In West Bengal, for instance, there is a Department of Metropolitan Development in addition to the Department of Urban Development. Other States often have Departments of Local Self Government which are exclusively concerned with the administration and control of Local Bodies. In some States there is one Department of Housing and Urban Development, while in others these responsibilities are split into two departments. In addition, core infrastructure services like water supply are often the responsibility of yet another Department or Organisation.
4.41 l,16st of the Town Planning Departments are still engaged in conventional physical land use planning, though no doubt, there are some excepiior,s to this general observation. As mentioned earlier, Town Planning Departments have formulated Master Plans for a large number of towns under an earlier I'lan Scheme. But all the shortcomings and impediments that attack at the national level appear in accentuated form at most state levels. There is no firm tie-up between the plans ofthe Town Planning Departments and state funding ofprogrammes. While preparing these "Plans" the Town Planning Departments rarely consider the problem of resources. This is not necessarily the fault of these departments since they were set up as primarily physical planning agencies and staffed mainly with physical town planners. Hence ifplanning ofurban development at the State level is to be improved, a complete re-orientation of these organisations would be necessary. There would have to beinter -disciplinary teams who wouldhave to work closely with the people who provide the resources and take major investment decisions.
4-42 The State Secretariat Departments concerned with Urban Development (as with other secretariat departments) have little planning capability. By and large, they merely do some expenditure allocation of the few plan schemes in this field (IUDP,IDSMT, slum improvement) to the various agencies (Local and State level) who implement them. In State with metropolitan cities, the importance of the departments is somewhat greater and so is the power of the Metropolitan Development Authorities where the detailed planning work conceming the metropolitan areas is done.
"
4-43 The state Planning Bodies have also yet to focus on urban development planning and their current activities mainly consist of expenditure allocation accounting and coordination. Even the States which have the better planning bodies have little technical planning capability in urban development at the State level.
4·44 The picture at the local level is somewhat mixed. To begin with the largest cities: Calcutta, Madras, Delhi and Bombay all have metropolitan development authorities now (CMDA, Ml\1DA, DDA and BMRDA). The responsibility for planning for the metropolitan area rests with them. In the case of Cl\1DA and DDA they carry out the bulk of execution of capital works as
'"
fh
well..MMDA and BMRDA, though quite different in their functions, are simi
lar in that they are not executing agencies but do mainly planning and coordination. MMDA has been more effective (and older) while BMRDA is yet to establish its authority effectively because of the presence of the well functioning and powerful Bombay Municipal Corporation which, moreover, unlike other city corporations, has jurisdiction over all of Greater Bombay. Of the other 8 existing metropolitan areas, development authorities have been appointed in all except Nagpur and Poena, One of the key problems in the planning of metropolitan areas is the multiplicity of jurisdictions. . Characteristically, the jurisdiction of the existing city corporations has not expanded with the growing city with the result that the metropolitan area is composed of a number of I »cal bodies ranging from city corporations to municipalities to notified area authorities.
4.45 Even below the metropolitan level there are about 50 urban develop ment authorities who have been designated as the relevant planning authorities for those cities. Their level of activity and quality ofexpertise is quite varied. The reason for their appoiritment is usually two-fold. One is that they become necessary when an urban area expands to cover more than one local body. The second is that State Governments prefer to channel funds for infrastructure investment through a State Government Agency like an urban development authority rather than through the existing local bodies which are ofter seen as too corrupt and inefficient.
4.46 In the rest of the towns and cities there is precious little planning except for the Master Plans prepared by the Town Planning Deptt, OIl behalf of the local bodies. The lack of capital funds renders planning for infrastructure investments infructuous anyway. What then remains is the enunciation ofplanning and development controls to be implemented by the local body, which do not amount to much beyond words and exhortations.
An AgendaforImprovement : Coping with the Emerging Needs ofthe Future
4.47 The last section has' documented the weak institutional base for urban development planning at present. Quite understandably and justifiably the country's planning energies have been devoted much more to the planning of rural areas. The absolute volume of urban population (over 160 million) now and its accelerated rate of growth is such that planning of urban development will have to be done much more systematically at all Ievels-s-natioal, State and local. I t will no longer be practicable to come up with various ad hoc programmes designed to combat certain very pressing and visible problems at the neglect of others. At the same time it must be recognised that resources for urban development are highly limited and will continue to be so for the foreseeable future given the existence of widespread rural poverty and lack of basic services in rural areas. Mechanisms for urban development should then be designed such that there is better allocation ofexisting funds as well as cost saving and cost recovering use of any additional funds that might become available. A realistic assessment of needs for basic infrastructure and services is therefore a pre-requisite for efficient and effective planning. A dialogue between the formulation of standdards that are consistent with the income levels in the country and available investible funds would be a crucial component of any new mechanisms that are suggested.
82
4.48 'the first re-orientation that should take place, as has been argued, is a departure from exclusive preoccupation with problems of large cities along with wishful lip-service to the role of small and medium towns as alternatives to the growth oflarge cities. The problems ofdifferent towns, by size 01' by region, have to be dealt with according to their respective needs.
4-49 It must be recognised that the largest cities, particularly Bombay, Calcutta, Delhi and Madras, and increasingly, Bangalore, Ahmedahad and Hyderabad, may be regarded as national cities. While each of them is a regional centre, each performs national functions as well. They should be seen as performing a useful as well as productive role for the region as well as the country as a whole. Apart from some of these metropolitan cities, a more fruitful approach to urbanisation would be economic analysis of urbanisation disaggregated by region. The network of urban centres can then be seen in their regional context and policies framed accordingly. A large concentration in a big city would then be seen in its regional context as well as national context.
4.50 The explanation for the growth rate of different cities aggregated by different size classes would be sought more in relation to the economic characteristics and trends of the regions the cities are based in. For example, some of the differential trends in urbanisation are better explained by the high rates of income growth in Punjab, Haryana and Western Uttar Pradesh, along with slow rates ofgrowth and agricul tural stagnation in Eastern Uttar Pradesh, Bihar and Orissa-rather than any pattern related to city size. Indeed forecasting of urban growth would also be more fruitful if done by economic region than by city size. It follows that programmes of urban development should also be framed in the context of regional or sub-regional plans.
4.51 ·What is being argued here is that, apart from metropolitan cities which have regional as well as national functions, the planning of urban development should be done at the regional and sub-regional level in the manner already discussed. There are various regional classifications available which delineate areas according to their economic, climatic and geographical characteristics. Planningfor urban development can be done on the basis ofsuch regions and according to the need and function of each town in the region. Steps should be taken by States to identify urban development planning regions for the Seventh Plan and plan for their investment needs.
4.52 The main lesson from the above may be reiterated: policy on urbanisation must shift its attention away from the distribution of city sizes. The distribution ofcity sizes in India is one of the most even in the world as are their respective rates ofgrowth. It would be more desirable for policy to focus on the needs ofeach region and city. The approach to urban policy must be more economic than physical. The central problems are those of employment and incomes. It is here that the roles of different towns and cities must be understood. Employment location policy needs to be coordinated with infrastructure investment policy in terms of location.
4.53 For this approach to be implemented a new system of urban development planning will have to be put into operation. This, however, has to take account
~" . ' "J:
i: ,~,J.
f).; f ~~:.
83 ofexisting systems, practices and institutions and to build on them as far as is possible. The key to the new approach is two-fold. First is close interaction between physical and financial and investment planning and second is the preparation of regional or sub-regional urban development plans to make the first possible.
4.54 At present, the lack ofthis interaction invariably results ill much too high physical standards which results in the available resources catering to the happy few. This dialogue can be institutionalised if there is constant monitoring of costs ofdifferent types of 'technologies and standards that go into the provision of the necessary urban services. These standards can then be revised as necessary in li ne with available resources, Such monitoring and standard setting would then help ill deriving costs of required investments at all levels quickly.
4.55 'What is envisaged then is that overall costing and allocation of resources to urban development should be done at the national level between the Planning Commission and the concerned Ministry-s-the Ministry of Works and Housing. Unlike the present ad hoc system ofschemes, State should be asked to prepare comprehensive State and regional urban development plans to qualify for urban investment allocation, given the overall cost standards. [The latter should take account of different kinds of inter-State variation].
4.56 An initial attempt at both these types of exercises has already been made. The background work for the accompanying Task Force on "Financing of Urban Development" has demonstrated that even with existing information it is possible to make estimates of urban investment costs based on need and certain assumed standards, This exercise has been conducted over just 3 months and the estimates are very rough. Considerable refinement and improvement in estimates should be possible if this process is institutionalised. Similarly, the preparatory exercise for the Madhya Pradesh Urban Development Project also demonstrates that even the existing somewhat unsatisfactory data can serve regional urban development planning exercise. Thus, the approaches being suggested here are eminently practicable and, moreover, they do not lead to astronomical estimates of investment needs.
4.57 The recommendations given below on the institutional mechanisms necessary for these procedures to be followed have given thought to practical realities,' These recommendations are given with a fifteen year perspective starting With possible implementation in the Seventh Plan.
Recommendations for Institutional Changes
Th(l National Level
(i) Planning Commission
(a) Perspective and Economy-wide Planning
4.58 At present, there is no mechanism in the plan process to work out the spatial (regional as well as urban/rural) implications of the sectoral pattern of investment that is envisaged in each Five-Year Plan. Before industrialisation the inter-linkages between different parts of the economy were weak enough to
84
be ignored in formal economic modelling. As the economy develops denser intersectoral as well as spatial linkages, it will be necessary to do this more systematically.
4.59 The only urban rural projections made currently are demographic ones of the expected urban/rural split of population and employment. The results are also used in the consumption sub-model because of the vastly differing urban/rural consumption patterns. However, the system ofnational accounts statistics as well as other information makes it difficult to do the spatial allocation of activities. Hence the demographic projections are not linked with the other economy-wide macro-economic projections of investment, income and consumption and the projections of sectoral economic activity.
4.60 From now on projections ofurbanisation should be undertaken more systematically to integrate them with the economic modelling exercises. Such a procedure would also have important feed back effects in working out the infrastructure and housing implications of the planned sectoral activities along with the implied demands for building materials. Indeed, the importance of urbanisation projections is mainly to provide information for the required infrastructural investments at the right places at the right time-both rural and urban.
4.6 1. Initially it may not be necessary to build in the urban/rural distinction into the main sectoral model. It would be adequate to, perhaps, build a sub-model which uses the outputs of sectoral model to allocate activities between urban and rural areas and work out the infrastructure investment implications. These could be fed back into the main model at discretion. Over time, as the information system improves and experience with modelling builds up, urban/rural allocations could be integrated increasingly with the economy-wide allocation and consistency exercise.
(b) Impact of Projects
4.62. As explained earlier, a great number of industrial and other investment decisions have a major bearing on urban development. It can, therefore, be suggested that just as projects over Rs. 10 crores are subject to project evaluation by the Project Appraisal Division, large projects of over Rs. 50 crores or generating direct employment of over 1000 persons should also be required to file "Spatial Impact" or "Urban Impact" statements. These statements would detail the implied direct and indirect costs ofurban infrastructure made necessary by these investments. These impact statements would include the most obvious implications of each project on employment (direct and indirect), basic services necessary for the implied employment, social amenities for the new settlements, communications networks, housing, water supply etc. Impact on existing settlements, both urban and rural, and the relationship between the new settlements and existing ones would have to be considered also. Thus,just as currently the materials, power and other requirements worked out by the economy wide, models get translated slowly into specific projects in our planning system, similarly' the urbanisation related projections would get translated into specific investments (for new projects) by this mechanism.
rr ~,~ l:~
~,
85
(c) Housing and Urban Development Division
4.63 If the suggestions made above are accepted it would also be necessary to upgrade the Housing and Urban Development Division of the Planning Commission technically to be able to use the information provided by the perspective plan projections and the "Urban Impact" statements for conversion to specific urban development programmes, projects and schemes. The urbanisation implications would need to be translated into the necessary investments for housing and urban infrastructure. Similarly, the information from the urban impact statements would have to be built in and coordinated within an overall urban development plan, resulting from State and regional urban development plans. At present, the Housing and Urban Development Division is one of the smallest in the Commission. With increasing urbanisation and the need for more systematic planning it is suggested that the Division' be strengthened technically with a wholetime technical Adviser made exclusively responsible for these activities. As at present, "vVater Supply" should be included with this portfolio, since a considerable portion of urban infrastructure investment is due to water supply provision. Already 6-7% of Plan investment is covered by these sectors and this can be expected to increase in the future to about 10%. Further, ifgreater coordination is to be achieved than at present, a full time Adviser would be justified as well as necessary.
(ii) The Ministry ofWorks and Housing
4.64. The responsibility for more detailed urban planning and development should rest with the Ministry of Works and Housing. This would become clearer if the Ministry is redesignated as the Ministry for Human Settlements as has been proposed. However, this new: role would have to be properly defined and the Ministry would have to be strengthened if it has to play an effective role in overseeing urban planning and development at the national level. It should be the nodal organisation for coordinating action in the matter of major investment decisions having major spatial implications. As suggested above, while the Planning Commission would work out the main fiscal/investment implications and work them into the main plan, the Ministry would work out the more detailed spatial implications and ensure that they are consistent with the investment decisions on infrastructure.
4.65 The Ministry would be responsible for working out the detailed urban investment implications of projected urbanisation at at least the State level. In order to do this it will be neesssary to have on-going information on the cost of various standards of infrastructure and types in different regions. Furthermore, it would need information on existing infrastructure to be able to work out needs for the future. Such an on-going exercise means technical strengthening of the Ministry as well as other organisations on whose 'expertise it can draw.
4.66 The Town and Country Planning Organisation would need to be reoriented and developed as a strong technical arm of the Ministry. Its functions should be extended to include :
(i) Investment planning for urban development
(ii) Appraisal of urban projects
.~
86
(iii) Setting of standards for urban infrastructure (iv) Monitoring of urban projects (v) Evaluation of urban projects (vi) Constant search and review of innovative urban programmes. (vii) Organisation of an Urban Information System
In order to do this its inter-disciplinary character should be strengthened and it would perhaps be redesignated as the "Human Settlements Planning Organisation" or equivalent. It would need equal representation of economists, financial analysts and town planners, along with support from demographers, geographers and statisticians. It would continue some of its consultancy activities in physical planning.
4.67 Centrally Sponsored Scheme on Urban Development Planning
A re-orientation ofurban development planning will not take place by mere re-naming of institutions. It is therefore necessary to launch a Centrally Sponsored Scheme for funding the deoelopment of new urban development planning capability such that the integration ofph:J!sical, investment and financial planning as envisaged can take place. The scheme would cover training and institutional needs arising from this re-orientation at both the central and state levels.
4.68 Urban Research
There is great need for both basic as well as applied research as all issues are connected with urbanisation. It is therefore necessary that urban research be strengthened and institutions carrying out such research supported in a systematic manner. There is a "vide variety of institutions conducting urban research : Schools of planning, economics research institues, institutes of management, the institutes of technology and universities. It is noted that the Ministry ofWorks and Housing has designated the National Institute of Urban Affairs as the nodal institution responsible for urban research. Its role as a clearing house of urban search and collection of data can be strengthened and systematised. It is recommended that new Ministry ofHuman Settlements should work out procedures for the systematic strengthening ofurban research in selected institutions around the country.
4.69 The change in orientation suggested will need the collection and systematisation of data on urban areas to become an on-going and regular exercise. The T. C. P. O. has already assumed responsiblity for the organisation of an "urban and regional Information System" (URIS). In addition, the National Institute of Urban Mairs (N. 1. U. A.) has also collected a considerable amount of data from the majority of towns in the country on their financees as well as existing infrastructure and service provision. This information needs to be refined and updated at regular intervals.
4· 70 The N. 1. U. A. is an autonomous institution which should continue to be so. The acutal collection of data could be shared by the N. 1. U. A. Since it has already succeeded in building an initial data base. Furthermore, the N.1.U. A. should continue basic research on the over all settlement pattern, trends, etc. along with other research projects. The T. C. P.O. should concentrate on planning issues as outlined above.
."12.'(';
f'
87
The State Leoei
4.71 It has been noted that capacity tor urban development planning at the State Level is especially weak. Consequently very serious thought has to be given to the mechanisms by which this would be strengthened in the coming years.
4.72 Ifurban development planning is to be comprehensive and need based but subject to the usual budget constraints at the same time, a process ofinformation exchange would have to be developed such that the States are able to prepare such plans. Unlike the present situation, urban planning capability should be located within the set up where major investment decisions are taken. In this context it is clear that Town Planning Departments and similar organisations at the State level are quite weak and the linkage between investment decisions and funding is almost non-existent. If such major decisions are taken only at the secretariat, then the machinery for dealing with the consequences of these decisions should also be in the secretariat. If this arrangement is administratively not feasible then utmost care should be taken that this machinery works very closely with the secretariat and there is an inbuilt mechanism to ensure proper co-ordination.
4.73 An arrangement similar to the one suggested earlier for the Centre may be suggested at the State level as well. Responsibility for the various aspects of urban development which are currently fragmented in various departments in many States should be consolidated and brought under one Department of Human Settlements. The State ofMadhya Pradesh has attempted such consolidation where there is one Secretary for Housing, Local Self Government and Environment. The Department of Housing has under it a Housing Board : The Department of Environment is responsible for the Town and Country Planning Department, Development Authorities, Pollution Control Board and the State Slum Clearance Board; Department ofLocal Self Government works through the Director ofLocal Bodies and is responsible for all the municipal corporations, municipalities and notified area committees. Different types of arrangements in different states can be worked out according to their own conditions. But it is important that machinery for coordination of all bodies concerned with these urban functions be established.
4.74 As suggested for the T. C. P. O. at the Central Level, the Town and Country Planning Departments(T. C. P. Ds.) should be strengthened technically to perform the following functions
(i) The preparation of the Five Year Urban Development Plan and Annual Plans for the State. This would mainly include the State wide investment allocations for different components of urban infrastructure.
(ii) The preparation of Regional Urban Development Plans for regions in the State.
(iii) The preparation of physical land use and other plans for smaller towns which do not have their own capability.
(iv) Advising on physical plans, site and layout plans prapared by development authorities and local bodies.
(v) Monitoring and evaluation of urban development projects: 21 W.H.- 'c;-" , ,; -;
88
(vi) The construction of a data base for each town or city, including demographic, social, economic, topographic and land use data.
(vii) Enforcement of standards, urban regualations, etc.
4.75 In terms of planning the centre point would be the preparation of regional urban development plans. (Disaggregation below the State Level would not be necessary in the smaller States, naturally). As has been mentioned earlier, the larger cities, particularly the metropolitan cities, may be expected to prepare their own plans. Apart from them, urban development planning should be done within the regional context. This would be a much more sensible way of dealing with the subject rather than fragmented programmed for development of a limited number of facilities here and there. In this context, the Urban Sector Study in Madhya Pradesh, which was done preparatory to the recently approved urban development project in the State, may be seen as the type of exercise that is possible within available means. Theresultwas that two key growing sub-regions in the State were identified : the Indore-Dewas region in the West and the Bhilai-DurgRaipur region in the East. Within these regions, the service levels and other deficiencies were identified within the towns in these regions and investment provision made regardless of town-size.
4.76 The procedure that can be followed to prepare such plans is not difficult and can consist of the following steps:
(I) Analysis of the economy of the State as a whole by sector: of activity an 1 the location of activities.
(2) Disaggregation of the demographic patterns and analysis of trends.
(3) Delineation of regions [Some State Governments have already divided their States] into planning regions. Madhya Pradesh, for example, has ten and inventory of the main activities therein.
(4) Identification of key urban employment centres within these regions and their activity characteristics.
(5) Projection ofurban growth by region : both popultion as well as economic growth disaggregated by city. \
(6) Identifiction of main regions/cities exhibiting growth potential or, conversely identification of regions where growth is constrained by lack of urban infrastructure.
(7) Inventory of urban services ir, each region/city i
-Water Supply -Sewerage, drainage and sanitation -Solid Waste removal -Roads and traffic -Power and street lighting -.Shelter and land development
89
(8) Assessment of demand for services and resulting investment, finandai and physical plan.
(9) Revision, iteration, in the light of available resources.
4.77 These steps are not difficult to take even with currently available information. Certain kinds of information are difficult to obtain on a sub-regional basis but a considerable amount ofinformation is available on the basis of N.S.S. regions.'
4.78 In some cases, although the information is available, there may not be adequate capability in the existing Town and Country Planning Departments. A centrally sponsored scheme for funding the development of urban development planning capability has already been recommended. This should also be extended systematically to the State Level for the development of similar capability there, just as the original Master Plans were prepared under a Centrally Sponsored Scheme. This could be begun on a pilot basis in about 6-7 States which are facing the more serious urban problems. These could be : Maharashtra, Gujarat, Karnataka Tamilnadu, West Bengal, Madhya Pradesh and Uttar Pradesh. It would be necessary to spell out quite clearly what the exercise would consist of, what the organisational set up should be and what type of persons would be needed to carry out the exercise.
4. 79 As these organisations develop and as various plans are prepared the Scheme can be extended to the other States by the Eighth Plan. The result would be that the urban areas would develop within their regional context and investment for urban development would be planned and allocated according to need.
The Local Level
4.80 At the local level, the recommendations for metropolitan planning are given in the next chapter. The accompanying Task Force on "Management of Urban Development" is also giving specific recommendations for planning at the local level. There is consensus that municipal bodies should be strengthened for the planning needs of each town. Once the regional dimensions are spelt out by the State Level planning body, the responsibility as well as authority for planning at the local level should rest with the local body. It will be possible for the local bodies in many of the larger cities to develop their own planning capability in terms of qualified staff Now that there are 2 r6 class I cities already and that this number is expected to increase to over 300 by 1991, a large proportion of the urban population will be 'covered by these local bodies. It will, however be difficult for most of the leoal authorities in the small and medium towns td afford their own planning staff It is recommended that the newly revamped and strengthened State level T. C. P. Ds. develop special wings which would act as technical consultants for the local planning needs of the smaller towns.
4. 8r The effective implementation of planning at the local level also involves adequate co-ordination of the fiscal capabilities of the local bodies with the implications of a development plan. The Task Force on "Financing of urban Development" is recommending stregthening of local bodies in fiscal terms and is also calling for a more systematic devolution of funds to local authorities. This is 'for both capital as well as for current expenditures. The Task Force on "Management of Urban Development" is also recommending that capital investments in
90 urban infrastructure should be the responsibility of local authorities except when such investments are inter jurisdictional in nature. Taken together, what this means is that there must be greater coordination, between development and physical planning at the local level as well, and moreover, this should bear a much closer relationship with the sources offunds available with the local authority or which it knows to be potentially available. The next chapter lays out in some details the mechanisms that may be adopted for such coordination for metropolitan cities. Similar recommendations apply for planning in other cities but inter jurisdictional problems are usually not so severe in these cities and the coordination can be done by the municipal body as well.
4.82 Some comment will be in order on planning at the intra-city or zonal level. Much of city level planning has been of the top-down variety and has often borne little relationship with the needs of people at the neighbourhood level. This has been particularly true for the needs of slum dwellers, who have little say in the pattern of delivery of services to them. The Task Forces on "Shelter for the Urban Poor and Slum Improvement" and on "Management of Urban Development" are commending the widespread adoption of the Urban Community Development programme as a means of delivering services to the poor and of eliciting their participation in planning at the sub-local level. Details ofsuch an approach are provided in the r~ports of these TaskForces. It is recommended strongly that the urban commumty development programme should be adopted widely as a means of increasing citizen participation in urban planning at the sub-local level.
Training JVeeds
4· 83 The re-orientation of urban development planning from a largely physical approach to a coordinated physical, economic and financial approach implies an expansion in and change of training facilities for urban planning. It means that there will be much greater need for urban planners with technical background in physical planning as well as economic and investment planning. This means that existing town planning courses in the planning schools should be made broader as, for example, they have been made at the Ahmedabad School of Planning. Furthermore, management training for urban development planning should also be introduced at the Indian Institutes of Management as well as at the L. B. Shastri Academy for Administration. There are, at present, no urban economics courses being offered at any level in any University in the country. Serious consideration needs to be given to the introduction of such courses at the leading economics departments in selected Universities at the M. A. level. This would help in the broadening ofcourses at the planning schools as well, since many of the students specialising in urban economics, or urban geography, or urban sociology, could be expected to be trained further at the schools of planning.
4. 84 There is also need for training of personnel already working in the various existing urban institutions. Training of personnel in the major areas o, planning for urban development has been woefully neglected not only in small and medium local and municipal bodies but in large metropolitan cities as well. The prevailing philosophy has been to leave all incumbents to learn on the job as best as they can. This philosophy in its turn has been nursed by elected and nominated Municipal Councillors on two major premises: (I) that their municipality is
~ ~
~". e ,
tt:'" ';'.;c"
~~: "
,~
t,
...................
9t
special and unique so far as problems and their solutions go ; (2) that they themselves bring men of intelligence but no particular spcialisation, it is enough that planners, executives, administrators, policy-makers, supervisors, foremen, etc. should be left to learn on the job and bungle through.
4.85 Institutions like the Indian Institute of Public Administration have, of course, curricula and courses for training incumbents from leoal bodies. But, if planning for urban development the systematic way that this task force advocates is going to bear fruit in the future, then much more is required than is at present offered by existing institutions.
4 .86 The first task in the mid-career training ofpersonnel is to firmly eschew the bias in present-day planning toward physical planning of a city to make it more ofa garden city for the happy few and the tendency towards profligate expenditure of land resources merely because they are acquired so cheaply by robbing their owners of the greater part of their legitimate expectations. The second task to be assiduously built into the training curriculam is concern to make a town or city economically strong and productive in the secondary and tertiary sectors, to create and encourage conditions for steady increments in the value added employment of skilled, semi-skilled and even non-skilled workers. The innards of a city, like those of any living organism, are not always exactly beautiful to look at but must be functionally adequate if anything, for growth and health. The continuing accent should be on (I) costs-effectiveness, and (2) benefit cost ratios for any municipal endeavour aimed at economic, cultural and demographic growth.
4.87 For any concerted urban planning endeavour of the kind envisaged in this respect, adequate outlays and personnel must be earmarked for training. This is not possible in just one large central institution but in a number of regional institutions with perhaps an appex institution to retrain and reorient the best products of the regional institutions.
4.88 There should be a network of institutions to undertake among others
(i) training in the aims and principles of urban development with prime emphasis on equity, distribution, economic, cultural, and employment growth with right balancing of the secondary and tertiary sectors.
(ii) Physical planning of urban areas with emphasis on circulation, proper zoning of social, cultural, production and residential facilities, economy of transportation costs and access, and proximity of housing and shelters to plaee ofwork, particularly of low-income workers.
(iii) the most economical and effective use ofland and the need for
(a) monitoring and publication of land prices and the land readjustment system
(b) monitoring of actual land use with reference to those enunciated in the land use plans
(c) monitoring of squatting and unauthorised settlements
-------------------.r.
9. 2
,
(d) evolving principles of pricing parcels of land on the basis of
(i) economic costs
(ii) declared social objectives
(iv) Training in the principles and nuts and bolts of
(a) municipal Organisation
(b) municipal administration
(c) municipal management
(d) municipal finances and principles of taxation including refinancing and balancing of sectoral heads of revenue and expenditure
(e) execution and management of capital projects and modules of projects
(f) duties of top, middle and junior level supervisors, foremen, etc.
(g) Above all, the preparation of Text-books and Annotated Manuals and Curricula of municipal training.
4.89 It is therefore recommended that the Ministry of Works and Housing, in conjunction with the Ministry ofEducation devise a specific plan for the exapn- . sion of training for urban development planning on the above lines during the Seventh Plan. Specific funds should be allocated by the Planning Commission for this purpose keeping in view a 15 year perspective for the needs of such training.
Information System for Urban Development Planning
4· go Urban development planning within the framework ofoverall development planning in India would necessitate the setting up of an Urban Information System (DREIS). The system, may start its work by compiling systematically the data available with the central level data collection/compilation agencies like the Census, Central Statistical Organisation(CSO)etc. There are serious problems of inter-sectoral as well as inter-state comparability with regard to a segment of this information base. The data on workforce, its distribution among various industrial categories (at the two digital level of NIC classification), the distribution of industrial establishments among these categories, may be mentioned as illustrations. UREIS would have to retabulate the data on the basis of highly disaggregated information and by using comparable definitions of various concepts at different points of time. One' other task of DREIS would be to procure from various Central and State Government departments and local authorities data that are collected for various administrative purposes but never published nor used in the planning process. These data should be systematised and published.
V. PLANNING FOR METROPOLITAN AREAS
Problems in the Existing Approaches to Metropolitan Planning
5.1 As we have seen, planning in metropolitan areas now largely consists of land-use planning as an aid to development control. The standard practice is to prepare Master Plans for a relatively long period of time like 20 years. The land allocation is primarily based on population forecasts and relatively weak projections of economic activities: usually devised in terms of employment which is itself derived from population forecasts. These forecasts are converted into various types of land requirements based on absolute' a priori norms such as density, open space per unit of population and schools, health facilities, markets etc. also for per unit of population. This approach, as we have already noted, has suffered from two key problems. First, there is no connection between the investment implications of such a Master Plan and resource availability. Moreover, since these land requirements are derived from an end state twenty years hence, they are not responsive to resource availability (assessing resource availability for a twenty year period is itself a difficult, if not useless, task). Second, the land use allocation exercise and the standards used do not deal adequately with the prevailing socio-economic conditions in the city: where people live, what they do, and where they work. It would, therefore, be desirable that metropolitan planning in the future is re-oriented to take account of such key shortcomings.
5.2 The preparation of an urban development plan is essentially to allow for the orderly expansion of the city under conditions of expanding population and economic activities. Such a process must take account of the existing pattern of a city as well as socio-economic conditions of the people-both in terms oftheir pattern of employment as well as their residence, along with the physical potential of development in the city. The manifestations of these spatial concerns then have to be coordinated with the availability of resources. The lack ofresource awareness and the notion that all space requirements are "absolute", affects the very essence of planning as a process which allocates limited resources
, taking account of priorities in varieties of land requirements or possibilities of trade-off amongst them.
5.3 The impacts of such a style of planning are many
(a) Excessive space norms make services land so expensive that a large section of low income people cannot afford it. For example, the stipulation for open space in Bombay is at the rate of 15% of gross area +1 acre per 1000 population. This puts the proportion of open space itself at over 40 per cent at reasonable densities.
(b) Large tracts of land which are notified for future use over the twenty year period are often beyond the capabilities of the local authority
--------------
94
to acquire and develop; what is worse, they invite unauthorised development-and not necessarily by the poor.
(c) The use of unrealistic standards unrelated to income levels and ability to pay on the part of the city or its people leads to the development of only selected parts of the city. Thus, vast areas of the city remain unserviced for long periods of time even after people have begun to live in these areas.
(d) Since overall resource availability is not explicitly taken into account, it is conveniently assumed that all land development for public purposes is to be directly financed through local government finance. Innovative methods which make use of real estate dynamism such as bonus F.S.I., transfer of development rights, etc. are seldom thought of.
(e) The assumed desirability of unifunctional land use, separation of land use and provision of a "desirable" urban environment in terms of unrealistic norms of aesthetics leads to a downgrading of the key economic functions of a city; industrial production, trade and commerce and the provision of other services. While encouraging uneconomic and wasteful use of valuable urban land, this results in curtailing the options of people to devise ways and means of increasing their productivity and thereby pay for urban services, especially at the lower rungs of the economic ladder.
(f) The forced separation of residence and work place ignores the realities of the current Indian situation. In an economy where a large percentage of the population is still dependent on self-employment or household production, residences are essentially centres of both consumption and production. The restriction of the use of residential areas for exclusively residential purposes renders their use for other purposes illegal or extra-legal by definition. This leads to unnecessary constriction of a host of essential economic activities that are actually carried on in these areas.
5.4 The net result is that Master Plans often remain all. paper and are seldom capable of being implemented effectively. These shortcomings are not merely the result of the methodology of planning followed : as already discussed, they also result from the existing institutional set up for urban planning and resource allocation which is not conducive to an integration of physical and investment panning.
5.5 Of the 121 metropolitan cities that exist at present, 10 have metropolitanor urban development authorities which are responsible for preparing the long term land use plans. Only Nagpur and Poona still do not have metropolitan level development or planning authorities. The pattern of responsibilities exercised by each of these authorities is quite different depending on the historical
I. Calcutta, Bombay, Delhi, Madras, Bangalore, Hyderabad, Ahrneda bad, Poena, Kanpur, Lucknow, Nsgpur, and Jaipur,
95
evolution of each. The Calcutta Metropolitan Development Authority (CMDA) and the Delhi Development Authority (DDA) are responsible for the execution of works as well as for planning. The Madras Metropolitan Development Authority (Ml\1DA) and the Bombay Metropolitan Regional Development Authority (BMRDA) are mainly coordinating and planning agencies. Among the others, although the overall planning responsibilities rest with these Development Authorities, their operations are largely concerned with the development of the peripheral areas often outside the juridiction of the existing municipal authorities. Thus, typically, their energies are diverted from the key issues and concerns of planning to the day-to-day problems ofland acquisition, development and disposal at the periphery. These Development Authorities are the creation of State Governments and are largely insulated from the existing municipal corporations. Thus, their planning activities get necessarily de-linked from the availability of local finances.
5.6 Although the planning responsibility rests with these authorities, the planning of investments and allocation of capital funds is essentially done by the State Governments in the usual 5-year national planning cycle and through the annual plans. At the city level, there is usually a multiplicity of agencies responsible for different components of infrastructure investment. In most cases there are state or city level housing agencies, water supply and sewerage boards, road transportation authorities, etc. In addition to these, there are Government departments like public works departments, railways, port trusts, etc. which are also involved in different kinds of public investments. Thus, urban development in the sense of integrated resource allocation and investment in various infrastructural services becomes a will-o'-wisp in the present institutional set-up. The absence of a "Metropolitan Sub-Plan" budget head in State plans makes it difficult to coordinate public investment in these cities. The metropolitan authorities simply do not possess the power or expertise to do the required coordination between the investment plans and physical plans at the city level. The problems faced by them may be summarised as follows: . .
(a) the sources of funds for various investing agencies are different such as local tax resources for local authorities, state plan allocations for government departments, plan allocations plus institutional finances raised by the funcional quasi-Government agencies, and central resources for central government departments. This multiplicity of sources of funds make nonsense of effective allocation of all available resources for a given area; .
(b) resource allocation for State agencies is largely done in the five year allocation cycle of State PIall formulation. However, actual investment in a given area is based on the annual project related budget cycle followed by the individual agency;
(c) although resource allocation takes place in a five year cycle (with a short-term annual budget sub-set), investment in most infrastructure projects requires long gestation periods. The project formulation itself is a 'time consuming activity to which the actual investments are required to be related. In most circumstances, there is no agency at the local level which could project the demand
" for infrastructure needs, translate it into' resource requirements, and set-up priorities within the local context; and
(d) ·even if such an agency exists, it is difficult to influence the investment allocation of State level quasi-autonomous agencies through such a local agency.
96
5.7 In view of the above complexity, physical planning at the local level is either reduced to an exercise for narrow land-use planning and residual infrastructure provision, or the attempts to have an integrated physical and investment planning result, at best, into persuasive advocacy documents. For effective integration ofphysical planning, and investment planning, the present institutional set-up is not very conducive. However, it is equally difficult to suggest an institutional set-up which has universal applicability that can achieve the desired objective.
5.8 Another set of problems that arises from the current mode of physical planning is the lack of participation by the people in the planning process. The existence of metropolitan development authorities has reduced the importance of the municipal bodies in the planning and investment process. Thus the mechanisms for consultation with large sections of the people are totally absent. A good case can be made out for the initiation of more participatory planning in the delivery of services at the sub-local level.
Toioards Better Approaches to Metropolitan Development Planning
5.9 All the problems alluded to above necessitate a thorough new look at the procedures currently used in the planning of metropolitan areas and the evolution of approches and methods more suited to the new imperatives arising from intensification of urban growth all over the country. It is virtually certain that eight to ten more cities will cross the million population mark within the current census decade.' Hence great demands will be made on the planning capabilities available in the country.
5.10 The review above reveals the following key problems that have to be tackled:
(i) Coordination of city level investment plans with higher (state and central) level planning and resource allocation exercises.
(ii) Coordination of city level investment plans with resource availability and with physical planning.
(iii) The fostering ofa closer relationship between the norms and standards used in physical planning with the socio-economic realities prevailing within our cities. More explicitly, the needs of the poor must be accounted for more specifically in all physical planning exercises.
5. I I The concurrent" Task Force on "Management of Urban Development" has paid considerable attention to the institutional arrangements that are necessary for metropolitan planning. We strongly endorse their recommendations in this regard since the institutional measures they have suggested are vital for the initiation of better planning.
.._-._---_.----- -_._---_.- .._--_...__._._-_..... ----
1. As shown in Chapter IIi, th-se arc Coimbatore, Patna, Surat, Madurai, Indore, Var a nasi, Jabalpuf, Vadodara and possibly, Agra, Dhanbad and Bhopal.
- .
Coordz'nation ofState andCity Planning
5.12 A more organised dialogue needs to be established between the metropolitan authorities and state governments, This would be assisted if the State Plan should include a Metropolitan Sub-Plan (on the lines of the Tribal Sub-Plan) for each metropolitan city in the state. It would, therefore, be necessary for the State Government to direct the quasi-autonomous functional agencies to prepare capital investment plans for the metropolitan areas based on the availability of resources as indicated by the State Government as well as the availability of institutional finances. This would necessarily be an iterative cycle which should begin somewhat in advance of the usual 5 yearly cycle of the preparation of 5 year plans. The necessity of preparing such a plan would automatically induce a dialogue between the local metropolitan authorities and the various functional agencies (indudng agencies responsible for power, telecommunications, transportation, etc.) .
5.13 The last chapter has suggested the preparation of an urban development plan for each state on regional lines. The suggestion for a metropolitan sub-head in the State Plan is not inconsistent with this idea. . Indeed, each metropolitan area would merely constitute a region among the various regions delineated in the State. However the particular attention to the preparation of metropolitan plans being recommended is necessary because of the complexities of inter-sectoral and inter-spatial coordination that is necessary for the efficient functioning of large cities.
5.14 The key focus in the preparation of the metropolitan sub-plan at the state level is the advance assessment of the availability of budgetary resources for metropolitan development. The provision of this information to the metropolitan authority would enable it to assess the feasibility of raising the necessary resources from other sources such as institutional funds' as well as the generation of funds from land development and other activities.
Coordination of Inoestsment; Financial and Physical Planning at the City level 5.15 As mentioned in the last section there is currently a wide variety in
the types of metropolitan-wide authorities that exist in the different metropolitan cities in the country. It is, therefore, difficult to provide a uniform recommendation for all the metropolitan cities. It is dear, however, that there is need for a metropolitan planning authority (henceforth M.P.A.) which accomplishes all the coordinating tasks mentioned above. As suggested by the Task Force on "Management of Urban Development" such an authority should not be an exeu ting agency: the capital works implied in a plan should be carried out by the relevant municipal bodies or functional bodies as applicable. The function of the M.P.A. should be to prepare a Five Year Plan coterminus with the national and State Five Year Plans.
5.16 The following measures would need to be taken for the M.P.A. to accomplish this :
(i) The M.P.A. should first prepare a long term perspective structure plan" for the city in order to layout the broad developments expected over a 10-20 year period.
.._-----------------, I. It is important to note here that the Task Faroe on "Financing of Urban Development"
is giving a strong recommendation for establishing an Apex Ur ban Development Financing Agency.
2. This has been done, for example, by the Madras Metropolitan Development Authority.
98
(ii) More specifically, this should be broken down into s-yaer segments coinciding with the nationals year planning cycle.
(iii) The physical plan should then be converted into an investment plan for the 5 year period and consequently a financial plan.
(iv) Each local authority responsible for capital investment in the metropoliltan area should then prepare a capital investment plan within tliis framework after taking into account its revenue generating ability. While so doing, specific attention may be paid to institutional finances that are available and the debt servicing burden that will be cast on the local athority. It is in, this contex that the M.P.A. should communicate its assessment of State level of finances available.
v) The M.P.A. should on the one hand help the State Planning or Urban Development Department to coordinate the investment planning of various sectors and agencies for a particular metropolitan area, and on the other examine technically the funcional agencies' plans to see that the resources are used to provide efficient and equitable delivery of services. .
(vi) For the above process the sectoral allocations 101' the metropolitan area will have to be flexible so that inter and intra-sectoral re-alloca tion is possible depending upon the priorities redetermined by theM.P.A.
(vii) This process of converting physical plans into investment plans on the one hand, and investment plans into financial plans on the other will result in an iterative revision of norms, standards and the extent of development feasible within the available resources.
To this end, it will be necessary for State Governments to vest M.P.As with sufficient authority. The key to the success in such planning coordination lies in the matching of costs of development to the ability of the people to pay (through taxes as well as user charges) on the one hand and to the utilisation of funds currently available on the other. This might seem somewhat complex to begin with but soon becomes a habit as in other spheres of development planning.
Suggested Procedures for Realistic Metropolitan Planning
5. I 7 In order to achieve the coordination between physical and investment plans that is suggested above, a broad checklist needs to be examined briefly. Cities must be planned as centres of production and exchange rather than as centres of consumption for the elites. The concepts of "City Beautiful" and "Garden City" have plagued the preparation of plans which are supposed to serve the needs of the population residing in out cities. There is a clear need for articulating the concept of "public interest" more explicitly. Frequently. irrational decisions or decisions favouring specific interest groups ate justified by urban authorities on the basis of their being in the "public interest". It is seldom clear which "public" or who from among the public is going to benefit. A case in pointis the frequent removal of "slums" or " low income settlements" from certain locations to place the same land under use as gardens or upper/middle income housing. A crucial issue in planning then is how to ensure that metropo
99
litan planning caters to the needs of all income groups of the population with respect to shelter, employment and the distribution ofpublic services.
5.18 Even physical planning must be done with the imperatives of the prevailing socio-economic realities in mind. What is vital is the collection of appropriate information on :
(i) The distribution of income in the city.
(ii) The pa~tern of residential location by income groups and other socioeconomic groups.
(iii) The pattern of employment location-by occupation, industry groups, etc.
(iv) The pattern of residence-work and other transportation resulting from the residence/employment location pattern found above.
(v) The availability ofshelter and services by income group and location.
(vi) The available finances in the city.
5.19 All this information can be collected in a comprehensive household/ employment sample survey on small statistical sample which should be conducted in each of the metropolitan cities every 5 years, preparatory to the planning exercise. A judiciously and scientifically selected half to one percent sample should in most cases prove adequate for such purposes. If the results from such a survey are available along with the usual census information, a sugested procedure for initial metropolitan planning might be :
(i) Population Projections made realistically over the plan period.
(ii) Residence Location and Demand for land and Housing
-Assessment of demand for housing by income group according to ability to pay.
-Projection of such demand for existing as well as expected population.
-Delineation of various alternatives for the distribution of the additional popuation in new as well as existing areas.
-articulation of different housing strategies for satisfying additional demand as well as backlog.
-inventory of supply of land available for development: new land as well as possibilities of classification.
(iii) Employment Location
-·Projections of the expanding economic activities in light ofincreases in .popuoation. .
-Distr~bution of the expansion in economic activities by occupation and Industry.
-"Distribution of the expanded employment by location. -Demand for land for differnt economic activities by location.
100
(iv) Transport -The provision of transport links (roads as well as. equipment). to
serve the emerging pattern of employment and residence location arrived at in (ii) and (iii).
-projection of mode split according to demands for different kinds of transport needs.
-projection of transport investments required.
(v) Provision of Public Services
-the provision of water supply, sewerage and sanitation, electricity, drainage, land development, etc. in the light of decisions in (ii) and (iii) .
-alternative cost implications of the different alternatives considered in (ii) and (iii).
-costing of different kinds of norms.
(vi) Financing qf Public Seroices
-prepration of investment and financial plans in light of (i) to (v) above.
-iteration of (i) to (vi) depending' on resource availability and allocation.
5.20 Steps (i) to (iii) have to be taken in order to arrive at (iv), (v) and (vi) which are really the key concerns of MPAs. The problem that arises, of course, is that decisions in (i), (ii) and (iii) depend on decisions taken in steps (iv) to (vi). The latter decisions are strategic decisions which, to some extent, have to be supplied to planners as part of an iterative process. There needs to be a clear articulation of objectives by the l\1:.P.A.
5.2 I In order to achieve the coordination between physical and investment plans that is suggested above, the detailed procedures of planning need to be examined and guidelines issued. A Centrally Sponsored Scheme for the development of urban development planning expertise at the Central and State Level has already been recommended. This scheme should specifically include the promotion of techniques and personnel for metropolitan planning on the above lines. Model procedures for metropolitan planning should then be worked out so that they can be institutionalised in M.P.As as experience is developed.
5.22 'the Centrally Sponsored Scheme suggested above for the strengthening of urban development planning capability should include provision for pilot household surveys in selected cities over the Seventh Plan period. It is also necessary to take steps to improve the access of metropolitan authorities to City Level data from national sources of information such as the National Sample Survey, the decennial population census, and the Central StatisticalOrganisation. In particular, it is important that access be given to the 1981 Economic Census at the city level before it becomes dated.
IOI
5.23 The 12 existing metropolitan cities are conveniently located In a mosaic ofgeographical regions in the country. The addition of 8 or 9 more cities into this group by I99I will further improve their geographical distribution such that, each region will then be served by a large city. It is, therefore, important that in addition to the intra-city exercises suggested above, detailed geographic and economic analysis of these metropolitan regions be initiated in order to be able to make recommendations for:
(a) integration of communication, transport, energy and other infrastructure in the region to bring about better interdependence in the hierarchical structure of the different areas of the region.
(b) assessment of the types of industries and other activities that are more suitable for location in metropolitan areas. The present policy of banning the location or expansion of industry in cities with population exceeding 5 lakhs can then be modified on this basis.
(c) assessment of the type of industries and institutions that should be assisted to take root in smaller cities and towns of the region, that would interlock with each other and the rural hinterland and make optimum use of locally available resources.
5.24 This should preferably be done under the auspices of the Planning Commission which may seek the scollaboration of bodies like the ICSSR, UTs, LlMs, Universities, research institutes and other special foundations interested in this issue.
.':RJ
V1. COORDINATION OF INDUSTRIAL AND URBAN DEVELOPME]V'T
Introduction
6. I The link between urbanisation and industrialisation was demonstrated in Chapter I and has been substanttiated in Technical' Appendix. I. Policies concerned with the location of industry are not now coordinated with the provision and funding of urban services, nor with associated, communication and transport facilities. The converse is also true. As already observed, the selection of towns under the Integrated Ubran Development Programme (IUDP) or the Integrated Development of samll and Medium Towns (IDSMT) has Hot been linked with any industrial dispersal schemes. Similarly, the urban development projects in Calcutta, Madras and Kanpur have had little linkage with the requirements of industry in these cities. '
6.2 Decentralisation of industry has been an explicit aim of the government for a long time. Entrepreneurs are given attractive incentives to locate in backward areas. These incentives include low interest rates on loans from term lending institutions, priority in the granting of loans, income tax concessions, capital investment subsidies and transport susbsidies. Further, different State governments offer additional incentives to firms to encourage location in the backward areas of their States., Another measure for the deconcentration of industry has been the provision of industrial estates in outlying areas. But even these have not produced extensive decentralisation, although, as documented in Chapter IV, there has been considerable deconcentration of industry in India but not always in the direction or magnitude intended.
6. 3 The analysis of the 198 I Census at the regional level, given in Chapter I, reveals different regional patterns of urbanisation. On the one hand, are the agriculturally dynamic regions like Haryana, Punjab, and Western V ttar Pradesh, where most of the industry and employment in urban areas has been triggered by the initial growth in agriculture. On the other hand are the agriculturally slow growing regions like Eastern Uttar Pradesh, Bihar, Orissa and Madhya Pradesh where urbanisation is taking place without significant growth in agricultural productivity and incomes. A closer examination of these regions given in Chapter VII shows that the fastest urbanisation is occurring in regions like Eastern Madhya Pradesh, Southern Bihar, and Northern Orissa where major public sector large industrial investments have been made. Other regions in these States like Eastern Uttar Pradesh and Northern Bihar are essentially stagnating in terms of agricultural growth but there is some evidence of acceleration in the rate of urbanisation. Clearly the need for urban development and Industrial measures would be very different in each of these regions and subregions. In the stagnating regions, there is need for special employment generating measures in the relatively fast growing towns that are located here.
rr',
'" 103
6·4 111 view of all this given the links between the provision of social and physical infrastructure and the location of industry, it is imperative that industrial location measures' should be linked with urban development programmes. This reinforces the recommendations made in Chapter IV concerning the preparation of urban development plans at the State and subregional level. Only if this is done will it be possible to take into account the requirements of planned industrial activities in the allocation of urban infrastructure investments. Provision of appropriate physical and social infrastructure is a matter of detailed planning to he done at the sectoral and city/town levels, and has different dimensions. Appropriateness connotes adequacy in terms of capacity and quality of available infrastructure in a given period of time to sustain and support industial and urban activities at efficient levels. In the context of planning, however, the meaning of appropriateness acquires a different sense; that is effectiveness in inducing industrial and urban development along pre-determined patterns over a period of time. The agencies involved in industrial, urban and irnfrastructure development planning are necessarily large in number. So also are the levels of decision making. From the operational point of view coordination. at the city/town levels between the variogs agencies and decision-making tiers poses considerable problems. There aJ9, for example, such diverse agencies as urban development authorities, industrial development corporations, financial institutions, infrastructure development corporations, electricity authorities, and zonal railway authorities etc. whose policies and working plans need to be synchronized and dovetailed. The task is too complex to be amenable to administrative arrangements and devices adopted at the field level. Therefore, -coordination between the concerned agencies should be brought about the State level as a part of the overall planning process.
6·5 Different types of physical and social infrastructure are required for industrial and urban development. Some are required for industrial and urban devlopment. Some of these are essentially site-specific, while others form part of larger connective networks, Some infrastructure require commitment of large quantums of scarce resources and are lumpy in nature. In other words, the plicy for provision of physical and social infrastructure involves larger issues which are beyond the competence of sectoral and city/town decision-making levels.
6.6 Some of the possibilities of linking industrial development with the provision of urban infrastructure are examined below. In view of the discussion above, these are divied into two parts: "local level links" and "higher linkages."
Local Level Links
6 . 7 The possibility of forging a link between industrial and urban palnning depends on the extent to which the two processes can be controlled bv public authorities. This psossibility of control varies from case to case and, i~ order to proceed further, s-ome typology ofindustrial growth (as it impinges on urban planning processes) is necess~ry, This has been attempted in Table 6. I
21 WH-20 ~,
104
which contains some data on the growth of urban polulation in selected industrial centres which are classified into the following categories:
(i) Steel towns.
(ii) Other towns with large industrial projects.
(iii) Towns with industrial area development for large and medium industries.
(iv) Industrial town on the outskirts of a metropolis.
(v) Centres of small-scale industry.
Metropolitan areas and large industria.l cities like Bangalore, Hyderabad. a~ld Ahmedabad are deliberately excluded since they would share the characteristics of two or more of the above categories. Even in the case of the towns included in the Table the classification is approximate and involves a judgement of the dominant feature of industrial development rather than its total character. Th..e nature of the planning problem and possible solutions varies for these cases an~ we deal with them separately in what follows.
Sleel towns
6. 8 Steel towns are a class apart. Generally Indian steel plants have been set up in virgin areas wherethe urban population is negligibly low to start with though there are exceptions like the Vishakhapatnam Steel Palnt. A large integrated steel plant typically employs 20,000 to 30,000 workes who along with their dependents, may constitute a fair sized town. Hence a location. decision on a steel project implies the establishment of a new town and arrangements for planning these new towns have to be built into the project planning exercise. This is in fact done and township costs consitute nearly 7 per cent of the gross. fixed assets of integrated steel plants.
6·9 The integration of the urban planning exercise with industrial project planning carries one major danger. There is a temptation to limit the planning exercise to the housing, social welfare facilities and neighbourhood shopping required by the workers directly employed by the steel plant. This is quite inadequate. The data given in the Table shows the rapidity with which urban population has increased in the steel plant 'towns, each one ofwhich is now a large town. Moreover, their population size is far greater than the steel plant workers plus their dependents. The four public sector steel pIa.ilts between them employ over 1.6 Iakh workers, which, with a dependency ratio of I to 3 would mean a population of 4.. 8 Iakh. But in practice the four steel plant towns have a population of nearly 14 Iakhs, Part of it is of course construction labour working on projects. But even allowing for this it is clear that half or more of the population is there on account of activities stimulated by the steel plant. Workforce outside non-house1hold manufacturing was in the 45-65% range in 1971 (excludingBokaro which was under construction and wher~ the proportion was even higher). It is therefore essential that the planning exercise for such new industrial towns linked to steel plant (or similar projects) must (a) allow for a population size much larger than that attributable to the steel) pIlant (b) a large fpJ).:ge of economic ~~tivjri~~ linked to but not part of the stee V ant?
--------------- -----------
i05
. 6.10 The steel plant management's pnmary objective is to run the plant efficiently and profitably. With regard to urban planning their horizons may justifiably be limited to township planning for their workers. In fact, the B.P.E. I guidelines on township planning tend to reinforce this attitude. Generally, there is no municipality or urbzn planning authority in the local area which can undertake this task.
6. I I Company towns arc usually well planned so far as their own population are concerned. In fact Jamshedpur has often been considered a specially salubrious and comfortable city. Yet a steel town is much more than a company township and a wider framework for urban planning is required.
6. 12 One possibility would be to undertake the new town development as a separate project which would be planned, executed and administered by a separate authority constituted in the same manner as other urban development and planning authorities. The responsibility for infrastructure development would rest with this authority. The steel plant management would be given certain areas ofland for constructing houses and other amenities for their workers. Alongwith this the UDA could layout other industrial commercial and residential areas not connected with the steel plant. One difficulty that could arise with such an arrangement is that the UDA may be starved of funds and may not take up the development of urban infi:astructure in phase with the steel plant. In order to avoid this a part of the sum that would normally be a part of the usual township costs may be provided directly to the UDA by the Central Government and earmarked for specific activities. Moreover, to ensure coordination, the steel plant management could be included in the controlling Committee of the UDA. If such an arrangement can be effected there may be greater degree of coherence in the planning of new towns linked to steel plants. Procedures should also be laid down for the muncipalization of these towns in good time.
Other town with Major Projects
6.13 Major projects other than steel do not generally involve the establishment of a large new town in a virgin area. The mineral based projects are often based in remote areas away from existing centres. But typically the number of employees is quite low. A large petroleum refinery may employ only 1500 or so workers. A large cement plant may employ around 1000 workers. The huge Kudremukh mining project employs only I Goo or so workers. Engineering projects are often much larger in terms of employment. But enjoying some :fl.exibiluty in their location, they are set up near existing urban centres of some size also for drawing on local semi-skilled or skilled urban workers. For instance the BHEI} plants which between them employ around 55,000
persons· are at Bangalore Hyderabacl, Trichy, Hardwar and ]hansi. The HEC3 plant which has over 20,000 workers is at Ranchi.
1 Bureau of Public Enterprises.
2 Bharat Heavy Electricals Ltd.
a Heavy Engineering Corporation.
106
6.14 These major projects may not be large enough to require a new town; but they can and do affect the pace of urbanisation in the urban centres near them. This can be seen in the data given in the Table for Ranchi, Bhopal and Hardwar. The sharp acceleration in urban growth after 1961 in Ranchi and after 1971 in Hardwar matches the timing ofHEC and BHEL, Hardwar. In Bhopal, which has had a more sustained tendency towards high growth and in Trichy, the impact of the BHEL plant has not been so significant. The next three cases are of centres where the new major project did not involve a very large workforce (the specific projects are cement for Neemuch, a textile complex in Nagcla and a petroleum refinery in Begusarai). These are swelling, too, but not so rapidly. Kota and Bhatinda are similar cases except that they were already urban. centres of some consequence when the new project came (after 1961 in Kota and after 197 I in Bhatinda). Korba and Dhanbad show the sharp acceleration of urban growth in coal mining regions.
6. 15 The cases covered under this category generally involve the establishment of a township near the project site which is often on the outskirts of the nearly urban centre. This sort of development of relatively isolated townships can be seen in Baroda, Hyderabad and Bangalore. Water supply, sanitation and social services for these two townships are also planned exclusively and independent of the urban centre. This isolation has had several consequences. Firstly, the township cannot use effectively the services facilities available in the urban. centre, particularly in the central area. Secondly, the urban centre cannot benefit from the facilities created to service the township.
6.16 What is meant by integration in these cases? Firstly, it means that the likely impact of the project on immigration, generation of direct and indirect employment, transportation and other service activities must be assessed. Secondly, the implication of these on investment requirements for houses, roads, water supply, sanitation, social services, etc. have to be worked out. Thirdly, the responsibilities for undertaking these investments has to be apportioned between the urban development authority and the project management. Fourthly, a mechanism to find the additional requirements of the urban development authority has to be established.
6. I 7 The integration will have to be secured by negotiations and collaborative efforts at planning by the local authority and the project management. As for funding there is a case for setting up a Central scheme for project-linked urban development which can provide resources to the local authority undertaking its part of the assigned responsibility. The project authority Would obtain the funds for its responsibilities as part of the project costs.
6.18 The coal belt has certain special problems which require a wider framework. Individual coal projects are not large but taken together they do mean a large increase in 'urban' population. There is also now the growth of power generation and other activities in coal areas. Such areas of concentrated development are readily identified. They are mainly in the Damodar Valley in Dhanbad and Burdwan, around the Singrauli coalfield in UPjJ\1P and Singareni in Andhra Pradesh. In all cases what is required is a regional plan for housing, urban development and transportation. Two of the three regions are inter-state in
character and a strong element of Central intervention will be required. There is a case, in the coal belts for setting up a regional urban development authority with Central participation.
Towns with intensive industrial area development
6.19 The third category is similar to the second in that an influx ofmedium and large industries leads to rapid urban growth. It differs however in the fact that the impact is not that of one or two very large projects but ofseveral smaller ones. Hence a linkage based on collaborative effort by project managements and the local authority may not be workable.
6.20 There are many areas in the country where such developments have taken place. Table 6.1 also presents data on three of them where the impact seems to be substantial. All three are in Maharashtra. The first two were taken up for intensive development by SIC01vP after 1971. The third is an off-shoot ofPune which started growing earlier in the sixties. All three are largely a consequence of a deliberate industrial location policy pursued by the State Government.
6.21 The development of industrial areas and industrial estates has been undertaken by practically all State Governments. Their decisions on the location of these areas/estates is sometimes based on their assessment of where industry will want to move and sometimes on where they think it ought to come. Planning for these estates does not normally go beyond land development, laying down of f>ower and water supply systems and sanitation and some limited infrastructure facilities. The implications of industrial growth on urban development are seldom taken into account or allowed for in the development plants. Responsibilities are also fragmented and the industrial areas/states are often developed by a corporation which has no links with the Urban Development of the State Government or the local authority. There are some exceptions however. In Maharashtra an attempthas been made to undertake simulteneous development of industrial areas and related urban infrastructure, e.g. in Aurangabac1. However; such cases of integration are very few indeed.
6.22 The rational answer to the planning problem in these cases lies in integrated planning of industrial and urban infrastructure in the context of an overall urban development plan. The entire exercise should be undertaken by one agency which should be the local authority. The industrial promotion organisation would be given some land by the local authority. The development of housing, commuter transport facilities, water supply, sanitation, etc. would be undertaken by the local authority which would be specifically funded for this purposes. If necessary special state level schemes for Urban Development in Industrial Areas may be set up to provide a channel for such finding. As has been recommended earlier the coordination of these investments as well as allocation should be done at the state level in the preparation of the regional and state level urban development plans. '
Industrial Towns on the Outskirts on Metropolitan Cities
6.23 This category like the previous one generally involves the inflow of a large number of units each one of which, by itself, does not add much to urban
I/State Industries Corporation of Maharashtra.
rag
population. iThe difference however is that the industrial towns in this category are a part of a large metropolitan area and the 'urban' impact of industrial jobs is diffused throughout a large structure.
6.24 Fringe development of this type has been particularly marked around Delhi and Bombay. The data given in the Table show the rapidity of population growth in towns like Faridabad and Ghaziabad near Delhi, and Thane and Ulhasnagar near Bombay. All of these towns have grown largely because of the growth of industrial employment.
6.2 ~ The planning problem in this case cannot be tackled by taking on an urban infrastructure and housing component to industrial area plans. This is bccasuse these towns are part of a larger metropolitan area and the urban impact of industrial jobs is not localised. The rational answer to the planning problem in these cases lies in the development plans for the larger metropolitan region (the NCR in the case of Delhi and the BMR in the case of Bombay). These larger development plans should cover the planning ofindustrial areas, housing, transportation, water supply etc. on a regional basis. A separate, partial exercise for a sub region within the metropolitan region, may be justified but only as part ofan overall planning strategy for the whole region.
6.26 We have most of the rational answers in theory. In practice, the metropolitan regional plans lack bite and much of the development in fringe areas is unplanned and sometimes unwanted. The urban pressures arising from these development are met by piecemeal solutions. What is required now is not special schemes which will reinforce this piecemeal approach but a serious attempt at strengthening the framework of metropolitan regional planning.
Centres of small scale industry
6.27 This last category poses in many ways the most difficult planning problem. Developments are diffused and difficult to predict. Often the industrial units are scattered through the city and do not necessarily congregate in a designated industrial area. The units are far too 'small to be able to contribute much by way of housing or other facilities.
6.28 There are a large number of such centres and the Table gives data all a selected cross section. Surat is a centre for art silk and diamond cutting, Ludhiana for woolens, Batala for machine tools, Tohalkaranji for textiles and engineering, Malegaon and Bhivandi for powerlooms. All of these are centres of modern small-scale manufacturing. The gowth pattern varies and reflects . the fortunes of the industry on which they are dependent. With the exception of Surat, which is larger and more diversified, the others showed rapid growth between 1961 and 1971 and some deceleration ther-eafter. The last four cases are traditional manufacturing centres. Firozabad, a centre for glassware and Khurja, a centre for pottery are not entirely handicraft based places. ~annanore is a centre for handlooms and Bhadohi for capets. The growth rates 1ll all these cases seem lower than for modern small-scale industries possibly becau~e the skilled persons are already there in the towns and growth only means
. more Intensive employment rather than Immigration.
109
6.:29 There is no simple answer to the planning problem in these centres of small scale industry. The main problem lies in the difficulty in predicting the likely growth in employment, immigration and urban population and in assessing urban impact because of the diffused location of units within the urban centre. These difficulties reflect the lack of control over the industrial growth process. All that can be suggested is that in all such centres the local authority should build up some experties on the two or three major small scale industries in the area. On the basis of this expertise they can form assessments of national or regional trends in the industry, its technological compulsions, its requirements of power, transportation, water and sanitation, the type oflabour force required, etc. These assessments can then be taken into account in the preparation of urban development plans. Moreover, in many of these towns, the provision of urban infrastructure will typically follow the growth of industry. At a minimum the preparation of state and regional level urban development plans should take retrospective account of the activities that have grown already and provide for the required infrastructure.
Higher Level Links
6.30 The discussion so far has concentrated on how urban planning and industrial planning can be linked at a local level. Certain mechanisms for forging links have been suggested. However, such local level links may not be enough. Many of the decisions on outlays and strategies for urban development and industrial development are made at a higher level in the apparatus for State planning and Central planning. It is necessary to ask whether some link between urban and industrial planning is required in the methods and organisational arrangements for plan formulation.
6<~I The link between. urban and industrial development can be articulated only if National ani State plans articulate clearly the prospective pattern of industrial location. This is seldom the case. The location of certain major projects is known but the bulk of the increase in industrial employment comes from smaller projects and private sector activity whose locational pattern is not analysed in the National or State plans. An important reason for this is our lack of understanding of the determinants of location decisions. The Central and State
. Governments do have policy instruments which will influence location decisions e.g. industrial licensing, various subsidy schemes, development ofindustrial areas! estates. However, the quantitative impact of these schemes is difficult to forecast. In any case, even if the prospective pattern of industrial location could be forecast or controlled, there are further difficulties in assessing the quantiative impact of industrial growth 011 immigration and urban growth.
6,32 The linkage that is really required in Central and State plans relates basically to public sector outlays and policies 011 industrial location and urban developmen t. For instance, ifthe location policy seeks to shift industries away from metropolitan areas towards medium sized towns, there must be a corresponding orientation in urban development strategy. Since most industrial and manufacturing tOWES thrive best with population 250,000 to .500,000, this category and those which are likely to enter this country by 1991 must receive top consideration. Or, if industrial location policy requires the development ofmany new growth centres, there must be a corresponding provision in the outlays for urban development,
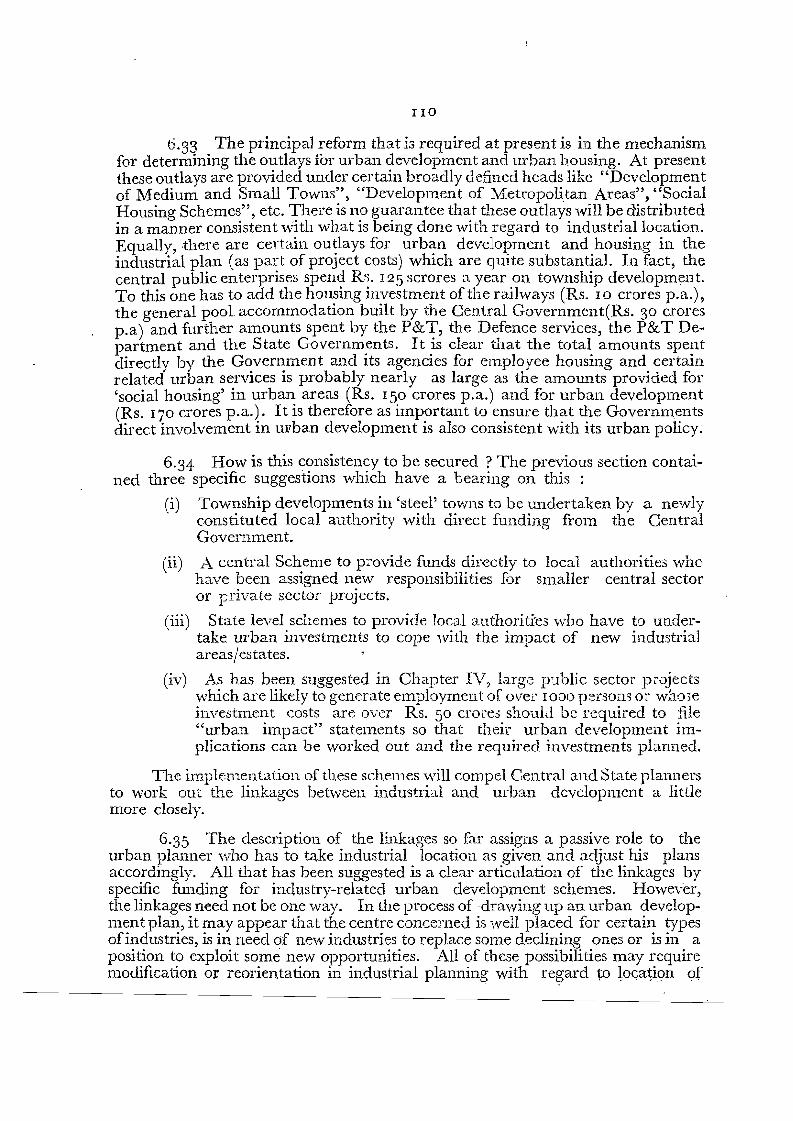
110
6.33 The principal reform that ia required at present is in the mechanism for determining the outlays for urban development and urban housing. At present these outlays are provided under certain broadly defined heads like "Development of Medium and Small Towns", "Development of Metropolitan Areas", "Social Housing Schemes", etc. There is no guarantee that these outlays will be distributed in a manner consistent with what is being done with regard to industrial location. Equally, there are certain ou~lays for urb,;n development and .housing in the industrial plan (as part of project costs) which are quite substantial. In fact, the central public enterprises spen1 R~~. I 25 scrores a year .on township development. To this one has to add the housmg investment of the railways (Rs. 10 crores p.a.), the general pool accommodation built by the Central Government(Rs. 30 crores p.a) and further amounts spent by the P&T, the Defence services, the P&T Department and the State Governm.ents. It .is clear that the total. amounts spe~lt directly by the Government and Its agencies for employee housing and certain related urban services is probably nearly as large as the amounts provided for 'social housing' in urban areas (Rs. 150 crores p.a.) and for urban development (Rs. 170 crores p.a.). It is therefore as important to ensure that the Governments direct involvement in urban development is also consistent with its urban policy;
6.34 How is this consistency to be secured? The previous section contained three specific suggestions which have a bearing on this :
(i) Township developments in 'steel' towns to be undertaken by a newly . constituted local authority with direct funding from the Central
Government.
(ii) A central Scheme to provide funds directly to local authorities who have been assigned new responsibilities for smaller central sector or Frivate sector projects.
(iii) State level schemes to provide local authorities who have to under, take urban investments to cope with the impact of new industrial
areas/estates.
(iv) As has been suggested in Chapter IV, large public sector projects which are likely to generate employment of over IO;)!) person;; or whose investment costs are over Rs. 50 crores should be required to file "urban impact" statements so that their urban development implications can be worked out and the required investments planned.
The implementation of these schemes 'will compel Central and State planners to work out the linkages between industrial and urban development a little more closely.
6.35 The description of the linkages so far assigns a passive role to the urban planner who has to take industrial location as given and adjust his plans accordingly. All that has been suggested is a clear articulation of the linkages by specific funding for industry-related urban development schemes. However, the linkages need not be one way. In the process of drawing up an urban development plan, it may appear that the centre concerned is well placed for certain types ofindustries, is in need of new industries to replace some declining ones or is in a position to exploit some new opportunities. All of these possibilities may require modification or reorientation in industrial planning with regard to location of
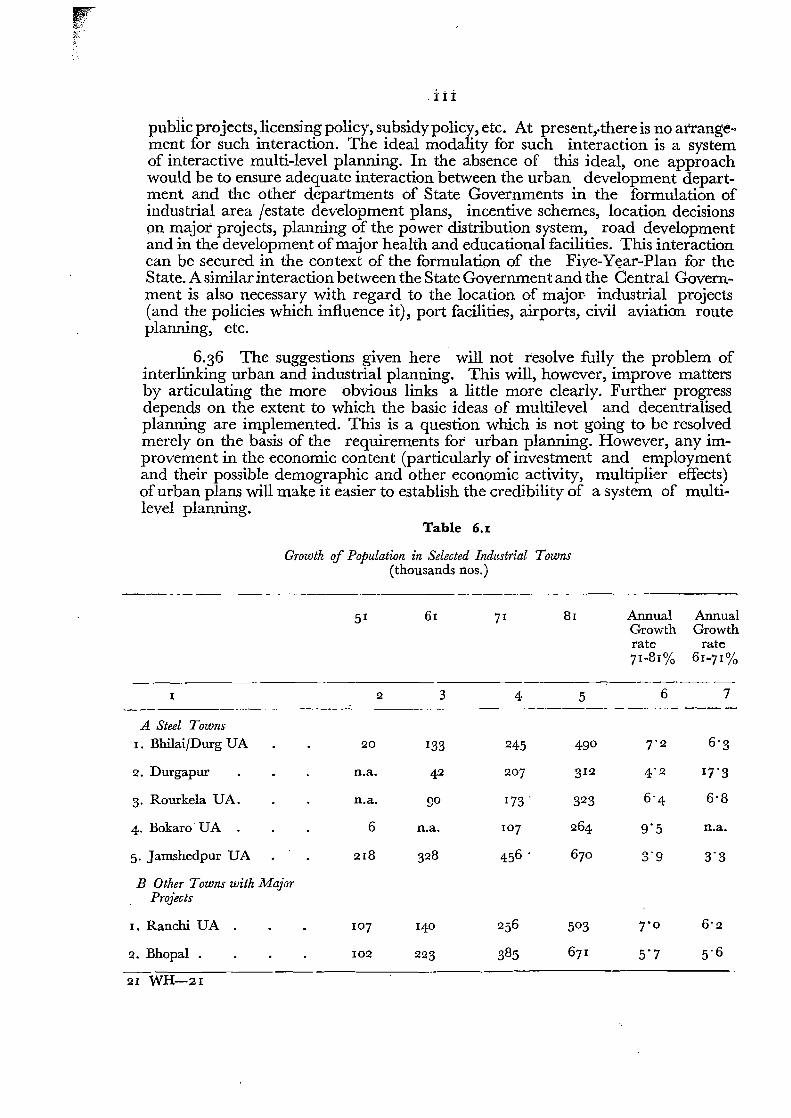
~.
. i r i:
public projects, licensing policy, subsidy policy, etc. At present.there is no arrangement for such interaction. The ideal modality for such interaction is a system of interactive multi-level planning. In the absence of this ideal, one approach would be to ensure adequate interaction between the urban development department and the other departments of State Governments in the formulation of industrial area jestate development plans, incentive schemes, location decisions on major projects, planning of the power distribution system, road development and in the development of major health and educational facilities. This interaction can be secured in the context of the formulation of the Five-Year-Plan for the State. A similar interaction between the State Government and the Central Government is also necessary with regard to the location of major. industrial projects (and the policies which influence it), port facilities, airports, civil aviation route planning, etc.
6.36 The suggestions given here will not resolve fully the problem of interlinking urban and industrial planning. This will, however, improve matters by articulating the more obvious links a little more clearly. Further progress depends on the extent to which the basic ideas of multilevel and decentralised planning are implemented. This is a question which is not going to be resolved merely on the basis of the requirements for urban planning. However, any improvement in the economic content (particularly of investment and employment and their possible demographic and other economic activity, multiplier effects) ofurban plans will make it easier to establish the credibility of a system of multilevel planning.
Table 6.1
Growth of Population in Selected Industrial Towns (thousands nos.)
--_._-----------------------_._-..
51 61 71 81 Annual Growth rate 71 8 1%
Annual Growth
rate 61-71%
I
A Steel Towns I. BhilaifDurg UA
2
20
3
133
4 ._
245
5 -----
49°
-6
7'2
7
6"3
2. Durgapur n.a. 42 2°7 312 4"2 17'3
3. Rourkela VA. n.a. 9° 173 323 6'4 6'8
4. Bokaro UA . 6 n.a. 1°7 264 9'5 n.a.
5. ]amshedpur VA 218 328 456 . 670 3'9 3"3
B Other Towns with Major Projects
7'0I. Ranchi VA 1°7
2. Bhopal. 102 223 5'7
21 WH-21
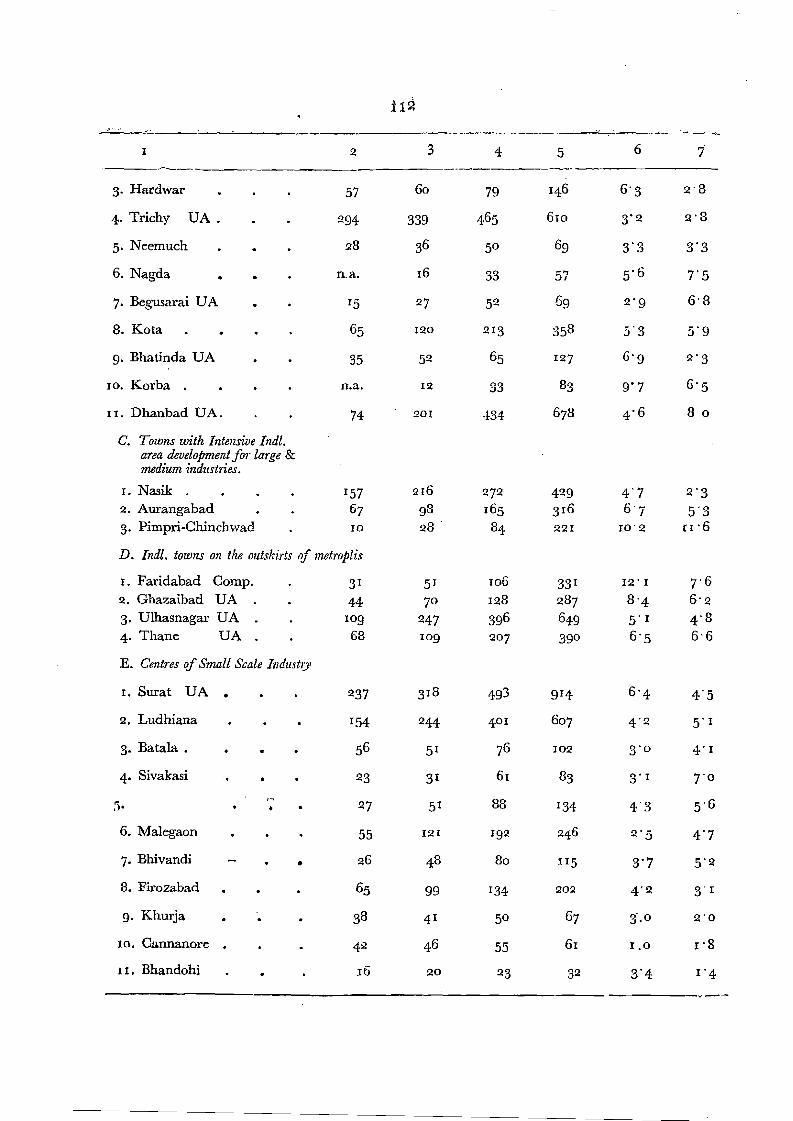
i12
1 3 4 5 6 1
3. Hardwar 57 60 79 146 6'3 2'8
4. Trichy VA. 294 339 465 6ID 3'2 2'8
5. Neemuch 28 36 50 69 3'3 3'3
6. Nagda n.a, 16 33 ~.,
;)/ 5'6 7'5
7. Begusarai V A IS 27 52 69 2'9 6'8
8. Kota 65 120 21 3 358 5"3 5'9
g. Bhatinda VA 35 52 65 127 G'9 2'3
10. Korba n.a. 12 33 83 9'7 6'5
II. Dhanbad VA, 74 201 ·134 678 4'6 8 0
C. Towns with Intensive Indl. area developmentfor large & medium industries.
I. Nasik 157 2r6 272 4'29 4'7 2'3 2. Aurangabad 67 98 165 316 6'7 5'3 3. Pimpri-Chinchwad 10 28 8<1 221 10'2 [l'6
D. Indl, towns on the outskirts of metroplis
I. Faridabad Compo 31 51 J06 331 12' 1 7"6 2. Ghazaibad VA 44 70 128 287 8"4 6'2 3. Ulhasnagar VA 109 247 396 649 5' 1 4'8 4. Thane VA 68 109 2°7 39° 6'5 6'6
E. Centres ofSmall Scale Industry
I. Surat VA • 237 318 493 914 6'4 4'5
2. Ludhiana 154 244 4°1 607 4"2 5' I
3, Batala , 56 51 76 102 3'0 4' 1
4· Sivakasi 23 31 61 83 3' 1 7"0
:l. 27 51 88 134 4'3 5'6
6. Malegaon 55 121 192 246 2'5 4'7
7, Bhivandi • 26 48 80 IIS 3'7 5'2
8. Firozabad 65 99 134 202 4'2 3' 1
g, Khurja 38 41 5° 67 g,o 2'0
10. Cannanore . 42 46 55 61 1,0 1'8
I 1. Bhandohi 16 20 23 32 3'4 1'4
VII. THE URBANISA1 ION OF NEW AREAS
Introduction
7.1 Chapter II gives a picture of the rather varied experience in urbanisation and economic development that exists in India. It embraces a range of conditions varying from the poorest and least developed to some of the middle income countries. Regions emerge as very important entities, each with its own hierarchy ofdifferent sized classes of towns and cities. This leads instance to one of the main recommendations in this report that the planning of urban development should be on a disaggregated regional basis and not in bunches of similar size classes of towns and cities across India. Within this general approach, the special needs of metropolitan cities and key industrialising cities as forming a national network of markets for goods and services have been recognised and suggestions made for the improved planning of these cities. This chapter decides on other areas which need special attention in terms ofurban policy in the future. These areas are those that have shown a significantly accelerated rate of urbanisation during the last decade but lack adequate investments in their urban infrastructure. This brief analysis underlines the need for attention on more regional studies of urbanisation and economic development. ,
The Pattern of Urbanisation by Sub-Regions
7.'2 The National Sample Survey has identified economic sub-regions within states. These have been used often for regional analysis.' There are other classifications of regions more appropriate for urban analysis but the N.S.S. regions are used here for convenience and to illustrate some of the problems that exist in particular sub-regions.
7.3 Appendix Tables A 7.1 andA 7.2 give the urban and rural populations for the regions, the share of each region in the state and the levels of urbanisation in 1971 and 198!. Table 7.1 uses these data to derive growth rates of total population, urban population, rural population and the URGD. These data are useful for better understanding ofthe high rates of urban growth that are observed in particular regions.
7.4 vVe first focus on the regions with the lowest levels of urbanisation. There are three regions with levels of urbanisation around or lower than 10
percent corresponding to the least developed countries in the world. These are Northern Bihar, Southern Orissa and Eastern Uttar Pradesh. In fact, Eastern D.P. and Northern Bihar constitute a contiguous belt wtih a total population of almost 70 million people. Other regions with extremely low levels of urbanisation of less than 15 percent are Coastal Orissa, Southern Rajasthan, Northern Orissa, Central Bihar and Eastern Madhya Pradesh. Except for Southern Rajasthan, all the others are in the eastern and Central Eastern belts of the country.
1 They have been used, for example in Amitabh Kundu and Moonis Raza. Indian Economy : The Regional Dimension, New Delhi: Spectrum Publishers 1982,
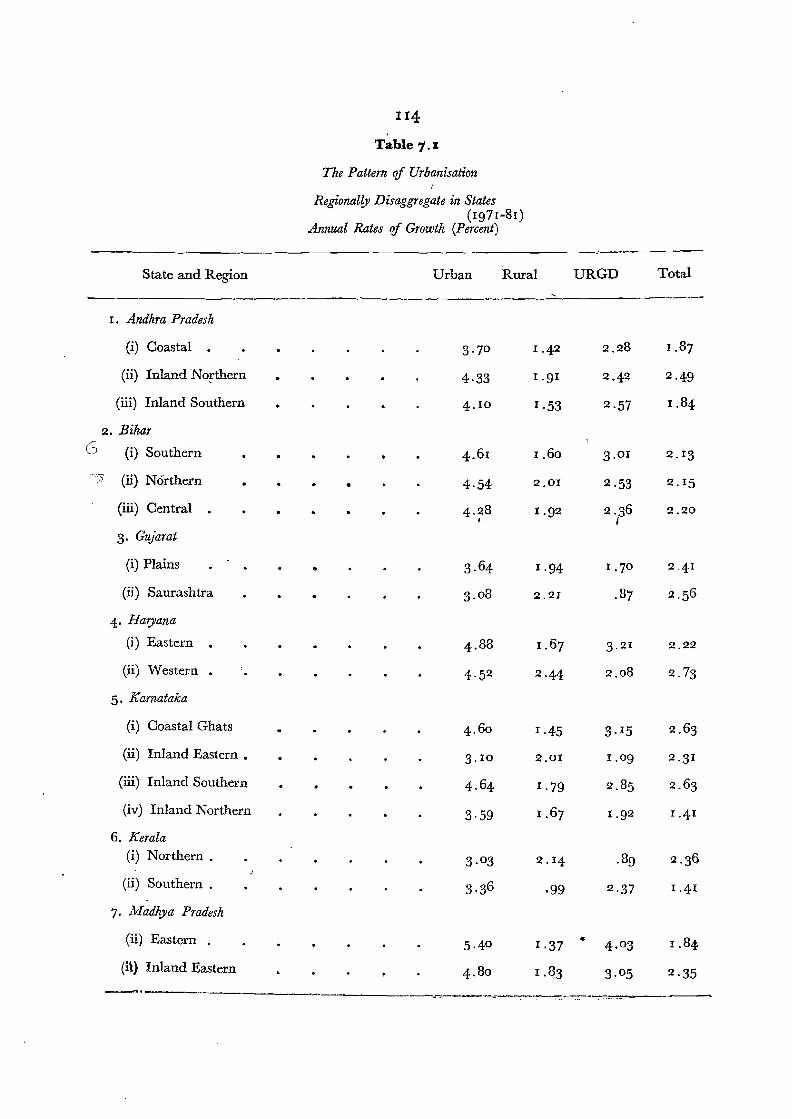
II4 \
Table 1.1
The Pattern of Urbanisation
Regionally Disaggregate in States (1971-81)
Annual Rates of Growth (Percent)
---'-- _._-.----
State and Region Urban Rural URGD Total
I. Andhra Pradesh
(i) Coastal · 3.70 1.42 2.28 1.87
(ii) Inland Northern 4·33 1.91 2·42 2·49
(iii) Inland Southern 4. 10 1.53 2·57 1.84
2. Bihar (~) (i) Southern 4. 61 1.60 3.01 2.13
-:} (li) Northern 4·54 2.01 2·53 2.15
(iii) Central · 4. 28 , 1.92 2.36 I
2.20
3. Gujarat
(i) Plains .. 3. 64 1.94 1.70 2.41
(ii) Saurashtra 3. 08 2.21 .87 2.56
4. Haryana
(i) Eastern · 4. 88 1. 67 3. 21 2.22
(li) Western · 4.52 2·44 2.08 2.73
5. Karnataka
(i) Coastal Ghats 4. 60 1.45 3. 15 2.63
(ii) Inland Eastern • 3. 10 2.01 1.°9 2.31
(iii) Inland Southern 4.64 I. 79 2.85 2.63
(iv) Inland Northern 3·59 1.67 1.92 1.41
6. Kerala (i) Northern • 3·°3 2.14 .89 2.36
(ii) Southern . 3.36 .99 2·37 I.,p
7. Madhya Pradesh
(ii) Eastern 5.40 1.37 ..
4. 03 1. 84
(n) Inland Eastern 4. 80 1. 83 3. 05 2·35
'... ...-•..-~
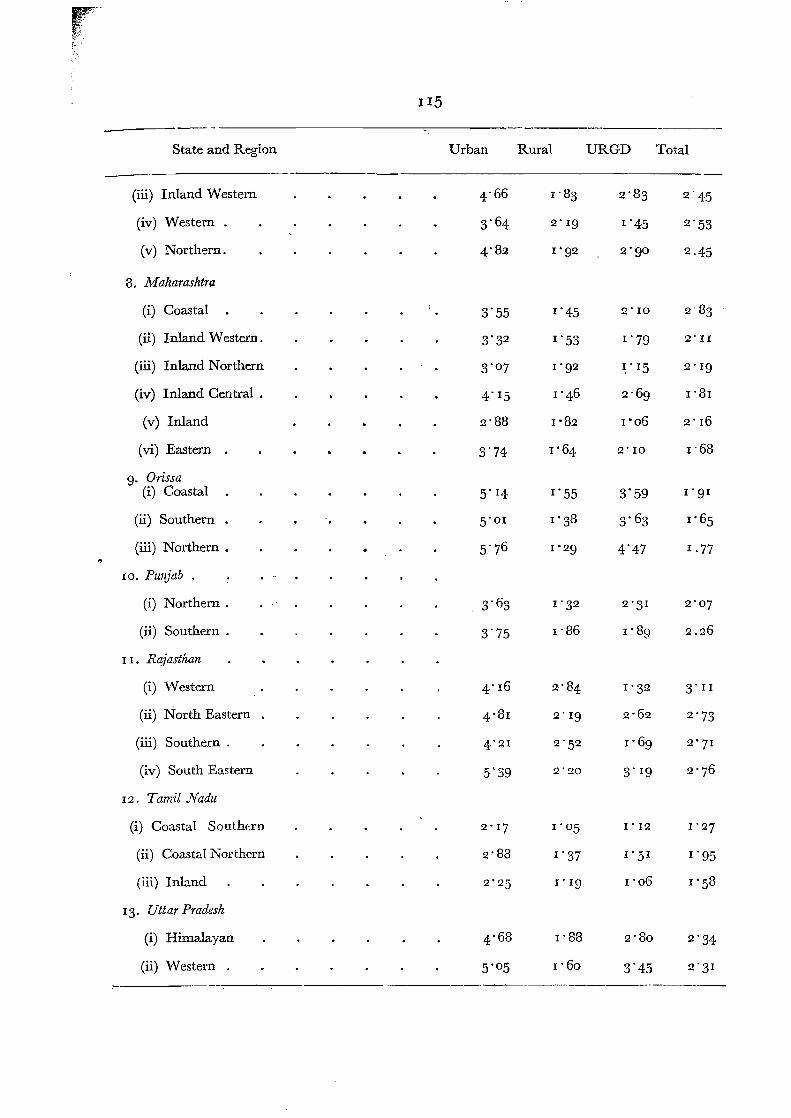
II5
State and Region Urban Rural URGD Total
--(iii) Inland Western 4'66 1" 83 2'83 2 45
(iv) Western 3'64 2"19 1'45 2'53
(v) Northern, 4'82 1'92 2'90 2·45
8, Maharashtra
(i) Coastal 3'55 1"45 2' 10 2-83
(ii) Inland Western, 3'32 1" 53 1'79 2' I I
(iii) Inland Northern 3'07 1'92 ~"I5 2' 19
(iv) Inland Central , 4" IS 1'46 2'69 1'81
(v) Inland 2'88 1"82 1'06 2' 16
(vi) Eastern 3'74 1'64 2' 10 1"68
9, Orissa (i) Coastal 5" 14 I' 55 3'59 I" 91
(ii) Southern 5'01 1'38 3'63 1" 65
(iii) Northern • 5'76 1'29 4'47 1.77 ., 10, Punjab
(i) Northern, 3'63 1"32 2'31 2'07
(ii) Southern, 3'75 1"86 I' 89 2,26
I I, Rajasthan
(i) VVestern 4' 16 2'84 1'32 3' I I
(ii) North Eastern 4'81 2"19 2,62 2'73
(iii) Southern, 4'21 2'52 1'69 2'71
(iv) South Eastern 5<39 2'20 3" 19 2'76
12. Tamil Nadu
(i) Coastal Southern 2' 17 I' 05 1'12 1"27
(ii) Coastal Northern 2'83 I' 37 I' 51 1'95
(iii) Inland 2'25 1'19 1'06 I' 58
13' Uttar Pradesh
(i) Himalayan 4'68 1'88 2'80 2'34
(ii) vVestern 5'°5 1'60 3'45 2'31 .-------_..._._-_.----p .._---
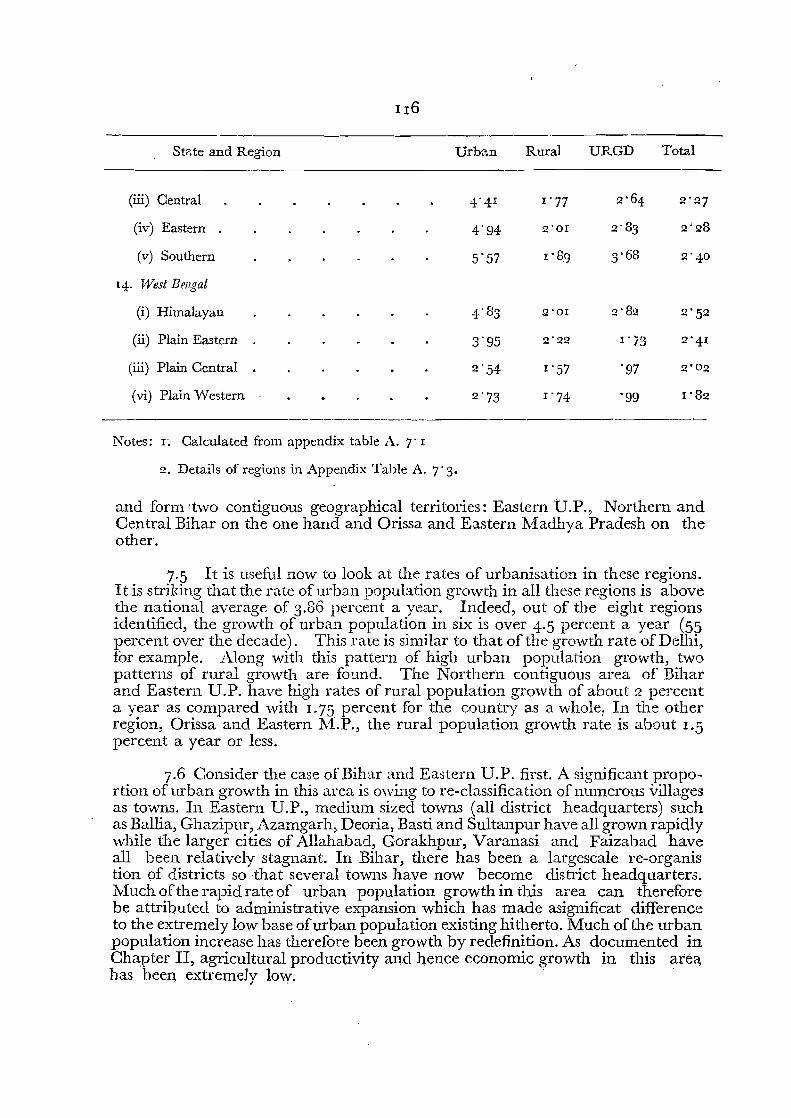
-----------State and Region Urban Rural URGD Total
(iii) Central 4'41 1'77 2'64 2'27
(iv) Eastern 4'94 2'01 2'83 2'28
(v) Southern 5'57 1'89 3'68 2'40
q, f'Vest Bel/gal
(i) Himalayan 4'83 Z'OI 2'82 2'52
(ii) Plain Eastern 3'95 2-22 I'i3 2'41
(iii) Plain Central , 2'54 I'57 '97 2'02
(vi) Plain Western 2'73 1'74 '99 1'82 __________4 ______
Notes: 1", Calculated from appendix table A, 7' I
2. Details of regions in Appendix Table A. 7' 3.
and form 'two contiguous geographical territories: Eastern D.P., Northern and Central Bihar on the one hand and Orissa and Eastern Madhya Pradesh on the other.
7.5 It is useful now to look at the rates of urbanisation in these regions. It is striking that the rate of urban population growth in all these regions is above the national average of 3.36 percent a year. Indeed, out of the eight regions identified, the growth of urban population in six is over 4,5 percent a year (55 percent over the decade). This rate is similar to that of the growth rate ofDelhi, for example. Along with this pattern of high urban population growth, two patterns of rural growth are found, The Northern contiguous area of Bihar and Eastern V.P. have high rates of rural population. growth of about 2 percent a year as compared with 1.75 percent for the country as a whaler In the other region, Orissa and Eastern 1-1.P., the rural population growth rate is about 1.5 percent a year or less.
7.6 Consider the case of Bihar and Eastern V.P, first, A significant proportion of urban growth in this area is owing to re-classification of numerous villages as towns, In Eastern D.P., medium sized towns (all district headquarters) such as Ballia, Ghazipur, Azamgarh, Deoria, Basti and Sultanpur have all grown rapidly while the larger cities of Allahabad, Gorakhpur, Varanasi and Faizabad have all been relatively stagnant. In Bihar, there has been a largescale re-organis tion of districts so that several towns have now become district headquarters. Much of'the rapid rate of urban population growth in this area can therefore be attributed to administrative expansion which has made asignificat difference to the extremely low base ofurban population existing hitherto, Much ofthe urban population increase has therefore been growth by redefinition. As documented in Chapter II, agricultural productivity and hence economic growth in this area, has been extremelv low. - . ,. .
Itt 7.7 Now consider the case of Orissa and Eastern Madhya Pradesh. These
regions have exhibited characteristics quite similar to some other regions with somewhat higher initial urban levels: Southern Bihar, South Eastern Rajasthan and Southern V.P. All these regions exhibit very high urban population growth along with low rural population growth resulting in VRGDs higher than 3 percent. They are characterised by heavy industrial irivestments in large public sector enterprises: Ranchi, Dhanbad, Bokaro in Southern Bihar; Durg-Bhilai and Raipur in Eastern Madhya Pradesh ; Orissa has Rourkela, Sambalpur and the new capital city of Bhubhaneshwar ; South East Rajasthan has Kotah and Southern V.P. has Jhansi. In common with Northern Bihar and Eastern V.P., these regions have also had low agricultural productivity growth, and consequently these large industrial investments have induced high rates ofmigration from rural areas as evidenced by the extremely low rates of rural population growth. It should also be noted that these areas have a high proportion of tribal population.
7.8 Other regions with high URGD (over 3 percent) that stand out are Western U.P. and Eastern Haryana, coastal Karnataka, and Inland Eastern Madhya Pradesh. \Vestern U. P. and Haryana form a district region with Punjab. They have all had relatively low rural population growth of around r :5 percent a year despite very high gains in agricultural productivity. Here urban growth is taking place because ofgains in income leading to demands for agriculture related urban services. It is noticeable that apart from Haryana, these regions are well served by an existing network ofsmall and medium towns which are growing quite rapidly in the wake of the green revolution. Haryana has had a shorter record ofrural prosperity and also had a low initial level ofurbanisation. Consequently, a large number ofsmall towns have appeared in Haryana over the last decade.
7.9 Thus three distinct phenomena of high urban growth each with a different reason have been identified. Rapid urbanisation is taking place as a result ofmajor public investments in industry in otherwise backward areas. At the same time, rapid urbanisation is also taking place as a result ofrapid agricultural growth in other regions, It seems clear that, given demand for labour in urban areas, rural urban migration is likely to take place quite readily in both prosperous agricultural regions and agriculturally poor regions. In contrast, the third kind of rapid urban growth is observed in agriculturally stagnant regions where there is no readily identifiable demand in urban areas except by redefinition ofsettlements for administrative expansion.
7.ro It is now necessary to identify the regions with low urban growth. With the average urban population growth being 3.86 percent a year for the country, regions with less than 3 . 25 percent may be identified. These arc Saurashtra, Inland Eastern Karnataka, Northern Kerala, parts of Maharashtra, and Tamilnadu. Further insight is gained by examining the record of growth of in dividual towns. It is found that out ofabout I25 towns in the country which had negligible population growth in the last decade (less than r%a year), 90 were confined to (r ) Tamilnadu (48), (2) Maharashtra (20), (3) Kerala (9), (4) Gujarat (7) and (5) Karnataka (6)-mainly in the sub-regions identified above as slow growing. Of these areas, it is notable that all of the regions in Tamilnadu had very low rural population growth (lessthan r . 5 percent a year) as well. The definitional problems
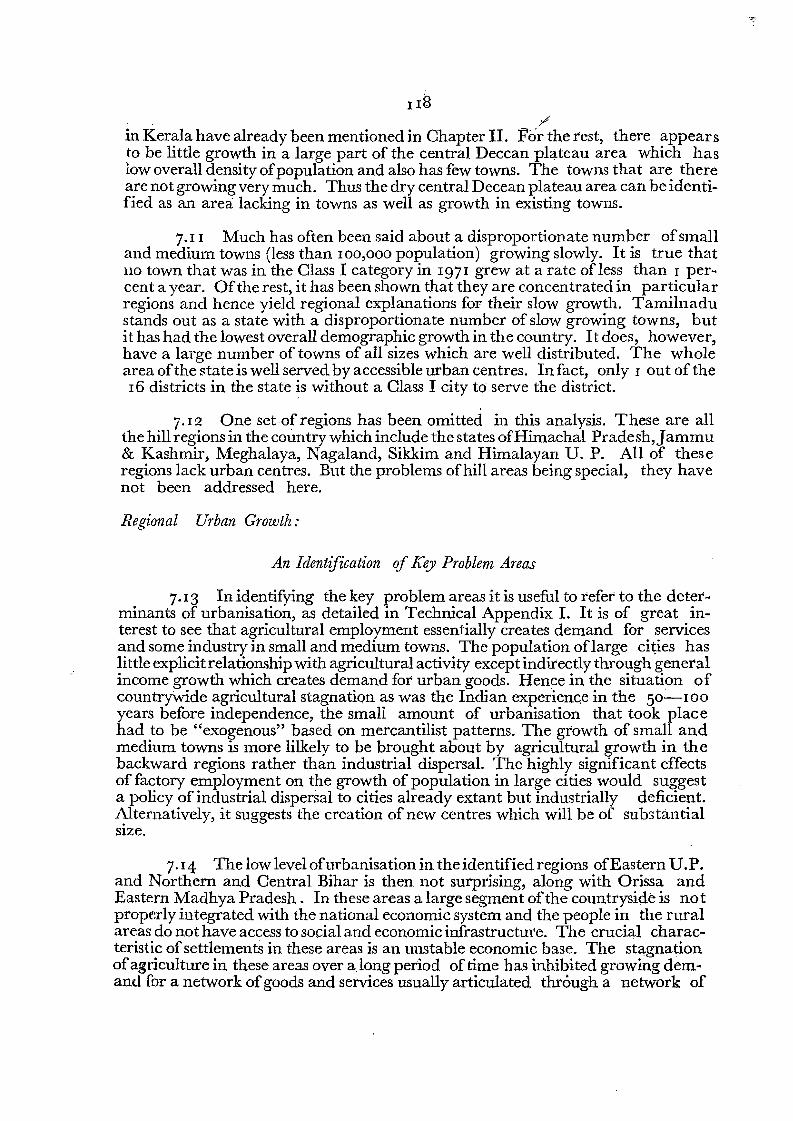
in Kerala have already been mentioned in Chapter II. For~
the test, there appears to be little growth in a large part of the central Deccan plateau area which has low overall density ofpopulation and also has few towns. The towns that are there are not growing very much. Thus the dry central Decean plateau area can be identified as an area lacking in towns as well as growth in existing towns.
7.1 I Much has often been said about a disproportionate number ofsmall and medium towns (less than 100,000 population) growing slowly. It is true that 110 town that was in the Class I category in 1971 grew at a rate ofless than 1 percent a year. Ofthe rest, it has been shown that they are concentrated in particular regions and hence yield regional explanations for their slow growth. Tamilnadu stands out as a state with a disproportionate number of slow growing towns, but it has had the lowest overall demographic growth in the country. It does, however, have a large number of towns of all sizes which are well distributed. The whole area ofthe state is well served by accessible urban centres. In fact, only lout of the 16 districts in the state is without a Class I city to serve the district.
7.12 One set of regions has been omitted in this analysis. These are all the hill regions in the country which include the states ofHimachal Pradesh,]ammu & Kashmir, Meghalaya, Nagaland, Sikkim and Himalayan V. P. All of these regions lack urban centres. But the problems ofhill areas being special, they have not been addressed here.
Regional Urban Growth:
An Identification of Key Problem Areas
7. I 3 In identifying the key problem areas it is useful to refer to the determinants of urbanisation, as detailed in Technical Appendix 1. It is of great interest to see that agricultural employment essentially creates demand for services and some industry in small and medium towns. The population oflarge cities has little explicit relationship with agricultural activity except indirectly through general income growth which creates demand for urban goods. Hence in the situation of countrywide agricultural stagnation as was the Indian experience in the 50-100 years before independence, the small amount of urbanisation that took place had to be "exogenous" based on mercantilist patterns. The growth of small and medium towns is more lilkely to be brought about by agricultural growth in the backward regions rather than industrial dispersal. The highly significant effects of factory employment on the growth of population in large cities would suggest a policy of industrial dispersal to cities already extant but industrially deficient. Alternatively, it suggests the creation of new centres which will be of substantial SIze.
7.14 The low level ofurbanisation in the identified regions ofEasternV.P. and Northern and Central Bihar is then not surprising, along with Orissa and Eastern Madhya Pradesh. In these areas a large segment ofthe countryside is not properly integrated with the national economic system and the people in the rural areas do not have access to social and economic infrastructure. The crucial characteristic ofsettlements in these areas is an unstable economic base. The stagnation ofagriculture in these areas over along period of time has inhibited growing demand for a network ofgoods and services usually articulated through a network of
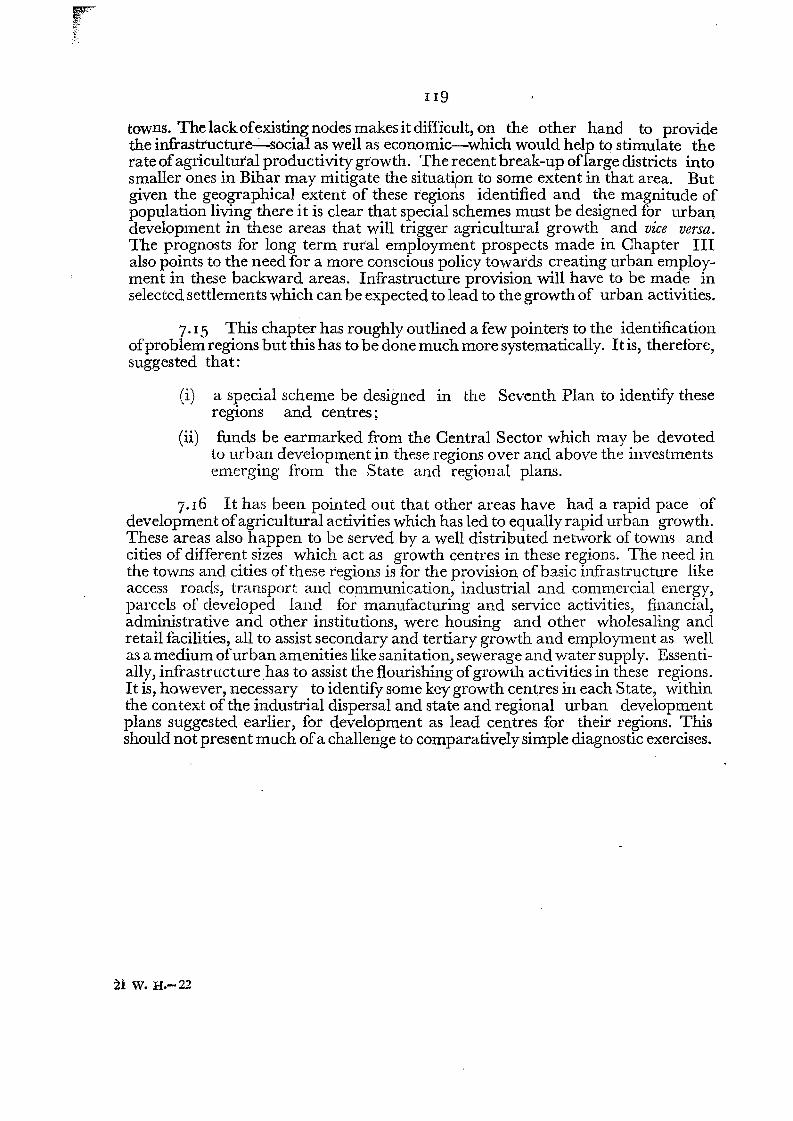
II9
towns. The lackofexisting nodes makes it difficult, on the other hand to provide the infrastructure-s-social as well as economic-which would help to stimulate the rate ofagricultural productivity growth. The recent break-up oflarge districts into smaller ones in Bihar may mitigate the situatipn to some extent in that area. But given the geographical extent of these regions identified and the magnitude of population living there it is clear that special schemes must be designed for urban development in these areas that will trigger agricultural growth and vice versa. The prognosts for long term rural employment prospects made in Chapter III also points to the need for a more conscious policy towards creating urban employment in these backward areas. Infrastructure provision will have to be made in selected settlements which can be expected to lead to the growth of urban activities.
7. 15 This chapter has roughly outlined a few pointers to the identification ofproblem regions but this has to be done much more systematically. It is, therefore, suggested that:
(i) a special scheme be designed in the Seventh Plan to identify these regions and centres;
(ii) funds be earmarked from the Central Sector which may be devoted to urban development in these regions over and above the investments emerging from the State and regional plans.
7.16 It has been pointed out that other areas have had a rapid pace of development ofagricultural activities which has led to equally rapid urban growth. These areas also happen to be served by a well distributed network of towns and cities of different sizes which act as growth centres in these regions. The need in the towns and cities of these regions is for the provision of basic infrastructure like access roads, transport and communication, industrial and commercial energy, parcels of developed land for manufacturing and service activities, financial, administrative and other institutions, were housing and other wholesaling and retail facilities, all to assist secondary and tertiary growth and employment as well as a medium ofurban amenities like sanitation, sewerage and water supply. Essentially, infrastructure .has to assist the flourishing ofgrowth activities in these regions. It is, however, necessary to identify some key growth centres in each State, within the context of the industrial dispersal and state and regional urban development plans suggested earlier, for development as lead centres for their regions. This should not present much ofa challenge to comparatively simple diagnostic exercises.
21 W. H.-22
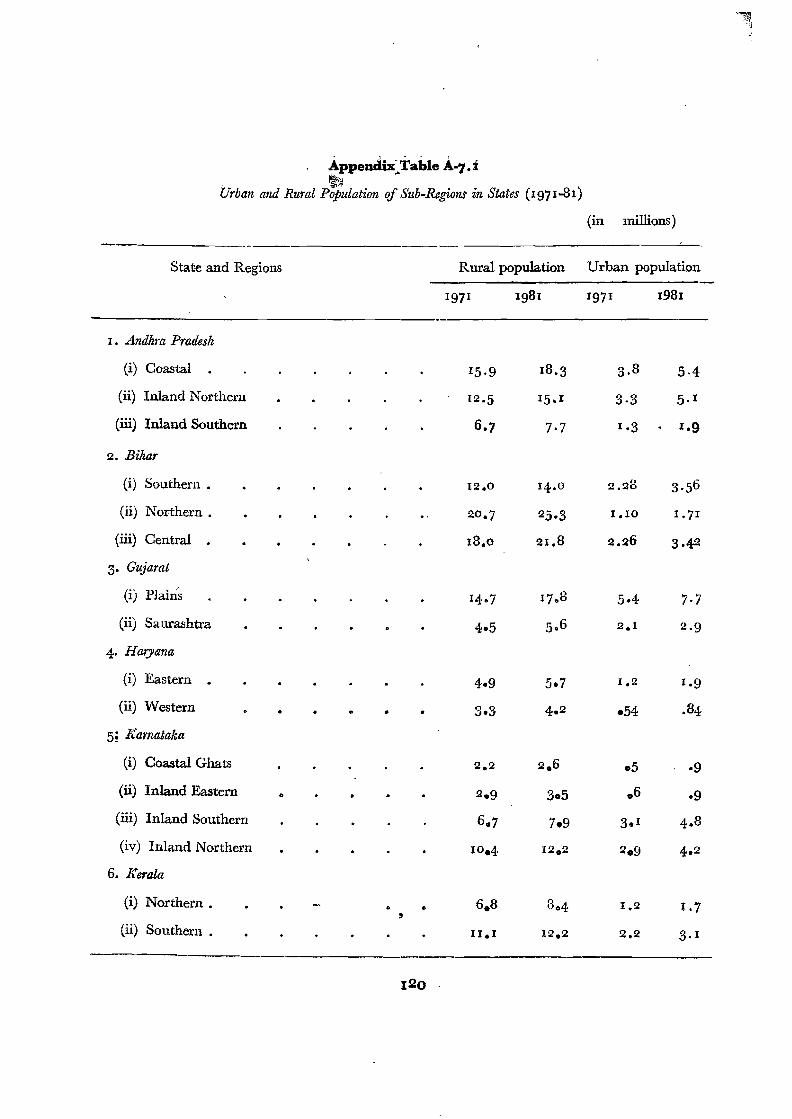
Appendb(Table A-,.f . ~~~'" Urban and Rural Population if Sub-Regions in States (1971-8 I )
(in millions)
State and Regions Rural population Urban population
I. Andhra Pradesh
(i) Coastal
(ii) Inland Northern
(iii) Inland Southern
2. Bihar
(i) Southern .
(ii) Northern .
(iii) Central
3- Gujarat
(i) Plains
(ii) Saurashtra
4. Harysna
(i) Eastern •
(ii) Western •
5; Karnataka
(i) Coastal Ghats
(ii) Inland Eastern o
(iii) Inland Southern
(iv) Inland Northern
6. Kerala
(i) Northern _ o
(ii) Southern .
1981 1981
15·9 3. 8 5·4
3·3
7·7
1.10 1.7 1
7·7
2·9
5.7 1·9
.54
·9
3.5 .9
7.9
10.4·
I,7
3. I
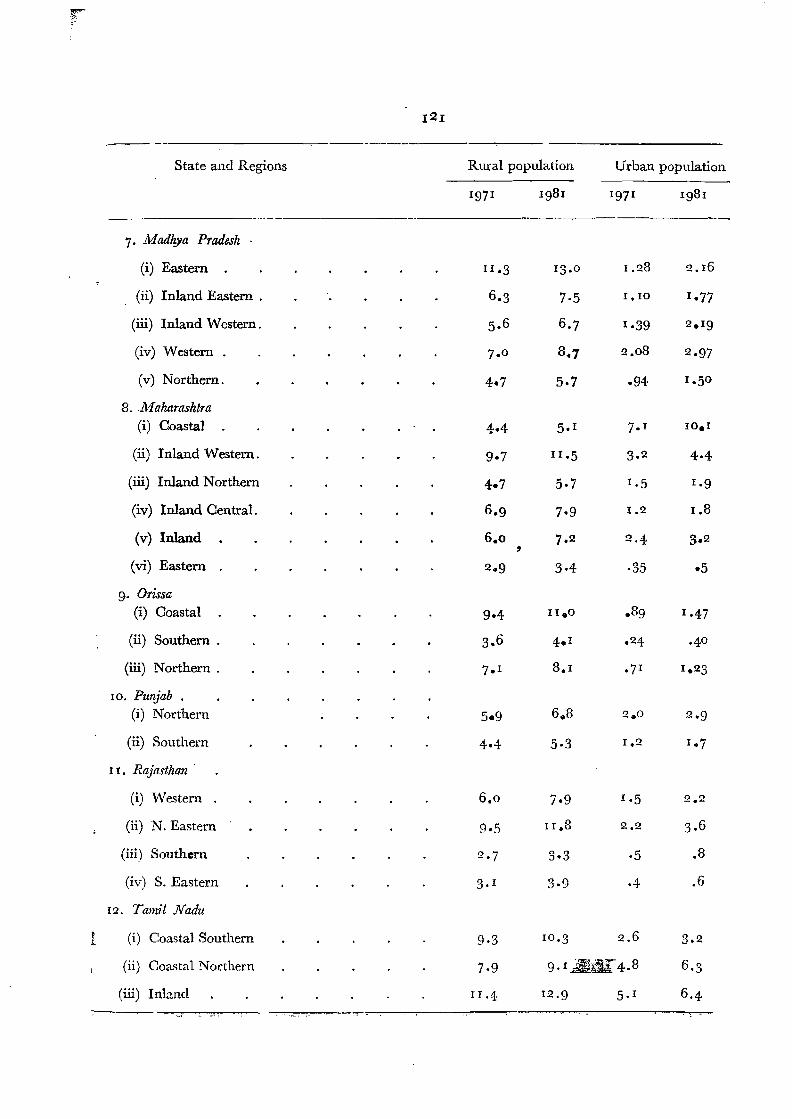
121
State and Regions Rural population Urban population
1971 Ig81 1971 1981
t
7. l\lladhya Pradesh
(i) Eastern
(ii) Inland Eastern .
(iii) Inland Western.
(iv) Western
(v) Northern.
8.A1aharashtra (i) Coastal
(ii) Inland Western.
(iii) Inland Northern
(iv) Inland Central.
(v) Inland
(vi) Eastern
9. Orissa (i) Coastal
(ii) Southern .
(iii) Northern .
10. Punjab. (i) Northern
(ii) Southern
I I. Rajasthan
(i) Western
(ii) N. Eastern
(iii) Southern
(tv) S. Eastern
12. Tamil Nadu
(i) Coastal Southern
II .3
6.3
5. 6
7. 0
4.7
4·4
9·7
4.7
6.g
6.0 , 2·9
9·4
3. 6
7. 1
5.9
4·4
6.0
9·5
2·7
3. 1
9·3
13.0
7·5
6.7
8.7
5·7
5. 1
II .5
5.7
7·9
7.2
3·4
11.0
4.1
8.1
6.8
5·3
7·9
II .8
3·3
3·9
ro·3
1.28
1.10
1·39
2.08
.94·
7. T
3. 2
1.5
1.2
2·4
·35
.89
.24
.7 1
2.0
1.2
1·5
2.2
·5
.4
2.6
2.16
1.77
2.19
2.97
1.50
10.1
4·4
I.g
1.8
3. 2
·5
1·47
·4°
1.23
2·9
1·7
2.2
3.6
.8
.6
3.2
(ii) Coastal Northern 7·9 g.1 $~iC4.8 6.3
(iii) Inland 11.4 12·9 5. 1 6.4
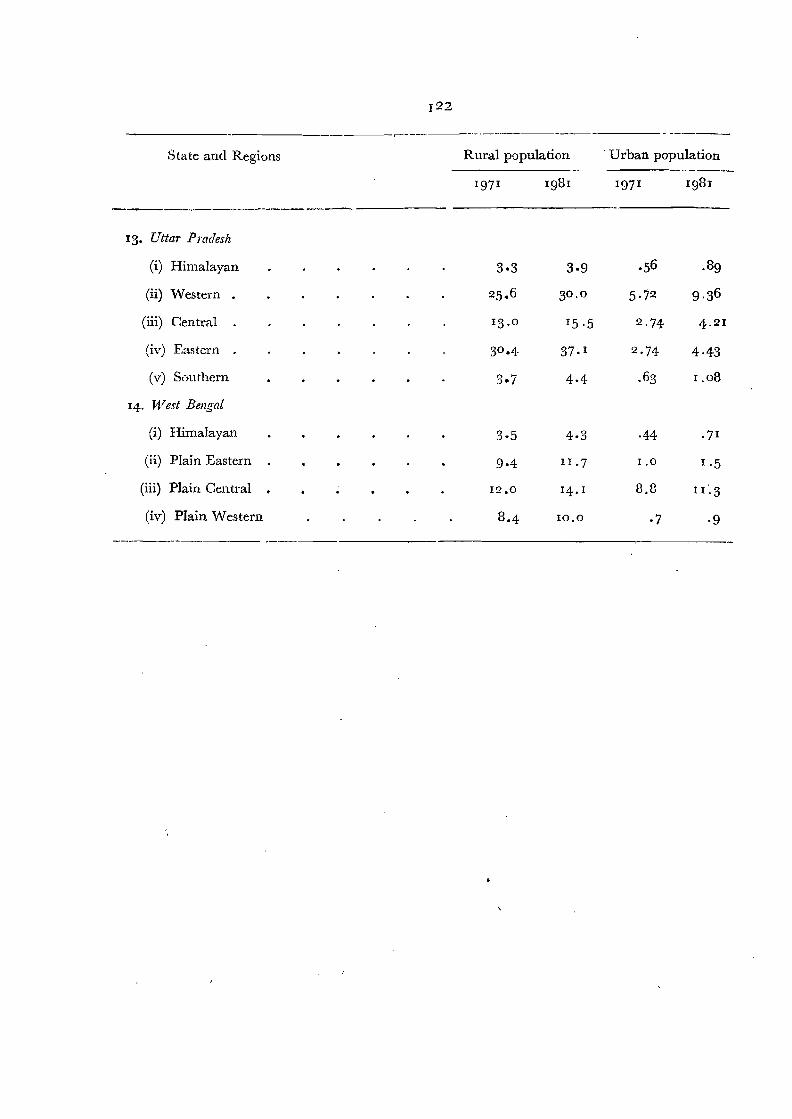
122
._---_..---._-----_.._._--------- ----- -----
State and Regions Rural population .Utban population
1981 1981
----_..._--- _._--_.'-.----
13. Uttar Pradesh
(i) Himalayan 3·3 3·9 .56 .89
(ii) Western . 25. 6 3°. 0 5·72 9.36
(iii) Central 13. 0 15·5 2·74 4. 21
(iv) Eastern 3°·4 37. I 2·74 4·43
(v) Southern 3.7 4·4 .63 1.08
14. fVest Bengal
(i) Himalayan 3·5 4·3 ·44 .7 1
(ii) Plain Eastern 9·4 11.7 1.0 1.5
(iii) Plain Central • 12.0 14. I 8.8 II '.3
(iv) Plain Western 8.4 10.0 ·7 ·9
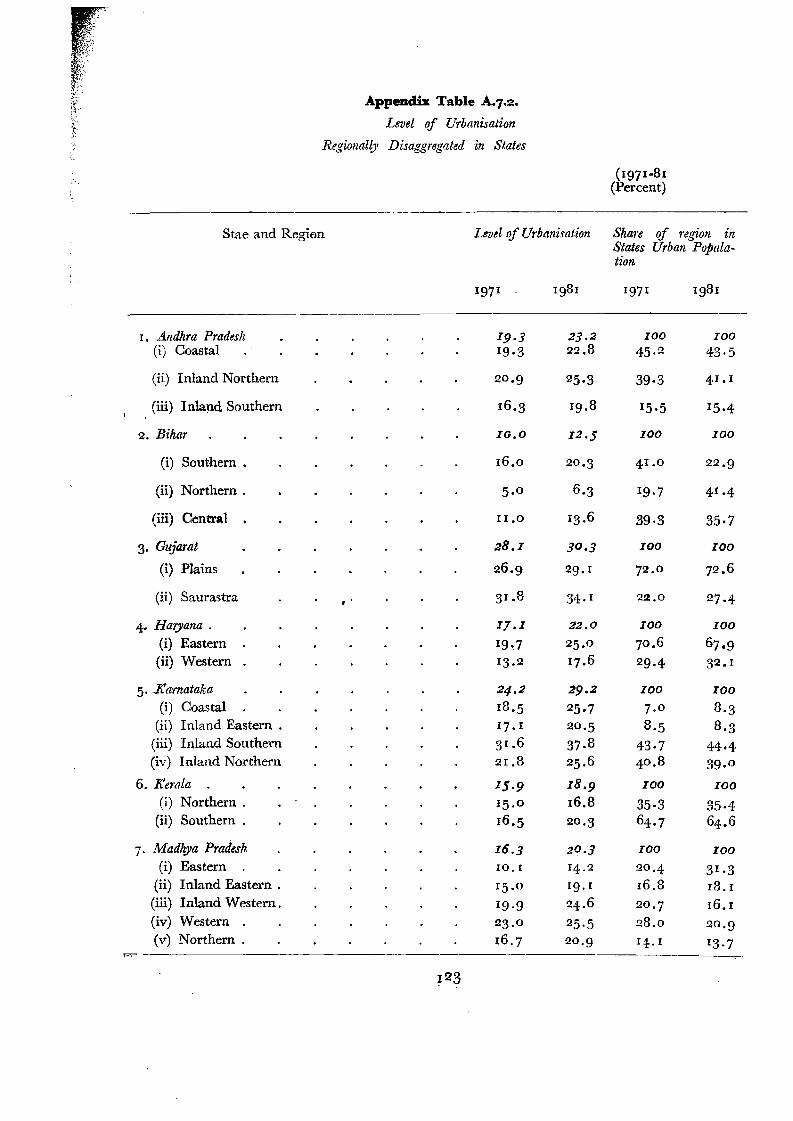
~:.
Appendh Table A.'.2.
Level of Urbanisation
Regionall.J1 Dlsaggregated in States
(1971-81 (Percent)
Stae and Region
------
I. Andhra Pradesh (i) Coastal
(ii) Inland Northern
(iii) Inland Southern
2. Bihar
(i) Southern.
(ii) Northern.
(iii) CentTal
3. Gujara:
(i) Plains
(ii) Saurastra .. 4. Haryana.
(i) Eastern (ii) ·Western
5. ..Kamataka (i) Coastal
(ii) Inland Eastern . (iii) Inland Southern (iv) Inland Northern
6. Kerala (i) Northern .
(ii) Southern .
7· Madhya Pradesh (i) Eastern
(ii) Inland Eastern . (iii) Inland Western. (iv) Western (v) Northern .
Level ofUrbanisation
1971 1981
19·] 2].2 I9·3 22.8
20.9 25·3
16.3 19.8
10.0 12·5
16.0 20·3
5.0 6.3
II .0 13.6
28.1 30.3
26.9 29. I
31.8 34. I
17.1 22.0
19·7 25.0 13.2 17.6
24. 2 29·2
18·5 25·7 17. 1 20·5 31•6 37.8 21.8 25. 6
15·9 18·9
15.0 16.8 16·5 20·3
16.3 20.3
10. I 14.2 15.0 Ig. I Ig.g 24.6 23. 0 25·5 16.7 20·9
Share of reglOn in States Urban Population
1971 1981
100 100 45. 2 43·5
39·3 .p .1
15·5 15·4
100 100
41.0 22·9
19·7 41.4
39·3 35·7
100 100
72.0 72.6
22.0 27·4
100 100
70•6 67.9 29·4 32. I
100 100
7.0 3.3 8·5 8.3
43·7 44·4 40 •8 39. 0
100 100
35·3 35·4 64.7 64. 6
100 100
20·4 31·3 16.8 18. I 20·7 16. I 28.0 20·9 11.. I 13·7
~23
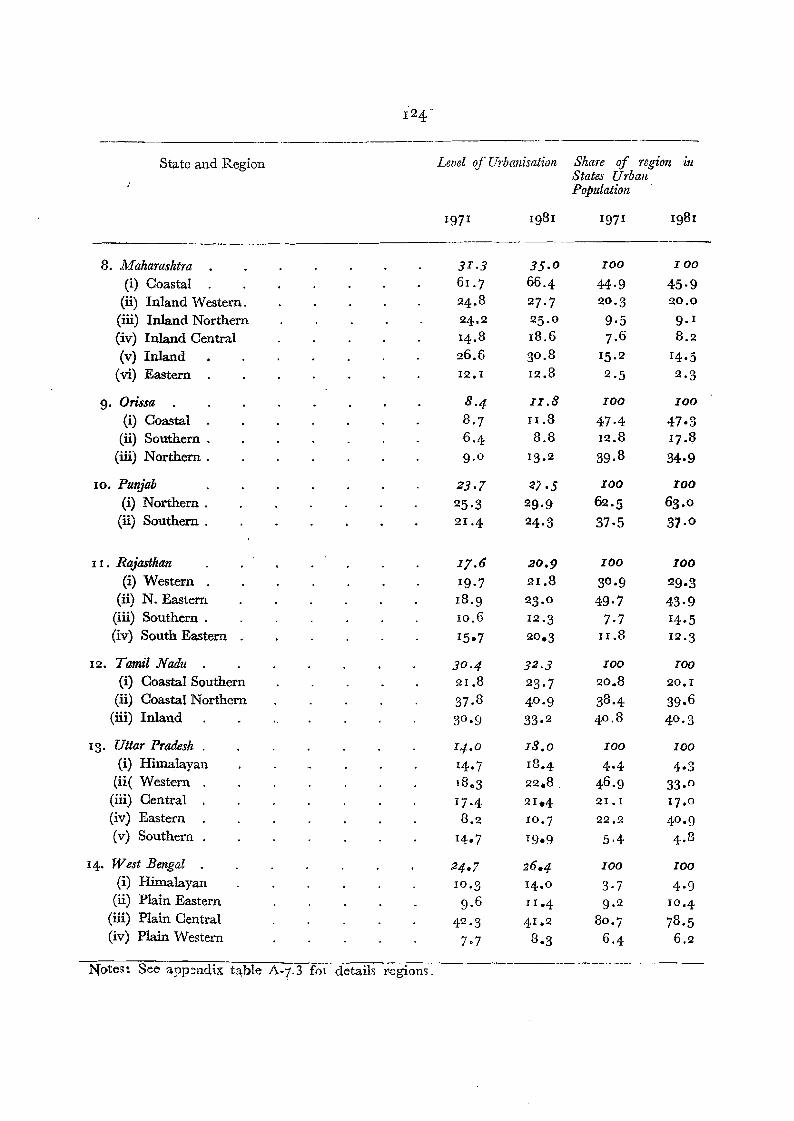
---------
State and Region
8. Maharashtra (i) Coastal (ii) Inland Western.
(iii) Inland Northern (iv) Inland Central (v) Inland
(vi) Eastern
9. Orissa (i) Coastal
(ii) Southern. (iii) Northern .
10. Punjab (i) Northern .
(ii) Southern .
I I. Rajasthan (i) Western
(ii) N. Eastern (iii) Southern . (iv) South Eastern
12. Tamil.N'adu (i) Coastal Southern
(ii) Coastal Northern (iii) Inland
13· Uttar Pradesh (i) Himalayan
(ii( Western (iii) Central (iv) Eastern (v) Southern
14· West Bengal . (i) Himalayan
(ii) Plain Eastern (iii) Plain Central (iv) Plain Western
Notes s See appendix table A-l.3 fot
1 2 4
Leoel of Urbanisation
1971 1981
31.3 35·0
61.7 66.4 24. 8 27·7 24. 2 25. 0 14.8 18.6 26.6 30. 8 12.1 12.8
8·4 II.B 8.7 II .8 6.4 8.8 9. 0 13.2
23·7 ~J ·5 25·3 29·9 21.4 24·3
17.6 20.9
19·7 21.8 18·9 23.0 10.6 12·3 15·7 20.3
30·4 32.3 21.8 23·7 37.8 4°·9 3°·9 33. 2
14. 0 18.0
14.7 18.4 1803 22.8. 17·4 21.4 8.2 10·7
14.7 19.9
24·7 26.4 10·3 14.0
9. 6 11·4 42.3 41•2
7·7 8.3
details l;;;gions~-
--_ ..~---
Share of region in States Urban Population
1971 1981
--~.--
100 100
44·9 45·9 20·3 20.0 9·5 9. 1 7.6 8.2
15.2 14·5 2·5 2·3
100 100
47·4 47·3 12.8 17.8 39.8 34·9
100 100
62·5 63. 0 37·5 31. 0
100 100
30.9 29·3 49·7 43·9
7·7 14·5 II .8 12·3
100 lao 20.8 20.1 38.4 39.6 4°·8 40. 3
100 loa 4·4 4·3
46.9 33. 0
21.1 17.0
22.2 4°·9 5·4 4. 8
100 100
3·7 4·9 9. 2 10·4
80.7 78.5 6.4 6.2
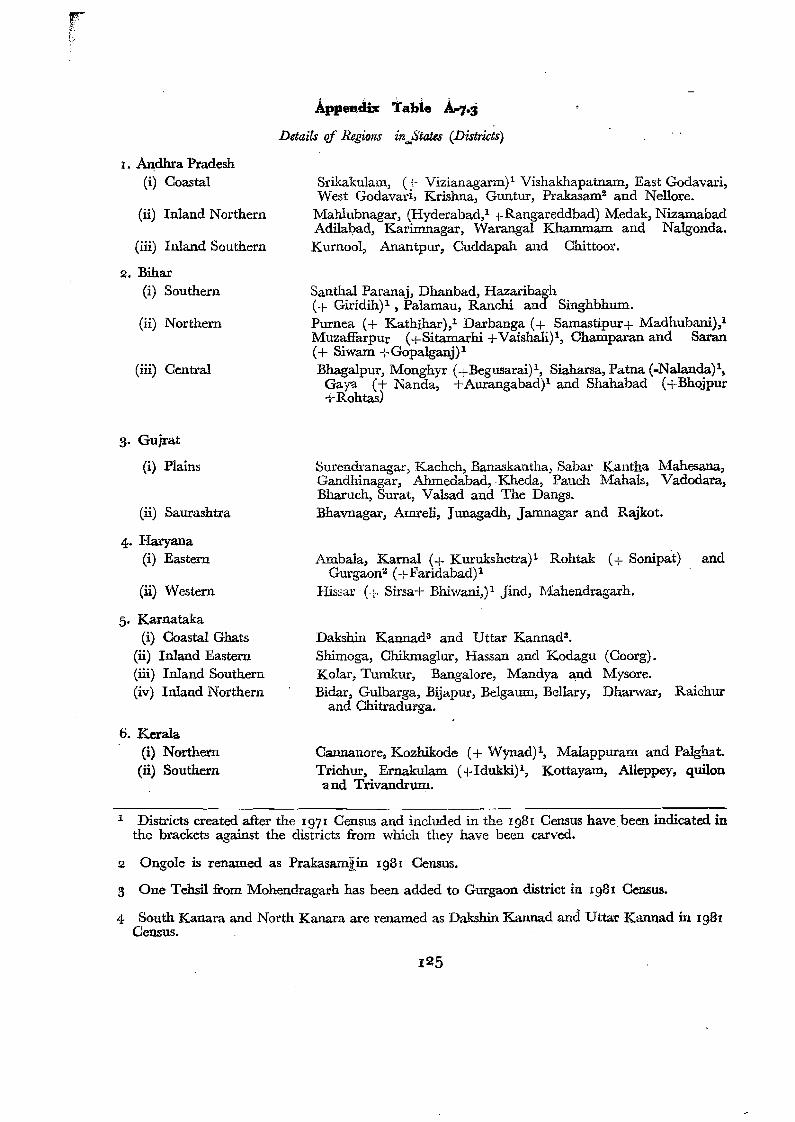
.Appendix Tabte A...,.s Details of Regions in""States (Districts)
r, Andhra Pradesh (i) Coastal
(ii) Inland Northern
(iii) Inland Southern
2. Bihar (i) Southern
(ii) Northern
(iii) Central
3. Gujrat
(i) Plains
(ii) Saurashtra
4. Haryana (i) Eastern
(li) Western
5. Karnataka (i) Coastal Ghats
(ii) Inland Eastern (iii) Inland Southern (iv) Inland Northern
6. Kerala (i) Northern
(ii) Southern
Srikakulam, (+ Vizianagarm)! Vishakhapatnam, East Godavari, West Godavari, Krishna, Guntur, Prakasam" and Nellore.
Mahlubnagar, (Hyderabad,l-l-Rangareddbad) Medak, Nizamabad Adilabad, Karimnagar, Warangal Khammam and Nalgonda. Kurnool, Anantpur, Cuddapah and Chittoor.
Santhal Paranaj, Dhanbad, Hazaribagh (+ Giridih) 1 , Palamau, Ranchi and Singhbhum. Purnea (+ Kathihar),l Darbanga (+ Samastipur.i. Madhubanij. Muzaffarpu- (+Sitamarhi +Vaishali)l, Champaran and Saran (+ Siwam +Gopalganj)l Bhagalpur, Monghyr (+Begusarai)l, Siaharsa, Patna (-Nalanda)l,
Gaya (+ Nanda, -l-Aurangabad)! and Shahabad (+Bhojpur +Rohtas)
Surendranagar, Kachch, Banaskantha, Sabar Kantha Mahesana, Gandhinagar, Ahmedabad,Kheda, Panch Mahals, Vadodara, Bharuch, Surat, Valsad and The Dangs. Bhavnagar, Amreli, Junagadh, ]amnagar and Rajkot.
Ambala, Kamal (+ Kurukshetra)! Rohtak (+ Sonipat) and Gurgaon" (+Faridabad)l
Hissar (+ Sirsa+ Bhiwani,) 1 lind, Mahendragarh.
Dakshin Kannad" and Uttar Kannad", Shimoga, Chikmaglur, Hassan and Kodagu (Coorg). Kolar, Tumkur, Bangalore, Mandya and Mysore. Bidar, Gulbarga, Bijapur, Belgaum, Be1lary, Dharwar, Raichur
and Ohitradurga,
Cannanore, Kozhikode (+ Wynad)l, Malappuram and Palghat. Trichur, Ernakulam (+Idukki)l, Kottayam, Alleppey, quilon and Trivandrum.
1 Districts created after the 1971 Census and included in the I98I Census havebeen indicated in the brackets against the districts from which they have been carved.
2 Ongole is renamed as Prakasamjjn 1981 Census.
3 One Tehsil from Mohendragarh has been added to Gurgaon district in IgBI Census.
4 South Kanara and North Kanara are renamed as Dakshin Kannad and Uttar Kannad in Ig81 Census.
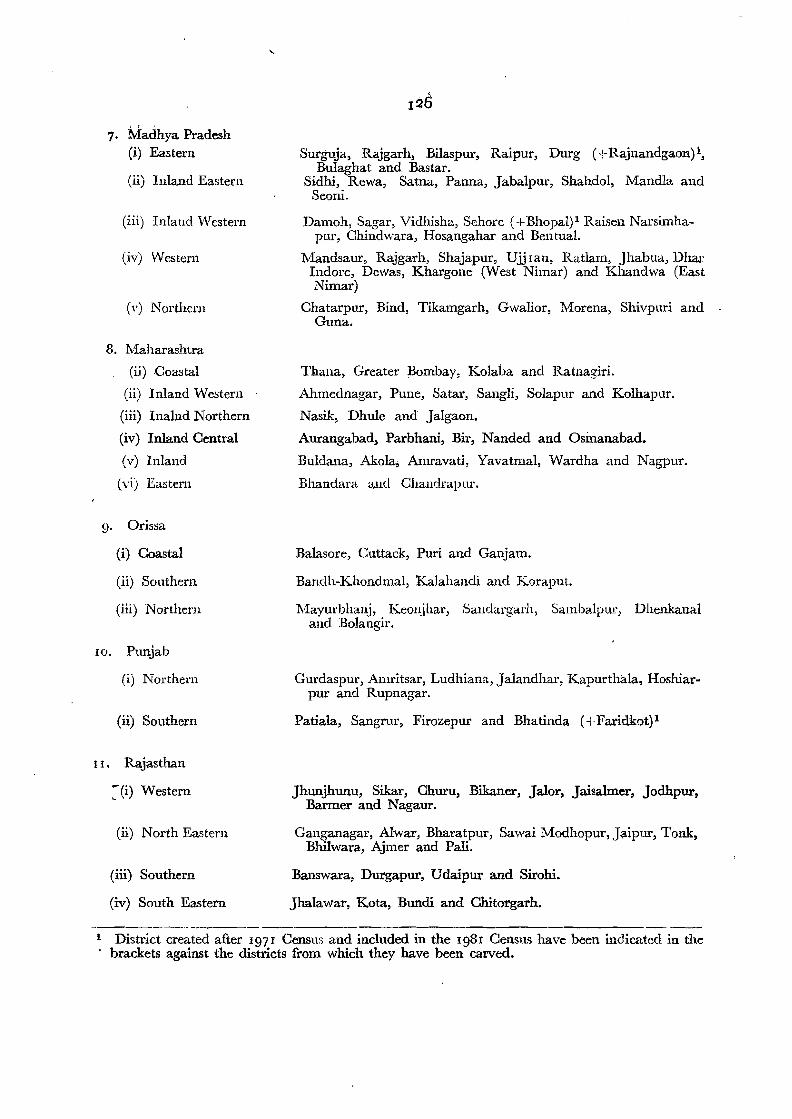
------------------- ----
"
1. Madhya Pradesh (i) Eastern
(ii) Inland Eastern
(iii) Inland 'Western
(iv) Western
Cv) Northern
8. Maharashtra
(ii) Coastal
(ii) Inland Western
(iii) Inalnd Northern
(iv) Inland Central
(v) Inland
(vi) Eastern
g. Orissa
(i) Coastal
(ii) Southern
(iii) Northeru
10. Punjab
(i) Northern
(ii) Southern
I 1 • Rajasthan
~(i) Western
(ii) North Eastern
(iii) Southern
(iv) South Eastern
Surguja, Rajgarh, Bilaspur, Raipur, Durg (+Rajl1andgaon)t, Bulaghat and Bastar.
Sidhi, Rewa, Satna, Panna, Jabalpm-, Shahdol, Mandla and Seoni.
Damoh, Sagar, Vidhisha, Sehore (+BhopaI)l Raisen Narsimhapur, Chindwara, Hosangahar and Bentual.
Mandsaur, Rajgarh, Shajapur, Ujj ran, Ratlam, Jhabua, Dhar Indore, Dewas, Khargone (West Nimar) and Khandwa (East Nimar)
Chatarpur, Bind, Tikamgarh, Gwalior, Morena, Shivpuri and Guna.
Thana, Greater Bombay, Kolaba and Ratnagiri.
Ahmednagar, Pune, Satar, Sangli, Solapur and Kolhapur.
Nasik, Dhule and Jalgaon.
Aurangabad, Parbhani, Bir, Nanded and Osmanabad,
Buldana, Akola, Amravati, Yavatmal, Wardha and Nagpur.
Bhandara and Chandrapur.
Balasore, Cuttack, Puri and Ganjam.
Bandh-Khondmal, Kalahandi and Koraput,
Mayurbhanj, Keonjhar, Saudargarh, Sambalpur, Dhenkanal and Bolangir.
Gurdaspur, Amritsar, Ludhiana, Jalandhar, Kapurthala, Hoshiarpur and Rupnagar.
Patiala, Sangrur, Firozepur and Bhatinda (+Faridkot)l
Jhunjhunu, Sikar, Ohuru, Bikaner, Jalor, Jaisalrner, Jodhpur, Barmer and Nagaur.
Ganganagar, Alwar, Bharatpur, Sawai Modhopur, Jaipur, Tonk, Bhilwara, Ajmer and Pall.
Banswara, Durgapur, Udaipur and Sirohi.
Jhalawar, Kota, Bundi and Chitorgarh.
District created after 1971 Census and included in the Ig81 Census have been indicated in the brackets against the districts from which they have been carved.
1
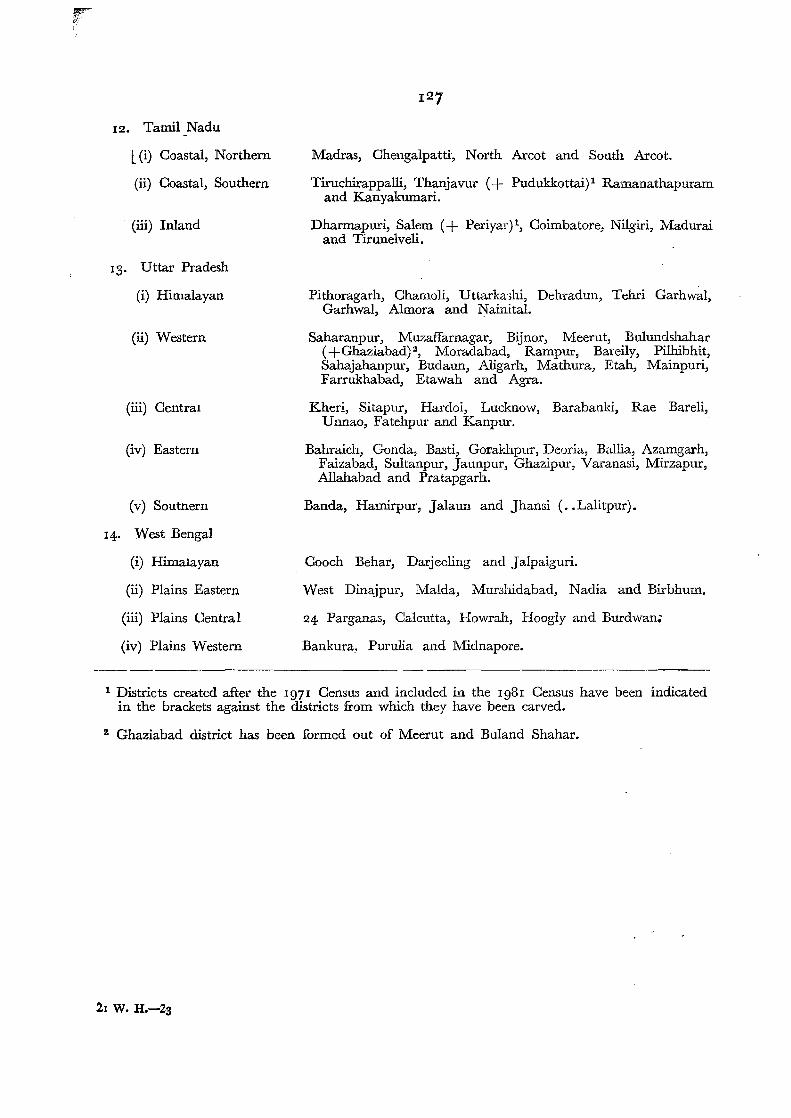
---------
12. Tamil Nadu
l (i) Coastal, Northern
(ii) Coastal, Southern
. (iii) Inland
13. Uttar Pradesh
(i) Himalayan
(ii) Western
(iii) Central
(iv) Eastern
(v) Soutnern
14. West Bengal
(i) Himalayan
(ii) Plains Eastern
(iii) Plains CentraI
(iv) Plains Western
Madras, Chengalpatti, North Areot and South Areot.
Tiruchirappalli, Thanjavur (+ Pudukkottaij- Ramanathapuram and Kanyakumari,
Dharmapuri, Salem (+ Periyar)", Coimbatore, Nilgiri, Madurai and Tirunelveli.
Pithoragarh, Chamoli, Uttarkashi, Dehradun, Tehri Garhwal, Garhwal, Almora and Nainital,
Saharanpur, Muzaffarnagar, Bijnor, Meerut, Bulundshahar (+Ghaziabad)2, Moradabad, Rampur, Bareily, Pilhibhit, Sahajahanpur, Budaun, Aligarh, Mathura, Etah, Mainpuri, Farrukhabad, Etawah and Agra.
Kheri, Sitapur, Hardoi, Lueknow, Barabanki, Rae Bareli, Unnao, Fatehpur and Kanpur,
Bahraich, Gonda, Basti, Gorakhpur, Deoria, Ballia, Azamgarh, Faizabad, Sultanpur, Jaunpur, Ghazipur, Varanasi, Mirzapur, Allahabad and Pratapgarh,
Banda, Hamirpur, Jalaun and Jhansi ( .. Lalitpur),
Cooch Behar, Darjeeling and J alpaiguri.
West Dinajpur, Malda, Murshidabad, Nadia and Birbhum.
24 Parganas, Calcutta, Howrah, Hoogly and Burdwanz
Bankura, Purulia and Midnapore,
1 Distriets created after the 197 I Census and included in the 198 I Census have been indicated in the brackets against the districts from which they have been carved.
2 Ghaziabad district has been formed out of Meerut and Buland Shahar.
21 W. H.-23
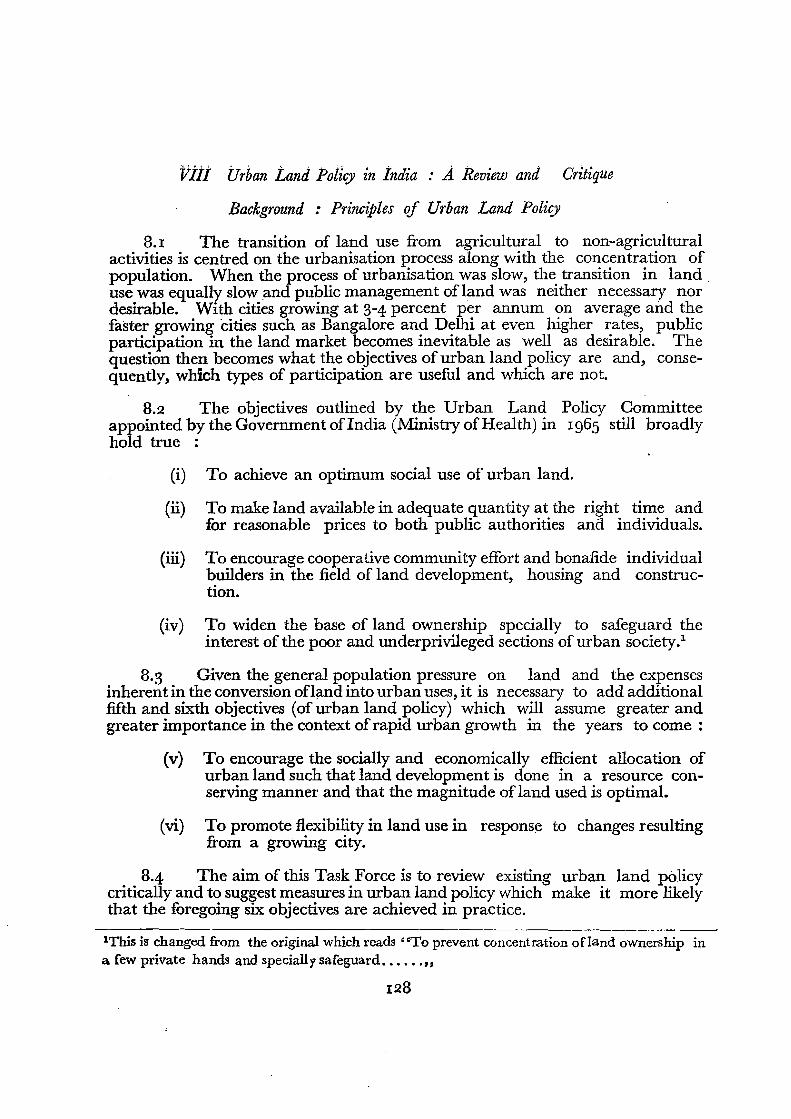
viii Urban Land PolZcy in India : A Review and Critique
Background : Principles of Urban Land Policy
8. I The transition of land use from agricultural to non-agricultural activities is centred on the urbanisation process along with the concentration of population. When the process of urbanisation was slow, the transition in land. use was equally slow and public management of land was neither necessary nor desirable. With cities growing at 3-4 percent per annum on average and the faster growing Cities such as Bangalore and Delhi at even higher rates, public participation in the land market becomes inevitable as well as desirable. The question then becomes what the objectives ofurban land policy are and, consequently, which types of participation are useful and which are not.
8.2 The objectives outlined by the Urban Land Policy Committee appointed by the Government ofIndia (Ministry ofHealth) in 1965 still broadly hold true
(i) To achieve an optimum social use of urban land.
(ii) To make land available in adequate quantity at the right time and for reasonable prices to both public authorities ana individuals.
(iii) To encourage cooperative community effort and bonafide individual builders in the field of land development, housing and construction.
(iv) To widen the base of land ownership specially to safeguard the interest of the poor and underprivileged sections of urban society.'
8.3 Given the general population pressure on land and the expenses inherent in the conversion ofIand into urban uses, it is necessary to add additional fifth and sixth objectives (of urban land policy) which will assume greater and greater importance in the context ofrapid urban growth in the years to come :
(v) To encourage the socially and economically efficient allocation of urban land such that land development is done in a resource conserving manner and that the magnitude ofland used is optimal.
(vi) To promote flexibility in land use in respons~ to changes resulting from a growing city.
8.4 The aim of this Task Force is to review existing urban land policy critically and to suggest measures in urban land policy which make it more likely that the foregoing six objectives are achieved in practice.
lThis is changed from the original which reads "To prevent concentration ofland ownership in a few private hands and specially safeguard "
128
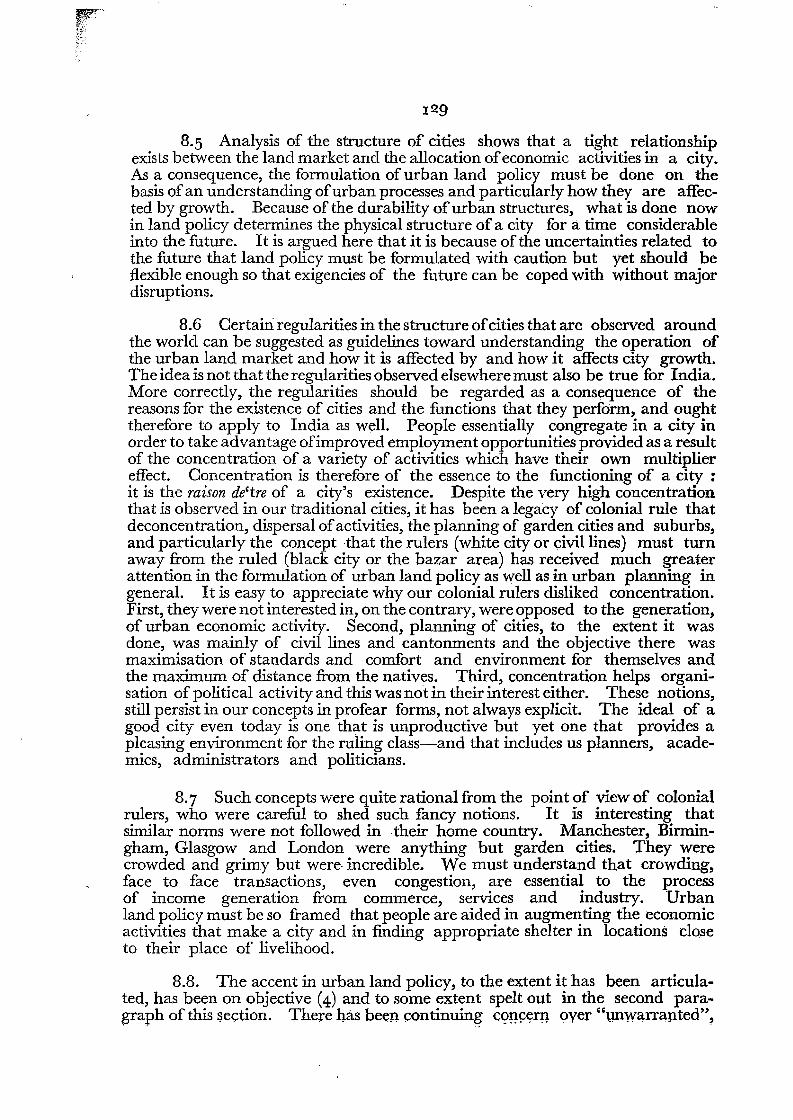
1 29
8.5 Analysis of the structure of cities shows that a tight relationship exists between the land market and the allocation ofeconomic activities in a city. As a consequence, the formulation of urban land policy must be done on the basis ofan understanding ofurban processes and particularly how they are affected by growth. 'Because of the durability ofurban structures, what is done now in land policy determines the physical structure of a city for a time considerable into the future. It is argued here that it is because of the uncertainties related to the future that land policy must be formulated with caution but yet should be flexible enough so that exigencies of the future can be coped with without major disruptions.
8.6 Certairi regularities in the structure ofcities that are observed around the world can be suggested as guidelines toward understanding the operation of the urban land market and how it is affected by and how it affects city growth. The idea is not that the regularities observed elsewhere must also be true for India. More correctly, the regularities should be regarded as a consequence of the reasons for the existence of cities and the functions that they perform, and ought therefore to apply to India as well. People essentially congregate in a city in order to take advantage ofimproved employment opportunities provided as a result of the concentration of a variety of activities which have their own multiplier effect. Concentration is therefore of the essence to the functioning of a city : it is the raison de'tre of a city's existence. Despite the very high concentration that is observed in our traditional cities, it has been a legacy of colonial rule that deconcentration, dispersal ofactivities, the planning of garden cities and suburbs, and particularly the concept that the rulers (white city or civil lines) must turn away from the ruled (black city or the bazar area) has received much greater attention in the formulation of urban land policy as well as in urban planning in general. It is easy to appreciate why our colonial rulers disliked concentration. First, they were not interested in, on the contrary, were opposed to the generation, of urban economic activity. Second, planning of cities, to the extent it was done, was mainly of civil lines and cantonments and the objective there was maximisation of standards and comfort and environment for themselves and the maximum of distance from the natives. Third, concentration helps organisation of political activity and this was not in their interest either. These notions, still persist in our concepts in profear forms, not always explicit. The ideal of a good city even today is one that is unproductive but yet one that provides a pleasing environment for the ruling class-and that includes us planners, academics, administrators and politicians.
8.7 Such concepts were quite rational from the point of view of colonial rulers, who were careful to shed such fancy notions. It is interesting that similar norms were not followed in ·their home country. Manchester, Birmingham, Glasgow and London were anything but garden cities. They were crowded and grimy but were incredible. We must understand that crowding, face to face transactions, even congestion, are essential to the process of income generation from commerce, services and industry. Urban land policy must be so framed that people are aided in augmenting the economic activities that make a city and in finding appropriate shelter in locations close to their place of livelihood.
8.8. The accent in urban land policy, to the extent it has been articulated, has been on objective (4) and to some extent speIt out in the second paragraph of this section, There has been continuin~ concern oyer "unwarranted",
130
"undersirable" and unprecedented increases in urban land values over almost the whole planning period. Each planning document regards the control of urban land values as a major objective in urban policy. There has been a percept in that urban land prices have been rising very rapidly and that this has somehow been the result of excessive concentration in the ownership of urban land. As a result the last quarter century has seen a series of attempts at achieving objectives 2 & 4 but which, in balance, have probably accentuated the problems that were sought to be solved. Despite the concern over urban land values and its pattern ofownership and concentration it is strange that no organised attempt has been made at data collection in order to find out what has actually happened to either urban land values or its pattern of ownership. Hence most pronouncements in the "trend of land values are based on conjectures or casual observations.
In pre-colonial India, Delhi, Hyderabad, Lucknow, Lahore, etc. were growing too but active producers of wealth. vVe may blame the structure of parts of our cities to our colonial heritage but we are responsible for our continuance of these modes of thinking. It is in the new towns, new state capitals and the national capital where the strongest evidence of such urban land policy is most visible. To the extent that they reflect our aspirations, expanding old towns are also avidly copying them. Let us count how. First, the land policy has been such as to discourage high densities of residence as well as of employment. Second, employment has been sought to be dispersed. Third, except unavoidably in the steel cities, industry is discouraged except in designated industrial estates. Fourth, the allocation of land has assumed that the poor do not exist. This is particularly ironic since much of the rationale behind public acquisition of land at low prices from the original farmers has been to arrest the rise in land prices so that the poor are not deprived of access to land for shelter as they are in a speculative private market. Fifth, in many places, even commerce has been discouraged in the sense that land allocation for traditional type markets is looked down upon. In short, much of urban land policy where it has been formulated has been 'anti-people and prorich'.
8.g Most attention is naturally focussed on the newly developing areas where new land development and construction is typically going on. Rapid land value increases would be expected in such areas-and should take placeleading to massive windfall gains in certain geographical areas to the neglect of others. In an evolving land value pattern in which different degrees of land price appreciation take place it is quite reasonable to expect that an uninformed perception would be heavily biased towards areas of high appreciation. This problem is not peculiar to India alone. It is therefore necessary to understand the role of the price of land in the allocation and distribution of urban activities.
8. 10 While it is commonplace to hear that the price of land has risen in an "unwarranted" manner in urban areas it is not always clear what such a statement means. The observed price of any commodity is essentially a distribution around some mean and it is usually not too difficult to find this mean. The variance in the observed prices of other commodities is small. The problem with urban land is that it possesses a value because of its particular location rather than its intrinsic characteristics. Wide fluctuations in prices within the
131
same area are unlikely but prices in different areas can vary widely. It is difficult to talk about the mean price ofland since it has a very high variance within a town.
8. II Conceptually, we can think of the price ofland as being affected by three sets of characteristics :
(i) site specific characteristics (intrinsic quality of land).
(ii) neighbourhood qualities (amenities); and
(iii) access characteristics.
8. I 2 The influence of (i) is relatively minor as compared with that of (ii) and (iii). The main determinant of urban land value is the attractiveness of location-or the intensity of its access characteristics. Thus, typically, land in the central city which has close access to centres of employment and commerce has very high value and that at the periphery, relatively low value. In a monocentric city, the distance from the city centre is the key determinant of land price; distance being a proxy for the access characteristics of a particular plot of land.
8.13 At the very edge of the city, land values approach the existing value of land in alternative uses. At the very edge of the city then, the value of undeveloped land would approach the value of agricultural land. As the city grows and the boundary shifts, the value of land increases at the old boundary so that there is a gradual decline toward the new boundary. If the profile of land value is an exponential decay from the city centre, as is generally found in cities and if land values increase everywhere, the proportional increase at the periphery is likely to be phenomenal as compared with the values nearer the city centre. It is often these increases that are most perceived and regarded as unwarranted when it should be understood that such increases in value are intrinsic to the process of urban growth. - .
8.14 Once a pattern of land price surface changes, how does one decide whether these changes are warranted or un-warranted? If land value measures some kind of accessibility value then the increase in the size of a city's population can be said to increase the accessibility (or opportunity set) for everyone in the city. The increase in value of land in that case really measures the increase in its "productivity" and is, in that sense, justified. But when does speculation or unwarranted rise exist ?
Speculation
8. 15 Speculation can exist both in a competitive market and in a monopoly situation. Speculation can be defined as the buying and selling of land by an agent purchasing for purposes of capital gain and not for development. In even a competitive situation, expectations if price increases can feed on themselves and lead to an unwarranted price rise. In such a situation, eventually, the prices will have to come down but (a) 'eventually' might be a long time and (b) meanwhile there would be a misallocation of resources according to these erroneous price signals. Furthermore, there will be a transfer of income to speculators, Thus, we need to worry about speculation in even a competitive situation.
8.16 In a monopoly situation, the owner of land can affect the price of land by holding it off the market in order to raise prices. His power to do this depends on (a) his concentration ofownership (what proportion of land is subject to concentration of ownership), (b) the elacticity of demand for land (c) the conditions in other cities. Even if there is a relatively low degree of concentration of ownership of land on a city-wide basis (the typical case), there can be extreme concentration of ownership in particular parts of the city. In situation of competitive ownerships and concentrations, a land-owner cannot hold the land off the market indefinitely because in order to realise his gain he has to sell it sometime. If he holds it off too long, competitive parcels of land could be developed by others and he might lose his accessibility value. In the monopoly case, the owner is essentially competing against himself and holding all others to ransom. Although the land may eventually come on the market, we need to be concerned because of the misallocation of resources in the meantime and a possible suboptimal configuration of the city resulting from arbitrary pricing by the monopoly owner. The durability of buildings and structures adds to this problem.
8. I 7 With the promulgation of the Urban Land Ceiling Act, the urban land market ironically enough is now the monopoly of the public authorities. The public authorities also hold the key to the release of those areas that have been frozen as being in excess of the ceilings into the market. In addition the advent ofRousing Boards and Urban Development Authorities which hold large tracts of land and release them in driblets has also probably led to an increase in speculative transactions : the speculators here, perhaps unwittingly, being these public authorities again. It is partly the inability-both financial and physical--of these public authorities to develop land rapidly enough commensurate with the rising demands of expanding population, that effectively restricts the supply of developed urban land and turn the public authorities into monopolist speculators. In this new situation, it is important that methods should be found to accelerate the supply of developed land.
8. 18 The thrust of land policy has generally ignored some of these objectives of efficiency in allocation but has concentrated instead exclusively on land price control through different degrees of socialisation of land. This has usually been justified ostensibly in the interests of the poor to facilitate their access to land. In practice things have largely worked out contrary to expressed intentions.
Existing Approaches to Land Policy
Large-scale Acquisition ofLand:
8.19 Delhi is the best example of this policy and, being the capital, is being increasingly used as a model for urban development measures in other growing cities. The principle has been that all the land on the yet undeveloped periphery ofa growing city should be notified at an early stage and acquired by a public authority,at the prevailing agricultural prices. This would then prevent the undesirable speculation. that would otherwise occur in the event of lands changing from agricultural to non-agricultural uses. The corollary that follows is that all increases in land values would accrue to the public benefit. A second corollary is that such a procedure js also necessary for the orderly planning and
development of the city since the public authority has control over all the peri, pheral la~ds and can pre~ent haphazard gro~th, ~ban sprawl, .etc. A third corollary IS that the poor WIll not be left to the' mercies" of the pnvate market where they would stand no chance. Appropriate controls can be exercised in the land distribution policy so that the aims for equitable income and wealth distribution can be achieved. A fourth coroallary is that the development of land is largely left to the public sector.
8.20 In the case ofDelhi, the "Scheme for Large Scale Acquisition, Development and Disposal of Land" was initiated in 1961, according to which the Delhi Development Authority was to be the major developer, along with other agencies like the Municipal Corporation of Delhi, the Central Public Works Department and Cooperative House Building Socieities which also had to carry out development of land, in accordance with the Master Plan and its zoning regulations. The main object of this scheme was "to lay down a clear and rational land policy consistent with the socio-economic and physical needs of the city and to prevent speculation and other unhealthy transactions in land, to provide developed and undeveloped land for bonafide residential, industrial, commercial and institutional use and to ensure a systematic vdistribution of land through the prescribed land use pattern".. For this purpose land was to be acquired by the Delhi Administration under the Land Acquisition Act, 1894 and then transferred to the Delhi Development Authority under Section 22 (I) of the Delhi Development Act, 1957. The cost of acquisition was to be met out of the revolving fund created by the Government for this purpose and expenditure incurred by the Authority was to be met out of the sale proceeds of industrial, commercial and
. residential plots, with the surplus sale proceeds credited to the revolving fund.
8.21 The Scheme laid down that as a general policy, disposal of serviced land should be by auction to the highest bid except in the following cases where land could be allotted at pre-determined rates :
(i) to individuals whose lands have been acquired,
(ii) to industrial units functioning in non-conforming areas which have to be shifted,
(iii) to individuals in the low and middle income groups,
(iv) to cooperative house building societies and cooperatives societies of industrialists.
Land was to be held on 99 year lease-this being the nearest to freehold and an adequate incentive for the lessee to invest in housing.
8.22 This was the first effort for the socialisation of urban land through a comprehensive package ofplanned land use measures and public intervention aimed at creating a land bank and for holding land on lease. It envisaged coordinated growth through an apex planning, land development and controlling authority and the revolving fund implied the use ofland as a resource for the common good. The ingredients for planned growth through legislatio nand public interventions were thereby established in a process which had little 01' no
role for the private land developer. It called for action to achieve the stipulated goals and objectives through a vigorous implementation programme through official agencies and housing cooperatives.
It is necessary to ponder over the implications of the scheme as was envisaged and carried into practi ce in Delhi, because it has been copied' as a model for many subsequent schemes in other cities in the country.
Disposal of Land on Leasehold
8.23 Associated with the policy of land acquisition have also been the policies of disposal of land so acquired. For residential uses the general policy has been to provide the land on leasehold rather than freehold. The justification for this is partly to exercise a greater degree ofcontrol over its use, partly to collect ground rent on a continuing basis and partly to be able to collect major portions of land value increments to public account at the time of transfer. Leases, even if they are oflong duration, are in practice quite restrictive (though they do not need to be so). The transfer of land is regulated : no transfer is lawfully allowed for an initial period of 10 years.
The leases can also restrict the uses to which land can be put to. It may be noted that most of these restrictions are again ostensibly to achieve the objectives of control of land values and the wealth.
equitable distribution of income and
Restrictions on Land Use
8.24 Even in unplanned cities the standard instruments of land regulation are zoning and building byelaws. Different areas of the city
use are
zoned for different purposes : residential, commercialor industrial. Density norms are also often used. Associated with these are building bye-laws which regulate the land use in terms ofminimum and maximum utilisation of the land. Such building bye-laws usually prescribe flOOF area ratios (FAR OR FSI), permissible heights of buildings, permissible qualities of buildings, etc. The objectives of zoning regulations and building bye-laws are ostensibly those of safety, building a proper urbanenvironment, etc. The effects on the efficient allocation ofland are usually quite severe in that they act as impediments against changes in the intensity of land use that might be expected in a growing city. For instance, in the context of land value increases, building bye-laws which restrict the height of buildings to 2 to 3 storeys result in the proportion of structure declining in relation to land value. Substitution of capital for land being restricted in such a situation, the supply of housing gets effectively restricted. The return on speculation in land grows much higher than the return on construction. In a poor country another effect of minimum building standards as enshrined in building bye-laws is equally damaging. With legal construction limited to relatively high quality and expensive housing, the poor are drived to unauthorised and illegal structures by definition. The poor dare not have recourse to extra-legal options consequent penalisation as a result.
Urban Land Ceiling
8.25 The fourth main instrument that has been used in recent times is the imposition of the urban land ceiling. Conceptually, this is essentially an
135
extension of the large scale public acquisition of land from the periphery to the rest of the city. Once again, the idea is ostensible redistribution of wealth and improvement for the access of the poor to the land for shelter purposes. The raison d'etre is that there is an undesirable concentration in land ownerships, which encourages speculation, shooting up ofprices and decrease in the supply of land. The owners of vacant land beyond the ceilings will be compensated in nominal terms and the public authority can use the land so gained for public purposes and for housing of the poor.
8.26 The Urban Land (Ceiling and Regulations) Act was enacted in 1976. Initially, this Act was envisaged for a ceiling on both land and buildings, but was transacted to consider urban land alone. The Act has been made applicable to all cities with a population of 0.3 million and above and in a few other smaller cities which have had high growth rates. The ceiling on vacant land as prescribed is 500 M Z in Delhi, Bombay, Calcutta, and Madras; 1000 Ms in Bangalore, Hyderabad, Ahmedabad, Kanpur and Pune, 1500 M Z for eight other cities with a population between 0.5 to 1.0 million and 2000 Mz for 35 smaller cities. The number of cities can be increased and added to the schedule of the Act. Significantly, the Act applied not just to the city but the city agglomeration, generally identified by a 5 k.m. belt around the city and within which the conflict between prime agricultural land and future urbanisation is most prominent.
~'Vhat has gone wrong ?
8.27 It should be clear from this description of existing approaches to urban land policy that any thoughtful observer with socially progressive ideas can scarcely question these approaches. What may have gone wrong then ?
The Case of Dellzi
8.28 In order to gauge what may have gone wrong, it will be useful to give some details on the operation of the "Scheme for Large Scale Acquisition, Development and Disposal ofLand" as it has operated in Delhi. By December, 1961, about 74,000 acres of land were notified under Section 4 of the Land Acquisition Act, 1894 upto January 1982 of which, about 49,000 acres were acquired land out of which again the Delhi Administration transferred about 45,000 acres to the Delhi Development Authority (D.D.A.). About 4,000 acres of acquired land have yet to be taken possession of on account of unauthorised structures on the land or litigation. About 2 I ,500 acres are still under Section 6 Notification of the Land Acquisition Act, 1894. The process from notification and freezing of land to actual possession for planned growth has not been as rapid as desired and this has resulted in a demand fOF streamlining procedures of the Land Acquisition Act, 1894, to reduce delays and also to ensure adequate compensation and other incentives for compulsory acquisition. A major offshoot of these delays is unauthorised use of land, which in Delhi today is to the extent of 1.92 lakh households (i.e. about a million people or 15 percent of the population of the city). This is proof that the major aim ofproviding serviced land in adequate quantity, at the right locations, at the right time and at the right price has not been quite achieved as a pre-requisite of coordinated growth. It may
I. The large majority of this resettlement was done during 1975 to 1977. 21~WH-24. 1 ..... .-'
also be noted that the compensation to which the original owner is entitled under the Land Acquisition Act, 1894, is the market value ofthe land on the date of notification of Section 4, along with 15 percent atium. In the case of Delhi, approximately one third of the land notified in 196 I is still under Section 6. Fanners are, therefore, receiving 19601 compensation levels twenty years hence. About 6000 acres are still under Section 4. The gain has been, among others, of the approximately 2 lakh urban households occupying land unauthorisedlv.,
1:5.29. 0Of the approximately 45,000 acres given to DDA for development, only about 14,000 acres have been devoted to residential development. Of this (in 20 years about a third went for about 30,000 plots in cooperative housing societies, another third for auctioned (about 9500 plots) and L.I.G. and M.I.G. plots (about 21,000 plots at pte-determined prices), and the remaining third for about 2 lakh plots for the poor dislocated from central city slums and resettled in 44 resettlement colonies.' The way slums are demolished without any warning whatever and the dwellers are harassed and chased from one area to another is much worse than meted ont to unwanted animals. This is what land to the poor has meant in practice. And yet the latter provide the vital public and private goods and services so essential for any city. The target according to the Master Plan was development of about 30,000 acreas for residential development during these 20 years. In addition to this,oD.D.A. has, in the past 5 years or so, constructed about 65,000 housing units for different category of people. The net result of all this is that of about 11.5 lakh dwelling units at present in Delhi, 2 lakhs are in resettlement colonies, 2 lakhs in unauthorised colonies (which are being regularised slowly), about 3.7 lakhs in traditional areas, about 1 Iakh in squatter settlements, about 1.5 lakhs in regular plotted areas and about 1.5 lakhs in flats.
8.30 In summary then, apart from. the z lakh resettlement plots the majority of which were developed between 1975 and I97i, the D.D.A. has developed orJy about 60,000 plots and about 60,000 flats in 20 years while it has had a monopoly on land development during that time and the population of Delhi has grown from about 2.3 million in 1961 to about 5.7 million in 1971. There has been a learning process so that, while it started from ideals that implied 'petty' peripheral neighbourhoods, large scale core area decongestion and renewal and well defined segregated activity. With land becoming increasingly scarce a more compact policy is now being pursued. The policy of auctioning residential (only 95000 in 20 years) commercial as well as industrial plots in irregular driblets has led to very high rises in land prices. With all land under the control of the D.D.A., the bids for the small amounts that are auctioned have been astronomical, since there is no 'alternative (apart from unauthorised occupation). Moreover..the D.D.A. has regarded these scarcity auction prices as market signals and increased its predetermined prices by similar proportions. The result is that even predetermined land prices are now well over Rs. 400 per square metre-which is higher than the average land prices of developed areas in cities such as Boston and Washington DC in the United States.
Effects cif Large Scale Public Acquisition of Land
8.3 1 The effect of public acquisition of land has been that the public authority is able to offer the land at very low, essentially agricultural prices pre-
I , The Large majarityofthis resettlement was done during 1975 to I9/i.
137
vailing many years earlier. The resulting intensity of land use, born of the fact that land has been bought cheap, is highly wasteful, uneconomic and inefficient. "
8.32 As argued earlier despite very common and general pattern that are observed internationally, deficiencies in knowledge and appreciation about the specifics of city growth, its appropriate and legitimate functions, and uncertainty about the future render planning exercises nearly futile. The first impediment to appropriate utilisation of publicly acquired land is therefore lack of knowledge and appreciation of what a city should look like, how it should grow, who shall inhabit it and the requirements of the future. Added to the problem is the attitude ofomniscience of the planning authority and disregard of consultation with legitimate interests. "Papa knows best", becomes the mantra.
8.33 The second problem in the inefficient allocation of publicly acquired cheap land relates to the operation of the politico-economic-administrative structure as it operates in the country today. This, incidentally, is not very different from the operation of most bureaucracies. The perception ofwhat is regarded as a public purpose is heavily dominated by the preferences and even private intetests and perceptions of the few planners and decision makers in the public authorities. Then there are also the temptations for self-aggrandisement as reflected in gigantism in public projects. The preferences of upper and middle class planners and administrators are heavily biased toward order, cleanliness, deconcentration, the flowering front garden and the useful backgarden, both serving to help the"undesirable" populace at arms length and away from sight. Then again, land for public institutions like universities, government undertakings, government offices, etc., is allocated in usually highly wasteful quantities. If land were acquired by these institutions at prices which reflected its true opportunity cost, it would be difficult budgetarily for them to be so spendthrift.
8,34 The density and development norms typically promulgated by a public authority as has already been noted are unconsciously lavish. The result is that the city gets landed with unmanageable areas, higher service and. transport costs. Lastly, the public authority can soon run out of the land in the first place. All this follows logically from the acquisition of cheap land.
8,35 The third problem in the inefficient allocation of publicly acquired lands is linked with the determination oftheir prices. The usual policy is to provide the land at cost plus rates to the users who are regarded as deserving in some sensewhether they are public institutions, housing cooperatives or the poor-and to auction the rest for the remaining users. Once again the problem arises partly from inadequacy of knowledge and partly from the operation of normal administrative procedures. Once very large tracts of land are acquired there is no rational way of determining prices at different locations. The usual governmental response to this is to decide prices on a no-profit no-loss basis. Differentiation between locations is administratively difficult--specially in the case where the allottee has little choice in the location he is allocated. For the test of the plots, it is difficult for the public authority to decide the correctvolume ofland that should be auctioned at any given time. The public authority predictably can act as a classical monopolist: supply is restricted in the interest of raising current prices for budgetary reasons that most public authorities are subject to. Note that none of these arguments has focussed
on the effects of corruption that can reasonably be expected to exist in such authorities. The focus here is on intrinsic problems even if we assume that the public authorities are composed of intelligent, well motivated and honest people.
8,36 How does a public authority define who the deserving users are who should get land at pre-determined and essentially low prices? Here, once again, it is important to understand the politico-economic-administrative framework we operate in. The existence of competing elements of bureaucratic political and other public groups who all regard themselves as deserving is large in a society in which everyone regards himself as poor except, perhaps, the hypothetical top one percent of the population who these are is difficult to see. The allocation of land from a public authority can then be expected to reflect the differing degrees of access that each group enjoys. In a free market, the distribution of land can be expected to reflect the distribution of income and wealth. In an allocated "market".the distribution of land can be expected to reflect the distribution of access to the allocating authorities. The key insight here is that the distribution vi access to a publicauthority is likely to beeven more skewed than the distribution ofincome and wealth. There might well be redistribution within the top decile of the income distribution as various organised groups of white collar and other bureaucratic groups are quite likely to corner a disproportionate share of the land. To give an example: cooperatives are usually defined as deserving groups in our socialist culture. But who are likely to form housing cooperatives? The more educated, better off members of the bureaucratic and professional elite-not the poor who have difficulty organizing themselves. The first cooperative societies in Delhi which were able to get vast tracts of land at cost plus prices were composed of elite groups such as LA.S. administrators, lawyers, judges, engineers, journalists, etc. Opposition to or discussion of such allocative practices is also difficult to mount because most members of the articulate public get bought out in this way. Such processes, first observed in Delhi, are now seen in one city after another where urban development authorities have gone into operation and modelled themselves on Delhi. Once again, the corruption aspects of these allocations are not being here discussed. It is the distribution of power, of access to power and of self perception that determines this lopsided land allocation even if the allocators are a band of incorruptible dedicated planners and administrators. The poor, with little means to organise themselves, then get left in the cold of the unauthorised illegal sector of the market and might even be worse off than in a free market situation.
. 8:37 The key spatial problem that arises from public land acquisition and disposal is that it is difficult to devise allocation procedures within which people can also exercise locational choices. The usual procedure is for allocation by priority or by l?ttery: the consumer is then happy to receive the plot wherever it may be located. Ag:am, because of the organised pressure from various elite groups there is a contimnng dem~~d upon the local authority to do slum and squatter clearance from the centre of cities so that more well located land is made available for the better off. The typicalresponse ofpublic authorities is then to relocate the poor, if that is done ~t all, to the periphery of the city and often outside the urbanisable limits since that IS sc:en as th~ most expendable and cheapest land. As the city expands and the Phenphery shifts further out this merry go round is repeated at the expense again of t e poor. .
139
8.38 Another important inequitous effect of public aquisition of land is that it is often poor farmers who happen to be at the edge of the city who lose their land to the public authority. They not only lose their land at a price lower than they otherwise would have but also lose their livelihood at an earlier stage as well. The loser is then the poor farmer and the beneficiary the usually better off urban dweller.
Effects of Restrictive Leases
8.39 The restrictive practices in leases are designed with the noble intention of preventing allotment from being subverted with immediate sales. Here again the problem really arises from the fact that land is given at concessional prices and there are high incentives for making capital gains. This restricts spatial mobility of people who are tempted to indulge in illegal 01' extra-legal practices. The restriction on mobility has serious effects on efficiency in residential location as well as efficiency in the labour market.
8.40 The restrictions in leases, which are usually for 99 yeats, relate mainly to the transfer of the property. They usually prohibit the transfer of the property in the first 10 years except with special permission. Further, even after the 10 years, the public authority claims a significant share of the unearned increase in value in Delhi. This is pegged at 50 percent. The result is that most transactions are effected illegally or extra-legally and are not registered at all. The public exchequer therefore loses revenue which it would otherwise have gained through capital gains tax, stamps duty, etc. The local public authority does not get the 50 percent of the increment in value either. As a result of the decrease in open transactions, the plots that are so transacted gain a scarcity value and land prices are bid up unnaturally high.
In practice there is little difference between a long term lease and freehold. Even freehold properties are subject to all zoning and building regulations. They can also be subject to a transfer tax which recoups some of the unearned benefit. Since the restrictions on leases have to be administered, they lead to more avoidable corruption as well as inordinate delays than freehold lands.
Effects oj Urban Land Ceiling
8.41 The inefficiencies resulting from the operation of the urban land ceilings are quite. similar to those described above. It was envisaged that through the Act large portions of vacant urban land would vest with the public authority at nonmarket value prices. In reality, exemption clauses in the Act do not have the required clarity and their interpretation by local competent authorities vary considerably to the extent that exemptions in many agglomerations have been freely given to industries, education, health and other public facilities-often in conflict with development plan provisions. Accordingly, the Act in operation has not made a dent in achieving its prime objective.
8.42 Here again the assumption is that the public authority know's best. The aim of equity is not served well by such an assumption. Unlike rural land where it is relatively easy to designate "standard acres" i.e., the imposition of land ceilings in relation with the productivity of land, it is difficult to do the same in respect of urban land. In the case of rural land the land ceiling imposed on fertile and irrigated areas is less than that on dry and barren areas. This is
feasible administratively since these qualities are well known and do not change very quickly. The difference in value between the best and worst agricultural land is in the range of I to 5 or' I to 10. In the case of urban land, however, the difference in value between the edge of the city and the centre is typically I to 100 or more. Furthermore, in the context of rapid urban growth these ratios keep changing. Hence the imposition of a physical urban land ceiling means that different individuals are subject to ceilings which are quite different in value. As was documented in the last section, different ceilings have been imposed in cities according to their size. A logical question that arises is will these ceilings be altered as cities grow? The ceiling in Bangalore is currently TOOO M2. As BangaIore's population increases to 5 million (from about 3 million) will it be brought into line with the 4 largest cities and the urban land ceiling reduced to 500 ]\12 ? If so, how will the surpluses be squeezed out?
8-43 In terms of the efficient allocation of land, the imposition of urban land ceilings is essentially a short sighted measure. If implemented efficiently what it means is that all excess vacant land would come to the government at one point in time. Nothing will be leftfor thefuture. The government itself then has to decide when to release which parcels of land. As outlined earlier, the pressures on the government for allotment of the more desirable locations will be such that short term objectives will dominate those of longer term urban land husbandry. In addition, since the land is acquired at low prices once again, all the preferences are for inefficient uses as suggested before. The objective of providing shelter for the poor gets relegated to a very low priority in the way that such a regulation actually gets implemented. Land use for government purposes like the location of government offices and other public sector uses, usually receives the top priority. Shelter for' the poor is often comes as the fifth or sixth priority in these guidelines.
8.44 Apart from some cities where extremely large holdings were held by the erstwhile princes, the amount of land even potentially available from the operation of the urban land ceiling acts is small in comparison with the needs of cities and with the amount of land which can be acquired publicly through normal measures. In Madras>, for example, only 1700 hectares are potentially available, of which only 700 hectares are with individuals while about 1000 hectares are with industry. This points to yet another problem that has emerged as a result of the urban land ceiling act. Projects-whether for industry or for residential development-which need temporary or permanent land ownerships in excess of the ceiling need to get exemptions in each case. This has had the effect of slowing clown development as cases are stuck interminally with the competent authorities. This becomes the happy hunting ground of corruption.
845 These are problems inherent in large scale real estate management vested in public authorities. When land is acquired and given in diffierentkinds of leases with differring conditions, the administrative problem of management gets quite immense. Inevitably, transfers of land, changes in land use, etc. have all to be .dealt with administratively. This obviously leads to a whole host of avenues of corruption. Even in the absence of corruption, delays in changes in land use are built into the svstern and the "flexibility
• in urban structure essential for a
I
It Should be noted, however, that in Madras the imposition of the ceiling has been much more Iiberal allowing 500M2 per head in a family subject to a maximum of 2000 M'2.
I

growing city gets retarded. To the extent that decisions are subject to discretion and there is uncertainty in rules, procedures and regulations, overall procedures in the land market is increased and this impedes the flexibility that is necessary in a growing city.
The Need for a New Approach
8.46 We need an urban land policy to promote efficiency in the allocation of land, to help the poor in their access to land for shelter; to aid in the process of adjustment that cities have to go through in the process of rapid urban growth. The issues are now too complex to be merely seen in the context of public vs. private participation in the land market. The accumulated experience, as analysed above, in India as well. as other parts of the world is now extensive enough to question the way things have worked out in practice. Yet, it is also clear, that an unregulated private land market would be as bad or worse for orderly and equitable urban growth. In a situation where incomes are likely to lag behind, land price growth as seems to be the case the public authorities must intervene in order to protect the interests of the poor and to promote orderly growth. This must be done in the interest of social welfare but also because the city belongs to the poor as much as to the rich. It is still the poor who physically produce the goods and services for economic growth and wellbeing. They are as integral a part of the city as any other groups. But the tendency is to regard -them as marginal groups and hence to put them in marginal locations. Further, under conditions of rapid urban growth the provision of roads, of open spaces, of urban transport, of water, sewerage and sanitation, all have to be planned for; long term investments have to be coordinated. The market does not do these things well enough. We, therefore, need a dynamic symbiotic relationship between urban planning and the urban land and housing market. Public planning and policy enunciation should also use private energies and not usurp their functions. Moreover, these private energies must be directed in a desirable manner.
8.47 The problem is further complicated as the market responds to an enunciated plan. Services like roads, drainage, sewerage, water supply, and electricity are supplied by a public authority. Their planned provision has a crucial effect on the expected values of land. Speculators, developers, and others quickly alter their activities in response to a declared plan, sometimes constructively and sometimes perversely. These decisions cannot be predicted with any precision. So an exercise in urban planning can easily have unintended results inimical to its objectiYes.
8.;18 We need land policy to establish conditions conductive to land-use cooperation and controlled competition. Unless the wlole economy is planned and prices, in general, are not seen as important information signals about relative scarcity, urban planning must take into account the land market and people's preferences. Planning must, of necessity, be done by a small group of individuals, whose attempts to predict the future contain a large element of their own sets of preferences which are not shared by everyone else. New political systems are unable to transmit the wants of people very successfully to planners. Planning methods themselves are not adequate for the needs of cities. We should distinguish those measures which are specifically aimed at curbing undesirable speculation, since this is an issue that receives prominence in land policy. In

!4~
addition to efficient allocation of land we can regard the objective of land policy as the curbing of price rise because of the concerns outlined in the earlier section. Mere control of price is really a control of productivity if we assume that price reflects productivity.
8.49 The basic problem of urban land policy is the supply of serviced land:
(i) in adequate quantity
(ii) at the right locations
(iii) a t the right time
(iv) at the right place.
These four considerations are obviously interrelated. It is difficult to predict where new developments will take place and when and the price of land is highly determined by its location. The price is very important for it determines the intensity of housing development that then takes place. Much concern is expressed to restrain the price rise of urban land in order to make it accessible for lower income groups. If, however, the price of land is pegged too low, extensive rather than intensive development is likely to take place and hence demand for land gets intensified. If by public participation these prices are kept low and not allowed to rise in response to higher demand, the only logical consequence is that the public authority is forced to provide larger and larger quantities of land with all the attendant costs. Urban land policy should therefore be aimed at inducing the right prices to prevail in the market so that they can act as appropriate signals in the development of the land. Public authorities need to use both indirect as well as direct methods of intervening in the market. Indirect methods should essentially aim at curbing speculation as well as encouraging the private supply of developed land while direct methods should be mainly concerned with making available increased volumes of developed land for the poor. This calls for the building up of a new information system which is not there at all.

IX. Urban Land Policy: Some New Directions
Introduction
g.! . Urband land assembly, development and distribution, of necessity, constitute the foundations on which urban planning is based. The roots of rural urban 'problems can be traced to the management of urban land. Yet, given the complexities of the urban land market and the dual use of land for its "use value" and "exchange value", it is difficult to work out afaultless system of urban land management so that the problems of equity, growth as well as changing urban structure are taken care of simultaneously. Moreover, as has been noted urban land is not a homogeneous mass but a heterogeneous structure comprising lands of various descriptions. A proper classification of urban land is necessary, as the nature of problems and their solutions in each distinct category of urban land are bound to be different, We endorse the classification of urhan land into the following five broad categories as was recommended by the Gommitt~e on Urban La.nd Policy in !g65 :
(a) Developed Urban Land i.e., land within the city limits which is developed and largely built upon. There may be some vacant plots within it which would also fall in this category.
(b) Undeveloped Urban Land i.e., land within the city limits at any point of time which is not yet developed and built upon.
(c) Land within the Urbanisable Limits i.e., land presently agricultural or un-urbanised but likely to get urbanised within the next IO or !5 years.
(d) Land beyond the Urbanised Limits. This would naturally be purely rural land and the greater its distance from the city limits the lesser would it be subject to the forces of rural-urban interaction.
(e) Land the use of which is frozen as green belt or for agricultural purposes and also land which is reserved for community use.
g.2 This Task Force has concentrated its' attention on (a), (b) and (c) in terms of urban land policy specifically.. (d) and (e) are essentially covered by its recommendations on urban planning in general. The problems of urban land assembly and development are relevant mainly for (b) and (c) while policies on redevelopment are relevant for (a).
A Review of Legislation Affecting Urban Land
9.3 A major difficulty in the articulation of urban land policy is the plethora of existing legislation and regulation which govern the land market. These include laws governing land tenure, land use regulations, land taxation laws
~l-WH-25~ i

144
and laws enabling direct public intervention in the land market for the purpose of social controlofland. Specific pieces of legislation like the urban land ceiling and the working of the land acquisition act have already been discussed. The other relevant pieces of legislation are briefly described here.
9'4 The main constitutional provisions concerning land are listed in Appendix g. I. The key provision is, of course, Article Ig (1) (f) which confers on individuals the right to- property. This is, however, qualified by Article 19 (5) which allows the State to restrict the operation of article 19 (I) (f) by allowing reasonable r.estrictions on property rights in the public interests. All the other local and state laws and regulations become valid and operational on account of this provision. These may be classified as follows :
(i) Land Acquisition Act for the purpose of acquiring lands for a public purpose.
(ii) The Town Planning and Improvement Trust Acts to control the use of land to regulate its development with a view to promote organised urban growth. These include Master Plan and Town Planning Schemes, Urban Development Authority Acts, etc.
(iii) Municipal enactments for controlling the development of land and building activity. These include Building Bye-laws, Zoning Rules and Sub-Divisional Rules, Fire Safety Regulations, Periphery Control Acts, Restriction of Ribbon Development Act, Housing Code etc.
(iv) The Slum Areas (Improvement and Clearance) Act. (This is being deaIt with in some detail by the Task Force on "Shelter for the Urban Poor and Slum Improvement".)
(v) The Urban Land Ceiling Act.
(vi) The Urban Art Commission Act.
(vii) Other Acts like the Tree Preservation Act, Public Health Act, Place of Public Act, etc.
9.5 The development plans available in the country today have been prepared under the State Town and Country Planning Acts, which vary in scope and contents from State to State. Most of these plans have not been effective tools for implementation as by and large they have not provided for programming and budgeting and implementation on a phased basis linked up with availability of resources as discussed in Chapter IV. They have at best served as negative instruments of control and with little or no relationship to the hinterland. Also, multifarious and variegated legal tools listed above and dealing with development control have precipitated over-lapping and, at times, inconsistent provisions in urban areas. Comprehensive legislation that integrates economic development with settlement planning should be promoted and the Model Urban and Regional Planning and Development Act, which has been recommended by the Union Government to all States to enact should be pursued with renewed vigour, preferably in lieu of existing legislation but at least supplementary to such legislation where existing state and local government situations necessitate adjustments.

'145
9.6 Zoning Regulations have found .widespread acceptance as a means for providing public control over land development. Similarly, sub-division regulations which prescribe the minimum requirements to be met primarily by
,developments on the fringe of urban areas have been implemented as a means ofensuring that new developments will meet certain acceptable design standards. They are valid only if they substantially help in protecting health, safety, welfare and amenities. The Model Act referred to earlier, caters for zoning and subdivision regulations as part ofstatutory comprehensive development plans. Some State planning legislation however, cater for such regulations but as of today only Delhi and Bombay have clear cut zoning and sub-division regulations as part of the statutory planning process. To encourage such regulations, the Central Government through the Town & Country Planning Organisation brought out a Model State Zoning Act in 1970 as a guide for States to enforce where the comprehensive Model Regional and Town Planning and Development Law is not enacted. This Model Zoning Act was supplemented by the Model Land Use Zoning Regulations-I975 so as to include mixed land uses as an integral component of the urban land development process.
9.7 Efforts need to be made to integrate zoning and sub-division regulations in Development Plans so as to conform to overall land use patterns and within prescribed densities. Thus, though ceiling on maximum urban holdings are indicated under the Urban Land (Ceiling and Regulations) Act 1976, subdivision rules prescribe plot sizes not permissible below a certain minimum. These rules are supported by Building Bye-laws applied at the city level as a municipal function. Latterly some conflicts have surfaced in the application of builidng bye-laws with local authorities who look after this aspect in areas declared as development areas. In Delhi, attempts at unified building bye-laws have been finalised and even zoning and sub-division regulations controlled by the Development Authority but applied by the Municipal Corporation under delegated powers in their areas have been refined to enable a uniform interpretation. The objective in all major urban areas in India should be to tighten up and speed up the approval process for land development through clear rules and regulations so as to reduce uncertainty and speculation.' In this regard difficulties arise as the number of Urban Development Authorities increase a.nd take over some city functions from Municipal bodies of long standing. (The Task Force on "Management of Urban Development" is making recommendations concerning the relationship of urban development authorities with Municipal bodies).
9.8 Controls like zoning regulations, sub-division rules, building byelaws and authority to approve layouts are means of directing urban growth. These techniques which are negative restrictions on the use and development of land have been borrowed from advanced countries especially U.S.A. where itself their adequacy is currently being questioned. Many of the standards set in these regulations are very high and which are more suited for affluent societies and not for settlement patterns of low income families. Such standards make illegal by definition, any shelter: affordable by .low income families. There is urgent need for the modifications of such standards. In this context, it may be difficult to have one unified set of building bye-laws covering the entire city due to varying life styles prevailing in the old core, newly developing areas and the urban and rural villages.

. t46
Assemhb and Development of Urban Land: fVhat can be done
. 9'9 The last Chap.ter focussed on the problems t~at have. ~risen. in the timely supply of serviced and developed urban land In quantities which are adequate to match the demands arising as a result of rapid urbanisati on. lt is clear that the approach towards the development of urban land will have to be changed in order to accelerate the process of development of the land.
g.10 Land policy instruments can be classified according to their operation through the market or as direct measures allocating land to different groups. Public authorities need to use both indirect as well as direct methods of intervening in the market. Indirect methods should essentially aim at curbing speculation as well as encouraging the private supply of developed land while direct methods should be 'mainly concerned with making available increased volumes of developed land.
Indirect Methods
g.11 The existence of uncertainty is the main cause of speculative activities which result in the decreased supply of urban land, It is therefore necessary to take various measures which reduce the degree ofuncertainty in the land market by increasing the amount of information available.
Planning Notification
g.12 The Task Force has recommended systematic planning procedures at the city level. If this is done it is important that adequate information be available in the plans that are articulated. Since a public authority must provide various services, of which roads, transportation, electricity, and water are the most important, uncertainty about the future is decreased if plans for these services are announced considerably in advance. Both buyers and sellers can then have better information on which to base their actions. Efficiency of land use is likely to increase assuming that the planning decisions are good.
Approval Process
9.13 A tightening up of the approval process for land development can reduce uucertainty and speculation. A reduction in time required for such approvals, clarification of rules and regulations and predictability of approval would have the effect of reducing uncertainty. In the current circumstances, this applies particularly to all the land frozen under the urban land .ceiling act.
Property Tax
9.14 A well administered property tax can do much to regulate the land market. If properties are valued frequently, undesirable speculation will be dampened considerably since taxes would have to be paid on unrealised gains. There" is little reason why vacant lots should be taxed at lower or higher rates as long as they are revalued frequently. The holders ofvacant lots should be given

signals-through rising assessments with rising values-s-indicating the opportunity costs of their holding the vacant land. There is a genuine administrative problem of frequent land valuation but this can he systematised as well for it to be feasible. The Task Force on "Fianancing of Urban Development" has made recommendations to this effect. The main issue to note here is that a well administered property tax helps in bringing surplus land into the supply for development at the tight time when it becomes uneconomic to carry it as a non-revenue yielding asset purely for the purpose of making capital gains.
lnformation Exchange
9.15 Land Price Publication System : The last Chapter documented the serious concern being expressed at the perceived high increases in urban land values in the metropolitan areas. There are, in fact, no systematic data which can make it possible to document the actual movements in land prices in any of our cities. It is therefore difficult to reach precise conclusions on the actual pattern ofland value increases and hence to identify the casual factors underlying land value increases. It is therefore important that systematic data be collected so that the facts are clear. In addition, good data on land values would help in the assessment of property taxes, capital gains taxes and the wealth tax. The Task Force views the issue to be of sufficient importance that a separate chapter (Chapter XI) is devoted to a proposal for the establishment of a Land Price Publication System.
g.16 Register of Owners: The existing system of land records is quite inadequate in most cities. Ther e are no authoritative records of existing owners of the different plots in cities. It is therefore necessary to initiate a system of land ownership records. Since this would be a very large and expensive exercise, a beginning may be made with systematic registration of all new transactions. Schemes may also be begun in selected cities for preparing a comprehensive register of all land owners, particularly those on the urban fringe.
g. I 7 Standard Price System: It is important to regulate the agricultural land prices prevailing on the fringe so that orderly development of land takes place as cities expand. Area on the fringe of urban areas can be designated in rings and zones and a "standard price" announced (based on actual value) for each area in a base year. Subsequent to that, inflation adjustments can be announced every year along with other real price rises that are observed to occur around the notified areas. It should be feasible for such a system to be initiated in the existing 12 metropolitan cities and, as experience improves, extended to other class I cities and further. This would be useful for curbing speculation in the fringe areas and bringing land into development at the right prices and at the right time.
. g.18 The various measures suggested above will essentially increase the amount ofinformation available to both those holding vacant land which can be developed as well as those who need land for development and habitation. These measures would therefore promote the supply of serviceable land at the right time as well as at the right locations.


4().
TABLE 2.12
TASK FORCE ESTIMATES O.FSLUM POPJJLATION IN MILllON PLUS CITD!S.•19S1.
(Population in '000 .......

---
41
TABLE 2.13
DENSITY OF POPULATION AND AVERAGE HOUSHOLD SIZE IN SLUM AREAS
Average No. of persons
City Group Per acre of land Per Household
Citieshaving 1971 Census Population
(1) One lakh or more but less than 3 Lakh
(2) 3 Lakh or more but-less than One Million
(3) One Million or more (declared slums only)
(a) All Cities
(b) Hyderabad
(c) Ahmedabad
(d) Banglore
(e) Bombay
(f) Madras -. (g) Kanpur
(h) Calcutta
(i) Delhi
151 4'8
111 4.8
97 4'6
210 5'1
73 6'1
48 5.6
40 4'.5
190 5.0
484 4'0
88 3'7
255 4'7
Source : NSSO, SARVEKSHANA, VOL. III; APRIL, 1980,

· 42
TABLE 2:14
S01iFCHARACTERlSTICS· OF SLUM DWELLERS; 1976-77 (31st NSS ROUND)
Characteristics
%house owned'
House neither owned nor rented'
Rented House •
Average Monthly rent (Rs.)
A
54.12
8.61
37.27
B
50.74
6.20
43.06
C
._--
42.47
8.88
48.65
15.11 18.22 17.92
Wall
% Katcha 59.38 54.76 33.18
% Semi Pucea • 8.95 7.94 17.46
% Pucea 31.67 37:30 49.36
Roof
% Katcha 37.51 30.36 23.55
% Semi Pucea 52.21 52.59 52.23
% Pucca • 10.28 17.05 22.22
Latrines
% Separate for households (Sanitary) 2.55 2.32 5.18
% Separate for households (Others) 7.49 6.46 3.02
% No Separate Latrine 89.96 91.22 91.80
Ownership with Private Sector
% Area • 50.99 73.07 35.00
% Households 50.74 60.58 57.80
% Persons 50.94 ·59.54 56.26
Cities A: One lakh to 3 lakhs Population. B : 3 lakhs to 10 lakhs Population. C : One Million population & more.
Source: NSSO: SARVEKSHANA. VOL. III.APRIL. 1980.

43
TABLE 2.15
PERCENTAGE DISTRIBUTION OF SLUM POPULATION BY TYPE OF HOUSING FACILITY, 1976-77 (NSSO)
Percentage of slum Population having thefacilities in City group
Type of facility provided in slum areas Population Population 1 Million 1-3 Lakhs 3-10 Lakhs & above
Population
l. Electricity . 82.1 85.4 81.1
2. Approach road other than Kaccha to reach Slum area. 78.1 87.1 91.6
3. Slum area not water logged during monsoon 53.7 51.4 65.3
4. Tap or tubewell as source of drinking water 79.9 79.2 93.5
5. Latrine facility 44.8 51.5 81.9
6. Tap or tubewell and latrine facility 40.8 47.3 81.0
7. Underground Sewerage System 3.9 10.5 44.8
8. Garbage disposal system 75.7 84.7 .89.9
9. With facility (6) and (7) 3.4 9.9 44.3
10. With facilities (6) and (8) 33.3 43.3 78.0
11. With facilities (6), (7) and (8) 2.6 9.7 42.8
12. Minimum Needs Programme 15.7 26.4 59.3
13. Slum Clearance Programme • 14.9 25.8 46.9
14. Both (12) and (13) 8.6 18.8 28.4
15. Some development made in slum areas during last 5 years 53.9 63.9 56.2
Source: NSSO, SARVEKSHANA, VOL. III, APRIL, 1980.

Iii. UNiVERSAL SLUM IMPROVEMENT BY THE YEAR 2000: PROBLEMS AND
PROSPECTS
A Brief History
3.1 The first attempt a! tackling the problems related to -the existence of slums was the introduction of the slum clearance programme. This involved demolition and redevelopment or replacement of unfit housing which was done under the SlUIn Clearance/Improvement Scheme 1956. Under this scheme the Government was empowered to compulsorily acquire such areas for the purpose of redevelopment. Simultaneously the scheme also emphasized the .rehabilitation of slum dwellers with minimum dislocation of work place and residence. Keeping in vie~ the low paying capacity of slum dwellers, the scheme offered a package of minimum standards of environmental hygiene- and essential services rather than construction of any elaborate structures. The scheme also laid down minimum standards for redevelopment, plot sizes and tenements and offered rehousing facilities to the poor and incentives to higher income groups to gq for their own housing.
3.2 With the introduction of the scheme of 'Environmental Improvement of Slums in 1972 the emphasis of governmental efforts was shifted in the direction of environmental improvement of slums through the provision of certain minimum facilities like water taps and community facilities, storm water drains, sewers, latrines, paved roads/lanes and street lighting. A number of factors were responsible to bring about such a' change in governmental policy; these included (a) widespread resentment from tbe people' against large 'scale demolition of established communities under the Slum Clearance .Programme; (b) the large amount of funds needed for such a programme compared with the availability of Iimited resources; (c) fast deterioration of !he! "Fit" structures; (d) the change in emphasis was expected to induce owners of slums to undertake renovation of their properties; and (e) it was expected that a large number of slum dwellers could be benefited within the given resources, if improvement of slums was resorted to. With the shift in emphasis in government policy explicit recognition; was given .to the fact that neighbourhood environment constitutes an important housing externality. Accordingly, the Environmental. Improvement of Slums (EIS) Scheme vested power with the local authorities to prepare and execute schemes of road/street widening and improvement, landscaping and street ligh!ing etc.
3.3 Under the Sixth Five Year Plan, a sum of Rs. 151 crores pas been allocated for thel EIS Sche~e. A detailed discussion of the scheme is given in the fol1hcoming paras. -.
3.4 The problem of squatter settlements, unlike the slum problem" is not that wide spread; it is confined mainly to the big cities. The policy towards squatters' relocation was that of removing squatter settlements and their relocation at earmarked sites. But -of late, this policy has been replaced by one making provision for the regularization of squatters' colonies through the provision of common public services under programmes such as the sites and services programme. There is also a move to consider the possibilities of granting tenurial right to slum dwellers so as to encourage them to undertake the -improvement in their structures at their own cost. On the other hand measures to prevent squatting on government land are also being considered.

Slum Clearance and Rehousing-Past Efforts
3.5 The earliest effort for the betterment of slum dwellers can be traced to the year 1952 when the Scheme for Subsidised Industrial Housing was introduced. Although the scheme did pave the way for a partial rehousing of slum dwellers, it could not make much headway because , more than 50 per cent of the slum dwellers remained outside the purview of the scheme as they were not industrial workers. This, led to the formulation of the Slum Clearance Scheme in 1956; this scheme was devised practically on the same lines as subsidised industrial housing with
some variation in the quantum of Central Subsidy which was 37i per cent in the new scheme instead of 50 per cent earlier, the remaining 12 per cent was to be found by the State Govern
, \
ments. The main feature of the Slum Clearance Scheme was the provision of two types of accommodation .(a) houses/tenements with a minimum covered area of 232 sq. ft., (b) open developed plots in 'planned layout 1000-1200 sq.ft. in size. Both the accommodations included amenities such as latrine, kitchen and bath. The scheme, also provided for night shelters and dormitories.
3.6 Dilling the Fourth Plan the Scheme was transferred to the State Sector-but it suffered a set back owing to the inadequate allocation of funds. The open plot system, with its emphasis on environmental services, did not find much acceptance in the early stages of the, Scheme particularly in Madras and Delhi. The Delhi Development Authority as a result lowered the plot size from 80 sq. yds. to 25 sq. yds, which formed the basis for the rehousing of a large number at squatters in Delhi. Properly regulated and consciously pursued this, approach held considerable promise of rehousing for the urban poor.. /
Slum Improvement
3.7 The prospects of slum clearance and rehousing being bleak in the 'past, the original Slum Clearance Scheme was extended to cover slum improvement following the recommenda
. tion of the Sixth Housing Ministers' Conference in 1962. It was to be financed on the same pattern of loans and subsidies as "applicable to the rehousing operation. The financial assistance in the present scheme was restricted to the following:
(a) slum areas on public or requisitioned land; and
(b) slum areas where the majority of dwellers lived in the dwellings owned by them.
The scheme also provided loans out of the funds available under the scheme for the improvement of slums .on private land by the landlords or by the local bodies who were to recover the cost of such improvement from the landlords or for acquisition or requisition of such properties. In the absence of any means to recover the cost of improvement, not only did the progress of the scheme suffer but the problem became so overwhelming and resources so limited that the work of wholesale slum clearance had to be abandoned. In 1969, it was decided to confine the 'Scheme to slum improvement only. The Planning Commission reiterated this approach in its guidelines circulated for the formulation of the Annual Plan Programme. in 197071. A further step was the allocation of 100 per cent central grant for the improvement of bU5
tees in Calcutta. With this came into being the Central Sector Scheme (outside the State Plan) of Environmental Improvement of Slum Areas which envisaged 100 percent grant to begin with. The details of this scheme are discussed below.
Scheme of Environmental Improvement of Slums
3.8 The Scheme for Environmental Improvement of Slums was' introduced in April, 1972 as a centrally sponsored scheme in order to provide financial assistance to State Governments 19 W.H.-IO - -"-1
1 1 •...:lI
1 \

for undertaking the work of environmental improvement in the existing slums which. have :not been earmarked for clearance for a minimum period of 10 years. Originally, the scheme was to cover only eleven big cities, but subsequently, in 1973-74, another nine cities were added to the list so as to have a representation of at least one city each from all the major States and Union territories in the country." Later, in April 1974, in pursuance of the decision of the National Development Council, the scheme was transferred to the State sector as a part of. the Minimum Needs Programme. During th~ Fifth Five Year Plan its scope was further extended to cover all cities in the country with a population of three lakhs or more or at least' one cityftown in those States which did not have any city of this size.
3.9 Since April, 1979 the scheme has been extended to all urban areas in the country irrespective of their population size. At present, it forms
/
an important constituent of the. Prime Minister's 20-Point Programme under Point lO(a) and is being monitored by the Central Government, Ministry of Works' and Housing.
3.10 The scheme aims at providing certain minimum amenities in urban .slnms, removing the unhygienic conditions and effecting the environmental improvement of these areas. The amenities provided are, by definition, to be common and temporary in nature (considering the temporary nature of the slums).
Scale oi Improvement
3.i1 The improvement carried out under the scheme relates mainly to the provision of the followinz-c
(a) Water Supply including drinking water taps (b) Sewers
(c) Storm water drains
(d) Community latrines and baths; and
(e) Street lighting, widening and paving of lanes.
Any other item of improvement can be considered on its merits.
3.12 The standards, laid down in respect of facilities to be provided are as follows:,
(1) Latrines one seat for 20 to \50 persons.
(2) Water Taps: 1 Tap for 150 persons.
(3) Sewer Open drains with normal outflow avoiding accumulation of stagnant wasta water.
(4) Storm Water Drain: Quick drain out of Storm Water.
(5) COrpID1;ID.ity Baths: One bathroom for 20-50 persons,
(6) Widening and Paving of existing lanes: To make room for easy flow 'of pedestrains, bicycles and handcarts on paved paths to avoid mud and slash.
(7) Street Iighting: One Pole at 30 metres apart.
Per Caoita Cost Ceiline '
3.13 The per capita cost ceiling for the above mentioned facilities has .been fixed at Rs, 150. In addition to the above items of improvement, the scheme also provides for funds for
I. TI) start with, the scheme was introduced in the following cities/towns : (I) Calcutta, (:2) Bombay, (3) Delhi, (4) Madras, (5) Hvderabad, . (6) Ahmedabad, (7) Kanpur, . (B) Bangalore, (9) Lucknow, (10) Poena, (ll) Nagpur, (12) Indore, (13) Jaipur, (14) Srinagar , ([5) Patria, (16) Cochin, ('7) Ludhiana, (18) Cuttack, (19) Gauhati, (20) Rohtak.

47 \
acq~ition of land in slum areas provided such acquisition, is deemed essential for carrying out works of improvement in 'slums. The scheme, however, lays down that foods required for rehous~g the slum dwellers, dislocated as a result of land acquisition, at alternate sites, will have to be raised by the concerned State Government from its own resources. .
3.14 The expenditure on setting up the above mentioned facilities in accordance with the norms laid down in the scheme are to be met entirely by the Central Government under the present scheme. The State Government concerned is required to meet from its own resources the expenditure on departmental supervision and temporary housing of slum dwellers. The development works' in slums other than those listed above and the expenditure on maintenance of faciIitiesprovided under the scheme are also to be met entirely by the State Government concerned. Further, it has been stipulated that of the total central assistance more or less two-thirds would be utilised for setting up environmental improvement facilities (infra-structure) and the balance one-third would be utilised for acquiring land etc. for setting up the super-structure. The total budget amount under the present scheme is apportioned among the various cities/towns mainly on the basis of their population.
Notification of Slum Areas
3.15 For-the purpose of the scheme a "Slum Area" has been defined as an area notified as "slum" under the Slum Areas Act of the respective State/Union Territory. It is, therefore, necessary that there are statutory provisions in each State and Union Territory in the form of an Act defining a criteria under which an area can be notified as slum area. In the event no STIch Act is in existence in a State or Union Territory steps were to be taken urgently to initiate the enactment of such an Act in this regard.
Scope of the Scheme
3.16 While making selection of slum areas for the environmental improvement programme, the scheme stipulates that preference should be given to slums located on lands belonging to public agencies such as State Governments, Municipalities, etc: Improvement of slums located on private land can, however, be undertaken provided the State Government concerned enacts suitable legislation to the effect that the landlord of the private land would not be entitled for .higher rentals from the slum dwellers in consideration of such improvement effected under the programme and would not also claim higher compensation in the event of acquisition of the said land by the Government. In case, however, any existing legislation snch as the "Rent .Control Act' or the 'Slum Areas Act' ofa State Government already ensures that the l!Cudlord. could neither increase the rent nor claim higher compensation for his property in consideration of the improvement effected, there may be no need to. enact fresh legislation on this account. It would, however, be necessary to declare the areas 'proposed' to be. covered by improvements as "Slum Areas" within the definition of he "Slum Areas Act".
3.17 Improvement of srums where the plots and the houses are owned by .. the slum dwellers themselves may also be considered provided:
(a) the streets and pavements and other areas where it is desired to carry out works of improvement are the property of the local body or the government;
(b) the economic conditions of the residents is such that they can be considered poorest class of the society;
I' State governments/local bodies have to provide dlspensat-ies. primary schools and other cornrnunitv faeiliti. a
. from their OWn resources ifsuch facilities are not available within a reafC'nlll.,]e diflanc( Of tho slum area ~overt;d under the programme: ., ..'

(c) improvements should have normally been made 41 slums located on public lland., before improvement in relation to (a) and (b) above could be undertaken.
3.18 In order to have a better cost effective utilisation of the funds only such· slums were to be taken up for improvement, where water, electricity and sewer mains were available! at least on their periphery.
3 19 Other things being equal, preference was to be given to areas which may have already been provided with part facilities. Additional efforts in such areas may be put up to bring up these areas to the required standard of improvement with the least expense of funds and. time,
3.20 The concerned State/local governments were to bear the maintenance expenditute on the improvement work carried out under the scheme from sources other than allocations under this scheme,
Progress in Implementation
3.21 Ever since the Scheme of EIS came into being in 1972, its scope had constantly been extended to a larger number of cities and towns in the country in order to have a wider coverage of people. In 1978 the scheme became applicable to all the urban areas in toe country irrespective of their population size. In 1982 it was included as an important component in the Prime Minister's 20-Point Programme. Prior to its inclusion in the 20-Point Programme, . there was no isystematic monitoring of the progress of the implementation of the scheme and the State Governments and the Union Territories were doing the feed back of the progress under
. the scheme, in their respective State, as a matter of routine, to the Central Ministry of Works and Housing. Now, under the 20-Point Programme the scheme is systematic-any monitored and a regular feed back of the data in respect of physical achievement of the targets and tho expenditure incurred is undertaken by the various State Governments and the Union Territories as a matter of obligation on their part. The Central Ministry of Works and Housing, has been entrusted with the task of monitoring the scheme and is required to submit monthly and quarterly progress reports to the Planning Commission. The Ministry has framed comprehensive guidelines, outlining an over-all framework within which the State Governments and Union Territories are required to execute the scheme.
3.22 Before an assessment is made of the progress of implementation of the scheme a reference may be made to the Sixth Five Year Plan outlays and targets in 'respect of slum improvement in the country. According to the Sixth Plan document the problem of slums in the country has to be tackled over a period of 10 years. The Plan has made a provision of R<;. 151.45 crores and fixed a target of 10 million people to he covered under the Slum Improvement Scheme (E.I.S.). But according to the reports received from State Governments the! total Sixth Plan outlay in respect of State and Union Territories is about Rs. 159.64 crores and the physical target has been fixed at 8.02. million persons. Further, the Plan has estimated that by the end of 1985, the slum population of the country would be of the order of 33.1 million. The Plan's estimate has been based on the assumption of the Working Group, set up earlier by the Planning Commission, that a fifth of the urban population in the country constitutes slum population. According to the Plan document about 6.8 million people have already been covered under the Slum Improvement Scheme m.T.s.) since its inception upto ] 979-80. Thus, according to the Plan Document, about 26.8] million slum dwellers would still need to be covered under the E.I.S. Scheme by 1.985.
3.23 The assessment of the urozress of th~ F.T.S. Scheme can be made for two neriods t.e. period 1972-73 to 1979-80 (prior to the incorporation of the Scheme under the 20-Point

49
Programme) and period 1980-83 (the first three years of the Sixth Five Year Plan). Table 3.1 gives details of the progress of the scheme upto February, 1983, for the country as a, whole following the Sixth Plan targets.
/ 3.24 As of February, 1983, a total of about 11 million slum dwellers are reported to
have been covered under the E.I.S. Scheme all over the country. Of this total, about 6.8 million people were covered during the period upto 1979-80 and the remaining 4.2 mi.l1ion people were covered during the period 1980-83.. In the first two years after the scheme had come into operation i.e. 1972-197Ll, 50 per cent, of the total 6.8 million beneficieries were covered whereas during 1980--83, the maximum coverage of people (about one fourth ~f the total 4.2 million beneficiaries) was said to have been achieved in the year 1980-81.
3.25 Table 3.2 which gives Statewise details of the physical achievement (number of persons covered) for the period 1980-83 indicates that by the end of February 1983 (for three years) 4.2 million persons were reported to have been covered under the scheme, constituting about 50 per cent of the total number of beneficiaries who were expected to be covered during the five years of the Sixth Plan.
3.26 Among States, Andhra Pradesh and Orissa have already achieved over 75 per cent of their Sixth Plan targets while States of West Bengal, Tamil Nadu, Bihar, Uttar Pradesh, Punjab and Gujarat have covered over 5-0 per cent of their respective target. The States of Assam, Manipur and Kerala have shown quite tardy progress, their coverage of beneficiaries being 10 per cent or below. The remaining States have achieved between 25 per cent to 50 per cent of their physical targets.
3.27 By the end of March 1983, about 6.8 million slum dwellers were reported to have been covered under the E.I.S. scheme in the different metropolitan cities alone. Of this total about 4.3 million were. covered before the Sixth Five Year Plan and. the remaining 2.5 million were benefited during the first three years of the Sixth Plan, which is a little more than one third of the total coverage since the inception of the scheme in 1972. Bombay and Calcutta account for about two-thirds of the total coverage .
.Evallmtion of tlhe Scheme for Environmental Improvement. of Slums
3.28 Of late, the scheme has come. in for sharp criticism stemming mainly from its actual implementation. These criticisms are broad in nature and point mainly to the various lacunae both in the basic frame and execution of the scheme. These include:
(a) So far no systematic evaluation has been made of the salient features of the scheme and the extent to which it has achieved its basic goal even though it has been in existence for over a decade now.
(b) The schemesfipulatec1 the provision of certain minimum amenities which are basically of a temporary nature and have to be provided on a collective basis. Considering the temporary character of slum areas where these amenities are to 'be provided as also the cost constraint, the number of these amenities has been restricted to 5 items for which a per capita cost ceiling of Rs. 150 has been prescribed. It is not clear what the basis of the scale of the various amenities to be provided was, nor is it clear how the cost ceilings were fixed. The scheme also does not provide for a situation where a priority could be assigned to a particular ame~ify in the event of the inability of the concerned local authority to adhere to the total prescribed cost ceiling So as to ensure that all slums in the .

50
city are 'provided with at least one amenity which ~s considered as the most critical of the five amenities.
(c) There is no provision for a mechanism of detailed monitoring of the number of units provided of various amenities, The general emphasis being on spending the allocated amount and the number of beneficiaries is arrived at by dividing the total expenditure by Rs, 150, the allowable per capita expenditure. The conclusion is thereafter drawn that a certain number of slum dwellers have. been benefited under the scheme.
(d) The scheme does not provide any flexibility for variation in the rate of expenditure in accordance. with the varying needs, of slum areas, nor does it make provision for higher costs involved in slum improvement of those slums having peculiar geographical location. The programmes under the" scheme, therefore, are carried out primarily as a construction or public works programme having no regard for 'tlj1e peculiar features of slum areas and specific treatment in terms of environmental amenities which each slum needs. As a. result the very basic . objective of improving the environment of slums is defeated. I
(e) Under the present arrangements (as stipulated in the E.I.S. Scheme) there is a complete absence of any financial participation of local bodies in the environmental improvement of slums. Prior to the' introduction of ,the present scheme local bodies were required to undertake slum 'improvement out of their own reSOUTces. This practice has now ceased completely with the result that a fast deterioration of slum areas is taking place on account of lack of maintenance of various amenities by the local bodies.
(f) The existing scale of amenities now needs revision as these have proved impracticable both in physical and financial terms. There is a need to' reduce the norms and to raise the cost ceiling.
3.29 The various lacunae found in the actual implementation of the scheme relate to the diversion of funds and mixing them with the contributions from the local bodies. Unified programmes are formulated to provide service to areas other than the slum areas whicb' need these services most. It has also been observed that the various services provided under the scheme have not been in conformity with the scale and type of services/amenities as stipulated in the scheme. Even high cost Community Centres, Baratghars, Bridges a-nd Open Air Theatres have been provided from the funds earmarked for the E.I.S. scheme. .Expenditure on these amenities are undesirable. in view of the fact that large portions of slums are still to be provided with critical mini~um amenities like potable water, storm water drains, street ighting etc.
3.30 In most of the States the monitoring of the schemes has been quite unsatisfactory. The achievements are reported on the basis of sanctioned funds rather than the actual achievement, the method adopted is to divide the allocated funds by the per capita cost of Rs. 150 This is incorrect especially when the services provided for are different from those" stipulated in the guidelines of the Government of India. .
Universal Slum Improveenent by the year 2000
Projecting Slum Population
3.31 The progress of the E.IoS. Scheme has been reviewed in the foregoing section in the light of the Sixth Plan targets of physical achievement. In this section, an attempt is made to . assess the backlog of slum dwellers who have to be provided the minimum basic facilities under

51 ~.he E.l.S. scheme ali the basis of Task Force estimates of slum population in the country as a whole and sp:cifically in metropolitan cities. '
3.32 About 11 million slum dwellers have been covered under the £.1.S. Scheme between the Inception of the scheme in 1972 until February 1983. Of these, about 6.8 million persons were covered under the scheme before 1980. Since State-wise data for the' years 1972-79 are not available for coverage of the scheme, it is not possible to estimate the backlog and the consequent magnitude of the future task by State.. This is therefore done at the India level only. Information on coverage is, however, available for the metropolitan cities so metropolitan/nonmetropolitan estimates have ;been made as welL
3.33 According to Task Force estimates, the slum population in the country in 1981 was between about 32 and 40 million people, constituting 20 to 25 per cent of the total urban population. On the basis of the 11 million people who are reported to have already been eoveredunder the scheme, it is therefore estimated that 21 to 29 million existing slum dwellers have yet to be provided facilities under the slum improvement scheme. This constitutes 66 to 73 percent 'Of the total slum population in the country.
3.34 According to Task Force estimates the slum population in the 12 metropolitan cities was between about 14 to 16 million in 1981. The number of persons covered under the E.I.S'. scheme was about 7 million .of whom about 4.2 million had been covered by 1980. Hence, it is estimated that about 7 to 9 million persons living in slums in various metropolitan cities have yet to be provided with the necessary environmental facilities in the future. This constitutes about 51 to 57 per cent of the 19'81 slum population in these cities, and about 33 to 31 per cent of the total slum population yet to be covered in the country.
3.35 Estimating slum population in the future. implies that the pattern of urbanisation will remain much the same and that the formation of slums will continue apace. While it may be hoped that better planning of urban development will prevent the settlement of the poor in surroundings we are now familiar with as slums, it will still be the case that investments. in basic infrastructure for the poor will have to made continuously from the public exchequer. Thus the projection.s of urban slum population may be regarded as projections of people living in low income and environmentally deprived settlements, but which will be referred to as "slum population" in short.
3.36 The assessment of existing slum estimates revealed that the total slum population constitutes 20 to 25 per cent. of the total urban population while this proportion is 33 to 3-8 per cent for the metropolitan cities. Table 3.4 gives projections on slum population for 1981-. 2000. The projections for total urban population and that in metropolitan cities have been done by Task Force on "Planning of Urban Development". It is assumed that the proportion of slum population of the incremental urban population will continue to be 20-25 per cent: the low and high estimates are given on this basis.
3.37 The projections reveal that the 1981 slumpopulatlon will double by the year 2000. During. the Seventh Plan period this population will increase by about 7-9 million, of which a large proportion will be in the metropolitan cities-which includes 8 to 9 cities' which are expected to be added to the existing 12 metropolitan cities.
3.38 The next sections make an assessment of the costs of slum improvement before arriving at estimates of investment requirements for basic infrastructure in low income settlements.
I. Coimbatore, Patna; n.IS'll~, Madurai, Indore, Varanasi, Agra, Jabalrur, Vadodara,

..~
'j,
3.39 It is of interest to note that in a survey of municipalities made 'by the National Insti: tute of Urban Affairs, an estimate of urban population not served by essential public services like water supply, sanitation, roads, street lighting, etc. also comes to about 25 per cent. This gives confidence in our estimate of 20-25 per cent. In view of this information and all tbe other information available it is the Task Force conclusion that the current slum population is rww probably nearer 25 per ceru rather than 20 per cent.
Cost of Slum Improvement
3.40 The improvement carried out under the B.I.S. Scheme mainly relates to the provision of water supply including water taps, sewerage, storm water drains, community baths and latrines, street lighting and widening and paving of lanes. Standards have been laid do-wn in the scheme for effecting such improvement, The per capita cost ceiling for providing these facilities has been fixed at Rs. 150 which was Rs. 120 earlier. The expenditure on setting up these facilities in accordance with the norms laid down are to be met entirely by the Central Government. The State Governments are, however, required to undertake expenditure on developmental supervision, temporary housing and other development works (For a detailed discussion of the scheme refer to preceding paras).
3.41 The broad financial pattern of distribution of the per capita cost ceiling (PCCC) of Rs. 150 varies considerably in accordance with local conditions. In 1978, the Government of India laid down that only such slum areas may be included in the scheme whe-re water, electricity and sewer mains are available at least in their periphery Or where water supply could be provided through wells and septic tanks may be provided in the absence of sewerage facilities.
3.42 Of late, there has been a persistent deniand Ior an upward revision of the PCCC .from the State Governments who find this "Cost Ceiling" quite inadequate in view o-f the escalation in the cost of construction since 1978. Moreover, with the present per capita cost ceiling it has been found difficult to take care of the variation in expenditure because of the varying locations and nature of slums areas Dar does it make room for higher cost involved in the improvement of slums resulting fro-m a peculiar geographical location of slum areas. A number of. States have already undertaken slum improvement projects on the basis of higher cost. These include, among others, West Bengal (Bustee Improvement Programme in Calcutta) and Andhra Pradesh (Urban Community Development Programme in Hyderabad).
3.43 An attempt has been made to compile data on the increased PCC from various sources in an attempt to arrive at an acceptable per capita cost ceiling so as to work out th'e implied cost of slum improvement over the fifteen year perspective. These sources are: .
(a) Escalated PCCC as adopted in the Bustee Improvement Programme in Calcutta.
(b) Escalated PCCC as adopted by the Municipal Corporation of Hyderabad for the preparation of the Master Plans for Slums in the twin cities of Hyderabad and Secunderabad.
(c) Escalated PCCC as suggested by the Local Authority of Khanna town in Punjab and approved by it.
(d) Escalation in PCCC as suggested by Shri S. S. Tinaiker, Member of the Task Force, in his background paper for the Task Force.
(e) Revised PCCC as suggested by the various State Governments as reported to the Town and Country Planning Organisation.

(t) Figures of' PCCC as used· in the Accelerated Slum tnprovemen! Scheme and the Madras Urban Development Project in Tamil Nadu.
3.44 Unfortunately, details/of the cost break up in these schemes are not provided in these forecasts. Nevertheless, the available details on PCCC from each source are given below:
(i) The Bustee Improvement Programme, Calcutta
3.45 1,It
was for the first time that the Slum Improvement SCheme under the Central Sector (with cent per cent financial assistance) was introduced in the Bustees of Calcutta under a massive multi-sectoral investment programme of Rs, 150 crores of which Rs. 10 crores were earmarked for the Bustee Improvement Programme. Based on the conditions prevailing in bustees, the CMDA identified the physical sub components of this programme and determined the improvement norms. It was perhaps on this basis that an analogous .programme was drawn for other towns adopting similar improvement norms and per capita cost ceiling. The improvement norms prescribed by the Calcutta Metropolitan Development Authority were as follows:
(a) Conversion of existing service latrines into sanitary latrines/construction of new sanitary latrines either with Septic Tank with Chloronization chamber discharging into surface water drains in unsewered areas or connection to city sewer system where available, on the basis of one latrine for each hutment Or every 25 persons, whichever is advantageous,
(b) Potable water tap connection to individual huts for every 1000 persons with average water supply of 90 litres per capita.
(c) Surface, drainage facilities through underground conduits connected to underground sewer system where available or open surface drains discharging into the nearest open drainage channels.
(d) Paving of roads, streets and pathways within the- bustees.
(e) Security lighting of streets and pathways.
(f) Miscellaneous facilities such as garbage dustbins, bathing facilities, etc. at suitable locations.
The average cost' of improvement according to the above norms was initially fixed at Rs, 120 per capita, which was subsequently raised to Rs. 150 per capita, Now, the CMDA has revised this per capita' cost to Rs. 350. The hike in the per capita cost is explained bY not only increases in the prices of inputs but also enlargement of the scope resulting from integration of bustees service system for water supply and drainage and. sanitation with city's trunk services system,
(ii) The Urban Community Development Programme, Hyderabad
3.46 The Municipal Corporation of Hyderabad has undertaken two projects for the development of slums in the twin cities of Hyderabad aug Secunderabad. These relate to preparation of Master Plans for 457 slum areas in these cities" The programme is being operated under the "Habitat Housing Programme". Housing is being provided under the Urban ,O~w,niunity Development programme wherein house site "Pattas" have been given to slum dwellers to motivate them to construct their own houses on a self-help basis. The. amenities
.provided along with their per caplta costs are given below. The total capita cost of these amenities comes to Rs. 400. This cost also includes the cost of Community Halls, which

according to the scale of amenities as laid down in the Scheme, ate outside its purview, Even it the cost of a community hall is excluded from the total peec, it comes to Rs. 390, which again is q.uite high as compared to the existing PCCC as stipulated in the scheme.
Amenity PCCC Rs.
% of' the total PCCC
----_.-._--
(1) Asphalt Road
(2) Sewer Lines
(3) Storm Water Drains
(4) Community Lavatory
(5) Water Supply
(6) Electricity
(7) Community Hall
120
100
28
52
52
28
20
30
25
7
13
13
7
5
Source:
Total
Municipal Corporation of Hyde rabad,
400
----_._100
---
(iii) Khanna Town, Punjab
3.47 The following is the approved tender per capita cost of different amenities for slum improvement work in Khanna Town in Punjab. This is a revised estimate and relates to September, 1982.
-----_.-------------
Amenity PCCC
(Rs.)
(1) Water Supply 135
.(2) Sewer Open Drains 65
(3) Community Baths and Latrines 40
(4) Widening and Paving of existing lanes 105
(5) Street Lighting 35 ----------------------_.
Total 380
Source:-Town & country planning organisation.
The basis of the above hike, though not stated, could be taken as general increase in prices of construction materials and labour cost.
(iv) The Accelerated Slum Improvement Scheme of Tamil Nadu ) .-,.~~
3.48 This scheme was launched in Tamil Nadu in 1977-78 for accelerated improvement of 683 slums in 106 municipalities and township committees. To start with, Madurai, TiruchiraPalli, Coimbatore and Madras have been selected for implementation of the scheme. The'

55
scheme envisages the coverage of about 9 lakh persons. The scale of improvement adopted has been as follows:
(i) Public conveniences' ----------
1 seat for 10 families ---._ -
(ii) Watel" supply 1 public fountain for every 2bore well or tubewell).
0 families (or
(iii) Street Lighting 4 flood/tube lights per acre housing 1501200 families.
of slum area,
The estimated cost of these improvements is about Rs. 250 per capita. In another scheme introduced under the Madras Urban Development Project, the cost of improvement has been fixed at about Rs. 260 per capita. .1 .
'" ~.... ~,.
(v) Task Force Background Patrer
3.49 An estimate made for the Task Force suggests that the revised per capita cost ceiling should be Rs, 275. This assumes that certain cost reduction in the pce will be affected by adopting different alternatives for various amenities. A brief summary of these suggestions is made below:
Provision of toilets constitutes the single most important environmental amenity for the hygiene of slums, followed by drainage. The cost of one acqua privy seat based on actual rate of construction iJ;1 Bombay is about Rs. 7000. On the assumption that it is used by 50 persons, the higher side of the scale, the pee comes to Rs. 140, which is higher than t'he present pce. If some cost reduction is effected by eliminating items like doors and roofs or by resorting to redesigned layouts the cost can be brought down 10 Rs. 5000. This cost can further be brought down to Rs. 4000, if the toilets are connected with a sewer line. Further savings can be effected by adopting the low cost sanitary latrines designed by the "Sulabh Shauchalaya" Scheme in Bihar which is described in d:;,tail in Appendix I of this report.
3.50 In slums which are located in areas with low ground water or soft impervious strata, the NEERI design of rural latrines are the most snitab'e as it involves less expenditure and is easy to maintain and can be executed quickly. The estimated cost of this type of latrine is Rs. 3500 per seat without roofs and doors. A~ rf':~ards drainaze considering various aspects such as geographical location of slum areas, the degree of rainfall, Rs, 30 per capita as Rs. 150 per hut can be regarded as reasonable.
3.51 Water taps, pathways and street lichtinz constitute relatively minor items of expenditure and provide good scope for savings. Excenr wate·r supplv the other items do not constitute substanriallv to the cost of environmental improvement of slums. Considering various aspects, the PCC of Environmental Improvement of slums has been estimated at Rs. 275 if the amenities provided have to be of a scale and quality which really improve the environment of slums. . . I~
{vi) State Government Reports to the Town and: Country Planning Organisation
3.52: During the course of their field visit" to citiesltowns covered under E.I.S. Scheme, the TePO have solicited the views. of State Governrnenf/Union Territories on the adequacy/inadequacy of the existing per capita cost ceiling of environmental imorovemen-. Whil- no State considered the present pcce as adequate to meet the expenditure 011 slum imp-ovement most of the States gave varying figures for the revised per capita cost ceiling. These figures ranee
------------------ .._---------~~Tinaiker: Environmental Improvement of Slums and it:,; cost.
Urban Development Task Force Paper S. 4. Planning Commission, 1983.

from Rs. 200 to lts.500.The consensus was fora revised PCCC of Rs 250 to Rs.300. However, a few States favoured a still upward revision. i.e. Rs. 350 to Rs. 500. About 17 States gave their opinion for the upward revision of the PCC, of which six considered Rs. 300 to be adequate while two States thought that it should be Rs, 400 and 'one each favoured Rs, 200, Rs. 350, Rs. 500 respectively. No basis for the anticipated hike have been given by anyState, ..
3.53 In sum, following are the revised figures for per capita costs for slum improvement obtained from different sources:
(i) Rs. 250-TCPO Survey, Accelerated Slum Improvement Scheme, Tamil Nadu
(ii) Rs. 260-Madras Urban Development Project
(iii) Rs. 275-Task Force Background Paper
(iv) Rs, 30D-TepO Survey
(v) Rs, 350-Ca1cutta Bustee Improvement Programme
(vi) Rs, 380-Khanna Town, Punjab
(vii) Rs. 400-M. c., Hyderabad.
Investment requirements for UniversalSlum Improvement 1985-2000
3.54 This gives a considerable range of what the per capita cost of slum improvement should be currently. The Task Force on "Financing of Urban Developmen:' has made estimates of the "costs of urban infrastructure", They have included water supply, sewerage/sanitation, solid waste disposal, storm water drainage, roads, street-lighting and land preparation as the essential components of public infrastructure. Their low estlrna:e is about Rs, 750 per capita of which about one-third may be regarded as off-site infrastructure. Of the remaining Rs. 500, if allowance is made far the provision of roads (Rs: 200 per capita) and land preparation (Rs. 60 per capita) which is of a higher standard than envisaged in slum improvement schemes, a per capita expenditure of Rs. 300-350 (at about 1982 prices) Seems a realistic es~
timate tor slum improvement., .
3.55 Table 3.7 gives estimates of investment requirements for universal slum improvement by the year 2000. It is suggested that provision be made for the full incremental slum population in each plan period and the existing backlog of 23-'32 million people be covered in phases by the year 20{)(): 40 per cent in the Seventh Plan, 40 per cent in the Eighth Plan and 20 per cent in the Ninth Plan.
3.56 As shown in the table this scheme imolies a provision of Rs. 480-660 crores at Rs. 300·per capita in the Seventh Plan for coverage of about 16--22 milion people-an approximate doubling of physical targets in the Sixth Plan. Takinz into account the earlier conclusion of slum population now being nearer 25 per cent than 20 per cent, and the discussion on costs, it would seem that within the "hove range tl,p recommended expenditure in the Seventh Plan for slum improvement should be about Rs. 650-750 crores.
3.57 _ It should be emphasized. however; that a more svstemaric assessment of norms, Standards and their costs should be undertaken in order to arrive at realistic costs of these schemes. The practice of fixing p~r canita norms which are then not rl,~n(ted for lon~ l pn':'ths nf
time should cease. A procedure for the continuous monitorlna of these scheme', should be put info effect such that evaluations C:J'1 he done svst-rnatica'Iv. Tt would tb-n h~ fp;~"ih~~
to revise the cost norms at regular periodic intervals in response to changes in the cost s'nlC

57
ture prevailing in the economy. The above figures' should therefore be, taken to merely indicate the order of magnitude of funds recovery for the universal improvement, of s~ums by, ,the year 2000. Note that the backlog itself is about as much as the incremental slum population expected.
TABLE 3.:1
PROGRESS OF SCHEME OF ENVIRONMENTAL IMPROVEMENT OF SLUMS-ALL INDIA UPTO FEBRUARY, 1983
Population Covered (in lakhs)
1972-74 33
1974-78 17 1978-80 18
Sub-Total 1972-80
1980-81 11
1981-82 16
1982-83 15
Sub-Total 1980-83 42"
Grand Total 110
Source: 1. Ministry of Works & Housing, Government of India.
/ :Z,- Town and Country PI!!J1nin~ Organisation, Ministry of Works and Housing,

TABLE '3.2
STATE-WISE PROGRESS OF SCHEME OF ENVIRONMENTAL IMPROVEMENT OF SLUMS, 1980-83
Population Covered (in ·000)
State Sixth Plan Achievement Percentage 1980-85 1980-83 achievement
Physical Target
1000 750 75.0
50 9 18.0
132 80 606
333 195 58.6
253 88 34.8
27 10 37.0
293 99 33.8
400 182 45.5
400 30 7.5
534 137 25.7
850 400 47.1
8 1 . 12.5
20 7 35.0
37 28 75.7
333 186 55·9
167 75 44.9
12 5 41.7
1075 648 60.3 {',I
33 10 30.3
670 383 57.2
660 460. 69.7
700 358 51.1
33 -13 39.4
30 6 20.0
36 28 77.8
8086 4188 51.8
----'----
5our~,,: Town and Country Planning Organisation, Ministry of W9rks and Housing, 1983.

59
TABLE 3·3
COVERAGE OF ENVIRONMENTAL IMPROVEMENT OF SLUMS IN METROPOLITAN CITIES (UPTO MARCH 1983)
(in '000)
]981 Population covered under the Scheme Total upto % of Census ----~--------~----March the total
City Population 1983 beneficia-Before the 1980-81 1981-82 1982-83 ries Sixth Plan
-_._-----_._1 2 3 4 5 6 7 8
Calcutta 9166 1366 220 200 80 1866 27.22
Greater Bombay 8227 1832 121 63 124 2140 31.22
Delhi 5714 166 66 133 159 524 7.64
Madras 4277 (a) (a) 850(b) 850 12.40
Bangalore 2914 (a) (a) 135(b) 29 164 2.39
Hyderabad 2528 137 78 14 36 265 3.87
Ahmedabad 2515 32 32(c) 0.47
Kanpur 1688 205 21 25 251 3.66
Pune . ]6.85 130 21 11 162 2.36.
Nagpur 1298 162 102 15 279 4.07
Lucknow 1007 176 11 11 5 203 2.96
Jaipur ,..; 1005 103 4 12 119 1.74"'"
TOTAL' 42024 4277 496 601 496 6855 100.00
Notes: (a) No separate figures are available for persons covered underthe Scheme upto 1979-80 (before the Sixth Plan) and for the years 1980-8], 1981-82, 1982-83; only cumulative figures of coverage upto March 1982 and December 1982 for Madras and Bangalore cities respectively are available.
(b) Total under col. 5 does not include these cumulative figures of persons covered. However total under col. 7 includes the cumulative total mentioned above (in col. 5).
(c) The fizures are partial since these do not include improvement work undertaken by the Municipal Corporation of Ahmedabad. .
Source: (i) Town & Country Planning Organisation, Ministry of Works & Housing, Govt. of India, ]983.
(ii) Housing and Urban Development Department, Government of Tamil Nadu, 1983 (for Madras city).
/

-----
TABLE 3'4
SLUM: POPULA-TION .. IN INDIA ~ROJECTIONS, 1981 ......2000
A. U~~ltn Population (Population in Millions)
1981 1985 1990 2000
India 162 188 225 310
Metropolitan1 42 51 65 95
Other Ur~an 120 131 160 215
Source :-ra,slc Force o.n "Planning of Urban Development"
B. . Estimated Slum Population
19812 1925 1990, 2000
India
M.etropolitan
Other Urban
.;,.
LowS
High4
LowS
High'
Low?
HighS
32
40
14
16
18
24
38
41
17
19
21
28
45
56
22
25
23
31
62
18
32
36
30
42
1. Estimated Metropolitan population includes that of citiesexpected to have more than 1 million population in ·the projected years.
2. Task Force estimates for 1981 Slum Population
3. "All India" Low estimate: Assuming 20% of additional urban population will be in slums, Squatters' settlements, etc.
4. "All India" High estimate: 25% of additional urban population.
5. "Metropolitan" Low Estimates 33% of additional metropolitan population.
6. "Metropilitan" High Estimates 38% of additional metropolitan population.
7. "Other" Low Estimate: Residual from (3) and (5) (About 15% of additional other urban population).
8. "Other" High Estimate: Residual from (4) and (6) (About 20% of additional other population).

6I
TABLE 3.5
SLUM POPULATION YET TO BE COVERED-ALL INDIA - (FEBRUARY 1983)
(in '000)
Total Total Slum Population Total No. Slum Population yet to Urban estimated for 1981 of slum be covered Population dwellers
Low High covered up Low Estimate to Feb. 1983 Estimate High
1 2 3 4 5 6 7
AIl India 155233 32414 40875 10983 21426 (66.10)
29887 (73.11)
-------._-------------
Percentages in bracket relate to total slum population.
Source: (1) Coverage ofBeneficiaries: Town & Country Planning Organization, Government of India.
(2) -Slum Population : Task Force Estimates.

..•..',<
TABLE 3.6
SLUM POPULATION YET TO BE COVERED-·METROPOLITAN CITIES (MARCH-1983)
(in '000)
City 1981 Census Population
Population living in Slums on the basis of assumed percentages
Low High Estimate Estimate
Slum Population covered upto March 1983
Slum'pcpnlation yet to be covered
Low Hizh . Estimate Estimate
----- - ---- 1 2 3 4 5 6 7
Calcutta 9166 3208 3666 1866 1342 1800 (42) (49)
Greater Bombay 8227 3291 3702 2140 !l5l 1562 (35) (42)
Delhi 5714 2571 2857 524 2047 2333 (80) (82)
Madras 4277 1283 1497 850(a) 433 647 (34) (43)
Bangalore 2914 583 728 164(a) 419 564(72) (77)
Hyderabad 2528 506 632 265 241 367 (48) (~8)
Ahmedabad . 2515 503 629 32(b) 471 597 (94) (95)
Kanpur 168~ 675 760 251 424 509 (62) (67)
Pune 1685 253 . 337 162 91 175 (36) (52)
Nagpur 12g8 389 454 279 110 175 (28) (38)
Lucknow 1007 352 403 203 149 200 (42) (50)
Jaipur 1005 251 302 119 132 183 (53) (61)
Total 42024 13865 15967 .6855 7010 9112 (51) (57)
Notes: (a) This is a cumulative total of beneficiaries covered upto March 1982 and December 1982 for Madras and Bangalore, respectivel y .
(b) These figures are partial since these do not include the number of beneficiaries covered under Slum-Improvement undertaken by the Municipal Corporation of Ahmedabad.
(c) -Percentage in bracket relates to slum population.
Source: (1) Town & Country Planning Organisation, Ministry of Works & Housing, Government of India.
(2) Housing & Urban Development Department, Government of Tamil Nadu, 1983 (for Madras city).

------
----
TABLE 3.7
INVES TMENT REQUIREMENTS IN LOW INCOME URBAN SETTLEMENJS, 1935 -2000
A. Estimate of Backlog in 1985 (In millions) 0_____
Total Slum Slum Expec- Increment Estimated Population Popu- ted co- to slum backlog 1981 lation verage population 1985 ------ covered 1983-85 1981-85,
upto 1983 ------- -----.-Low High Low High Low High
India
Metropolitan
Other Urban .
32
14
18
40
16
24
11
7
4
4
2
2
6
3
3
7
3
4
23
8
15
32
10
22
B. Slum Population to be covered 1985-90 (In millions)
Tndia Incremental Slum Population
Backlog coverage
Total:
Metropo Incremental Slum Population litan Backlog coverage
Total :
Other: Incremental Slum PopulationIUrban
Backlog coverage
" 1985-90 1990 -2000 ------.
Low High Low High
7 9 17 22
9 13 14 19
16 22 31 41
5 6 10 11 3 4 5 6
8 10 15 17
2 3 7 11'
" . ." 6 9 9 13
:-----.. Total: 8 12 ]6 23
C. Investment required of 1985~20oo (Investment in 1982 in Rs. crores)
1985-90 1990-2000
Low High Low High
(i) At per Capita Cost 0/ Rs, 300
India 480 060 930 1230
Metropolitan cities 240 300 450 510
Other Urban 240 360 480 720
(ii) At per Capita Cost 0/ Rs, 400
India 640 880 1240 1640
Metropolitan cities 320 400 600 680
Other Urban 320 480 640 960
--- ---_._- ._-Notes: 1. Backlog Coverage: It is assumed that approximately 40 per cent of existing backlog in 1985 will
be covered in the Seventh Plan and the rest in the Eighth and Ninth Plan. " 2. It is assumed that all the slum population will be covered by the year 2000 with the backlog coy
erage distributed as above.

.' ','
IV. IMPEDIMENTS TO HOUSING INVESTMENTS BY THE POOR
4.1 The poor do make substantial housing investments. The issue, is how to encourage larger investments without the poor having to sacrifice any of the basic essentials for living and how to utilise that investment to achieve greater comfort and livability of shelter. The poor, in this context, need to be defined as all those who cannot compete in the authorised housing market 'Owing to their low income and for lack of assets. This chapter reviews the various impediments, legal and otherwise; which militate against the poor even helping themselves. '
The Role of Legislation
4.2 Some of the legal impediments which are related to Town Planning legislation (which provides the statutory basis for Master Plans/Development Plans ofcities) and building regulationS are well recognised (though hardly any modifications to them have actually been made) as factors which inhibit the poor from making significant housing investments. These relate to zoning re,gulations,-standards 6f services, minimum plot sizes, maximum permissible density, requirements of minimum sizes of living spaces and standards of building construction etc. All such requirements pot the cost of even minimum sized plots and minimum specified tenements far above the means of the poor and in effect deny them access to authorized, "decent" housing.
4.3 It is generally accepted that the security of land tenure encourages investment in housing. From this point or view legislation regarding slum areas which affects settlements of the poor needs to be analysed. As mentioned in the last chapter the first Slum Areas (Improvement and Clearance) Act which was applicable to the Union Territory of Delhi was passed in 1956. TaJkingabout the Bill, the then Minister for Home Affairs explained in the Rajya Saoha : "According to the normal standards, the population in an acre should not exceed 2eO. In Delhi, it is 'On an average, as much as 600. But in the Slum Areas the number of persons per acre-s-in some of the Katras-goes up to about 2500.".
The Minister told the Lok Sab'ha : "The population living in Slums comes to nearly 2 Iakhs; . that is, about 40,000 families are somehow managing to exist in tllese Slums. . So, the Bill seeks to remove this evil and we hope that vigorous' measures will be taken in order to restore some sort of decency of life to the large numbers who are living under unimaginable conditions in' these areas today.i'" The Act primarily applied to dilapidated, overcrowded, insanitary pucca buildings since the problem then as explained by the Minister, was mainly of insanitary living conditions in such buildinzs. By amendments made after 1964, the Act encompassed unauthorized hutments also." Subsequently some 'of the States
lReport of the study group on Town Planning and 'Building Regulations, Ministry of Works "and Housing,Govt. of India.
2Birdi, H. D. Delhi Slums and Law, ISSD, New Delhi 1982, (p. 107) 3Ibid, (P. 107)
«P.or. instance (Section 4) "(1) where the Comnetent Authority ...• , is satisfied that any building in a slum ~rea~ IS In .l1;nv resoect unfit for human habitation, it may ... , .. serve unon the owner of the building a notice reqtnrmg him.... to execute the work!'! of improvement specified therein and stating that in the opinion of] the authority those works will render the building fit for human habitation."
The amendment in 1964 added :
"Provided that where the owner ofthe building is different from the owner of the land on which the buidling stands and the wf)r~s of imnrovement required to be executed relate to nrovision of water taos, bathing places. constru"] ction of dr>LITJS, OlJe'1 or closed as the case may be, nrovision of water-borne latrines OT removel of rubbish and such works are to be executed outside the building, the notice shal] be served upon the owner of the land,"

---------
passed similar pieces of legislation based on the Slum Areas (Improvement and Clearance) Act, 1956. The following states have enacted Slum Areas Acts:
(1) ~dhra Pradesh (1956)
(2) Madhya Pradesh (1956)
(3) A&3am(1961)
(4) Punjab (1961)
(5) Uttar Pradesh (1962)
(6) Tamil Nadu (1971)
(7) Maharashtra (1971)
(8) West Bengal (1972)
(9) Gujarat (1973)
(10) Karnataka (1974)
(11) Kerala
Broadly they 8Jl conform to the Slum Areas (Improvement and Clearance) Act, 1956. There are minor differences between them (except the case of Gujarat where there is no provision for land acquisition under the Act).
4.5 Because of tardy implementation resulting in. failure to keep pace with the growth of population in the cities, Master Plans/City Development plans failed to create an orderly and hygienic urban environment and the problem of the growth of unauthorised hutments increased. .AS a result or the recognition that the policy of clearance and rehabilitation of slum dwellers could not be successful in the face of growing problems5, the Scheme for Environmental Improvement in Slum Areas was introduced in 1972 in the Central Sector. The operation of the Scheme is made possible by the statutory provisions in the Slum Areas Act in those states where it has ,been passed.v The important sections among these provisions, which relate to slum improvement, are listed below.
<; 4.6 The Slum Area (Improvement and Clearance) Act. 1956 states that:
"(i) "There the Competent Authority upon report from any of its officers or other information in its possession is satisfied as respects any' area that the buildings
ln that area
(a) are in any respect unfit for human habitation, or
(b) are by reason of dilapidation, overcrowding, faulty arrangement and design of such, buildings, narrowness or faulty arrangement of streets, lack of ventilation, light or sanitation facilities or any combination of these factors, are detrimental to safety, health or morals,
it may, by notification in the official Gazette, declare such-area to be a slum area."
"{ii ) In determining whether a building is unfit for human habitation for the nurposes of.this Act, regard shall be had to its condition in respect of the following matters,
that is to say
(a) repair
(b) stability
r-. ,5Descrintion of Slum Improvement Scheme-Internal .Brief for Minister P. C. Sethi, Ministry of Works an . Housing, 198(1.
; ~ (The states v hich rave net enacted Slum Areas legislation face several legal problems in takina up improvement work in slums. narticularlv those on private lands. They presumably try to implement the Scheme by taking action under Municipal Acts and by laws.

,._~
66
(c)' freedom from damp
(d) natural light and air
(e) water supply
(f) drainage and sanitary conveniences
(g) facilities for storage, preparation and cooking of food and for the disposal of waste water;
and the building shall be deemed to be unfit as aforesaid if and only if it is so far defective in one or more of the said .matters that it is not reasonably suitable. for occupation in that condition.?" .
4.7 Slum Improvement: The Acf empowers the Competent Authority to serve upon the owner of a building or land in a slum area, to execute the works of improvement. (see footnote 4). In the event of the owner failing to execute the work, the Competent Authority may itself do the work required to be done under the notice and recover the expenses with in.terest from the owner.
4.8 Acquisition of Land: Where it appears that in order to enable the 'Competent Authority to execute any work .of improvement in relation to any building in a slum area or to redevelop any clearance area, it is necessary that land within, adjoining or surrounded by any such area should be acquired, the Government may acquire the land and make it available to the Competent Authority to execute the necessary work. The amount payable as compensation under this Act is sixty times the net average monthly income actually derived from such land during the period of five consecutive years immediately preceding the date of publication of the notice to acquire the land.
4.9 Protection of Tenants in Slum Areas from Eviction: No person can evict a tenant from a building or land in a slum area without permission from the Competent Authority. In granting or refusing such permission the important factors which are taken into consideration are:
(a) whether alternative accommodation within the means of the tenant would be available to him if he were evicted.
(b) whether the eviction is in the interest of improvement and clearance of the slum area.
. 4.10 The Slum Areas Act refers to the inadequacy of shelter in terms of its structural quality, hygienic condition and availability of services. It does' notconcem itself with its legality or illegality. Originally, when the Bill was drafted. its major concern was with the improvement of old, insanitary pucca 'buildings, in which case the question of ownership of the building and of the land on which it stands, and the' contractual relationship between the owner and occupiers is generally straightforward. When the Act is applied to hutments, .their unauthorized status raises a- number of questions which the Act does not deal with. The Act seeks to provide basic services to slum. dwellers in order to relieve the wretched conditions in slums. Its limited objective is to stop slum areas from being a danger to the health, safety and morals of the people of the area. In this respect it is a temporary measure.
4.11 A pucca building may become a slum over a period of time owino fa nezlect, 18~k
of or inadequate maintenance, overcrowding, etc. (behind these reasons may be such factors as
7Section 3 Declar:"tion of Slum ATef-!. .. _The Slum Area (Improvement and Clearance) Act, 19::>6.

the Rent. Control Act, non-availability of affordable alternative accommodation etc.), A hutment, however, is a slum from the start because as an unauthorized settlement it suffers from haphazard growth and a lack or acute underprovision of basic services such as potable water supply, latrines and drainage. The emergence of hutments can be directly attribu.ed to Town Planning legislation and building regulations which lay down standards of space, services and construction, the achievement of which is beyond the investing capacity, of the low-income population. Slum improvement may relieve insanitary and wretched conditions in old, pucca buildings, but i~ cannot be a corrective measure even to that limited extent in the case of hutments as .long as the processes of .Town Planning, financing and management, which determine the access people have to land and services, continue to operate i~ their present form, Thus the laws and procedures formulated in the name of creating planned development and hygienic' environment effectively exclude the poor from some of the fundamental necessities of a better life. Worse still, the prevailing system calls into question. the legitimacy of their very existence.
4.12 From the above discussion it becomes obvious that Slum Improvement is not intended to provide a solution to the question of housing for the poor. It is silent on the crucial question of tenure to the residents of slums (hutments) , Although the impracticability of slum clearance is well recognized and it is assumed that the slums which are. taken up for improvement will remain for some years, their residents are given no legal status. The Act has thus failed to create conditions conducive to' the making of hOUSIng investment by the poor.
4.13 Slum improvement work as part of the Minimum Needs-Programme, includes provision of .communal water taps and latrine'S, paving/widening of pathways, construction of open drains and installation of street lights. . These improvements can be carried out after an area is declared as a slum area under the' Slum Areas Act. Any person aggrieved by such a declaration can appeal to the Administrator (Tribunal, Appellate Authority, Court, etc. in the State Acts) and get the declaration rescinded. No improvements are possible in such cases. Even in those cases where an area is declared as a slum area and is improved, the ownership of the land continues to rest with the original owner. The residents get no legal right to occupy the land.. They are protected from eviction, in that ~he Competent Authority has to grant permission to evict residents of notified slums. (Residents in non-recognized slums do not get such protection). The Act mentions land acquisition only 'in order to enable the authority to execute any work of improvement in relation to any building in a slum area or to redevelop any clearance area'. It is ambiguous on the question of acquisition of land to facilitate hutment improvement.S Because the Slum Areas Act does no! concern itself with the unauthorized status of hutment'S, or ownership and proposed use in the city Master Planil Development Plan of the land on which they ,are situated, a number of difficulties arise in the .operation of the Slum Imporvement Scheme. A large number of hutments are situated on lands which are regarded in the MasterPlanjDe'velopment Plan as unsuitable for building purposes e.g., lands subject to flooding, steep slopes of hills, lands without proper access etc. Many of them cannot be improved at a 'reasonable expense' (as required by the Act) and for others slum clearance is the only viable alternative. Given the impracticability of slum clearance and! rehabilitation (as expressed in government documents) the possibilities for slum improvement in such hutments are .doubtful.
4.14 Many hutments occupy lands reserved for public purposes (schools, hospitals, parks etc.) in the Master PlainjDeve{opment Plan of the' city. The record of Master Plan implementation has generally been very poor. In addition to the problems of inordinately long and complicated land acquisition procedure, local authorities face' the problem of acutely inadequate finance to acquire the' reserved lands, These lands cannot be built upon or sold; they remain
-------_._----.---------.--_._--------,.-----SMost of the State Acts, however, explicitly ~~nti!,n acquisition of land ~9 facilitate slum (hutment) improvement
But, as far as can beascertained, this provision in the Acts has been utilized m extremely rare cases to acquire land for this purpose.

68"
vacant. Many of them, over a period of time, are occupied by hutments. Can those hutments be improved? If the statutory Provisions of the Master Plan are not to be violated, they must be cleared, which is rarely possible. Alternatively they can be improved as a temporary measure. The guidelines for slum improvement", however, suggest that the slum must not be earmarked for clearance for at least 10 years from the date of effecting improvements.. This compromises the Master Plan. The third possibility is that when the Master Plan is revised (there is a statutory provision for revising the Master Plan every 10 years 1;'" the land-use of the sites of hutments is changed from 'public purpose' to 'residential' to accommodate the existing slums, T~ would, in all probability, mean less than adequate provision in the Master Plan of public amenities for an area, such as schools, hospitals, which are primarily intended to be used by the poor. Such anomalies have their roots in the contradictions between the Town Planning Act (which provides the statutory basis for Master Plans/Development Plans) and Slum Are~ Ac~.
4.15 The Act makes no reference to the question of ownership of the land On which a slum is situated. This also presents difficulties for executing slum improvement. The guidelines for the Scheme of Environmental Improvement in Slum Area'", therefore clearly stipulate that improvements should be completed in slums located on public lands before those on private lands can be considered. Public lands include lands owned by State Government, Central Government, railways, Port Trust etc. Even here the record of implementation of slum improvement on lands owned by different public agencies is very uneven. There is resistance from some of them to allow slum improvement on their land.
4.16 Generally most of the hutments are highly densely built. W11en slum improvement work is executed realigning and shifting of huts is sometimes required in order to make room for building communal latrines, open drains and pathways. The Scheme, however, does not provide for reducing the high level of congestion in hutments by decanting some of .he households to other suitable locations (although the Slum Areas Act defines overcrowding as one of the factors which renders buildings in an area detrimental to health, safety and morals). This is primarily because slum improvement is regarded as a temporary measure, executed only to the extent of providing basic services on (or in rare cases, near) the site of individual hutments. As such, it is not dovetailed with a larger programme for decongestion which is, in a number of cases, a primary need.
4.17 All such problems arise because the Slum Areas Act does not take into account the' unauthorized status of hutments. It makes its central concern the provision of sanitary environment in slums.· This. may indeed be the need in unsanitary, unsafe, pucca buildings but in hutments the problem is not bad sanitation. alone." but more importantly their illegality. The failure of the Slum Areas Act to deal with the unauthorized status of hutments perpetuates the sense of vulnerability (vis-a-vis the city authorities and!.or slumlords, local inte-rest groups etc.) and acts as an impediment to possible sustained and substantial improvement by 'the slum
9Ministry of Works and Housing, Govt. of India: Draft Revised Guidelines for Point 10 (a)'of the 20 Point Programme-Scheme for Environmental Improvement m Slum Areas October 1982.
ro Ibid.
llExperience amply shows that mere .p;.ovisin of basic ~ervict:s on a meagr~ scale (as given in the guideline 8 and even more meagre in practice) and an absence of ~n effective ~omm",:mty. organization to maintain the services. do not lead to any appreciable improvement in the sanlta~lOn ~ltl1atlOn in hutments, In this respect, even the limited objective of the Act IS defeated. (Also see S. S., Tinakar s paper-Envlronmental. Improvement of Slums and its cost',

69
dwellers or their shelter. They remain outside the formal. TOwn Planninz framework as abe.rration: in _the Master Plan. . In the absence of security of tenure the resid:nts are- reluctant t? l?~est ~n shelter improvements any more than absolutely necessary to attain minimum liability, In fact, the Slum Areas Act restricts erection (which includes extension alteration or re-erec.ion) of a building in a slum are-a without the previous permission of the'Competent Authority". The Act, however, does not specify the conditions which need to be fulfilled to obtain such permission.
4.18 Because of a varie·ty of shortcomings in the Slum Areas Act it is not capable of creating conditions fit for human habitation in hutments. To limit the problems they have to deal with, city authorities in some cases have devised a cue-off date (usually a date' on which an enumeration of hutments is- carried out) to establish the 'authorized' status of residents of hutrnents, although by their very nature all hutments are unauthorized. Those families who start residing in the hutrnents after this date are said to 'unauthorized'. There is no statutory basis lor such a distinction in the Slum Areas Act. It defines a slum only on the basis of structural and hygienic conditions and makes no reference to the date of its establishment. The n.eed to devise such a cut-off da:e shows the total inadequacy of the Slum Improvement Scheme to deal with the problem. \
4.19 Slum improvement is a temporary measure. The need 'to formulate a perspective plan for slum improvement' or 'to prepare a long-term plan to give security of tenure to slum dwellers':", is often expressed in government documents. These perspective or long-term plans cannot, however, -be prepared in isolation of the overall Town Planning framework. Short of restructuring the' basis of Town Planning which determines the access to urban land and services, no short-term measure is likely to really alleviate the situation of the poor in cities.
The Constraints of "Illegallty'
4.20 The illegal status of hutments creates a number of difficulties and exposes them to various forms of .exploitation. Slumlords often extort money from them under various guises (as rent, contribution for festivals, for obtaining basic services etc.). In large cities where the pressure on accommodation even in hutments is great, substantial sums of money have to be paid in order to "buy" a patch of land or a shanty at certain locations. The poor and less educated feel vulnerable in face of strong arm tactics of various vested interests for grabbing land. The sense of insecurity which surrounds many such unauthorised settlements leads to reluctance on the part of the residents to make significant housing investments.'!
4.21 Hutments generally grow by accretion in a haphazard manner. Newcomers pitch their shelter close to the existing huts. During the initial period of uncertainty the residents are unwilling to spend more than the barest essential minimum on their shelter, and that too on such materials which can be re-used. The unauthorised and unplanned growth leads to overcrowding
----------_. ---------- ._-12 This probably applies to nucca structures. In any case there is no machinery to control such new construction
. work in hutments -. IS Description of Slum Improvement Scheme : Internal Brief for Minister, P. C. Sethi, op cit. 14 See Appendix tor case studies on the process of housing hutments made by a sample of low income families in Poena

------ ---- -------- --------------
.. ~.~
- ....~
70 .. and leaves very little or no possibility of expansion of the existing huts. Even when the owner may wish to carry out improvements and may have a capacity to invest in house extension, he is limited by the non-availability of space. As pointed 'out earlier, there is no provision to decongest
r hutments as part of slum improvement. Therefore, even in 'improved' hutments, excessively high densities continue to prevent' or restrict incremental improvements of shelter.
4.22 The poor are denied legal access to land and the consequent possibility of Housing improvement, by various vested interests for a variety of reasons. There are instances where groups of city residents who are property tax payers have taken the city administration to court in an attempt to stop possible resettlement of hutment dwellers on a piece of public land next to their properties. There are cases where a proposal by the city administration to resettle hutment dwellers on a piece of land earmarked in the City Development Plan for Housing fOr Economically Weaker Sections, is rejected by the Standing Committee of the Corporation. It is suggested in knowledgeable circles that this kind of veto may have been motivated by the desire to protect the interests of landowners in the area. It is also said that it is no accident that a good many hutments are on lands belonging to elected members of the civic bodies and their relatives.
4.23 There is an urgent need to create strong and effective mechanisms to curb such obstruction by vested interest of efforts to house the poor which are procedurally in order. Unless this-is done the poor will continue to be denied access to land and a chance of improving their shelter. .
4.24 The illegality of hutments imposes a severe constraint for obtaining institutional finance for shelter improvement.'! In the absence of a dear title to the land, the channels for obtaining loans formally for house building remain closed. Those in formal employment can obtain loans because of certain facilities that_go with their jobs. They are, however, not necessarily cheap loans and are often available only {or short term and hence require high repayment instalments. In most cases they are not available for house construction but obtained for this purpose under some other head. Even this possibility is not open to those in casual, unsteady employment. A few of them manage to raise small amounts of loans, often interest free, from their employers; some borrow from friends and relations, in some cases at exhorbitant interest ' rates; but most find it extremely difficult to put together a sum of money which can adequately finance significant improvement of shelter.
I r..
The Limits to Improvement , -.
4.25 Although security of tenure is a necessary condition to facilitate substantial investment in housing improvement, it is not a sufficient condition. The amount of investment people can make in housing) is obviously related to their income, assets and access to institutional finance, which -may be conditional on the kind of privileges and facilities that go with their jobs, such as loan against Provident Fund, employees' co-operative societies, employer's guarantee for institotkmalIoans, etc.
4.26 The demands of the materials and techniques used for construction are also a limiting factor. For instance, a hut made from polythene sheets, rush mats, dry twigs, gunny sacks etc.
15 See also H. U .Bijlani "Evaluation of Sites and Services Projects". Planning Commission, Urban Development Task Force Paper 8-2, 1983.
<.",

71
is a minimum shelter. An improvement- on it is a shed built from rough wooden .slats, .recycled tin sheets, brbken or sundried bricks in mud mortar and plaster, asbestos cement sheets, galvanized iron sheets, clay roof tiles and such other materials. A further improvement, however involves the use of cement, bricks, properly fashioned doors and windows, galvanized iron sheets- and clay tiles, all of which-require the use of relatively expensive materials and skilled labour, Each of these levels of constructlon or improvement represents distinct levels of invest
. ment magnitude, which determine who can do what and when. The first level-s-that of the minimum shelter-requires minimal capital investment. The materials used may be free of recycled waste. The major investment in this case is that of labour and time, and subsequently on maintenance and upkeep. At the second level, monetary expenditure on both materials and labour is higher, but that on maintenance and upkeep maybe lower, andthe degree of stability and "permanence" of the structure is of a definitely higher order. The third level represents an essentially pucca structure, which demands, On a per square foot basis, only a marginally lower coot of construction than a "legal" structure. The major savings effected are because building regulations do not have to be strictly adhered to. In terms of capital investment th~ third level represents a .big leap from the second and which only a minority of shanty dwellers are capable of.
4.27 An important point, often overlooked, is that the maznitude of investment in housing that a household can make can be assessed by evaluating the chances of occupational mobility and access to stable employment." The low-income population comprises two non-competing groups. The first is employed in urban modern sector jobs mainly owing to a relatively high social standing, higher level of education and contacts with those in formal employment! who help them in obtaining jobs. The second srouo is effectively barred from modern, urban employment on account of their lower social status and the lack of qualifications and contacts, and are thus condemned to remain in traditional, low-skill. casual and low-paying. occupations. Incidence of upward mobility from urban traditional and casual jobs to modern sector empolymenj is very small.
4.2R If this situation is viewed azainst the levels of constructio-, mentioned earlier, it is clear "hat the big leap to an almost pucca house is possible for some. but the vast majority has no capacity to improve their houses beyond the second level. What is therefore needed is a range of technical measures for improving rudimentarv shelters. The key factor here is simplicity and ease of construction which puts it within the reach (in terms of both economy and skills) of the! r-oor. It Is possible to make innovations in design which make huts adequate shelter but which involve very little additional resource use. Some research has already been undertaken in this field, for instance water-proofing of mud walls which can, at a modest cost, render them free from mai~tena.'nce needs for five years (CBRT). This is. however, supposed to apply in urban areas which often' do not permit such tvne of construction. Such product" are neither easily available, nor is there any effort to disseminate information about them to potential users.
,-----.- -----_._-- --------- ----. 16 OJlIier, P.: "T.ahonr mnl-.ilitv and l:>.hOllr ntilization in developing countries", Oxford Bulletin of
Economic and Statistics, Vol. vt, No.3, 1975. Joshi, Hp"tht~r and Vijay: Surplus Labour and (he Cily-A Study 0/ Bombay, Oxford Univenity Press, Delhi. 1976.· . Bapat, Meera : Shanty TOlV~ and qtl' ,. T!!~ Case; 0/ POOl/a, p..:r£?amon Press, Oxford, 1981;

72
4.29 Starting with such relatively inexpensive means of improving shelter, other technical innovations could include, for the relatively better paid, a range of building components which are easy to assemble and which can be bought and used a few at a: time to suit the individual purse,
The Need for Change f.:I Programme and Policies
4.30 To encourage such technical innovations, however, what needs to be recognized is that self-help housing and sites and services programmes are a viable alternative to the question of shelter for the poor. Lip service is often paid to such programmes. There is, however, no evidence of their having been undertaken on a siznificant scale to make any impact on the
. housing situation, they must .be provided on a large scale and at various locations in a city to offer settlers a~ choice. Batring very few examples (mainly World Bank aided projects), in practice however, only small sites and services schemes, if any, are designed as part of public
"housing programmes." The procedure for 'inviting applications (generally by advertising in local newspapers) is such that it rarely reaches the needy and the schemes can go undersubscribed, It is therefore essential to device channels of communication which can carry the necessary information to the poor, many of whom are illiterate and apprehensive of the system. Unequal access to information can also be disadvantageous in that it leaves the poor and vulnerable open for exploitation 'by those who can USe the information and their knowledge of the system to their own advantage at the cost of the poor or to mak~ them dependent.
4.31 The provsion of sites and services is generally made for the lowest income group (Economically Weaker Sections). To prove their eligibility for the scheme, the applicants have to produce a number of documents--certificates, affidavits, photographs etc. which can be a barrier to many who do no~' have the wherewithal to obtain them. Again, to tie up eligibility for getting a site with income, excludes all those who have higher incomes but which are still too low to enable them to compete in the housing market. Rather than stinulating income as a criterion, what could be more constructive is -a system of incentives and disincentives-in terms of locations, plot sizes, amenities, repayment charges-on the basis of which people can make their own selection of a site from a wide range and substantial number of choices. Further, the procedure for the collection of repayment charzesyrent needs to be flexible enough to make it possible for those on daily wages to pay their dues. They may not. be in a position to plan their outgoings as their income is unstable; a procedure must be creat, ed to allow them payment in instalments.
4.32 The fac:s regarding constraints on resources and the abysmal record of nuhlic housin,!! programmes clearlv demonstrate that the traditional annro-ich to housing, either in terms of broad objectives or its concern with architectural standards is largely irrelevant civen the basic facts of poverty and urban growth. And ye', there is resistance at various levels to alternatives such as -self-help housing. More basic than the attitudinal change. however, is the need to remove the obstacles the poor face in gaining access to land and basic services. This will create cdnditions conducive for them to make investments in housing improvements.
l':Appcndi~ III gives an evaluati~-of Sites ;~d Se~~i;5 Sch~rnes -ac~ordin~ to 'th~-~;pcrienc~f RUnCO:

e.
y..J!:XISTING INNOVATIVE PROGRAMMES IN SH.ELTER AND SLUM IMPROVEMENT
Introduction
5.1 An informal/ad hoc attempt to identify some innovative and succtssful programmes to shelter the urban poor and to improve the conditions of existing slums, in different parts of the country, has resulted in a short list of eight projects which, even if not exactly successful in
. all respects, represent. attempts to confront issues rather squarely (the issues 6f poverty, low income, afford ability, cost recovery, coverage, felt needs and priorities of urban poor,. participation, non-physical needs of slum communities, etc.) and for those reasons appear relevant and show a potential for replication. Tbeyare also 'innovative' at least in one respect. All of them represent a departure from the conventional answer to the slum problem: medium-rise, pucca, heavily subsidized tenements built year after year by the slum clearance boards, municipal authorities and public housing agencies.
Projects
5.2 The selected projects include':
0) The Urban Community Development Projects in general and the Hyderabad Urban Community Development Project in particular
(ii) 'Habitat' housing programme of the Hyderabad Urban Community Development Project .
(iii) Weaker Section Housing and Shelter Improvement Programme of the Vishakhapatnam Urban Community Development Project
(iv) Sulabh International of Patna
(v) Bustee Improvement Programme of Calcutta
(vi) Arumbakkarn Sites and' Services Project of Madras
(vii) Resettlement Colonies Project of Delhi, and
(viii) Slum Rehabilitation Project at Vasna, Ahmedabad.
Similarities and Differcm~es I
. 5.3 These projects differ vastly from each other in philosophy, size, focus, organisation, apnroach, impact and per capita cost. The Urban Community Development Project of Hyderabad, the Resettlement Colonies Project of Delhi and the Bustee Improvement Programme of Calcutta are all meant for the slum dwellers and are bit! in size but differ significantly from each other in focus, approach and operational style. The Hyderabad UCD, spreading over length and breadth of the twin city, covers all slum pockets (over half a million people), is multi- ,r,j'
sectoral in natural in response to peoples' felt needs, is highly participatory; shelter component is relatively small and is becoming a model for the entire .countrv to follow on account of its extensive coverage and positive impact. Delhi's Resettlement Colonies Project has covered almost a million people, is mainly shelter focussed, bas not bothered to involve people and due
.1 (i) (ii) (iii) (iv) (v) and (viii) are described in grt'ater detail in Appendix I.
73

"C Jc1m .~ !:'~~i
.;
74 to its implementation style-forced evictions-has become quite controversial. Calcutta'g Bustee Improvement Programm- has covered over 2 million people, focuses primarily on in-situ environmental improvement, user participation is almost non-existent and is now also trying to meet the Bustee dwellers non-physi::al-n\rtritional, educational, health and income-i-needs; Between Madras' Arumbakkam Sites and Services Project and Ahmedabad's Vasna Slum Rehabilitation Project there are many similarities (Vasna : 2250 families; cost Rs. 1.10 crores; new site 7 kms from the' city centre and loan .recovery instalment Rs. 20 per month. Arumbakkam: 2200 families; cost Rs, 1.84 crore: rese.tlernenr site 7 ·kms from the city centre and loan recovery instalment for the lowest category of occupant Rs. 22 per month). There are also significant differences (In Vasna, the planning and implementation responsibili:ty was primarily with a voluntary agency; in Arumbakkam, it is a formidable combination of the World Bank, MMDA and the Tamil Nadu Housing Board. In Vasna, the houses were built by an external agency. In Arumbakkam, the agency's involvement is mainly in laying the services and preparing a frame-work for house construction. In Vasna there is substantial subsidy. In Arumbakkam, 100 per cent cost recovery is aimed at. In Arumbakkam, the services and facilities have been provided as planned. Vasna, in that respect, has lagged far behind. The loan repayment performance at Arumbakkam is renorted to be good, while at Vasna it is dismal). . Though Calcutta, Madras, Hyderabad (Habitat), 'Delhi, Ahmedabad and Vishakhapatnam are all primarily 'shelter' projects, there is a great variation between them in approach and performance. The Calcutta Bustee Improvement Programme concerns itself with improvement in the quality of and access to environmental and social services but refrains from. touching the super-structure (thereby avoiding such difficult issues as land title and tenure). In Arumbakkam, it is an incremental shelter (sanitary core, wall and roof unit etc.) where as in Vasna a fully built house is provided. In Hyderabad and Vishakhapatnam though houses are owner built (as against agency or contractor built) they are pucca and conventional, Sulabh International is neither a government organization nor strictly a voluntary agency (more or less a 'commercial' organisation) and its focus is neither shelter nor slams It is low 'Cost, easy to maintain; affordable and' replicable sanitation technology. Despite variations, differences and even contrasting styles these projects represent new ideas, new approaches, new attitudes, new organisational styles and therefore. a new hope for the seemingly intractable problem of sheltering the urban poor and improving the living environment in city slums.
Special features 0_- _ .. ," .--;-~-~:~~.,.
A wider definition Of slum problem: concern for human development
5.4 Some of the above listed efforts reflect in their (project) design a much wider and deeper understanding of the slum problem-not only a problem of environmental degradation and physical denrivation to be solved by constructing pucca houses but a more complex socioeconomic, political, cultural and human problem to be solved through a range of responses: education and awareness to motivate the individual: comrnunitv organisation and mobilization to promote collective and cooperative !Troup action and planned intervention for income supplementation and creating conditions for sustainable chance. The Hyderabad UCD dwells heavily on 'human development through participation.' The Vasna project at Ahmedabad started by saying that "slums are people not places" and trled a "comnrehensive approach incorporating social, economic, educational and motivational inputs, alonzwith housinz" so that "an alternative value svs'em mavemerge and far reachinz attitudinal and behavioural changes mav take place." In 'Habitat'. 'Hvderabad and the Weaker S~ction Housinz at Vishakhapatnam the' house i<; 'nnlv an entry point' and the particioatorv wnv of constrnctinz a house is only a "means of bringing out peoples' internal creativity". 'People, not the physical environment, appears to be the new focus in some of the selected projects.

Shelter ior the Poor : Attitudinal and Strategic Changes
5.5 All the 'shelter' projects listed here show a significant change m the attitude towards ~he slum problem and a new strategy to housing the urban poor. These changes include :
-- A major shift in attitude towards people (Not an unproductive burden but a productive resource)
'>,- A new interpretation of and approach to peoples' self initiated housing actions and self generated housing stock (Even if deficient, approaches to a solution not a Nob/em. Not to he demolished but to be conserved and improved)
A new definition of a house (Not necessarily pucca or permanent, status symbol but one that shelters adequately)
A redefinition of the- housing task (Not necessarily permanent buildings but liveable j environment)
A new role for the traditional housing agencies (Not doers but facilitators. Not builders but promotors)
A new relationship between housing agencies and .jhe clients (Not donors and receivers but partners)
A new economics (Not charity but investment)
A new definition of scale (Not symbolic gestures but full coverage), and
Fer some, a new vision (Not houses alone- bu, overall development)
Rejection of Multi-storey Tenements
5.6 Interestingly; in none of the above shelter category projects medium-rise, contractor built and puc<::a tenements, so much in vogue during the '50s and '60; have been constructed. In Vasna, the Houses are agency built, conventional and pucca but they are only ground storey, high density structures grouped around a central open courtyard. In Hyderabad and Vishakapatnam the new houses are pucca but mostly ground floor structures and self built. In Arumbakkam, the houses are incremental in 'nature. Only a part of the house is built by the external agency. In the Bustee Improvement· Programme, Calcutta, the effort is concentrated on improving the environmental services and community facilities, the shelter is not even touched.
Loree Scale
5.7 Unlike earlier years when the; efforts were mostly sporadic and symbolic (a few hundred! pucca tenements per year in a city where thousands of families lived in slums), MOW some of these projects are attempting a much wider canvass. UCD Hyderabad covers more than 80 per cent of Hyderabad's half a million slum dwellers. Under the Bustee Improvement Programme of Calcutta around two million slum d•...,ellers, in about 2C<>0 locations, have been covered. And in Delhi's Resettlement Colonies, almost a million slum dwellers have been rehoused, in a relatively short period of time.
Low Cost
5.8 A characteristic common to all the eight projects and the ODe that makes them affordable and 'replicable is their low cost. The organisational coot of reaching out to around 4 lakh slum dwellers spread over 450 pockets in the twin city of Hyderabadand Secunderabad and initiating, coordinating and monitoring more than 160 welfareIdevelopment activities for them is less than Rs. 7.0 lakh per year (Rs. 1.75 per 'person per year or paise 15 per person per month). Per, capita cost of providing lenvironmental services and community facilities in Calcutta's' Bustee Improvement Programme was Rs, 150 in the initial years and now it is estimated to be Rs, 280. In, Arumbakkam Sites and Services Project a slum household in Rs. 150-350 income group is required to pay an initial deposit of Rs, 200 and monthly instalment of Rs. 22

only (for 20 years) for a 40 sq. mt. plot. .In Vasna, Ahmedabad (1975-76) construction cost of a reasonably well built house (brick walls in cement mortar, precast purlins, asbestos roof) was only Rs, 10.75 sq. ft. Sulabh International's twin pit,. bucket flush latrine is much less expensive compared to a capital intensive and wastage prone water borne sewerage system. Pucca and conventional houses built under the Habitat project in Hyderabad and uhe Weaker Section Housing Project in Vishakhapatnam cost between Rs. 5000 to 8000 only (though they are not the cheapest available structures in that caategory/ quality of houses),
Need-based Solutions and Multi-sectoral Involvement
5.9 Some of these projects are trying to go beyond meeting physical. needs of the slum dwellers like building houses or improving the residential environment. This is a major departure from-the earlier practice of confining involvement to construction of houses alone (an on-going practice with many a slum clearance board even today). The Arumbakkam Sites and Services Project, besides providing home-sites, environmental services and community amenities, has an income supplementation component and a special service programme for mothers and children. Calcutta's Bustee Improvement Programme has an ambitious health component and a well-conceived scheme for supplementing income. In Hyderabad the : housing activity started much later while the educational, motivational and welfare work were going on since -its early beginning. The Vasna Project, from its very inception was conceived as an integrated effort and besides housing included community organisation, leadership training, income supplementation, non-formal education. and 0 t her community development activities.
5.10 This multi-faceted approach and multi-sectoral involvement is in recognition of the fad that construction of a house or even improvement in the quality and availability of environmental services does not necessarily lead to improvement in the 'quality of life of slum dwellers. Unless people earn more, unless they get organised' to maintain their houses and services and until these improvements are supplemented by preventive and curative health care, education and other inputs there could not be a perceptible change in their lives.
Attitudinal .Changes
5.1 ~ Most of these pr-ojects signify an attitudinal change towards th~ people and the problem. Some of them are based on the understanding that the people are an asset', not
.a burden and that their initiative and energy should be utilized in solving problems. The guiding principle in the Bustee Improvement Programme of Calcutta is that the Bustee huts are not an eye-sore deserving demolition but a component of housing stock, however deficient, that should be preserved and improved. In Vasna, the theme is "slums are people, not places" 'and, therefore, 1Jhe effort is geared towards human and community development through participation. and involvement. The stated objectives of the Hyderabad uen are "creating a sense of social coherence on a neighbourhood basis, developing a sense of belonging to the urban community, bringing about a change in attitude by creating civic consciousness, developing local initiative, etc". This new attitude to the housing task means accepting peoples informal housing activities as ·legi;timate starting points of a problem solving process. And the riew attitude to the people means taking people as a creative resource capable of solving their own problems.
,. •. J ,.Participation : 'f'P"' .-r' !'1i!f'H ~ ..~. ~_·;·1~·!~··r:J I
5.12 User involvement at various stages of decision making, resource mobilization and project implementation and in different roles of builder, helper .or organiser is an important feature (,'I some of the identified projects.. The Arumbakkam Sites and Services project, recog
/

77 nizing p:oples' building skills, provides only a serviced plot with a sanitary block or a skeleton house With ,~o walls and a roof. The completion of the structure is left to the individual's nuua.ive and ,skill. In this case the external agency makes that beginn1ng and expects people to follo~ on their own. In the Calcutta Bustee Improvement Programme the external agency enters the 6ce~e much after the people have acted in building their huts. In Vasna, the people played a promment role in evolving the house design and' the lay-out plan and asecrtained their choice in selecting neighbours. In Habitat Hyderabad, more than 5000 pucca, conventional houses .h~:e been built by people themselves without an external agency taking _construction responsibillty or a contractor working as middleman. The UCD Hyderabad rests on the assumption and works on the principle that even disadvantaged groups, when motivated and organised, can work for their 'betterment. The participatory way of 'Working has brought many changes and advantages in these projects. Some of these include : reduction in construction cost, greater user satisfaction, wider coverage, improvement in the maintenance and debt servicing performance, greater initiative, awareness and cooperation among the community members etc.
Organisational Innovations:
5.13 The age-ncies in charge of the Habitat-Hyderabad and the Weaker Section Housing in Vishakhapatnam are not the conventional "housing' agencies (which are usually manned by engineers, surveyors and architects who deal almost exclusively with construction techniques, contractors and building materials) hut. the community development organisations (staffed mainly by social workers rand community organisers with skills and faith in motivating people and activising communities but mostly ignorant about rechnical and engineering matters). As projects have grown in size,. number and complexity the design, engineering and technical wings have been strengthened but they still play a supportive, services provider-role, compared to the Community Development Organisations who remain the principal motivating force. This arrangement, interestingly, has accounted for a fresher approach and many innovations. In Hyderabad and Vishakhapatnam the 'non-technical' people are defining the problem afresh, viewing housing in the context of other needs of the poor, insisting on people's participation and attempting to use the house building process as an opportunity to organise people for self development.
5.14 Whereas in Hyderabad the non-housing agencies are moulding a new housing strategy, in Madras, a new housing strategy (in-situ improvement of slums and Sites and Services). has necessitated a new organisation or substantial changes in the existing one. While implementing the Arumbakkam Sites and Services Project (through the Tamil Nadu Housing Board) and the Slum Improvement Projects (through the Tamil Nadu Slum Clearance Board) the MMDA realised a need for and created a Community Development Cell to help establish a rapport with the potential users and to seek their active cooperation. Prior to these' projects none of these organisations had social workers of community organisers on their staff. Similarly, the Calcutta Metropolitan Development Authority, which is carrying out a massive improvement programme in the Bustees of Calcutta for the last ten years but has neither developed a community development wing within the organisation or sought assistance of any other agency with required orientation and skill-and subsequently has failed to involve bustee dewellers in any of its activities-is now keen to rectify the error and an effort is being made to organise a community development wing and recruit appropriate personnel for the job,
5.15 Another important development, with regard to organisational innovation, is tha involvement and increased participation of non-governmental voluntary agencies in the shelter and other development activities meant for the urban poor. In Madras, the Madras Metropolitan Development Authoritymade a specific effort to invite and involve voluntary agencies in playing specific roles and undertaking specific responsibilities in implementing, sites and services
19 W.H.-14 Y

and slum improvement projects in various' parts of the city. In Hyderabad and ViShkbapatnam, not only .the external voluntary agencies but organised groups ,of localresidents are also playing an important role in delivering various community services. In Calcutta, CMDA .and UNICEF are evolving a programme of service delivery through voluntary agencies and community groups; And in Patna, a non-governmental agency called Sulabh Interna.ional is Involved in research, development and extension work on low cost 'sanitation technology, Though some of these roles are secondary and supportive in nature (delivery of services planned and designed by others), there are examples of voluntary agencies playing crucial, primary roles. Sulabh International's work in low cost sanitation technology in Patna and elsewhere, and Ahmedabad Study Action Group's role in the Integrated Urban Development Project in. VasnaAhmedabad, are' cases in point. In the Slum' Rehabilitation Project at Vasna, ASAG played a crucial role in project conceptualisation, formulation, design, resource mobilization, construction, pre-shifting and post-settlement community work and delivery of basic social services. In a project involving construction of a new settlement for 2250 flood hit slum households, which was funded jointly by the Government of Gujarat. Ahmedabad Municipal, Corporation, RunCO and OXFAM, ASAG, a non-profit public charitable trust run by a multi-disciplinary team of professionals advocated the cause of the flood victim slum dwellers, played a critical role in bringing various agencies -together and mobilize funds, provided architectural and engineering services for housing and community buildings, undertook construction responsibility, coordinated working of various partner agencies, conducted socio-economic studies of the target community, organised allotment, took initiative in -organising educartiorial and health facilities, started income supplementation activites for women, ran an innovative programme to 'foster creativity in children, organised leadership training and started many other welfare and development activities for the resettled people.
5.16 Involvement of a voluntary agency in the Vasna Resettlement Project changed its character, content and performance. First, ASAG's advocacy role brought many agencies together and gave birth to the project. Second, its involvement and human development .bias prevented it, from becoming yet another 'housing' project. Third, due to ASAG's insistence and approach' the occupants could play a role in project design and implementation. Fourth, saving in the construction cost was of the order of 30 per cent compared ,to 'any agency built housing project at that time. And fifth, many experiments in delivery of social services became possible. The entreprenurial ability, aggressive salesmanship and, a special organisational structurewhich besides ensuring the benefits of a registered society also permits Sulabh International to .work almost as a contractor-are important factors not only for the financial success of Sulabh International but also its enormous spread (what started as a small activity in Patna ten' years ago has now become a state-wide programme in Bihar, Orissa, West Bengal and other places. Sri Lanka and Afghanistan are also experimenting with Sulabh technology). It is conceivable that had Sulabh International restricted its role to motivating, training and demonstration only (as Safai Vidalaya of Ahmedabad has done) and not started providing turn-key services for installation and maintenance of low cost sanitation units, Sulabh International -may not have spread as fast and wide as it has. Sulabh's willingness to play j, tum-key contractor's role has helped many a safety seeking organisation to adopt the new technology.
Cost Recovery
5.17 When Madras city which had started making virtue (and political capital) out of its highly subsidized tenement housing schemes for the slum dwellers changed its course and took up the sites and services and slum improvement schemes On a 100 per cent cost recovery basis, it, was a significant development for Glum improvement work in India as slum housing and subsidy, for a long time, had become inseparable. In Arumbakkam, insistence on cost recovery has not necessarily deprived the poor of access to developed plots as 50 per cent of the plots have been

79
sold only at Rs. 1.0 per sq. mt. through a cross subsidy method (differential pricing of marketable land). In Calcutta, cost recovery is indirect where the investment is sought to be recovered by bringing into the tax net the improved bustees (property tax and service maintenance charges). In Hyderabad and Vis'hakhapatnam housing projects, though the land and the services are subsidized, at least the cost of the super-structure is recovered (and the loan recovery performance is astonishingly good) even though instalments are relatively high (Rs, 45 to 50 per month).
5.18 The cost recovery aspect of the Arumbakkam Sites and Services Project, Hyderabad and Vishakhapatnam Housing activities and Calcutta Bustee Improvement Programme needs to 'be studied rather carefully as it holds the key to attracting further investment in this work. The Hyderabad experience, in particular, is of great significance because while a personalised approach and participatory way of working seems to reflect positively on the borrowers' accounta
.bility, the strain of subsidy---on land, infrastructure services, community amenities and organizational services-is beginning to weigh adversely on project extension and replication potential. '
Land Issues
5.19 The land issue is critical to effectively handling the slum problem. Experience in many places has shown tharsecure land tenure is an 'enabling' condition and motivates residents to invest their energy 'and resources in improving their shelter and environment. The Hyderabad project has proved this effectively. Out of 13000 slum households, who were granted! pattas, over half !have 'Created a permanent asset in the form of pucca houses. While in Hyderabad the pattas are offered in the declared slums, in Vishakhapatnam, vacant government and private land is acquired to be given to slum dwellers free of cost. In Vasna, the land was provided free of cost! by the State Government. Calcutta's Bustee situation being more complex, the CMDA has avoided getting into the title or ownership issue altogether, At Arumbakkam, the land is sold at asubsidized rate to the poor through a cross-subsidy method. In the case of Delhi resettlement colonies security of tenure has not been granted yet and lana is still being held in a licence basis. Habitat, Hyderabad; Weaker Section Housing Vizag.; the Arumbakkum Project, Madras; the Vasna Project, Ahmedabad and the Resettlement Colonies Project, Delhi
. have all tried to tackle the land issue in different ways but, except for Arumbakkam, other approaches and solutions, even if they may have worked in a particular situation appear questionable and doubtful inthe long run. In Hyderabad, despite some remarkably positive gains, distribution has not moved smoothly after the first 13000 pattas were dlstrfbuted. In Vizag, the Municipal Cornoration is already feeling the strain of the heavy burden of land acquisition cost. Vasna, Ahmedabad is the lone example in Gujarat (providing free land for slum rehabilitation) and in the last seven years no other project' on: similar lines has developed. In Resettlement colonies of Delhi there is a resentment that despite promises, land titles have not been transferred to the allottees.
Inirastructural Services and Community Facilities
5.20 Provision of infrastructural services of reasonable quality and adequate civic amenities is a distinguishing feature of Hyderabad. Vtshakhapernam, Vasna, Arumbakkam and Calcutta projects. In case of Hyderabad, Vis1hakhapatnam and Vasna all the services and facilities are fullv subsidized by the Municipal Corporation. In case of Calcutta, the users are expected to pay 'service maintenance charges an.d the capital cost is planned to be rec?vered. ~~om ~he property taxes .and betterment charges. In .Arumbakkam, cost on commumty facilities like primary schools, clinics and community halls i5.to be realised by transferring assets to appropriate agencies and the CO$t of Infrastructural services is to be recovered from sale of developed
plots.

80
General Recommendations
. 5.21 These eight projects and programmes put togetber have all the ingredients of aeuccussful strategy to improve conditions of living in slums. of Indian cities and provide affordable shelter to urban poor. .They inciude methods to reduce cost, ways to involve people, rimder existing organisations and institutions . more effective, and make programmes and projects need-based and relevant.
. 5.22 If one were to pick up the distinguishing features from each of the eight discussed projects, a formula' to effectively handle the slum problem would emerge. The salientpoints of that formula will be as follows: .,
1. Provide secure land tenure'. If an overall policy is not possible, do so from project' to project, on area to area basis.
2. Concentrate on activities like the Urban Community Development wbich embrace' various aspects of slum dwellers' needs and problems, and encourage community involvement in finding solutions.
3. Adopt low cost solutions like in-situ environmental improvement, and sites and services. Avoid, as far as possible, construction of expensive formal houses.
4. Insist on C08lt recovery,
5. Involve people.
6. Design multi-sectoral projects. Incorporate health care and income supplementing activity along with physical improvements.
7. 'Restructure & re-orient existing institutions and agencies:
-those involved in programme planning, designing, financing and implementing projects.
8. Organise shelter upgrading activity through material 'banks and institutional credit for repair.
9. Actively encourage and facilitate voluntary agencies' and community groups" in:volvement in planning and implementing projects and running activities.
10. Avoid symbolic gestures. Undertake projectslactivities affecting sizeable numbers.
1r. Encourage and adopt appropriate, low cost technologies.
12. Aim at overall development. Use opportunities and inputs as means of strengthening people rather than mere provision of services.

APPENDIX I
CASE STUnmS OF INNOVATIVE PROGRAMMES
1. Urban Community Development Project, Hyderabad
2. Weaker Section Housing, Vishakhapatnam 3. TJle Bustee Improvement Programme, Calcutta
4. Sutabb Shaucbalaya, Bihar
5. rllJJe SJum Rehabilitation Project at Vasu8, Ahmedabad.
--::=============================~

1.' URBAN COMMUNITY DEVELOPMENT PROJECT, HYDERABADI
Descriptive Information
. 1. The first experiment in Urban Community Development was initiated in 1958 in Delhi with a Ford Foundation grant. The methodology of community development, already current in rural India .since the early fifties was thought relevant to urban areas as well and the first series of Urban Community Development Projects were started in Ahmedabad (1962), Baroda (1965) and Calcutta (1966)...
2. The earlier projects were carefully observed by the Government of India and based on these experiments a Rural-Urban Relationship Committee was set up to detail the planning of Urban Community Development Projects on a nation-wide scale and to examine role of the ·municipalities in implementing such projects.
3. The Committee reported that there was a lack of awareness among people that the municipality was there to serve. their needs. The Report suggested a need for constant discussion of local problems and needs so as to help people verbalize their felt needs, to motivate change and encourage people to exercise their own initiative in planning and carrying out improvement projects. Technical and we]('are resources would then ~e directed to the people to assist them in meeting their felt needs.
4. On the recommendations of this Committee, during the last year of the Third Plan (1966), the Got ernment of India initiated the Urban Community Development programme on an experimental basis, Originally planned for forty cities, pilot projects were finally taken up in fourteen cities. State Governments were not enthusiastic in supporting this experiment and subsequently seven: of the original fourteen projects closed down. Of the remaining seven projects, Hyderabad is one of the few cities with a continuous history of successful implementation and expansion of the urban community development programme.
5. Hyderabad is the fifth largest city in India, after Calcutta, Bombay, Delhi and Madras. In 1981, the population of the city was estimated at 2· 2 million. About 23% of the population i.e. approximately 500,000 people live in slums.
6. Hyderabad and the adjoining city of Secunderabad were combined into a single administrative.unit under the Municipal Corporation of Hyderabad. The city has one of the largest Muslim populations of any city in India. Muslims who constitute llper cent of India's population, form 38 per cent of the population of Hyderabad. In the older part of the city, where the Urban Community Development Project was first started, Muslims constitute 71 per cent of the population. This is of special significance for any programme involving women, because, in India, Muslim women are more home-bound than women of other communities; their partcipation in the work force ar d even in community activities outside the home is very low.
7. This has important implications for mobilizing women for participating in community activities and even for organizing income-generating activities, which would preferably have to be home-based, rather than in alocation away from home. Under these circumstances living in a proper house rather than an impermanent shanty, becomes doubly significant.
8. The Hyderabad Project like the other pilot projects was designed to cover a population of 50,000 people divided into eight "neighbourhoods" for implementation purposes. The staffing patern provided for a Project Officer and eight Community Organizers who would be supported by voluntary workers selected from the local communities.
9. The Hyderabad UCD Project was designed to cover the total population within the project area. Though some of the activities of the project were directed to middle or lower-middle income groups, the main focus of project activities is on slums and the poorest areas.
"This section describes the Hyderabad Urban Community Development Project including its "Habitat" component.

84 to. From 1967 to 1976 the ueD programme expanded from one project area covering appro
ximately 4000 shim population to three project areas covering approximately 60000 slum population. In 1981, the programme consisted of nine project areas covering a slum population of over 4· 0 lakh living in 459 slums. There are at present 470 slums in the twin city as compared to 300 in 1976 and 94 in 1967. The remaining eleven slums have not been covered because the land on which they are situated is either under dispute or has been earmarked for some other purpose by the Hyderabad Urban Development Authority.
11. At the start of the project (1967), the Hyderabad UCD covered 4% of the total slum population of the city. In .1976 coverage increased to 20% (3·0 lakh people) and in 1981,80% (5'0 lakh people) of the slum population.'
12. The All-India pattern of activities evolved for UCD projects suggested a list of possible activities but the Hyderabad UCD staff was given scope to develop' activities according to the felt needs of the people and were given a mandate to cover activities not normally covered by a Municipal Corporation: running nursery schools, organizing adult education classes, eye camps, vocational training programme etc. Whereas the suggested list of activities adds upto 50,. the list of activities variously implemented in different locations within the project area in Hyderabad add upto 160.
13. The above 160 activities are categorised under five main headings and show a specific bias towards involving people :
(a) Child Welfare activities Pre-school classes, immunization, balwadis, mid-day meal centres, medical check-up, creche, etc.
(b) Women's Welfare activities Mahila Mandal, income generation activities, etc.
(c) Youth Welfare activities Typewriting classes, youth rallies, matric coaching classes, auto-rickshaw driving, gymnasiums, playground, youth clubs, civil defence.
(d) Housing Home improvements, clean-house competition, patta distribution, Habitat, Brick manufacturing units, etc.
(e) Other activities (for the .community as a whole) : dispensanes, exhibition, study tours, Basti Committees, Cooperatives, filmshows, anti-mosquitos drive etc.
14. None of the above activities is a single-purpose activity:
-Setting up Basti (slum neighbourhood) Welfare Committeesand Mahila Mandals (women's organisations) are ways ofworking with communities through their own community members -they are the means for promoting self-help.
-Study tours, exhibitions, film shows are not only ways of expanding the horizons of those participating, but are also means of drawing the community together-of fostering a "we" feeling.
-Improving physical amenities is not only for improving people's living conditions; it is a way ofcalling on community co-operation. Housing is not just a family affair; the whole

86
2. WEAKER SECTION HOUSING: VISHAKHApATNAM
Descriptive Infor-matfon
21. The Vishakhapatnam Urban Community Development Project, started in 1979, is a text book replication ofthe Hyderabad UCD Project. The broad pattern ofthe Project is the same as the Hyderabad UCD. 31,200 households comprising of 1. 52lakh people live in 168 slum pockets. The Ratio ofslum population to total population in 1980 was 25 %. Due to rapid urbanisation and industrialisation, increased port activity and the university, the population is growing very fast (Decennial growth rate for the decade 61-71 was 7·21 %). Slums are also multiplying fast. The proposed steel plant on the city boundary is likely to aggravate the situation still further (under Indo-Soviet .collaboration over Rs. 3000 crores will be invested in the next three years. 50,000 direct and 200,000 indirect jobs are expected to be created).
22. Under the Environmental Improvement Scheme in Slums, physical amenities (drainage, pavements, roads, street lights, water, latrines, bathrooms, etc.) at a cost ofRs. 1.32 crore were provided during 75"81. The Weaker Section Housing Scheme was started by the Urban Community Development Project which commenced in 1979. Till now 3000 houses funded by HUDCO and 693 houses funded by banks have been completed. Work on the HUDCO financed scheme of 1400 EWS houses (at Kobbarithota) has started recently and proposals for 2000 more houses are being processed by the State Government and HUDCO.
23. The general pattern for organising the shelter activity is as follows: A land plot (either in the existing slum or at a new location) is provided free of cost by the Municipality. The Environmental services (water, sewerage, drainage, roads, street lights) and a community hall are also provided free of cost. Loan for construction of the house is secured from a bank or HUDCO. UCD staff members conduct surveys, assess the situation, prepare project reports for approval of the concerned department and submission to funding agencies and organise communities for construction work. People build their own house (pucca with RCC roofand costing between Rs. 6500 to 8000).
24. Under its Shelter Improvement Scheme the UCD has helped 428 households improve their shelter-mostly replacement of thatched roof by mangalore tiles, installation ofwindows for ventilation, and addition in roofheight. UNICEF is providing a subsidy ofRs. 1000 perunit Which is given in the form of tiles and wooden columns and beams. Repairs and improvement ate dene by people themselves. They are also bringing additional finance, if required. .
25. The Shelter Improvement Scheme has been well received and the selected slum households have used the opportunity to improve their houses considerably. Encouraged by the success of demonstrative action the Scheme has now been incorporated as a Lead Bank Scheme in the District Credit Plan for 1983-85. It envisages assistance to 1000 households upto an expenditure of Rs. 2500 per unit.
Observations
26. The Weaker Section Housing Programme being implemented by the Vishakhapatnam Urban Community Development Project is in many ways a remarkable effort. For an agency working within the municipal set up, the dynamism and flexibility are noteworthy. For a new agency (only three years old) VUCD has covered a vast ground. In different schemes different solutions are attempted. Four types ofschemes are going on simultaneously: (i) new houses on new sites (ii) new houses in existing slum pockets (iii) two or three storeyed houses in existing slums and (iv) shelter improvement. These schemes are different in nature, each posing a special challenge and requiring a special response. Despite the limited experience and inadequate organisational set up, the scale of operation is also impressive.
27. The most important aspect of the programme, however, is the manner of its· execution. The house-owner is doing most of the work, not the building contractor. Interestingly, people are building pucca houses (with R.C.C. slab, plastered walls and operable windows unlike kutcha houses built in most s elf-help housing schemes). In the process, people are learning to work collectively and picking up new construction skills. A few of them have started new business activities using the newly acquired skills and materials. Compared to a contractor built house, the self-help house is less expensive. Though there is a definite scope for improvement in the design of houses and site-layout and

81
a great potential to further strengthen the Shelter Improvement Scheme, it is recognised that new houses .are generally elegant and the improved shelters are a great change over their previous huts.
28. On account ofthe generous investment made by the Municipal Corporation in laying services the quality ofoverall environment in new settlements is generally good. Roads are wide and well built: Drains, though open, are clean. Street lights are appropriately spaced and work. Open spaces are vast and the general standard of cleanliness is good. The quality of servises provided by the Vishakhapatnam Municipal Corporation is noteworthy in comparison to such other projects where standard of services is generally poor and overall environment gloomy.
29. Shelter Improvement Programme, though in its early stages, also looks quite impressive. Investment is small (only Rs. 1000 from UCD). But the small amount is making a good impact. People are making significant changes in their houses. In the Muslim Tatachetalapalam area, for instance, some families have done a remarkable jobofimproving their houses.
30. Three important decisions are responsible for these developments. First, the Andhra Pradesh Government's decision to provide secure land tenure (patta) to the slum households and in case of new sites, virtually free land, are giving a much needed incentive to the people to invest in building houses and improving their environment. The Vishakhapatnam Municipality's decision to provide basic services and community facilities free of cost is the second helpful decision. And the community organisation and liaison work done by the Vishakhapatnam Urban Commun:ity Development Project staff is helping people to playa useful role in constructing houses.
31. For various reasons the design department of the VUCD is rather weak and needs strengthening. A designer or two with appropriate orientation, skill and experience would be a great help. It is possible to improve present designs (in terms of space allocation and utilization, cost reduction, circulation efficiency, arrangement of services, choice of materials and also the aesthetics). It is possible to evolve many more alternative designs to suit different people"s requirement, style and economic conditions. Though the house owners playa crucial role in construction, in evolving house plans or lay-out they contribute practically no ideas. It should be possible to work-out a participatory design process in which the house owners could also contribute ideas and suggestions. The layouts, in particular, need attention. There is an obvious scope for cost reduction. For instance all new houses are built as duplexes. If a row housing concept is adopted more walls could be shared, higher density could be attained and cost of laying infrastructural services could be reduced.
32. Compared to a private contractor provided or public housing agency built structures, the houses built under this programme are less expensive. .But they are not necessarily cheap or low cost. For instance, cost of a house unit (measuring 205 sq. ft.) in Adarshanagar, in 1979-80, was Rs. 7200. If'Rs, 1400 given as subsidy by the Vishakhapatnam Municipal Corporation for latrine and bath room is added, the cost comes to Rs. 8600. This worked out to Rs. 42 per sq. ft. (in 1979-80, now the same would be Rs. 70 per sq. ft.) excluding the cost of land, infrastructural services and professional services of the designer, engineer and community workers ofUCD. For most of the poor both the amount of money and rate of construction are quite high although a comparison may be invalid as specifications are different and conditions available in Vishakhapatnam and Ahmedabad are not the same, it is instructive to know that the cost of construction at Vasna (1974-75) was Rs. 11.25 (sq. ft.) Bu.ilt up area, selection of materials, design and the construction method are mainly responsible for the cost of a structure. If the slum-household are offered alternative designs, structural components, building specifications and details and explained their cost implication, they may possibly opt for a less expen- . sive solution.
33. For an agency which will build around 8000 houses in four or five years (direct investment of Rs. 7· 0 crores), using participatory work methods, the organisational machinery at the disposal of VUCD seems quite inadequate, particularly on the technical side. Whereas under the Hyderabad UCD Director a full-fledged Technical Team consisting of an Assistant Engineer, 12 Supervisors, and Assistant City Planner, 4 Town Planning Assistants and 12 Draftsmen-cum-Surveyors is available" all that UCD Vishakhapatnam has is one Assistant Engineer. Though technically speaking the Town Planning and the Engineering Wings of the Vishakhapatnam Municipal Corporation are expected to provide assistance and occasionally services of planners/designers from the Vishakhapatnam Urban Development Authority is supposed to be available on demand, in practice not much timely help seems to be forthcoming. The Assistant Engineer is overworked and though technically qualified for

88
supervisory functions, he lacks skill and experience in the areas of design and participation. Nonavailability of technical services due to inadequate staff is affecting the performance adversely.
34. The organisational inadequacy reflects on the house design, layout plans, and even technical drawings. It also reflects on material management, cost control and other supports people require, The entire programme looks severely handicapped on account of an inadequate organisational setup.
35. In terms of people's participation, although, what is being done is note worthy, innovative and useful, there certainly is need to widen scope of people's involvement. In a participatory housing programme the house-builders could play various roles depending on the manner in which 'participation' is arranged and sought. They can help in selecting site, evolving design, procure and protect building materials, supervise construction, provide skilled-unskilled labour, maintenance of services, management of estate etc. etc. It is clear that participation in this programme at this stage is limited to a few selected tasks and areas. There is both the need and possibility to involve people more in many additional ways. The new areas of involvement, operational modalities, cost benefits (both in material and non-material terms) and nature of the organisation set up for the purpose need to be examined.
36. Though the Shelter Improvement Scheme is well received and is showing positive results. ten case studies in two locations (Godarigotalu and Muslim Tatachetlapalam) suggest a need for : some organisational rearrangements and additional interventions to secure financial assistance. I:iJ. these tW9 places though the poor have responded to the scheme with great enthusiasm and improved their huts impressively there are two developments that cause concern. First, as subsidy of Rs. 1000 provided by the VUCD is not sufficient to renovate or repair the house fully, the. households involved in improving their shelter are required to borrow money from other sources. These borrowings range from Rs. 3000 to 18000 and are costing people a yearly interest of 30 % to 72 %. Mohammed Yu suf of Muslim Tatachetlapalam, aged 58, and father of 4 sons and 4 daughters, was found to have borrowed Rs. 18000 and is paying Rs. 1050 per month only as interest. He has mortgaged his wife's ornaments and is not quite sure as to how will he repay the amount. .
Second, though the people are doing a satisfactory job of improving their shelter, a little technical assistance here and there could help them save quite some money or make space divisions a lot more efficient and functional. (The case studies revealed some wasteful use of imported cement, wasteful/inefficient space divisions and poor detailing, all of which are easy to prevent/improve.)
37. At this stage the UCD project provides only the building materials worth Rs. 1000. But if people are getting so heavily indebted and exploited, some alternative ways could be found to get the extra money. Perhaps a bank could be involved, and a community revolving fund could be set up; or a risk guarantee fund could be set up. The project should arrange for the technical services of an experienced person who could help prepare a rough blueprint of changes to be made, werkout budget estimates and advise people on the use, price and availability of building materials. A way should be found to buy discarded, second-hand materials as done by Freedom to Build in Manila.
38. In the UCD Vishakhapatnam sponsored shelter activities thereis a scope for and need to :
improve/modify designs
reduce cost
evolve alternative layouts to correspond with people's life style, achieve higher density, reduce infrastructure development cost and promote new aesthetics.
suggest use of alternative building materials
employ alternative construction techniques
solicit greater involvement of people
strengthen organisational set-up for design, planning and execution
introduce new technical inputs and establish new linkages with financial institutions (in . Shelter Improvement Activities)
organise an efficient system of cost monitoring and performance evaluation.

89
3. THE BUSTEE IMPROVEMENT PROGRAMME, CALCUTTA
Calcutta Metropolitan District-The Bustee Scene
39. Calcutta Metropolitan District (CMD) covering an area over 1400 km., a linear conurbation along both banks of the river Hoogly and comprising two Municipal Corporations, 33 municipalities, 62 nonmunicipal urban areas and over 500 rural units holds at present a population exceeding 9 million. The twin cities of Calcutta and Howrah respectively on the East and West banks of the river, forming the core of the Metropolitan area, together account for a current population exceeding 4 million, occupying a total area of about 150 sq. km. under conditions ofextreme overcrowding. The slum population in the eMD is over 2.5 million of which the twin cities of Calcutta and Howrah account for 1.75 million scattered over more than 3000 locations.
40. A very large segment of this slum population, nearly 90 %occupy,C'tenancy settlements" locally termed as 'bustees' as distinct from "Squatters" Settlement. In the bustees of Calcutta and Howrah, title to the land is held by one person, the structures (predominantly huts with mud-packed bamboo walls and fire-proof roofing with burnt clay tiles or GCI sheets) belong to a second person and the bustees dweller is a tenant of the structure (hut) owner. The occupancy is characterised by sharing of barrack like huts subdivided into small cubicles each representing a family shelter and grouped around a small courtyard, accessible from unpaved streets, lanes and bye-lanes,with scanty common services like safe water sources and privy (dry bucket type laterines manually serviced), one each for 10/12 families on an average. Localted as a general rule in poorly drained areas, and having no arrangements worth the name for drainage, these tenancy settlements are prone to flooding and during the monsoon season, portray the worst conditions among known forms of subhuman existence.
41. The basic malady is economic. Bustees are occupied by a large section of the urban poor who have been priced out of other conventional shelters the city offers and have to choose between pavements and bustee hutments. Bustees exist as amarket response to these demands and neither the landowners nor the hutowners have any interest to make investments on the shelter and common facilities, so long as the market forces take care of their anticipated returns. The regulatory provisions seeking to enforce the obligations of the bustees and hutowners to maintain essential services and to keep the huts in proper state of repairs do not yield desired results because of inherent weaknesses in the enactments.
42. On an average more than 50 ~.~ of the bustee families live below the poverty line. In certain bustees, this figures goes upto 75 /~. A very large proportion of the family members is not in the labour force. Participation rate among women is quite low. The incidence of unemployment ranges between 15 ~'6 and 40 %. A large parcentage of the unemployed having given up hopes of securing employment reports themselves as unemployed. Even amongst the employed a very large section remains underemploye d, which is nothing but conceled unemployment. The dependency ratio (non-earning dependants to earners) in an average family size of five, ranges between 3 and 4.
Literary Status
43. The Literacy rate of the CMD is 43.2 %. For the CMD bustees, the rate may be very near to the CMD average. Primary school enrolment coverage for Calcutta, CMD and West Bengal are,respectively 65 %, 66 %and 80%. Thus excluding CMD, the State coverage is much higher and is very near the national target of 88 %by end of fifth Five year plan. Out of 100 wards in the city of Calcutta, 50 wards record coverage below the average level of65 %and in 37 wards the coverage is below 50%.Two categories ofprimary schools provide the coverage-recognised and unrecognised. The recognised category includes primary schools, which according to certain prescribed criteria qualify for public assistance towards wages of teaching staff and fixed recurring grants. As of 1976, 100 wards of Calcutta had in all 1333 primary schools of which 1273 were recognised and the rest unrecognised. Between them they covered a total pupilage of 283, 374 of which the share ofunrecognised schools stood at 7554. It would be interesting to note that the 50 wards which record lower coverage than the city average hold a total bustee population of about 6,00,000 of which children in the primary school age group would be of the order of 80,000. Enrolment data do not, however, provide a complete picture. Attendance is estimated at only about 70 %to 75 %of enrolment. Drop out rate for the primary school cycle as a whole is estimated at about 50-60 ~~. Thus only about 35-40 % of the age group complete the primary school cycle. This rate may be as low as.Io-zo S; in Bustees, where severe economic compulsion prevail.

90
Health Status
44. A recent CMD health survey undertaken by CMDA reveals the following characteristics: Maternal mortality rate is 3 per thousand. Infant mortality rate is 100 per thousand. Sickness incidence is 3 %for acute diseases and '6%for chronic diseases, Gastro-intestinal infection including enteric fever tops the list ofmorbidity(35 /~) followed by respiratory disorders (10.9 %), accidents (5.8%), cardio-vascular diseases (8. 7 ~~) and dermatitis (4. 3 ~,~). While the general status of .health in CMD bustees may more or less correspond to the CMD status indicated above, a recent survey conducted in ten bustees covering 10,000 families, clearly vindicates the notion that the famiIies below the poverty line (about 55 %) show higher incidence of chronic illness and current sickness and malnourishment among children representing well over 44 % of the population in that income class.
Government Policies and Programmes : Past and Present
Slum Clearance and Rehousing : 45. The principa1 thrust of public efforts in the early fifties and sixties was directed towards re moval
. or clearance of bustees and rehousing the bustee dwellers in medium-rise pucca tenements. Over a period of about 30 years, it has not been possible to rehouse even 2 /~ ofthe bustee households in the CMD under the slum clearance programme with Central Government assistance. Even with heavy doses of rent subsidies the tenements remained beyond the economic reach of the bustee dwellers. Rehousing at new locations also entailed disruption of established links and access to employment for the rehoused families. Tenement living further constituted a mismatch with their life-style. All these factors coupled with large differential between the subsidised rent and market rent for the rehousing dwelling units.. contributed to surreptitious subletting of the rehousing units to income groups well above the bustee dwellers. The futility of the clearance approach was clearly vindicated.
Environmental Improvement in situ and conseroaiion ;
46. It was in the early seventies that a major shift in emphasis from conventional rehousing to conservation through environmental improvements in situ, led to the launching of a massive bustee improvement programme in the CMD, under the aegis of the newly formed Calcutta Metropolitan Development Authority (CMDA) with Government of India assistance. This in essence recognised the role of the bustees as a large reservoir of low quality housing stock, even a sizeable portion of which could not be substituted by conventional housing in the foreseeable future; and aimed at preserving them by removing in, the first place, the basic environmental deficiencies viz. (a) substitution· of water supply sources of doubtful quality by safe potable sources, (b) replacement of open dry latrines by sanitary privies, (c) removal of waterlogging and flooding by an appropriate drainage system, (d) conversion of muddy slushy and dark lanes and pathways into paved and illuminated streets and pathways and (e) substitution of scattered dumps of domestic refuse and garbage by . appropriate garbage collection an d disposal devices. The improvement programme does not seek to interfere with the complex tenure system and the rights and interests of either the landowners or the hutowners in its current phase.
47. Since commencement of the bustee improvement programme in 1971, more than 1· 6 million bustee dwellers in the CMD at nearly 1500 locations have been covered by 1979 at a total cost of over Rs. 240 million, that is, roughly at an expense of Rs. 150 per capita. By 1982, the total coverage is expected to cross the 2 million mark at a total cost of Rs. 450 million since commencement.
48. The site variables for so large a programme spread over nearly 3000 locations are numerous and complex. These call for examination and consideration of a vast array of variables for technological solutions and adoption of the ones most appropriate and acceptable to the community. This therefore requires intimate association of the functional agencies and the community in evolution of the appropriate designs. In the twin city of Calcutta and Howrah, bustee community's participation in the planning and implementation of the programme is secured through 21 Advisory Committees constituted by the Govt. for the 100 wards of the, city of Calcutta and an Advisroy Body for the Howrah Municipality, with local community leaders and workers. Good rapport has been built up with the communities through these Advisory committees. '
'Khatal' Removal and Cattle Resettlement :
49. Bustees in Calcutta and Howrah have for tactical reasons been traditionally chosen by private milk-traders as centres for keeping cattle and carrying out unlicensed milk-trade. According

91
to a Govt. estimate there are in all about 2,500 such unlicensed cattle establishments, big and small, housing about 50,000 cattle. Buffaloes constitute the majority of the cattle, brought from the bovine breeding tracts of neighbouring States of Bihar and UP. These establishments locally termed as 'Khatals', though account for a very large share of the city's milk supply, they constitute a hazard not only for the livestock and country's cattle wealth but also the residents of the bustees in which they are located. Large volume of cattle wastes and other refuse choke whatever drainage outlets exist and directly contribute to malfunctioning of the improved drainage systems laid inside the bustees. The State Government has taken three major steps to. dear-with this evil e.g., (a) augmentation of supplies of processed milk through Govt. dairies and distribution centres, (b) banning of entry of cattle, and (c) removal of 'Khatals' and resettlement of cattle along with workmen in peripheral areas of the city. '
50. Works have been taken up by CMDA with financial assistance from the Netherland Government at four sites for resettlement of 14>000 cattle from the city's 'Khatals'. These cattle resettlement colonies will have modern facilities for cattle rearing, feeding, milk processing etc. as also residential facilities for attendants. These were expected to be ready to receive city-kept cattle in phases commencing from June '81 and the full complement of 14,000 by June '82.
Nutrition & Health:
51. Along with physical improvements, feeding centres were opened in Calcutta bustees for distribution 0 f milk and vitaminised breads to bustees: children(0-6 yrs.) and expectant mothers, in collaboration with the Social Welfare Directorate of the Government of West Bengal under the Special Nutrition Programme.(SNP). CMDA through its team of social workers carried out pre-identification surveys and took charge of 140 such centres while 200 other voluntary organisations and local youth clubs took care of 662 centres. Over 1,75,000 children and expectant mothers in Calcutta bustees were brought under the fold of the SNP through these efforts including about 30,000 covered by the Health Directorate of Government of West Bengal. By 1977, the coverage reached a figure of 3,00,000. Though CMDA had to disassociate itself from the SNP on account of more pressing preoccupations with urban infrastructure, the efforts continued to reach the target of 4,00,000 for the CMD.
52. The main thrust of the Health Programme launched by CMDA in the early seventies was directed towards augmentation of hospital beds with emphasis on creation of specialised services in teaching and non-teaching hospitals and introducing a three-tier structure with a referral system through Outdoor clinics, Polyclinics and Hospitals Mobile clinics were also introduced to supplement the outdoor services particularly for bustees in peripheral areas. The main object was to provide improved access to health services, and reduce overcrowding in Hospitals. This was sought to be achieved by treating minor ailments outside the Hospitals and bringing down incidence of illness through preventive health care and family planning and welfare measures, and augmenting facilities for ambulatory services. While the health service infrastructure under the programme was provided by CMDA, the management and manning of the services rested with the State Health Deptt. One of the essential features of the system was introduction of Family Health Cards for each individual family within the command areas of the outdoor clinics to facilitate monitoring of the health status and the delivery system and in particular follow up of referral cases.
53. Under this programme 37 Outdoor clinics, 5 Polyclinics and 20 Mobile clinics were set up. 56 Ambulances vans were supplied to CMD municipalities and other institut~ons.
54. The programme received a set back on account of withdrawal of health component from the CMDA programme package during the fifth plan period and inadequate budgetary support jn the Health Department. A new pilot programme with special emphasis on bustee population as its principal target has been launched by CMDA in association with the Health Deptt. under its five year programme for the period 1978-82 with IDA assistance.
Termed as Integrated Community Health Programme, it envisages delivery of primary health care including nutrition and family planning services to a target population of about 3,25,000 of which over 2,22,000 are bustee dwellers in 7se1ected wards of Calcutta Corporation identified as deficient in health facilities. The proposed health delivery system comprises establishment of 14 Urban Community Health Centres (U:CHCs).a~d 3 Zona; Vrban Health Cen~res (ZUHCs) with 3 attached UCHC~ and linking them up WIth 3 existing polyclinics and three Hospitals for referral and follow up of Hospital discharged

92
cases. The package of services includes preventive care as well as treatments for minor ailments, peri odic health check up, maternal and child care, nutrition education and family planning motivation and services. The entire population in the command area will be covered with routine vaccination against small pox and inoculations against Diptheria, Tetanus.Whooping Cough, Cholera and Typhoid etc. All malnourished cases will be identified and refered to the nearest feeding centres run by the Social Welfare Deptt. or the Health Deptt. Family information schedule depicting the health status of an individual family would be recorded and up-dated through routine home visits by Multi-purpose health workers.
55. The pilot programme basically seeks to integrate the preventive, promotive and curative aspects of health services at the community level and systematize the referral of patients and their follow up through community based workers; and to measure the effectiveness and efficacy of the health delivery system for replication throughout the CMD at later phases.
Education-Primmy and Adult :
56. Improvements of Primary education facilities in the CMD formed one of the components of the CMDA action programme launched during early seventies. It had two sub-components.Ia) provision of new buildings with five class rooms, teacher's room, craft room and toilet and (b) renovations ofexisting structures: to create an intake capacity of 200 students on an average for each school placed in one shift. The location and selection criteria both for new schools and existing ones to qualify for renovation assistance were evolved in consultation with the Education Deptt. of the GOWB and the list of both new construction and renovations was cleared by the Education Deptt. Recognition of the school by the Education Deptt. and clear title to the land on which the school is located, constituted two major preconditions to qualify for assistance.
57. Under this programme, 113new primary schools and about 600 existing primary schools have been constructed and renovated within the CMD by 1975. Currently an extention of this progrmme is under way~ This envisages construction of 80 more new primary schools and renovation of 400 existing, schools by 1982.
58. These additional primary school facilities would no doubt wipe off considerably the current deficiencies in the CMD, but both the programmes being not directly addressed to the bustee population in the CMD, their impact on the literacy level in the bustees may be of marginal nature.
Small Scale Enterprise :
59.'"CMDA decided at the end of 1976 that its efforts towards physical improvement of bustees by provision ofurban infrastructure should be complemented by efforts to support the economic activities of the bustee dwellers in order to raise their employment and incomes directly. Pursuant to this, CMD A undertook a survey in early 1977 within ten selected bustee areas, having a total population of about 200,000 a substantial segment of which are in the lowest income brackets, with special focus on the very low income manufacturing units offive important sub-sectors e.g. light engineering, leather tannery, gar-. ment making, plywood making and clay modelling. The major common feature of these units is that a majority of them belong to the informal sector, are very small and have insufficient access to institutional credit and technical assistance. The survey broadly revealed that (a) these units provide employment to the lowest income groups (b) most ofthem suffer from lack ofworking capital finance. The survey covering about 4,000 units on a sample basis, further revealed that employees wages were low ranging between Rs. 8 to Rs.12 per day, which roughly works out to an annual per capita income between Rs. 300 and Rs. 450 for an average family size of 6, assuming that the family had one earner working for 225 days in a year. The average capital employed per labourer ranged from Rs. 1,000 (clay modellers) to Rs.3,400 (small tanners). .
60. CMDA in collaboration with Cottage and Small Scale Industries (CSSI) Department of the GOWB and four nationalised banks, launched in 1978 an experimental programme to support the economic activities of the bustee population in order to raise their employment and incomes directly. The programme, which is largely experimental, is directed to be target group of very small scale enterprises mostly unregistered and belonging to the informal sector in .ten selected bustees. It broadly envisages identification of 48,000 service and manufacturing enterpnses within a range of five selected industry groups, assistance to prospective borrowers to make loan applications, prolJ?-pt appraisal of the enterprises by joint site visits and credit disbursements by banks of an average loan SIze of Rs. 6,250 per unit, over a three year period. The programme further envisages SSE extension service provided by the CSSI mainly with a view to (a) rendering assistance and advice

93
in securing technical assistance availablefrom various agencies catering to the samll scale sector and in provision of inputs and marketing (b) ideJ.?-t.ifying ne\y entr.epreneurs and investment possibilities (c) promoting associations/cooperatives to facilitate poolmg of inputs, production and marketinz (d) pronoting~o~ applications s;n? helping fill them out and (e).identitying training needs ofsmall entr~preneurs and enlisting them for training programmes. The extension service 1S to playa catalytic role between the bustee population and all institutions catering to the SSE sector. While the promotional costs are to be borne by the extension service, the costs of the actual landing operations are to be borne by the commercial banks. The programme also provides for studies of the SSE potential in Calcutta and surveys of SSE's in all of CMD slum areas together with performance monitoring of loanees, commercial banks, extension service and coordination efforts. The proposed studies would be utilised to prepare a second phase project with a larger geographical coverage and with industry specific techno-economic support • programme.
61. The promotional component of the programme has not made much headway. By mid March 1980, the number ofapplications received was 1200 ofwhich only 145 cases were taken up for consideration by the Banks and out of that disbursements were made in 58 cases. Because of different attitudes and stands of, the four participating Banks in regard to security by group guarantees, progitability vetting by SISI fire insurance cover, marketing facilities, entrepreneurial training gaps, registration of
, units under the CSSI, rate of disposal of cases shows wide variance amongst the Banks. With this rate of progress the target set for the programme now appears to be over-ambitious and unattainable.
Observations
62. Large Coverage : The most impressive aspect of CMDA's Bustee Improvement Programme is its spread and reach. ,In a relatively short period of about a decade.(1971 to 82) about 2 million bustee dwellers have been covered. Compared to low targets and sluggish pace in other cities this is a noteworthy performance.
I
63. Low Cost : The second important point is the low cost of the operation. The first I: 6'million bustee dwel1ers were covered at a total cost of Rs. 240 million, that is, roughly at an expense of Rs. 150 per capita. And the 2·0 million mark has been reached at a total cost of Rs. 450 million, that is,· at Rs. 225 per capita.
64. Substantial Investment : An investment ofRs. 45 crore since inception is indicative of attention, theprogrammeis receiving. Calcutta's special status, CMPO's earlier efforts and the World Bank's involvement are obviously responsible for a relatively large capital outlay.
65. Non-Physical Needs: A substantial involvementinnon-physical needs like nutrition, health, 'education (primary and adult) and income supplementation/generation through small scale enterprises, in addition to provision of urban services and facilities, makes the programme need-based and therefore, relevant.
66. elssues :
(a) Involvement of communities in planning, execution and maintenance of environmental services and community facilities is absent.
(b) User satisfaction is quite low. For any fault in quality of working of the services CMDA is blamed. Charges of corruption in contracting and execution are frequently levelled. The general complaint is that the quality of installed services is poor and overall performance is unsatisfactory.
(c) Maintenance ofinstalled services is poor. To clean up a choked sewer line, replace a stolen water tap or broken street lamp, conduct a minor repairing in overflowing toilet, replace or repair 19W.H.-16 .

94
a garbage bin or fillup a small ditch on the paved street people wait for CMDA or CMC while blaming CMDA for faulty installation and tardy maintenance. Maintenance of services and assests is becoming a serious burden on the CMDA and Calcutta Municipal Corporation. It is difficult to say if people ~s active involvement in planning and execution would make any difference to maintenance performance. Involvement of a community based organisation is considered quite essential in maintenance of services and facilities.
(d) Despite a heavy public investment in improving services and facilities, in many Bustees the overall environmental picture is not very different though deficiencies in basic services have been substantially reduced.
(e) A matching response from the Bustee, in form of indigenous investments in upgrading shelter and other things, normally expected in such a programme, does not seem to be forthcoming readily. Bustee dwellers are watching what CMDA is doing. They are demanding more and also complaining. But seem to be doing little on their own.
4. SULABH SfIAUCHALAYA 'BIHAR
67. According to the National Sample Survey, only 20% of urban households in the country use toilets connected with the sewerage system out of which only--7% have exclusive use of toilets and the rest either share with other households or make use of public toilets. 14 % of the households have water-borne latrines connected with septic tanks. Nearly one-third of the urban population is served by bucket privies. Households having no toilets account for the remaining one-third. In India, only about 217out of3119 towns have a sewerage system, most of them with partial coverage, although 2092 towns have been provided with piped water supply.
Although more than 19 designs like sewerage, septic tank, hand flush waterseal pit privy, acqua privy, chemical toilet, borehole, dug well, trench latrine, etc., are prevalent all over the world for the disposal ofnight-soil, only three systems have been found technically fit for adoption on a mass scale in India. These are: Sewerage System; Septic Tank and Sulabh Shauchalaya.
68. Sulabh Shauchalaya or water seal latrines have relieved scavangers of the unpleasant task of carrying night-soil on their heads for disposal. They require little water to flush-only about two litres-are free from air pollution, provide manure on the spot, can be cleared by the house owners themselves and alternately the two pits canwork for many years.
69. The system first started in Patna, then spread to other districts in Bihar and now to Haryana, West Bengal, Orissa, Uttar Pradesh and Andhra Pradesh. The initial work started in 1967-1970 during the Gandhi Centenary Period, as a tribute to him. At the instance ofthe Government of India, the Government of Bihar, through its Local Self Government Department, directed local bodies to get all the existing bucket privies converted into hand flush latrines and to connect them either with sewer lines or leaching pits.
70; The Government of Bihar gave grants to the Bihar State Gandhi Centenary Committee and the programme kept going but had no real impact. People wanted result-oriented work and not just preaching. Sulabh Shauchalaya Sansthan devised a latrine known as Sulabh Shauchalaya which functions as a flush latrine with or without being connected to a sewerage system. The movement received a shot in the arm when the Bihar Government promulgated an Ordinance in 1970 amending the Bihar and Orissa Municipal Act whereby a blanket ban was imposed on construction of new dry latrines. The new Iawmade continuance of dry latrines a cognizable offence.
71. To help people convert their latrines into Sulabh Shauchalaya, the local bodies aided by the State Government gave grants ofRs. 350 each and a loan of the same amount to those interested. A similar procedure was adopted in West Bengal also. Sulabh Shauchalaya intervened between householders and Municipalities to process each loan application. Volunteers went from door to door persuaded people, had forms filled and processed and after the grant was sanctioned, conversion work started.
72. These latrines can be constructed within a small space of seven feet long and four feet wide and two litres ofwater is enough to flush out excreta from the pan to the tank. The water seal prevents

95
gases from leaking out of the pit and all the gases produced in the tank are absorded by the soil. It can be constructed on a corridor or in an upper floor ofa building or even in a bedroom.
73. Sulabh Shauchalaya is a permanent installation which is economical and durable. It can be adopted by both the rich and the poor. The cost ofinstalling a Su1abh Shaucha1aya varies from place to place but was generally between Rs. 1000 to 1300 in 1983. Perhaps the biggest advantage is that nightsoil is always underground, inaccessible to flies and insects. As tanks are covered with air-tight and water-tight RCC slabs the place can be u1tilised for other purposes also.
74. The technique ofconstructing a Sulabh Shaucha1aya is simple enough to enable an ordinary mason to put it up under the supervision of a trained worker. Another advantage with the Su1abh Shauchalaya is that it can work in different soil conditions-rocky or sandy. Although the distance between the water source and Sulabh Shauchalaya largely depends On the soil, the safe distance between the source ofwater and the Su1abh Shaucha1aya in homogenous soil, black cotton soil or sandy soil is suggested to be 20 feet.
75. Till March 1980 about 30,000 bucket pnvres were constructed and 10,000 more were under process in 1981. In Patna and Ranchi alone about 700 scavangers have been relieved from carrying head-load and provided alternative employments.
76. The system of public conveniences by Sulabh Shauchalaya started in India in 1974 when public baths and urinals were constructed in Patna and Ranchi. The land and finances were made available by these two local bodies. They are now being maintained by the Sulabh Shauchalaya Sansthan and the scheme has since been extended to eight other big towns of Bihar. A 24-seat public latrine was first constructed in Patna near the Gandhi Maidan which was the filthiest part of the town. At present there is a 48-seat public lavatory at this place maintained by the Sulabh International whose head office is also in the same campus.
77. Such public latrines are now maintained by the Sulabh International in Patna at 35 places with a total number of551seats. There are 52 urinals and 313 baths. The conveniences are located near railway stations, bus stops, markets, hospitals, offices and other busy areas. Caretakers are posted to ensure all-round cleanliness and also provide soap powder to the users of the toilets.' They are required to pay 10 paise as maintenance expenditure. Daily collection from 551 toilets, 52 urinals and 313 baths in Patna in 1980 was around Rs. 2000 per day.
·78. The idea is spreading rather fast. Cities like Ranchi, Cuttack and Calcutta have obtained services of Sulabh International to install and maintain Patna type public facilities, The idea has spread to Sri Lanka also. After a study team visited Patna and Ranchi, 800 service latrines in Sri Lanka have been converted into Sulabh Shauchalaya.
Observations
79. Sulabh Shauchalaya is a low cost alternative to capital intensive, expensive to maintain, and wastage prone water-borne sewerage systems and therefore deserves to be adopted in a big way in towns and villages, where sanitary conditions are poor. The technique, if adopted properly, could serve poor people's needs adequately.
80. The success of Patna model where people are paying for the use of baths and toilets is a welcome development for local authorities who usually find it diflicult to install and maintain such services. This successful experiment should encourage other cities to follow the example and maintain services better and keep the city clean. It is. doubtful, however, that the system of collecting charges from the users of toilet and bath would work in permanent settlements. Sulabh's success in this area is confined primarily to places frequented by floating populations. The system, there-: fore, may not be a solution for slum pockets. That, however, hardly reduces its importance because even if the system succeeds in keeping the public utilities clean it is a positive step in improving fast deteriorating environmental conditions of towns and cities.
81. Sulabh International's success in spreading its message and its own operations far and wide lies in its organisational form, operational style and the entrepreneural skills of its leader,besi.de

96
the virtues of its simple and low cost technology. Sulabh International is able to overcome many bureaucratic hurdles due to its willingness to accept responsibility and do the 'dity-work'-not only a contractor's job in building toilets and bath rooms but also maintenance responsibility for an extended period of time in different cities of the country. Almost a similar operation in AhemdabadSafai Viclyalaya-though it has silently done some, good work in conversion of thousands of service latrines into flush latrines and trained and motivated people to adopt and spread this technology, has not been able to make as strong an impact because it is unwilling to act as a 'Contractor' and insists on its own training and motivational role.
82. Though Sulabh International is quite confident that this method does not pollute underground water sources, some people in Patna think otherwise and are concerned about the possible pollution hazards. A scientific analysis and proper dissemination of findings will help settle these doubts.
5. THE SLUM REHABILITATION PROJECT AT VASNA, AHMEDABAD
83. The Slum Rehabilitation Project at Vasna, Ahmedabad was set-up after a heavy flood in. the river Sabarmati (in August '73) swept away more than 4000 slum and squatter colonies situated. along its banks. While the Municipal and government authorities and other agencies were engaged. in providing emergency relief and settling a few flood affected families in transit camps, the Ahmedaba d Study Action Group (ASAG), a voluntary, non-profit, multi-disciplinary organisation run by young professionals submitted, after consulting the affected slum communities, an exploratory proposal fOJ' their rehabilitation to the Ahmedabad Municipal Corporation which was already contemplating some action.
84. The ASAG proposal emphasised the following points:
(a) Considering the possibility that floods may come again and recognising the unsafe nature of river bank locations the people were inclined to move to other location/s in the city provided:
(i) such a location was not too far away from their .gresent place of work, and
(ii) the alternative accommodation was acceptable and not too expensive. It was also pointed out that earlier efforts to shift people to safer locations had met with. resistance as they were forcibly driven out or offered accommodation that would have caused social and economic dislocations.
(b) For a successful relocation effort participation of the affected people at many stages of the process was necessary. It was also argued that previous attempts to relocate people had not succeeded as decisions which affected peoples' lives intimately were imposed by outsiders without consulting them.
(c) ASAG stressed that "slums were people not places" that they were more a reflection 0)1
attitude towards life than on conditions of physical environment and therefore building houses alone would not solve the problem. ASAG advocated a comprehensive approach incorporating social, economic, educational and motivational inputs, alongwith housing, that would lead to emergence of an alternative value system and bring about far reaching attitudinal and behavioural changes. ASAG suggested that not merely a housing project but a socio-economic development programme was necessary to 'meaningfully' rehabilitate the flood victim slum dwellers.
85. The Ahmedabad Municipal Corporation decided to adopt the broadbased development strategy outlined by ASAG. The Government of Gujarat, as part of its flood rehabilitation scheme, consented to provide a 43 acre site, seven kilometres from the city centre, together with a subsidy of Rs. 700 per family. OXFAM, a British development aid agency supporting the developmental perspective outlined by ASAG, agreed to provide Rs. 400 per household and an additional sum to support the 'Social Action Component' designed by ASAG. Though the site was outside the city boundary and therefore beyond its jurisdiction, the Ahmedabad Municipal Corporation, in an unprecedented gesture, agreed to provide infrastructural services (piped water, sewerage, street lighting, and roads)
. and community facilities (kindergarten, school, shops, health and community centres etc.) free of cost. And HUDeO agreed to give loan assistance to meet part of the construction cost.

97
86. The floods swept Ahmedabad in August 1973. ~he first brick on the site was laid on 15 May 1974. By the end of September 1975,2,248 houses, alongwith water supply, sewerase street lights roads and a co~r~unity c~n~re were completed in a sh?rt period of sixteen man ths. And ~t present, ~round 2,400 families consisting of over 12,000 peope live m the new settlement meant -exclusively for the flood displaced river bank slum dwellers.
87,. V.a.snaproject's significance is not .somuch in its final outco~e as in the process. In many ways the propel; IS a departure from the conventional slum clearance housing. In form and content, it is different from previous efforts to house the city's poor. Instead of bulldozing the poor against their will a negotiated settlement based on voluntary choice ofthe people has been attempted. Instead of being p~ssive receipients of dole, people have been made active partners in the process designed to foster their entry into the mainstream of city's life from their previous illegal and marginal existence. Instead of providing uneconomic and culturally undesirable multi-stroyed houses, modest shelters have been built to suit their life-style and paying capacity. Recognising the futility ofmere construction projects, social, educational and rna tivational inputs have been incorporated in the resettlement exercise. An attempt has been ID3.de to enhance peoples' income earning capacity and create new employment opportunities that may off-set some of the negative effects of relocation. And through the project an opportunity has been provided to the Government orgainisations and voluntary agencies to work together and share responsibility in helping the disadvantaged.
88. The Vasna project consisted of two separate but mutually complimentary streams of activities. The firs: related to building a new township for the displaced slum dwellers-houses, infrastructural facilities and community amenities. And the second, stream of activities related to building people-a self-respecting, self- reliant new community out of unrelated and scattered clusters of displaced slum dwellers. In building the towsnship emphasis was on (a) peoples' choice (b) peoples' role and (c) replicability, And in building people, the tool was 'Social Actions Component' (discussed elsewhere).
89. Attempts were made to involve the slum communities, which were spread along the river in 23 clusters, in the design of the house and preparation of the site lay-out. A few schematic, preliminary design a rtlines were evolved based on the feedback studies ofearlier housing efforts and expressed needs of the target community. Scaled models ofvarious alternative design possibilities were taken to different settlement clusters by a gorup of community workers and architects. These plans .were discussed with individu 11 families, neighbour groups, and recognised leaders. Their reactions, comments and observations res.ulted in many changes in the des ign and the lay-out.
90. Participation in the construction workwas optional and voluntary. Only 19 per cent of the fa nilies whocould be contacted indicated willignesss to take part. Others found it difficult due to lack of c-onstruction experience, higher paying jobs elsewhere or physical disability for manual labour. Yet, about 130 cons.enting families were moved to a transit camp near the site. They worked for some time building houses but for various reasons their number also dwindled gradually.
91. At Vasna, instead of multi-storey tenements, only single storeyed, low cost (Rs, 11.25 per sq. ft.), low specification houses have been constructed. Each family has been provided a 300 sq. ft. land plot on whic 1 a house with plinth area of248 sq. ft. has been built. The house includes a multi-purpose room, a covered verandah, an alcove each for cooking and storing, a bathroom, a toilet shared by two fami lies and the 'backyard shared by four. Running water and regular sewer lines are also provided. The house has an asbestos cement roof and 9" brick walls in cement mortar. Mud and cow dung have been used to plaster the floor and walls. Outdoor living being an important aspect of people's life style houses have been built around large, interlinking community courtyards. On an average, a courtyard for eight families measures about 40' x 52'. These courtyards have become focus of family and community activities.
92. Much before the first family moved to the new township, the complexities involved in allotment of houses "vas realised by the project planners. Loss of identity, social dislocation, lack of co-operation and even hostility among neighbours in a newly-built community are often attributed to faulty allotment ·of houses. At Vasna, the risk was unusually high. Approximately 44 per cent of the eligible families were Muslims 'and the remaining Hindus. Seggregate them in different blocks on account ofknown history of hostility, tension and conflict between these groups would have meant perpetuation ofprejudices and loss of opportunity to achieve some kind ofsocial integration. On the other hand, to mix them together indiscriruinately would mean running the risk ofconflict. The age old practice of drawing lots was not only improper but in this case, also dangerous.
93. It was therefore, decided to leave the choice of neighbours to people themselves. Each family was given option ofchoosing its own neighbours. In a complex socio-metric exercise, spanning over nine

98
months. the families were asked to make their own decisions in choosing neighbours who would share their toilet, backyard and courtyard. It was a lively and stimulating experience in group behaviour. Through the dialogue that ensued, people learned to weigh their options, use their discretion and make decisions. More importantly, they learned to accept responsibility. Not many in Vasna can complain that they are saddled with unwanted neighbours.
94. The special feature of the Vasna project is its 'Social Action Components', necessitated by the project participatory nature and its emphasis on the wider concept of human development. The Social Action Component, conceived as an integral part of the resettlement process, was designed with the follow-ing objectives in mind:
-To organise and mobilise people in needs and issues,
-To solicit community participation in decision-making, problem solving, resource raising, etc.,
...,-To rectify social and economic dislocations caused by change in the location of residence and business,
-to enhance productive ability and earning potential of the people by skill upgrading, training, credit referral, new job opportunities and other assistance,
-to strengthen community organisations and institutions.
-to organise delivery of basic social services.
95. Trained community workers were the agents of change under the social action component. In the early pre-action stage, the community workers were carriers of information and channels of communication. After establishing rapport with the slum communities, they initiated an ongoing 'dialogue, explaining the project objectives and observing reactions of the people. They prepared them to participate meaningfully. Even when people were in their make-shift shacks on the river, the community workers created a climate for intensive involvement through programmes like enrolment of drop outs in nearby schools, regular health check-ups and income-supplementing activities.
95. During the planning stage, collective decision-making was facilitated by community workers. They sought people's views onseIection Of site, design of the house, design of community layout and other matters. During the transfer phase, the community workers helped people solve their problems of adjustment. In the post-occupation and maintenance phase, new leaders were identified and trs.ined for self-governance; Groups and sub-groups were formed around issues to form popular opinion to take action for the resolution of problems. Formal and indigenous organisations were activated and people were helped in institution building and to develop management skills. The community workers also helped in organising, maintaining, and assisting income supplementing activities. and on-going impact and need surveys to provide feedback information for altering or modifying the involvement strategy. .
97. The community workers were aware that they were outsiders, that their role was only transitional, that their function was not to replace people's initiative by their own, and that they were initiators or facilitators and not the doers. One of the criteria in designing activities at Vasna has been the period of withdrawal of external resources, human as well as material, since the dependency factor was crucial in assessing success or failure of the undertaking.
98. In the earlier stages of the project, it was thought that a change in the place of living would result in some economic hardships. Repayment of housing loan, increased cost of living due to improved services and better access to social amenities, higher transportation costs involved in maintaining the social and economic ties with the previous place of residence, and loss of job opportunities due to increased distance, were considered some of the factors responsible for additional financial burdens on those who moved. To prevent sub-letting and shifting back to the old settlements; to avoid a drastic cut in the essential needs of life like food, nutrition and education; to meet the new obligations and, more importantly, to sustain the process of change and development initiated primarily through outside intervention, it was considered necessary to start income generating activities as an integral part of the housing 'programme. The additional monthly financial burden "vas estimated at Rs. 35, which meant approximately Rs, 1 million per year for all the 2,250 families. Since it was impossible to generate an additional income of Rs. 1 million, a selective approach was adopted and it was decided to work with 300 families, whose income was below Rs, 250.

99
99. Many activities were started. At a training and production centre seventy women were trained and fift~ of them earn Rs. 5 a day n<?w. Their products-cushion covers,· shoulder bags, bedspreads, wall hangings, etc.-are accepted m the local market and also exported. After about seven years the activity is still going on as a local women's cooperative. The sewing centre, in addition to upgrading the skills of the workers tried to obtain work orders on a collective basis. Through the intermediary credit referral services provided by the project, about 215 people were given loans by the banks. Approximately eighty-five of them were small entrepreneurs; others had borrowed money to purchase bicycles to continue their earlier income generating activities in the city.
100. An attempt was made to develop a low cost health delivery system through community level para-medical health workers. The three-tier arrangement which emphasised preventive health care and health education was intended to reduce dependence on highly qualified professionals who are expensive and not easily accessible. Ten community health workers were trained to supervise health care services under guidance of a qualified nurse and four doctors. After about two years the scheme had to be wound up for several reasons.
101. The community workers, in co-operation with the district panchayat, started a primary school-present enrolment 550 children-immediately after the families began moving to the new township. Though the inadequacies of formal education-particularly for this community-were recognised, for obvious reasons the project could not accept responsibility of creating an alternative educational system for the entire community. However, through 'Sarjan', an experimental education programme for the pre-primary and primary school children, opportunities are offered to bring out the creative abilities of children. They are provided simple tools, newspapers, discarded tooth brushes-charcoal, colour, water bowls, etc.-to express themselves creatively in drawing, painting, music and other media. The response on the part of the children and their parents is overwhelming and" what is more important, a qualitative change is apparent in their behaviour and performance. The school teachers maintain that the children involved with the 'Sarjan' programme are far more attentive, display leadership qualities, perform better in the class work, attend school regularly, are more disciplined and comparatively more motivated than others.
102. In the initial stage of all these activities the project inputs-human as well as material were substantial, but the process of building peoples' own organisation is still going on and efforts were made to delegate responsibility for their management and maintenance to the people themselves. Community workers and others support personnel were involved in training local people to assume more and more responsibility. Though the plan to withdraw all project inputs by 1978 sounded somewhat ambitious at that time the withdrawal did take place as planned. The success of the social action component was to be measured by one criterion-its ability in preparing people to manage their own affairs.
Observations
103. There are in-built difficulties in an ambitious attempt to relocate some 12,000-13,000people, and these are even 'more when the target is not only relocation or rehabilitation, but development. Many of these difficulties are transitional in nature. Some of them are related to the sharply rising expectations of the people due to a sudden and dramatic change in their living environment. Some of the problems have roots in inter-group rivalries and local politics, and a few are due to the lack of administrative and organisational arrangements to deal with the new issues that arise. Some problems are there simply because designers made mistakes and others because the modest shelters at Vasna do not fit into people's long cherished dream of a pucca, cement-concrete house.
104. There are complaints, protests, threats, and demonstrations. Though not a single family was moved under coercion of any kind, a few, unable to accommodate and adjust, have moved back to the slum on the river.' There was some corruption in the allotment of the houses and even though the guilty were brought to book, the relationship between the municipality, the community and ASAG became strained. The municipality has not been able to fulfil its commitment to build a community centre, primary school, health unit and shops. People complain about the inadequacy ofwater supply malfunctioning of the drainage system and frequent blackouts due to the failure of the street lights. There is a stalemate in the completion of the remaining work as occupants are refusing to pay the rents and the municipality is insisting on the payment of arrears and the promise of regular payment as a precondition for a dialogue. As the municipality has not been able to control a 'nala' that cuts across the site, there are floods in the area during the monsoon.

100
105. There is no end to complaints that the houses' are inferior and allegations that the project funds have been misappropriated. Inter-group rivalries and bitter competition for power and leadership prevent people from presenting a united front and this weakens their bargaining power with the establshment and reduces the effectiveness of the developmental process. Community workers find people slow to respond while the experts on community development feel that the over-enthusiasm of the community workers to show results tends to make them forget their facilitator's role as they replace the people's initiative by their own. On the other hand, there are many who think that efforts through the social action component to alleviate the effects of the dislocation caused by the shift in residence and to create a base for sustained development, are very inadequate.
106. Yet, at Vasna, a living community has come into existence. The people have already made sizeable investments in improving and modifying their houses. Although the municipal shops are yet to be built, they have, on their own, opened about fifty shops in the front verandah of their houses or have erected wooden stalls in public places. Even though the school has not yet been built, parents are eager to get their children enrolled in it. The people are organising themselves to redress their grievances. They make periodic representations to whoever is in authority about what they feel are their problems. At one stage, they staged a dharna, stopping all buses on the road and secured their long-standing demand for a bus stop within the town ship. Two year's ago, a group of concerned member of this community filed a civil suit against the Government of Gujarat, the Municipal Corporation and the project Committee for failing to fulfil the promises made to the people. As one community worker, who refused to be daunted by anything less than 4,500 problems (his formula for normalcy is of a minimum two problems per house) put it : "The Vasna Project like any other programme of its kind is not without its weakness and failures. Had it been only a housing efforts, the problems would have been fewer; had the people been treated as faceless masses, subject to the dictates of the planners and the government, the difficulties would have been even fewer. But Vasna project is not merely a housing project. It is an attempt to initiate a process of development. It has started by saying that 'slums are people not places' ! It has attempted to meet human needs rather than housing needs, It is learning laboratory, an experiment. And no experiment is a failure if one learns from it."
107. Is the Vasna Project successful? Does it provide a replicable model? These two questions are , constantly asked by administrators, planners, social scientists and funding agencies. There is no easy answer.
108. Seen as only a housing project.for slum dwellers and compared to past and present Government efforts to house the poor, the Vasna project may seem an impressive and unqualified success. In comparison to the snail's pace at which housing projects generally move, to have completed 2,250 houses and infrastructural services in just sixteen months will certainly appear remarkably efficient. Construction costs remained very economical at Rs. 11· 25 per sq. ft., and overheads were held at a minimum about 5-7 per cent since the project work was not given to contractor, as compared to the 12-16 per cent agency overheads normally charged for mere supervision. All this makes the Vasna project unusual, innovative, and successful.
109. But housing was only one of the components of the Vasna Project. The second goal of the prozramtne was to 'build people'-to stimulate a social and economic transformation in a former slum com~unity, to facilitate a development process that would ultimately become self-initiated and self managed. In this respect, a judgement may be too premature although some positive signs have begun to manifest themselves in the community. According to a study which evaluated the people's response to the project, they have become more involved in the Government system, vocalise their demands more forcefully to the local authorities, appreciate the value of education and cleanliness, are in the process of integrating more scientific explanations of realityinto their traditional beliefs, are rejecting money lenders for banks, increasing their savings, and investing in their homes and new business, are buying more consumer durables, aspire to a higher standard of living, and have a more positive outlook towards life.
110. But, the study also indicated a leadership crisis: a continuing reliance on outside agencies for the maintenance ofpublic spaces; inadequate care given to children and a continuing high rate ofmalnutrition a less than impressive participation in the socio-economic programmes; a relatively high incidence of crime; underemployment and unemployment especially among women ; less leisure time spent as a family and a community; and a lower level of security due to the separation from relatives ani friends in the city.
111. An important criterion in any evaluation of the project would be the capacity of the Vasna Project model to be replicated. The Vasna Project would be a failure if it only solved the problem> of 2,250 families at Vasna without providing clues as to how it could be applied to solve comparable

101
urban situations. In the course of the Vasna Project, it was realised that economic viability is just not possible so far as housing for the poor in metropolitan areas is concerned. In Ahmedabad where 84.? per cept of. the housing shertage is among families earning less than Rs. 250 per month, a substantial subsidy will certatnl~ be required for low income housing projects for a long time to come. AIthou~h the r:ate of subsidy was singificantly less as compared to other Government projects, and although this SUbSIdy was shared between several Government and voluntary agencies, the Vasna Project still had a 65 per cent subsidy component. This certainly makes it doubtful, given the non-availability of resources to match the awesome demand, whether the Vasna Project can be replicated on a sufficiently large scale. This suggests that a project-mix emphasising in situ environmental improvement, and Sites and Services schemes may be a better alternative. However, in some situations, housing will be required, as in the case of Vasna Project where the continual threat of floods made the original location on the river/bank unsafe. Under such circumstances, where the necessary subsidy is available, the Vasna Project could provide a model.
112. Housing can become a tool for development and change if resources are available for a social action component. This could be accomplished in any of then three ways. First, funding institutions with a strong developmental orientation could be tapped to implement the socio-economic objectives of the development project.. However, such funding agencies have a limited capacity and cannot be relied upon exclusively.. Second, Government housing projects could adopt the Vasna Project construction model which has substantially lowered overheads by eliminating the contractor. These savings in construction overheads could then be creatively diverted into a social action component. Third, substantial efforts could be made to integrate existing community development programmes into housing projects to produce a comprehensive development approach. Again, such co-ordinated planning efforts could use the Vasna Project as a flexible model upon which improvements could be made in stimulating a sustained process of development.
113. Resources, notwithstanding, appropriate institutional and implementation mechanisms are required if the Vasna Project model is to be replicated. An inter-institutional arrangement in which there is a climate of faith, mutual trust, and co-operative understanding between Governmental agencies and voluntary, people-based, grassroots. institutions is absolutely necessary so that development can become people-oriented. This requires Government agencies to be 'open' and include voluntary organisations, as intermediaries and facilitators, in their housing and development programmes. Equally important is the need for voluntary agencies to become truly involved in the development process-to gain experience, develop expertise, to become the people's advocate. Only then can the development model of the Vasna Project be capable of replication.
114. Finally, is the concept, ideal and spirit of the Vasna Project repeatable? It must be. For physical inputs are grossly inadequate to deal with the problems of slums which remain essentially attitudinal, political, behavioural, economic, and social in nature. Housing is only an entry point into the community, but the emphasis is on the process of development. This, if nothing else, is the most important statement that the slum Rehabilitation Project at Vasna has made.

APPENDIX II
CASE STUDIES OF HOUSING INVESTMENTS By THE POOR
-==================================================================..
. /
l03

CASE STUDIES OF HOUSING INVESTMENTS BY THE POOR
INTRODucnON
1. The following case studies illustrate many of the factors which inhibit the poor from making housing investment, which are discussed in Chapter IV. The households that were interviewed, stay in two settlements, Ganeshnagar and Bibwewadi, in Poona.
2. Ganeshnagar is a squatter settlement which started in 1969 and occupies a piece of government-owned land. Its present population is nearly 9,000. A large majority of the residents work in industrial and service sector jobs. Their relative economic stability is reflected in the quality of their shelter, some of which have been improved to form almost 'pucca'. structures.
3. The Pune Municipal Corporation (PMC) 'improved' the settlement in 1975 by way of concreting pathways, constructing open drains, building aqua-privies and providing water taps. The Community is a remarkable case of organization. With careful vigilance it maintains a sanitary environment in the settlement and controls its development. The residents have full faith in the elected local leadership (community organization) which they firmly believe is working for their welfare. . .
4. In the case studies, the anxiety caused by their unauthorized status comes out clearly. Those who have invested money in housing have done so on the basis of the strength of the number of other families in similar circumstances and on the basis of their faith in their community organization, which they believe will lead the residents in a united action against any threat. .
5. Bibwewadi is a sites and services scheme sponsored by the Municipal Corporation. There are 500 concrete bases spaced apart, each measuring 10' X 15', and communal water taps, latrines and bathrooms, on the site which is located near the southern boundary of the city. Residents from three different shanty settlements in the city were moved to this peripheral location in the mid-1970s, without being offered any alternative location. .
6. They are tenants of the Municipal Corporation each pays a monthly rent of Rs. 18/-. A number of them have large amounts of rent arrears. Some of the rent defaulters have been evicted in the past, some moved away because they could not pay the rent or considered too high the price of staying at such a remote location from the job market. The quality of houses on the site is diverse. Some are bare minimum shelters, a few of which do not even cover the full extent of the area of the concrete base; a small number of the houses are much improved with an attic or a mezzanine and a balcony, which increase the usable space. Some have built extensions in the side, open spaces and front, but the construction is such that it can be dismantled without much difficulty and the materials can be reused. This caution is prompted by the fear that the authorities may raise objections of such extensions.
7. The diversity in the quality of shelter reflects the disparity in income distribution and access to finance. In spite of their regular tenancy, in the absence of a possibility of raising at least a small amount of money, the very poor in unstable and casual employment have not been able to improve their shelter much. Although they are legal tenants, some of them do not regard it as adequate security of tenure for investing money from the viewpoint of creating an asset. They have formed a co-operative society and are making efforts to get the land ownership transferred to the society. There is no other community organization; it remains a disparate group.
I05

106
8. The interviews which form the basis of these case studies brought forth vividly the attitude of mistrust of the poor-especially the less worldly-wise among them-towards anyone making inquirles about their circumstances. The first reaction in many cases was of fear, secretiveness and sullenness. Only after they were satisfied that we did not represent any kind 'of 'officialdom' did the respondents open up. Even then, as in the case of the Gajarmal family in Ganeshnagar, traces of suspicion and mistrust did linger right through the interviews.
9. There is a sense of vulnerability and distrust which the poor feel vis-a-vis authority, which comes through in some of the case studies. The poor and less educated often feel an inadequacy to deal with official procedures and feel threatened by them.
A. Ganeshnagar Case Studies
(i) Shamiuddin Kazi
10. Kazi, in his early-to mid-twenties, works as a spray painter in Bajaj Auto. The household comprises five members-Shamiuddin's mother, wife, a younger brother who is a 'bachelor, and an unmarried sister, They moved to Ganeshnagar about 14 years ago after Shamiuddin's father died. Their previous residence had been the Range Hill area, tied to the father's job at the ammunition factory. After his death they had to vacate the place.
11. Their first residence in Ganeshnagar was a hut rented from one Parubai Chavan, a licensed stall-holder in the vegetable market who owns a number of such houses (4-6) in Ganeshnagar. The Kazis fourteen years ago paid a deposit of Rs.I50.00 aud a rent of Rs. 25.00 per month. .
12. They built their own house on the present site about six or seven year ago. This was the .typical Ganeshnagar shelter, with walls made of corrugated iron sheets and a roof of Mangalore tiles. Some improvements were made during the first five or six months. This house was built by a hired carpenter. The materials were bought in Bhauani Peth and were all new. Six month ago, five years after its initial construction, the house was upgraded to its present condition. It is now a pucca construction with brick masonry walls and Mangalore tiles (reused). There are two rooms in a covered area 11 feet by twenty-one feet. One serves as a sitting room and one as a kitchen. The entire space doubles as sleeping quarters at night. The height of the structure is generous, about 16 feet, at the edge of the roof, A mezzanine or loft over the sitting room gives into a kitchen and is used as space for drying clothes. Shamiuddin gave some indication that when his younger brother got married the loft might be used as an addtional room. The kitchen has a proper cooking platform finished in polished stone and glazed tiles. A little "mori" at one end of the platform serves as a washing and bathing place and there is provision for the storage of water.
13. The floor of the house is paved in cement tiles. The doors and window are in panelled teak, neatly oil-painted. An interesting feature is the artificial ceiling of the sitting room, designed to disguise the fact that there is a loft above. The lighting fixtures in this room are sunk into the ceiling.
14. Shamiuddin reported having spent around Rs. 27,000 on the upgradation. His sources of finance were diverse: the family's savings; a loan of Rs. 3,000 from his Provident Fund; Rs. 4,000 loan from the Bajaj Employees' Cooperative Society; some money from his father's dues from his job; amounts from fixed deposit accounts created by his grand-father in the names of Shamiuddin and his brother and sister; the proceeds from the sale of his mother's ornaments; and personal loans to the extent of Rs, 5,000 from two friends.
15. Asked whether he knew of the necessity to seek official permission to build, Shamiuddin replied that he had only sought the advice of the chairman of the Ganeshnagar association (which is a registered body) and the latter had assured him that he could go ahead. He did not seem to be
. aware of the official procedures for seeking permission to build.
.16. Finally, we asked Shamiuddin how, given the illegality and insecurity of his tenure on the land, he had taken the risk of investing so heavily in the construction and upgrading of his house. Was he not afraid that, in the event of his eviction, he would suffer a substantial loss, as little of the material he had invested in was recyclable? He replied that he had taken a calculated risk. Firstly, he had seen others in the neighbourhood, whose tenure was as insecure as his, investing in the improvement of their houses. Secondly, he was aware of the case of another settlement, Jai Jawan

107
Nagar, where 'residents were served eviction notices but nothing came of it. Thirdly, the Municipal Corporation had invested in drainage and in paving and lighting the streets in the area, which he felt was a sign that they would not in a hurry undo what they had done at great expense. Fourthly, the issue of identity cards to slum residents and of water rate notices more recently, were to his implicitassurances that he would not be evicted. Finally, he had enough faith in the community organization, and its chairman to stand by him should the worst happen.
(ii) Punwatkar
17. The Punwatkar family, consisting of a formally employed couple (he is PA to the Director of Social Welfare, she is with the PWD) two children and now a niece who had joined them, came to Ganeshnagar in 1972. Earlier they had rented accommodation in Ambedkar Society, where for approximately 80 sft. of space they were paying a monthly rent of Rs. 40.00.
18. The first structure they built had corrugated iron (CI) sheets for walls and asbestos cement (AC) sheets for roofing. The earth itself formed the floor. The cost, in those days was about twelve hundred rupees for approximately 120 sq. ft. The major part of the investment came through a loan from Mrs. Punwatkar's mother. The first upgradation was done around 1977-78. While the original AC sheets were retained from the roof, the walls were built in brick up to window still height (windows were introduced at this stage) and CI sheets retained from there on up. Flooring in IPS was introduced. A small extra room of about 120 sft. was added. This addition and upgradation cost about Rs, 7,000. Finances were obtained through loans against the couple's PF accumulation. Since they had no legal tenure, they could not qualify for the non-refundable housing loan which is'available to P·F account-holders. .Instead they had to borrow "for medical treatment", and repayment had to be made ill the short span of three years. The upgradation, to a "Pucca" shelter, was done a year back. This comprised, while retaining the original AC sheet roofing, walls built entirely in brick, stone slab flooring, panelled teak doors and windows. The present house consists of two rooms about 9 ft. x 14 ft. each. One of them serves as a kitchen and has the necessary facilities of cooking platform, water storage and a little space for washing and bathing. The provision of an independent water connection cost Rs. 1,000 which was paid to the Municipal Corporation. The CI sheeting rendered surplus from the earlier structure was utilised for creating an annexe to the main house. This is used for parking of two-wheelers and for dead storage. During the two weeks which it took to carry out these changes, the Punwatkars went to stay with friends nearby.
19. The upgradation outlined above cost around Rs. 12,000. Once more a loan for "medical treatment" was taken against PF accumulation, and like the earlier loan, it has to be paid back in three years. The Punwatkars' monthly outgoings towards this are Rs. 250, Rs. 150 from his salary and Rs, 100 from hers. Mr. Punwatkar, in addition to his regular job, works a couple of hours in the evenings at teaching shorthand in a nearby typing school, so that he can cover these extra outgoings. Being a socially ambitious and upward mobile couple, they send their children to English-medium schools. This must also impose an additional strain on the family finances. We asked Mrs. Punwatkar, who was the respondent to our interview, about the process of obtaining permission for building expansion or upgradation of structures in Ganeshnagar. She replied that the matter is referred to the chairman of the community organization, who visits the site along with other members of the managing committee, and ascertains on the spot the nature of work to he done. Residents of neighbouring houses are informed and asked to specify their objections, if any. .If these are found to be genuine, ways and means of getting around them are discussed. Only when a consensus had been reached between all parties concerned does the work of construction begin. Mrs. Punwatkar asserts that no one defies the committees decision.
20. We also sought Mrs. Punwatkar's views on the importance oflegality of tenure. As the wife of the secretary to the community organization and herself an educated, working woman, we found her both perceptive and vocal on the subject. She said that while the risk of eviction was always technically there, there was little risk of such an eventuality actually occurring. She mentioned the investment by the Municipal Corporation in improvements a one reason for this . reassurance. More importantly, however, she felt that the unity of the community and the strength of its leadership were important factors in ensuring its survival.
21. She did feel,however that legality of tenure was in the long run an important consideration. Towards this end, she indicated that the proposed water cess charge to be levied by the Pune Municipal Corporation for which they had been served notices, should instead be collected as ground rent, which would be more reassuring. "

108
(iii) Jadhav
22. Mr. Jadhav owns a shop in Ganeshnagar, which is attached to his residence. He has lived in the locality since 1971. During his first year there he lived in rented accommodation which cost Rs. 25.per month in addition to a deposit of Rs. 200. There was no electricity, and water had to be bought.
23. Before coming to Pune in 1971, Jadhav had a job as storekeeper at the Polytechnic in Buldana (Vidarbha). Owing to reduction in staff he was transferred to the Engineering College in Pune, with a transfer allowance of Rs. 800. A year later he was declared redundant. He made a representation to the Department of Technical Education, opting for employment as a Class IV worker rather than giving up his job. He was told that, as an SSC he was overqualified for that job, but his plea was considered nonetheless. This took a year, during which time he took up the occupation of an itinerant fruit vendor, selling guavas.
24. In 1972, after living for a year in a rented hut, he decided to build his own house from the Rs. 800 received as transfer allowance. He staked 04t a piece of land and, in bits and pieces, put together a shelter using Galvanised Iron sheets for wall and Mangalore tiles for the roof. All the material was recycled. The sheets (used) were bought at a premium price of Rs. 130 each. This was when the control rate for new sheets of the same quality was Rs. 80. There was no paving on the floor. .
25. In 1973.a year after he built his own house, Jadhav decided to change overfrom itinerant vendor, to shopkeeper. He added a room to what he had a'ready built and part of it, opening out into the open was converted into a grocery of sorts. Having thus stabilised himself to some extent, he undertook to train his illiterate wife to share the responsibility of running the shop. Today she is practically in charge of the business.
26. All the additions, alterations and improvements made by Jadhav have been piecemeal and gradual, dictated more by necessity than by a plan of improvement. Thus it is not possible to precisely date or cost the development, nor to iaentify definite"stages"in the process. What he now has is, in addition to the two rooms already mentioned (the first being about 9' x 12' the second about 12' x 14'), a separate, clearly demarcated space about 4t' x 9' for the shop. This was originally built as a detached unit, about 4 ft. away from the first room, but now the space in between has been roofed over and is used for washing and water storage. The entire structure forms an integral unit, covering about 300 ft. on the ground.
27. Fairly early in this process ofdevelopment Jadhav made the rather unusal change from a Mangalore tile roof to a corrugated iron one, opting for the relatively more uncomfortable of the two in terms of heat transfer. He explained that this was due to the relative vulnerability oftiles which ate susceptible to breakage and involve recurring cost of maintenance,
28. Over the years the walls have been converted, one by one, from GI sheets to brick and mortar. Here again, necessity wasthe overriding consideration. The first brick wall was built becauseit was deemed as a prerequisite by the MSEB for providing an electric connection. GI sheets representing the risks of short circuit and electrocution, the metro board had to be installed on a non-conducting surface. Subsequent masonry walls were also constructed one at a time, usually by night and without foundations or on holidays, for fear. of the construction being stayed or demolished by any Municipal Corporation officials who might chance on it.
29. Somewhere in the mid-1970's Jadhavgot reinstated as a storekeeper at the Poona Engineering College and now earns Rs. 1000per month. In addition to this he has the shop, which is run as indicated earlier, primarily by his wife, with himself and his grown up son devoting to it what time they can spare. But in spite of this relative stability, Jhadhav has not made any remarkable improvements in the quality of his shelter, other than putting in stone flooring, The rooms are untidy and dingy, with not even an attempt at a clear demarcation between the various activities associated with living. Living, cooking and storage mingle in merry disorder, and the shelter itself seems to be looked upon as something 'necessary' rather thane'desirable'. The unplanned nature of his improvement of shelter is strongly reflected in this. We asked Jadhav how he felt about secur'ty oftenure. He said that it would be an advantage if SODlCthina could be done to ensure the right to transfer ownership of shelter to his successors. Other than this,Poe fataUstiQaIl)' observed that, in the event of eviction, from the present site, he Pad nowhere to 90' With

109
the kind of life ofu?certainty and insecurity that he had lived, he was not afraid ofanything that fate might fave m store for him. In any case, he was ~ot alon~. There were so amany others like him, and whatever happened the problemwculd be everybody s, not Ius alone. Nonetheless he does consider the lack of tenure as "a hanging sword" and wishes he could feel more reassured on this count.
(iv) Gajarmal
30. The Gajarmal family came to stay in Ganeshnagar just three years ago, after the head of the household retired from his job in the Kirkee ammunition factory and had to vacate his job-tied accommodation at Range Hill. He had acquintances living in Ganeshnagar, from whom he learnt that it was possible to buy a ready-made, illegal shelter in the area. What he bought was a hut with GI sheet walls Mangalore tile roof and rough Shahbad flooring. The main space is. 14'x9', from Which 4!'x9' is iden~ tifiable as kitchen, with a cooking platform and terrazo tilefiooring. Annexedto this main space, thereis a washing cum-storage space of about 3'x9'. .
31. The household consists of six members-e-Gajarmal and his wife, three sons and a daughter. A fourth son, the eldest, is married and lives separately. Of the three sons sharing the accommodation the eldest is employed in the P & T department on Rs. 350 p.m. This, together with Gajarmal's pension of Rs, 250 p.m. makes up the entire income of the family. The next son has just completed his RCom. and is looking for a job. The youngest is still at school. The daughter has completed her sse and is engaO'ed to be married soon to a man living and working in Bombay. She had a job offer to work as a Balwadi t;'acher in Ganeshnagar, but the family was not enthusiastic about the idea. The brothers saw it as an aspersion on their masculine duty of providing for their sister. The parents saw it in more pragmatic terms, as the potential loss of useful help around the house. Because of Mrs. Gajarmal's age and failing eyesight, the daughter has to bear the brunt of .household chores.
, 32. In interviewing the Gajarmal family we came across the typical mistrust of the poor towards any strangers asking questions. While Mr. Gajarmal Was quite open and trusting, his wife more than once expressed apprehensions about his giving us the information we sought, and said that her sons would disapprove oftheir having given us this information. She repeatedly asked how the information was going to be used, and what, if anything, they were going to get out of it.
33. Mr. Gajarmal told us that he came from a village in Mulshi Taluka, and was the first person from his family to get away from agriculture and to come to work in the city. The family still had their ancestralland(about 5 acres) in the village but it was tilled by Gajarmal's cousin, and Gajarmal himself, though the principal title holder, was not getting any share of the proceeds from it.
34. The job with the ammunition factory was the only one Gajarmal had held during his thirtytwo years of service, and it had carried with it a two-room quarter at Range Hills. The furniture crowded into Gajarmal's present premise-notably a steel almirah two cots (one permanently folded away for want of space) a folding steel table and chairs bears testimony to be relative generosity of space in his formal' job-tied residence. He started his career on a salary of Rs. 60 per month, and was earning for Rs. 600 when he retired.
35. Although he was fully aware that he would have to vacate the job-tied-accommodation on retirement he was never able to save towards the ultimate acquisition of a house for himself. because ofthe expenses of running the large household. When he finally retired, there was no alternative but to buy the present house for which he p~id about ~s. 5009. The amount ca~e ou! of his GPF. He did not borrow anything. He has not invested ill any significant Improvements during his three years of residence here. He mentioned a privatewater connection as a high-priority need (but his wife and daughter did not think so. They feel that the water supply at the community tap near the house is abundant and because of a rule made by the managing committee that there shoud be no washing or bathing at the community taps, there was no inordinate waiting for one's turn in the queue. But the expenses involved in getting one (around Rs. 1 200) are an inhibiting factor. So also is requirement of the PMC that the house has to be in his name (i.e.there must be an identity card which names him as the official resident of the house) before an application from him for a tap can be considered. He has neither the means nor the inclination to make any investment in the absence of security of tenure,
36. We asked Gajarmal whether the identity card issued after the 1976slum census had been changed to his name. He said that it was still in the name of the previous owner, but that some process of transfer was in progress. He was not quite sure vvhat. His son was dealing with it.
19 W.H.-l~

no
(v) Mahadu Shankar Gonellu
37. The Gonellu family are originally Telugu-speakers from the Sholapur district where it borders on Andhra Pradesh. The younger generation, eager to obliterate their "foreign" identity, changed the name to Gonewar, and now Mahadu Shankar also uses that form socially, though on paper he continues to be Gonellu,
38. They live in a room 9' X 12' which is part of' a row of back-to-back rooms (total 8) built in the early seventies by one Gaikwad for the purpose of renting out. Mahadu has been staying here since 1972. He paid a rent of Rs. 15.00 per month until 1977. Then, towards the end of the Emergency, the Ganeshnagar Mandal exhorted all tenants to stop paying rent in keeping with the Emergency dictate that the occupier of a house is the owner. Around the end of 1980, Mahadu paid a lumpsum amount of Rs. 500 to Gaikwad and officially became the owner.
39. The room has a front (external) wall built of crude wooden slats, and three party-walls constructed in opened-out tin cans. All the walls are whitewashed, some gaps in the wooden wall are slated with mud mortar, and those in the party-walls with cardboard. The roof is in CGI sheet, about eight feet high at the ridge, which is lined over the rear wall. The floor is in mud-and-cowdung plaster. The only opening is a wooden door set at one end of the front wall. A slight depression in the floor, just inside. the door, is used as washing and bathing space, and the water is drained out througha hole in the threshold, into the open drain outside. Because of this kind of washing space, as also because of seepage from the ground and leaks in the roof, the floor gets damp and soggy during the rains. Three years ago, before he got ownership of the room, Mahadu replaced some four or five sheets in the roof at a cost of about Rs. 400. The sheets were bought in Bhavani Peth. Apart from this he had not made any improvements during his entire stay.
40. The house is sparsely furnished. A wooden plank supported on brackets on the rear wall a wooden rack, 3 ft. by 4 ft. along one end wall, a tin trunk and small earthen platform along the front wall are the only solids that intrude in the space.
41. The family consists of Mahadu (50), his wife (44), and five sons, aged respectively 22,20, 15, 12, and 7 years. Mahadu works in the Khadki Ammunition Factory, earning Rs. 800 per mo~th,. out of which Rs. 300 goes towards the repayment of a long-standing loan. .The original loan amount was Rs. 500, taken from a private source during a family emergency at the cripping interest rate of 12.5% per month. This high interest coupled with Mahadu's inability to keep to the repayment schedule, caused the outstanding amount to inflate considerably, and it stands today at Rs. 1,500.
42. The eldest son, who has studied up to the eleventh standard, has recently found a temporary job as supervisor at a small factory, and earns Rs. 70 per week. Mahadu is keen that he find a stable government job, and does not intend to let him marry until he does. He sees "no point in spoiling the life of some poor, innocent girl by bringing her as daughter-in law into a home which is financially insecure". The second son is mentally retarded and "wanders around begging". The third son has a job as waiter in a small restaurant, and is paid Rs, 50 per month and given two meals. He comes home only to sleep. The fourth son goes to school. The youngest does not. Mahadu's wife is in poor health and does not work except at running the home to the extent her health permits.
43. Mahadu, whohas not been to school at all, came to Poona from Sholapur in 1940. After working for two years as a casual labourer on an army construction site in bundh, he found a job at the Ammunition Factory during the mass recruitments in 1942.. He was retrenched at the end of the War in 1945. He got back the job in 1949. During this time he was staying in' a hutment near Aundh. In 1954 he was transferred to Jabalpur. On being transferred back to Poona in 1960 he stayed in a hutment in Vaitagwadi. He heard about Ganeshnagar and about Gaikwad's rental accommodation from a fellow worker in the Ammunition Factory, and moved there in 1972.
44. It was only after his return from Jabalpur that Mahadu married and had a family. We asked him how it was that he, who had voiced so much concern for the welfare of his would-be
daughter-in-law, had not given similar thought to the welfare of his wife and the well-being of his family when having five sons. He replied that his wife was keen on having a daughter, so they kept on having children until they realised that they had five mouths to feed, and still no daughter. His wife countered this with the emphatic assertion that she had wanted. a tubectomy after the third child,

III
but her husband refused "to sign the paper" allowing this. Finally, after the fifth child, she went and had} it on her own. .
45. The Gonellus have always found it difficult to make ends meet, both because of the size of the family and also because of the wife's poor health, requiring frequent medical treatment. Mahadu ~imselfis a very frail person, wit!t a tendency to asthma. ;Loans have bee;'! a pa;rt of his life for a long time. He does not smoke, drink or have any expensive tastes. It IS mainly out of a genuine concern for what would happen if he should suddenly have to stop working or, worse still, die, that he has left untouched all the accumulation of various funds and benefits that go with his job. We tried to :findout the details of these, but he was very unclear about them and we gave up the attempt. Because of his poor health and the distance to his place of work, Mahadu cannot cycle, and travels to and from work on PMT and PCMT buses, spending (currently) Rs. I- 15 each way.·
46. Mahadu is quite happy with the Ganeshnagar Mandal, though he does not go into raptures over them. He sees the identity card issued following the 1976 slum census as an adequate guarantee that he will not be summarily evicted. He finds the water supply at the Municipal tap reasonably satisfactory. He does not have electricity in his house. We asked him if he intended to acquire a connection.. He said that with the kind of walls he had there was no question of the MSEB granting him one, since the metre has to be mounted on a properly insulated board which itself must be set in it stable wall.
47. This led us to ask him whether, in view of the funds, that would accrue to him upon retirement, he had any plans for upgrading the house. He made vague references to the need for proper CGI sheets for the walls, and for some measures to stop seepage of damp upwards through the floor. But he seemed unable to conceptualise the value of the money due to him, or just how to allocate it for various purposes. On the whole, both Mahadu and his wife seem to be so preoccupied with their own respective conditions of health that they are unable to look beyond this immediate concern.
(vi) Bmw
48. Banu, aged about 30, lives with her husband Siraj, and three sons, aged respectively 9 years, 4 years and eight months, in a room lO'XIO' behind the community temple in Ganeshnagar. The room is in fact one quarter of a hut 20/X20'. The wall are CGI sheets, and the roof is of Mangalore tiles. The floor is in mud-and-cowdung plaster. The only opening in the walls is the entrance door. The two party-walls stop a foot or so short of the 10 foot high roof, and there is some scope for air circulation on this count, though it also considerably reduces privacy from the immediate neighbours. A little "mori" in one corner .of the room serves 2. washing space. The room has an independent electric connection and a fluorescent tube. The bi-monthly electricity bill comes to about ten rupees.
49. Banu earns around :fifty to sixty rupees a month rolling beedies. This work is "subcontracted" to her by her mother, who has a contract with the Thakur Savadekar Bidi factory in New Khadki for a logbook quota of 800 bidis a day, for which she gets :five to six rupees. She has been doing this work for the last thirty years, starting with a quota of 1500 beedies a day, which was later reduced to 1,000 and now to 800. She goes to the factory every evening to hand in the day's quota and to collect raw material (leaves, tobacco and thread) for the next day's work. The leaves are soaked in water overnight and dried, to make them pliable for rolling. We inspected the old lady's logbook and found that she has a consistent record of delivery and, significantly, 110 "rejects". Banu told us that if there was a shortfall in quota due to bad leaves this had to be made good by the contractor. Therefore any surplus leaves left over from the day's work were carefully preserved for such a contingency. Since leaves are issued on a weight basis it is not difficult to lay by a few when the lot is good. On the rare occasion of a genuine shortfall, leaves have to be purchased in Nana Path.
50. Banu's husband Siraj works as a casual labourer on construction sites, doing masonry work and some plastering. He averages four days a week and earns Rs. 8-9 per day, making on an average between Rs. 125-150 a month. This, together with the Rs. 50--.60 earned by Banu, is the entire income of the family. Siraj is addicted to the bottle, and more than half his income gets spent on drink. Banu's parents are reasonably secure economically, and they coccasionally help out in cash or kind. Until about six years ago Siraj used to ply an autorickshaw, and used to make about Rs. 10--15 per day after paying tent (Rs, 12) and other overheads on the vehicle. He once got involved in an accident while driving in an inebriated state, and his licence was impounded. This resulted in his changing over to being a construction worker.

112
51. Until around 1970Siraj used to stay in a joint family with his parents and married elder brothers, in a slum in Sivajinagar. His drinking problem was a source of tension in the family. After he got married the problem continued. As a result the family decided that Siraj and his wife should move out and set up house independently. This is how they came to Ganeshnagar twelve years ago and buill: a hut similar to the present one (except that the roof was of CGI sheet). This cost around Rs. 1,000 then. The amount was raised by Siraj's mother who sold her oranaments and gave the money to her errant son as a parting gift.
52. Siraj and his wife never had enough mony to invest in the improvement of their house bu t when a newcomer to Ganeshnagar decided to build a hut next to theirs, sharing a wall, and went in for a Managalore tile roof, they decided to have roofextended over their hit to replace the CGI sheets. This cost them around Rs, 500 six years ago. The money came in the form of a .'loan' from Banu's mother. Around the same time they also acquired a private electric meter. Other than this they never m-anaged to invest in improvements.
53. The old house was located in a square in the centre of Ganeshnagar. About three years ago a local entrepreneur saw it as an ideal location for a mill. He moved through the office bearers of the Ganeshnagar Mandal to acqure it for himself, along with the adjacent house. The Mandal Committee tried to apply pressure on Siraj and his neighbour to move. The neighbour, being financially secure, held out. Siraj and his wife, being more vulnerable, proved pliable. Theerstwhile occupant of their present house was "persuaded" by the MandaI to vacate his premises, and left Ganeshnagar, The vacated house was alloted to Siraj and this is where the family now lives.
"iLl. After the 1976 slum census conducted by the PMC, Siraj was issued an identity card officially recording him as occupier of his former premises. When he moved out from there to mak e room for the mill, the Mandal took the identity card, undertaking to get the transfer recorded. Th e card is still in the Mandal's custody. Siraj and Banu were given the card for their new house, which is still in the former occupier's name. They have been unable to get the transfer recorded. The electric connection in the former house is still in Siraj's name. Three months ago they had to pay z:.n outstanding bill of Rs. 175 which according to Banu, had been incurred by the new occupier.
55. The present house has a standpipe nearby for Municipal water supply. The supply according to Banu is erratic and there are fights over collecting water, Sometimes, when she canne t get.water at the municipal tap, she walk down to a place beyond the periphery of Ganeshnagar ani collects water from a nit which accumulates it from a burst water mains above. .
56. Balm's eldest son goes to a municipal school nearby, and the second one is due to enrol soon. Banu herself was educated as far as the 4th standard, and her husband up to the 7th.' She finds it difficult to make ends meet on their meagre income, especilally because of the heavy drain on it dr.e to her husband's drinking. She did not admit to taking any loans, but vaguely said that her parem.s help out occasionally, They live nearby in new Khadki, and her mother is a daily visitor on accour.t of the bidi-rolling activity.
57. Because of her family's experience in the matter of being compelled to change residence; Banu does not have a very high opinion of the Ganesh Nagar Mandal and its overall achievements, She does feel, though, that her neighbours are generally kind people and that there have never bee i
any tensions with them, She does not feel discriminated against on account of being a Muslim. She feels reasonably secure against eviction from Ganesh Nagar, and sees the identity cards as adequate guarantee oftenure, whatever be the problems due to her family's residence not being recorded. We asked her about the improvements she would like to make in her house, but she was not interested in discussing it because it was clearly beyound their means, and dismissed any talk about it as idle daydreaming.
B. Bibwewadi Case Studies (vii) Shendkar
58. The Shendkars came to live in the Bibwewadi sites and services scheme after being evicted from a hutment near the Swargate Octroi Post. The hutment was demolished and the Corporation offered them a "site" at Bibwewudi in lieu of this, at Rs. 18 per month for a platform 10'xlS'. On this, nine years ago, they built their first shelter, using only the material salvagad from the demolition of their earlier hut, and contributing their own labour.
59. Right from the aCy'1.,~Sm"Ul of the platform the Shendkars went about their task systematically. At Swargate octroi post they ran a little restaurant. This was not strictly legal, but they had managed

113
t? remain in business .bY showin~ 'consideration' to th~ appropriate PMC officials at the appropriate t~mes. They had ~ntentlOns of C~)lltmuIllgIII the ~ame business on the new site. So they acquire a platform nght onthe main road, as this would be the ideal location for suchan enterprises, As a precaution against the risk of losing this platform in possible road-widening operations at a later date a second platform immediately behind the first was acquired in the name of Mrs. Shendkars widow'ed brother who is a member of the household. By a twist of fate, the Shendkars soon discovered that becau l~ of the 'legality' of their new location, the operation of a restaurant was subject to Public Health regulations more stringent than had been applicable in the hutment at Swargate. The Public Health officials could no t look the other way, even for a consideration, and the enterprises had to be wound up within a year or so of its starting. While they had done good business, they could not comply with the Corporation's regulations regarding water supply and sanitation standards in public eating places.
60. As a result ofthis they were without any means of livelihood, and the entire family went to live in Mr. Shendkars village for a year or so. During this time Mr. Shendkar looked around for a job and finally found one in a brass foundry in Bhavani Peth, There he now earns Rs, 600 per month. H1s wife works as a domestic servant and cook at a number of houses in the neighbourhood, and earn ~ another Its. 200. The eldest son, aged 20, is an apprentice at a garage and brings in Rs. 100 per manti. The wido wed brother ofMrs. Shendkar transports children from the neighbourhood to and from schcol and earns between Rs. 200-225 per month, for eleven months in a year, besides a variable nominal income from odd jobs.
'61. The household consists of eight persons-Mr. & Mrs. Shendkar, their four sons and daughter, Mrs. Shendkar's brother, two dogs, a cat and three goats, the milk from which is consumed in t.ie household. The goats are housed in a CI sheet shelter built on the second platform mentioned above, This shelter is divided into two rooms, 6' X 10' and 9' X 10' respectively. Entry is through the former, accessible from the former, has been rented out to an old lady who pays as rent Rs. 18.00 per month, payable tv the Corporation for the platform. The Shendkars upgraded their own house (the one in front) two years ago. They brought in hired skilled labour from Mr. Shendkar's village in Velha Taluxa and offered their own services as helpers.
62. The new construction is of brick in mud mortar, plastered over in cement. It has two sto reys, the lower having a headroom ofseven feet and the upper an average headroom ofabout five feet. Ace. ss to the upper storey is through a cutout in the wooden floor, reached by a stepladder from the grou id floor. The upper floor also has a cantilevered balcony, projecting 2t feet beyond the front edge of t ae platform. The ground fioor is divided into two rooms. The front room is about 6' X 9' and the rear rocm is about i3' X 9' . The first of these is used as a sitting room and the second is a kitchen the latter las a side door leading to the open alley between the Shendkars house and the adjacent one. This space bas been corconed off by a hedge and serves as an extention to the kitchen". The ground floor is paved w.th the IPS tiooring which is standard on all the platforms provided by the Corporation. The upper flo or is in wooden planks, spanning width-wise across five wooden joists which project in front to support the balcony. The roof is of corrigated G.I. Sheets.
63. The upgradation described above cost the Shendkars Rs. 8,0001- two years ago. The amount was entirely borrowed. Mr. Shendkar took an interest free loan of Rs. 7,000 from his employer a id is now repaying it in instalments of Rs. 200 per month, which are deducted from his salary. Of this amount H.s. 4,000 are still to be paid. Mrs. Shendkar borrowed Rs. 1,000 from her various employers, This amount has been repaid.
64. Our respondents were Mrs. Shendkar and her brother, who came in after us. Mrs. Shendkar is born aid brought up in Pune, in Kasba Peth, and has studied up to the 7th standard. Her husband is illiterate and from an agricultural background. He knows writing only to the extent of being able to sign his name, and that he was taught by his wife. The house and the two members we met, give the impression of an ambitiously upward mobile family. Mrs. Shendkar admitted that they still aspire to go back to the old restaurant business, as soon as the loan is repaid and the legal restrictions can be OVerCOlTIo:l. They also seem to have plans to expand their living space by upgrading the hut on the platform at the back.
*Inside the kitchen there is little 'more' (Washing-cum-bathing space). Mrs. Shendkar mentioned that the community bathrooms are riot convenient to use because it involves walking some distance through the open for a bath or waslung clothes and utensils. This is all right where using was is concerned, hut not in the case of bathrooms. Thus I:l0st residents in the scheme do not use t he bathrooms provided,

II4 (viii) Gole
6~. The Gole family, consisting of an old couple, their two sons and two daughters, came to live on a'site' in the Bibwewadi Sites and Services Scheme in 1971, when their former residence, part of an 'unsafe' house in Ganesh Peth, was demolished, at the instance of the owner, at the peak of the monsoon that year.
66. The first house they built was in brick in mud mortar and had a corrugated. iron (GI) sheet roof. It costs about Rs. 1200-1300 then. Labour was hired at a hundred rupees. Old GI sheets were bought at Rs. 300. The rest was consumed by the walls, doors and windows. The internal space was sub divided by a partition wall running part of the way across the platform and set at about five feet from the front edge. '_
. 67. Funding for this came out of the sale of five tolas of gold (Rs. 960) and the liquidation of savings in the Post Office Savings Bank (Rs. 300), small improvements were done gradually over the years. The relatively major upgradation, if it can be called that, was done two years ago, atjacostof Rs.2,000. This included expenditure on fivetwooden joists at Rs, 250 these now sell 'at Rs. 300 each and nine new GI sheets for Rs, 900. Three old ones were reused. The improvements mainly consisted of the shifting back ofthe partition wall to accommodate a bed placed lengthwise, the addition of a loft over this space and the replacement of rusted and leaky GI sheets in the roof. A ketcha extension to the authorised platform, which had been added over the years, was widened to six feet and a low parapet seat was created to run around two sides of it. The house is not electrified.
'. 68. Funding for this upgradation was from Post office savings of Rs. 770 and the remainder through loans taken fro m various employers at whose houses Mrs. Gole works as domestic help.
69: Mr. Gole is 70, and a carpenter by trade. He works on a casual basis. Because of his age and poor health, he does not have steady' work. His wife, who was our interviewee, estimates that he is employed for about eight days in a month, and makes about Rs, 18 per day. She earns about Rs. 150 per month for her various jobs. Their eleder son failed his 10th standard examination and is engaged, at age 20 years, as an apprentice fitter at a garage. He receives a stipend of Rs. 90 per month, but the garage is facing closure and his job future uncertain. He has registered with the employment exchange. Earlier he worked with a building contractor's firm as an office boy, earning Rs. 150 per month. But he left the job because he found its demands out of proportion with the salary. The change to a skilled job also offered better prospects of future growth.
70. Because of the low income of the household and the all-round jobs insecurity of both the working males, Mrs. Gole finds it difficult to make ends meet. She also reflected an interesting attitudinal characteristic about the maintenance of the house. While she considered it the duty of the household to maintain whatever they' have built, she feels that the platform must be maintained by the PMC in its capacity as 'landlord' and because they have paid to the PMC an advance equivalent to three months' rent, which she believes is for minor maintenance and repairs. She pointed out to portions of the floor which were caved and cracked, and bitterly complained about the poor maintenance by the Corporation. She did not seem to have understood that the platform although rented was as' good as their own and that they had legaltenurial rights over it. She vaguely discussed the possibility of their having a right to space in whatever new construction might take place on the site of their old demolished house in Ganesh Peth but then dismissed the idea because she felt after' all they had been offered the present site in lieu of that and in any case the site of that house was still covered with the debris of demolition standing exactly as it had been ten years ago. . (ix) Paroatibai
71. We interviewed Par:vatibai at her recently (just a week earlier) upgraded house, The new structure consists of a single room covering the entire 10' x 15' base provided by the PMC in the sites and services scheme. The walls are in brick' in mud-mortar, plastered externally front and rear with cement, and internally all round in mud and cowdung, The side walls are due to be peinted in cement on the outside. The roof is in corrugated iron sheets (reused from the earlier house) resting on joists. There is no mezzanine or loft. The height at the ridge of the roof is about ten feet from the platform level. There is no washing place inside. Washing and bathing are done in the open space behind the house on a stone slab placed there specially for the purpose. All this work was done by hired labour, and except the roofing material, everything else was newly bought. The joists from the earlier structure, unshaped post in a state of decay, lay in front of the house. Parvatibai told. us that these would be used for constructing a cattle shed next to the house, to keep their bullocks in.

II5
72. Parvatibai has no idea of the expenditureJncurred on the .renovation, Her husband Madhu, had managed all that. She also knew that a loan had been arranged, but did not know about its source or the amount taken. (We wondered, whether he had sought a loan from the Hamal Panchayat-porters' organisation). .
The family consists of Parvatibai, Madlin and their two little children. They came to Bibwewadi in 1975, after being evicted from their hutment near Swargate ocoitr post. Their first house 011 the present site was a crudely built shelter of G-I sheets, wooden posts and joists.
73. Madhu is a carter, who has his own cart and bullocks. Parvatibai had no idea of his income, but could tell us that the maintenance of the bullocks alone costs Rs, 20-25 per day. Madhu has no fixed place or timings of work, nor a regular weekly holiday. All his wife could say, was that he leaves home around 7 a.m. and does not usually return until 10 p.m. Hegoes "somewhere in Bhawani Peth", Parvatibai devotes erse1f exclusively to the home, and is not gainfully employed. The house looked bare. There washo furniture Dot even a steel bed which is a piee of furniture most of the poor households have. There were no brass utensils ; if a household has any brass pots, they are generally nrranged neatly on shelves in the cooking area and displayed. proudly.
74. Not chaving succeeded in getting any concrete information from Paratibai, we rose to leave, with a ompliment to her on what a fine new house she had. At this point she confessed that she had feltequit alarmed by our arrival, thinking that we might be from the Corporation and were going to make inquiries about the new construction which migh1 result in putting her family into trouble.

APPENDIX HI
EVALUATION OF SITES AND SERVICES PROJECTS
117

EVALUATION OF SITES AND SERVICES PROJECTS
Introduction
1. Sites and Services projects are an intervention in the housing market to shift the supply of housing facilities in favour of the poor. Despite many problems this way of supplying shelter to the poor remains an effective mechanism to reach the poor. On the one hand it improves the quality of housing conditions for the poor and on the other enables the families to improve housing facilities as and when they can afford them. This makes the process of housing consolidation easy for the family and also spreads the demand for scarce building materials over number of years. In contrast, a massive conventional low cost housing programme would have generated high level of competition for procuring scarce materials in the market; leading to high prices, scarcities and speculation.
2. Further the sites 'and services projects if formulated properly can also be immune to large scale invasion by middle income-groups as these are not very suitable residential areas for them to live in. The project impact research done in HUDCO has also now tended to prove that ownership of affordable shelter has a healthy impact on the income and savings of the Poor beneficiary families.
3. The above advantages of sites and services projects assume that all the rules of the game are observed. In practice this is not so. This is so as brought out by detailed feedback whichis nowavaHable in respect of sites and services projects. In some cases adequate precautions are not taken at project design implementation or post allotment stages of the project. The disadvantages of this neglect emerge at project lev..el in many ways once the project gets going.
4. An attempt is made in the following paras to coalesce some of the evaluation results in respect of sites and Services projects;
Affordability and Accessibility Issues
5. The concept of affordability adopted in most of the sites and services is too simple. The usual way is to assume as to how much a family can pay for housing. The project authorities tend to feel satisfied if the hire-purchase instalment is either equal or lower than this amount. The evidence that the affotdability determined in this way is not adequate has become obvious on account of high default rates in cost recovery and high turnover of facilities at project level. This is particularly true in case of families where a female was the head of the family. Though one can argue that in some projects the high turnover of families and high delinquency rates need not necessarily be due to low affordability ofthe project but could be dueto low priority accorded to better housing by the poor families (hence they sell and go back to slums). The defaults in some cases have also resulted from the tradition of subsidising programmes for the poor. Once the sites are allotted and construction loans granted the beneficiaries sometimes emerge as pressure groups for concessions in payment or
, more facilities on subsidised basis. Despite these doubts, the level or delinquency rates and turnover of families remains an important yard stick to adjudge a part from other factors, the affordability level of the projects.
6. Even on a conceptual level the conventional concept of affordability adopted need not be foolproof. For example, if income eligibility considerations are known before hand the applicant families declare the same in order to become eligible. Further we tend to assume that the eligible families have regular income.. But in case of a families where a female is the head of the household or the-head of the family is aged etc. there is frequently no regular income. These households live on gifts or transfers of income from other families. It is also found that these families like casual workers have variable incomes. In one month they may have higher.incomes while in another month they may have lowe r than the required- income.
119

120
7. In addition, the affordability criteria is frequently based on the concept of ability to pay rather than the willingness to pay. The gap between the two could be wide depending upon circumstances. For example, i fthe housing supply is made available the families may be willing to pay more than what they are able to pay. However, when supply is made available, the families may be willing to pay less than they are actually able to pay. Further affordability is taken in too static a sense. The project may be affordable when formulated or announced but may be unaffordable when completed.
8. Thus determination of affordability is quite a complex task and cannot be encompassed by simple housing-income ratios. Income levels no doubt are essential but do not provide sufficient basis for assessing accessibility of low income families towards a project.
9. As in the case of affordability, the manifestations of an unaffordable project could take quite complex forms. Default in payments or sale of houses could be too simple as indices and can emanate from a complex set of factors. For example, if the family is unable to build the house as visualised or is actually Iivingin worse conditions than before or lives for too long in a partially built house the project is not affordable to it. Similarly if the family has to cut down significantly its essential consumption expenditure to pay for the site and the subsequent need to invest in construction then the shelter being offered. is not affordable to the family. .
10. International experience In implementing sites and services projects is also in line with these observations. lJi Senegal, for example, the families realised too late tliatthe house being constructed is costing them more than they can afford. In addition, time over-runs also increased the cost in Senegal to an extent that it eroded affordability, In Zambia sites and services projects have run into 80 per cent defaults in cost recovery. In Philippines they discovered that 20 per cent housing-income ratio tends towards being over-optimistic and in actual practice the families were not able to set aside visualised amounts towards housing etc. etc.
11. In view of the above, there is a need to carry out more research and project evaluation studies to identify intrinsic parameters of affordability/accessibility at the household level.
Project Design &Planning
12. Much more attention needs to be devoted to project design and planning. The projects at present tend to be more technical in shelter solutions than providing diverse/flexible options to the poor to help them solve their shelter problems. Standard designs are frequently distributed to the families to help them construct houses on this basis and on the sites allotted. This method is more for the convenience of the agency than for the families. Standard designs are easy to approve in contrast to those needing approval for modified designs.
13. Adequate attention is also not paid to construction methods adopted in the project design or to integrate it with other inputs i.e. local materials, self-help ofhired labour etc. Similarly the projects provide either individual or community facilities. No flexibility is provided to help - families graduate from one form to another according to its resource availability over a period oftime (individual vs. communal water supply). Further for convenience of layout planning plot sizes are fixed. disregarding each family's affordability in terms of regular income, gifts or motivation etc. Once project parameters are fixed families either have to fall in line or violate designs, standard plans etc,. This development seriously affects the quality of formal housing effort visualised by project designers for these informal groups.
14. The selection procedure adopted in project for identifying beneficiary farTliIies also tends to be too conventional. No personal attention is paid in selection of beneficiaries. Most of the time families are selected on income eligibility considerations. In this manner, as mentioned above, many females as head ofthe families, aged persons or casual workers get excluded as their incomes are irregular, uncertain and skewed . On the other hand, relatively better off families may become eligible on the basis of false documents ; as no home visits are made. .
15. The implementation strategies visualised in project design too need another look. For example, many projects make provision for material loans. As these are to be procured as per given rules -,
\.

I~l
and procedures ofthe nuthorities there-are frequent problems; In some cases this way of materialsupply unnecessarily necessitates use of more expensive materials. 'Given the freedom, the families could have made their own arrangement at much more speed, at low cost or even used local/substitute materials.
16. Further sites and services projects also make no provision for maintenance of community facilities, streets etc. In the absence of which, infrastructure tends to quickly deteriorate creating a bad precedent for popular participatio.nor replicability .ofprojects at other places. Failures of this type build resistance amongst people as well as planners.
Sites and Services and Concept of Progressive Housing Development
,17. The philosophy of providing sites and services to the poor is based on the idea of progressive housing development by the families. The advantages of this are that these projects :
(i) Cost-less to the families than either the public or even the private housing supply and on similar standards;
(ii) can help prolong the construction period by each family depending upon its stream or size ; of income over a period of time. . .
18. However, the planners have a tendency to shy away from giving total support in implemen-. tation of these projects, as they are not sure as to whether the agencies they lead will be able to make a success of these projects. This is especially so in some schemes the houses that have been built on the sites allotted are of low quality. While.in others the houses that have come up being of good construction quality the settlements have becomea-ttractive for relatively higher income groups. The results in both situations are unsatisfactory :in terms of their objectives.
19. Further as success of these .projects depends too much on mobilisation of the community the housing agencies which lack community development staff have shied away from either taking up the projects or to replicate the projects. In some cases the difficulties have emerged from an entirely different set of problems. For example in some projects the families started building houses with extra rooms than visualised in the project and later on ran into financial problems. There is also a tendency on the part of some families to go for expensive materials rather than use local materials. This has led in some cases to over-indebtedness of the family.
Popular Participation
20. Involvement of the beneficiaries in formulation as well as implementation of projects is necessary to :
(i) help dovetail the projects as per needs of the poor families ;
(ii) reduce construction Period;
(iii) make projects resource efficient;
(iv) help efficient cost recovery ; and
(v) reduce costs and help promote better maintenance of assets created under the projects etc.
21. However, very few agencies have been able to adopt full fledged community approach to housing projects. The reasons differ from agency to agency. In some cases planners at project design stage do not want to raise expectations of the people.andhence do not hold discussions. In other cases the agencies have neither trained staff nor resources to mount detailed participatory exercises at predesign stage of the project. Sometimes the planners feel that it is difficult to synthesise the opinions of the poor and their professional judgements. As a result they do not encourage communication between the people and themselves. Involvement of the Community in implementation of the project is felt to be still more difficult. Frequently labour contribution in digging of ditches or foundation work etc, is taken as equivalent to down payment. In some projects where self-help was mandatory the families could not participate as "wages lost" were more than work put in 'money terms'. The families thus resorted to hiring labour.

122
22. However, a lot depends on the social background of the people' who .are . allotted sites. If it is a homogeneous group (based either on religion caste' etc.) it is much easier to identify community leaders and even from construction groups..Howeverin case of heteroreneous groups it is found difficult .to generate popular response. As sites and services unlike sll; .n upgradation sehemes 'create new communities calls for much effort to generate conmmunity effoi to In some of the successful projects social, sports or music concert forums created to evoke popular participation in heterogeneous groups. Unfortunately mostof'the traditional housing agencies are neither equipped nor inclin ed enough to put in the.required scale ofeffort in this direction.
23. In addition to these problems at operational levelnumerous problems are' faced even at the conceptual Ievel, This is so as most of the time, the project agencies have no clear cut guidelines aa to what constitutes "popular participation'. As most of the factors which determine popular participation are predominantly attitudinal in nature,. these tend to .be too qualitative to be understood properly by all. At present wehave too little informationon these aspects. In the absr ace of clear cut guidelines the easier way that is adopted is t<1 leave some project components to the _)eople to do' it themselves. '
24. In viewofabove more research is needed to build up aviable relationship and ide ~tify parameters which are conceptually as well as operationally important towards popular participation in .sites and services projects. Further the contribution .of popular participation towards success of' the project has to be much more understood ifmore and more housing agencies have to adopt it on regular basis.
Project Impact ofSites andServices Projects
25. Surveysin HUDCO have shown that ownership of a house even by the poor Icads to healthy impact on income employment and health. However, what is more important is to," hat will be the impact of large scalesites and services solution at citylevel. For example if in a city a Si zeable population is to be covered under this scheme, then what impact this will have on the city is .still not clear. This is when people move from informal housing to formal housing their expectatior s tend to rise. In response to these rising expectations as well as demand for city servicesthe capacity of hecity authorities to supply the same is limited. The problem is no doubt being taken care of by link lng large scale sites and servicesprojects with programmes to augment overall availbility ofutilities at city level. But then this calls for willingness of the government to lay by more resources for financing urban development.
Results ofBvaluation Surveys by HUDCO-A Case Study
26. In the following paras an attempt is made to summarise the results of an evaluation survey done by HUDCO on a Sitesand ServicesProject financed in Chandigarh (Dadu Majra). The Chandigarh Survey was done in March, 1982. The project was sanctioned in January, 1979 and is situated on the west of Sector 38 in Chandigarh. The project helped develop 2712 sites. The all inclusive cost of each developed site was Rs, 2,600. Each site was provided with foundation and »linth platform ofone room (lO'X 10'), cooking platform (5.5' X. 7') bathing enclosure of 5' X 5' and WC of 4'X 3'. Each plot was serviced with water supply, electricity and sewerage connection. The monthly hirepurchase instalment was fixed at Rs, 19to be paid for 20 years.
27. The survey results .showed that 97 per cent of the allottees were living themselves and only 3per cent had let out their sites. The average age of the allottees was 42 years and family size. was six'. At least 64 per cent of the allottees were illiterate and 90 per cent of them belonged to Scheduled Caste/Scheduled Tribe families. 87 per cent ofthe allottees had monthly family imcome of Rs, 500 or below and another 13per cent were between Rs 301to Rs. 350 p.m,
28. All the allottees who were provided these sites previously lived in a slum. l'~ one of them in the past had the facility of cooking space, bath, electricity, potable water etc. Once allotted a site of their own Rs, 6000 was spent on an averages by the families..The' amount spent varied between Rs, 1500to Rs. 11,000. All those who undertook any. construction did so according to the technical guidelines laid down by Chandigarh Housing Board. The sources of funds for investment came from Banks (Rs.3000 each family @ 4 per cent), The other sources were own savings and support from relatives andfriends, etc. . . .
29. All the families found water supply, electricity, street light, drainage either as adequate or satisfactory. Further all the residents interviewe~iii.~~~~~~,~n with the project.
. /..'~' ,-1'"'__, "":::-'_ '-~
GMGIPMRND-L-z9 WH-S-I.Q A -eoo- .r. I?"":'-,r '-', -<.--'.::> .~\ . ~Ji ff • 'J ( " . "-j '\'
. rt .,,{ Ace, NoI!1i..£'j\-:-t \ ~, ..:,?atG ..J h.. _~.:, ~i1.. )1
'\;~ -; . -~/ . .lY '\;'. '-- .-' ,,*/
'.'.>. I.. I - -~-/ -..{ _/:,'~::'':' !) n A f\~_.r_' _