Task-Driven Color Coding - uni-rostock.de
8
Task-Driven Color Coding Christian Tominski Georg Fuchs Heidrun Schumann Institute for Computer Science University of Rostock {firstname.lastname}@informatik.uni-rostock.de Abstract Color coding is a widely used visualization method for scalar data. To generate expressive and effective visual representations, it is extremely important to carefully de- sign the mapping from data to color. In this paper, we de- scribe a color coding approach that accounts for the dif- ferent tasks users might pursue when analyzing data. Our task description is based on the task model of Andrienko & Andrienko [1]. We apply different color scales and in- troduce strategies to adapt the color mapping function to support tasks like comparison, localization, or identifica- tion of data values. Keywords—Visualization, Color, Task. 1 Introduction and Motivation Color coding is a fundamental visualization method for representing scalar values, and is therefore widely used in a large variety of application scenarios. Designing appro- priate color scales is an intricate step that influences the expressiveness and effectiveness of visual representations significantly. Appropriate in this context means that the color-coded visualization really supports analysts in de- riving assured statements about the underlying data. Ap- propriateness can only be achieved if characteristics of the data and the tasks of analysts are taken into account. There- fore, it is necessary to provide flexible color schemes that can be adapted to the data and task at hand. Generally, a color coding scheme can be characterized by a color mapping function f : D → C that maps data values D to colors from the color scale C. From liter- ature we know several approaches that address adequate definition of the color mapping function, or give guide- lines for the use of color scales. In this context, Cyn- thia Brewer’s ColorBrewer has to be mentioned as a pi- oneer work [4, 5, 8]. Brewer describes binary, qualita- tive, sequential, and diverging color scales for visualiza- tion on cartographic maps. A major point of Brewer’s work is that these scales are based on human perception, and that they have been evaluated for different output de- vices like CRT screens, TFT displays, or LCD projectors. However, the ColorBrewer was specifically designed for segmented maps; continuous data is not supported. Con- tinuous color scales are considered in the PRAVDAColor tool from Bergman et al. [2]. Additionally, the tool offers a rule-based mechanism to support users in choosing ap- propriate color scales. The mechanism is based on data characteristics (data type: ratio / interval data; spatial fre- quency: low / high) and visualization tasks (isomorphism, representation, segmentation, or highlighting). In Schulze- Wollgast et al. [12], the influence of data characteristics (e.g., the distribution of data values) on color coding is in- vestigated in more detail. Based on the extraction of sta- tistical meta-data like average, median, and extreme val- ues as well as skewness and quartiles, the color mapping function is adapted to be consistent with the characteristics of the data range. Schulze-Wollgast et al. further enrich the color-coded visualization by an expressive color leg- end, including a Box-Whisker plot to communicate data features. Furthermore, the problem of color coding for the purpose of visual comparison is discussed. While the color mapping function f usually employs linear interpo- lation, Hyun has experimented with nonlinear functions to improve interactive data exploration [9]. More general overviews on the color coding problem are given in [14] and [15], including aspects of basic vision and psychophysics, color reproduction, and color design. In this paper, we will discuss color coding with regard to the task at hand. Previous publications, like [2] or [12], address the design of color scales for specific tasks (e.g., isomorphic, segmentation, comparison), while others, like [10] or [16], just point out that the goal of the user has to be considered when using color coding. However, to the best of our knowledge, a systematic approach for a task-driven color coding still has not been published. We take on this issue and propose a generic view on the problem. Our work is based on the task description of Andrienko & Andrienko [1], which served as a good starting point to think about tasks and color-based visualization. To lay a common ground, we review aspects that influ- ence the design of color coding schemes in Section 2 and briefly introduce the task model in Section 3, where we
Transcript of Task-Driven Color Coding - uni-rostock.de

Task-Driven Color Coding
Christian Tominski Georg Fuchs Heidrun SchumannInstitute for Computer Science
University of Rostock{firstname.lastname}@informatik.uni-rostock.de
AbstractColor coding is a widely used visualization method for
scalar data. To generate expressive and effective visualrepresentations, it is extremely important to carefully de-sign the mapping from data to color. In this paper, we de-scribe a color coding approach that accounts for the dif-ferent tasks users might pursue when analyzing data. Ourtask description is based on the task model of Andrienko& Andrienko [1]. We apply different color scales and in-troduce strategies to adapt the color mapping function tosupport tasks like comparison, localization, or identifica-tion of data values.
Keywords—Visualization, Color, Task.
1 Introduction and MotivationColor coding is a fundamental visualization method for
representing scalar values, and is therefore widely used ina large variety of application scenarios. Designing appro-priate color scales is an intricate step that influences theexpressiveness and effectiveness of visual representationssignificantly. Appropriate in this context means that thecolor-coded visualization really supports analysts in de-riving assured statements about the underlying data. Ap-propriateness can only be achieved if characteristics of thedata and the tasks of analysts are taken into account. There-fore, it is necessary to provide flexible color schemes thatcan be adapted to the data and task at hand.
Generally, a color coding scheme can be characterizedby a color mapping function f : D → C that maps datavalues D to colors from the color scale C. From liter-ature we know several approaches that address adequatedefinition of the color mapping function, or give guide-lines for the use of color scales. In this context, Cyn-thia Brewer’s ColorBrewer has to be mentioned as a pi-oneer work [4, 5, 8]. Brewer describes binary, qualita-tive, sequential, and diverging color scales for visualiza-tion on cartographic maps. A major point of Brewer’swork is that these scales are based on human perception,and that they have been evaluated for different output de-vices like CRT screens, TFT displays, or LCD projectors.
However, the ColorBrewer was specifically designed forsegmented maps; continuous data is not supported. Con-tinuous color scales are considered in the PRAVDAColortool from Bergman et al. [2]. Additionally, the tool offersa rule-based mechanism to support users in choosing ap-propriate color scales. The mechanism is based on datacharacteristics (data type: ratio / interval data; spatial fre-quency: low / high) and visualization tasks (isomorphism,representation, segmentation, or highlighting). In Schulze-Wollgast et al. [12], the influence of data characteristics(e.g., the distribution of data values) on color coding is in-vestigated in more detail. Based on the extraction of sta-tistical meta-data like average, median, and extreme val-ues as well as skewness and quartiles, the color mappingfunction is adapted to be consistent with the characteristicsof the data range. Schulze-Wollgast et al. further enrichthe color-coded visualization by an expressive color leg-end, including a Box-Whisker plot to communicate datafeatures. Furthermore, the problem of color coding forthe purpose of visual comparison is discussed. While thecolor mapping function f usually employs linear interpo-lation, Hyun has experimented with nonlinear functions toimprove interactive data exploration [9].
More general overviews on the color coding problemare given in [14] and [15], including aspects of basic visionand psychophysics, color reproduction, and color design.
In this paper, we will discuss color coding with regardto the task at hand. Previous publications, like [2] or [12],address the design of color scales for specific tasks (e.g.,isomorphic, segmentation, comparison), while others, like[10] or [16], just point out that the goal of the user has to beconsidered when using color coding. However, to the bestof our knowledge, a systematic approach for a task-drivencolor coding still has not been published. We take on thisissue and propose a generic view on the problem. Our workis based on the task description of Andrienko & Andrienko[1], which served as a good starting point to think abouttasks and color-based visualization.
To lay a common ground, we review aspects that influ-ence the design of color coding schemes in Section 2 andbriefly introduce the task model in Section 3, where we
also identify the main aspects of task-driven color coding.In Section 4, we discuss the color coding problem in moredetail. We conclude with a short summary and an outlookon future work in Section 5.
2 Requirements for Color CodingA fundamental requirement for effective color coding is
that the color mapping function f has to be invertible. Thismeans that every data value (or every well-defined group ofdata values) is associated with exactly one color, and viceversa, every color represents a fixed range of data values.In other words, colors encoded from two different data val-ues should be visually distinguishable. On the other hand,visually similar colors imply that they represent data val-ues that are close to each other. Moreover, if the data’svalue range is given by a linear function, the color map-ping function has to be constructed in such a way that thecolor coding is perceived as linear as well; just linearlymapping the components of the color space in use is notsufficient, particularly when using the RGB color space.Otherwise, perceptual variations in the visual representa-tion do not express the true magnitude of variation in theunderlying data.
Besides these basic requirements, further aspects decideabout effectiveness of color coding. Telea identifies the fol-lowing factors to be relevant for color coding [16]:
Characteristics of the data: Statistical features, over-all distribution of data values, as well as data variationspeeds and domain sampling frequencies are data charac-teristics that should be considered when designing colorcoding schemes. For example, using a linear color map-ping function on a skewed data set will result in the major-ity of data values being compressed to a narrow range ofcolors. Depending on the task at hand, this can be disad-vantageous (see [12]).
Characteristics of tasks and goals: Different tasksand goals require different color coding schemes. A maindistinction here is whether the task requires the compari-son of exact values (i.e., quantitative analysis) or the judg-ment of qualitative differences. Furthermore, certain goalsmay lead to specific regions of interest in the data domain.These regions should be accentuated, for instance by usingbright, warm, and fully saturated colors. The appropriateselection of color scales according to four specific tasks isdiscussed in [2]. In Section 4, we will introduce our ap-proach to task-driven color coding.
Characteristics of the user: Although color coding isa commonly applied method, the capabilities and the cul-tural as well as professional background of users are onlyrarely considered to an adequate level. Individual colorperception varies from user to user, which makes it nec-essary to check the color perception capabilities of users
before presenting color-coded images [7]. For users suf-fering from color blindness, data values have to be mappedredundantly to visual variables others than color. An ex-ample for variance in the professional background is theplacement of blue/violet colors in a spectrum scale [10].In some fields these colors may be placed at the low endof the color scale (in order of increasing wavelength), inothers at the high end (in order of increasing frequency).
Characteristics of the output device: Different outputdevices use different systems to define and display colors.Thus, a color coding scheme being appropriate for display-ing data on a computer display might be inappropriate toshow the same data on printed materials. Therefore, thecolor scales of the ColorBrewer were evaluated for differ-ent output devices (see [4, 5]).
The aforementioned criteria address four questions:What is visualized (data), why and for whom is it visu-alized (task respectively user), and where is the outputdisplayed (device). The problem is that many visualiza-tions that use color to not consider these four questions toan adequate level. It is often the case that just basic colorcoding schemes are used, most prominently the classicrainbow color scale. However, such methods can lead to avariety of problems [3, 13]. Our goal is to shed some lighton more advanced color coding schemes. In particular, weinvestigate the why aspect in more detail and present ourpreliminary findings.
3 Specification of the Task at HandTask-driven color coding requires task descriptions as a
basis. Most early task descriptions are given as verbal listsof visualization goals, including identification, correlation,comparison, and others. These descriptions lack formal de-scription, and hence, concrete understanding of the taskscan vary. Recently, Andrienko & Andrienko proposed atask model that is based on formal definitions [1]. This al-lows for a precise view on visualization tasks. We believethat developing task-driven color coding based on a taskmodel with a formal background is a good initial choice.
The formalism behind the task model of Andrienko &Andrienko uses two basic notions: references, the spacewhere data values have been collected, and characteristics,the space of attributes that were collected. This distinctionis in line with the well-known distinction of independentvariables and dependent variables.
On its first level, the task model distinguishes twoclasses of tasks: elementary and synoptic tasks. Elemen-tary tasks address individual data elements. This may in-clude groups of data, but the main point is that data valuesare taken into account separately and are not consideredas a whole. Synoptic tasks, on the other hand, involve ageneral view and consider sets of values in their entirety.

Visualization tasks
Elementary tasks(on values)
Synoptic tasks(on sets)
Lookup Comparison Relation Seeking Connectional tasksDescriptive tasks
Direct Inverse
Homogeneousbehavior
Heterogeneousbehavior
Lookup Comparison Relation Seeking
Direct Inverse
Figure 1: Task typology (adapted from [1]).
Elementary tasks are further divided into lookup, com-parison, and relation seeking. The lookup task defines asearch for data characteristics. This includes both directand inverse lookup, depending on if references are givenand corresponding data values are sought (also referred toas identification), or data values are given and associatedreferences are of interest (also called localization). Rela-tion seeking tasks search for occurrences of relations speci-fied between data characteristics or references. In a broadersense, comparison can also be seen as relation seeking, butthe relations to be determined are not specified beforehand.Direct comparison tasks relate characteristics, whereas in-verse comparison tasks search for relations between refer-ences.
Synoptic tasks are divided into descriptive and connec-tional tasks. Descriptive tasks specify the properties of ei-ther a set of references or a set of characteristics. The firstcase belongs to the group of identification tasks. Here, aset of references is given, and the task is to find a patternthat describes the behavior of the given reference points.The second case belongs to the group of localization tasks.Here, a concrete pattern is given, and the task is to searchfor those reference points that exhibit the pattern. Besidesspecifying the properties of a set of characteristics or ref-erences, the comparison of those sets is of high relevance.As in the case of elementary tasks, we have to distinguishbetween direct and inverse comparison tasks, dependingon whether a set of references or a set of characteristicsis compared. Moreover, the synoptic task relation seek-ing considers two sets of characteristics or references tocome up with relationships between these sets. In contrastto descriptive tasks, connectional tasks establish connec-tions between at least two sets taking into account the rela-tional behavior of two or more variables. Depending on the
set of underlying references – either variables are consid-ered over the same set or over different sets of references –homogenous and heterogeneous behavior tasks are distin-guished.
The aforementioned tasks are arranged in a task topol-ogy, summarized in Figure 1. To achieve task-driven colorcoding, we have to identify color maps that are appropri-ate for the different tasks. The first-level categorizationof tasks draws a distinction between individual data val-ues and sets of data values. This can be reflected by ap-plying either continuous/discrete color scales, where eachdata value is encoded by a separate color, or segmentedcolor scales, where each color stands for a set of data val-ues. At the second level, the tasks lookup and comparisonare particularly of interest with regard to the color codingproblem (see [12]). The lookup task requires color scalesthat support accentuation of particular color values. In or-der to accomplish comparison tasks, all variables involvedin the comparison must be represented by a unified colorcoding scheme; perceptual separation of colors for the in-dividual variables is not the primary goal here. Usually,the same holds true for relation seeking and connectionaltasks. The third level addresses identification and local-ization tasks. Both problems demand for different colorscales: identification (direct lookup or direct comparison)requires recognizing characteristics as precisely as possi-ble, whereas localization (inverse lookup or inverse com-parison) requires easy recognition of those spatial refer-ences that exhibit certain characteristics of interest. In thelatter case, color coding schemes that support accentuationand de-accentuation are suitable. At the bottom line wehave to consider three alternatives to come up with an ini-tial approach to task-driven color coding:

Identification
Segmented
Unsegmented
Localization
Figure 2: Unsegmented and segmented color scales for identification and localization.
1. Individual values vs. sets of values,
2. Identification vs. localization.
3. Lookup vs. comparison, and
In the following section, we will discuss color codingschemes for these alternatives in more detail.
4 Color Coding for Specific TasksColor coding individual data values requires unseg-
mented color scales, that is, every color c ∈ C representsexactly on value in d ∈ D. In contrast to that, segmentedcolor scales should be used to encode groups of data val-ues, that is, every color in c ∈ C represents a subset D′ ⊂D. The specification of both of these types of color scalesis a well investigated problem [2, 8, 13]. Figure 2 showsexamples of unsegmented and segmented color scales forthe identification and the localization task. The segmentedcolor scale for identification represents five different valuesets. The color scales for localization are designed in sucha way that they support preattentive recognition of refer-ence areas of interest. The segmented color scale for local-ization supports a binary decision: Areas drawn yellowishmatch the selection criteria, other areas do not. The un-segmented color scale communicates a smooth selectionof reference areas comparable to smooth brushing [6].
Designing appropriate color maps for lookup and com-parison tasks requires additional effort. We will introducetwo new concepts for this purpose next.
4.1 Color Scales for the Lookup TaskLookup tasks are basically a search for concrete char-
acteristics or references. This search can be facilitatedby applying appropriate color coding schemes. While theinverse lookup task is relatively easy to handle, the de-sign of adequate color scales for direct lookup is intricate.Schulze-Wolgast et al. propose the extraction of statisticalmeta data to adapt a given color scale accordingly [12].The adaptation process includes three steps: 1) Expan-sion of the value range to be mapped onto the color scale
such that the lower and upper bounds are intuitive to inter-pret, 2) adjustment of control points of the color mappingfunction to improve the color coding for data-dependentsegmentation or highlighting, and 3) skewing of the colormapping function (e.g., applying logarithmic or exponen-tial mapping functions, rather than linear ones) to handledata ranges with special value distributions. Here, we in-troduce two approaches to improve color coding for thelookup task: histogram equalization and Box-Whisker plotadaptation. Both methods address the problem that certainvalue distributions can lead to situations where the major-ity of data values is represented by only a narrow rangeof colors. This is unfavorable for lookup tasks. By his-togram equalization and Box-Whisker plot adaptation, wespread the colors according to the data’s value distributionand achieve that more colors are distinguishable in denseparts of the data.
Histogram equalization: Histogram equalization wasoriginally introduced to improve the contrast of gray-scaleimages. The same concept can be used to adapt a givencolor scale according to the value distribution of the data athand, and thus, to improve the perceptibility of the color-coded visualization. The procedure can be described asfollows. First, the value range is subdivided into uniformbins, and the number of data values falling into the bins iscomputed. Second, the color scale is sampled accordingto the same uniform subdivision. The corresponding sam-ple points, which represent specific colors, are then shiftedbased on the computed cumulative frequencies. Finally, alinear color mapping function is applied to establish a con-tinuous color scale. As a result, more colors are providedfor those segments that contain a higher number of datavalues, making values in high density regions easier to dis-tinguish.
Box-Whisker plot adaptation: An alternative proce-dure to adapt the color coding to the characteristics of thevalue distribution is to utilize Box-Whisker plots. Box-Whisker-Plot adaptation subdivides the data range basedon quartiles and inter quartile range (IQR), which are com-monly accepted features to describe value distribution.Quartiles and IQR are more robust against outliers thanother statistical indicators. The Box-Whisker plot segmen-
1,0
0,75
0,5
0,25
0,0
q5
q4
q3q2
q1(a) (b)
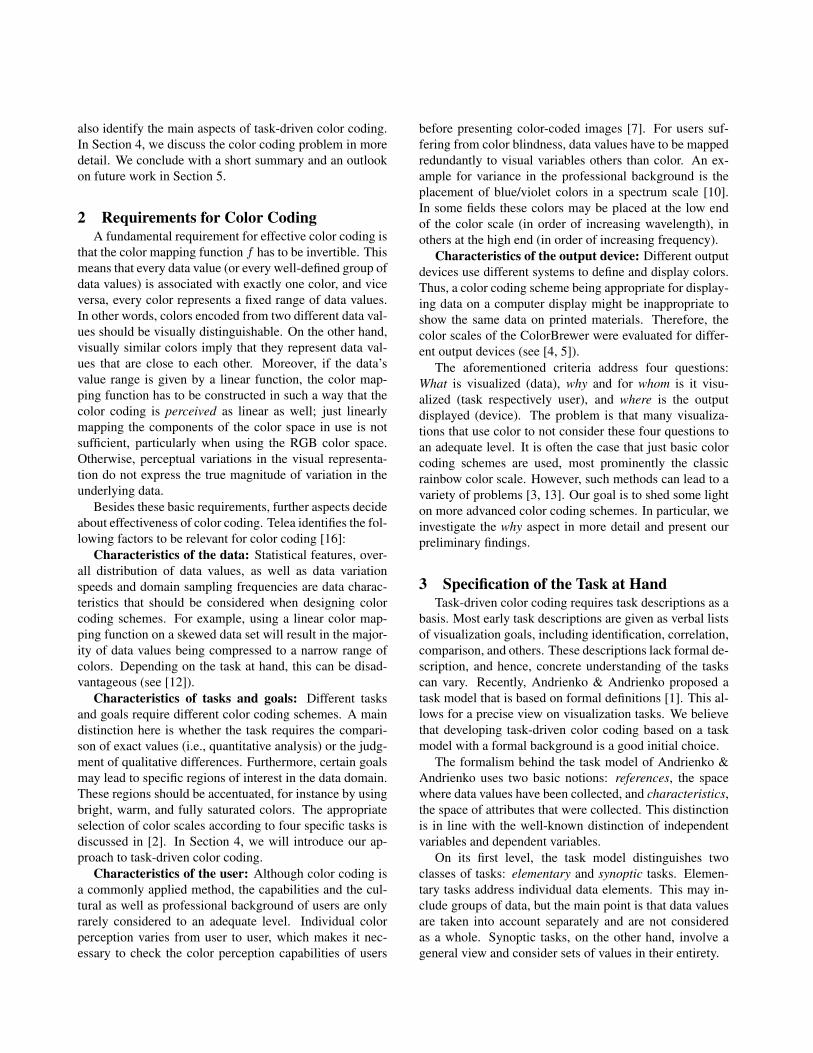
Figure 3: Adaptation of color maps. (a) Histogram equalized color map; (b) Box-Whisker plot adaptation; AdditionalBox-Whisker plots visualize the data distribution.
(a) (c)(b)
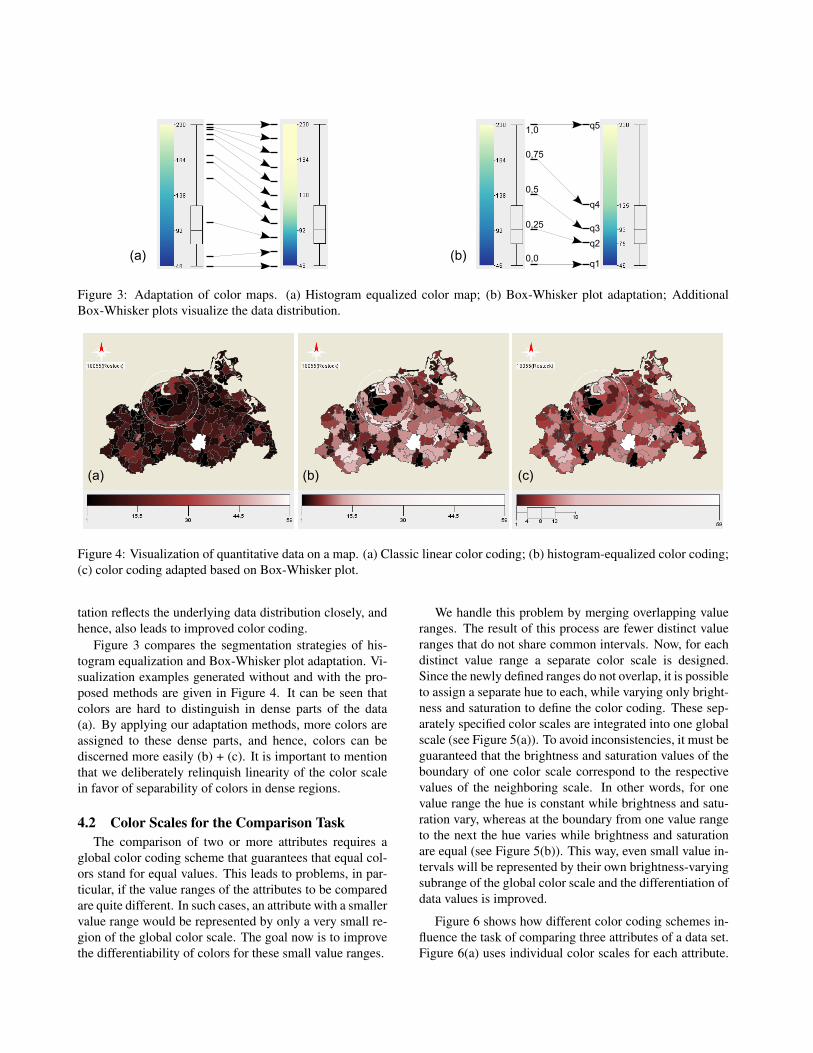
Figure 4: Visualization of quantitative data on a map. (a) Classic linear color coding; (b) histogram-equalized color coding;(c) color coding adapted based on Box-Whisker plot.
tation reflects the underlying data distribution closely, andhence, also leads to improved color coding.
Figure 3 compares the segmentation strategies of his-togram equalization and Box-Whisker plot adaptation. Vi-sualization examples generated without and with the pro-posed methods are given in Figure 4. It can be seen thatcolors are hard to distinguish in dense parts of the data(a). By applying our adaptation methods, more colors areassigned to these dense parts, and hence, colors can bediscerned more easily (b) + (c). It is important to mentionthat we deliberately relinquish linearity of the color scalein favor of separability of colors in dense regions.
4.2 Color Scales for the Comparison TaskThe comparison of two or more attributes requires a
global color coding scheme that guarantees that equal col-ors stand for equal values. This leads to problems, in par-ticular, if the value ranges of the attributes to be comparedare quite different. In such cases, an attribute with a smallervalue range would be represented by only a very small re-gion of the global color scale. The goal now is to improvethe differentiability of colors for these small value ranges.
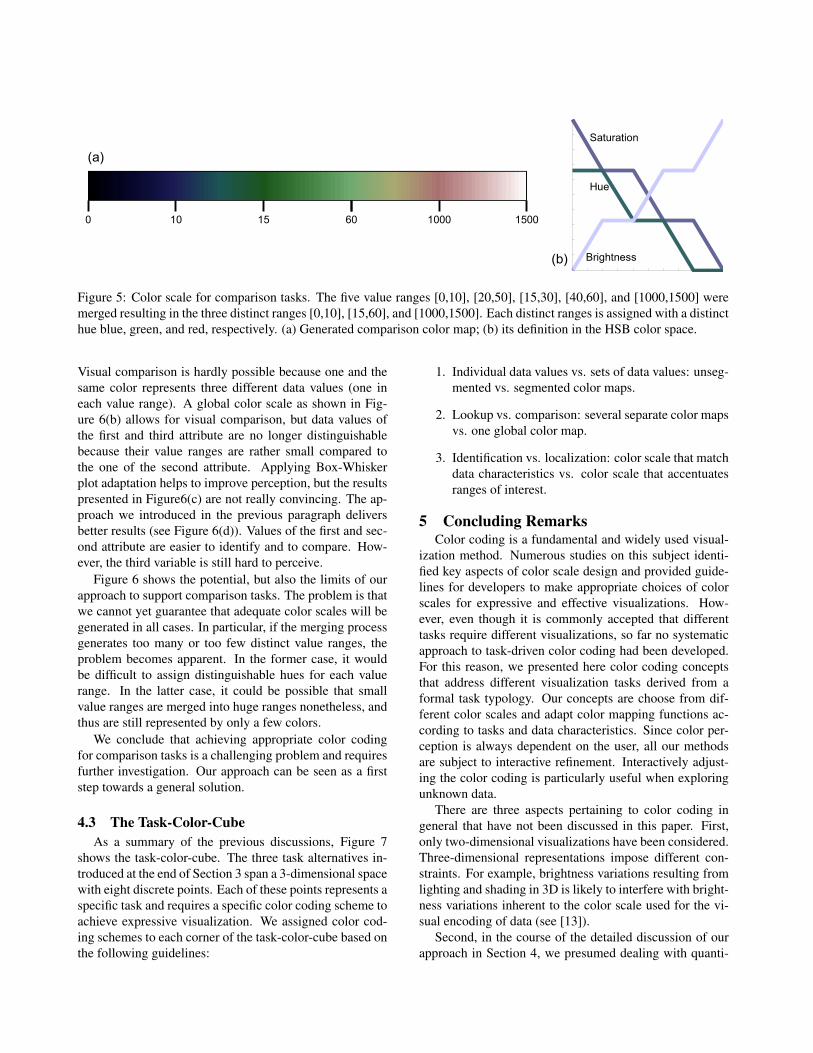
We handle this problem by merging overlapping valueranges. The result of this process are fewer distinct valueranges that do not share common intervals. Now, for eachdistinct value range a separate color scale is designed.Since the newly defined ranges do not overlap, it is possibleto assign a separate hue to each, while varying only bright-ness and saturation to define the color coding. These sep-arately specified color scales are integrated into one globalscale (see Figure 5(a)). To avoid inconsistencies, it must beguaranteed that the brightness and saturation values of theboundary of one color scale correspond to the respectivevalues of the neighboring scale. In other words, for onevalue range the hue is constant while brightness and satu-ration vary, whereas at the boundary from one value rangeto the next the hue varies while brightness and saturationare equal (see Figure 5(b)). This way, even small value in-tervals will be represented by their own brightness-varyingsubrange of the global color scale and the differentiation ofdata values is improved.
Figure 6 shows how different color coding schemes in-fluence the task of comparing three attributes of a data set.Figure 6(a) uses individual color scales for each attribute.
0 10 15 60 1000 1500
Hue
Saturation
Brightness(b)
(a)
Figure 5: Color scale for comparison tasks. The five value ranges [0,10], [20,50], [15,30], [40,60], and [1000,1500] weremerged resulting in the three distinct ranges [0,10], [15,60], and [1000,1500]. Each distinct ranges is assigned with a distincthue blue, green, and red, respectively. (a) Generated comparison color map; (b) its definition in the HSB color space.
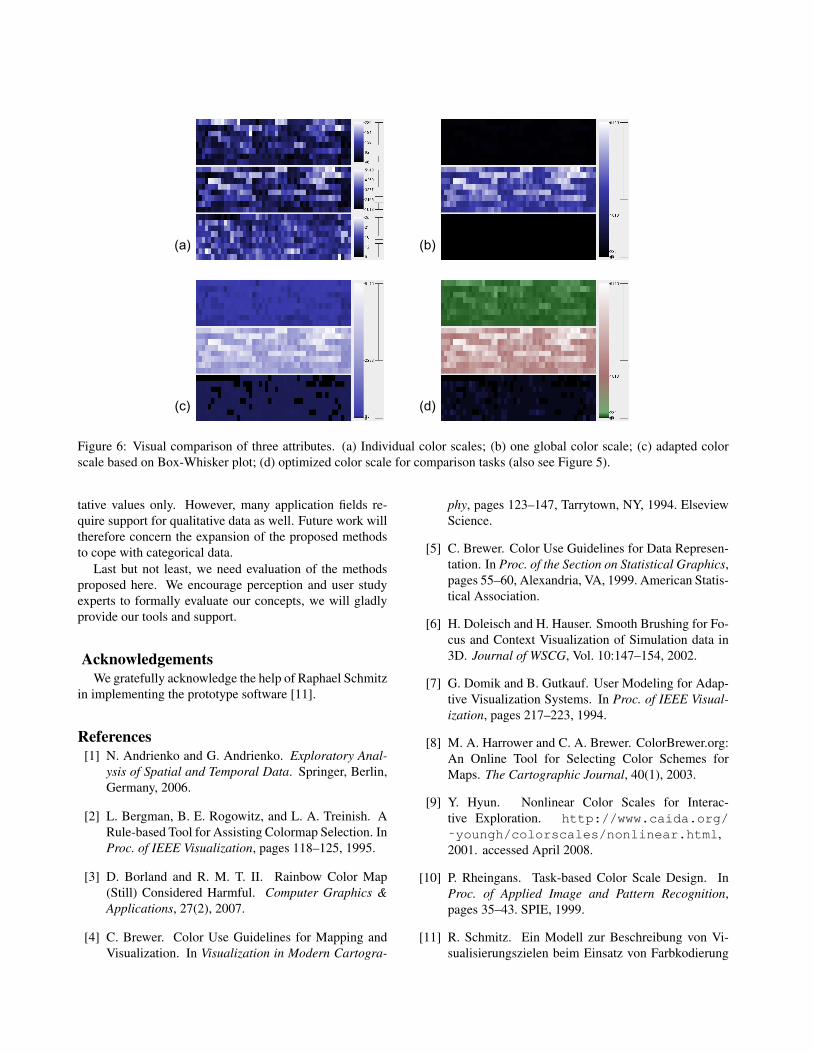
Visual comparison is hardly possible because one and thesame color represents three different data values (one ineach value range). A global color scale as shown in Fig-ure 6(b) allows for visual comparison, but data values ofthe first and third attribute are no longer distinguishablebecause their value ranges are rather small compared tothe one of the second attribute. Applying Box-Whiskerplot adaptation helps to improve perception, but the resultspresented in Figure6(c) are not really convincing. The ap-proach we introduced in the previous paragraph deliversbetter results (see Figure 6(d)). Values of the first and sec-ond attribute are easier to identify and to compare. How-ever, the third variable is still hard to perceive.
Figure 6 shows the potential, but also the limits of ourapproach to support comparison tasks. The problem is thatwe cannot yet guarantee that adequate color scales will begenerated in all cases. In particular, if the merging processgenerates too many or too few distinct value ranges, theproblem becomes apparent. In the former case, it wouldbe difficult to assign distinguishable hues for each valuerange. In the latter case, it could be possible that smallvalue ranges are merged into huge ranges nonetheless, andthus are still represented by only a few colors.
We conclude that achieving appropriate color codingfor comparison tasks is a challenging problem and requiresfurther investigation. Our approach can be seen as a firststep towards a general solution.
4.3 The Task-Color-CubeAs a summary of the previous discussions, Figure 7
shows the task-color-cube. The three task alternatives in-troduced at the end of Section 3 span a 3-dimensional spacewith eight discrete points. Each of these points represents aspecific task and requires a specific color coding scheme toachieve expressive visualization. We assigned color cod-ing schemes to each corner of the task-color-cube based onthe following guidelines:
1. Individual data values vs. sets of data values: unseg-mented vs. segmented color maps.
2. Lookup vs. comparison: several separate color mapsvs. one global color map.
3. Identification vs. localization: color scale that matchdata characteristics vs. color scale that accentuatesranges of interest.
5 Concluding RemarksColor coding is a fundamental and widely used visual-
ization method. Numerous studies on this subject identi-fied key aspects of color scale design and provided guide-lines for developers to make appropriate choices of colorscales for expressive and effective visualizations. How-ever, even though it is commonly accepted that differenttasks require different visualizations, so far no systematicapproach to task-driven color coding had been developed.For this reason, we presented here color coding conceptsthat address different visualization tasks derived from aformal task typology. Our concepts are choose from dif-ferent color scales and adapt color mapping functions ac-cording to tasks and data characteristics. Since color per-ception is always dependent on the user, all our methodsare subject to interactive refinement. Interactively adjust-ing the color coding is particularly useful when exploringunknown data.
There are three aspects pertaining to color coding ingeneral that have not been discussed in this paper. First,only two-dimensional visualizations have been considered.Three-dimensional representations impose different con-straints. For example, brightness variations resulting fromlighting and shading in 3D is likely to interfere with bright-ness variations inherent to the color scale used for the vi-sual encoding of data (see [13]).
Second, in the course of the detailed discussion of ourapproach in Section 4, we presumed dealing with quanti-
(b)(a)
(c) (d)
Figure 6: Visual comparison of three attributes. (a) Individual color scales; (b) one global color scale; (c) adapted colorscale based on Box-Whisker plot; (d) optimized color scale for comparison tasks (also see Figure 5).
tative values only. However, many application fields re-quire support for qualitative data as well. Future work willtherefore concern the expansion of the proposed methodsto cope with categorical data.
Last but not least, we need evaluation of the methodsproposed here. We encourage perception and user studyexperts to formally evaluate our concepts, we will gladlyprovide our tools and support.
AcknowledgementsWe gratefully acknowledge the help of Raphael Schmitz
in implementing the prototype software [11].
References[1] N. Andrienko and G. Andrienko. Exploratory Anal-
ysis of Spatial and Temporal Data. Springer, Berlin,Germany, 2006.
[2] L. Bergman, B. E. Rogowitz, and L. A. Treinish. ARule-based Tool for Assisting Colormap Selection. InProc. of IEEE Visualization, pages 118–125, 1995.
[3] D. Borland and R. M. T. II. Rainbow Color Map(Still) Considered Harmful. Computer Graphics &Applications, 27(2), 2007.
[4] C. Brewer. Color Use Guidelines for Mapping andVisualization. In Visualization in Modern Cartogra-
phy, pages 123–147, Tarrytown, NY, 1994. ElseviewScience.
[5] C. Brewer. Color Use Guidelines for Data Represen-tation. In Proc. of the Section on Statistical Graphics,pages 55–60, Alexandria, VA, 1999. American Statis-tical Association.
[6] H. Doleisch and H. Hauser. Smooth Brushing for Fo-cus and Context Visualization of Simulation data in3D. Journal of WSCG, Vol. 10:147–154, 2002.
[7] G. Domik and B. Gutkauf. User Modeling for Adap-tive Visualization Systems. In Proc. of IEEE Visual-ization, pages 217–223, 1994.
[8] M. A. Harrower and C. A. Brewer. ColorBrewer.org:An Online Tool for Selecting Color Schemes forMaps. The Cartographic Journal, 40(1), 2003.
[9] Y. Hyun. Nonlinear Color Scales for Interac-tive Exploration. http://www.caida.org/
˜youngh/colorscales/nonlinear.html,2001. accessed April 2008.
[10] P. Rheingans. Task-based Color Scale Design. InProc. of Applied Image and Pattern Recognition,pages 35–43. SPIE, 1999.
[11] R. Schmitz. Ein Modell zur Beschreibung von Vi-sualisierungszielen beim Einsatz von Farbkodierung

Comparison
UnsegmentedLookup
Segmented
Localization
Identification
Figure 7: The task-color-cube. The cube spans along the axes segmented vs. unsegmented, identification vs. localization,and lookup vs. comparison. Each corner of the task-color-cube represents a specific task instance and is associated with aparticular color coding scheme.
zur Darstellung multivariater Daten. Master thesis,University of Rostock, 2006. (in German).
[12] P. Schulze-Wollgast, C. Tominski, and H. Schumann.Enhancing visual exploration by appropriate colorcoding. In Proc. of International Conference in Cen-tral Europe on Computer Graphics, Visualization andComputer Vision (WSCG), Plzen, Czech Republic,Febr. 2005.
[13] S. Silva, J. Madeira, and B. S. Santos. There is Moreto Color Scales than Meets the Eye: A Review on
the Use of Color in Visualization. In Proc. of Inter-national Conference Information Visualisation (IV),2007.
[14] M. C. Stone. A Field Guide to Digital Color. A.K.Peters, 2003.
[15] M. C. Stone. Color in information display. In Tu-torial, IEEE Visualization Conference, Sacramento,USA, Oct. 2007.
[16] A. C. Telea. Data Visualization: Principles and Prac-tice. A K Peters, Ltd., 2007.