Task 5: Tourism Industry Overview - NCDOT
24
June 2013 www.camsys.com North Carolina I-95 Economic Assessment Study Task 5: Tourism Industry Overview prepared for North Carolina Department of Transportation prepared by Cambridge Systematics, Inc. technical memorandum
Transcript of Task 5: Tourism Industry Overview - NCDOT

June 2013 www.camsys.com
North Carolina I-95 Economic Assessment Study Task 5: Tourism Industry Overview
prepared for
North Carolina Department of Transportation
prepared by
Cambridge Systematics, Inc.
technical memorandum


technical memorandum
North Carolina I-95 Economic Assessment Study
Task 5: Tourism Industry Overview
prepared for
North Carolina Department of Transportation
prepared by
Cambridge Systematics, Inc. 730 Peachtree Street, NE, Suite 1000 Atlanta, GA 30308
date
June 2013


North Carolina I-95 Economic Assessment Study Task 5: Tourism Industry Overview
Cambridge Systematics, Inc. i 8739-007
Table of Contents
1.0 Task 5: Tourism Industry Overview ................................................................. 1 1.1 Introduction .................................................................................................... 1 1.2 Tourism Expenditures................................................................................... 1 1.3 Tourism Jobs ................................................................................................... 5 1.4 Major Attractions on I-95 Corridor and Coastal North Carolina ............ 8 1.5 Lodging Industry Statistics for I-95 Corridor .......................................... 10 1.6 Key Traveler Demographics for Eastern North Carolina ...................... 11


North Carolina I-95 Economic Assessment Study Task 5: Tourism Industry Overview
Cambridge Systematics, Inc. iii
List of Tables
Table 1. Selected Major Attractions on I-95 Corridor Annual Visitation ............... 9
Table 2. Selected Major Attractions in Coastal North Carolina Annual Visitation ........................................................................................................ 10
Table 3. Hotel Room Inventory, Rates, and Occupancy on I-95 .......................... 11
Table 4. Origins of Eastern North Carolina Overnight Travelers 2011 ............... 12
Table 5. Primary Purpose of Overnight Trips to Eastern North Carolina 2011 ................................................................................................................ 12
Table 6. Share of Overnight Travel to Eastern North Carolina by Season, 2011 ................................................................................................................ 13
Table 7. Primary Mode of Travel to Eastern North Carolina for Overnight Visitors 2011 ............................................................................... 13
Table 8. Average Trip Spending by Travelers to Eastern North Carolina 2011 ................................................................................................................ 14

North Carolina I-95 Economic Assessment Study Task 5: Tourism Industry Overview
Cambridge Systematics, Inc. v
List of Figures
Figure 1. Tourism Spending in the I-95 Corridor and Corridor’s Share of State 2000-2011 ............................................................................................. 2
Figure 2. Tourism Spending in the I-95 Corridor by County 2001 and 2011................................................................................................................ 3
Figure 3. Per Capita Tourism Spending in the I-95 Corridor, the Rest of North Carolina, and Eastern North Carolina (Noncoastal and Non-I-95 Counties) 2000 to 2011 ............................................................... 4
Figure 4. Per Capita Tourism Spending in the I-95 Corridor Counties, the Rest of North Carolina, and Eastern North Carolina (Noncoastal and Non-I-95 Counties) 2001 and 2011 .............................. 5
Figure 5. Tourism Jobs in the I-95 Corridor and Corridor’s Share of State 2000 to 2011 .................................................................................................. 6
Figure 6. Tourism Jobs in the I-95 Corridor by County 2001 and 2011 ................ 6
Figure 7. Tourism Jobs’ Share of Total Jobs in the I-95 Corridor, the Rest of North Carolina, and Eastern North Carolina (Noncoastal and Non-I-95 Counties) 2000 to 2011 ............................................................... 7
Figure 8. Tourism Jobs’ Share of Total Jobs in the I-95 Corridor by County 2001 and 2011 ................................................................................. 8


North Carolina I-95 Economic Assessment Study Task 5: Tourism Industry Overview
Cambridge Systematics, Inc. 1
1.0 Task 5: Tourism Industry Overview
1.1 INTRODUCTION The I-95 Corridor’s tourism industry is a key contributor to the region’s economy and has helped the region weather the recent recession by staying rel-atively stable compared to other industries. The corridor includes many, generally small- to medium-sized attractions that draw visitors from elsewhere in North Carolina, as well as from other, mainly East Coast states. While thou-sands of travelers visit destinations along the corridor on an annual basis and spend money in the region’s shops, recreational areas, museums, and restau-rants, a large portion of the travel expenditures coming into the region are from “pass-through” travelers on their way to and from places outside of the I-95 Corridor. This includes people traveling for leisure, business, or other personal reasons between the Northeast and the Southeast, as well as travelers destined for other locations in North Carolina. I-95 is not only a conduit for north-south travelers, but also is a jumping-off point for the major tourist attractions on the North Carolina coast that attract millions annually. The large volumes of pass-through travelers on I-95 are key to supporting the hotels along the corridor that have largely located at adjacent I-95 interchanges in order to serve this clientele. Similarly, these travelers also patronize local restaurants and retail establish-ments before moving on to more distant destinations.
1.2 TOURISM EXPENDITURES Visitors to the I-95 Corridor spend on a variety of goods, including lodging, food, retail, transportation, and amusement/recreation. On an annual basis, the North Carolina Department of Commerce’s Division of Tourism releases esti-mates of expenditures, jobs, and tax revenues associated with travel for the State and by county. For the purposes of these detailed estimates, the tabulations are based on travel activities associated with all overnight and day trips to places 50 miles or more, one way, from the traveler’s origin, and any overnight trips away from home in paid accommodations. These data would include both visitors to the I-95 region, as well as people who are stopping along the corridor and continuing their trips to other destinations.
Figure 1 shows total tourism expenditures (adjusted for inflation into 2011 dol-lars) in the I-95 Corridor for the 2000-2011 period and the region’s share of total visitor spending in North Carolina. In 2011, travel expenditures approached $1.3 billion, representing an increase of 30 percent compared to 2000. Tourism

North Carolina I-95 Economic Assessment Study Task 5: Tourism Industry Overview
2 Cambridge Systematics, Inc.
spending is cyclical with the economy, with expenditures in the I-95 Corridor showing drops both in the 2001 and 2009 recessions. During the 2000s, the I-95 Corridor’s share of total tourism expenditures in North Carolina grew from approximately 6 percent early in the decade to about 7 percent in 2009 and 2010.
Figure 1. Tourism Spending in the I-95 Corridor and Corridor’s Share of State 2000-2011
Source: North Carolina Department of Commerce, calculated by Cambridge Systematics, Inc.; tourism
spending is in 2011 dollars.
Figure 2 shows the increases in tourism spending by county in the I-95 Corridor for the 2001 to 2011 period. Cumberland and Johnston counties posted the larg-est gains, with 44 percent and 128 percent, respectively. The Fort Bragg expan-sion would have stimulated travel spending in Cumberland County, while the development of very large retail outlet malls in Johnston County also created a tourist draw. The Carolina Premium Outlets are located directly on the I-95 frontage road.
5.4%
5.6%
5.8%
6.0%
6.2%
6.4%
6.6%
6.8%
7.0%
7.2%
$-
$200
$400
$600
$800
$1,000
$1,200
$1,400
2000 2001 2002 2003 2004 2005 2006 2007 2008 2009 2010 2011
Corridor's Share of State
Tourism Spending (Millions of Dollars)
LEFT Axis: I-95 Corridor Tourism Spending RIGHT Axis: Share of State

North Carolina I-95 Economic Assessment Study Task 5: Tourism Industry Overview
Cambridge Systematics, Inc. 3
Figure 2. Tourism Spending in the I-95 Corridor by County 2001 and 2011
Source: North Carolina Department of Commerce, calculated by Cambridge Systematics, Inc.; tourism
spending is in 2011 dollars.
While travel expenditures in the I-95 Corridor have been growing and the region’s share of total North Carolina tourism spending is increasing, the region’s tourism industry remains small relative to the corridor’s population size. Figure 1.3 compares per capita tourism spending (total travel expenditures divided by population size) in the I-95 Corridor with the rest of North Carolina and a parallel corridor, “Eastern North Carolina,” that excludes both the corri-dor, as well as the tourism-intensive coastal counties. By contrasting per capita tourism spending between the I-95 Corridor and noncoastal Eastern North Carolina, the effects that I-95 may have on tourism spending may be discernible. As illustrated in Figure 3, there is a rising gap in per capita tourism spending between the two regions. By 2011, per capita travel expenditures in the corridor exceeded the noncorridor counties by about $300 (about 30 percent). Even in the early 2000s, the Corridor’s tourism spending was about $100 higher per capita than the comparison region. The rising gap may be due, in part, to the growth of major destinations along I-95, such as the Carolina Premium Outlets.
$0
$50
$100
$150
$200
$250
$300
$350
$400
$450
$500
Cumberland Nash Johnston Robeson Wilson Halifax Harnett Northampton
2001
2011

North Carolina I-95 Economic Assessment Study Task 5: Tourism Industry Overview
4 Cambridge Systematics, Inc.
Figure 3. Per Capita Tourism Spending in the I-95 Corridor, the Rest of North Carolina, and Eastern North Carolina (Noncoastal and Non-I-95 Counties) 2000 to 2011
Source: North Carolina Department of Commerce, calculated by Cambridge Systematics, Inc.; per capita
tourism spending is in 2011 dollars. The “noncoastal, non-I-95 counties” in this tabulation include Hertford, Gates, Bertie, Martin, Pitt, Greene, Wayne, Lenoir, Duplin, Sampson, Bladen, and Columbus counties.
Figure 4 shows per capita tourism spending by I-95 Corridor county for 2001 and 2011. Compared to the noncorridor grouping of Eastern North Carolina counties and the rest of North Carolina, the I-95 Corridor has experienced a sub-stantial increase in per capita travel expenditures in the past 10 years, growing from $1,022 in 2001 to $1,260 in 2011, a 23 percent increase. Nevertheless, spending in the rest of North Carolina, which includes the coastal areas, moun-tain destinations, and large cities, remained 57 percent higher ($1,983) than the corridor region in 2011. Cumberland and Johnston counties registered the strongest growth, while Nash and Halifax counties continue to have the highest relative per capita spending levels. Halifax County (Roanoke Rapids) is a tradi-tional lodging point on I-95 and Nash County is a gateway for visitors traveling to North Carolina’s Outer Banks, many of whom are traveling long distance. These roles help to stimulate higher relative levels of travel demand in the two counties.
$500
$750
$1,000
$1,250
$1,500
$1,750
$2,000
$2,250
2000 2001 2002 2003 2004 2005 2006 2007 2008 2009 2010 2011
I-95 Corridor Rest of North Carolina Eastern NC - Non-Coastal; Non-I-95

North Carolina I-95 Economic Assessment Study Task 5: Tourism Industry Overview
Cambridge Systematics, Inc. 5
Figure 4. Per Capita Tourism Spending in the I-95 Corridor Counties, the Rest of North Carolina, and Eastern North Carolina (Noncoastal and Non-I-95 Counties) 2001 and 2011
Source: North Carolina Department of Commerce, calculated by Cambridge Systematics, Inc.; per capita
tourism spending is in 2011 dollars. The “non coastal, non-I-95 counties” in this tabulation include Hertford, Gates, Bertie, Martin, Pitt, Greene, Wayne, Lenoir, Duplin, Sampson, Bladen, and Columbus counties.
1.3 TOURISM JOBS Similar to the I-95 Corridor’s rising travel expenditures experienced over the 2000-2011 period, tourism-related employment has been rising as well. In 2011, the industry directly employed over 11,500 people in the corridor region, an increase of about 1,000 jobs compared to 2000 (see Figure 5). Over the same period, the region’s share of total North Carolina employment related to travel also increased.
$-
$500
$1,000
$1,500
$2,000
$2,500
$3,000 20012011

North Carolina I-95 Economic Assessment Study Task 5: Tourism Industry Overview
6 Cambridge Systematics, Inc.
Figure 5. Tourism Jobs in the I-95 Corridor and Corridor’s Share of State 2000 to 2011
Source: North Carolina Department of Commerce, calculated by Cambridge Systematics.
Figure 6 shows the growth of tourism jobs on the I-95 Corridor by county from 2001 to 2011. Most corridor counties posted jobs increases over the period, but growth was led by Johnston and Cumberland counties. The two counties, which also led in travel industry expenditures growth, experienced employment increases of 760 and 600 jobs, respectively.
Figure 6. Tourism Jobs in the I-95 Corridor by County 2001 and 2011
Source: North Carolina Department of Commerce, calculated by Cambridge Systematics.
5.0%
5.2%
5.4%
5.6%
5.8%
6.0%
6.2%
6.4%
9,000
9,500
10,000
10,500
11,000
11,500
12,000
2000 2001 2002 2003 2004 2005 2006 2007 2008 2009 2010 2011
LEFT Axis: I-95 Corridor Tourism Jobs RIGHT Axis: Share of State
-
500
1,000
1,500
2,000
2,500
3,000
3,500
4,000
4,500
Cumberland Nash Johnston Robeson Wilson Harnett Halifax Northampton
2001
2011

North Carolina I-95 Economic Assessment Study Task 5: Tourism Industry Overview
Cambridge Systematics, Inc. 7
Figure 7 compares the I-95 Corridor with the rest of North Carolina and non-coastal Eastern North Carolina in the tourism industry’s share of total jobs. Since 2000, the travel industry’s share of all corridor jobs has held steady at just under 3 percent. The industry accounts for about 5 percent of jobs in the rest of North Carolina and has seen its share tick-up slightly during and since the 2009 recession. As mentioned earlier, the “rest of North Carolina” includes the State’s large cities and top coastal and mountain destinations, thus explaining the higher share of jobs within the travel industry compared to the I-95 Corridor. The share of jobs in tourism in North Carolina’s noncoastal Eastern region is consistently a percentage point lower than in the I-95 Corridor region, and the industry’s share of jobs within this region is very slowly eroding. As with the greater per capita expenditures, the higher share of tourism jobs on the I-95 Corridor may be attributable to Interstate proximity among other factors.
Figure 7. Tourism Jobs’ Share of Total Jobs in the I-95 Corridor, the Rest of North Carolina, and Eastern North Carolina (Noncoastal and Non-I-95 Counties) 2000 to 2011
Source: North Carolina Department of Commerce (tourism jobs); Bureau of Economic Analysis (total jobs
by county); calculated by Cambridge Systematics, Inc.
Tourism’s share of employment in most I-95 Corridor counties is holding steady (see Figure 8). Johnston County, however, has seen the travel-related share of total jobs increase significantly from 2.2 percent in 2001 to 3.6 percent in 2011. Tourism makes the largest relative contribution to jobs in Nash County, accounting for 6.6 percent of the county total in 2011. Interstate travel, as well as Rocky Mount’s role as regional center and gateway to the Outer Banks, support the tourism industry in Nash County.
1.0%
1.5%
2.0%
2.5%
3.0%
3.5%
4.0%
4.5%
5.0%
5.5%
2000 2001 2002 2003 2004 2005 2006 2007 2008 2009 2010 2011
I-95 Corridor Rest of North Carolina Eastern NC - Non-Coastal; Non-I-95

North Carolina I-95 Economic Assessment Study Task 5: Tourism Industry Overview
8 Cambridge Systematics, Inc.
Figure 8. Tourism Jobs’ Share of Total Jobs in the I-95 Corridor by County 2001 and 2011
Source: North Carolina Department of Commerce (tourism jobs); Bureau of Economic Analysis (total jobs
by county); calculated by Cambridge Systematics, Inc.
1.4 MAJOR ATTRACTIONS ON I-95 CORRIDOR AND COASTAL NORTH CAROLINA The I-95 Corridor region is a destination for business-, family-, and leisure-related travel. These types of travelers, as well as pass-through travelers (people only spending an evening on their way to other parts of North Carolina or the United States) bring in jobs and spending for the corridor area. Some of the primary generators of tourism are the corridor’s attractions that draw people mostly from around North Carolina and the East Coast. Visitors spend for admissions, lodging, food, transportation, and retail activities. Regions that possess multiple visitor attractions and venues that encourage longer stays can attract higher levels of tourism spending.
Table 1, drawing from multiple sources, provides an example of the significant tourist attractions and recent annual attendance in the I-95 Corridor region, ranging from museums, animal parks, recreational areas, and historic sites. Given their proximity, I-95 is a primary roadway for longer-distance travelers, both out-of-state and North Carolinians living beyond the corridor region, to reach these sites.
Compared to major attractions elsewhere in North Carolina (see Table 2, Major Attractions in Coastal North Carolina), those located on the I-95 Corridor tend to be small, attracting fewer than 100,000 visitors per year. The Airborne and Special Operations Museum in Fayetteville brings in close to 150,000 visitors per year and ranks among the top 30 tourist destinations in the State based on
0%1%2%3%4%5%6%7%8%
2001
2011

North Carolina I-95 Economic Assessment Study Task 5: Tourism Industry Overview
Cambridge Systematics, Inc. 9
attendance. The I-95 Corridor also is a jumping-off point for travelers to the North Carolina Coast, which attracts much higher visitor volumes. There are 11 destinations on or near the shore that draw 200,000 or more visitors per year, including close to 2 million to Cape Hatteras National Seashore. While these attendance figures certainly include visitors going to multiple destinations on the same trip, they do underscore a significant difference in magnitude between the I-95 Corridor destinations and North Carolina’s more intensively visited coastline attractions. It also suggests that the I-95 Corridor’s tourism industry is relatively more dependent on pass-through travelers, including those destined for the Outer Banks, as opposed to tourists with the corridor as a primary destination.
Table 1. Selected Major Attractions on I-95 Corridor Annual Visitation
Attraction City County Annual Visitors
Airborne and Special Operations Museum Fayetteville Cumberland 144,289
Medoc Mountain State Park Brinkleyville Halifax 102,580
Rocky Mount Sports Complex Rocky Mount Nash 74,332
Clemmons Educational State Forest Clayton Johnston 50,000
Historic Halifax Halifax Halifax 32,074
Vollis Simpson Windmill Farm Lucama Wilson 27,500
Sylan Heights Bird Park Scotland Neck Halifax 23,000
North Carolina Coastal Plains Museum Wilson Wilson 20,000
Nestus Freeman Roundhouse Museum Wilson Wilson 20,000
Imagination Station Science Museum Wilson Wilson 20,000
North Carolina Baseball Museum Wilson Wilson 12,000
Ava Gardner Museum Smithfield Johnston 12,000
Tobacco Farm Life Museum Kenly Johnston 10,000
Bentonville Battlefield State Historic Site Four Oaks Johnston –
Lake Gaston N/A Halifax, Northampton –
Royal Palace Theatre Roanoke Rapids Halifax –
Averasboro Battlefield Museum Dunn Harnett –
Imperial Centre for the Arts and Sciences Rocky Mount Nash –
Sources: Triangle Business Journal (American City Business Journals), March 22, 2012 and various local
sources, including interviews with convention and visitors bureaus. This list intends to represent the major attractions in the region and the relative magnitude of annual attendance. However, it should not be viewed as a comprehensive capture of all significant tourism venues in the region.

North Carolina I-95 Economic Assessment Study Task 5: Tourism Industry Overview
10 Cambridge Systematics, Inc.
Table 2. Selected Major Attractions in Coastal North Carolina Annual Visitation
Attraction City County Annual Visitors
Cape Hatteras National Seashore Manteo Dare 1,960,711
Fort Macon State Park Atlantic Beach Carteret 757,700
Fort Fisher State Historic Site Kure Beach New Hanover 601,366
Cape Lookout National Seashore Sea Level Township Carteret 508,116
Wright Brothers National Memorial Kill Devil Hills Dare 485,622
North Carolina Aquarium at Fort Fisher Kure Beach New Hanover 411,487
North Carolina Aquarium at Pine Knoll Shores Pine Knoll Shores Carteret 381,498
North Carolina Maritime Museum Beaufort Carteret 292,789
Fort Raleigh National Historic Site Manteo Dare 283,478
North Carolina Aquarium at Roanoke Island Manteo Dare 256,186
Battleship North Carolina Wilmington New Hanover 199,498
Tryon Palace New Bern Craven 175,853
Moores Creek National Battlefield Currie Pender 58,118
Sources: Triangle Business Journal, March 22, 2012 and U.S. National Park Service. This list intends to
represent the major attractions in the region and the relative magnitude of annual attendance. However, it should not be viewed as a comprehensive capture of all significant tourism venues in the region.
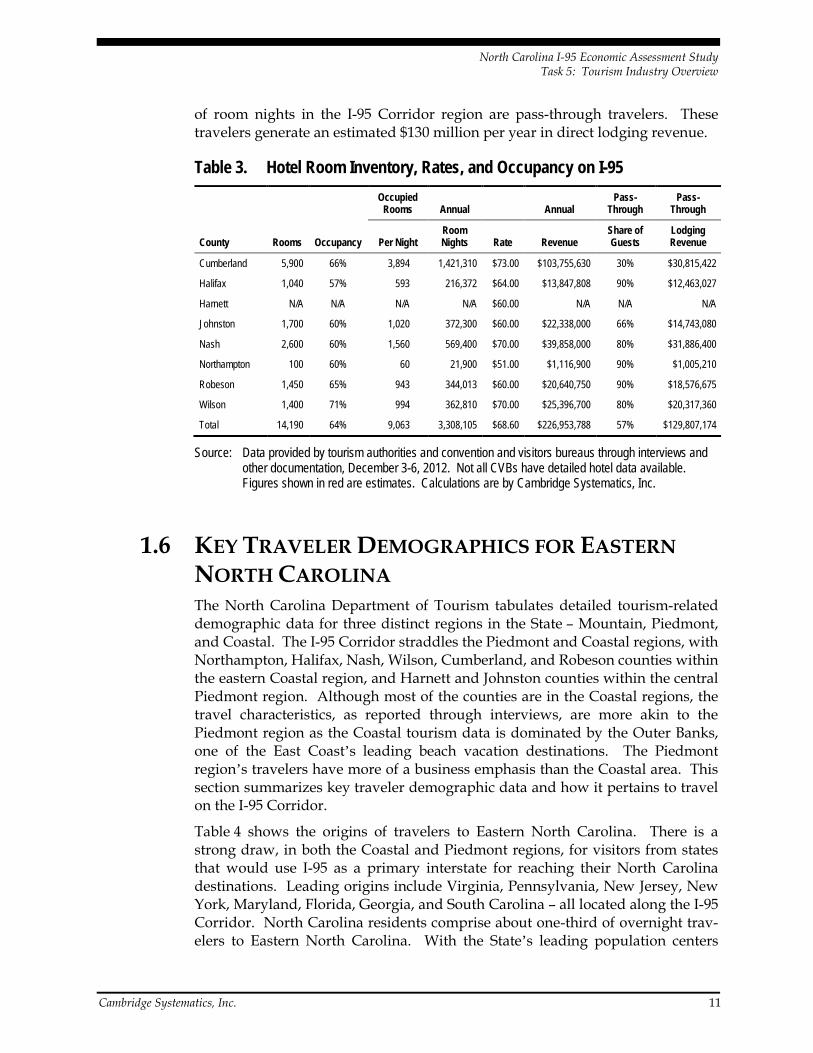
1.5 LODGING INDUSTRY STATISTICS FOR I-95 CORRIDOR Information about the I-95 Corridor’s lodging industry was obtained from indi-vidual tourism authorities and convention and visitors bureaus (CVB). In total, there are over 14,000 hotel rooms in the eight counties located on the corridor. Average occupancy generally ranges from 60 to 70 percent, for a corridor-wide average of approximately 64 percent. Based on occupancies and average rates, the corridor’s hotels generate an estimated $227 million in revenue per year (these data correspond to late 2011 through late 2012) from 3.3 million annual room nights.
Tourism and CVB directors were asked in interviews to estimate the share of room nights that are for travelers passing through on I-95. Most counties esti-mated that these types of guests account for between 80 and 90 percent of room nights. In Johnston County, the estimate was lower, 66 percent, because a num-ber of hotels serve the I-40 corridor. Cumberland County had the lowest share of hotel nights associated with pass-through guests, 30 percent, because a smaller portion of its rooms are located along the highway, and instead, many serve the Fort Bragg market 10 miles to the west. Based on the data made avail-able from the interviews and CVB director estimates, approximately 57 percent
North Carolina I-95 Economic Assessment Study Task 5: Tourism Industry Overview
Cambridge Systematics, Inc. 11
of room nights in the I-95 Corridor region are pass-through travelers. These travelers generate an estimated $130 million per year in direct lodging revenue.
Table 3. Hotel Room Inventory, Rates, and Occupancy on I-95
Occupied
Rooms Annual Annual Pass-
Through Pass-
Through
County Rooms Occupancy Per Night Room Nights Rate Revenue
Share of Guests
Lodging Revenue
Cumberland 5,900 66% 3,894 1,421,310 $73.00 $103,755,630 30% $30,815,422
Halifax 1,040 57% 593 216,372 $64.00 $13,847,808 90% $12,463,027
Harnett N/A N/A N/A N/A $60.00 N/A N/A N/A
Johnston 1,700 60% 1,020 372,300 $60.00 $22,338,000 66% $14,743,080
Nash 2,600 60% 1,560 569,400 $70.00 $39,858,000 80% $31,886,400
Northampton 100 60% 60 21,900 $51.00 $1,116,900 90% $1,005,210
Robeson 1,450 65% 943 344,013 $60.00 $20,640,750 90% $18,576,675
Wilson 1,400 71% 994 362,810 $70.00 $25,396,700 80% $20,317,360
Total 14,190 64% 9,063 3,308,105 $68.60 $226,953,788 57% $129,807,174
Source: Data provided by tourism authorities and convention and visitors bureaus through interviews and other documentation, December 3-6, 2012. Not all CVBs have detailed hotel data available. Figures shown in red are estimates. Calculations are by Cambridge Systematics, Inc.
1.6 KEY TRAVELER DEMOGRAPHICS FOR EASTERN NORTH CAROLINA The North Carolina Department of Tourism tabulates detailed tourism-related demographic data for three distinct regions in the State – Mountain, Piedmont, and Coastal. The I-95 Corridor straddles the Piedmont and Coastal regions, with Northampton, Halifax, Nash, Wilson, Cumberland, and Robeson counties within the eastern Coastal region, and Harnett and Johnston counties within the central Piedmont region. Although most of the counties are in the Coastal regions, the travel characteristics, as reported through interviews, are more akin to the Piedmont region as the Coastal tourism data is dominated by the Outer Banks, one of the East Coast’s leading beach vacation destinations. The Piedmont region’s travelers have more of a business emphasis than the Coastal area. This section summarizes key traveler demographic data and how it pertains to travel on the I-95 Corridor.
Table 4 shows the origins of travelers to Eastern North Carolina. There is a strong draw, in both the Coastal and Piedmont regions, for visitors from states that would use I-95 as a primary interstate for reaching their North Carolina destinations. Leading origins include Virginia, Pennsylvania, New Jersey, New York, Maryland, Florida, Georgia, and South Carolina – all located along the I-95 Corridor. North Carolina residents comprise about one-third of overnight trav-elers to Eastern North Carolina. With the State’s leading population centers

North Carolina I-95 Economic Assessment Study Task 5: Tourism Industry Overview
12 Cambridge Systematics, Inc.
located to the west of the I-95 Corridor, a relatively lower number of in-state travelers would use I-95 to reach their destinations. However, the North Carolina travelers headed to the Outer Banks may use lodging areas in the vicinity of I-95, such as those in Nash County (Rocky Mount), on their trips to the beach.
Table 4. Origins of Eastern North Carolina Overnight Travelers 2011
Coastal Percent Piedmont Percent
North Carolina 38% North Carolina 32%
Virginia 15% Virginia 8%
Pennsylvania 8% South Carolina 7%
New Jersey 4% Georgia 7%
New York 4% Florida 6%
Ohio 4% New York 5%
Maryland 3% Ohio 4%
Florida 3% Tennessee 3%
California 2% Pennsylvania 3%
Georgia 2% Other 26%
Other 17%
Source: North Carolina Division of Tourism, Film and Sports Development, North Carolina Department of Commerce, “2011 North Carolina Regional Travel Summary,” June 2012.
The purpose of visitor trips to Eastern North Carolina is primarily for leisure (Table 5), although the Piedmont region has a far larger share of business travel-ers (20 percent compared to 4 percent for the Coastal region). The Piedmont region includes North Carolina’s largest business centers, while the Coastal region includes a large share of the State’s leading leisure destinations.
Table 5. Primary Purpose of Overnight Trips to Eastern North Carolina 2011
Travel Purpose Coastal Piedmont
Leisure 93% 71%
Business 4% 20%
Other 3% 10%
Source: North Carolina Division of Tourism, Film and Sports Development, North Carolina Department of Commerce, “2011 North Carolina Regional Travel Summary,” June 2012.
Reflecting the preponderance of leisure travel to the Coastal region, summer is by far the largest tourism season in the Coastal area. Bus tour data compiled at the North Carolina Visitor Center on I-95 just south of the Virginia border

North Carolina I-95 Economic Assessment Study Task 5: Tourism Industry Overview
Cambridge Systematics, Inc. 13
corroborates this, with a far higher number of bus tours occurring in the warmer months. By comparison, the more business-oriented Piedmont region is more evenly balanced between seasons. (Table 6).
Table 6. Share of Overnight Travel to Eastern North Carolina by Season, 2011
Season Coastal Piedmont
Winter 7% 21%
Spring 22% 20%
Summer 50% 33%
Fall 21% 25%
Source: North Carolina Division of Tourism, Film and Sports Development, North Carolina Department of Commerce, “2011 North Carolina Regional Travel Summary,” June 2012.
Travel to the Coastal region is much more oriented to autos than overnight travel to the Piedmont region. The Piedmont includes three major airports, with many travelers reaching the area for business purposes from around the coun-try. In contrast, the Coastal region is more dependent on cars, with people coming to the area for longer stays and needing a vehicle to reach the major beaches and other attractions that stretch over a length of 300 miles. Based on the travel origination data, a large number of beach travelers are likely using the I-95 Corridor for a segment of their trips from northern, Mid-Atlantic states.
Table 7. Primary Mode of Travel to Eastern North Carolina for Overnight Visitors 2011
Travel Mode Coastal Piedmont
Auto 91% 79%
Air 7% 17%
Other 2% 4%
Source: North Carolina Division of Tourism, Film and Sports Development, North Carolina Department of Commerce, “2011 North Carolina Regional Travel Summary,” June 2012.
Trip spending is higher in North Carolina’s Coastal region as stays tend to be longer and party-size tends to be larger than for the Piedmont region (Table 8). If trip duration is affected by congestion for visitors using I-95 to reach North Carolina destinations, it would have an effect on average trip spending. If some travelers shift their travel plans entirely from North Carolina destinations due to either higher costs or congestion levels degrading from the experience, then these spending levels would represent potential losses to the State from foregone trips. Day travelers (who spend far less per trip), however, are more sensitive to congestion levels and costs in their trip planning than overnight travelers who

North Carolina I-95 Economic Assessment Study Task 5: Tourism Industry Overview
14 Cambridge Systematics, Inc.
are much more likely to have traveled longer distances for their trips to North Carolina destinations
Table 8. Average Trip Spending by Travelers to Eastern North Carolina 2011
Traveler Spending Coastal Piedmont
Overnight Trip $1,003 $542
Day Trip $293 $143
Source: North Carolina Division of Tourism, Film and Sports Development, North Carolina Department of Commerce, “2011 North Carolina Regional Travel Summary,” June 2012.


![Task Model and Task Ontology for Intelligent Tourist ... · ontology-based intelligent tourism-information system using tourism domain ontology [7]. Lam et al. (2006) introduced an](https://static.fdocuments.net/doc/165x107/5f09e8c37e708231d42915bb/task-model-and-task-ontology-for-intelligent-tourist-ontology-based-intelligent.jpg)