
TARIFFS AND GROWTH IN THE LATE 19TH CENTURY printed paper.pdf · TARIFFS AND GROWTH IN THE LATE...
28
TARIFFS AND GROWTH IN THE LATE 19TH CENTURY Kevin H. O’Rourke The paper estimates the correlation between tariffs and economic growth in the late 19th century, in the context of three types of growth equation: unconditional convergence equa- tions; conditional convergence equations; and factor accumulation models. It does so for a panel of ten countries between 1875 and 1914. Tariffs were positively correlated with growth in these countries during this period. Economic theory is ambiguous as regards the relationship between trade policy and growth. The growth literature of the past decade has produced an impressive array of models in which protection can either increase or reduce long run growth rates (Grossman and Helpman, 1991; Rivera-Batiz and Romer, 1991; Stokey, 1991; Young, 1991). Such theoretical ambiguity invites empirical research. While new growth theory is ambiguous on the subject, the new empirical growth literature has produced a consensus that free trade is positively asso- ciated with growth, based on evidence from the late 20th century (but see Rodrı ´guez and Rodrik (1999) for a sceptical review of the literature). The clear message which emerges from cross-country studies such as Harrison (1996), Lee (1993) and Sachs and Warner (1995) is that protection has slowed growth in the late 20th century; a conclusion bolstered by more detailed studies of countries, or entire regions such as Latin America, which have experimented with import-substitution policies (e.g. Taylor, 1998). However, what is true of the late 20th century is not necessarily true of earlier periods. Theory identifies off-setting effects of protection on the growth rate, which leaves open the possibility that different effects may predominate in different epochs. In a recent paper, Vamvakidis (1997) has introduced a note of historical caution into the literature, finding that correlations between trade and growth do indeed differ between periods. In particular, while he confirms that a positive correlation between openness and growth charac- terised the twenty years between 1970 and 1990, there was no such correlation in the 1950s and 1960s. Moreover, the correlation between tariffs and growth was positive in the 1930s. Vamvakidis argues that individual countries could have benefited from protection in a decade when unemployment was high, and other countries were already adopting protection. The late 19th century is a period to which proponents of protection have The Economic Journal, 110 (April ), 456–483. # Royal Economic Society 2000. Published by Blackwell Publishers, 108 Cowley Road, Oxford OX4 1JF, UK and 350 Main Street, Malden, MA 02148, USA. [ 456 ] I am particularly grateful to Kevin Denny, Anthony Murphy and Jeff Williamson for many helpful discussions, and to Chris Hanes and Cormac O ´ Gra ´da for extensive comments on an earlier draft; I also thank Bill Collins, Giovanni Federico, Evanna McGilligan of the Canadian Embassy in Dublin, Ian McLean, Michael Roche of the Australian Embassy in Dublin and Alan Taylor for making data available to me; and Bill Collins, Colm Harmon, Morgan Kelly, Elhanan Helpman, Alan Taylor, Athanasios Vamvakidis, two anonymous referees and seminar participants at Harvard and Yale for helpful comments. The usual disclaimer applies.
Transcript of TARIFFS AND GROWTH IN THE LATE 19TH CENTURY printed paper.pdf · TARIFFS AND GROWTH IN THE LATE...

TARIFFS AND GROWTH IN THE LATE 19TH CENTURY�
Kevin H. O'Rourke
The paper estimates the correlation between tariffs and economic growth in the late 19thcentury, in the context of three types of growth equation: unconditional convergence equa-tions; conditional convergence equations; and factor accumulation models. It does so for apanel of ten countries between 1875 and 1914. Tariffs were positively correlated with growth inthese countries during this period.
Economic theory is ambiguous as regards the relationship between tradepolicy and growth. The growth literature of the past decade has produced animpressive array of models in which protection can either increase or reducelong run growth rates (Grossman and Helpman, 1991; Rivera-Batiz and Romer,1991; Stokey, 1991; Young, 1991). Such theoretical ambiguity invites empiricalresearch.
While new growth theory is ambiguous on the subject, the new empiricalgrowth literature has produced a consensus that free trade is positively asso-ciated with growth, based on evidence from the late 20th century (but seeRodrõÂguez and Rodrik (1999) for a sceptical review of the literature). The clearmessage which emerges from cross-country studies such as Harrison (1996),Lee (1993) and Sachs and Warner (1995) is that protection has slowed growthin the late 20th century; a conclusion bolstered by more detailed studies ofcountries, or entire regions such as Latin America, which have experimentedwith import-substitution policies (e.g. Taylor, 1998).
However, what is true of the late 20th century is not necessarily true ofearlier periods. Theory identi®es off-setting effects of protection on the growthrate, which leaves open the possibility that different effects may predominatein different epochs. In a recent paper, Vamvakidis (1997) has introduced anote of historical caution into the literature, ®nding that correlations betweentrade and growth do indeed differ between periods. In particular, while hecon®rms that a positive correlation between openness and growth charac-terised the twenty years between 1970 and 1990, there was no such correlationin the 1950s and 1960s. Moreover, the correlation between tariffs and growthwas positive in the 1930s. Vamvakidis argues that individual countries couldhave bene®ted from protection in a decade when unemployment was high,and other countries were already adopting protection.
The late 19th century is a period to which proponents of protection have
The Economic Journal, 110 (April), 456±483. # Royal Economic Society 2000. Published by BlackwellPublishers, 108 Cowley Road, Oxford OX4 1JF, UK and 350 Main Street, Malden, MA 02148, USA.
[ 456 ]
� I am particularly grateful to Kevin Denny, Anthony Murphy and Jeff Williamson for many helpfuldiscussions, and to Chris Hanes and Cormac OÂ GraÂda for extensive comments on an earlier draft; I alsothank Bill Collins, Giovanni Federico, Evanna McGilligan of the Canadian Embassy in Dublin, IanMcLean, Michael Roche of the Australian Embassy in Dublin and Alan Taylor for making data availableto me; and Bill Collins, Colm Harmon, Morgan Kelly, Elhanan Helpman, Alan Taylor, AthanasiosVamvakidis, two anonymous referees and seminar participants at Harvard and Yale for helpfulcomments. The usual disclaimer applies.
often pointed as offering evidence in support of their position. In particular,the United States and Germany both adopted protectionist policies, andexperienced strong growth, arguably linked to the development of infantindustries behind high tariff barriers. Surprisingly, however, there have beenrelatively few quantitative cross-country studies of the effects of protection ongrowth in this period; while those which do exist have typically relied uponfairly crude correlation analysis.
This paper goes further, by estimating the correlation between tariffs andgrowth in the late 19th century in the context of three types of growthequation: unconditional convergence equations; conditional convergenceequations, associated with Mankiw et al. (1992); and factor accumulationmodels of the type estimated by Taylor (1996). The analysis uses data for tendeveloped countries between 1875 and 1913: Australia, Canada, Denmark,France, Germany, Italy, Norway, Sweden, the United Kingdom, and the UnitedStates. While there are inevitably problems with some of these data, hopefullythe method represents an advance on earlier work in this area. The ®ndingsare quite robust, and may come as a surprise to some.
Section 1 recalls the main features of late 19th century tariff policy in theten countries considered here. Section 2 reviews the literature on late 19thcentury tariffs and growth, while Section 3 presents empirical evidence on thelink between the two. Section 4 tries to interpret this evidence in the light ofthe existing historical literature, while Section 5 concludes with some quali®ca-tions and suggestions for future research.
1. Late 19th Century Tariff Policies
The evolution of European trade policies between 1860 and 1913 is wellknown.1 The Franco-British trade agreement of 1860 initiated a wave ofcommercial treaties involving all the main European powers. The inclusion ofthe most-favoured-nation clause into these treaties ensured that concessionswere rapidly generalised, and Europe moved swiftly towards free trade. Theturning point came in the late 1870s and 1880s, when cheap New World andRussian grain ¯ooded Europe (Kindleberger, 1951; O'Rourke, 1997). Notsurprisingly, this undermined agricultural support for free trade, although inseveral countries (e.g. Sweden) cleavages emerged between smaller, grain-using farmers specialising in animal husbandry, and larger, grain-producingfarmers. Moreover, agricultural protection often triggered a reversion towardsindustrial protection. Thus, in Germany, where rye-producing Junkers werepowerful, Bismark's 1879 `marriage of iron and rye' afforded protection toboth agriculture and industry. In France, the protectionist breakthrough istypically taken to be the MeÂline tariff of 1892; Italy introduced moderate tariffsin 1878, and rather more severe tariffs in 1887 (Federico and Tena, 1998);
1 This section draws on O'Rourke and Williamson (1999, ch. 6), who in turn largely follow Bairoch(1989), the standard reference on the topic.
# Royal Economic Society 2000
[ A P R I L 2000] 457T A R I F F S A N D G R O W T H I N T H E L A T E 1 9 T H C E N T U R Y

Sweden adopted agricultural protection in 1888, much earlier than Norway,where farm sizes tended to be smaller than in Sweden, and export interests(shipping, timber and ®shing) were politically powerful.
Of the major Western European powers, only Britain adhered to free tradeprinciples, which may re¯ect the diminished role and political clout ofagriculture in the ®rst industrial nation. Denmark, as is well known, alsoadhered to free trade in agriculture throughout the grain invasion, engagingin a radical structural adjustment in the process. Whether this Danish responsewas due to the size distribution of farms, a high degree of social cohesion, theGerman defeat of 1864, or other factors, remains a topic of considerableinterest (Kindleberger, 1951).
In Europe, therefore, protection was in the ®rst instance agricultural,although industrial protection followed in several countries, and the netimpact on the allocation of resources between town and country remains to bedetermined. In the New World, no such ambiguity as to protection's overallsectoral impact exists: the regions of recent settlement were agriculturalexporters. Thus, their tariffs were designed to provide `infant' industries withprotection from European competition. In the United States, the Civil Warbrought about a large increase in tariffs, as part of the attempt to ®nance thewar effort. After the War, tariffs remained high, a result not only of Republicandomination of Congress, but also of the combination of speci®c duties andfalling import prices between the 1870s and 1890s (Irwin, 1998). Canada alsochose to protect its manufacturing industries, especially after 1878, when theConservatives were elected on a `National Policy' platform aiming `to select forhigher rates of duty those [goods] that are manufactured or can be manufac-tured in the country'.2 In Australia, ®nally, some colonies opted for protection(e.g. Victoria), while others (e.g. New South Wales) opted for free trade. By1893, after a succession of tariff increases, the maximum Victoria tariff ratesstood at 45% (Siriwardana, 1991, p. 47). The ®rst federal tariff of 1902 was acompromise between protectionist and free-trading colonies, but federalprotection was greatly strengthened in 1906 and 1908.
2. Late 19th Century Tariffs and Growth: Sources and Methods
Over the last twenty years, a greater range of national accounts data hasbecome available to economic historians seeking to explore the correlationbetween tariffs and growth. This paper exploits those data, as summarised inAngus Maddison's most recent book on the subject (Maddison, 1995). Inconjunction with national sources, Maddison's data make it possible toestimate conventional growth equations using PPP-adjusted GDP data that areconsistent across countries and across time.
Previous authors had to make do with country-speci®c national accountsdata, that have in some cases been superseded by more recent estimates. Thebest known investigation of the link between tariffs and growth in the late 19th
2 Leonard Tilley, the new Finance Minister, speaking in 1879 (cited in McDiarmid, 1946, p. 161).
458 [ A P R I LT H E E C O N O M I C J O U R N A L
# Royal Economic Society 2000

century probably remains Bairoch (1972), updated and expanded as Bairoch(1976), and summarised in Bairoch (1993). His strategy was to compareaggregate growth rates in free trade and protectionist periods, for the majorEuropean countries. For example, using the work of Marczewski, Toutain,LeÂvy-Leboyer and Crouzet, he examined the growth rates of French agricul-tural, industrial and total output in the free trade era of 1860±91, as comparedwith the protectionist periods 1824±59 and 1892±1913. Sectoral and aggregategrowth rates were lower during the free trade period, and especially the growthrate of agricultural output. Moreover, innovation was if anything slower duringthe free trade period: Bairoch's conclusion was that free trade was bad forFrench growth.
Broadly speaking, the same picture emerged when Bairoch examined otherContinental countries, although there were important exceptions (most nota-bly, German industrial and aggregate output grew more rapidly during theliberal period, de®ned for that country as 1862±79). On the other hand, theleading European economy, Britain, did relatively well during the 1860s and1870s: for Bairoch, liberalism was associated with divergence, not convergence.
Bairoch's pioneering work can be criticised on several grounds. First, themethod relies on a post hoc ergo propter hoc logic: differences in growth ratesbetween periods are ascribed to differences in trade regimes, when otherfactors might have been important. Second, the method requires decidingwhat constituted the `free trade' and `protectionist' eras in different Europeancountries. This is not always obvious; for example, Bairoch takes the MeÂlinetariff of 1892 as marking the end of the `liberal interlude' in France, althoughwheat duties were raised signi®cantly in 1885 and 1887. Different starting andend points for the liberal period, which inevitably re¯ect an element ofjudgement, would produce different growth rates.
The second comparative, quantitative study of which I am aware is Capie(1983), whose results are summarised in a later survey (Capie, 1994). Capieargues that there is no evidence that tariffs boosted growth in late 19th centuryEurope. First, average tariffs (i.e. the ratio of customs duties to total imports)were fairly low in all countries bar Russia, and there was not much variation intariffs across countries. `Protection does not appear to have been suf®cientlyhigh to make any signi®cant impact on performance' (Capie, 1983, p. 9).Second, simple country-by-country regressions of growth rates on tariffs, usingannual data from Germany, Italy, the United Kingdom and Russia, found norelationship between tariffs and growth.
Vamvakidis (1997) ®nds little or no relationship between tariffs and growthbetween 1870 and 1910, in a simple bivariate framework. However, he does®nd that the Spearman rank correlation coef®cient (which eliminates thein¯uence of extreme observations) between average tariffs and growth, usingdecade averages for 11 countries, is positive: 0.345, with a t-statistic of 2.438.
Finally, Foreman-Peck (1995) uses decadal data for an unbalanced panel ofup to 18 European countries between 1860 and 1910, to estimate an `eclectic'model of the level (rather than the growth rate) of output per capita,expressed as a system of equations. His reduced form estimates indicate that
2000] 459T A R I F F S A N D G R O W T H I N T H E L A T E 1 9 T H C E N T U R Y
# Royal Economic Society 2000
average tariffs were negatively related to output per capita; structural equationssuggest that the result is due to the fact that output per capita was negativelyrelated to agriculture's share of employment, and that the latter variable waspositively related to tariffs. Foreman-Peck's interpretation is that tariffs werebiassed towards (low-productivity) agriculture, of which more later; an alter-native interpretation is that the grain invasion provoked higher tariffs in moreagricultural economies (O'Rourke, 1997).
This paper aims to improve on previous studies, in three ways. First, unlikeBairoch and Capie, I use Maddison's (1995) PPP-adjusted GDP data.3 Second,unlike Bairoch, Capie and Vamvakidis, I control for the other forces thattheory says should affect growth when estimating the impact of protection.4
Third, the growth equations estimated here are more directly comparable withthe late 20th century literature cited in the introduction, than are Foreman-Peck's output level equations.
3. Tariffs and Growth: Some Cross-country Evidence
My data set covers ten countries, three in the New World (Australia, Canadaand the United States) and seven in Europe (Denmark, France, Germany,Italy, Norway, Sweden and the United Kingdom). For each country, I have dataon real GDP, the GDP de¯ator, population, agricultural land endowments, theshare of agricultural output in GDP, school enrollments, investment rates,imports as a share of GDP, tariff rates, and coal consumption. The data coverthe period 1875±1914, and are expressed as 5-yearly averages.
Working with late nineteenth century data naturally necessitates compro-mises. Theory suggests that I should be examining the behaviour of GDP perworker, not per head of population, but labour force data are not available forall countries on an annual basis. School enrollment rates are simply the totalnumber of pupils in primary and secondary schools, divided by the totalpopulation: cohort-speci®c enrollment rates would clearly be preferable. WhenI run factor accumulation models, in which the growth of GDP per head isrelated to the growth in endowments per head, I am forced to use coalconsumption as a proxy for the capital stock, since the latter are unavailable(following Collins et al., 1997 and Vamvakidis, 1997). This short cut does atleast have a venerable pedigree: see Landes (1969, p. 293). As in previousstudies, average tariffs are simply de®ned as the ratio of customs duties to totalimports, of which more below. When estimating land endowments and enroll-ment rates, I am occasionally forced to rely on interpolation where data aremissing. Appendix 1 provides the details.
Table 1 gives the raw data on tariffs, while Table 2 reports regressions of
3 Foreman-Peck and Vamvakidis used earlier versions of the Maddison data, for example that givenin Maddison (1991).
4 In common with the late 20th century literature, I simply enter my measure of protection as anadditional explanatory variable, and am thus estimating a reduced form relationship between protec-tion and growth. However, this paper speculates at some length (in Section 4) about the possiblemechanisms that might have linked tariffs and growth in the late 19th century.
460 [ A P R I LT H E E C O N O M I C J O U R N A L
# Royal Economic Society 2000
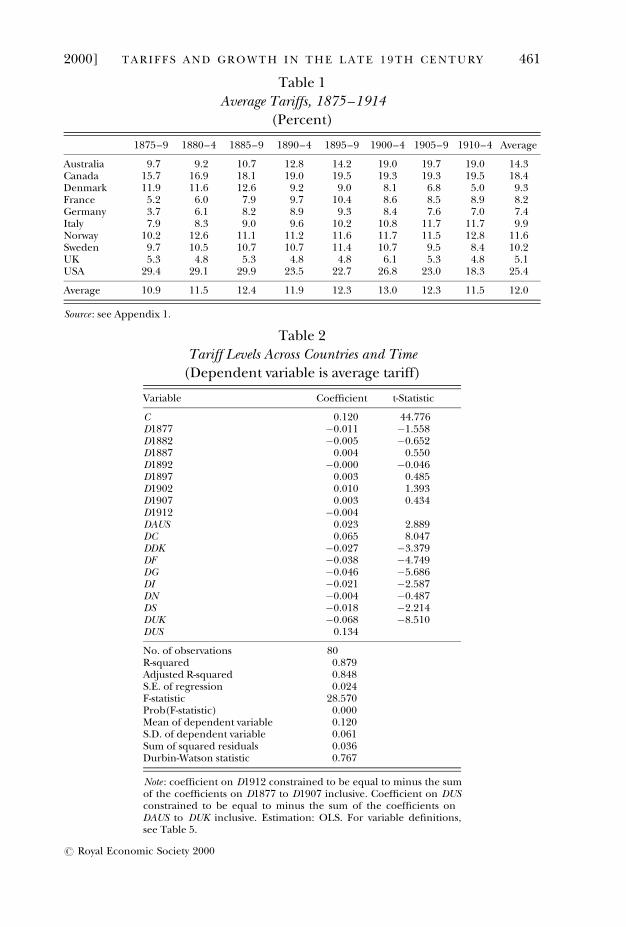
Table 1Average Tariffs, 1875±1914
(Percent)
1875±9 1880±4 1885±9 1890±4 1895±9 1900±4 1905±9 1910±4 Average
Australia 9.7 9.2 10.7 12.8 14.2 19.0 19.7 19.0 14.3Canada 15.7 16.9 18.1 19.0 19.5 19.3 19.3 19.5 18.4Denmark 11.9 11.6 12.6 9.2 9.0 8.1 6.8 5.0 9.3France 5.2 6.0 7.9 9.7 10.4 8.6 8.5 8.9 8.2Germany 3.7 6.1 8.2 8.9 9.3 8.4 7.6 7.0 7.4Italy 7.9 8.3 9.0 9.6 10.2 10.8 11.7 11.7 9.9Norway 10.2 12.6 11.1 11.2 11.6 11.7 11.5 12.8 11.6Sweden 9.7 10.5 10.7 10.7 11.4 10.7 9.5 8.4 10.2UK 5.3 4.8 5.3 4.8 4.8 6.1 5.3 4.8 5.1USA 29.4 29.1 29.9 23.5 22.7 26.8 23.0 18.3 25.4
Average 10.9 11.5 12.4 11.9 12.3 13.0 12.3 11.5 12.0
Source : see Appendix 1.
Table 2Tariff Levels Across Countries and Time
(Dependent variable is average tariff)
Variable Coef®cient t-Statistic
C 0.120 44.776D1877 ÿ0.011 ÿ1.558D1882 ÿ0.005 ÿ0.652D1887 0.004 0.550D1892 ÿ0.000 ÿ0.046D1897 0.003 0.485D1902 0.010 1.393D1907 0.003 0.434D1912 ÿ0.004DAUS 0.023 2.889DC 0.065 8.047DDK ÿ0.027 ÿ3.379DF ÿ0.038 ÿ4.749DG ÿ0.046 ÿ5.686DI ÿ0.021 ÿ2.587DN ÿ0.004 ÿ0.487DS ÿ0.018 ÿ2.214DUK ÿ0.068 ÿ8.510DUS 0.134
No. of observations 80R-squared 0.879Adjusted R-squared 0.848S.E. of regression 0.024F-statistic 28.570Prob(F-statistic) 0.000Mean of dependent variable 0.120S.D. of dependent variable 0.061Sum of squared residuals 0.036Durbin-Watson statistic 0.767
Note : coef®cient on D1912 constrained to be equal to minus the sumof the coef®cients on D1877 to D1907 inclusive. Coef®cient on DUSconstrained to be equal to minus the sum of the coef®cients onDAUS to DUK inclusive. Estimation: OLS. For variable de®nitions,see Table 5.
2000] 461T A R I F F S A N D G R O W T H I N T H E L A T E 1 9 T H C E N T U R Y
# Royal Economic Society 2000

tariffs on country and time dummies. As expected, the tables show that tariffswere highest in the United States, and lowest in the United Kingdom, withtariffs also being high in Australia (I use the Victorian tariffs) and Canada.Continental European countries all have average tariff rates somewhere inbetween these two extremes, with Scandinavian (and, in particular, Danish)tariffs being surprisingly high, and German tariffs being surprisingly low. Thegeneral increase in tariff levels in the 1880s is also apparent from the tables.
There are several problems associated with this average tariff measure. First,there is a well-known index number problem: as protection on a particularcommodity increases, the weight of that commodity in the overall tariff indexdeclines. In the extreme case of a prohibitive tariff, the weight would drop tozero. Second, and perhaps more importantly during this period, many tariffswere raised for revenue purposes, and were not necessarily directly protective:British duties on tobacco, for example. If these revenue duties were notincluded, British and Danish average tariffs would be much lower (Irwin,1993). On the other hand, even revenue tariffs will have a general equilibriumimpact of some sort in an open economy.
Despite the impact of revenue tariffs on average customs duties, manyfeatures of Table 1 correspond with what we know about the tariff history ofthe period, in particular the high United States and low United Kingdomtariffs (although the British index for 1875±9 is slightly higher than that forFrance, mirroring the debate between Nye (1991) and Irwin (1993)). Evenfeatures of Table 1 that seem surprising are often compatible with otherevidence on relative protection levels in the late 19th century. Table 3, takenfrom O'Rourke and Williamson (1997), summarises various measures ofprotection in 1875 and 1913. First, there are Bairoch's (1989) estimates oftariffs on wheat. Second, there are several average tariffs, computed using avariety of weights, for both manufacturing and the economy as a whole. Thesewere computed by the League of Nations in 1927, by H. Liepmann in hisclassic Tariff Levels and the Economic Unity of Europe (1938), and by Bairochhimself. Third, I report the estimates of sectoral and overall protectioncalculated by Estevadeordal (1997). Estevadeordal estimated a model predict-ing trade ¯ows for eighteen countries in 1913.5 He then constructed twomeasures of `openness' based on the difference between countries' predictedand actual trade intensity ratios. Table 3 indicates where individual countriesranked among Estevadeordal's eighteen nations in terms of their openness(the most open being ranked 1, and the most protected being ranked 18).
These scholars also found, for example, that protection for manufacturing(although not overall protection) was higher in Denmark than in Germany:Denmark's free trade reputation is due to its refusal to protect agriculture.Contrary to popular opinion, Germany was not particularly protectionist with-in the context of Continental Europe, and indeed neither was Italy (Federicoand Tena, 1998). The data in Table 1 are therefore not wildly out of line with
5 Countries in the Estevadeordal sample were: Argentina, Australia, Austria-Hungary, Belgium,Canada, Denmark, Finland, France, Germany, Italy, Netherlands, Norway, Portugal, Spain, Sweden,Switzerland, the United Kingdom, and the United States.
462 [ A P R I LT H E E C O N O M I C J O U R N A L
# Royal Economic Society 2000

Table 3European Tariffs 1875±1913
ManufacturingCountry 1875
(%)1913 (1)
(%)1913 (2)
(%)1913 (3)(rank)
1913 (4)(rank)
Denmark 15-20 14 n.a. 16 14Norway 2-4 n.a. n.a. 8 8Sweden 3-5 20 25 5 6Italy 8-10 18 20 15 17UK 0 0 0 4 5France 12-15 20 21 12 12Germany 4-6 13 13 6 3
Agriculture
CountryWheat 1913
(%)All Agriculture 1913 (1)
(rank)All Agriculture 1913 (2)
(rank)
Denmark 0 1 1Norway 4 16 13Sweden 28 7 8Italy 40 12 16UK 0 4 2France 38 10 12Germany 36 6 6
Overall
CountryOverall 1913 (1)
(%)Overall 1913 (2)
(%)Overall 1913 (3)
(%)Overall 1913 (4)
(rank)Overall 1913 (5)
(rank)
Denmark 6 9 n.a. 2 4Norway 11 n.a. n.a. 11 12Sweden 9 16 28 7 7Italy 10 17 25 16 17UK 6 0 0 3 3France 9 18 24 14 14Germany 8 12 17 8 8
Notes :Manufacturing 1875: average levels of duties on manufactured products in 1875, from Bairoch (1989),Table 5, p. 42.Manufacturing 1913 (1): League of Nations estimate, as reported in Bairoch (1989), Table 9, p. 76.Manufacturing 1913 (2): Liepmann (1938) estimate, as reported in Bairoch (1989), Table 9, p. 76.Manufacturing 1913 (3): rank among 18 countries (1 � least protectionist, 18 �most protectionist),based on the adjusted trade intensity ratios in Estevadeordal (1997), Table 6, p. 104.Manufacturing 1913 (4): rank among 18 countries (1 � least protectionist, 18 �most protectionist),based on the openness measures in Estevadeordal (1997), Table 6, p. 105.Wheat 1913: levels of duties on wheat, calculated by Bairoch (1989), Table 9, p. 76.Agriculture 1913 (1): rank among 18 countries (1 � least protectionist, 18 �most protectionist), basedon the adjusted trade intensity ratios in Estevadeordal (1997), Table 6, p. 104.Agriculture 1913 (2): rank among 18 countries (1 � least protectionist, 18 �most protectionist), basedon the openness measures in Estevadeordal (1997), Table 6, p. 105.Overall 1913 (1): import duties as % of special total imports (1909±1913), calculated by Bairoch(1989), Table 9, p. 76.Overall 1913 (2): League of Nations estimate, as reported in Bairoch (1989), Table 9, p. 76.Overall 1913 (3): Liepmann (1938) estimate, as reported in Bairoch (1989), Table 9, p. 76.Overall 1913 (4): rank among 18 countries (1 � least protectionist, 18 �most protectionist), based onthe adjusted trade intensity ratios in Estevadeordal (1997), Table 8, p. 107.Overall 1913 (5): rank among 18 countries (1 � least protectionist, 18 �most protectionist), based onthe openness measures in Estevadeordal (1997), Table 8, p. 107.
2000] 463T A R I F F S A N D G R O W T H I N T H E L A T E 1 9 T H C E N T U R Y
# Royal Economic Society 2000

what other sources suggest. However, there remains the possibility thatrevenue tariffs were more important in some countries than in others. It willtherefore be important to check that econometric results are robust to theinclusion of country-speci®c ®xed effects.
Table 4 gives average annual per capita growth rates between successive 5-year periods. Canada, Denmark and the United States experienced relativelyrapid growth, while British growth was somewhat below par, and Australiaperformed poorly.
Since I am using ®ve-year averages, and there are eight ®ve-year periodsbetween 1875 and 1914, there are seven periods of growth to be explained. Ithus have 70 observations. (For a good justi®cation of using panel data in thiscontext, see Harrison (1996).) Unless otherwise stated, the dependent variableis the average annual growth rate of output per capita.
Table 6 explores the impact of tariffs on growth in the context of anunconditional convergence model, with per-capita growth being related to theinitial income per capita. (Table 5 provides a list of variable names used insubsequent tables.) There is little evidence of unconditional beta-convergencefor this ten-country sample: the coef®cient on initial income in (1) is verysmall, albeit negative, and insigni®cant at conventional levels.6 Adding the logof the (initial) average tariff improves the ®t of the equation somewhat; thecoef®cient on the tariff variable in (2) is positive, at 0.746, and signi®cant atconventional levels. The coef®cient implies that a 10% increase in the tariff
Table 4Growth Rates, 1875±1914
(Percent per annum)
1875±9 to1880±4
1880±4 to1885±9
1885±9 to1890±4
1890±4 to1895±9
1895±9 to1900±4
1900±4 to1905±9
1905±9 to1910±4
Average
Australia 0.9 1.0 ÿ2.0 ÿ2.3 1.8 2.8 1.7 0.6Canada 3.7 0.9 2.0 1.1 4.8 3.2 2.4 2.6Denmark 1.2 1.1 1.9 2.0 2.1 1.9 2.1 1.7France 1.4 0.3 2.0 1.7 0.8 1.3 1.7 1.3Germany 0.1 1.9 1.8 2.3 1.3 1.6 1.2 1.4Italy 0.5 1.0 ÿ0.2 0.2 2.6 3.4 2.3 1.4Norway ÿ0.0 0.8 1.7 0.9 0.8 1.3 2.7 1.2Sweden 0.7 0.6 1.6 2.4 1.5 1.7 1.5 1.4UK 1.0 0.9 0.9 1.9 0.6 0.4 1.0 1.0USA 4.2 0.3 0.9 1.6 3.1 2.1 0.8 1.8
Average 1.4 0.9 1.1 1.2 1.9 2.0 1.7 1.4
Source : see Appendix 1.
6 This fact has previously been commented on by Maddison (1994) and O'Rourke and Williamson(1997). The latter paper ®nds stronger evidence for convergence, conditional on education, based on®xed country-speci®c enrollment rates. This ®nding survives when enrollment rates are allowed to varyover time, as is the case here: when growth rates are regressed on enrollment rates and initial income,the coef®cient on education is positive and signi®cant at the 10% level, while the coef®cient on initialincome increases to ÿ0.734 (with a p-value of 0.118).
464 [ A P R I LT H E E C O N O M I C J O U R N A L
# Royal Economic Society 2000

rate is associated with an increase in annual growth rates of 0.075% per annum,or 5.2% (100 3 0:075=1:443); a one standard deviation increase in the tariffrate (0.481249) would increase average annual growth rates by 0.359% p.a., orby 24.9% (100 3 0:359=1:443). These are quite large effects.
When country-speci®c ®xed effects are introduced, the coef®cient on thetariff variable increases to 1.538; a one standard deviation increase in tariffs isnow associated with an increase of 0.74% p.a. in the average annual growth rate,or 51.3%. The coef®cient is marginally smaller at 0.691 when time dummies areintroduced. When both time and country dummies are introduced, the coef®-cient declines to 0.511, and is no longer signi®cant at standard con®dencelevels. However, this is hardly surprising, given that a regression of tariffs ontime and country dummies produces an R-squared of 0.879 (Table 2).7
Table 5List of Variables Used in Regressions
Variable Description
C ConstantD1877 Dummy variable: 1 if period is 1875±79, 0 otherwiseD1882 Dummy variable: 1 if period is 1880±84, 0 otherwiseD1887 Dummy variable: 1 if period is 1885±89, 0 otherwiseD1892 Dummy variable: 1 if period is 1890±94, 0 otherwiseD1897 Dummy variable: 1 if period is 1895±99, 0 otherwiseD1902 Dummy variable: 1 if period is 1900±04, 0 otherwiseD1907 Dummy variable: 1 if period is 1905±09, 0 otherwiseD1912 Dummy variable: 1 if period is 1910±14, 0 otherwiseDAUS Dummy variable: 1 if country is Australia, 0 otherwiseDC Dummy variable: 1 if country is Canada, 0 otherwiseDDK Dummy variable: 1 if country is Denmark, 0 otherwiseDF Dummy variable: 1 if country is France, 0 otherwiseDG Dummy variable: 1 if country is Germany, 0 otherwiseDI Dummy variable: 1 if country is Italy, 0 otherwiseDN Dummy variable: 1 if country is Norway, 0 otherwiseDS Dummy variable: 1 if country is Sweden, 0 otherwiseDUK Dummy variable: 1 if country is UK, 0 otherwiseDUS Dummy variable: 1 if country is US, 0 otherwiseLY Log of initial incomeLTAR Log of average tariff (®rst period)SK Log of the savings rateSH Log of school enrollment rateNGD Log of population growth rate plus 0.05DKL Rate of change of capital-labour ratioDRL Rate of change of land-labour ratioCYC Deviation of output from trend output
(based on regressions of output on time and time squared)SPECTAR Log of (average tariff times implicit GDP de¯ator)LTAR(�1) Log of the second period average tariffLTAR12 Log of the average of tariffs in ®rst and second periodsGDP Real GDPPOP PopulationDOLD Dummy variable: 1if country is European, 0 otherwiseDNEW Dummy variable: 1 if country is in New World, 0 otherwise
7 When the dependent variable is the log of the average tariff, rather than the average tariff, the R-squared is 0.862 (not shown).
2000] 465T A R I F F S A N D G R O W T H I N T H E L A T E 1 9 T H C E N T U R Y
# Royal Economic Society 2000

These results were suf®ciently surprising to me that I ran equations relatingtariffs and growth using many different speci®cations, in an attempt to see howrobust this correlation was. I ®rst explored the link between tariffs and growthin the context of an augmented Solow model, of the sort associated withMankiw et al. (1992): consistent with the ®ndings of Taylor (1996), this modelperforms extremely poorly in the late 19th century.8 Most notably, the savingsrate and population growth coef®cients have the wrong signs, while the coef®-cient on initial income has the wrong sign in several speci®cations. Onceagain, the tariff coef®cient is large, positive and statistically signi®cant, unlessboth time and county dummies are included.
In Table 7, I run factor accumulation models of the sort favoured by Taylor(1996): growth in output per worker is related to growth in the land-labour andcapital-labour ratios (recall that capital stocks are proxied by coal consump-tion). This speci®cation re¯ects the important role that expanding frontiers
Table 6Unconditional Convergence Model
(Dependent variable is average annual growth rate)
(1) (2) (3) (4) (5)
Fixed effects? No No Yes No YesC 1.718 3.477 4.170
(4.303) (4.576) (4.950)LY ÿ0.286 ÿ0.383 0.288 ÿ0.761 ÿ5.027
(ÿ0.733) (ÿ1.020) (0.340) (ÿ1.962) (2.833)LTAR 0.746 1.538 0.691 0.511
(2.679) (2.128) (2.566) (0.659)D1877 ÿ0.566 ÿ2.383
(ÿ1.132) (ÿ2.607)D1882 ÿ1.079 ÿ2.589
(ÿ2.196) (ÿ3.304)D1887 ÿ0.913 ÿ2.223
(ÿ1.877) (ÿ3.187)D1892 ÿ0.756 ÿ1.841
(ÿ1.569) (ÿ2.929)D1897 0.040 ÿ0.789
(0.084) (ÿ1.427)D1902 0.113 ÿ0.295
(0.239) (ÿ0.632)
No. of observations 70 70 70 70 70R-squared 0.008 0.104 0.267 0.252 0.453Adjusted R-squared ÿ0.007 0.077 0.128 0.154 0.274S.E. of regression 1.150 1.101 1.070 1.055 0.977F-statistic 0.537 3.880 21.170 2.568 6.156Prob(F-statistic) 0.466 0.025 0.000 0.018 0.000Mean of dependent variable 1.443 1.443 1.443 1.443 1.443S.D. of dependent variable 1.146 1.146 1.146 1.146 1.146Sum of squared residuals 89.973 81.270 66.435 67.840 49.588Durbin-Watson stat. 1.349 1.479 1.889 1.576 1.714
Note : t-statistics are in parentheses. Estimation: OLS. Omitted year: 1907. Country speci®c ®xed effectsin (3) and (5) not reported.
8 The results (not shown) are available on request from the author.
466 [ A P R I LT H E E C O N O M I C J O U R N A L
# Royal Economic Society 2000

played in the late 19th century Atlantic economy, as well as the greater role ofagriculture in that period. In (4) and (5) a catch-up term is added to thespeci®cation. Since both speci®cation tests (not shown) and common sensesuggest that country ®xed effects should be included, all regressions in this andsubsequent tables incorporate them. The model performs much better than theaugmented Solow model, and the positive relationship between tariffs andgrowth survives (but note that the coef®cient on initial income is positive in(4)). The tariff coef®cient ranges from 0.57 to 1.853. Again, adding country®xed effects alone to the speci®cation increases the size of the tariff coef®cient,while adding time dummies as well as country dummies lowers both the size ofthe coef®cient and the signi®cance level (to below conventional levels).9
Finally, it should be noted that controlling for import shares strengthens the
Table 7Factor Accumulation Model
(Dependent variable is average annual growth rate)
(1) (2) (3) (4) (5)
LY 1.464 ÿ3.796(1.832) (ÿ2.300)
DKL 18.361 19.528 21.809 22.527 18.55(2.869) (3.225) (3.392) (3.660) (2.928)
DRL 10.913 14.189 22.933 18.235 22.748(0.750) (1.030) (1.669) (1.333) (1.724)
LTAR 1.853 1.142 1.737 0.570(2.845) (1.669) (2.708) (0.810)
D1877 ÿ0.990 ÿ2.589(ÿ2.070) (ÿ3.108)
D1882 ÿ1.166 ÿ2.508(ÿ2.714) (ÿ3.510)
D1887 ÿ0.736 ÿ1.892(ÿ1.786) (ÿ2.958)
D1892 ÿ0.561 ÿ1.527(ÿ1.364) (ÿ2.648)
D1897 ÿ0.279 ÿ0.940(ÿ0.650) (ÿ1.869)
D1902 ÿ0.089 ÿ0.397(ÿ0.214) (ÿ0.938)
No. of observations 70 70 70 70 70R-squared 0.331 0.414 0.524 0.447 0.569Adjusted R-squared 0.204 0.291 0.355 0.319 0.405S.E. of regression 1.023 0.965 0.920 0.946 0.884F-statistic 28.701 20.154 7.004 15.110 7.338Prob(F-statistic) 0.000 0.000 0.000 0.000 0.000Mean of dependent variable 1.443 1.443 1.443 1.443 1.443S.D. of dependent variable 1.146 1.146 1.146 1.146 1.146Sum of squared residuals 60.664 53.119 43.210 50.117 39.074Durbin-Watson stat. 1.462 1.612 1.853 1.801 1.693
Note : t-statistics are in parentheses. Estimation: OLS with ®xed effects. Fixed effects omitted. Omittedyear: 1907.
9 In response to a referee's suggestion, I tried replacing the log of the average tariff with the averagetariff itself. The qualitative results remain unchanged; for example, when the average tariff is used in(3), the tariff coef®cient is 10.82, with a t-statistic of 1.860; when it is used in (5), the tariff coef®cient is5.41, with a t-statistic of 0.881.
2000] 467T A R I F F S A N D G R O W T H I N T H E L A T E 1 9 T H C E N T U R Y
# Royal Economic Society 2000
correlation between tariffs and growth. For example, when the simple factoraccumulation model with country dummies is re-estimated, the coef®cient ontariffs increases to 2.374, up from 1.853 (equation (2) in Table 7). The importshare is positively and signi®cantly related to growth, consistent with ®ndingsfor the late 20th century.
Clearly my prior, which was that tariffs should be negatively correlated withgrowth, is not supported by the data. The data are far more comfortable withthe hypothesis that tariffs boosted late 19th century growth. What could bedriving the results?
One possibility is that the results are driven by one or two countries: theUnited States, for example, was both a high-growth and a high-tariff economy.On the other hand, Australia was a low-growth country; using high Victoriantariffs, as I do, rather than tariffs re¯ecting the free trading New South Wales,should have reduced the correlation between growth and tariffs. The fact thatmy results are robust to the inclusion of country dummies indicates thatsomething more than country ®xed effects is going on. Indeed, in all cases, thetariff coef®cient increases in size when country dummies are introduced.
In Table 8, I let the tariff variable interact with country and time dummies,in the context of a simple factor accumulation speci®cation. With countrydummies already included, I am using up many scarce degrees of freedom; thehope is that such an exercise will yield some insight into what is driving theoverall result. For the sake of comparison, the coef®cient on tariffs was 1.853in equation (2) of Table 7.
F-tests clearly reject the null hypothesis that tariff coef®cients are equalacross countries, while there seems to be a tendency for the tariff coef®cient tofall over time. The tariff coef®cient was `larger than average' (i.e. greater than1.853) for Australia, Canada, Germany, Italy and Norway.10 Reassuringly, thetariff coef®cient was (insigni®cantly) negative for the two free-traders in thesample, Denmark and the United Kingdom, as well as for the United States.The fact that no positive correlation emerges for Denmark and Britain,countries whose histories contain no suggestion that tariffs boosted growth,suggests that the overall correlation is more than a spurious by-product of theway these data are generated.
At this point, a skeptic might well ask whether the causation could be goingthe other way round, from growth to tariffs. One could argue as follows: indepressions, tariff rates increase. This could be because duty rates are raised(which is what the endogenous tariff literature emphasises), or it could bebecause speci®c duties translate into higher rates of protection in periods oflow prices (Crucini (1994); see also Thornton and Molyneux (1997)). In eitherevent, tariffs are higher when output is low, and thus about to grow more
10 The Italian coef®cient seems absurdly high; inspection of Tables 1 and 4 reveals that Italian tariffsdid indeed increase after 1895, at the same time that the economy's growth rate acceleratedsigni®cantly. There are also severe problems regarding the data on Italian land inputs (see Appendix1). Reassuringly, the positive correlation between tariffs and growth does not depend on these Italianobservations. Excluding Italy, a simple factor accumulation model with country dummies produces atariff coef®cient of 1.424, with a p-value of 0.027. This is lower than the coef®cient in equation (2) ofTable 7, but it is large and positive nonetheless.
468 [ A P R I LT H E E C O N O M I C J O U R N A L
# Royal Economic Society 2000

Table 8Tariffs and Growth in Different Countries and Periods
(Dependent variable is annual average growth rate)
(1) (2)
DKL 23.761 22.992(4.091) (3.633)
DRL 22.766 25.238(1.728) (1.802)
DAUS 3 LTAR 2.836(2.390)
DC 3 LTAR 4.297(0.955)
DDK 3 LTAR ÿ1.600(ÿ0.985)
DF 3 LTAR 1.096(0.760)
DG 3 LTAR 2.317(2.049)
DI 3 LTAR 10.664(3.987)
DN 3 LTAR 3.633(0.643)
DS 3 LTAR 0.789(0.138)
DUK 3 LTAR ÿ3.110(ÿ0.743)
DUS 3 LTAR ÿ1.07(ÿ0.359)
D1877 3 LTAR 1.258(1.867)
D1882 3 LTAR 1.212(1.719)
D1887 3 LTAR 1.057(1.423)
D1892 3 LTAR 0.975(1.312)
D1897 3 LTAR 0.911(1.211)
D1902 3 LTAR 0.816(1.072)
D1907 3 LTAR 0.743(1.004)
No. of observations 70 70R-squared 0.581 0.511Adjusted R-squared 0.397 0.339S.E. of regression 0.890 0.932F-statistic 6.041 6.668Prob(F-statistic) 0.000 0.000Mean of dependent variable 1.443 1.443S.D. of dependent variable 1.146 1.146Sum of squared residuals 38.031 44.322Durbin-Watson stat. 2.169 1.834Restrictions p � 0:042 p � 0:139
Note : t-statistics are in parentheses. Estimation: OLS with ®xed effects.Fixed effects omitted. Restrictions: p-values from F-tests that tariff coef®-cients are equal across countries or time.
2000] 469T A R I F F S A N D G R O W T H I N T H E L A T E 1 9 T H C E N T U R Y
# Royal Economic Society 2000

rapidly than average. There is some evidence that the latter effect may havebeen at work during recessions. Let CYC be a business cycle variable, de®nedas the deviation of actual output from predicted output, where predictedoutput is derived from a regression of annual output on time and timesquared. Table 9 gives the correlation between CYC, the GDP price de¯ator,the log of the average tariff LTAR, and growth over the subsequent period. Ascan be seen, during booms (CYC is positive), prices are higher, tariffs are lowerand subsequent growth is lower; during troughs (CYC is negative) prices arelower, tariffs are higher, and subsequent growth is higher. When the log of thetariff is regressed on country dummies and CYC, the coef®cient on CYC isstrongly negative, as predicted by the political science literature (e.g. Cassing etal, 1986; Gallarotti, 1985), although maybe not for the reasons suggestedhere.11
One simple and extremely crude way to check whether it is this dependenceof tariffs on the business cycle that is driving the results is to regress the growthrate between ®ve-year periods on tariffs in the second period, rather than the®rst period. Say the economy was in recession in the ®rst period: ®rst periodtariffs might be higher than usual, but second period tariffs would re¯ect thebetter economic conditions that followed. Table 10 presents the results whengrowth is regressed on second period tariffs, and the average of ®rst andsecond period tariffs, in the context of the factor accumulation model. Usingsecond period tariffs lowers the tariff coef®cient somewhat, to 1.352, downfrom 1.853, while using average tariffs leaves the coef®cient unchanged.
An alternative is to construct a `speci®c tariff' variable, SPECTAR, de®ned asthe log of the average tariff times the GDP price de¯ator. Table 9 shows thatSPECTAR is not as strongly correlated with the business cycle as is the averagetariff, while a regression of SPECTAR on CYC and country dummies reveals nostatistically signi®cant relationship between speci®c tariffs and the business
Table 9Prices, Tariffs and the Business Cycle
(Correlations)
CYC Prices LTAR SPECTAR Growth
CYC 1Prices 0.335 1LTAR ÿ0.224 ÿ0.412 1SPECTAR ÿ0.160 ÿ0.194 0.974 1Growth ÿ0.382 ÿ0.187 0.300 0.277 1
Note : prices are the implicit GDP de¯ator. CYC is as de®ned in the text. LTAR isthe log of the average tariff. SPECTAR is the log of (average tariff 3 prices). Alldata sources given in Appendix 1.
11 The coef®cient on CYC in the regression (not shown) is ÿ0.830, with a t-statistic of ÿ2.669.
470 [ A P R I LT H E E C O N O M I C J O U R N A L
# Royal Economic Society 2000

cycle.12 Table 11 shows that when the average tariff is replaced by SPECTAR ina simple factor accumulation model, the coef®cient on tariffs is still large andpositive, if somewhat smaller than in equation (2) of Table 7.
From these exercises, it appears that the countercyclicality of tariffs cannoton its own explain my results; moreover, if the positive correlation betweentariffs and growth were due to the interaction of changing price levels over thebusiness cycle and speci®c tariffs, then why does a positive correlation notemerge for Britain and Denmark, the two free traders in the sample?
Another way that business cycles might matter is suggested by Vamvakidis(1997). As mentioned in the introduction, he ®nds some support for thetheoretical suggestion that tariffs might be bene®cial during recessions (due,for example, to their employment-creating effects), but not otherwise. Usingpooled data from 1920 to 1990, he regresses growth on domestic tariffs, andother variables. In many speci®cations, the tariff coef®cient is positive (ifinsigni®cant); but when he controls for unemployment, the tariff coef®cientbecomes negative and signi®cant. Speci®cally, when he adds the unemploy-ment rate, and an interaction term between tariffs and unemployment, to thespeci®cation, he ®nds: a negative and signi®cant unemployment coef®cient; apositive and signi®cant coef®cient on the interaction between tariffs andunemployment; and a negative and signi®cant coef®cient on tariffs.
Might something similar have been at work in the late 19th century? Might
Table 10Factor Accumulation Model, Second Period Tariffs
(Dependent variable is average annual growth rate)
Variable (1) (2)
DKL 16.979 17.925(2.688) (2.923)
DRL 13.741 14.595(0.959) (1.042)
LTAR(�1) 1.352(1.838)
LTAR12 1.851(2.493)
No. of observations 70 70R-squared 0.368 0.397Adjusted R-squared 0.235 0.270S.E. of regression 1.002 0.980F-statistic 16.627 18.748Prob(F-statistic) 0.000 0.000Mean of dependent variable 1.443 1.443S.D. of dependent variable 1.146 1.146Sum of squared residuals 57.271 54.700Durbin-Watson stat. 1.532 1.570
Note : t-statistics are in parentheses. Estimation: OLS with ®xed effects. Fixedeffects omitted.
12 The coef®cient on CYC in the regression (not shown) is ÿ0.271, with a t-statistic of ÿ0.862.
2000] 471T A R I F F S A N D G R O W T H I N T H E L A T E 1 9 T H C E N T U R Y
# Royal Economic Society 2000

the overall positive tariff effect my regressions have uncovered be due solely tothe positive effects of tariffs during recessions? Equation (1) in Table 12presents the evidence, in the context of the factor accumulation model. TheCYC variable here is identical to that used earlier; i.e. it is the deviation fromtrend output. There is no evidence that the growth effects of tariffs are solelydue to their impact during recessions. To be sure, the coef®cient on tariffs islower than in the simpler speci®cations of Table 7, down to 1.066 from 1.853,and has a p-value of 0.133. On the other hand, the coef®cient is still positive;moreover, the fact that the coef®cient on the tariff-cycle interaction term ispositive suggests that tariffs were more effective during expansions, not less.
If tariffs helped boost growth, this is not solely due to some recessioneffect.13 The positive correlation between tariffs and growth which this section
Table 11Growth and `Speci®c' Tariffs
(Dependent variable is average annual growth rate)
Variable (1) (2)
DKL 19.896 22.504(3.177) (3.451)
DRL 12.382 23.627(0.875) (1.697)
SPECTAR 1.467 0.796(2.097) (1.154)
D1877 ÿ1.089(ÿ2.280)
D1882 ÿ1.198(ÿ2.750)
D1887 ÿ0.669(ÿ1.589)
D1892 ÿ0.497(ÿ1.179)
D1897 ÿ0.196(ÿ0.446)
D1902 ÿ0.036(ÿ0.086)
No. of observations 70 70R-squared 0.379 0.510Adjusted R-squared 0.248 0.337S.E. of regression 0.994 0.933F-statistic 17.390 6.643Prob(F-statistic) 0.000 0.000Mean of dependent variable 1.443 1.443S.D. of dependent variable 1.146 1.146Sum of squared residuals 56.319 44.410Durbin-Watson stat. 1.584 1.839
Note : t-statistics are in parentheses. Estimation: OLS with ®xed effects.Fixed effects omitted.
13 On a somewhat related note, neither is it the case that current tariffs have a positive effect onoutput, while lagged tariffs have a negative effect. Adding (one-period) lagged tariffs to equation (2) inTable 7 reduces the coef®cient on current tariffs somewhat, while the coef®cient on lagged tariffs ispositive but statistically insigni®cant.
472 [ A P R I LT H E E C O N O M I C J O U R N A L
# Royal Economic Society 2000

has uncovered seems surprisingly robust, given the contrary evidence emer-ging from the late 20th century data.
4. Discussion
It appears that the Bairoch hypothesis (that tariffs were positively associatedwith growth in the late 19th century) holds up remarkably well, when testedwith recently available data, and when controlling for other factors in¯uencinggrowth. If the result is accepted, these questions naturally arise: what are theeconomics underlying the result, and why was the late 19th century so differentfrom the late 20th century? Thus far, the paper has been silent on themechanisms through which tariffs in¯uenced growth, and it has been silentfor a speci®c reason: partial correlations such as the ones presented above arethe basis for today's conventional wisdom, almost universally accepted amongeconomists and policy makers, that openness is good for growth. Clearly, itmakes sense to see what the same methodology implies about the linksbetween tariffs and growth in an earlier period. Nonetheless, a constant themeof O'Rourke and Williamson (1999) is that late 20th century economists
Table 12Growth and Tariffs: Alternative Speci®cations
(Dependent variable is average annual growth rate)
Variable (1) (2) (3)
DKL 20.230 19.654 20.039(3.469) (3.162) (3.235)
DRL 10.060 14.254 14.086(0.754) (1.025) (1.015)
LTAR 1.066 1.855 1.961(1.521) (2.823) (2.819)
CYC 5.910(0.739)
LTAR 3 CYC 5.062(1.244)
LTAR 3 GDP ÿ0.000(ÿ0.109)
LTAR 3 POP ÿ0.000(ÿ0.465)
No. of observations 70 70 70R-squared 0.479 0.414 0.416Adjusted R-squared 0.346 0.278 0.281S.E. of regression 0.927 0.974 0.972F-statistic 12.622 13.207 13.323Prob(F-statistic) 0.000 0.000 0.000Mean of dependent variable 1.443 1.443 1.443S.D. of dependent variable 1.146 1.146 1.146Sum of squared residuals 47.281 53.108 52.915Durbin-Watson stat. 1.642 1.613 1.612
Note : t-statistics are in parentheses. Estimation: OLS with ®xed effects. Fixedeffects omitted.
2000] 473T A R I F F S A N D G R O W T H I N T H E L A T E 1 9 T H C E N T U R Y
# Royal Economic Society 2000

should think harder about the mechanisms underlying their partial growthand convergence correlations. While answering the questions posed above isbeyond the scope of this paper, in this section I make a start, by suggestingpossible avenues for further research.
Bairoch himself argues that free trade was bad for French growth, as itexposed the agricultural sector to cheap New World and Ukrainian grain. Thisreduced agricultural incomes, and hence the demand for industrial products.While it might be possible to rationalise the argument in the context of modelsincorporating transport costs, in which domestic market size matters, theoreti-cal objections to the argument are easier to envisage. If protection boostedgrowth, a more straightforward explanation would involve appealing either tothe impact of protection on the relative price of capital goods, to learningeffects, or to the structural impact of protection.
The ®rst hypothesis is suggested by Williamson (1974), who argued thatUnited States Civil War tariffs increased the United States savings and invest-ment rates, by lowering the price of capital goods relative to (heavily tariffed)®nal goods. Williamson's argument is that construction was non-traded, andthus did not bene®t from protection, while `with the outstanding exception ofrailroad rails, ®nished capital goods were rarely traded in this phase ofAmerican development' (Williamson, 1974, p. 657). Presumably this rise in thesavings rate should have boosted growth rates, other things being equal. Anappealing feature of the argument is that if capital goods have becomeincreasingly traded over time, as seems plausible, then this could explain thecontrast between the late 19th and late 20th century evidence; indeed, there isconsiderable late 20th century evidence to suggest that the relative price ofcapital is inversely related to economic growth (De Long and Summers, 1991;Jones, 1994), and that protection can slow growth by reducing capital goodsimports (Lee, 1995; Taylor, 1994).
In a recent paper, Collins and Williamson (1999) provide more systematicevidence that tariffs lowered the relative price of capital goods during thisperiod. They calculate the price of capital goods, relative to consumptiongoods, between 1870 and 1950 for eleven countries: my ten, minus France,plus Finland and Japan. They then run a series of regressions explaining therelative price of capital goods, where each observation refers to a particularcountry during one of the periods 1870±85, 1885±1900, 1900±13, 1913±29,1929±39, and 1939±50. Controlling for GDP per capita and GDP, and includ-ing time dummies, they ®nd that a 10 percentage point increase in the tariffrate was associated with a 7.6% decline in the relative price of capital goods(and a 25.6% decline in the relative price of equipment). Moreover, they ®ndthat the investment rate was negatively and signi®cantly related to the relativeprice of capital. In my sample, a bivariate regression of the savings (i.e.investment) rate on the tariff (both variables measured in logs) produces acoef®cient of 0.38, with a t-statistic of 6.45, consistent with Collins and William-son. However, the relationship is sensitive to the inclusion of country ®xedeffects, which are not included by Collins and Williamson (incorporating theminto the regression reverses the sign of the coef®cient, which becomes ÿ0.15,
474 [ A P R I LT H E E C O N O M I C J O U R N A L
# Royal Economic Society 2000

with a t-statistic of ÿ1.24). The fact that the investment share is negativelyrelated to growth when an augmented Solow model is estimated for this dataset is also a problem for the hypothesis, although the argument clearlyprovides a promising avenue for future research.14
The factor accumulation model, which controls for increases in both thecapital-labour and land-labour ratios, suggests that tariffs had a positive impacton total factor productivity. What might explain such a ®nding? Several authorshave addressed the venerable argument that learning-by-doing meant that late19th century protection was good for growth on infant industry grounds.(Again, it is possible that infant industry effects might be at work in someperiods but not in others, since the infant industry argument for protectionrequires not only dynamic scale economies, but underdeveloped capital mar-kets. The technological characteristics of new industries vary over time, andcapital markets have clearly become better developed over the last hundredyears.) David (1970) argued that there was evidence for learning-by-doing in theUnited States ante-bellum cotton textile industry, but that this did not justifyprotection. The reason for the latter assertion was that learning, according toDavid, was best modelled as being a function of the cumulative time spentproducing the good, rather than a function of cumulative output. In the formercase, protection, which boosts output, would not speed learning. By contrast,Head (1994) ®nds econometric support for the notion that learning dependedon cumulative output in the late 19th century United States steel rail industry:protection had a dramatic effect on that industry, and although consumers werehurt by steel rail duties, net welfare effects were positive (if small).
These studies do not by themselves provide strong support for the notion thatprotection boosted growth on infant industry grounds. Nor do the data supportone possible corollary of the hypothesis: that protection should have been moreeffective in larger countries. Equations (2) and (3) in Table 12 interact tariffswith GDP and population respectively, and ®nd no evidence that tariffs had abigger impact on growth in larger countries: indeed, the interaction terms,while statistically insigni®cant, are negative rather than positive.
A third hypothesis is suggested by the work of Broadberry (e.g. Broadberry,1998), who ®nds that the shift of resources out of agriculture can account for asigni®cant proportion of productivity growth in countries such as Germany,the United Kingdom and the United States in the late 19th century. There isoverwhelming evidence that internal labour markets were not well-integratedin the 19th century: nominal wage gaps were about 51% for late 19th centuryindustrialisers (Clark (1957) cited in Hatton and Williamson (1991, p. 382));wage gaps were 52% in 1830s Britain (but only 9±13% in 1890s America), evenafter accounting for cost of living differences.15 At ®rst glance, the argument
14 Note that the positive link between tariffs and growth survives if DKL is omitted in Table 7, asmight be appropriate if DKL was a function of LTAR. For example, when DKL is omitted from (2), thetariff coef®cient is 1.711, with a t-statistic of 2.442; when DKL is omitted from (3), the coef®cient is1.226, with a t-statistic of 1.635.
15 For Britain, see Williamson (1990, p. 193); for the United States, see Hatton and Williamson(1991).
2000] 475T A R I F F S A N D G R O W T H I N T H E L A T E 1 9 T H C E N T U R Y
# Royal Economic Society 2000

that protection can boost welfare by shifting labour into higher-productivitysectors appears to involve a purely static effect, but if it takes time for labour tomove out of agriculture, then the reallocation of labour could indeed have animpact on measured growth rates in the short to medium run, assuming thatinitial agricultural employment was suf®ciently high. Clearly industrial tariffshelped speed up this process, while agricultural tariffs retarded it: if on balancetariffs favoured manufacturing in my sample of countries, then according tothis logic they would have been growth-promoting. This argument would alsohave the desirable effect of helping to account for the difference between thelate 19th and late 20th century experiences: growth due to the reallocation oflabour between agriculture and industry will by de®nition decline and even-tually vanish as agricultural labour supplies dry up.
Table 13 regresses the change in agriculture's share of GDP on the followingvariables: changes in capital-labour and land-labour ratios; a dummy variablefor Europe, re¯ecting the asymmetric impact of declining transport costs onagriculture in the Old World and the New; time dummies, re¯ecting changingworld relative prices of agricultural goods; and average tariffs. As expected,rising capital-labour ratios and falling land-labour ratios were associated withfalling agricultural shares. The results also show a moderately strong, negativeassociation between tariffs and the change in agriculture's share of GDP(equation (1)); that is, the decline in agriculture's share of GDP was fasterwhen tariffs were higher. This suggests that in this sample of countries, tariffprotection was biassed in favour of industry. Not surprisingly, the effect wasstronger in the food-exporting New World, which used tariffs to stimulateindustry, than in food-importing Europe, which protected agriculture as wellas industry (equation (2)). (The fact that Foreman-Peck (1995) concentratessolely on Europe may help explain the contrast between his results and mine,as may the fact that this paper studies changes in output, rather than outputlevels.) Clearly, distinguishing between agricultural and industrial tariffs wouldbe necessary to pursue this line of inquiry further.
5. Research Agenda
There are several quali®cations to the above exercises that need to be made,and which suggest possible avenues for further research.
First, the average tariff measure which I am using is extremely crude, andmay in some cases be misleading, for reasons highlighted earlier, and stressedin recent work (Anderson, 1995; Anderson and Neary, 1994). The constructionof a superior index of protection, on a uniform basis, for as many countries aspossible during the late 19th century should be a major research priority. Thefact that quotas were not as common during this period as they would becomein the inter-war period makes the construction of such an index easier, andalso more desirable.
It is not clear how developing a superior index of protection would affectthese results. Germany was probably more protectionist than my tariff datasuggest, resorting in some cases to quotas and export subsidies. Slow-growing
476 [ A P R I LT H E E C O N O M I C J O U R N A L
# Royal Economic Society 2000

Britain was probably less protectionist than my data suggest, assuming thatrevenue tariffs were not as distortionary as more conventional tariffs. Makingadjustments for these two countries would probably strengthen the positivecorrelation between tariffs and growth, as would replacing high Victoriantariffs with lower average Australian tariffs; on the other hand, lower levels ofprotection in rapidly-growing Denmark would weaken the correlation uncov-ered in this paper.
Second, there is always a signi®cant sample selection issue that arises whenquantitative exercises of this sort are performed with 19th century data. By and
Table 13Structural Transformation and Tariffs
(Dependent variable is change in agriculture'sshare of GDP)
Variable (1) (2)
C ÿ2.787 ÿ4.282(ÿ1.583) (ÿ1.816)
DKL ÿ16.658 ÿ20.308(ÿ1.402) (ÿ1.626)
DRL 9.893 9.460(0.436) (0.416)
LTAR ÿ1.173(ÿ1.442)
LTAR 3 DOLD ÿ0.545(ÿ0.520)
LTAR 3 NEW ÿ2.170(ÿ1.639)
DOLD ÿ1.047 2.121(ÿ1.304) (0.621)
D1877 ÿ0.506 ÿ0.394(ÿ0.510) (ÿ0.394)
D1882 ÿ0.762 ÿ0.762(ÿ0.826) (ÿ0.826)
D1887 0.744 0.681(0.827) (0.755)
D1892 ÿ0.471 0.537(ÿ0.524) (ÿ0.595)
D1897 0.331 0.328(0.358) (0.354)
D1902 0.702 0.716(0.775) (0.790)
No. of observations 70 70R-squared 0.152 0.165Adjusted R-squared 0.008 0.007S.E. of regression 2.011 2.012F-statistic 1.056 1.041Prob(F-statistic) 0.410 0.424Mean of dependent variable ÿ1.621 ÿ1.621S.D. of dependent variable 2.019 2.019Sum of squared residuals 238.575 234.884Durbin-Watson stat. 2.348 2.340
Note : t-statistics are in parentheses. Estimation: OLS. Omittedyear: 1907.
2000] 477T A R I F F S A N D G R O W T H I N T H E L A T E 1 9 T H C E N T U R Y
# Royal Economic Society 2000

large, those countries for which data are available are countries which werealready relatively prosperous. In the late 19th century, such countries wereeither undergoing, or had already undergone, their industrial revolutions.Several of these countries also enjoyed relatively large and prosperous domes-tic markets, and ample natural, administrative and educational resources. Forboth of these reasons, infant industry protection was more likely to work inthese countries than in smaller, peripheral economies with little hope ofdeveloping a manufacturing base at that time. Indeed, in the most comprehen-sive study of the subject to date, Reynolds (1985) has found that the develop-ing world bene®ted greatly by participating in the relatively open internationaleconomy of the years 1850±1914. Lessons from the late 19th century corecannot automatically be extended to the late 19th century periphery: as always,more research on southern and eastern Europe, as well as the developingworld, should be high on the agenda of cliometricians.
Third, and as already stressed, we need further research to establish whetherthe mechanisms identi®ed by theory were in operation during this period:correlation on its own is not enough. For example, it is always possible thataverage tariffs may be proxying in this period for the willingness of govern-ments to get involved in the economy, something which Gerschenkron (1962)believed might be bene®cial in a `backward' society.16 Of course, precisely thesame point ± that correlations are not enough ± can be made about post-1945studies which show a positive link between growth and free trade. Thus, it isequally possible that late 20th century tariffs may be proxying for a range ofother policies that are bad for growth. The relationship between trade policiesand government intervention more generally needs to be explored; and cross-country regressions need to be supplemented with more individual countryand industry studies.
Finally, and related to the previous point, the theoretical papers cited in theintroduction typically assume that sectors differ in important ways, and thatprotection matters for growth by altering the structure of the economy. Theprevious section ended with the suggestion that tariffs may have mattered inthe late 19th century by altering the allocation of resources between agricul-ture and industry, which of course implies that a multi-sector model, withdisaggregated tariffs, is appropriate for understanding the relationship be-tween protection and growth. Single-sector models, of the sort suggested bymuch growth theory, may not be the most appropriate for the issue at hand.Of course, precisely the same comment applies to the many empirical studies®nding a positive association between openness and growth in the late 20th
century, on which this paper is modelled.
University College, Dublin
Date of receipt of ®rst submission: July 1998Date of receipt of ®nal typescript: June 1999
16 I am grateful to Bill Collins for raising this possibility.
478 [ A P R I LT H E E C O N O M I C J O U R N A L
# Royal Economic Society 2000

Appendix 1. Data sources
Data on population, real GDP, coal consumption and tariffs were taken from the database underlying Collins et al. (1997). Collins et al. discuss their data sources in anappendix; the population and real GDP ®gures are from Maddison (1995); coalconsumption and tariff data are mostly from Mitchell (1992, 1993, 1995). Italian tariffrates were kindly provided by Giovanni Federico; Australian tariff data prior to 1901were constructed from data in the Victorian Year-Book (various editions). In addition,the following data were required:
Land
Australia, Denmark, France, Germany, Sweden, UK, US: the data were generouslyprovided by Alan Taylor. In turn, those data were based on the numbers used byO'Rourke et al. (1996), who discuss the underlying (national) sources in some detail.The only changes made by Taylor were to convert land endowments to thousands ofacres. (In addition, grazing areas were added to the US land endowment.) For details,see Taylor (1996, p. 21). Canada: area of land in farm holdings, census years, StatisticsCanada (1983), series M23 (with geometric interpolations for non-census years). Italy:for 1861, 1892, 1905, 1909, statistics for total land under cultivation were generouslysupplied by Giovanni Federico; data for intervening years derived by geometricinterpolation. The ®gure for 1909 was accepted for 1910±13. Norway: based on data inStatistics Norway (1995), Table 14.7. For 1900, 1907 and 1917, statistics exist for totalarea of fully cultivated land; data for intervening years derived by geometric interpola-tion. For 1865, 1875, 1890 and 1900, statistics exist for area under grain, dry peas andpotatoes. The ratio of this area to the total fully cultivated area which applied in 1900 isassumed to apply in 1865, 1875 and 1890, yielding estimates for total fully cultivatedarea in those years. Intervening years derived by geometric interpolation.
Enrollment Rates
Enrollment rates are crude ratios of primary plus secondary enrollments divided bytotal population. European population ®gures are all taken from Mitchell (1992),Table A5. Australia: population from Mitchell (1995), Table A5; primary plus second-ary enrollment from Mitchell (1995), Table I1. Canada: population from Mitchell(1993), Table A5; total school enrollment from Mitchell (1993), Table I1. Denmark:primary and secondary enrollment rates from Mitchell (1992), Table I1; data missingfor 1875±79, 1880±84 and 1885±89; data for 1875±79 and 1885±89 are taken fromEasterlin (1971), Table 1, p. 426; data for 1880±84 derived by geometric interpolation.France: Mitchell (1992), Table I1. Germany: Mitchell (1992), Table I1 (1910); 1875±79and 1885±89 data from Easterlin (1971), Table 1, p. 426; intervening data derived bygeometric interpolation. Italy: Mitchell (1992), Table I1. Norway: Mitchell (1992),Table I1. Sweden: Mitchell (1992), Table I1; only primary school data are availablebefore 1890; total enrollment rates prior to 1890 were derived by assuming that thetotal enrollment rate was 2% higher than the primary school enrollment rate; the®gure for 1880±84 was derived by geometric interpolation. UK: British enrollmentrates are used. Enrollment data are from Mitchell (1992), Table I1; before 1904 onlyprimary school data are used; total enrollment rates prior to 1890 were derived byassuming that the total enrollment rate was 2% higher than the primary schoolenrollment rate. USA: population from Mitchell (1993), Table A5; primary plussecondary enrollments from Mitchell (1993), Table I1; data are missing for 1875±79and 1885±89; these are taken from Easterlin (1971), Table 1, p. 426.
2000] 479T A R I F F S A N D G R O W T H I N T H E L A T E 1 9 T H C E N T U R Y
# Royal Economic Society 2000

Imports
Australia: Mitchell (1995), Table E1. Canada: Mitchell (1993), Table E1. Denmark:GammelgaÊrd (1985), Table 4. France: LeÂvy-Leboyer and Bourguignon (1990), Table A-III. Germany: Hoffman (1965), Table 127. Italy: ISTAT (1958), Table 84. Norway:Statistics Norway (1995), Table 18.1. Sweden: Johansson (1967), Table 51. UK: Mitchell(1988), p. 453. USA: U.S. Department of Commerce (1975), Part 2, series U193.
Nominal GDP
Australia: Vamplew (1987), series ANA 64. Canada (GNP): Urquhart (1986), Table 2.9.Denmark: Johansen (1985), Table 10.1. France: Toutain (1987). Germany: Hoffman(1965), Table 248, col. 5. Italy: Rossi et al. (1993), Table 1B (1890±1914); the ISTATseries for 1870±1890, given in ISTAT (1958), Table 111, is spliced on at 1890. Norway:Mitchell (1992), Table J1. Sweden: Krantz and Nilsson (1975), as reported in Mitchell(1992). UK: Feinstein compromise estimates, Mitchell (1988), p. 836. USA (GNP):Romer (1989), Table 2.
Investment
Australia: Vamplew (1987), series ANA 103 (1870±1900), sum of series ANA 107(public) and ANA 71 (private) (1901±1914). Canada: Urquhart (1986), Table 2.2.Denmark: Johansen (1985), Table 10.3. France: LeÂvy-Leboyer and Bourguignon(1990), Table A-III. Germany: Hoffman (1965), Table 42. Italy: Rossi et al. (1993),Table 2B (1890±1914); ISTAT (1958), Table 118 (`Totale') (1870±1889). Norway:Mitchell (1992), Table J1. Sweden: Mitchell (1992), Table J1. UK: Mitchell (1988), pp.832±33. USA: Kuznets (1961), Table R-29.
GDP De¯ator
These were calculated by comparing the nominal GDP ®gures with real GDP ®gures,taken from national sources. These were as follows: Australia: nominal GDP de¯ated byGDP de¯ator, Vamplew (1987), series PC 79. Canada: price de¯ator direct fromUrquhart (1993) Table 1.6. Denmark: Johansen (1985), Table 10.2. France: Toutain(1987). Germany: Hoffman (1965), Table 249, columns 5, 7 (spliced at 1880). Italy:Bardini et al. (1995), Appendix Table 1. Norway: Mitchell (1992), Table J1. Sweden:older data from Mitchell (1992), based on Krantz and Nilsson (1975). UK: compromiseestimate, Mitchell (1988), Table 5A. USA: Romer (1989), Table 2.
Share of Agriculture in GDP
European data from Mitchell (1992), Table J2. Australia: Mitchell (1995), Table J2.Canada: Urquhart (1993), Table 1.1. US: nominal GDP as above. Agricultural output:U.S. Department of Commerce (1975). 1870±1900: farm gross product, series K 248;1910±13: net income of farm operators from farming, series K259; missing yearsinterpolated.
ReferencesAnderson, J. E. (1995). `Tariff index theory.' Review of International Economics, vol. 3, no. 2, ( June), pp.
156±73.Anderson, J. E. and Neary, J. P. (1994). `Measuring the restrictiveness of trade policy.' The World Bank
Economic Review, vol. 8, no. 2, (May), pp. 151±69.
480 [ A P R I LT H E E C O N O M I C J O U R N A L
# Royal Economic Society 2000

Bairoch, P. (1972). `Free trade and European economic development in the 19th century.' EuropeanEconomic Review, vol. 3, no. 3, (November), pp. 211±45.
Bairoch, P. (1976). Commerce ExteÂrieur et DeÂveloppement EÂ conomique de l'Europe au XIXe SieÁcle. Paris:Mouton.
Bairoch, P. (1989). `European trade policy, 1815±1914.' In (P. Mathias and S. Pollard eds) TheCambridge Economic History of Europe, Vol. 8, pp. 1±160. Cambridge: Cambridge University Press.
Bairoch, P. (1993). Economics and World History: Myths and Paradoxes. Chicago: University of ChicagoPress.
Bardini, C., Carreras, A. and Lains, P. (1995). `The national accounts for Italy, Spain and Portugal.'Scandinavian Economic History Review, vol. 43, no. 1, pp. 115±46.
Broadberry, S. N. (1998). `How did the United States and Germany overtake Britain? A sectoral analysisof comparative productivity levels, 1870±1990.' Journal of Economic History, vol. 58, no. 2, ( June),pp. 375±407.
Capie, F. (1983). `Tariff protection and economic performance in the nineteenth century.' In ( J. Blackand L. A. Winters eds) Policy and Performance in International Trade, pp. 1±24. London: Macmillan.
Capie, F. (1994). Tariffs and Growth: Some Insights from the World Economy, 1850±1940. Manchester:Manchester University Press.
Cassing, J., McKeown, T. J. and Ochs, J. (1986). `The political economy of the tariff cycle.' AmericanPolitical Science Review, vol. 80, no. 3, (September), pp. 843±62.
Clark, C. (1957). The Conditions of Economic Progress, 3rd edition. London: Macmillan.Collins, W. J., O'Rourke, K. H. and Williamson, J. G. (1997). `Were trade and factor mobility substitutes
in history?' NBER Working Paper no. 6059 (June).Collins, W. J. and Williamson, J. G. (1999). `Capital goods prices, global capital markets and accumula-
tion: 1870±1950.' NBER Historical Paper no. 116 (February).Crucini, M. J. (1994). `Sources of variation in real tariff rates: the United States, 1900±1940.' American
Economic Review, vol. 84, no. 3, ( June), pp. 732±43.David, P. A. (1970). `Learning by doing and tariff protection: a reconsideration of the case of the ante-
bellum United States cotton textile industry.' Journal of Economic History, vol 30, no. 3, (September),pp. 521±601.
De Long, J. B. and Summers, L. H. (1991). `Equipment investment and economic growth.' QuarterlyJournal of Economics, vol. 106, no. 2, (May), pp. 445±502.
Easterlin, R. A. (1971). `A note on the evidence of history.' In (C. A. Anderson and M. J. Bowman ed.)Education and Economic Development, 3rd printing, pp. 422±9. London: Frank Cass.
Estevadeordal, A. (1997). `Measuring protection in the early twentieth century.' European Review ofEconomic History, vol. 1, no. 1, (April), pp. 89±125.
Federico, G. and Tena, A. (1998). `Was Italy a protectionist country?' European Review of Economic History,vol. 2, no. 1, (April), pp. 73±97.
Foreman-Peck, J. (1995). `A model of later nineteenth century European economic development.'Revista de Historia EconoÂmica, vol. 13, no. 3, (Autumn), pp. 441±71.
Gallarotti, G. M. (1985). `Toward a business-cycle model of tariffs.' International Organization, vol. 39,no. 1, (Winter), pp. 155±87.
GammelgaÊrd, S. (1985). Billeder af Dansk Macro-ékonomi 1818±1980, Hñfte III: Tabeller. Copenhagen:Gyldendal.
Gerschenkron, A. (1962). Economic Backwardness in Historical Perspective. Cambridge, Massachusetts:Harvard University Press.
Grossman, G. M. and Helpman, E. (1991). Innovation and Growth in the Global Economy. Cambridge,Massachusetts: MIT Press.
Harrison, A. (1996). `Openness and growth: a time series, cross-country analysis for developingcountries.' Journal of Development Economics, vol. 48, no. 2, (March), pp. 419±47.
Hatton, T. J. and Williamson, J. G. (1991). `Wage gaps between farm and city: Michigan in the 1890s.'Explorations in Economic History, vol. 28, no. 4, (October), pp. 381±408.
Head, K. (1994). `Infant industry protection in the steel rail industry.' Journal of International Economics,vol. 37, no. 3±4, (November), pp. 141±65.
Hoffmann, W. (1965). Das Wachstum der deutschen Wirtschaft seit der Mitte des 19.Jahrhunderts. Berlin:Springer-Verlag.
Irwin, D. A. (1993). `Free trade and protection in nineteenth-century Britain and France revisited: acomment on Nye.' Journal of Economic History, vol. 53, no. 1, (March), pp. 146±52.
Irwin, D. A. (1998). `Changes in U.S. tariffs: the role of import prices and commercial policies.'American Economic Review, vol. 88, no. 4, (September), pp. 1015±26.
ISTAT (1958). Sommario di Statistiche Storiche Italiane 1861±1955. Rome: Instituto Centrale di StatisticaJohansen, H. C. (1985). Dansk ékonomisk Statistik 1814±1980, Danmarks Historie, Bind 9. Copenhagen:
Gyldendal.Johansson, OÈ . (1967). The Gross Domestic Product of Sweden and its Composition 1861±1955. Stockholm:
2000] 481T A R I F F S A N D G R O W T H I N T H E L A T E 1 9 T H C E N T U R Y
# Royal Economic Society 2000

Almqvist and Wiksell.Jones, C. I. (1994). `Economic growth and the relative price of capital.' Journal of Monetary Economics,
vol. 34, no. 3, (December), pp. 359±82.Kindleberger, C. P. (1951). `Group behavior and international trade.' Journal of Political Economy,
vol. 59, no. 1, (February), pp. 30±46.Krantz, O. and Nilsson, C.-A. (1975). Swedish National Product, 1861±1970: New Aspects on Methods and
Measurement. Lund.Kuznets, S. (1961). Capital in the American Economy: its Formation and Financing. Princeton, NJ: Princeton
University Press.Landes, D. S. (1969). The Unbound Prometheus: Technological Change and Industrial Development in Western
Europe from 1750 to the Present. Cambridge: Cambridge University Press.Lee, J.-W. (1993). `International trade, distortions, and long-run economic growth.' IMF Staff Papers,
vol. 40, no. 2, ( June), pp. 299±328.Lee, J.-W. (1995). `Capital goods imports and long-run growth.' Journal of Development Economics, vol. 48,
no. 1, (October), pp. 91±110.LeÂvy-Leboyer, M. and Bourguignon, F. (1990). The French Economy in the Nineteenth Century: An Essay in
Econometric Analysis. Cambridge: Cambridge University Press.Liepmann, H. (1938). Tariff Levels and the Economic Unity of Europe. London: Allen and Unwin.Maddison, A. (1991). Dynamic Forces in Capitalist Development: A Long-Run Comparative View. Oxford:
Oxford University Press.Maddison, A. (1994). `Explaining the economic performance of nations.' In (W. J. Baumol, R. R.
Nelson and E. N. Wolff eds) Convergence of Productivity: Cross-National Studies and Historical Evidence,pp. 20±61. New York: Oxford University Press.
Maddison, A. (1995). Monitoring the World Economy 1820±1992. Paris: OECD Development CentreStudies.
Mankiw, N. G., Romer, D. and Weil D. N., (1992). `A contribution to the empirics of economic growth.'Quarterly Journal of Economics, vol. 107, no. 2, (May), pp. 407±37.
McDiarmid, O. J. (1946). Commercial Policy in the Canadian Economy. Cambridge, Massachusetts: HarvardUniversity Press.
Mitchell, B. R. (1988). British Historical Statistics. Cambridge: Cambridge University Press.Mitchell, B. R. (1992). International Historical Statistics: Europe, 1750±1988. London: Macmillan Press.Mitchell, B. R. (1993). International Historical Statistics: The Americas, 1750±1988. London: Macmillan
Press.Mitchell, B. R. (1995). International Historical Statistics: Africa, Asia & Oceania, 1750±1988. London:
Macmillan Press.Nye, J. V. (1991). `The myth of free-trade Britain and fortress France: tariffs and trade in the nineteenth
century.' Journal of Economic History, vol. 51, no. 1, (March), pp. 23±46.O'Rourke, K. H. (1997). `The European grain invasion, 1870±1913.' Journal of Economic History, vol. 57,
no. 4, (December), pp. 775±801.O'Rourke, K. H., Taylor, A. M. and Williamson, J. G. (1996). `Factor price convergence in the late
nineteenth century.' International Economic Review, vol. 37, no. 3, (August), pp. 499±530.O'Rourke, K. H. and Williamson, J. G. (1997). `Around the European periphery 1870±1913: globaliza-
tion, schooling and growth.' European Review of Economic History, vol. 1, no. 2, (August), pp. 153±90.O'Rourke, K. H. and Williamson, J. G. (1999). Globalization and History: The Evolution of a 19 th Century
Atlantic Economy. Cambridge, Massachusetts: MIT Press.Reynolds, L. G. (1985). Economic Growth in the Third World, 1850-1980. New Haven, Connecticut: Yale
University Press.Rivera-Batiz, L. A. and Romer, P. M. (1991). `Economic integration and endogenous growth.' Quarterly
Journal of Economics, vol. 106, no. 2, (May), pp. 531±55.RodrõÂguez, F. and Rodrik, D. (1999). `Trade policy and economic growth: a skeptic's guide to the cross-
national evidence.' NBER Working Paper no. 7081 (April).Romer, C. D. (1989). `The prewar business cycle reconsidered: new estimates of Gross National Product,
1869±1908.' Journal of Political Economy, vol. 97, no. 1, (February), pp. 1±37.Rossi, N., Sorgato, A. and Toniolo, G. (1993). `I conti economici italiani: una ricostruzione statistica,
1890±1990.' Rivista di Storia Economica, vol. 10, no. 1, (February), pp. 1±47.Sachs, J. D. and Warner, A. (1995). `Economic reform and the process of global integration.' Brookings
Papers on Economic Activity no. 1, pp. 1±118.Siriwardana, A. M. (1991). `The impact of tariff protection in the colony of Victoria in the late
nineteenth century: a general equilibrium analysis.' Australian Economic History Review, vol. 31,no. 2, (September), pp. 45±65.
Statistics Canada (1983). Historical Statistics of Canada, 2nd edition. Ottowa.Statistics Norway (1995). Historical Statistics 1994. Oslo.Stokey, N. L. (1991). `Human capital, product quality, and growth.' Quarterly Journal of Economics,
482 [ A P R I LT H E E C O N O M I C J O U R N A L
# Royal Economic Society 2000

vol. 106, no. 2, (May), pp. 587±616.Taylor, A. M. (1994). `Three phases of Argentine economic growth.' NBER Historical Paper no. 60
(October).Taylor, A. M. (1996). `Sources of convergence in the late nineteenth century.' NBER Working Paper
no. 5806 (October).Taylor, A. M. (1998). `On the costs of inward-looking development: price distortions, growth, and
divergence in Latin America.' Journal of Economic History, vol. 58, no. 1, (March), pp. 1±28.Thornton, J. and Molyneux, P. (1997). `Tariff endogeneity: evidence from 19th century Europe.'
Economics Letters, vol. 56, no. 3, (November), pp. 345±50.Toutain, J.-C. (1987). `Le produit inteÂrieur brut de la France de 1789 aÁ 1982.' Cahiers de l'ISMEA,
EÂ conomies et SocieÂteÂs, seÂrie AF, no. 15.Urquhart, M. C. (1986). `New estimates of gross national product, Canada, 1870±1926: some implica-
tions for Canadian development.' In (S. L. Engerman and R. E. Gallman eds) Long-term Factors inAmerican Economic Growth, pp. 9±88. Chicago: University of Chicago Press.
Urquhart, M. C. (1993). Gross National Product, Canada, 1870±1926: The Derivation of the Estimates.Kingston and Montreal: McGill-Queen's University Press.
U.S. Department of Commerce. (1975). Historical Statistics of the United States: Colonial Times to 1970.Washington D.C.
Vamplew, W. (ed.) (1987). Australian Historical Statistics. Broadway, New South Wales: Fairfax, Syme andWeldon.
Vamvakidis, A. (1997). `How robust is the growth-openness connection? Historical evidence.' Mimeo,Harvard University.
Williamson, J. G. (1974). `Watersheds and turning points: conjectures on the long-term impact of CivilWar ®nancing.' Journal of Economic History, vol. 34, no. 3, (September), pp. 636±61.
Williamson, J. G. (1990). Coping with City Growth During the British Industrial Revolution. Cambridge:Cambridge University Press.
Young, A. (1991). `Learning by doing and the dynamic effects of international trade.' Quarterly Journalof Economics, vol. 106, no. 2, (May), pp. 369±405.
# Royal Economic Society 2000
2000] 483T A R I F F S A N D G R O W T H I N T H E L A T E 1 9 T H C E N T U R Y


