Targeting Labour Market Programmes: Results from a ...
43
IZA DP No. 3085 Targeting Labour Market Programmes: Results from a Randomized Experiment Stefanie Behncke Markus Frölich Michael Lechner DISCUSSION PAPER SERIES Forschungsinstitut zur Zukunft der Arbeit Institute for the Study of Labor September 2007
Transcript of Targeting Labour Market Programmes: Results from a ...
IZA DP No. 3085
Targeting Labour Market Programmes:Results from a Randomized Experiment
Stefanie BehnckeMarkus FrölichMichael Lechner
DI
SC
US
SI
ON
PA
PE
R S
ER
IE
S
Forschungsinstitutzur Zukunft der ArbeitInstitute for the Studyof Labor
September 2007

Targeting Labour Market Programmes: Results from a Randomized Experiment
Stefanie Behncke SIAW, University of St. Gallen
Markus Frölich
SIAW, University of St. Gallen, IFAU and IZA
Michael Lechner
SIAW, University of St. Gallen, CEPR, ZEW, PSI, IAB and IZA
Discussion Paper No. 3085 September 2007
IZA
P.O. Box 7240 53072 Bonn
Germany
Phone: +49-228-3894-0 Fax: +49-228-3894-180
E-mail: [email protected]
Any opinions expressed here are those of the author(s) and not those of the institute. Research disseminated by IZA may include views on policy, but the institute itself takes no institutional policy positions. The Institute for the Study of Labor (IZA) in Bonn is a local and virtual international research center and a place of communication between science, politics and business. IZA is an independent nonprofit company supported by Deutsche Post World Net. The center is associated with the University of Bonn and offers a stimulating research environment through its research networks, research support, and visitors and doctoral programs. IZA engages in (i) original and internationally competitive research in all fields of labor economics, (ii) development of policy concepts, and (iii) dissemination of research results and concepts to the interested public. IZA Discussion Papers often represent preliminary work and are circulated to encourage discussion. Citation of such a paper should account for its provisional character. A revised version may be available directly from the author.

IZA Discussion Paper No. 3085 September 2007
ABSTRACT
Targeting Labour Market Programmes: Results from a Randomized Experiment*
We evaluate a randomized experiment of a statistical support system developed to assist caseworkers in Swiss employment offices in choosing appropriate active labour market programmes for their unemployed clients. This statistical support system predicted the labour market outcome for each programme and thereby suggested an 'optimal' labour market programme for each unemployed person. The support system was piloted in several employment offices. In those pilot offices, half of the caseworkers used the system and the other half acted as control group. The allocation of the caseworkers to treatment and control group was random. The experiment was designed such that caseworkers retained full discretion about the choice of active labour market programmes, and the evaluation results showed that caseworkers largely ignored the statistical support system. This indicates that stronger incentives are needed for caseworkers to comply with statistical profiling and targeting systems. JEL Classification: J68 Keywords: profiling, active labour market programmes, ALMP, statistical treatment rules,
unemployment, public employment services Corresponding author: Michael Lechner SIAW University of St. Gallen Bodanstr. 8 CH-9000 St. Gallen Switzerland E-mail: [email protected]
* We are very grateful in particular to Heidi Steiger for her support in the early stages of this project. We also thank Chris O'Leary and Thomas Ragni for helpful comments. We are grateful to the Swiss government (seco) for providing the administrative database as well as substantial financial support for this project.

1
1 Introduction
Profiling and Targeting Systems received considerable attention in recent years, both from aca-
demic researchers as well as from policy makers. These are statistical systems suggesting who
should receive certain public services, who should be offered re-employment bonuses (O’Leary,
Decker, and Wandner, 2005), who should attend certain active labour market programmes,1 who
should be searched at the airport to maximize Airport Security (Persico and Todd, 2005, Manski
2006), or which treatment (punishment) should be given to certain criminal offenders, to name just
a few examples.2 Particularly in the area of provision of public services such systems are consid-
ered as a potential means to target services more directly to clients in need or to those who would
benefit most from it. The increasing use of such profiling and targeting systems is made possible
through the widespread availability of PCs connected to the Intra- or Internet in most government
offices. These make the online provision of individual impact predictions possible as a potential
means to target services more precisely to clients who benefit most from them.
The interest in the targeting of active labour market programmes (ALMP) has been triggered by a
number of previous disappointing evaluation results. ALMP have been introduced in many coun-
tries during the 1990s to combat the problems of high and persistent unemployment or low earn-
ings of disadvantaged groups. The initial enthusiasm for this paradigm waned when many evalua-
tion studies (in various European countries) concluded with finding rather moderate or even nega-
tive treatment effects. This emphasized the need for targeting ALMP to those unemployed persons
who may actually benefit from them. Such profiling and targeting systems are, or have been, in
use in Australia, South Korea, the Netherlands, and the USA. Several other countries like the UK,
Germany, Denmark, Finland, and Sweden are currently piloting such systems or consider their
1 See the book "Targeting Employment Services" (Eberts, O’Leary and Wandner, 2002) and the articles therein,
Berger, Black, and Smith (2001), Black, Smith, Plesca, and Plourde (2002), Bryson and Kasparova (2003), Dehejia
(2005), Eberts (2002), Fraser (2000), Keum (2001), Manski (2000, 2004, 2007), Moisala, Suoniemi, and Uusitalo
(2006), Plesca and Smith (2005), Rudolph and Müntnich (2001), Staghøj, Svarer, and Rosholm (2007), and
Stephan, Rässler, and Schewe (2006). 2 Further examples from biometrics include the choice among various medical drugs for cancer treatment (or its
dosage) or the choice of a rehabilitation therapy for alcohol related problems. Past sickness history and intermediate
outcomes are used to adjust a time varying dosage. For references on targeting of treatments in biometrics and re-
lated fields, see Brownell and Wadden (1991) on obesity, Velicer and Prochaska (1999) on smoking, Murphy
(2003) and Murphy, Lynch, Oslin, McKay and TenHave (2007) on drug and alcohol dependence, and Rush (2005)
on depression.

2
use. Caseworkers seem to have been hostile to such systems in every case, though. It is one of the
purposes of this paper to add practical knowledge useful for the design of such systems.
Profiling and targeting systems generally serve two purposes: First, they provide information to
the caseworker. Econometric impact estimates of expected programme benefits can be provided on
a relatively disaggregated level. For example, the system can provide individual estimates, for a
particular client i, of the benefit from taking part in labour market programme A instead of B or C.
Their second purpose is to solve an agency problem in a decentralized bureaucracy: Caseworkers
may pursue their own strategies or aim to satisfy their own beliefs or convictions, which may not
be fully aligned with those intended by the law or the central government. For example, the Swiss
federal law contains relatively detailed provisions when to use certain sanctions if the unemployed
person displays insufficient job search efforts. However, the actual implementation of this sanc-
tioning policy differs substantially between caseworkers and between employment offices (Lalive,
van Ours, and Zweimüller, 2005, Egger and Lenz, 2006, Frölich et al., 2007). Similarly, regarding
the choice of active labour market programmes, caseworkers are often much less concerned about
programme costs than taxpayers are, and they may have different aims than increasing rapid rein-
tegration rates as intended by the law, e.g. place more emphasis on sustainable reintegration.
Profiling and Targeting Systems can be implemented in several ways, with the amount of discre-
tion left to the caseworkers being a crucial parameter. In the one extreme, caseworkers have no
discretion and the statistical system determines which actions are to be taken for a particular client.
In the other extreme, the statistical system may simply act as an information tool leaving the
choice entirely at the caseworker’s discretion. Restricting caseworkers' discretion, as done for ex-
ample in the Worker Profiling and Reemployment Services Initiative (WPRS) in the USA (Eberts,
O’Leary and Wandner, 2002), has the advantage of streamlining service provision and ensuring
equal treatment of clients across sites. It will lead to an alignment of procedures and actions across
offices and caseworkers and thereby reduce the heterogeneity in the way the law is implemented.
It may also save on caseworker’s time, e.g. when clients try to "negotiate" with their caseworker to
receive or avoid certain services or measures. On the other hand, it may severely reduce job satis-
faction and curtail intrinsic motivation of caseworkers who see themselves as subordinates of a
computer. This point strongly supports a high degree of caseworker discretion, where the statisti-
cal system acts to assist the caseworkers by providing additional information and suggestions for
possible actions. Another important advantage of caseworker discretion is its flexibility in permit-
ting private information of caseworkers to enter the choice of services. Caseworkers may have

3
obtained detailed observations of a client's motivation, personality, work ethos, which could in
principle also be made available to the statistical system but presumably only with considerable
measurement error. If such private information is available, it is desirable that caseworkers can
deviate from the recommendations of the statistical system. In this paper, we find evidence that an
implementation with full caseworker discretion is not likely to work well. Without strong incen-
tives or coercion, caseworkers may ignore or sabotage a system that is intended to provide infor-
mation only.
A large randomized field experiment was conducted in 2005 in several employment offices in
Switzerland, where part of the caseworkers had access to a statistical system providing individual
predictions of unemployment risk in relation to participation in different programmes of the Swiss
active labour market policy. The field study was motivated by previous work of Frölich, Lechner,
and Steiger (2003), and Lechner and Smith (2007) who found indications for substantial potential
benefits of introducing such a statistical system in Switzerland.3 During the randomized field
study, the behaviour of those caseworkers who had access to the system and their treatment
choices were monitored and compared to a randomized control group. The evaluation results show
that caseworkers did not change their behaviour in any significant way due to having access to the
additional information. Caseworkers either decided to ignore the system or were over-confident in
that their own experience clearly dominates any information that a statistical system might pro-
vide.
Hence, there is a dilemma if one intends to use profiling and targeting to solve the agency problem
in a decentralized bureaucracy: When providing no incentives to use the system, caseworkers may
ignore or sabotage it. However, severely restricting caseworkers' discretion crowds out intrinsic
motivation and does not exploit the value of the private information of the caseworker. (Even the
fear that the system could potentially be used to restrict caseworker discretion could already raise
strong objections on the side of the caseworkers, as was the case with SOMS in Canada, which
had to be stopped even before it was fully operational, Colpitts, 2002.) Our findings clearly sug-
gest that permitting full caseworker discretion is unlikely to work. If the use of a statistical system
is intended, either restrictions of caseworker discretion, or positive rewards for complying with the
3 Both studies found indications for treatment effect heterogeneity regarding employment chances that caseworkers
did not exploit. Caseworkers did not appear to be more successful in selecting labour market programmes than a
purely random allocation.

4
statistical system (i.e. for voluntarily restricting discretion) are needed.
In the next section, we describe profiling and targeting systems for unemployed and some of their
implementations. Section 3 explains the particular implementation of the Swiss targeting system.
Section 4 gives the detailed results of the experimental evaluation of the Swiss system and Section
5 concludes. Four appendices provide further details concerning the data, the econometrics used
for the predictions, the Swiss active labour market policy, and the results of the experimental
evaluation.
2 Profiling and targeting systems
2.1 Optimal programme choice
In a series of recent papers, Manski (2000, 2004, 2007) considered the choice between different
treatments from the perspective of a social planner. A number of mutually exclusive treatments is
available and the social planner attempts to choose the optimal treatment for each client.4 The
treatments may be different medical drugs, different therapies for persons with alcohol-related
problems, or different active labour market programmes (ALMP) to mention just a few examples.
The ALMP available often comprise job search training, personality courses, language courses,
computer courses, vocational skills training, further training, employment programmes etc.
At some time t the individual i may receive one of R+1 different treatment options and we observe
an outcome at the time (or during the period until) t+τ. Let
0 1, , ,, ,..., R
i t i t i tY Y Yτ τ τ+ + +
be the potential outcomes for individual i, i.e. those outcomes that would be observed if a particu-
lar treatment is chosen. The treatment 0 usually refers to the choice of "no active treatment", e.g.
no medical drug or no labour market programme. (In our application, we consider repeated treat-
ment choices, where a choice is made at every counselling meeting. Treatment 0 then means "no
programme is chosen now" but perhaps at the next counselling meeting.)
If the treatment choice cannot, or should not, be delegated to the individual, e.g. because of the
4 We examine here only the choice of programmes as one of the instruments of active labour market policy. Wunsch
(2007) considers the design of an optimal unemployment insurance system as a whole where also other instruments
are included.

5
moral hazard problem inherent in the unemployment insurance system, the social planner can only
allocate programmes on the basis of observed characteristics, which we denote by Xit. Under cer-
tain conditions (absence of risk aversion on the planner’s side or a binary outcome variable,5 ab-
sence of supply side constraints, absence of externalities), the optimal choice for a client with
characteristics Xit is given by
*
{0,..., }( ) arg max [ | ]r
it itr R
r X E Y X X∈
= =
and is thus based on estimates of the expected conditional potential outcomes
0, ,[ | ],..., [ | ]R
i t it i t itE Y X E Y Xτ τ+ + .
This is the basis for statistical targeting systems, which select for each client the programme with
the highest expected outcome.
This is in contrast to profiling systems, which predict only the outcome 0,[ | ]i t itE Y Xτ+ i.e. when "no
active treatment" is chosen. In the particular application to active labour market programmes, the
profiling systems often estimate the risk of becoming long-term unemployed if not taking part in
ALMP. Unemployed persons assessed to be at high risk are then assigned to the most intensive
services. As discussed e.g. in Frölich, Lechner, and Steiger (2003), targeting is preferable to profil-
ing if a variety of heterogeneous labour market programmes are offered, as it is often the case in
European countries, and if the long-term unemployment risk is not highly correlated with pro-
gramme impacts, as it was found e.g. in Berger, Black, and Smith (2001).
In practice, the social planner will not be omnipresent and needs agents, i.e. the caseworkers in the
employment offices, to implement the intended policies. In addition to providing psychological
support, they should choose labour market programmes to maximize the objectives of the central
planner.6 This can lead to deviations from the idealized situation described above. First, they have
to estimate the unknown potential employment outcomes for each programme and each particular
client. These estimates need to be updated at a regular interval since the characteristics Xit , such as
the unemployment duration and employability, change over time, which may effect the optimal
5 When the outcome variable is binary, the conditional mean characterizes the entire conditional distribution. 6 This is in addition to choosing the right degree of monitoring and sanctioning, providing information on vacancies
and maintaining employer contacts etc., which was not part of the field experiment due to lack of consistent data.

6
treatment choice. Caseworkers will usually attempt to predict programme impacts by combining
results from past national or regional evaluation studies (which will usually be very aggregated,
e.g. for men versus women, young versus old) with their own observations of the careers of their
clients, complemented by discussions with their colleagues and supervisors. For producing these
predictions, they face the problem of a relatively small sample size that is available to them, i.e.
the number of clients they have personally counselled. This is particularly acute for caseworkers
with little job experience.7
Furthermore, the caseworkers' capacity to follow-up on their clients after they are de-registered
from the employment office is also rather limited. For some unemployed, the exit state is known,
e.g. to employment or out of labour force. For other persons it is only known that they did not
show up at the employment office anymore. The subsequent career of the previously unemployed
person is usually unknown to the caseworker. (If the person becomes unemployed again, he might
be allocated to a different caseworker or might be registered in a different employment office.) It
is worthwhile mentioning that for successful treatment choice, precise estimation of the differences
in employment probabilities between the various programmes is important, not the levels in them-
selves. Bell and Orr (2002) found that caseworkers did not systematically select those into treat-
ment who would benefit most from it, and Frölich, Lechner and Steiger (2003) and Lechner and
Smith (2007) found similarly that the treatment effect heterogeneity was not successfully taken
account of by caseworkers.
A statistical system may thus be helpful to provide estimates of the expected potential outcomes
on an individual basis, if a detailed administrative database of past service provision and treatment
choices is available. The database will often be nationwide, covering the entire population with
detailed individual data and complete follow-up information. An individual who moved to a dif-
ferent locality may be out of sight for the previous caseworker but subsequent unemployment
spells will be recorded in the data set available to the statistical system. The large sample size and
the complete follow-up information can thus lead to impact estimates that contain additional in-
formation for the caseworkers. If made available to them, caseworkers may then combine this in-
formation with their own expectations of programme impacts, where they can incorporate addi-
7 Many caseworkers receive intensive training organized by the federal unemployment system, where they also learn
about the effectiveness of certain active labour market programmes. This training, however, will impart only more
or less general impact estimates for broad demographic groups, e.g. young women in a certain industry and cannot
be case specific, where one would like to account for a large number of case specific characteristics.

7
tional private information about their subjective assessment of the motivation, personality, and
work ethos of the unemployed client.
Statistical Profiling and Targeting Systems may often also have another purpose than merely pro-
viding information. They may help to streamline service provision and ensure that caseworkers
aim at the same target variables as the central planner does. Thereby, the statistical system may
help to solve the agency problem in a decentralized bureaucracy. Caseworkers often have consid-
erable discretion in the actions they take (or ignore to take). As one example, the sanctioning of
unemployed persons was mentioned in the introduction. Also in other respects, the caseworkers
and employment offices may well pursue their own convictions of what constitutes the best atti-
tude towards unemployed. Some caseworkers pursue rapid re-employment, whereas others grant
the unemployed more time to find good job matches. Some caseworkers expect active labour mar-
ket programmes to be beneficial for immediate employment, whereas others use them also to pro-
vide psychological stabilization and develop ‘fitness for the labour market’ (Egger and Lenz,
2006, Frölich et. al., 2007). In addition, a sympathetic or antipathetic relationship to the unem-
ployed person may also unconsciously influence the actions taken. Furthermore, caseworkers
probably are less concerned about programme costs than taxpayers would be. The central govern-
ment provides certain indicators it seeks to pursue but leaves the employment offices almost com-
plete freedom in their implementation (Egger and Lenz, 2006, Frölich et. al., 2007). The statistical
targeting system, on the other hand, aims at a clearly defined targeting indicator, usually employ-
ment (or unemployment) at a certain point in time or over a certain period.
A distinguishing feature of different profiling and targeting systems is thus the amount of case-
worker discretion permitted. If the streamlining of service provision were an important aspect, one
would expect less caseworker discretion. On the other hand, this may reduce the caseworkers’ in-
trinsic work motivation and job satisfaction and their flexibility to use private information about
clients to obtain better treatment choices. Some countries have implemented such systems for the
provision of active labour market programmes or welfare-to-work services (Australia, Canada,
South Korea, Netherlands, USA) and several European countries are planning to implement it in
the near future (UK, Germany, Denmark, Finland and Sweden).8 They differ in the degree of dis-
8 Germany is currently piloting a targeting system, see Stephan, Rässler, and Schewe (2006). Sweden is currently
piloting a profiling system in one county and is considering a targeting system as well. (Personal communication by
Anders Forslund, IFAU, Uppsala.) Finland has piloted a profiling system and is about to implement it. (Personal
communication by Roope Uusitalo, Labour Institute for Economic Research, Helsinki; see also Moisala, Suoniemi,

8
cretion that caseworkers retain, but caseworkers seem to have been hostile to such systems in
every case.
2.2 Experiences with targeting systems in Canada and the USA
Canada developed the Service and Outcome Measurement System (SOMS) between 1994 and
1999 as a support system for service delivery staff who retained full discretionary power (Colpitts
2002). SOMS was based on a set of parametric statistical models of subgroup employment ser-
vices impacts estimated on a huge database constructed by merging a number of different adminis-
trative datasets. SOMS, however, was never implemented mainly because of data security con-
cerns and because of resistance from frontline caseworkers who perceived SOMS as a threat to
their own job security. Staff fears were fanned by an impending organizational restructuring within
the ministry for human resources and employment. The SOMS database was deleted in 2002, be-
fore SOMS ever was tried in the field.
The Worker Profiling and Reemployment Services (WPRS) system was implemented nationwide
in the USA in 1994 and has operated in all states since that time. WPRS ranks new UI beneficiar-
ies who are not exempt from UI job search requirements by their probability of UI benefit exhaus-
tion. UI beneficiaries ranked by WPRS are then referred automatically to reemployment services
in order from highest to lowest probability until the available slots for services are filled. Most
states rank UI beneficiaries exhaustion probabilities using a logit model of benefit exhaustion
(Wandner 2002). Evaluations have produced a range of impact estimates for WPRS. Dickinson,
Decker, and Kreutzer (2002) estimated reductions in UI benefit receipt as large as half a week
based on analysis of state administrative data. Black, Smith, Berger, and Noel (2003) estimated a
reduction of 2.2 weeks in benefit duration based on random assignment to WPRS in Kentucky.
A Frontline Decision Support System (FDSS) was developed for the state of Georgia in the USA.
It was planned as a decision support system for frontline staff in one-stop employment service
centres to target reemployment services. The FDSS included two main parts: the systematic job
search module, and the service referral module. The service referral module identifies the se-
quence of activities that most often lead to successful employment for clients with similar back-
and Uusitalo, 2006.) Denmark is considering a targeting system, see also Staghøj, Svarer, and Rosholm (2007). The
UK used profiling in a pilot study for workers on incapacity benefits and is currently rolling out the system. (Per-
sonal communication by Alex Bryson and Richard Dorsett, Policy Studies Institute, London.)

9
ground characteristics (Eberts and O'Leary 2002). It was pilot tested in two Georgia Career Cen-
ters but discontinued soon after for several reasons, without subsequent impact evaluation.9
The Work First Profiling Pilot Project (WFPPP) involved comparison of targeted assignment with
random assignment of referrals to reemployment services among Temporary Assistance for Needy
Families (TANF) benefit recipients in Michigan. A net impact evaluation suggested that targeting
yielded a cost effective improvement in employment success (Eberts 2002).
In the following section, the evaluation of a pilot study of a targeting system in Switzerland is de-
scribed, where caseworkers retained full discretion in their treatment choices.
3 The SAPS experiment in Switzerland
3.1 Background
Switzerland enjoyed very low unemployment rates during most of the last century until the reces-
sion of the early 1990s when unemployment increased to levels not seen before. This triggered a
complete revision of the unemployment insurance act in 1996. In concordance with the conven-
tional wisdom of the OECD at that time, Switzerland switched from a passive unemployment
benefit system towards an active system promoting training and work experience to unemployed
persons. The federal states (cantons) were forced to provide a minimum number of active labour
market programme places, and participation was made mandatory for every unemployed person if
allocated to a programme by the caseworker. Allocation to a programme is at the caseworker's full
discretion, and non-compliance leads to a suspension of benefit payments.
The initial enthusiasm about ALMP has waned in the recent years since several evaluation studies
found rather moderate or even negative effects. While some policy actors sympathized with the
idea of abolishing the (most) expensive measures, the prevailing view was that active labour mar-
ket programmes should remain, but should be better targeted towards those who clearly benefit
from them.
9 FDSS arrived the same time as a huge rise in UI claims associated with a major recession, a change in mainframe
computing environment, which bogged down simple administrative tasks for staff, and the transfer from the Geor-
gia agency of the main FDSS champion who was the assistant commissioner for employment services. She left the
agency to lead the U.S. Department of Labor southern regional office. We thank Chris O'Leary for pointing out
many of these details.

10
This laid the foundation for the SAPS experiment. The Swiss State Secretariat for Economic Af-
fairs initiated a pilot study on targeting active labour market services in 21 employment offices:
Caseworkers should be assisted in their treatment choices with statistical information.10 The idea
of the Statistically Assisted Programme Selection (SAPS) was to predict for each individual,
which programme would benefit him or her most. Statistical predictions about the net impact
should be made for every jobseeker and for every possible labour market programme based on an
extremely large and rich database. These predictions, conveyed to the caseworker through an
Internet application, would provide individual information on how much participating in that
course would help to improve employment chances. Such predictions were made biweekly to take
new information on time varying covariates into account to assist the caseworker in choosing when
a programme should start.
Figure 1: Unemployment rate January 1990 - August 2007
0
1
2
3
4
5
6
Jan
90
Jan
91
Jan
92
Jan
93
Jan
94
Jan
95
Jan
96
Jan
97
Jan
98
Jan
99
Jan
00
Jan
01
Jan
02
Jan
03
Jan
04
Jan
05
Jan
06
Jan
07
A feasibility study was carried out in 2002 for the State Secretariat for Economic Affairs to ex-
plore the possibilities of a potential pilot study. The State Secretariat thereafter continued with the
preparations for a pilot study, which was carried out in the field from May/June to December
2005. The field study took place in five different regions: Basel, Bern, St.Gallen, Zürich, and Ge-
neva, where the results for Geneva should be considered with caution since a separate profiling
tool was tested in that period and since only two very specialized employment offices participated
in the SAPS evaluation. (There were also further problems with Geneva as discussed later.)
Since the pilot project was conducted with the aim to explore the potential for a subsequent large-
scale introduction of the statistical system in Switzerland, an impact evaluation of SAPS was a key
element. A randomized evaluation was featured where caseworkers were randomized either into
10 A very detailed report (in German) is given in Behncke, Frölich, and Lechner (2007).

11
the in or the out group. A randomization at the level of the caseworker was preferred to a randomi-
zation at the level of the employment office or at the level of the unemployed person. The number
of participating employment offices was considered too small for a reasonable randomization
across sites. A randomization at the level of the unemployed person, on the other hand, would
have led to the problem that a caseworker would receive employment predictions for some of his
clients but not for others. Such a situation would presumably have reduced compliance and/or
would also have produced spill over effects: a caseworker receiving predictions for some of his
clients would try to extrapolate those predictions to his other clients, for whom no predictions were
provided.
Therefore, in each pilot office half of the regular caseworkers were randomized in and half out. A
third group of caseworkers, called the definitive nonparticipants, contains all the caseworkers who
were not included in the randomization for various reasons.11 This should also imply a randomiza-
tion on the unit of the jobseekers because at a given point in time, each jobseeker is assigned
uniquely to one caseworker. Randomization, however, is only implied at the beginning of the field
study since newly registered jobseekers could have been assigned by the office management in a
non-random way to treatment and control group. We therefore distinguish in the later analyses
between a stock and a flow sample. The stock sample contains all jobseekers who were already
registered at the beginning of the field study in the respective employment office. The flow sample
contains all jobseekers who entered later. Whereas the stock sample should (almost12) be random-
ized, the assignment process for the flow sample was beyond our control. The employment office
managers could have changed the allocation between caseworkers and new jobseekers such that
the more difficult cases were assigned to the treatment group (which had access to the tool) or
rather to the control group (which did not experience the burden on their time resources by partici-
pating in the field study). The ensuing groups might thus in principle not be randomized. (The
equality of means tests, however, shows that such concerns are not justified.)
11 Before the randomization was carried out, a number of caseworkers were removed to restrict randomization only to
the 'regular' caseworkers. Those persons include the management of the employment office, all caseworkers with
substantive administrative duties, caseworkers that mainly assist only specific groups of unemployed (e.g. disabled,
youth, unemployed with the intention of self-employment), caseworkers that were on sick leave for a longer time or
about to retire in the next months or were known to leave the employment office soon, and caseworkers, who an-
nounced their unwillingness to participate in the field study before the randomization took place. 12 There was a time delay of a few weeks between randomization of caseworkers and beginning of the pilot study.

12
Apart from concerns about randomization, there is also an independent interest to evaluate the
impact of SAPS predictions for the stock and the flow separately, because they become available
at different times in the unemployment spell. For the flow sample, the predictions are made right
from the beginning of the spell, whereas they start for the stock sample at the beginning of the
experiment, i.e. after they have been unemployed for a while. From this perspective, the analysis
of the flow sample would be more interesting since a practical implementation of a SAPS system
should provide predictions as early as possible. Yet, any differences in estimated impacts could
also be attributable to declining or increasing interest of the caseworkers during the course of the
field study.
Table 1: Randomization of caseworkers in the pilot offices
Randomization Dropout during study In Out In Out
Region Basel: Basel city (3 offices together) 29 29 1 1 Region Bern: Jura bernois and Bienne a) 16 (15) 13 (11) 2 Bern Centre 9 8 1 1 Bern West 12 11 1 2 Bern Gümlingen 8 8 Bern Zollikofen 8 7 Bern Betlehem 11 (8) 10 (8) 1 Tafers (Fribourg) 4 3 Murten (Fribourg) 3 3 Region Zürich: Lagerstrasse 7 6 1 Bülach 9 9 1 1 Region St.Gallen: Oberuzwil 9 7 1 3 Sargans 4 4 2 Region Geneva: b) Gavard 5 7 2 Rive 12 12 (11) 2 2 Total: 146 (142) 137 (132) 10 15 Note: The first two columns give the number of caseworkers randomized in and out. For some of the caseworkers it turned out that they did not counsel any
unemployed for various reasons. The numbers in brackets provide the number of caseworkers with non-zero clients during the field study. The last two columns show dropout of caseworkers during the study due to retirement, prolonged sickness, dismissal, quit, or death. a) These are 2 offices plus 3 sub-branches. Randomization was carried out together because some caseworkers were employed at the same time in two offices or branches. b) The employment office in the canton Geneva are not geographically organized but specialize on occupation and skill groups. The two employment of-fices Gavard and Rive were specialized on specific occupational groups.
Note that the randomization was carried out for the caseworkers, but the outcomes of interest for
the evaluation are the employment prospects of the jobseekers. Table 1 shows the number of case-
workers in the pilot offices. The first two columns give the number of caseworkers randomized in
and out. For some of the caseworkers it turned out that they actually did not counsel any unem-
ployed during the period of the field study, e.g. due to sickness, leave, re-organization, or complete

13
focus on employer contacts. The numbers in brackets provide the number of caseworkers with
non-zero clients during the field study. (There is still quite some variation between them, with
some caseworkers counselling only 10 to 20 clients at a given time, whereas the upper limit is
about 150.) The last two columns show the number of official dropouts of caseworkers during the
period of the field study. These are caseworkers whose number of clients officially falls to zero
due to retirement, prolonged sickness, dismissal, quit, or death. (It does not include caseworkers
who were no longer interested in participation.) These fluctuations are more pronounced in the two
employment offices of St. Gallen where 25% of the caseworkers left the office during the period
of the field study.
3.2 The SAPS estimates and the outcome variable
During the field study, the participating caseworkers received suggestions for the optimal pro-
gramme for every particular jobseeker via the Internet. The SAPS predictions were made available
to the caseworkers via an easy-to-use Internet application. Based on a personalized login, case-
workers had access only to the predictions of their own clients. They were asked to provide feed-
back about these predictions. (Every access to the database was recorded.) The caseworkers of the
control group had no access to the predictions. For the purpose of later analysis, we also computed
the employment predictions for their clients, but made them not available.
The predictions were updated every second week by incorporating new information on time vary-
ing covariates (in particular unemployment duration). This is a big advantage vis-à-vis simple pro-
filing models as it takes into account that the optimal time when a labour market programme
should start may also vary across individuals.
The overriding aim of active labour market policies in Switzerland is rapid, and ideally sustained,
employment. The outcome variable of most interest was therefore defined as the number of months
in stable employment in the next 12 months, where an employment spell is considered as ‘stable’ if
it lasts for at least 3 months. This outcome variable was used for the predictions given by SAPS.
For reasons of consistency, it is used for the evaluation of effects of SAPS as well.
The active labour market programmes were grouped into 6 to 8 categories (depending on region).
See also Appendix B and C. For every individual i with characteristics Xit every second week it
was predicted how many months of stable employment would be expected if that individual started
a programme of this category now. A further category was the option ‘no programme now, but

14
perhaps later’.
The information conveyed by SAPS to the caseworker consisted of two parts: First, for every pro-
gramme the expected number of months in stable employment was predicted. Second, the statisti-
cal precision of the estimates was also conveyed to the caseworker in that the set of all pro-
grammes was divided into three groups: The significantly best programmes, the intermediate pro-
grammes, and the worst programmes. The set of significantly best programmes contains the true
programme with a relatively high statistical confidence. This set was estimated by Multiple Com-
parison with the Best (MCB) routines (see Horrace and Schmidt 2000 or Frölich 2008).
The cardinality of the set of significantly best programmes varies across jobseekers: For some job-
seekers, there was only one programme being statistically significantly better than the rest. For
other jobseekers, this set contained several programmes or, in some cases, all programmes. It was
suggested to the caseworkers to choose an option from the set of significantly best programmes
with a slight preference to be given to the programme with the largest estimate. (This distinction
will be used later when we consider the compliance of the caseworkers.) Important aspects on the
econometric methodology are given in Appendix B, with more information to be found in Frölich
(2008) and the corresponding (more detailed) discussion paper Frölich (2006).
4 Evaluation of the experiment
4.1 The field study and the presumed causal chain
The field study took place from May/June to December 2005. The evaluation of the impact of
SAPS is based on data from the unemployment insurance system until December 2006. In total,
employment predictions were made for 18713 jobseekers whereas the control pool contained
16677 jobseekers in pilot employment offices during this period. In a first instance, we examined
whether the control and treated jobseekers are similar in their observed characteristics. Therefore,
we examined separately the stock (= 22758 jobseekers) and the flow sample (= 12632 job-
seekers).13 All offices passed the randomization test with the exception of the two offices in Ge-
neva. (See Behncke, Frölich, and Lechner 2007 for more details.) It seems that a re-allocation of
caseworkers had taken place in Geneva after our randomization. Therefore, Geneva is treated
13 As described in the previous section we randomized the caseworkers in each office, not the jobseekers themselves.
Hence, randomization at the jobseeker level was not fully under our control.

15
separately in the following. As we will see later, the offices in Geneva also had a very low compli-
ance rate, such that any econometric analysis for these caseworkers would not have been sensible
anyhow.
Apart from the distinction between stock and flow sample we also have to consider the possibility
that a jobseeker’s caseworker may change over time. Apart from random fluctuations e.g. due to
extended holidays, sickness, quit, dismissal, or retirement of the caseworker, the policy of case-
worker-change (Dossierwechsel) is a major reason of this. In many offices, the caseworker is
changed if the jobseeker stays unemployed for more than 6 or 8 months, with the intention to in-
troduce new ideas in the job search process. This implies that those jobseekers for whom a case-
worker change is observed are more likely to have difficulties in finding a job, which is clearly
seen in their unemployment histories. In most of the analyses, we will define treatment status of
the jobseeker as time-invariant according to the randomization status of the first caseworker. More
precisely, for the stock sample it is the caseworker in charge at the inception of the field study,
whereas for the flow sample it is the first caseworker observed after the beginning of the study.
The time-invariant definition will implement the intended randomization design as closely as pos-
sible. However, it also implies that some of the controls may actually have later on been influ-
enced by SAPS predictions, whereas for some of the treated, SAPS predictions were no longer
available. In total, there were 2263 treatment-group switchers. In addition to the total sample, we
will therefore also consider the subsample without switchers, i.e. after deleting all jobseekers for
whom a change in caseworker between treatment and control group has been observed.14 For the
remaining subsample the SAPS predictions were either available during the entire field study or
never at all. Although the switchers are clearly different in their observed characteristics from the
non-switchers, we do not find any evidence for systematic differences between those who switch
into treatment versus those who switch into the control group. See also Appendix D.1.
In evaluating the field study, we follow the hypothesized causal chain of the treatment. Casework-
ers received a one-hour introduction into the use of the Internet SAPS system, which in itself is
unlikely to have affected their counselling style. Thereafter caseworkers were free to download the
employment predictions for any client at any time, which was recorded by our database. Case-
workers were also asked to provide feedback online, which was also recorded.
14 We do not exclude jobseekers with caseworker changes where both caseworkers belonged to the treatment group or
both to the control group.

16
The hypothesized causal chain, which is sketched in the following figure, thus starts with the
download of the SAPS predictions for a particular client.15 Caseworkers usually downloaded them
during or before a counselling meeting. The download of the predictions could have had two ef-
fects: They could have affected the counselling style of the caseworker, who e.g. might have
shown these predictions directly to the unemployed person. Second, they could have influenced
the choice of ALMP, perhaps not immediately but within the next few weeks. From the overall
feedback that we received from the caseworkers, it seems that their counselling style has been only
very little affected, if at all. Hence, the second channel, i.e. the choice of ALMP, is the channel
that we consider most relevant here.
Download of the SAPS predictions → Choice of ALMP
↓ ↓
Counselling style → Employment status one year after
Appendix D.2 provides some details on the frequency of downloading SAPS predictions. Overall,
the SAPS predictions were examined at least once for 37% of all jobseekers in the treatment
group. Hence, for almost two thirds of the jobseekers the predictions were never viewed and these
jobseekers could thus hardly have been influenced by the pilot study. In Geneva, the SAPS project
was almost completely ignored: the SAPS predictions were hardly ever examined at all. Therefore,
Geneva is omitted in most of the following analyses.
4.2 The choice of ALMP between treated and control
Since the main impact of SAPS on employment is expected by changing the allocation of job-
seekers to ALMP, we start with examining the choice of programmes between the treated and the
control jobseekers. In a second step, in Section 4.3 we will also take into account that the SAPS
predictions could only have had an effect on those jobseekers for whom predictions had been
downloaded.
One would expect that caseworkers in the treatment group would (at least partly) follow the pre-
15 There may also have been a spill-over effect from treated to control caseworkers, for which we do not observe any
anecdotal evidence.

17
dictions after they have become available to them. Whether a caseworker followed or complied
with the predictions can be defined in various different ways. The simplest definition considers a
SAPS prediction to have been followed or complied with if the recommended labour market pro-
gramme according to SAPS has subsequently also been assigned to the jobseeker. In fact, below
we consider a number of different definitions of compliance, which all have in common that we
examine, for each jobseeker, whether SAPS predictions and actual assignment to labour market
programmes coincided. We will see that all these different definitions lead to the same conclusion:
compliance with SAPS was low or inexistent.
For the following tables it is important to note that although the caseworkers in the control group
had no access to the SAPS predictions, we nevertheless computed these predictions also for the
jobseekers of the control group. Thereby we can measure “compliance” also for the control group,
which is the probability that the hypothetical predictions for the control group coincide with the
actual choices made for them, without knowing the predictions. Hence, we can examine whether
caseworkers of the treatment group were more likely to follow the SAPS predictions than those of
the control group.
Here, we consider the short-term compliance with the SAPS predictions. In Definition 1, compli-
ance is defined for a jobseeker i if the most recommended programme of the first SAPS-prediction
is identical to the first labour market programme assigned within the following 90 days. If no
ALMP is assigned within these 90 days, this is considered as “no programme” having been as-
signed. In Definition 2, compliance is defined for a jobseeker i if any of the set of MCB best pro-
grammes is identical to the first labour market programme assigned within the following 90 days.
Definition 2 thus subsumes Definition 1.
In principle, it is possible that the 90 days window is too short and caseworkers needed more time
to implement the SAPS recommendations. Similarly, they might have complied with the SAPS
predictions but only with the second ALMP they assigned. For example, they might have had an-
other ALMP in mind for that client and sent him to that programme first before implementing the
SAPS recommendations with a second programme. To permit for such delayed compliance, we
will also consider alternative definitions in Appendix D.3, which we refer to as long-term compli-
ance.
Table 2 gives the respective short-term compliance rates for treated and controls. The assigned
ALMP coincided with the programme with the highest SAPS prediction for only 12% of the job-

18
seekers. If the wider Definition 2 is used, this rate increases to 29%. Strikingly, these rates are the
same for the treatment and the control group. Since the control group reflects what would have
happened in the treatment group if the SAPS predictions were not available, the conclusion is that
the availability of the SAPS predictions had no impact on the actual choice of ALMP. This con-
clusion holds with and without switchers, for the stock and for the flow sample, and in every re-
gion. For the flow sample, it even appears as if the treated complied less than the controls, but this
difference is not statistically significant. The results in Appendix D.3 lead to similar conclusions
for long-term compliance.
Table 2: Short-term compliance of caseworkers in their choice of ALMP
Short term compliance
Observations (number of unem-
ployed) Highest prediction
(Definition 1) Set of highest
predictions (Definition 2)
Treat ment Control Treat
ment Control Treat ment Control
Including switchers 16566 14977 0.12 0.12 0.29 0.29 Without switchers 15701 14155 0.12 0.12 0.29 0.30 Stock sample 9844 8862 0.11 0.11 0.29 0.29 Flow sample 5857 5293 0.13 0.14 0.28 0.30 Basel 3528 3514 0.20 0.22 0.44 0.45 Bern 8484 7458 0.10 0.09 0.26 0.26 Geneva 1843 1437 0.04 0.05 0.14 0.14 St.Gallen 1578 1250 0.11 0.12 0.24 0.26 Zürich 2111 1933 0.08 0.07 0.19 0.18
Note: Unit of observation is the jobseeker. All rows (except the row labelled Geneva) are without Geneva. All rows (except for the first one) are without switchers. Definition 1 refers to the programme with the highest SAPS prediction. Definition 2 refers to all programmes, which belong to the MCB set of statistically significantly better programmes.
These results raise the question why caseworkers did not comply with the SAPS predictions. Two
possible answers stand out: First, caseworkers make their own predictions and it could have hap-
pened that these largely provided the same recommendations as the SAPS predictions. Second,
caseworkers may have more or less ignored the econometric predictions either because of confi-
dence in the superiority of their own judgements or because of unwillingness to comply with an
external tool that could pose a potential threat to their future autonomy and discretion if introduced
nationwide (perhaps with more binding predictions). The first of these answers can be ruled out as
the SAPS predictions differed clearly from the choices made by the control caseworkers. The pat-
terns recommended by SAPS and those realized by the caseworkers without accesses to the
econometric predictions are very different. (See Table D.7 in Appendix D.3.)

19
4.3 The impact of downloading the SAPS predictions on ALMP and employment
Table 2 showed that on average we observe only very little or zero differences between treated and
control groups in the realized choices regarding programme participation. One reason for this
could be that caseworkers disregarded the SAPS predictions from the beginning by not even look-
ing at them. Since the SAPS predictions were made available via the Internet, we could monitor at
what time exactly a caseworker inspected the predictions for a particular jobseeker. In a first in-
stance, we examine how intensively caseworkers have made use of the statistical system to
download predictions from the Internet, and whether this depended on characteristics of the case-
workers or the jobseeker. (Details can be found in Appendix D.2.) We observed that 21 of the
caseworkers (= 15%) never examined the predictions at all, and that for many jobseekers SAPS
predictions were never downloaded. We can thus partition the treatment group into jobseekers for
whom predictions were never viewed and for those for whom they were examined at least once. It
is hard to imagine that SAPS could have had an effect on those jobseekers for whom the predic-
tions were never examined.
We could thus compare compliance and the choice of ALMP for those for whom SAPS predic-
tions had been viewed versus those for whom they had not been inspected. Because the decision to
download SAPS predictions is at the discretion of the caseworker and likely to be endogenous,
such analyses could be affected by selection bias. We therefore perform instrumental variables
regression of the effect of downloading SAPS predictions on compliance. We define for each job-
seeker whether his SAPS predictions were ever downloaded during the field study. For a jobseeker
of the control group, naturally, this never happens. It seems safe to assume that a caseworker who
did not download the predictions is probably unlikely to comply more with the predictions than a
caseworker of the control group. We can thus use the randomization as an instrument, denoted by
Z, for the download of the predictions (treatment D) to estimate the impact of seeing the predic-
tions on compliance status Y. This setup is thus very similar to the concept of Imbens and Angrist
(1994). Since it was impossible for the members of the control group to download the predictions
the monotonicity condition of Imbens and Angrist (1994) is satisfied by definition, and this also
means that the local average treatment effect (LATE) is the same as the average treatment effect
on the treated (ATET) because the treated are the compliers.16 The exclusion restriction is our as-
sumption that unemployed whose caseworker is in the treatment group but not downloading the
16 This is because there are no always-treated, in the language of Imbens and Angrist (1994).

20
predictions are not affected by their status as being randomized in, compared to unemployed with
caseworker randomized to the control group.
Table 3 presents the impact of downloading the predictions on short-term compliance according to
Definitions 1 and 2. We show IV estimates without control variables (i.e. Wald estimates) and
with several control variables (2SLS), which may produce more precise estimates due to efficiency
gains. The first stage regression (not shown) is highly significant in both cases (indicating that the
instrument is not weak). Table 3 shows, however, that all estimates of the effects are insignificant.
The only exception is a negative effect in the flow sample in Basel. The effects in the stock sample
are zero throughout.
In Appendix D.4 the corresponding estimates for the long-term compliance are given. The results
are similar for Definitions 1 and 2, with the negative effect in Basel now only being marginally
significant at the 10% level in one of the two variants considered. Some evidence for a negative
effect in St.Gallen appears as well. The two additional definitions of long-term compliance (Defi-
nition 3 and 4) examined in Appendix D.4 show some indications of a positive effect in Zürich,
which is not very stable, though. Given that we observe no significant effect for Definitions 1 and
2, this result has to be interpreted with care as Definition 3 may be afflicted by some selection bias
(see Appendix D.3 for details on defining compliance). For the other regions, all effects are insig-
nificant.
Table 3: Impact of downloading predictions on short-term compliance
Definition All Basel Bern St.Gallen Zürich Stock sample, with control variables
1 0.00 -0.01 0.01 0.00 0.03 2 0.00 -0.02 0.03 -0.04 0.02
Flow sample, with control variables 1 -0.02 -0.11 0.02 -0.05 0.00 2 -0.05 0.03 -0.02 -0.16 -0.04
Stock sample, without control variables 1 0.00 -0.01 0.01 -0.01 0.02 2 0.00 -0.01 0.02 -0.07 0.02
Flow sample, without control variables 1 -0.03 -0.15** 0.01 -0.03 0.01 2 -0.05 -0.01 -0.02 -0.11 -0.03
Note: Instrumental variable estimates of the effect of downloading the predictions on compliance, where compliance is measured in the short term, i.e. within 90 days. (Geneva is not included since predictions were hardly ever downloaded.) Standard errors are clustered by caseworkers. Significance at the 1%, 5% and 10% level is marked with ***, ** and *, respectively. The following characteristics of the jobseeker are used as control variables: female, age, foreigner with yearly permit, foreigner with residence permit, mother tongue nei-ther German nor French, family size, insured earnings, qualification, employability rating, looking for a part-time job, duration of unem-ployment, unemployment spells in last two years.

21
Hence, these results corroborate the finding that caseworkers did not adjust their selection of
ALMP to the econometric predictions provided by SAPS. In additional analyses (not shown here)
we also examined IV estimates of downloading on the employment probabilities of the jobseekers.
Not surprisingly, no clear and significant pattern was found.
5 Conclusions
A randomized experiment was conducted in Switzerland to evaluate the potential of a statistical
targeting system to assist caseworkers in choosing active labour market programmes for their un-
employed clients. The potential employment outcomes were predicted for each unemployed per-
son based on a large administrative dataset. The experiment was designed such that caseworkers
retained full discretion about the choice of labour market programmes for their unemployed cli-
ents. The evaluation results showed that caseworkers largely ignored the statistical support system.
No significant differences in their choices of labour market programmes could be discerned vis-à-
vis the experimental control group. Caseworkers either decided to ignore the system out of various
reasons, or they were overly confident in their own experience and considered econometric esti-
mates as inferior.
Profiling and targeting of ALMP is a hotly debated topic and several countries including the UK,
Germany, Denmark, Finland, and Sweden are currently piloting such systems or considering their
introduction. Our evaluation results indicate that caseworker discretion may conflict with the pro-
vision of statistical targeting. It seems that stronger incentives are required for caseworkers to
comply with statistical profiling and targeting systems. Either restrictions of caseworker discre-
tions' or positive rewards for complying with the statistical system are needed (i.e. for voluntarily
restricting discretion).
References
Black, D., J. Smith, M. Berger, and B. Noel (2003): "Is the Threat of Reemployment Services More Effective than the Services Themselves? Evidence from Random Assignment in the UI System", American Economic Review, 93, 1313-1327.
Black, D., J. Smith, M. Plesca, and S. Plourde (2002): "Profiling UI claimants to allocate employment services: evi-dence and recommendations for the states", Final report to the US Department of Labour, 2002.
Behncke, S., M. Frölich, and M. Lechner (2007): "Pilotprojekt Statistisch assistierte Programmselektion (SAPS)", Swiss State Secretariat for Economic Affairs (seco), www.seco.admin.ch/dokumentation/publikation/00004/ 00005/index.html?lang=de .
Bell S., and L. Orr (2002): "Screening (and creaming?) applicants to job training programs: the AFDC homemaker-home health aide demonstrations", Labour Economics, 9, 279-301.

22
Berger M., D. Black, and J. Smith (2001): "Evaluating Profiling as a Means of Allocating Government Services", in: Econometric Evaluation of Labour Market Policies, M. Lechner and F. Pfeiffer (eds.), Physica/Springer, Heidel-berg, 59-84.
Brownell K. and T. Wadden (1991): "The heterogeneity of obesity: Fitting treatments to individuals", Behavior Ther-apy, 22, 153-177.
Bryson, A., and D. Kasparova (2003): "Profiling benefit claimants in Britain: A feasibility study", Department for Work and Pensions, Research Report No 196, ISBN 1 84123 620 9.
Colpitts, T. (2002): "Targeting Reemployment Services in Canada: The Service and Outcome Measurement System (SOMS) Experience", in: Eberts, R.W., D.J. O’Leary, S. Wandner (eds.), Targeting Employment Services, Kala-mazoo, Michigan: W.E. Upjohn Institute, 2002, 283-301.
Dehejia, R.H. (2005): "Program evaluation as a decision problem", Journal of Econometrics, 125 (2005) 141–173.
De Koning, J. (1999): "The chance-meter: measuring the individual chance of long-term uneemployment", Paper presented at the Conference 'Current Developments in the Evaluation of Employment Policies', Barcelona, 19-20 July 1999, Division of Labour and Education, Rotterdam.
Dickinson, K., P. Decker, and S. Kreutzer (2002): "Evaluation of WPRS sytems", in: Eberts, R.W., D.J. O’Leary, S. Wandner (eds.), Targeting Employment Services, Kalamazoo, Michigan: W.E. Upjohn Institute, 2002, 61-81.
Eberts, R. (2002): "Design, Implementation and Evaluation of the Work First Profiling Pilot Project", Report for the US Department of Labor. http://wdr.doleta.gov/research/keyword.cfm?fuseaction=dsp_resultDetails&pub_id=2287&bas_option=Keywords&start=1&usrt=4&stype=basic&sv=1&criteria=work%20first .
Eberts, R., and C. O’Leary (2002): "A Frontline Decision Support System for Georgia Career Centres", W.E. Upjohn Institute Staff Working Paper No. 02-84, Kalamazoo, Michigan.
Eberts, R., C. O’Leary and S. Wandner (2002), Targeting Employment Services, Kalamazoo, Michigan: W.E. Upjohn Institute, 2002.
Egger, M., and C. Lenz (2006): "Wirkungsevaluation der öffentlichen Arbeitsvermittlung - Evaluationsbericht", SE-CO Publikation Arbeitsmarktpolitik No 18 (10.2006), Swiss State Secretariat for Economic Affairs (seco), www.seco.admin.ch/dokumentation/publikation/00004/00005/index.html?lang=de French version: www.seco.admin.ch/dokumentation/publikation/00004/00005/index.html?lang=fr .
Fraser, N. (2000): "How strong is the case for targeting active labour market policies", International Journal of Man-power, 20, 151-164.
Fredriksson, P., and P. Johansson (2003): "Program Evaluation and Random Program Starts", IFAU Discussion Paper 2003:1.
Frölich (2006): "Statistical treatment choice: an application to active labour market programmes", IZA Discussion Paper 2187.
Frölich (2008): "Statistical treatment choice: an application to active labour market programmes", forthcoming in the Journal of the American Statistical Association.
Frölich, M., M. Lechner, S. Behncke, S. Hammer, N. Schmidt, S. Menegale, A. Lehmann, and R. Iten (2007): "Ein-fluss der Rav auf die Wiedereingliederung von Stellensuchenden", SECO Publikation Arbeitsmarktpolitik No. 20 (1.2007), Swiss State Secretariat for Economic Affairs (seco), www.seco.admin.ch/dokumentation/publikation/00004/00005/index.html?lang=de .
Frölich, M., M. Lechner, and H. Steiger (2003): "Statistically assisted programme selection – international experiences and potential benefits for Switzerland", Swiss Journal of Economics and Statistics, 139, 311-331.
Horrace W., and P. Schmidt (2000): "Multiple Comparisons with the Best, with Economic Applications", Journal of Applied Econometrics, 15, 1-26.
Keum, J. (2001): "Review of the Effectiveness of Public Employment Services", in: Park, F., Y. Park, G. Betcherman, A. Dar (eds.), Labor Market Reforms in Korea: Policy Options for the Future, Korea Labor Institute.
Kreuter M. and V. Strecher (1996): "Do tailored behavior change messages enhance the effectiveness of health risk appraisals?: results from a randomized trial", Health Education Research, 11, 97-105.

23
Lalive, R., J. van Ours, and J. Zweimüller (2005): "The Effect Of Benefit Sanctions On The Duration Of Unemploy-ment", Journal of the European Economic Association, 3, 1386-1417.
Lechner, M., and J. Smith (2007): "What is the value added by caseworkers?", Labour Economics, 14, 135-151.
Manski, C. (2000): "Identification problems and decisions under ambiguity: Empirical analysis of treatment response and normative analysis of treatment choice", Journal of Econometrics, 95, 415-442.
Manski, C. (2004): "Statistical Treatment Rules for Heterogeneous Populations", Econometrica, 72, 1221-1246.
Manski, C. (2006): "Search Profiling With Partial Knowledge of Deterrence", The Economic Journal, 116, F385–F401
Manski, C. (2007): "Minimax-Regret Treatment Choice with Missing Outcome Data", Journal of Econometrics, 139, 105-115.
Moffitt, R. (2006): "Welfare work Requirements with Paternalistic Government Preferences", The Economic Journal, 116, F441–F458.
Moisala J., I. Suoniemi, and R. Uusitalo (2006): "Työttömien tilastollinen profilointi", http://www.mol.fi/mol/fi/ 99_pdf/ fi/ 06_tyoministerio/ 06_julkaisut/06_tutkimus/tpt316.pdf
Murphy S. (2003): "Optimal dynamic treatment regimes", Journal of Royal Statistical Society, Series B, 65, 331-366.
Murphy S., K. Lynch, D. Oslin, J. McKay, and T. TenHave (2007): "Developing adaptive treatment strategies in sub-stance abuse research", Drug and Alcohol Dependence, Supplement 2, 88S, S24-S30.
OECD (1998): Early Identification of Jobseekers at Risk of Long-term Unemployment: The Role of Profiling, OECD Proceedings, Paris.
O’Leary, D., P. Decker, and S. Wandner (2005): "Cost Effectiveness of Targeted Reemployment Bonuses", Journal of Human Resources, 40, 270-279.
Plesca M., and J. Smith (2005): "Rules versus discretion in social programs: empirical evidence on profiling in em-ployment and training programs", unpublished, University of Michigan.
Persico, N., and P. Todd (2005): "Passenger Profiling, Imperfect Screening, and Airport Security", American Eco-nomic Review, Papers and Proceedings, 95, 127-131.
Persico, N., and P. Todd (2006): "Generalising the Hit Rates Test for Racial Bias in Law Enforcement, With an Appli-cation to Vehicle Searches in Wichita", The Economic Journal, 116, F351–F367.
Rudolph, H., and M. Müntnich (2001): "Profiling zur Vermeidung von Langzeitarbeitslosigkeit – erste Ergebnisse aus einem Modellprojekt", MittAB, 530-553.
Rush A. (2005): "Algorithm-guided treatment in depression: TMAP and STAR*D", in M. Bauer, A. Berghofer and M. Adli (eds), Therapieresistente Depressionen - Aktueller Wissensstand und Leitlinien für die Behandlung in Klinik und Praxis, , Springer, Heidelberg.
Smith, J. (2002): "Comments on Chapter 10, in: Eberts, R.W., D.J. O’Leary, S. Wandner (eds.), Targeting Employ-ment Services, Kalamazoo, Michigan: W.E. Upjohn Institute, 2002, 303-308.
Staghøj, J., M. Svarer, and M. Rosholm (2007): "A Statistical Programme Assignment Model", mimeo.
Stephan, G., S. Rässler, and T. Schewe (2006): "Das TrEffeR-Projekt der Bundesagentur für Arbeit. Die Wirkung von Maßnahmen aktiver Arbeitsmarktpolitik", Zeitschrift für Arbeitsmarktforschung, 39, 447-465.
U.S. Department of Labor, Employment and Training Administration (1999): "Evaluation of Worker Profiling and Reemployment Services Policy Workgroup: Final Report and Recommendations", Washington D.C.
Velicer W., and J. Prochaska (1999): "An expert system intervention for smoking cessation", Patient Education and Counselling, 36, 119-129.
Wandner, S. (2002): "Targeting Employment Services under the Workforce Investment Act", in: Eberts, R.W., D.J. O’Leary, S. Wandner (eds.), Targeting Employment Services, Kalamazoo, Michigan: W.E. Upjohn Institute, 2002, 1-25.
Wunsch, C. (2007): "Optimal Use of Labour Market Policies", Discussion Paper 2007-26, Department of Economics, University of St.Gallen.

24
Appendix
A Data
For the pilot study, detailed data on previous clients was required for the estimation of the coeffi-
cients of the SAPS-system. Furthermore, data was needed for the clients during the field study and
their follow-up information on assignments to ALMP and subsequent employment outcomes.
The estimation of the SAPS-system was based on the entire population of individuals (aged 25 to
55) who registered as jobseekers at an employment office anytime during January 2001 to Decem-
ber 2003. For these 460442 persons, detailed information from the unemployment insurance in-
formation system (AVAM/ASAL) was available from January 1998 to December 2004. This data
set was matched with the complete monthly information from the social security and pensions sys-
tem (AHV) for the period January 1990 to December 2002. These combined data sources contain
very detailed information on registration and de-registration of unemployment, benefit payments
and sanctions, participation in ALMP, eleven years employment histories with monthly informa-
tion on earnings and employment status (employed, unemployed, non-employed, self-employed).
Furthermore, they contain information on socioeconomic characteristics including qualification,
education, language skills (mother tongue, proficiency of foreign languages), job position, experi-
ence, profession, industry, and an employability rating by the caseworker, among other variables.
During the field study in 2005, the information from the unemployment insurance information
system (AVAM/ASAL) was delivered to us biweekly for all currently registered jobseekers.
Finally, in February/March 2007 we received the data from the unemployment insurance informa-
tion system until the end of December 2006. This permits us to follow up each participant of the
field study for at least 12 months.
B Further details on the SAPS predictions
The SAPS predictions are based on estimates of the expected potential outcomes
0, ,[ | ],..., [ | ]R
i t it i t itE Y X E Y Xτ τ+ +
which are used to estimate the expected optimal treatment:
*
{0,..., }( ) arg max [ | ]r
it itr R
r X E Y X X∈
= = .

25
The SAPS system provided estimates of the employment chances 0, ,[ | ],..., [ | ]R
i t it i t itE Y X E Y Xτ τ+ + and
of the optimal treatment r*, based on a rich set of covariates Xi,t, which includes characteristics of
the unemployed person, such as age, gender, family composition, education, language skills, quali-
fications, job experience, past employment and earnings histories, previous participation in pro-
grammes etc., and of the local labour market. Several of these covariates are time varying, e.g. the
current duration of the unemployment spell or the number of vacancies in the local labour market.
For the estimation of the system, an even larger set of covariates was taken into account to elimi-
nate potential selection bias, see Frölich (2008). Since selection bias may be more of a concern for
the young and the older individuals, the SAPS system is restricted in this pilot version to the 25 to
55 year old jobseekers. (For the younger jobseekers, detailed and long employment histories are
often not yet available. For the older jobseekers good health data would be helpful e.g. to assess
their labour market attachment or early retirement options.)
In addition to these estimates of expected employment chances, the SAPS system also provides
estimates of statistical precision, which are conveyed to the caseworker in a simple and accessible
way. Using Multiple Comparison with the Best procedures (MCB), the available programmes are
separated into three categories: 'good', 'intermediate', and 'bad' treatments. The information pro-
vided to the caseworker to assist the treatment choice for jobseeker i is in the following form and
was made accessible via an Internet application developed for the field study:
Table B.1: Example of individual SAPS predictions
Expected number of months in stable employment in the following 12 months for individual i if initiating a labour market programme now or soon:
No programme 6.7 Job search and personality courses 2.7 Language skills training 4.1 Computer skills training 6.1 Further training 5.7 Employment programmes 3.0
Programmes that are statistically significantly better than the others are marked as bold under-
lined, whereas intermediate programmes are marked in bold and the worst programmes are not
marked. (In the pilot study, the best programmes were marked on the screen in green and the worst
in red.) Caseworkers were advised to choose a programme out of the set of statistically best pro-
grammes, with a slight preference to be given to the programme with the highest estimated em-

26
ployment chances. In the example above, the set of best programmes contained the options "no
programme" and "computer skills training".
Generally, the cardinality of this set depends on the covariates Xi,t. For some jobseekers, there was
only one statistically significantly best programme, whereas for others the set of best programmes
might contain three or four, or even all programmes.17 This was intended to show the caseworker
that the information that the statistical system can provide varies across jobseekers and that the
caseworker should trust the SAPS predictions more if they were very precise and consider other
considerations when they were very imprecise.
C Labour market programmes in Switzerland
Many different programmes are available in Switzerland (and these programmes might vary some-
what from region to region). The official classification distinguishes 43 different types, of which
most are training or employment programmes. For various reasons explained below these pro-
grammes were grouped into a few broader categories. The exact definition of the groups varied
slightly from region to region and the following discussion focuses on Basel city. For the region
Basel the ALMP are categorized into six (R+1=6) different groups:
Table C.1: Labour market programmes in Basel
No programme Job search and personality courses Language skills training Computer skills training Further training Employment programmes
The first category 'No programme' means that the jobseeker is not allocated to any ALMP in this
month, but leaving the option for the future, if still unemployed then. This category could therefore
also be labelled as 'waiting' or 'no programme now but perhaps later'. This has to be distinguished
from a treatment 'no programme at all' or 'no programme for the next 12 months' or 'no programme
for the entire unemployment spell'. Such a programme does not exist in the above list out of two
17 The confidence level for the statistical inference was also randomized across caseworkers but this did not seem to
affect their behaviour at all.

27
reasons: First, forgoing the option to choose a labour market programme later is not really a sensi-
ble choice for a caseworker. The caseworker meets the jobseeker about once a month and decides
about actions to be taken then. Sequential plans may be developed but at every meeting, the latest
information and events are incorporated to update such plans. Second, identifying the effect of a
treatment 'no programme for the next 12 months' is more difficult than for a treatment 'no pro-
gramme now but perhaps later' because of the dynamic nature of the job search. When examining
previous participants in 'no programme for the next 12 months', many of them had been lucky
enough to find a job before a programme had been assigned. Hence, this group may contain a lar-
ger proportion of good risks or individuals successful in the job search. For further discussion, see
Fredriksson and Johansson (2003).
The categories two to six contain active programmes.18 The second category consists of a variety
of often short, basic courses, including training in effective job search strategies and resume writ-
ing and more intensive personality courses, which provide psychological backing for handling the
shock of becoming unemployed and coaching in developing new perspectives to entering the la-
bour market. These courses may be tailored to different groups (manual workers, management)
and offered in different languages.
The third category contains language and communication skills training for foreigners (including
alphabetization courses, basic skills in dealing with Swiss administrations and vocational language
courses for low educated foreigners)19 as well as courses in foreign languages at different levels.
Category 4, computer training, refers mostly to general courses in office applications such as word
processing and spreadsheet calculations, but also stock keeping and order management software.
The fifth category consists of further training in the jobseeker's occupation. Its duration is usually
between one week and two months. (Re-training to a new profession is not offered by Swiss
ALMP.)
The sixth category consists of subsidized employment programmes or job creation schemes in a
sheltered labour market, usually of three to six months duration. This includes activities in can-
tonal and municipal administrations (including hospitals, kindergartens, schools, and nursing
18 Only courses of at least five days duration are included. Shorter courses are included in the no programme category.
Such may be short evening courses that provide information on the duties and rights of unemployed or language
proficiency tests for assessing the need for a language course or its appropriate level. 19 Learning occupation specific vocabulary e.g. in the construction or hotel and restaurant industry.

28
homes) and non-regular workplaces in charitable, cultural, recycling, environmental protection or
other non-profit organizations. Internships are also included in this category.
Given the large number of active labour market programmes available in Switzerland the above
grouping into only 5 broad categories may appear rather rough. There are several reasons for not
choosing very narrow categories, though. One reason is statistical precision in that the number of
observations available in the dataset would be very small for some courses. However, there are
also more substantial issues. First, all of the R available categories should make sense for every
jobseeker. If one of the categories was defined as a language course for foreigners, it would not be
a reasonable option for a Swiss jobseeker and no predictions should be made because such a pro-
gramme would be dismissed from the outset. The choice set {0, ..., 5} would thus depend on the
characteristics Xit and would have to be treated as a function of Xit, which would complicate the
implementation. By defining a category language skills training which includes German, French
and foreign language courses, this category becomes feasible for every jobseeker, and the Xit char-
acteristics (e.g. mother tongue, profession) define which type of language course or further train-
ing is appropriate.
A second reason is that the caseworker may actually have much better information for choosing
the exact course out of a broader category. The statistical system may be able to estimate how
much the labour market values different types of training, but cannot recommend whether an ad-
vanced or intermediate English course would be more appropriate. The caseworker may also know
better about local waiting lists or supply constraints that are to be taken into account when allocat-
ing a course.
Third, in the pilot study employment predictions are made for the year 2005/06 based on data on
participants of the years 2001 to 2003. During these years, some of these courses have been modi-
fied and providers have changed in several details. However, the broader structure of these pro-
grammes remained largely unchanged. Therefore, we do not want to define categories too nar-
rowly, as specific courses may be rather different today.20
20 The above categories contain only programmes that a caseworker can actively assign. The Swiss labour market
policy also provides a few other instruments, such as subsidies for temporary jobs (interim jobs), regular jobs (set-
tling-in allowances), and self-employment assistance. These are not included in the statistical system since the for-
mer are largely contingent upon that a job has already been found (and thus cannot be assigned directly by the
caseworker) and since the occurrence of self-employment assistance is relatively rare and the selection problem

29
D Evaluation of the field study
D.1 Sample
In this appendix additional material about the evaluation of the experiment is given. The following
table shows the number of treated and control jobseekers in the five regions.
Table D.1: Sample sizes
Stock sample Flow sample 22758 12632 treatment control treatment control All 12079 10679 6634 5998 All without Geneva 10401 9472 6165 5505 Basel 2404 2368 1158 1202 Bern 5501 4805 3474 3004 Geneva 1678 1207 469 493 St.Gallen 1078 960 757 549 Zürich 1418 1339 776 750
Note: Number of treated and control jobseekers in the five regions. The first row refers to the entire sample. The second row refers to all regions except Geneva.
A jobseeker is defined as treated or control according to the treatment status of his first caseworker
during the field study. For some jobseekers, a change in their caseworker happened, where the new
caseworker might have a different treatment status. The occurrence of such a switching is exam-
ined in the following table. Examining the stock sample, one can see that for about 800 of the
treated and control jobseekers their treatment status changes over time. Of those jobseekers whose
caseworkers were in the treatment group at the beginning of the field study, 238 moved to a case-
worker of the control group and 556 moved to a caseworker who belongs neither to the SAPS
treatment nor to the control group.21 These jobseekers started as being treated but then received no
predictions anymore. (A treatment effect of SAPS might thus be diminished for this group.) Note
that there are only 16 cases changing treatment status more than once over time. For those job-
seekers who started being in the control group, 448 moved to a caseworker who belonged neither
to the treatment nor to the control group. For these jobseekers, predictions never became available.
The only group that could raise concern are those 345 observations who started as controls and
ended up in the treatment group. These could bias a treatment effect downward. Nevertheless, they
more difficult to handle.
21 These caseworkers did not participate in the randomization or started working for the employment office after the
randomization.
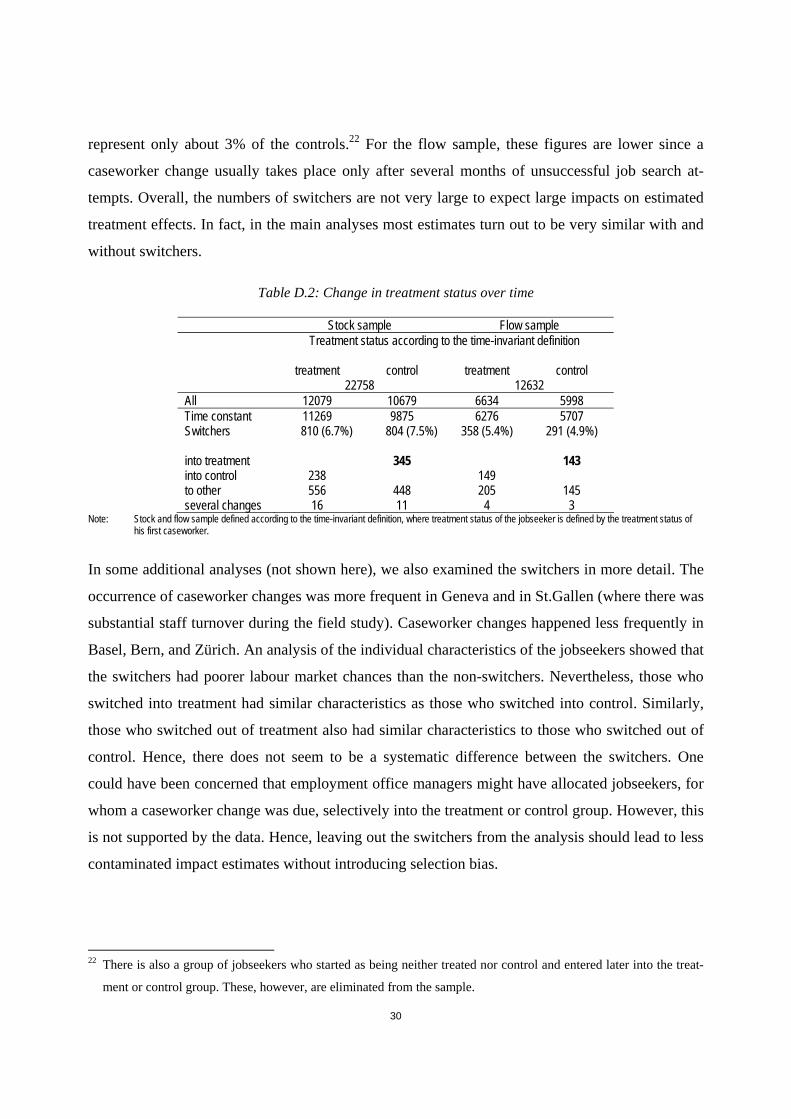
30
represent only about 3% of the controls.22 For the flow sample, these figures are lower since a
caseworker change usually takes place only after several months of unsuccessful job search at-
tempts. Overall, the numbers of switchers are not very large to expect large impacts on estimated
treatment effects. In fact, in the main analyses most estimates turn out to be very similar with and
without switchers.
Table D.2: Change in treatment status over time
Stock sample Flow sample Treatment status according to the time-invariant definition treatment control treatment control 22758 12632 All 12079 10679 6634 5998 Time constant 11269 9875 6276 5707 Switchers 810 (6.7%) 804 (7.5%) 358 (5.4%) 291 (4.9%) into treatment 345 143 into control 238 149 to other 556 448 205 145 several changes 16 11 4 3
Note: Stock and flow sample defined according to the time-invariant definition, where treatment status of the jobseeker is defined by the treatment status of his first caseworker.
In some additional analyses (not shown here), we also examined the switchers in more detail. The
occurrence of caseworker changes was more frequent in Geneva and in St.Gallen (where there was
substantial staff turnover during the field study). Caseworker changes happened less frequently in
Basel, Bern, and Zürich. An analysis of the individual characteristics of the jobseekers showed that
the switchers had poorer labour market chances than the non-switchers. Nevertheless, those who
switched into treatment had similar characteristics as those who switched into control. Similarly,
those who switched out of treatment also had similar characteristics to those who switched out of
control. Hence, there does not seem to be a systematic difference between the switchers. One
could have been concerned that employment office managers might have allocated jobseekers, for
whom a caseworker change was due, selectively into the treatment or control group. However, this
is not supported by the data. Hence, leaving out the switchers from the analysis should lead to less
contaminated impact estimates without introducing selection bias.
22 There is also a group of jobseekers who started as being neither treated nor control and entered later into the treat-
ment or control group. These, however, are eliminated from the sample.

31
D.2 Download of SAPS predictions
The 142 caseworkers in the treatment group could download the SAPS predictions anytime for any
of their clients. Twenty-one caseworkers never used this option at all. The following discussion
provides some information on the frequency of downloading the SAPS predictions.
Overall, for about 37% of all jobseekers in the treatment group their SAPS predictions were exam-
ined at least once. Hence, for nearly two thirds they were never inspected. For the 142 casework-
ers the following table shows for how many of their clients the SAPS predictions were viewed at
least once. The average (median) caseworker counselled during the entire field study a total num-
ber of 163 jobseekers. The total number of cases per caseworker varied from a minimum of 8 to a
maximum of 283 clients. This variation is partly due to different caseloads but also due to different
lengths of the field study, which did not start in all offices at the same time and ended earlier for
those caseworkers who retired. It is also due to different labour market conditions, e.g. the pace of
job turnover. The average caseworker downloaded SAPS predictions for 51 different clients,
whereas the most active caseworker examined predictions for 174 clients. The average caseworker
examined the SAPS predictions for 33% of his clients, with the most active caseworker even view-
ing the predictions for 83% of his clients. The frequency of downloading the predictions was larg-
est in St.Gallen and Zürich. In Geneva, on the other hand, the SAPS predictions were downloaded
on average for less than 1% of all clients (not shown). In other words, SAPS was almost com-
pletely ignored in Geneva.
Table D.3: Frequency of download of SAPS predictions per caseworker (all regions without Geneva)
25% quantile Median 75%
quantile Minimum Maxi-mum
Number of jobseekers for whom predictions were downloaded 8 51 78 0 174 Total number of jobseekers during field study 129 163 188 8 283 Fraction of jobseekers for whom predictions were downloaded 0.08 0.33 0.57 0 0.83 in Basel 0.09 0.40 0.56 0 0.81 in Bern 0.13 0.37 0.56 0 0.83 in Geneva 0.00 0.00 0.01 0 0.25 in St.Gallen 0.17 0.54 0.62 0.02 0.72 in Zürich 0.18 0.51 0.67 0 0.79 Note: 142 caseworkers. All rows (except the row labelled Geneva) are without Geneva. For each variable in column 1 the 0.25, median and
0.75 quantile and the minimum and maximum over the 142 caseworkers (without those in Geneva) is given.
In the Tables D.4 and D.5, we examine whether the probability of downloading the predictions
depends on the jobseeker characteristics and/or on the caseworker characteristics. Table D.4 shows
the probit regression of download on several jobseeker characteristics. The estimation results for

32
Geneva should be interpreted with caution since the SAPS predictions were hardly ever
downloaded. The main pattern observed is a higher likelihood of examining SAPS predictions for
those who had been more unemployed in the last two years, and a lower likelihood for those job-
seekers in the flow sample. The latter may be due to a somewhat declining interest on the side of
the caseworkers during the pilot study.
Table D.4: Probability of download as a function of jobseeker characteristics
Dependent variable With switch-ers Without switchers
Download of prediction All without Geneva
All without Geneva Basel Bern Geneva St.Gallen Zürich
Female jobseeker -0.036 -0.036 0.031 -0.15*** 0.158 0.059 0.17* Age/100 0.257 0.288 1.542 -0.96 6.087* 3.68** 0.66 Age/100 squared 0.31 0.329 -1.41 1.9 -7.501* -4.325** -0.03 Foreigner with yearly permit (B) -0.055 -0.045 0.06 -0.14** -0.331*** -0.007 0.08 Foreigner with residence permit (C) -0.008 -0.015 0.013 -0.05 -0.241*** 0.028 -0.05 Qualification (reference: apprenticeship/degree) No qualification -0.035 -0.036 0.043 -0.1 -0.538** -0.015 0.15 Short apprenticeship 0.126** 0.127** -0.08 0.09 -0.304* 0.007 0.26* Apprenticeship or degree that is not officially recognized in Switzerland -0.002 -0.01 -0.09 0.01 -0.071 0.126 0.07
Employability medium 0.129 0.148 0.067 0.19 -0.467** 0.668*** 0.08 Employability difficult 0.1 0.11 0.215 0.18 -0.256* 0.381* 0.08 Looking for part-time job -0.122*** -0.133*** -0.1 -0.14** -0.352 -0.096 0.05 Current duration of unemployment 0.00 0.00 0.00 0.00** 0.00 0.001*** -0.00** Number of unemployment spells in last 2 years 0.209*** 0.224*** 0.328*** 0.16*** 0.189 0.531** 0.25* In flow sample -0.48*** -0.475*** -0.62*** -0.45*** -0.514*** -0.4*** -0.42*** Constant -0.325* -0.348* -0.64* -0.18 -2.275** -1.382*** -0.22 N 16563 15699 3528 8482 1843 1578 2111
Note: Probit regression. All jobseekers of the treatment group (without Geneva). Dependent variable: whether, for the particular jobseeker, SAPS predictions have been downloaded at least once. Standard errors are clustered by caseworkers. Significance at the 1%, 5% and 10% level is marked with ***, ** and *, respectively.
Table D.5 includes also caseworker characteristics additionally in the regression. The caseworker
characteristics are mostly insignificant and their coefficients do not display a clear pattern across
regions. For the jobseeker characteristics it again appears that the number of unemployment spells
and the current duration of unemployment has a positive effect on the download probability. The
negative coefficient for the flow sample remains. The variable 'short apprenticeship' (=Anlehre) is
positively significant in both tables. In Switzerland, a 'short apprenticeship' is of two years dura-
tion with reduced skill requirements, and is distinct from a 'regular apprenticeship' which is of
three years duration and more demanding. Jobseekers with a 'short apprenticeship' are thus not
unqualified but signal a clear qualification gap, which could perhaps partly be filled with ALMP.
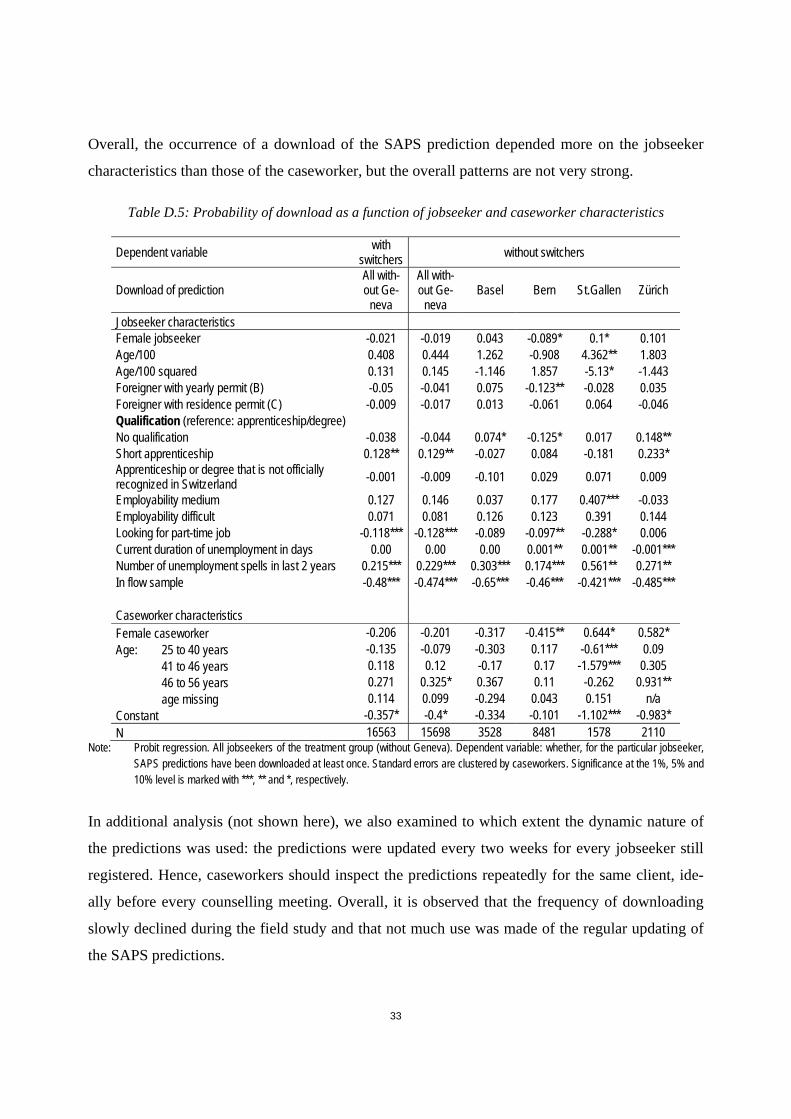
33
Overall, the occurrence of a download of the SAPS prediction depended more on the jobseeker
characteristics than those of the caseworker, but the overall patterns are not very strong.
Table D.5: Probability of download as a function of jobseeker and caseworker characteristics
Dependent variable with switchers without switchers
Download of prediction All with-out Ge-
neva
All with-out Ge-
neva Basel Bern St.Gallen Zürich
Jobseeker characteristics Female jobseeker -0.021 -0.019 0.043 -0.089* 0.1* 0.101 Age/100 0.408 0.444 1.262 -0.908 4.362** 1.803 Age/100 squared 0.131 0.145 -1.146 1.857 -5.13* -1.443 Foreigner with yearly permit (B) -0.05 -0.041 0.075 -0.123** -0.028 0.035 Foreigner with residence permit (C) -0.009 -0.017 0.013 -0.061 0.064 -0.046 Qualification (reference: apprenticeship/degree) No qualification -0.038 -0.044 0.074* -0.125* 0.017 0.148** Short apprenticeship 0.128** 0.129** -0.027 0.084 -0.181 0.233* Apprenticeship or degree that is not officially recognized in Switzerland -0.001 -0.009 -0.101 0.029 0.071 0.009
Employability medium 0.127 0.146 0.037 0.177 0.407*** -0.033 Employability difficult 0.071 0.081 0.126 0.123 0.391 0.144 Looking for part-time job -0.118*** -0.128*** -0.089 -0.097** -0.288* 0.006 Current duration of unemployment in days 0.00 0.00 0.00 0.001** 0.001** -0.001*** Number of unemployment spells in last 2 years 0.215*** 0.229*** 0.303*** 0.174*** 0.561** 0.271** In flow sample -0.48*** -0.474*** -0.65*** -0.46*** -0.421*** -0.485*** Caseworker characteristics Female caseworker -0.206 -0.201 -0.317 -0.415** 0.644* 0.582* Age: 25 to 40 years -0.135 -0.079 -0.303 0.117 -0.61*** 0.09 41 to 46 years 0.118 0.12 -0.17 0.17 -1.579*** 0.305 46 to 56 years 0.271 0.325* 0.367 0.11 -0.262 0.931** age missing 0.114 0.099 -0.294 0.043 0.151 n/a Constant -0.357* -0.4* -0.334 -0.101 -1.102*** -0.983* N 16563 15698 3528 8481 1578 2110
Note: Probit regression. All jobseekers of the treatment group (without Geneva). Dependent variable: whether, for the particular jobseeker, SAPS predictions have been downloaded at least once. Standard errors are clustered by caseworkers. Significance at the 1%, 5% and 10% level is marked with ***, ** and *, respectively.
In additional analysis (not shown here), we also examined to which extent the dynamic nature of
the predictions was used: the predictions were updated every two weeks for every jobseeker still
registered. Hence, caseworkers should inspect the predictions repeatedly for the same client, ide-
ally before every counselling meeting. Overall, it is observed that the frequency of downloading
slowly declined during the field study and that not much use was made of the regular updating of
the SAPS predictions.

34
D.3 Long-term compliance with the SAPS predictions
In Table 2, we observed that the incidence of “compliance” with the SAPS predictions was almost
identical in the treatment and the control group. Compliance was defined if SAPS predictions and
actual treatment choice coincided within the subsequent 90 days. In the following, we consider
alternative definitions of compliance, which nevertheless all lead to the same conclusion that dif-
ferences in compliance between treated and control are (close to) zero.
In the following definitions of compliance, again the first SAPS prediction is examined and com-
pared to the actual assignment to ALMP, where the entire period after the SAPS prediction until
December 2006 is considered. In addition, the first three assigned ALMP are examined.23 Hence, a
caseworker who assigned first a non-recommended ALMP but afterwards as a second (or third)
ALMP also a recommended programme would be considered as complying, even if the second or
third programme was assigned only many months later. Hence, we permit a delayed compliance in
that a caseworker might have initiated a different programme first with the option to consider the
SAPS suggestions later. This thus captures the long-term effect of the SAPS predictions on the
choice of ALMP.
The following table shows the results for 8 different definitions. To structure these different defini-
tions we distinguish between 4 definitions and 2 versions. The 2 versions differ in how they define
when a jobseeker has realized the option “no programme”.
In Version A a jobseeker is considered to have received “no programme” if he was not assigned to
any ALMP at all until the end of our observation period in December 2006. (If he was assigned to
at least one ALMP, he is considered to have not received “no programme”.) In Version B a job-
seeker is considered to have received “no programme” if he was assigned to at most two ALMP
until the end of our observation period in December 2006. I.e. he is considered to have received
“no programme” in addition to the other ALMP that he participated in. If he was assigned to three
or more ALMP, he is considered to have not received “no programme”. In other words, “no pro-
gramme” in Version A means no ALMP at all, whereas in Version B it means at most two ALMP,
23 Only ALMP after the first SAPS-prediction are considered. For the stock sample, this corresponds with the start of
the field study. For a jobseeker of the flow sample, this corresponds to the first date of uploading predictions for
this individual. We focus on the first SAPS prediction being made, because compliance with later predictions are
harder to measure as there might be a delayed effect from previous predictions. In addition, the caseworkers’ inter-
est and attention seems to have been highest in the early phase of the field study.

35
but not more.
The four different definitions differ in how they define whether SAPS predictions and actual allo-
cations coincided. In Definition 1 compliance is defined if the programme with the highest SAPS
predictions coincided with any of the first three assigned programmes (including the “no pro-
gramme” option). In Definition 2 compliance is defined if any of the programmes that are in the
MCB set of best programmes coincided with any of the first three assigned programmes (including
the “no programme” option).24 Although this definition of compliance is extremely wide, it was
satisfied only for 29% (Version A) or 35% (Version B) of all jobseekers, as Table D.6 shows. Ex-
amining the results for treated and control we observe no systematic difference in compliance
rates. If any difference is discernible at all, it even points towards slightly less compliance of the
treated caseworkers. As before, the only exception is Geneva. Since SAPS predictions were hardly
ever downloaded in Geneva, this difference can only be the result of randomization not having
been successful in Geneva in that it did not lead to a balanced control group. (The compliance
rates for Basel are much higher than for the other regions, which is at least partly due to the
smaller number of ALMP categories in Basel, which were only 6 for Basel and 7 for the other re-
gions, including the no participation option.)
Before concluding that no compliance difference exists, we examined two additional definitions of
compliance. One could imagine that our findings might have to do with the fact that we treated the
"no programme" option just as another treatment option in the SAPS predictions. However, it
could well be that caseworkers consider this option as something very different from an active
choice of an ALMP.
First, one could imagine that caseworkers first decide (i.e. without consulting SAPS) whether us-
ing ALMP or not is most appropriate for a particular client. Only if they conclude that an ALMP
should be assigned, they might wish to examine the SAPS predictions. In this case, we would like
to measure compliance only in the second step of this two-stage decision process. We therefore
consider as compliance if the jobseeker was assigned to the programme with the largest SAPS
prediction, given that an ALMP was assigned (Definition 3). In other words, for Definition 3 all
24 Note that, for Version B, these definitions include the case of short-term compliance as discussed in Table 2. Ver-
sion A of long-term compliance, however, is neither strictly weaker nor stronger than short-term compliance. It is
weaker in the sense that long-term compliance considers the first three programmes assigned. It is stricter in the
sense that “no programme” requires no ALMP until the end of 2006, whereas short-term compliance only requires

36
jobseekers who never received any ALMP are deleted, and for the remaining jobseekers, we apply
Definition 1: Compliance is defined if the programme with the highest SAPS prediction coincided
with any of the first three assigned programmes (not including the “no programme” option).
The results are shown in Table D.6. (Because the definition is the same for Version A and B, no
numbers for Version B Definition 3 are given.) The note below Table D.6 gives the number of
observations who are not deleted for Definition 3, which are roughly a third of the total sample. If
the decision to assign any ALMP at all or not was already influenced by SAPS or related to some
unobserved characteristics, this could be a selected sample and might incorporate some selection
bias. Again, there seems to be no difference between treatment and control group, perhaps with the
exception of Zürich, where compliance according to this definition was higher for the treated than
for the compliers.
For the second alternative definition (Definition 4), one could imagine that caseworkers may have
considered the SAPS predictions as too much tilted towards active ALMP. Therefore, caseworkers
may have followed the SAPS predictions in general but preferred to choose the “no programme”
option more often. (The target variable of the SAPS project ignored programme costs entirely and
due to its focus on stable employment, penalized short job spells; both aspects could have been at
odds with the preferences of (some of) the caseworkers.)
In Definition 4, we do not eliminate those cases where no ALMP has been chosen but consider
instead the "no programme" option to be always among the set of best options. Hence, we artifi-
cially augment the MCB set of best programme with the "no programme" option. Compliance is
then defined, analogously to Definition 2, if the jobseeker was assigned to a programme out of the
set of significantly best programmes including "no programme" (Definition 4).25
As Table D.6 shows, there is again no systematic difference in compliance rates between treated
and control. Only in Zürich a small difference can be observed, which is not significant. (The
overall much higher compliance rate of about 80% is due to the artificial augmentation with the no
programme option, since many jobseekers did not receive any ALMP at all.)
no ALMP for the subsequent 90 days.
25 More precisely, compliance according to Version A is defined if either never an ALMP has been assigned or if any
of the first three assigned ALMP coincided with the MCB set of best programmes. Version B is complied with if ei-
ther Version A is satisfied or if less than three ALMP have been assigned until December 2006 and “no pro-
gramme” belonged to the MCB set of best programmes according to the SAPS predictions.

37
Hence, whichever definition we look at, the conclusion is always nearly the same. Only in Zürich
a (insignificant) difference can be observed for Definitions 3 and 4, but none for the, more plausi-
ble, Definitions 1 and 2. For the other regions, no differences are discerned and sometimes it ap-
pears even as if there is less compliance among treated than controls. Table D.6 thus suggests that
the availability of the SAPS-predictions seems to have been ignored almost completely by the
caseworkers, at least in the sense that their choices of ALMP are not significantly different from
those of the control group.
Table D.6: Long-term compliance of caseworkers in their choice of ALMP
Long-term compliance (Version A)
Highest prediction (Definition 1)
Set of highest predictions
(Definition 2)
Highest prediction, only if an ALMP was assigned (Definition 3)
Set of highest predictions includ-
ing no ALMP (Definition 4)
Treat-ment Control Treat
ment Control Treat-ment Control Treat-
ment Control
Including switchers 0.12 0.13 0.29 0.29 0.27 0.26 0.75 0.74 Without switchers 0.13 0.13 0.29 0.29 0.27 0.26 0.75 0.74 Stock sample 0.12 0.12 0.30 0.30 0.29 0.29 0.78 0.77 Flow sample 0.13 0.14 0.28 0.28 0.23 0.23 0.71 0.71 Basel 0.19 0.19 0.41 0.41 0.28 0.30 0.77 0.77 Bern 0.10 0.10 0.27 0.26 0.25 0.25 0.74 0.73 Geneva 0.11 0.15 0.23 0.26 0.39 0.44 0.78 0.74 St.Gallen 0.12 0.13 0.25 0.27 0.26 0.26 0.72 0.70 Zürich 0.10 0.10 0.22 0.21 0.34 0.27 0.80 0.78 Long-term compliance (Version B)
Highest prediction (Definition 1)
Set of highest predictions
(Definition 2)
Highest prediction, only if an ALMP was assigned (Definition 3)
Set of highest predictions includ-
ing no ALMP (Definition 4)
Treat-ment Control Treat
ment Control Treat-ment Control
Including switchers 0.16 0.17 0.35 0.36 0.81 0.80 Without switchers 0.16 0.17 0.35 0.36 0.81 0.81 Stock sample 0.15 0.15 0.35 0.36 0.84 0.83 Flow sample 0.18 0.19 0.35 0.36
same as above
0.78 0.78 Basel 0.25 0.27 0.51 0.52 0.87 0.87 Bern 0.14 0.13 0.32 0.32 0.80 0.79 Geneva 0.11 0.16 0.25 0.28 0.80 0.76 St.Gallen 0.16 0.18 0.30 0.34 0.76 0.77 Zürich 0.12 0.11 0.25 0.23 0.83 0.80
Note: Unit of observation is the jobseeker. All rows (except the row labelled Geneva) are without Geneva. All rows (except for the first one) are without switchers. The number of observations for Definition 3 is 5689 in the treatment and 5333 in the control group. Without switchers, these are 5293 and 4929. In stock sample: 3075 and 2978. In flow sample: 2218 and 2021. In Basel, Bern, Geneva, St.Gallen and Zürich these numbers are 1110 and 1176, 2960 and 2653, 679 and 568, 599 and 510, 624 and 590, respectively.

38
Table D.7: Recommended and realized treatment choices
First SAPS prediction Allocated programme after start of pilot study
Highest prediction First programme First three pro-grammes
treatment control treatment control treatment control Basel Number of observations 3528 3514 3528 3514 3528 3514 No ALMP 21.15 22.65 68.54 66.53 97.93 97.84 Basic courses (job search training, personality course) 11.45 12.07 10.12 12.81 10.23 12.86 Language course 9.47 9.36 3.26 3.22 3.74 3.84 Computer course 15.31 14.88 2.98 2.25 3.49 3.02 Further training 27.52 26.07 2.27 1.79 2.98 2.45 Employment programme 15.11 14.97 6.15 6.63 8.62 9.68 Other courses 6.69 6.77 8.76 8.48 Bern Number of observations 8484 7458 8484 7458 8484 7458 No ALMP 10.25 9.76 65.10 64.43 95.95 95.64 Basic courses (job search training, personality course) 1.98 1.78 10.58 10.53 10.89 10.78 Language course 12.28 12.24 5.32 5.36 6.22 6.30 Computer course 19.10 20.10 2.25 2.16 3.22 3.24 Further training 21.60 21.47 2.85 2.70 4.14 3.96 Employment programme (individual) / internship 28.58 27.25 2.31 2.44 3.14 3.35 Employment programme (collective) / training firm 6.20 7.40 4.96 4.83 7.44 6.74 Other courses 6.62 7.56 8.99 9.90 St.Gallen Number of observations 1578 1250 1578 1250 1578 1250 No ALMP 11.91 12.24 62.04 59.20 94.74 94.24 Basic courses (job search training) 6.34 5.92 11.09 9.28 11.22 9.44 Personality course 16.98 14.56 6.65 9.12 9.38 11.68 Language course 24.40 25.36 3.80 5.28 6.08 6.80 Computer course 7.22 8.16 2.66 2.96 4.82 4.88 Further training 30.42 30.96 0.32 0.40 0.51 1.12 Employment programme 2.72 2.80 8.87 9.36 13.94 15.28 Other courses 4.56 4.40 6.65 6.56 Zürich Number of observations 2111 1933 2111 1933 2111 1933 No ALMP 7.58 6.67 70.44 69.48 98.20 98.86 Basic courses (job search training) 7.67 6.41 15.11 15.26 15.11 15.26 Personality course 8.15 6.83 1.71 1.66 2.42 2.43 Language course 31.83 32.44 4.55 4.50 5.73 5.69 Computer course 12.08 15.73 1.71 1.60 2.65 2.38 Further training 16.96 16.14 0.90 0.57 1.18 0.72 Employment programme 15.73 15.78 4.50 4.86 6.73 7.09 Other courses 1.09 2.07 1.56 2.53
Note: All jobseekers, without switchers, without Geneva.
Table D.7 compares the patterns of ALMP that were recommended by SAPS with those actually

39
assigned in the treatment and control group. It shows, first, that there were no systematic differ-
ences between treated and control, and, second, that the SAPS recommendations were clearly dif-
ferent from those actually realized. Hence, the potential argument that the reason for why we did
not observe any effect on the pilot study being the coincidence of the caseworkers’ own predic-
tions with those of SAPS is not supported.
D.4 IV estimates of long-term compliance with the SAPS predictions
Tables D.8 and D.9 provide the instrumental variable estimates for long-term compliance, and thus
complements Table 3 which showed the corresponding results for short-term compliance.
Table D.8: Impact of downloading predictions on long-term compliance (Version A)
Definition All Basel Bern St.Gallen Zürich Stock sample, with control variables
1 0.00 0.02 0.00 0.02 0.02 2 0.00 0.00 0.02 -0.02 0.02 3 0.02 -0.06 0.03 0.02 0.10** 4 0.03* 0.01 0.04 0.03 0.05
Flow sample, with control variables 1 -0.02 -0.01 0.01 -0.09 0.01 2 0.00 0.11 0.01 -0.09 0.01 3 0.00 -0.03 -0.04 -0.03 0.18 4 0.02 0.08 -0.03 0.06 0.11**
Stock sample, without control variables 1 0.00 0.01 0.00 0.01 0.01 2 0.00 0.00 0.02 -0.04 0.02 3 0.02 -0.06 0.04 0.03 0.10** 4 0.04* 0.01 0.05 0.03 0.06*
Flow sample, without control variables 1 -0.03 -0.02 -0.02 -0.08 0.01 2 0.00 0.10 0.00 -0.05 0.02 3 0.01 0.00 -0.03 0.00 0.18 4 0.01 0.08 -0.03 0.08 0.07
Note: Instrumental variable estimates of the effect of downloading the predictions on compliance, where compliance is measured in the long term (Version A). (Geneva is not included since predictions were hardly ever downloaded.) Standard errors are clustered by casework-ers. Significance at the 1%, 5% and 10% level is marked with ***, ** and *, respectively.

40
Table D.9: Impact of downloading predictions on long-term compliance (Version B)
Definition All Basel Bern St.Gallen Zürich Stock sample, with control variables
1 0.00 -0.02 0.01 -0.01 0.03 2 -0.01 -0.02 0.02 -0.07 0.03 3 0.02 -0.06 0.03 0.02 0.10** 4 0.02 -0.01 0.04* -0.03 0.05
Flow sample, with control variables 1 -0.05 -0.14* 0.00 -0.14** 0.02 2 -0.03 0.04 0.01 -0.19 0.02 3 0.01 0.00 -0.04 -0.05 0.18 4 -0.02 0.01 -0.03 -0.04 0.09
Stock sample, without control variables 1 0.00 -0.02 0.01 -0.03 0.02 2 -0.01 -0.02 0.02 -0.11 0.02 3 0.02 -0.06 0.04 0.03 0.10** 4 0.03 0.00 0.05** -0.04 0.06
Flow sample, without control variables 1 -0.04 -0.16* 0.00 -0.09 0.04 2 -0.02 0.01 0.01 -0.13 0.04 3 0.01 0.00 -0.03 0.00 0.18 4 -0.01 -0.01 -0.02 0.00 0.09
Note: Instrumental variable estimates of the effect of downloading the predictions on compliance, where compliance is measured in the long term (Version B). (Geneva is not included since predictions were hardly ever downloaded.) Standard errors are clustered by casework-ers. Significance at the 1%, 5% and 10% level is marked with ***, ** and *, respectively.