tardir/tiffs/a392383 - apps.dtic.mil
55
f, * % AD Award Number: DAMD17-98-1-8192 TITLE: Quantitative Breast Lesion Imaging and Characterization Using a Combined X-Ray CT-Gamma Camera Methodology PRINCIPAL INVESTIGATOR: Hamilton Tang, Ph.D. Randall Hawkins, M.D., Ph.D. CONTRACTING ORGANIZATION: University of California San Francisco San Francisco, California .94143-0962 REPORT DATE: July 2 000 TYPE OF REPORT: Annual Summary PREPARED FOR: U.S. Army Medical Research and Materiel Command Fort Detrick, Maryland 21702-5012 DISTRIBUTION STATEMENT: Approved for Public Release; Distribution Unlimited The views, opinions and/or findings contained in this report are those of the author(s) and should not be construed as an official Department of the Army position, policy or decision unless so designated by other documentation. 20010/27 m
Transcript of tardir/tiffs/a392383 - apps.dtic.mil

f,
* %
AD
Award Number: DAMD17-98-1-8192
TITLE: Quantitative Breast Lesion Imaging and Characterization Using a Combined X-Ray CT-Gamma Camera Methodology
PRINCIPAL INVESTIGATOR: Hamilton Tang, Ph.D. Randall Hawkins, M.D., Ph.D.
CONTRACTING ORGANIZATION: University of California San Francisco San Francisco, California .94143-0962
REPORT DATE: July 2 000
TYPE OF REPORT: Annual Summary
PREPARED FOR: U.S. Army Medical Research and Materiel Command Fort Detrick, Maryland 21702-5012
DISTRIBUTION STATEMENT: Approved for Public Release; Distribution Unlimited
The views, opinions and/or findings contained in this report are those of the author(s) and should not be construed as an official Department of the Army position, policy or decision unless so designated by other documentation.
20010/27 m

REPORT DOCUMENTATION PAGE Form Approved
OMB No. 074-0188 Public reporting burden for this collection of information is estimated to average 1 hour per response, including the time for reviewing instructions, searching existing data sources, gathering and maintaining the d6ta needed, *hd completing and reviewing this collection of information. Send comments regarding this burden estimate or any other aspect of this collection of information, including suggestions for reducing this burden to Washington Headquarters Services, Directorate for Information Operations and Reports, 1215 Jefferson Davis Highway, Suite 1204, Arlington, VA 22202-4302, and to the Office of Management and Budget, Paperwork Reduction Project (0704-0188), Washington, DC 20503
1. AGENCY USE ONLY (Leave blank)
2. REPORT DATE July 2000
3. REPORT TYPE AND DATES COVERED Annual Summary (1 Jul 99-30 Jun 00)
4. TITLE AND SUBTITLE Quantitative Breast Lesion Imaging and Characterization Using a Combined X-Ray CT-Gamma Camera Methodology
6. AUTHOR(S) Hamilton Tang, Ph.D. Randall Hawkins, M.D., Ph.D.
5. FUNDING NUMBERS DAMD17-98-1-8192
7. PERFORMING ORGANIZATION NAME(S) AND ADDRESS(ES) University of California San Francisco San Francisco, California 94143-0962
8. PERFORMING ORGANIZATION REPORT NUMBER
E-MAIL: [email protected] 9. SPONSORING / MONITORING AGENCY NAME(S) AND ADDRESS(ES)
U.S. Army Medical Research and Materiel Command Fort Derrick, Maryland 21702-5012
10. SPONSORING / MONITORING AGENCY REPORT NUMBER
11. SUPPLEMENTARY NOTES
12a. DISTRIBUTION / AVAILABILITY STATEMENT Approved for public release; distribution unlimited
12b. DISTRIBUTION CODE
13. ABSTRACT (Maximum 200 Words)
The purpose of this research is to develop tools and techniques for the measurement of radionuclide uptake in breast lesions using a combined x-ray CT-scintillation camera imaging system. The developed techniques are also potentially useful for other types of cancers, as well as for other diseases. Major projects in the second funding year include: 1) development of a scatter estimation method that can estimate the amount of detected scatter in arbitrary energy windows and for arbitrary radionuclide photon emission energies, 2) implementation of this scatter model into iterative reconstruction algorithms, and 3) testing of these new scatter estimation and reconstruction methods using Monte Carlo simulations and experimental measurements.
14. SUBJECT TERMS Breast Cancer
quantification, X-ray CT, SPECT
15. NUMBER OF PAGES 55
16. PRICE CODE
17. SECURITY CLASSIFICATION OF REPORT
Unclassified
18. SECURITY CLASSIFICATION OF THIS PAGE
Unclassified
19. SECURITY CLASSIFICATION OF ABSTRACT
Unclassified
20. LIMITATION OF ABSTRACT
Unlimited NSN 7540-01-280-5500 Standard Form 298 (Rev. 2-89)
Prescribed by ANSI Std. Z39-18 298-102

r *
\
FOREWORD
Opinions, interpretations, conclusions and recommendations are those of the author and are not necessarily endorsed by the U.S. Army.
tfff Where copyrighted material is quoted, permission has been obtained to use such material.
faj Where material from documents designated for limited distribution is quoted, permission has been obtained to use the material.
\faf citations of commercial organizations and trade names in this report do not constitute an official Department of Army endorsement or approval of the products or services of these organizations.
N/A In conducting research using animals, the investigator(s) adhered to the "Guide for the Care and Use of Laboratory Animals," prepared by the Committee on Care and use of Laboratory Animals of the Institute of Laboratory Resources, national Research Council (NIH Publication No. 86-23, Revised 1985).
X For the protection of human subjects, the investigator(s) adhered to policies of applicable Federal Law 45 CFR 46.
N/A In conducting research utilizing recombinant DNA technology, the investigator(s) adhered to current guidelines promulgated by the National Institutes of Health.
N/A In the conduct of research utilizing recombinant DNA, the investigator(s) adhered to the NIH Guidelines for Research Involving Recombinant DNA Molecules.
N/A In the conduct of research involving hazardous organisms, the investigator(s) adhered to the CDC-NIH Guide for Biosafety in Microbiological and Biomedical Laboratories.
PI - Signature ^Date
TABLE OF CONTENTS
Front Cover
Standard Form (SF) 298
Foreword
Table of Contents
Introduction
Training Accomplishments to Date
Statement of Work Review
Plans for the Coming Year
References
Appendix 1: Key Research Accomplishments
Appendix 2: Reportable Outcomes
Appendix 3: UCSF Radiology Department Research Grant (00-09)
Appendix 4: UCSF Radiology Department Research Grant (00-10)
Appendix 5: DoD BCRP Concept Award Grant
Appendix 6: The relative impact of scatter on absolute myocardial perfusion quantitation: An EGS4 Monte Carlo study (1999 IEEE NSS-MIQ
Appendix 7: Radionuclide scatter estimation using EGS4-generated convolution kernels (WC2000)
Appendix 8: Absolute SPECT quantitation using a point source calibration (abstract)
Appendix 9: Quantitative mammoscintigraphy using combined x-ray CT- radionuclide imaging (abstract)
Appendix 10: Absolute in vivo quantitation of myocardial activity (2000 IEEE Trans on Nucl Sei)
Appendix 11: Improved quantitative imaging for mIn-Prostascint® using CT/SPECT and dual-energy reconstruction (abstract)
1
2
3
4
5
5
7
8
8
10
11
12
18
26
36
41
46
47
48
54
Appendix 12: Scatter correction for dual-isotope imaging (abstract) 55

INTRODUCTION The goals of the research are two-fold: One goal of the project is to develop clinically useful tools and protocols for identifying and quantifying localized activity lesions in the breast and possibly in cancer-involved lymph nodes using a combined x-ray CT-scintillation camera using 99mTc-sestamibi as a model for other radiolabeled pharmaceuticals. The developed techniques will be helpful in the detection and quantification of a wide variety of radiotracers, making the techniques useful not only for the evaluation of breast carcinomas, but for many forms of cancer. A secondary goal is to acquire preliminary quantitative data on the relationship between 99mTc-sestamibi uptake and microvessel density levels in patients with suspected breast cancer.
TRAINING ACCOMPLISHMENTS TO DATE
Introduction This research is a specific clinical application of a larger set of imaging techniques being developed at the University of California, San Francisco (UCSF). Therefore, in addition to being applicable to breast cancer imaging, much of the techniques being developed are also useful for other applications, including quantitative myocardial perfusion imaging [1-3], mI quantification [4, 5], and mIn-Prostascint® imaging [6].
Additional Projects and Funding (Year 2) Assessment of Axillary Lymph Node Metastases Using FDG PET and Lymphoscintigraphy
A collaboration was formed with Dr. Stanley Leong, Professor of Surgery, and Dr. Eugene Morita, Clinical Professor of Radiology, to investigate combining F-18-fluorodeoxyglucose positron emission tomography (FDG PET) and single-photon emission computed tomography (SPECT) lymphoscintigraphy into an integrated imaging algorithm for the noninvasive assessment of axillary lymph node status for patients with breast cancer. The specific aim is to determine whether the imaging of radiopharmaceutical uptake in axillary lymph nodes, measured with FDG PET and localized with SPECT lymphoscintigraphy, correlates with histopathological examination of the sentinel lymph node (the standard). Ultimately, we want to test the hypothesis that radionuclide assessments obtained with either FDG PET alone, or with a combined FDG PET/lymphoscintigraphy imaging technique, will improve evaluation of metastatic disease in breast cancer patients and can be comparable to an invasive sentinel lymph node biopsy.
Pilot funding ($8000) was awarded for this project from the UCSF Research and Education Fund (Appendix 3). In addition, P.E.T.Net Pharmaceutical Services, Inc, has donated 25 FDG doses (@ $650/dose) to the project. Finally, an application was made to the 1999 U.S. Army Breast Cancer Research Program (Concept Award) for additional funding (Appendix 5). However, this grant was not funded. Despite this setback, the status of this project is ongoing. We are currently awaiting institutional review board (IRB) approval of the human research application.
Phantom Studies and Quantitation Techniques for the Absolute Measurement of Radiopharmaceutical Concentration on Clinical SPECT Systems
Based in part on our research at UCSF, GE Medical Systems and their R&D partner, Elgems Ltd, have configured a dual-headed SPECT system with coincidence imaging capability that also includes a separate x-ray tube and x-ray detectors for low resolution tomographic imaging. The dual-modality imaging system ("Millenium VG with Anatomical Mapping Capability", or "Hawkeye™") was announced as a product at the Society of Nuclear Medicine meeting in June 2000 and will be distributed commercially by GE Medical Systems. GE targets installing 50 dual-modality imaging systems worldwide by the end of calendar year 2000, including a planned installation at UCSF in December 2000.
Therefore, in anticipation of being able to utilize this system for quantification applications, including measuring 99mTc-sestamibi and 131I-labeled antibody uptake in breast and other cancers, we have obtained additional funding ($2000) to purchase phantom materials (Appendix 4). This phantom (along with the existing anthropomorphic breast phantom) will be used to test and develop radionuclide measurement methods on both our current prototype x-ray CT-scintillation camera, and on this new, dual-modality imaging system.
X-ray CT Dose Once the anthropomorphic phantom was obtained, a series of x-ray CT scans was performed to determine both the mean glandular dose and the skin dose for a variety of imaging conditions. Although not necessarily of
publishable nature, this information is important to referring physicians since it is a concern for all radiological imaging applications. The results from this study demonstrate that the mean glandular dose to the breast from a single, complete x-ray CT study is in the range of 125 to 450 mRem for the x-ray tube potentials available on the GE9800 scanner (at a constant x-ray current x time technique of 80 mAs). This compares to a typical mean glandular dose of 125-150 mRem per mammographic screening shot at our institution. In addition, the skin dose is only 50% higher than the mean glandular dose since the x-ray tube potentials are much higher than those typically used in mammography. Finally, it was confirmed that the x-ray CT dose was independent of x-ray slice thickness on our scanner. Further studies will still be necessary to determine those imaging parameters that will allow us to successfully delineate the cancer regions with the lowest possible patient dose. Obviously, higher tube currents and/or scan times increase the dose proportionally. This analysis will be repeated on the new dual-modality imaging system (Hawkeye™) when it arrives in December 2000.
Scatter Characterization Monte Carlo modeling of the imaging process has been performed using a model of radionuclide breast imaging to study the effects of scatter on radionuclide quantification. Using the EGS4 Monte Carlo code [7], a series of simulations was performed, modeling varying lesion sizes and lesion-to-background activity concentration ratios. The resulting planar and reconstructed tomographic data were analyzed to estimate the effects of scatter on lesion activity quantification. The results of the study indicate that not accounting for scattered photons can lead to biases in activity concentration estimates ranging from 10% to 30%, depending on the lesion-to- background activity concentration and the count-calibration procedure. It is worth noting that these biases are smaller than the biases due to the limited resolution of radionuclide imaging (which are on the order of 50% for 1-cm sized lesions using a typical high-resolution collimator). However, because methods have been developed to help combat these resolution biases [4, 5], the effects of scatter will become more evident in our measurements.
Scatter Estimation Model Many methods have been developed for estimating the amount of detected scatter in single-photon emission imaging. One particularly attractive method has been described by Clough [8] and Frey [9]. This scatter estimation method calculates the expected scatter projection data by forward-projecting an "effective" scatter source distribution through an attenuation distribution. This "effective" scatter source distribution is approximated by convolving an estimated primary source distribution with a kernel, or point spread function, that characterizes the detected scatter. We have developed a method for estimating these kernels using Monte Carlo integration (Appendix 7 [10]). These kernels allow us to estimate the detected scatter in arbitrary energy discrimination windows for arbitrary radionuclide photon emissions, including multiple-energy emissions.
Reconstruction The above method for estimating detected scatter was implemented into an iterative maximum-likelihood, expectation-maximization (MLEM [11]) reconstruction algorithm and its subset variant [12]. EGS4 Monte Carlo simulations of our imaging system using 99mTc and 201T1 have demonstrated better than 2% accuracy in measuring the amount of radionuclide uptake using this new reconstruction algorithm. Although experimental phantom work with 99mTc and other radionuclides is continuing, preliminary experimental measurements continue to exhibit a slight (< %10) bias.
Quantitative Radionuclide Imaging One of the original aims of this research was to determine the reconstruction parameters that would give the best radionuclide measurement accuracy and/or precision in tomographic images. However, work completed since the original grant application has revealed an alternative strategy that takes advantage of the unique capabilities of the combined x-ray CT-scintillation camera imaging system. Specifically, by defining regions of interest directly on the x-ray CT scans and modeling the radionuclide imaging process using the geometric information available from the combined imaging system, it is possible to extract absolute activity concentration from both tomographic and planar radionuclide scans, independent of such physical factors such as attenuation and lesion shape [4, 13]. More importantly, the technique does not appear to be strongly dependent on reconstruction parameters. Therefore, using this general technique, the quantitative accuracy is not strongly connected to the reconstruction algorithm. Nor does it depend necessarily on acquiring tomographic data [14].

However, we also have continued to develop our iterative MLEM reconstruction algorithm. We have now implemented a model for detected scatter (Appendix 7 [10]), which we are continuing to evaluate and test. With this new scatter model, we have hopefully eliminated the need to perform count calibration measurements with a uniform tank. Such measurements/scans are only used to verify our new measurement technique, which performs absolute quantification with count calibrations using only a planar scan of a point source (Appendix 8 [15]). We are also continuing to evaluate and test this new count calibration method.
Related Work Because the techniques being developed with this training fellowship are also readily applicable to other areas of quantitative radionuclide imaging research, publications using the techniques discussed have been presented by the trainee and other collaborators over the past funding year. Included in this report are applications of the combined imaging system to 99mTc imaging in myocardial perfusion (Appendices 6 and 10) and niIn- Prostascint® quantification (Appendix 11).
STATEMENT OF WORK REVIEW
The specific items in the original statement of work will now be addressed individually:
Year 1. Initial Experimental Phantom Studies, Months 1-12: a. Create/build realistic breast phantom extensions for use in conjunction with the Data Spectrum
anthropomorphic cardiac torso phantom An anthropomorphic breast phantom appropriate for radionuclide imaging was acquired with additional grant funding awarded by the UCSF Radiology Department in Year 1.
b. Perform x-ray CT dose measurements with the breast phantom using thermoluminescent dosimeters (TLD's) and different X-ray technique parameters (80-140kVp, 20-340mAs, 1.5-10mm slices, etc.) Dose measurements were completed with TLD 's using a wide of variety of representative x- ray CT imaging parameters. We can now predict the mean glandular dose for specific imaging parameters. We will repeat these measurements with the new dual-modality system (Hawkeye™) being installed in December 2000.
c. Acquire x-ray CT and scintigraphic SPECT data with a variety of lesion sizes, lesion position, and activity concentrations on X-SPECT system at UCSF Initial experiments have been performed. Further experiments are ongoing to compile a larger pool of data with different lesion sizes and positions and to confirm the results of Monte Carlo simulations.
d. Determine iterative reconstruction parameters, including corrections for attenuation, scatter, and collimator response that give the highest accuracy and precision to known lesion activity concentrations A different quantification strategy was developed that is not as dependent on reconstruction parameters for measurement accuracy and precision. However, new SPECT reconstruction algorithms also have been developed, incorporating models for photon attenuation, distance- dependent collimator resolution, and detected scatter. Monte Carlo experiments have been performed, verifying the accuracy of these new reconstruction routines, and experimental measurements are ongoing.
Year 2. Human-Observer and Computer-Aided Analysis Studies, Months 12-24: a. Prepare experimental breast phantom with realistic activity in all tillable chambers b. Acquire standard clinical planar scintigraphic scans of "prone" experimental breast phantom with
a variety of lesion sizes, lesion position, and activity concentrations c. Acquire X-ray CT and scintigraphic SPECT data of the same phantom configuration and activity
concentration on the X-SPECT system d. Perform detection studies on planar images using trained nuclear medicine experts

e. Reconstruct SPECT data with optimized reconstruction parameters f. Perform computer-aided characterization of activity distributions in the same phantoms g. Compare methodologies using standard ROC analysis
The specific tasks of Year 2 were designed to compare the lesion detection capability of planar scintimammography using human observers against the lesion detection capability of the combined imaging system using SPECT (and using additional anatomical information). We have altered these tasks slightly to take into account our new planar quantification methods [14, 16]. Therefore, human observers viewing planar scintimammography scans will be pitted against planar quantification schemes that use combined imaging, and human observers viewing tomographic scans will be pitted against SPECT quantification schemes that use combined imaging. In addition, because it will be difficult to experimentally generate the large number of images necessary for a realistic ROC study, images are being generated using the imaging model that we have developed over the last year, which includes the effects of photon scatter, distance-dependent collimator resolution, and photon attenuation. This model has been confirmed with Monte Carlo simulations of our imaging system and is currently being further verified with experimental phantom measurements. Therefore, we are still in the processes of generating the necessary data to perform this ROC study.
PLANS FOR THE COMING YEAR
Year 3 will focus on experimentally verifying the measurement accuracy of our quantification methods and on finishing the ROC analysis initiated in Year 2, after generating and verifying the appropriate radionuclide images.
In addition, Year 3 will focus on implementing the quantification procedures that have been developed thus far with the prototype x-ray CT-scintillation camera on the new, dual-modality clinical system from GE Medical Systems (Hawkeye™). Techniques developed for a clinical system will have a much higher probability of being implemented and will have access to a much larger patient population than was possible using the prototype scanner. Because it has been difficult to recruit cancer patients for the prototype imaging system, we feel that it would be appropriate to focus on transferring our techniques to this new, clinical system. This clinical system will also allow us to pursue additional projects that have been initiated during Year 2 (e.g., "Assessment of Axillary Lymph Node Metastases Using FDG PET and Lymphoscintigraphy").
Finally, in this final year of the training fellowship, we hope to perform scans on the volunteers on either the prototype X-SPECT system, or the new dual-modality system, using 99mTc-sestamibi.
REFERENCES
[1] A. J. Da Silva, H. R. Tang, and B. H. Hasegawa, "Absolute quantitation of myocardial activity in phantoms," IEEE Trans. Nucl. Sei, vol. 46, pp. 659-666, 1999.
[2] A. J. Da Silva, H. R. Tang, K. H. Wong, M. C. Wu, M. W. Dae, and B. H. Hasegawa, "Absolute in vivo quantitation of myocardial activity using a combined x-ray CT and SPECT system [abstract]," J. Nucl. Med, vol. 40, pp. 182P, 1999.
[3] A. J. Da Silva, H. R. Tang, K. H. Wong, M. C. Wu, M. W. Dae, and B. H. Hasegawa, "Absolute in vivo quantitation of myocardial activity," presented at 1999 IEEE Nuclear Science Symposium and Medical Imaging Conference, Seattle, WA, 1999.
[4] H. R. Tang, A. J. Da Silva, K. K. Matthay, D. C. Price, J. P. Huberty, R. A. Hawkins, and B. H. Hasegawa, "I-131-MIBG Imaging with the UCSF X-ray CT-SPECT System [abstract]," J. Nucl. Med, vol. 40, pp. 282P, 1999.
[5] H. R. Tang, J. K. Brown, A. J. Da Silva, K. K. Matthay, D. C. Price, J. P. Huberty, R. A. Hawkins, and B. H. Hasegawa, "Implementation of a combined x-ray CT-scintillation camera imaging system for localizing and measuring radionuclide uptake: Experiments in phantoms and patients," IEEE Trans. Nucl. Sei., vol. 46, pp. 551-557, 1999.

[6] K. H. Wong, H. R. Tang, A. J. Da Silva, M. C. Wu, K. Iwata, and B. H. Hasegawa, "Improved quantitative imaging for 11 lln-Prostascint using CT/SPECT and dual-energy reconstruction [abstract]," J. Nucl. Med., vol. 41, pp. 18P, 2000.
[7] W. R. Nelson, H. Hirayama, and D. W. O. Rogers, "The EGS4 Code System," Stanford Linear Accelerator Center, Stanford SLAC-265, December 1985.
[8] A. V. Clough, "A Mathematical Description of Single-Photon Emission Computed Tomography," in Program in Applied Mathematics. Tucson: University of Arizona, 1986, pp. 123.
[9] E. C. Frey and B. M. W. Tsui, "A new method for modeling the spatially-variant, object-dependent scatter response function in SPECT," presented at 1996 IEEE Nuclear Science Symposium and Medical Imaging Conference, Anaheim, CA, USA, 1996.
[10]H. R. Tang, A. J. Da Silva, R. A. Hawkins, and B. H. Hasegawa, "Radionuclide scatter estimation using EGS4-generated convolution kernels," presented at World Congress of Medical Physics and Biomedical Engineering, Chicago, IL, 2000.
[11] L. A. Shepp and Y. Vardi, "Maximum likelihood reconstruction for emission tomography," IEEE Trans. Med. Imag., vol. MI-1, pp. 113-122, 1982.
[12] J. K. Brown, B. H. Hasegawa, and T. F. Lang, "Iterative concurrent reconstruction algorithms for emission computed tomography," Phys. Med. Biol, vol. 39, pp. 1113-1132, 1994.
[13] H. R. Tang, J. K. Brown, A. J. Da Silva, K. K. Matthay, D. C. Price, R. A. Hawkins, and B. H. Hasegawa, "Implementation of a combined x-ray CT-scintillation camera imaging system for localizing and measuring radionuclide uptake: Experiments in phantoms and patients," presented at 1998 IEEE Nuclear Science Symposium and Medical Imaging Conference, Toronto, ONT, CAN, 1998.
[14] H. R. Tang, J. K. Brown, and B. H. Hasegawa, "Radionuclide measurement using projections of X-ray CT- derived templates onto planar nuclear scans [abstract]," J. Nucl. Med., vol. 39, pp. 98P, 1998.
[15] H. R. Tang, A. J. Da Silva, B. H. Hasegawa, and R. A. Hawkins, "Absolute SPECT quantitation using a point source calibration [abstract]," J. Nucl. Med., vol. 41, pp. 101P, 2000.
[16]H. R. Tang, B. H. Hasegawa, and R. A. Hawkins, "Quantitative mammoscintigraphy using combined x-ray CT-radionuclide imaging [abstract]," presented at World Congress of Medical Physics and Biomedical Engineering, Chicago, IL, 2000.

Appendix 1 Key Research Accomplishments
Year 1 • X-ray CT dose measurements were performed using an anthropomorphic phantom model to provide the
dose information that is necessary for clinicians to critically evaluate the imaging technique. • Monte Carlo simulations have been performed to assess the quantitative impact of scatter on the
quantification of 99mTc uptake in breast lesions. • Experiment phantom studies were initiated to define the imaging techniques that will be necessary in
patient scans. • Initial quantification studies have been performed in an anthropomorphic phantom.
Year 2 • An accurate scatter model was developed that can estimate the amount of detected scatter in arbitrary
energy windows and for arbitrary radionuclide photon emission energies. • The above scatter model was implemented into iterative reconstruction algorithms and tested using Monte
Carlo simulations and experimental measurements. • For absolute quantification, a count calibration scheme using only a planar point source measurement was
developed and is currently being verified experimentally. • Quantification studies with an anthropomorphic breast phantom are continuing. • Additional projects (e.g., "Assessment of Axillary Lymph Node Metastases Using FDG PET and
Lymphoscintigraphy") have been initiated.
10
Appendix 2 Reportable Outcomes for Year 2
Additional Funding Granted:
1. Principal Investigator, UCSF Radiology Research and Education Fund Project Title: "Assessment of Axillary Lymph Node Metastases using 18FDG PET and Lymphoscintigraphy" for $8000 total (Appendix 3)
2. Principal Investigator, UCSF Radiology Research and Education Fund Project Title: "Phantom Studies and Quantitation Techniques for the Absolute Measurement of Radiopharmaceutical Concentration on Clinical SPECT Systems" for $2000 total (Appendix 4)
Additional Funding Applied For (Not Funded):
1. Principal Investigator, Department of Defense Breast Cancer Research Program Concept Award Project Title: "Assessment of Axillary Lymph Node Metastases Using FDG PET and Lymphoscintigraphy" for $50,000 total (Appendix 5)
Manuscripts, Abstracts, and Other Publications:
1. HR Tang, AJ Da Silva and BH Hasegawa, "The relative impact of scatter on absolute myocardial perfusion quantitation: An EGS4 Monte Carlo study," Conference Record of the 1999 IEEE Nuclear Science Symposium and Medical Imaging Conference, Seattle, WA, Oct 27-30, 1999. (Appendix 6)
2. HR Tang, AJ Da Silva, RA Hawkins and BH Hasegawa, "Radionuclide scatter estimation using EGS4- generated convolution kernels," Proceedings of the World Congress of Medical Physics and Biomedical Engineering, Chicago, July 23-28, 2000. (Appendix 7)
3. HR Tang, AJ Da Silva, BH Hasegawa and RA Hawkins, "Absolute SPECT quantitation using a point source calibration (abstract)," JofNuclMed 41:101P, 2000. (Appendix 8)
4. HR Tang, RA Hawkins and BH Hasegawa, "Quantitative mammoscintigraphy using combined x-ray CT- radionuclide imaging (abstract)," To be presented at the World Congress of Medical Physics and Biomedical Engineering, Chicago, July 23-28, 2000. (Appendix 9)
Related Publications by Collaborators:
1. AJ Da Silva, HR Tang, KH Wong, MC Wu, MW Dae and BH Hasegawa, "Absolute in vivo quantitation of myocardial activity," To appear in IEEE Trans on Nucl Sei, 2000. (Appendix 10)
2. KH Wong, HR Tang, AJ Da Silva, MC Wu, K Iwata and BH Hasegawa, "Improved quantitative imaging for mIn-Prostascint® using CT/SPECT and dual-energy reconstruction (abstract)," JofNuclMed41:18P, 2000. (Appendix 11)
3. AJ Da Silva, HR Tang and BH Hasegawa, "Scatter correction for dual-isotope imaging (abstract)," J of Nucl Med 41:134P, 2000. (Appendix 12)
11
ASSESSMENT OF AXILLARY LYMPH NODE METASTASES USING
18FDG PET AND LYMPHOSCINTIGRAPHY
Summary
This research program investigates combining F-18-fluorodeoxyglucose positron emission tomography
(18FDG PET) and lymphoscintigraphy into an integrated imaging algorithm for the noninvasive assessment of
axillary lymph node status for patients with breast cancer. The goal is to determine whether the imaging of
radiopharmaceutical uptake in axillary lymph nodes, measured quantitatively with 18FDG PET and localized with
lymphoscintigraphy, correlates with histopathological examination of the sentinel lymph node (the standard).
Eventually, we would like to test the hypothesis that a noninvasive radionuclide assessment algorithm for
determining axillary lymph node status would be beneficial for staging and evaluating early-diagnosed breast cancer
patients.
Specific Aims
The specific aim is to develop and assess a noninvasive method for determining axillary lymph node
involvement in breast carcinoma using an imaging algorithm that integrates the metabolic information of FDG
PET and the anatomical localization of 99mTc-labeled sulfur colloid single-photon emission computed tomography
(SPECT). Focal uptake in ,8FDG PET images will be correlated anatomically with the sentinel node, as indicated
by focal uptake of 99mTc-sulfur colloid, to determine if it is possible to noninvasively predict the lymph node status.
We will also compare the quantitative nodal uptake of 18FDG (both absolute and relative activity concentrations) to
the pathology of excised sentinel nodes to determine if there is a quantitative relationship between the uptake of
!8FDG and lymph node status. We are performing this pilot study to develop necessary data acquisition and analysis
tools and to collect preliminary data with which to base the design of future clinical protocols involving larger
numbers of patients.
Background and Previous Work
The existence of axillary lymph node metastases is an important prognostic indicator for recurrence and
survival in the newly diagnosed breast cancer patient [1,2]. Because of improvements in screening mammography
and increased awareness, more breast cancers are being diagnosed at early stages, with a higher fraction being node
negative, leading to controversy and debate regarding the management of early-diagnosed, likely node-negative
patients. Lymph node status is usually obtained by axillary lymph node dissection (ALND), a technique in which

one or more axillary lymph nodes are removed surgically and are examined histopathologically [3]. More recently,
the sentinel node biopsy (SNB) has been developed as a less invasive method of determining axillary lymph node
status [4, 5]. In a sentinel lymph node biopsy, *""Tc-labeled sulfur colloid or blue dye is injected near a suspected
cancer region, either into the parenchyma or with an intradermal injection into the skin above the tumor, to
determine the location of a "sentinel lymph node," a primary drainage point for the breast lymphatics. Careful
histopathological evaluation of the sentinel lymph node has been predictive of axillary lymph node status [6].
Although SNBs are more limited than total ALNDs, the method is still an invasive surgical technique.
As an alternative, noninvasive imaging techniques for determining axillary lymph node involvement are
currently being developed and studied. Mammography [7], computed tomography [8], ultrasound [9], and magnetic
resonance imaging [10,11] currently lack sufficient ability to test for axillary lymph node involvement in women
with breast cancer. At present, there are several radiopharmaceuticals that can potentially provide regional
assessment of axillary lymph nodes using radionuclide imaging techniques. Among single-photon emitting agents,
both 201T1 and "mTc-sestamibi have demonstrated promise as tumor-specific agents for assessment of primary breast
carcinoma [12, 13] and involved axillary lymph nodes [14]. Focal uptake of 18F-fluorodeoxyglucose (18FDG) can
also identify metastatic sites of breast cancer in the axilla [15]. In comparison to ALND for determining node status,
18FDG imaging with positron emission tomography (PET) has demonstrated sensitivity in the range of 85% to 100%
and specificity from 66% to 91% [15-17]. 18FDG PET also has the added ability to identify metastatic breast cancer
outside the axilla [18, 19]. This is particularly important since such information would have significant impact on
the management of breast cancer patients.
Methods
A. General Study Design:
In this pilot study, we will quantify tumor uptake of 18FDG in breast cancer patients volunteer already
scheduled for sentinel lymph node biopsy. We will acquire spatially correlated 18FDG PET and 99mTc-sulfur colloid
SPECT nuclear images by using fiducial markers visible in both PET scanners and scintillation cameras. One of
two protocols will be employed:
1. The patient will first be injected intravenously with 18FDG and imaged with a PET scanner. On the next
day, the patient will undergo standard lymphoscintigraphy using 99mTc-sulfur colloid. In addition, SPECT
scans of the 99mTc-sulfur colloid will be obtained for correlation with the 18FDG PET data. Finally, a
sentinel lymph node biopsy will be performed to excise the 99mTc-tagged sentinel node either later in the
morning or in the afternoon.
2. The patient will first undergo standard lymphoscintigraphy using 99mTc-sulfur colloid. An addition, SPECT
scans of the 99mTc-sulfur colloid will be obtained for correlation with the 18FDG PET data. After the
SPECT scans, the patient will be injected intravenously with 18FDG and imaged with a PET scanner. On
the next day, after the 18F signal has radioactively decayed, a sentinel lymph node biopsy will be performed
to excise the 99mTc-tagged sentinel node.
In both cases, we will determine if there is a correlation between the absolute and relative uptake of 18FDG and
axillary lymph node involvement as assessed by histopathological examination of the excised sentinel lymph node
(our "standard").
B. Methods of Data Analysis:
Correlated 18FDG PET and 99mTc-sulfur colloid SPECT scans will be obtained. After data acquisition,
volumes of interest (VOIs) will be defined on the PET scans delineating any uptake in the axilla, independent of
knowledge of the correlated SPECT image. In addition, VOIs will be delineated around the sentinel lymph node on
the PET scan using the correlated SPECT image of the sentinel node as a guide (PET+SPECT). In the cases of
multiple lesions, each will be independently defined and analyzed. For relative measurement purposes, VOIs will be
determined from the contralateral side and in surrounding background tissues, which are presumed to be normal.
Absolute activity or standard uptake values (SUVs), normalized as a percentage of injected dose, will also be
determined on the PET images using reconstruction and analysis parameters optimized using phantom studies. With
both PET alone and PET+SPECT, the activity distribution inside the target VOI will be compared to the activity-
distribution in the non-target VOI using a rank-sum test or Student t-test to test the hypothesis that that there is a
significant difference between the reconstructed values in the two VOIs. The results of both of these tests are the
probability that the target VOI is significantly different from the presumed normal VOI. By varying the "detection
threshold" for each test type (rank-sum and Student-t) and for each VOI method (PET alone and PET+SPECT),
standard receiver operator characteristic (ROC) curves [23] can be generated to characterize the methods. The
histopathological examination of the sentinel lymph node will serve as the standard for truth. The area under the
curve (AUC) of the ROC curves will be calculated for both methods [24] to demonstrate whether quantitative
assessment with PET+SPECT is more sensitive in assessing focal uptake in axillary lymph nodes than using PET

images alone. In addition, the quantitative detection thresholds for the two different methods (PET alone and
PET+SPECT) will be examined.
We hope to eventually determine whether assessment with 18FDG PET+SPECT is more sensitive in
assessing focal uptake in axillary lymph nodes than using 18FDG PET images alone. In addition, we will examine
the quantitative detection thresholds for the two different methods (18FDG PET alone and 18FDG PET+SPECT).
Significance
The existence of axillary lymph node metastases is an important prognostic indicator for recurrence and
survival in the newly diagnosed breast cancer patient. However, because of improvements in screening
mammography and increased public awareness, more breast cancers are being diagnosed at early stages, with higher
fractions being node-negative (80% and higher), leading to debate regarding the management of early-diagnosed,
likely node-negative patients [20]. Lymph node status is usually obtained by ALND or SNB, but both are invasive
surgical techniques that are expensive and physically and psychologically stressful for the patient. ALNDs and
SNBs generally require hospitalization, general anesthesia, and 1-2 weeks of postoperative drain care, with
potentially significant complications, including arm edema, nerve injuries, and shoulder dysfunction.
Considering the morbidity and accompanying costs associated with surgery, and because more patients are
being diagnosed at earlier stages of their disease with no detectable nodal involvement, a noninvasive evaluation
technique would prove valuable for the clinical management of these patients. In response to this need, we propose
to develop and assess a noninvasive method for determining axillary lymph node involvement in breast carcinoma
using an imaging algorithm that integrates the metabolic information of I8FDG PET and the anatomical localization
of 99mTc-sulfur colloid SPECT.
While potential for future funding is good, funding will obviously depend on being able to develop and
demonstrate these imaging methods in a preliminary study. Researchers at the Breast Cancer Center at Mt. Zion
have expressed considerable interest in this study. Dr. Stanley Leong, Professor of Surgery at UCSF, and Dr. Gene
Morita, Clinical Professor of Radiology at UCSF, have agreed to help coordinate patient recruitment. Finally,
P.E.T.Net Pharmaceutical Services, Inc. has contributed 25 18FDG doses at no cost to help support this pilot project.
(The research rate for 18FDG is normally $650 per dose).
References [1] R. M. Bryan, R. J. Mercer, R. C. Bennett, and G. C. Rennie, "Prognostic factors in breast cancer and the
development of a prognostic index," Br. J. Surg., vol. 73, pp. 267-271, 1986. [2] W. L. Donegan, "Prognostic factors, stage and receptor status in breast cancer," Cancer, vol. 70, pp. 1755-1764,
1992. 3] D. N. J. Danforth, "The role of axillary lymph node dissection in the management of breast cancer," in Cancer:
Principles and practice of oncology, V. T. De Vita, Jr., S. Hellman, and S. A. Rosenberg, Eds. Philadephia: Lippincott, 1992, pp. 1-16.
4] A. E. Giuliano, D. M. Kirgan, J. M. Guenther, and D. L. Morton, "Lymphatic mapping and sentinel lymphadenectomy for breast cancer," Ann. Surg., vol. 220, pp. 391-398; discussion 398-401, 1994.
5] D. N. Krag, D. L. Weaver, J. C. Alex, and J. T. Fairbank, "Surgical resection and radiolocalization of the sentinel lymph node in breast cancer using a gamma probe," Surg. Oncol, vol. 2, pp. 335-339; discussion 340, 1993.
6] A. E. Giuliano, P. S. Dale, R. R. Turner, D. L. Morton, S. W. Evans, and D. L. Krasne, "Improved axillary staging of breast cancer with sentinel lymphadenectomy," Ann. Surg., vol. 222, pp. 394-399; discussion 399- 401, 1995.
7] M. Pamilo, M. Soiva, and E. M. Lavast, "Real-time ultrasound, axillary mammography, and clinical examination in the detection of axillary lymph node metastates in breast cancer patients," J. Ultrasound. Med., vol. 8, pp. 115-120, 1989.
8] D. E. March, R. J. Wechsler, A. F. Kurtz, A. L. Rosenberg, and L. Needleman, "CT-pathologic correlation of axillary lymph nodes in breast carcinoma," J. Comput. Assist. Tomogr., vol. 15, pp. 440-444, 1991.
9] J. N. Bruneton, E. Caramella, M. Hery, D. Aubanel, J. J. Manziono, and J. L. Picard, "Axillary lymph node metastates in breast cancer; preoperative detection with US," Radiology, vol. 158, pp. 325-326, 1986.
10] H. Palmedo, F. Grunwald, H. Bender, A. Schomburg, P. Mallmann, D. Krebs, and H. J. Biersack, "Scintimammography with technetium-99m mefhoxyisobutylisonitrile: Comparison with mammography and magnetic resonance imaging," Eur. J. Nuc. Med., vol. 23, pp. 940-946,1996.
11]R. Tiling, K. Kress, M. Pechmann, T. Pfluger, P. Knesewitsch, K. Tatsch, and K. Hahn, "Integrated diagnosis of breast tumors: Semiquantitative Tc-99m sestamibi imaging versus dynamic MRI (abstract)," J. Nucl. Med., vol. 35, pp. 51, 1994.
12] I. Khalkhali, J. A. Cutrone, J. G. Mena, L. E. Diggles, R. J. Venegas, H. I. Vargas, B. L. Jackson, S. Khalkhali, J. F. Moss, and S. R. Klein, "Scintimammography: The complementary role of Tc-99m sestamibi prone breast imaging for the diagnosis of breast carcinoma," Radiology, vol. 196, pp. 421-426,1995.
13] A. D. Waxman, L. Ramanna, L. D. Memsic, C. E. Foster, A. W. Silberman, S. H. Gleischman, R. J. Brenner, M. B. Brachman, C. J. Kuhar, and J. Yadegar, "Thallium scintigraphy in the evaluation of mass abnormalities in the breast," J. Nucl. Med., vol. 34, pp. 18-23, 1993.
14] R. Taillefer, A. Robidoux, S. Turpin, R. Lambert, J. Catin, and J. Leveille, "Metastatic axillary lymph node technetium-99m-MIBI imaging with primary breast cancer," J. Nucl. Med., vol. 39, pp. 459-464, 1998.
15] L. P. Adler, P. F. Faulhaber, K. C. Schnur, N. L. Al-Kasi, and R. R. Shrenk, "Axillary lymph node metastases: Screening with [F-18]2-deoxy-2-fluoro-D-glucose (FDG) PET," Radiology, vol. 203, pp. 323-327, 1997.
16]F. Crippa, R. Agresti, E. Seregni, M. Greco, C. Pascali, A. Bogni, C. Chiesa, V. De Sanctis, V. Delledonne, B. Salvadori, M. Leutner, and E. Bombardieri, "Prospective evaluation of fluorine-18-FDG PET in presurgical staging of the axilla in breast cancer," J. Nucl. Med., vol. 39, pp. 4-8, 1998.
17jC. I. Utech, C. S. Young, and P. F. Winter, "Prospective evaluation of fluorine-18 fluorodeoxyglucosc positron - emission tomography in breast cancer for staging of the axilla related to surgery and immunocytochemistry," Eur. J. Nucl. Med, vol. 23, pp. 1588-1593, 1996.
18] N. Y. Tse, C. K. Hoh, R. A. Hawkins, M. J. Zinner, M. Dahlbom, Y. Choi, J. Maddahi, F. C. Brunicardi, M. E. Phelps, and J. A. Glaspy, "The application of positron emission tomographic imaging with fluorodeoxyglucose to the evaluation of breast disease," Ann. Surg., vol. 216, pp. 27-34,1992.
19] D. H. Moon, J. Maddahi, D. H. Silverman, J. A. Glaspy, M. E. Phelps, and C. K. Hoh, "Accuracy of whole- body fluorine-18-FDG PET for the detection of recurrent or metastatic breast carcinoma," J. Nucl. Med., vol. 39, pp. 431-435, 1998.
20] I. A. Mustafa and K. I. Bland, "Indications for axillary dissection in Tl breast cancer," Ann. Surg. Oncol, vol. 5, pp. 4-8, 1998.
21] E. C. Glass, R. Essner, and A. E. Giuliano, "Sentinel node localization in breast cancer," Semin. Nucl Med., vol. 29, pp. 57-68, 1999.
22] C. K. Hoh and C. Schiepers, "18-FDG imaging in breast cancer," Semin. Nucl Med., vol. 29, pp. 49-56, 1999. 23] D. J. Goodenough, K. Rossmann, and L. B. Lusted, "Radiographic applications of receiver operating
characteristic (ROC) curves," Radiology, vol. 110, pp. 89-95, 1974. [24] H. H. Barrett and W. Swindell, Radiological imaging: The theory of image formation, detection, and
processing. New York: Academic Press, 1981.

Budget
Items Estimated Cost 1. 10 18FDG PET Scans 2. 10 ""Tc-sulfur colloid SPECT scans
7600 2400
Total 10000
Justification
H. Roger Tang has a Postdoctoral Fellowship from the US Army Breast Cancer Research Program (DAMD17-98-1- 8192) to help support this work. However, this fellowship provides funding only for his salary and does not provide additional funding for the research proposed. Although the Department of Radiology is making many of its resources available, proper execution of the proposed research requires additional support. For example, the Nuclear Medicine Department has generously provided office space and computer resources. In addition, P.E.T.Net Pharmaceutical Services has agreed to contribute 25 l8FDG doses at no cost to help support this pilot project, saving $650 per dose (research rate).
However, both scanner time and technologist' salaries need to be paid for. Because patients in this research protocol will have already been referred to the Nuclear Medicine Section for lymphoscintigraphy, there is no need to pay for ""Tc-sulfur colloid injections, planar lymphoscintigraphies, sentinel lymph node biopsies, or histopathologies. However, the following scans do need to be paid for:
1. Oncologic whole-body PET scans are charged at -$2300 per scan ($1736 for scanner time, $31 for ,8FDG injection, and $496 pro fees). Since the research rate is -34% of the full rate, each PET procedure will cost approximately $780 as part of this protocol.
2. Standard SPECT scans cost approximately $650. Again, at -34% of the full rate, a SPECT scan of the **"Tc-sulfur colloid, which is not a normal component of a lymphoscintigraphy exam, will cost $220 as part of this protocol.
Funding is being sought from other sources for additional scans. Dr. Tang has applied for a Concept Award from the US Army Breast Cancer Research Program to help pay for additional scans as well as additional 18FDG doses.
Phantom Studies and Quantitation Techniques for the Absolute Measurement of Radiopharmaceutical Concentration on Clinical SPECT Systems
Summary
This research program uses experimental phantom studies to develop tools and techniques for the absolute
measurement of radionuclide activity concentration. The tools and techniques will be developed especially for the
clinical imaging systems of the Nuclear Medicine section, but can be translated to most modern nuclear medicine
imaging systems. These quantitation techniques can be utilized in a variety of applications, including patient
specific dosimetry of 131I-labeled radiopharmaceuticals for radiotherapeutic applications.
Specific Aims
The aim of this research is to improve the accuracy of internal radionuclide dosimetry in patients with
cancer. Eventually, our goal is to measure tumor and normal organ uptake in a variety of nuclear medicine
applications, including therapy administrations of 131I-labeled hCC49ACH2 antibody for patients with
gastrointestinal adenocarcinomas and pre- and post-therapeutic administrations of mI-mIBG for patients with
neuroblastoma. Within this clinical context, in this pilot study we will develop techniques using single-photon
emission computed tomography (SPECT) to quantify localized lesion activity under a variety of conditions (lesion
size, target-to-background ratio, lesion position), with corrections for photon attenuation, scatter radiation, distance-
dependent collimator resolution, and background activity. We will demonstrate that, in comparison to current
imaging techniques, our SPECT techniques provide improved accuracy in quantifying uptake for simulated lesions
in an experimental phantom model.
Background and Previous Work
In our Department, radionuclide quantitation of focal lesions is performed using the technique of
"conjugate view planar imaging" [1], in which anterior and posterior planar radionuclide images are obtained of the
same region of a patient with a scintillation camera. A calibrated point source is placed on the patient and imaged
with the patient to determine a correction factor for signal losses due to attenuation. The conjugate view method
using a point source calibration is attractive for several reasons: 1) it is relatively simple to perform; 2) if the
transmission point source is placed correctly (i.e., in a location with the same attenuation as that of the unknown
activity source), then the attenuation can be accurately estimated; and 3) the technique has demonstrated reasonable
reproducibility in phantoms studies [2].

In practice, when the lesion is small and the non-lesion background activity is high, the conjugate view
measurements are not very accurate. In general, the conjugate view method is not accurate when the background is
inhomogeneous. Therefore, some knowledge of the distribution of activity in the surrounding tissues may be
necessary to accurately measure the localized object activity concentration. Another potential weakness of the
conjugate view method is the fact that attenuation correction is dependent on an accurate placement of the point
source of known activity, which can be difficult.
Researchers have suggested that it will be possible to measure the internal radionuclide concentration more
accurately using SPECT. However, because reconstructed images are derived from planar images obtained at
different perspectives around the patient, SPECT suffers from the same physical perturbations that make
measurements of activity difficult in planar radiopharmaceutical imaging. Specifically, effects due to the
attenuation of the photon signal by the body and activity present in adjacent tissues will still lead to an inability to
measure the absolute activity accurately. Tomographie methods help to alleviate the issue of activity in overlapping
tissues. However, because the spatial resolution of the scintillation camera dictates the spatial resolution in SPECT,
adjacent objects can still be difficult to separate from the object of interest. Additionally, photons originating from
adjacent tissues and scattered may be inseparable from the primary signal, possibly affecting our estimates of the
unknown object activity.
One key to accurate SPECT quantitation may be the reconstruction algorithm. Clinically, most SPECT
images are reconstructed using the filtered back-projection (FBP) algorithm [3]. Compensation for the attenuation
of photons is possible, but usually only under restricted assumptions of uniform attenuation in the body [4]. In
addition, corrections for detected scatter and the distance-dependent spatial i'esöiüiiüii due to the co'lrhiiator are also
not normally performed [5].
The Maximum Likelihood Expectation Maximization (MLEM) reconstruction algorithm [6] (and its
ordered-subset variation, OSEM [7]) is becoming more readily available on many modern nuclear imaging systems.
A potential advantage to these iterative reconstruction schemes is accurate modeling of the photon detection (or
"projection") process. Such methods can accurately model the effects of attenuation by the body, detected scatter
photons, and the detection characteristics of the collimator. To model the photon attenuation in an iterative
reconstruction, an a priori estimate of the patient-specific attenuation distribution is useful. One way that the
attenuation distribution of tissues may be estimated is by transmission imaging. Recently, commercial
manufacturers have begun equipping scintillation cameras with radioactive transmission line sources for
transmission imaging. The patient-specific attenuation estimates available from these transmission CT images are
adequate for attenuation modeling in iterative reconstruction codes, leading to more quantitatively accurate
representations of the radionuclide distribution than reconstructions without attenuation compensation. However,
most modern clinical SPECT implementations of MLEM and OSEM do not yet address the issues of detected scatter
photons and the distance-dependent spatial resolution due to the collimator.
Several researchers have proposed methods for dealing with the problem of detected scatter photons. The
detected scatter in the photopeak window can be estimated by placing an energy discrimination window at a lower
energy than the photopeak and assuming that a fraction of the photons detected in this lower energy window
approximates the amount of scatter in the photopeak window [8]. Alternatively, the detected scatter photons can be
modeled in the iterative reconstruction as part of the photon detection process [9]. Although some researchers have
suggested that Monte Carlo techniques provide the most accurate methods for estimating the expected distribution of
scattered photons [10], Monte Carlo methods are not used clinically because of their computational intensity.
Instead, researchers have been developing simpler, more computationally efficient, approximations to estimate the
scatter distribution [11]. With scatter compensation, most researchers have demonstrated in specific applications
improved image contrast in reconstructed estimates, but further research continues in this area.
Finally, the modeling of the distance-dependent spatial resolution of the collimator has also been addressed
by researchers [12, 13]. As with scatter compensation, several methods have been investigated and this continues to
be an active area of investigation. Thus far, the overall conclusion is that modeling the collimator in an iterative
reconstruction results in better image resolution and reduced noise aiüplincation in the final' reconstructed images.
Like the case of planar imaging, quantitative measurements in SPECT are made by defining regions, or
volumes of interest (VOIs) directly on SPECT images, and taking a sum or mean value within the VOIs. Like
measurements made with planar images, these estimates may be normalized with measurements made in other
organs or regions in the reconstructed image. However, despite the ongoing research into improving the
reconstructed image accuracy using emission computed tomography, it remains difficult to measure the absolute
activity in a localized volume due largely to the effects of image resolution.
Methods
The goal of this pilot study is to develop techniques with SPECT which provide accurate and precise
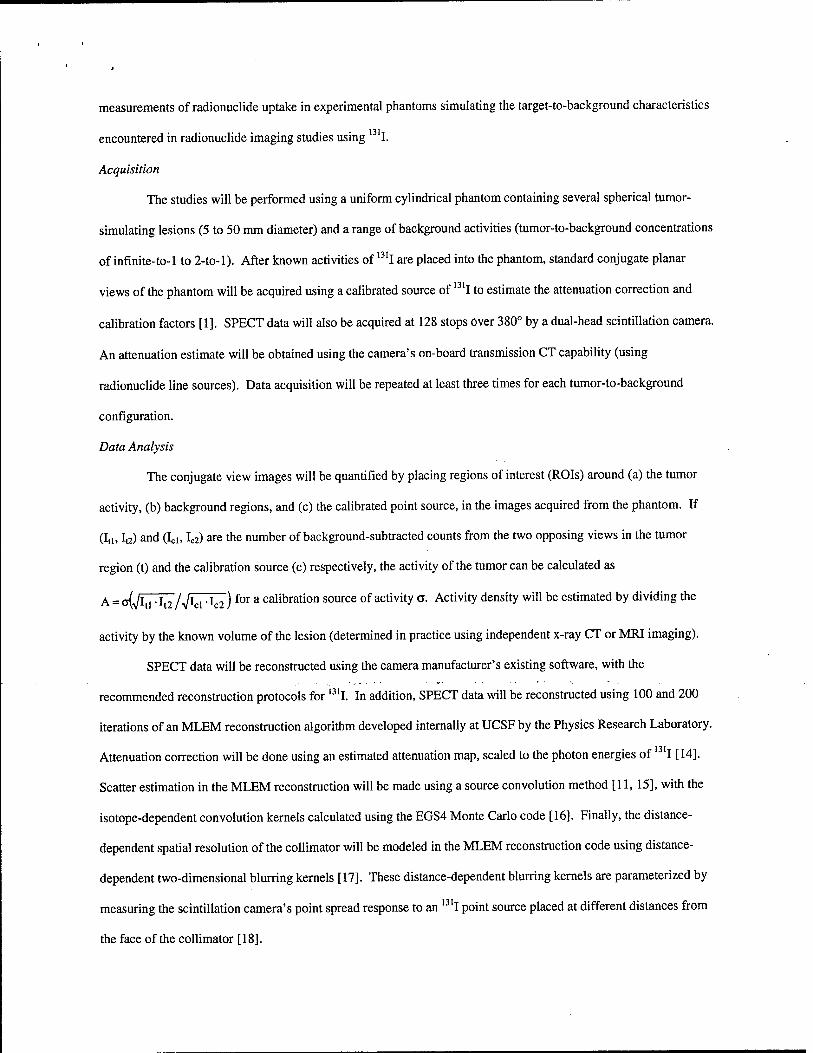
measurements of radionuclide uptake in experimental phantoms simulating the target-to-background characteristics
encountered in radionuclide imaging studies using 131I.
Acquisition
The studies will be performed using a uniform cylindrical phantom containing several spherical tumor-
simulating lesions (5 to 50 mm diameter) and a range of background activities (tumor-to-background concentrations
of infinite-to-1 to 2-to-l). After known activities of 131I are placed into the phantom, standard conjugate planar
views of the phantom will be acquired using a calibrated source of 131I to estimate the attenuation correction and
calibration factors [1]. SPECT data will also be acquired at 128 stops over 380° by a dual-head scintillation camera.
An attenuation estimate will be obtained using the camera's on-board transmission CT capability (using
radionuclide line sources). Data acquisition will be repeated at least three times for each tumor-to-background
configuration.
Data Analysis
The conjugate view images will be quantified by placing regions of interest (ROIs) around (a) the tumor
activity, (b) background regions, and (c) the calibrated point source, in the images acquired from the phantom. If
(I,i, Ia) and (Id, Ic2) are the number of background-subtracted counts from the two opposing views in the tumor
region (t) and the calibration source (c) respectively, the activity of the tumor can be calculated as
A = öÜl r^AAcr^) for a calibration source of activity 0. Activity density will be estimated by dividing the
activity by the known volume of the lesion (determined in practice using independent x-ray CT or MRI imaging).
SPECT data will be reconstructed using the camera manufacturer's existing software, with the
recommended reconstruction protocols for 131I. In addition, SPECT data will be reconstructed using 100 and 200
iterations of an MLEM reconstruction algorithm developed internally at UCSF by the Physics Research Laboratory.
Attenuation correction will be done using an estimated attenuation map, scaled to the photon energies of I [14].
Scatter estimation in the MLEM reconstruction will be made using a source convolution method [11, 15], with the
isotope-dependent convolution kernels calculated using the EGS4 Monte Carlo code [16]. Finally, the distance-
dependent spatial resolution of the collimator will be modeled in the MLEM reconstruction code using distance-
dependent two-dimensional blurring kernels [17]. These distance-dependent blurring kernels are parameterized by
measuring the scintillation camera's point spread response to an 13II point source placed at different distances from
the face of the collimator [18].

The SPECT data will be quantified with VOIs defined directly on the radionuclide images. The VOIs will
be dilated or eroded using morphological techniques [19] to match the known anatomical volume of the lesion
(determined in practice using independent x-ray CT or MRI imaging). The sum, mean, standard deviation, and
maximum count density will be determined for each VOL
Evaluation
For both planar and tomographic data, the measured radionuclide content for each region will be compared
against the known radionuclide concentration in the phantom. ROI and VOI definitions will be repeated by at least
three different operators to determine the inter-observer variation in the measurements. The accuracy and precision
of both the conventional planar method and the "standard" commercial SPECT method will be compared to the
results of the UCSF MLEM implementation. We hypothesize that our data reconstruction and analysis method will
provide more accurate and precise measurements than the other techniques.
Significance
Although the study will be pursued within the specific clinical focus of improving in vivo quantitation of
131I-labeled radiopharmaceuticals, such as 13,I-hCC49ACH2 and ,3lI-mIBG, the methods developed in this project can
be applied to a wide variety of radionuclides, including w"Tc, '"in, and mI. Thus, the overall goal of this pilot
project is to develop and to refine accurate techniques of measuring radionuclide uptake using modern clinical
hardware, offering capability not yet available on commercial imaging systems. This potential capability will have
significant application in areas of internal radiation dosimetry, especially in pre- and post-therapy monitoring of
cancer patients using radionuclide assessments. Therefore, with these preliminary results in place, it will be possible
to pursue a number of funding cppcrtun;.!c3.
References [1] B. L. Shulkin, J. C. Sisson, K. F. Koral, B. Shapiro, X. H. Wang, and J. Johnson, "Conjugate view gamma
camera method for estimating tumor uptake of iodine-131 metaiodobenzylguanidine," J. Nucl. Med., vol. 29, pp. 542-548, 1988.
[2] S. Shen, G. L. DeNardo, S. J. DeNardo, A. Yuan, D. A. DeNardo, and K. R. Lamborn, "Reproducibility of operator processing for radiation dosimetry," Nucl. Med. Biol, vol. 24, pp. 77-83, 1997.
[3] G. N. Ramachandran and A. V. Lakshminarayanan, "Three-dimensional reconstruction from radiographs and electron micrographs: application of convolutions instead of Fourier transforms," Proc. Nat. Acad. Sei., vol. 68, pp. 2236-2240,1971.
[4] L.-T. Chang, "A method for attenuation correction in radionuclide computed tomography," IEEE Trans. Nucl. Sei., vol. 25, pp. 638-643, 1977.
[5] R. J. Jaszczak, R. E. Coleman, and F. R. Whitehead, "Physical factors affecting quantitative measurements using camera-based single photon emission computed tomography (SPECT)," IEEE Trans. Nucl. Sei., vol. 28, pp. 69-80, 1981.
[6] L. A. Shepp and Y. Vardi, "Maximum likelihood reconstruction for emission tomography," IEEE Trans. Med. Imag., vol. MI-1, pp. 113-122, 1982.

[7] J. K. Brown, B. H. Hasegawa, and T. F. Lang, "Iterative concurrent reconstruction algorithms for emission computed tomography," Phys. Med. Biol., vol. 39, pp. 1113-1132,1994.
[8] R. J. Jaszczak, K. L. Greer, and C. E. Floyd, "Improved SPECT quantification using compensation for scattered photons," J. Nucl. Med., vol. 25, pp. 893-900, 1984.
[9] D. J. Kadrmas, E. C. Frey, and B. M. W. Tsui, "Application of reconstruction-based scatter compensation to thallium-201 SPECT: Implementations for reduced reconstructed image noise," IEEE Trans. Med. Imag., vol. 17, pp. 325-333,1998.
[10] C. E. Floyd, Jr., R. J. Jaszczak, K. L. Greer, and R. E. Coleman, "Inverse Monte Carlo as a unified reconstruction algorithm for ECT," J. Nucl. Med., vol. 27, pp. 1577-1585, 1986.
[11]E. C. Frey and B. M. W. Tsui, "A new method for modeling the spatially-variant, object-dependent scatter response function in SPECT," presented at 1996 IEEE Nuclear Science Symposium and Medical Imaging Conference, Anaheim, CA, USA, 1996.
[12] G. L. Zeng, G. T. Gullberg, B. M. W. Tsui, and J. A. Terry, 'Three-dimensional iterative reconstruction algorithms with attenuation and geometric point response correction," IEEE Trans. Nucl. Sei., vol. 38, pp. 693- 702,1990.
[13] G. L. Zeng, Y. L. Hsieh, and G. T. Gullberg, "A rotating and warping projector/backprojector for fan-beam and cone-beam iterative algorithm," IEEE Trans. Nucl. Sei., vol. 41, pp. 2807-2811,1993.
[14] H. R. Tang, J. K. Brown, A. J. Da Silva, K. K. Matthay, D. C. Price, J. P. Huberty, R. A. Hawkins, and B. H. Hasegawa, "Implementation of a combined x-ray CT-scintillation camera imaging system for localizing and measuring radionuclide uptake: Experiments in phantoms and patients," IEEE Trans. Nucl. Sei., vol. 46, pp. 551-557, 1999.
[15]D. J. Kadrmas, E. C. Frey, S. S. Karimi, and B. M. W. Tsui, "Fast implementations of reconstruction-based scatter compensation in fully 3D SPECT image reconstruction," Phys. Med. Biol., vol. 43, pp. 857-873,1998.
[16] W. R. Nelson, H. Hirayama, and D. W. O. Rogers, "The EGS4 Code System," Stanford Linear Accelerator Center, Stanford SLAC-265, December 1985.
[17] G. L. Zeng and G. T. Gullberg, "Frequency domain implementation of the three-dimensional geometric point response correction in SPECT imaging," IEEE Trans. Nucl. Sei., vol. 39, pp. 1444-1453, 1992.
[18]H. R. Tang, A Combined X-ray CT-Scintillation Camera System for Measuring Radionuclide Uptake in Tumors. San Francisco and Berkeley: University of California, 1998.
[19] R. C. Gonzalez and R. E. Woods, Digital Image Processing. New York: Addison-Wesley, 1992.

Budget
Items Estimated Cost 1. Cylindrical ECT Q.C. Phantom (Data Spectrum) 2. Fillable Hollow Sphere Sets for Cylindrical ECT Phantom (Data Spectrum)
$1750 $ 500
Total $2250
Justification
The following specific items will be necessary to initiate the proposed work:
The cost of the Cylindrical ECT Q. C. Phantom (Data Spectrum, Hillsborough, NC) is approximately $1750. This basic phantom can be used to hold various tumor-simulating spheres in addition to providing a fillable cavity that can be used to mimic different target-to-background situations for radiopharmaceutical imaging. In addition, this phantom also comes with a set of resolution inserts that can be used to test ECT spatial resolution.
To test a range of lesion sizes, fillable, hollow spheres designed for the Data Spectrum Cylindrical ECT Q. C. Phantom are necessary. A large volume range is achievable (1 OOfJ.1 to 20ml) in these sets, each independently fillable with different radiopharmaceutical concentrations.

UG3F University of California San Francisco
May 24,2000
Roger Tang Box 0252
RE: Research Proposal No. 00-09 Assessment of Axillary Lymph Node Metastases Using FDG PET and Lymphoscintigraphy Research Proposal 00-10 Phantom Studies and Quantitation Techniques for the Absolute Measurement of Radiopharm. Cone. On Clin. SPECT Systems
Dear Dr. Tang:
The above proposals have been reviewed by the Research Committee of the Department of Radiology. We reviewed these grants together, and we are pleased to inform you that your proposals were funded at a total of $10,000.00.
Please be aware that if human subjects are required, in order for the funds to be released, you will first need to demonstrate a successful application to the Committee on Human Research. Once the CHR approval is received and forwarded to our office, you can activate this grant by contacting the Radiology business office .in order to set up an account.
The award of this grant requires that you submit a progress or final rerjort (including any papers, abstracts, or grants submitted that stem from this grant) on the research in twelve months, before June 1, 2001. In this way, we can demonstrate the utility of these "seed grants" in promoting future funding for research.
Congratulations, and we look forward to the success of your projects.
Sincerely,
TW KS//CJL William P. Dillon, MD Professor of Radiology, Neurology and Neurosurgery Chief of Diagnostic Neuroradiology 505 Parnassus Avenue, Suite L-371
Concept Proposal Submission Form
Concept Proposal Submission Form
This form has been set to accept 12 point Times New Roman font. For symbols use either (1) the Windows Character Map (under Accessories) or (2) from Word in a separate document, select Insert-Symbol.. .-(normal text). The use of other fonts is not recommended since the information may not be accurately transmitted.
£3 By checking this box, I attest that I (1) have a masters or doctoral degree (e.g., M.S., M.A., Ph.D., D.Sc, D.N.S., M.D., D.O., etc.) from an accredited institution; (2) have access to the necessary space and equipment to perform the proposed studies; and (3) am employed by an eligible institution (i.e., for-profit and nonprofit organizations, public and private, such as universities, colleges, hospitals, laboratories, companies, and agencies of local, state, and federal governments, including military laboratories). Therefore, I am eligible to submit this proposal.
1. Proposal Title (160 character limit): Assessment of Axillary Lymph Node Metastases Using FDG PET and Lymphoscintigraphy
2. Principal Investigator (PI):
Last Name Tang First Name Hamilton MI R
3. Contact Information for PI:
Organization Name University of California, San Francisco
Department Name (if none, leave blank) Department of Radiology
Street Address Line 1 Box 0252
Street Address Line 2 (if no line 2, leave blank) University of California
City San Francisco State CA Country USA Zip Code 94143
Phone (415) 502-4495 Fax f650) 742-0146
E-mail roger.tang^radiology.ucsf.edu
4. Administrative Representative Authorized to Conduct Negotiations:
Last Name Kaiser First Name Joan MI E

Concept Proposal Submission Form
5. Contact Information for Administrative Representative Authorized to Conduct Negotiations:
Organization Name Contracts and Grants
Department Name (if none, leave blank) Office of Research Administration
Street Address Line 1 University of California, San Francisco
Street Address Line 2 (if no line 2, leave blank) 3333 California Street Suite 315
City San Francisco State CA Country USA Zip Code 94143-0962
Phone (415) 476-2977 Fax (415) 476-8158
E-mail [email protected]
6. Content Area of the Proposal Please indicate up to two areas of emphasis to best describe your proposal. Enter the appropriate codes in the drop-down fields below.
01 Behavioral and Psychosocial Sciences 09 Health Care Delivery 02 Cell Biology 10 Immunology 03 Clinical and Experimental Therapeutics 11 Pathobiology 04 Complementary and Alternative Medicine 12 Primary Prevention 05 Detection and Diagnosis 13 Radiation Sciences 06 Endocrinology 14 Research Resources 07 Epidemiology 15 Other, specify 08 Genetics and Molecular Biology
Primary Proposal Content Area: 05 Secondary Proposal Content Area (Optional):
7. Will animals be used in the proposed work? No
8. Will human subjects be used in the proposed work? Yes
9. Will human anatomical substances, including primary and established cell lines, be used in the proposed work? No
10. Are laboratory experiments planned? No
11. PI gender (optional, select one):
12. PI ethnicity (optional, select one):
If "Other" selected, specify
Data collected for questions 11 and 12 will be reported outside the Department of Defense only as grouped data without personal identifiers. Disclosure of this information is voluntary.

Concept Proposal Submission Form
13. Budget Summary Please adjust the indirect costs for your proposal below:
Direct Costs $50.000.00
Indirect Costs $23,750.00
Total Budget $73.750.00
14. Proposal Body In the space below, please provide a clear and concise overview of the proposed work in 5,500 characters or less (~1 page). As appropriate, include the hypothesis, supporting rationale, objectives, relevance to breast cancer, and a general plan for how the project will be executed. Figures are not permitted and the use of tables is discouraged. Proposals will be reviewed by diverse panels of scientists, clinicians, and consumer advocates; therefore, applicants should consider the varied backgrounds of the reviewers when preparing proposals. :
PURPOSE This research program investigates combining F-18-fluorodeoxyglucose positron emission tomography (FDG PET) and lymphoscintigraphy into an integrated imaging algorithm for the noninvasive assessment of axillary lymph node status for patients with breast cancer. The specific aim is to determine whether the imaging of radiopharmaceutical uptake in axillary lymph nodes, measured with FDG PET and localized with lymphoscintigraphy, correlates with histopathological examination of the sentinel lymph node (the standard). Ultimately, we want to test the hypothesis that radionuclide assessments obtained with either FDG PET alone, or with a combined FDG PET/lymphoscintigraphy imaging technique, will improve evaluation of metastatic disease in breast cancer patients and can be comparable to an invasive sentinel lymph node biopsy.
RATIONALE The existence of axillary lymph node metastases is an important prognostic indicator for recurrence and survival in the newly diagnosed breast cancer patient. However, because of improvements m screening mammography ana increased puolic awarentss, more oreast cancers are being diagnosed in early stages, with higher fractions being node-negative (80% and higher), leading to debate regarding the management of early-diagnosed, likely node-negative patients [1]. Lymph node status is usually obtained by axillary lymph node dissection (ALND). More recently, the sentinel node biopsy (SNB) has been developed as a less invasive method of determining lymph node status [2]. In SNB, Tc-99m-labeled sulfur colloid and/or blue dye is injected near the suspected cancer region to determine the location of a "sentinel node," a primary drainage point for the breast lymphatics, which is removed and histopathologically analyzed to determine axillary lymph node status. However, both ALNDs and SNBs are invasive surgical techniques. As an alternative, noninvasive imaging techniques for determining axillary lymph node status are being developed and studied. Focal uptake of FDG can identify metastatic sites of breast cancer in the axilla. In comparison to ALND for determining node status, FDG imaging with PET has demonstrated sensitivity in the range of 57% to 100% and specificity from 66% to 100% [3].

Concept Proposal Submission Form
FDG PET also has the added ability to identify metastatic breast cancer outside the axilla. This is particularly important since such information would have significant impact on the management of breast cancer patients.
OBJECTIVES We propose to develop and assess a noninvasive method for determining axillary lymph node involvement in breast carcinoma using an imaging algorithm that integrates the metabolic information of FDG PET and the anatomical localization of Tc-99m-sulfur colloid single-photon emission computed tomography (SPECT). Focal uptake in FDG PET images can be correlated with the sentinel node, as indicated by focal uptake of Tc-99m-sulfur colloid. In this project, we will compare the nodal uptake of FDG to the pathology of excised sentinel nodes with the goal of developing a noninvasive radionuclide assessment algorithm for determining axillary lymph node status that is comparable to or compatible with sentinel node biopsy.
RELEVANCE While extremely valuable, ALNDs and SNBs are invasive, expensive, and physically and psychologically stressful for the patient. ALNDs and SNBs generally require hospitalization, general anesthesia, and 1-2 weeks of postoperative drain care, with potentially significant complications, including arm edema, nerve injuries, and shoulder dysfunction. Considering the morbidity and accompanying costs associated with surgery, and because more patients are being diagnosed at earlier stages of their disease with no detectable nodal involvement, a noninvasive evaluation technique would prove valuable for the clinical management of these patients.
METHODS In this preliminary study, we will collect data from 20 breast cancer patients scheduled for sentinel lymph node biopsy. We will acquire spatially correlated FDG PET and Tc-99m-sulfur colloid SPECT nuclear images by using fiducial markers visible in both PET scanners and scintillation cameras. The patients will first be injected intravenously with FDG and imaged with a PET scanner. On the next day, patients will undergo standard lymphoscintigraphy using Tc-99m-sulfur colloid. In addition, SPECT scans of the Tc-99m-sulfur colloid will be obtained for correlatior. with the FDG PET data. Finally, "5r!™el lymph nod? b^psies will be performed to excise the Tc-99m-tagged sentinel node. After data acquisition, volumes of interest (VOIs) will be defined on the FDG PET scans delineating any uptake in the axilla, both with FDG PET alone and with correlated SPECT. VOIs will also be determined from normal background tissues. Standard uptake values (SUVs) will be determined on the FDG PET images using parameters optimized with phantom studies. With both FDG PET alone and PET+SPECT, the relative uptake between target and non-target VOIs will be tested for significance using statistical tests and correlated with the results of histopathological examination of the excised sentinel node (our "standard"). We hope to eventually determine whether assessment with PET+SPECT is more sensitive in assessing focal uptake in axillary lymph nodes than using FDG PET images alone. In addition, we will examine the quantitative detection thresholds for the two different methods (FDG PET alone and PET+SPECT).

Concept Proposal Submission Form
15. References No references are required for these submissions. Up to 5 references pertinent to the proposed study may be included in the boxes below. Limit each reference to 225 characters (~3 lines).
1.
2.
I. A. Mustafa and K. I. Bland, "Indications for axillary dissection in Tl breast cancer," Ann. Surg. Oncol., vol. 5, pp. 4-8, 1998. E. C. Glass, R. Essner, and A. E. Giuliano, "Sentinel node localization in breast cancer," Semin. Nucl. Med., vol. 29, pp. 57-68, 1999. C. K. Hoh and C. Schiepers, "18-FDG imaging in breast cancer," Semin. Nucl. Med., vol. 29, pp. 49-56, 1999.
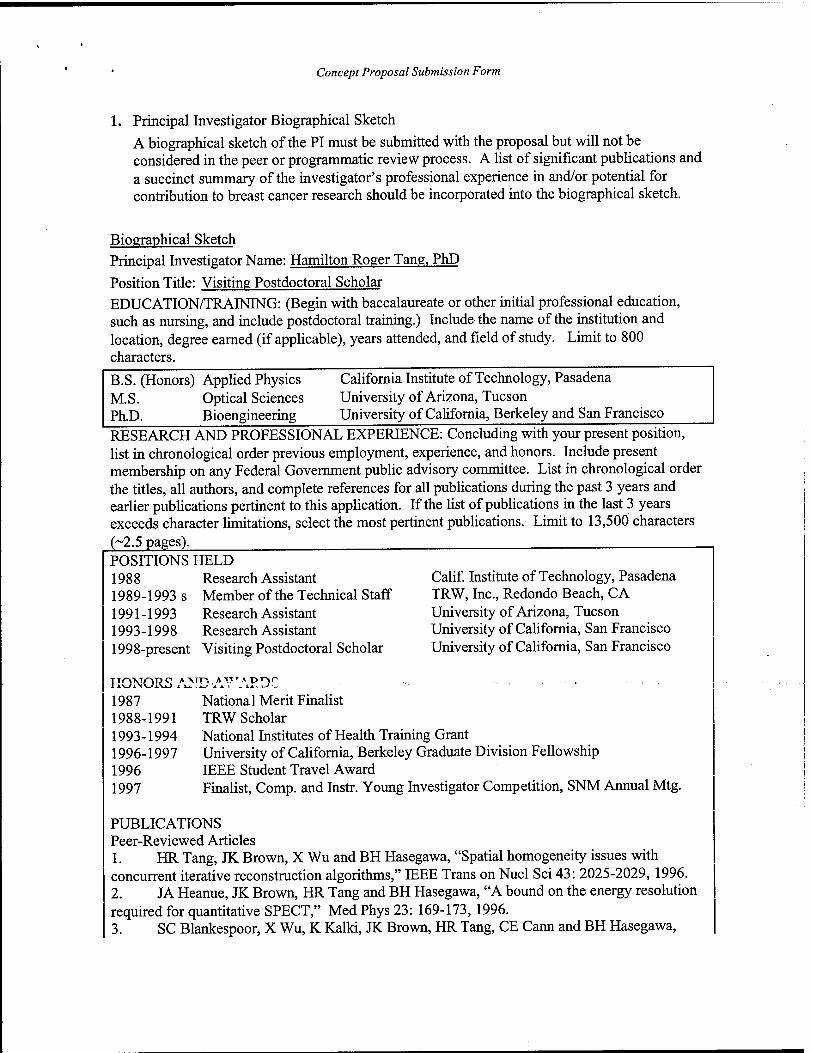
Concept Proposal Submission Form
1. Principal Investigator Biographical Sketch A biographical sketch of the PI must be submitted with the proposal but will not be considered in the peer or programmatic review process. A list of significant publications and a succinct summary of the investigator's professional experience in and/or potential for contribution to breast cancer research should be incorporated into the biographical sketch.
Biographical Sketch Principal Investigator Name: Hamilton Roger Tang, PhD
Position Title: Visiting Postdoctoral Scholar EDUCATION/TRAINING: (Begin with baccalaureate or other initial professional education, such as nursing, and include postdoctoral training.) Include the name of the institution and location, degree earned (if applicable), years attended, and field of study. Limit to 800 characters. B.S. (Honors) Applied Physics California Institute of Technology, Pasadena M.S. Optical Sciences University of Arizona, Tucson Ph.D. Bioengineering University of California, Berkeley and San Francisco RESEARCH AND PROFESSIONAL EXPERIENCE: Concluding with your present position, list in chronological order previous employment, experience, and honors. Include present membership on any Federal Government public advisory committee. List in chronological order the titles, all authors, and complete references for all publications during the past 3 years and earlier publications pertinent to this application. If the list of publications in the last 3 years exceeds character limitations, select the most pertinent publications. Limit to 13,500 characters (-2.5 pages). POSITIONS HELD 1988 Research Assistant Calif. Institute of Technology, Pasadena 1989-1993 s Member of the Technical Staff TRW, Inc., Redondo Beach, CA 1991 -1993 Research Assistant University of Arizona, Tucson 1993-1998 Research Assistant University of California, San Francisco 1998-present Visiting Postdoctoral Scholar University of California, San Francisco
HONORS AND AYTAP.DC 1987 Nationa 1 Merit Finalist 1988-1991 TRW Scholar 1993-1994 National Institutes of Health Training Grant 1996-1997 University of California, Berkeley Graduate Division Fellowship 1996 IEEE Student Travel Award 1997 Finalist, Comp. and Instr. Young Investigator Competition, SNM Annual Mtg.
PUBLICATIONS Peer-Reviewed Articles 1. HR Tang, JK Brown, X Wu and BH Hasegawa, "Spatial homogeneity issues with concurrent iterative reconstruction algorithms," IEEE Trans on Nucl Sei 43: 2025-2029, 1996. 2. JA Heanue, JK Brown, HR Tang and BH Hasegawa, "A bound on the energy resolution required for quantitative SPECT," Med Phys 23: 169-173, 1996. 3. SC Blankespoor, X Wu, K Kalki, JK Brown, HR Tang, CE Cann and BH Hasegawa,

Concept Proposal Submission Form
"Attenuation correction of SPECT using x-ray CT on an emission-transmission CT system: myocardial perfusion assessment," IEEE Trans on Nucl Sei 43: 2263-2274, 1996. 4. JA Heanue, JK Brown, HR Tang and BH Hasegawa, "The effect of radionuclide scatter in emission-transmission CT," IEEE Trans on Nucl Sei, 44: 1317-1322,1997. 5. HR Tang, JK Brown and BH Hasegawa, "Use of x-ray CT-defined regions of interest for the determination of SPECT recovery coefficients," IEEE Trans on Nucl Sei, 44: 1594-1599, 1997. 6. AJ Da Silva, HR Tang, BH Hasegawa, "Absolute quantitation of myocardial activity in phantoms," IEEE Trans on Nucl Sei 46: 659-666, 1999. 7. MC Wu, HR Tang, JW O'Connell, DW Gao, A Ido, AJ Da Silva, K Iwata, BH Hasegawa, and MW Dae, "An ultra high resolution ECG-gated myocardial imaging system for small animals," IEEE Trans on Nucl Sei, 46: 1199-1202. , 8. HR Tang, JK Brown, AJ Da Silva, KK Matthay, D Price, JP Huberty, RA Hawkins and BH Hasegawa, "Implementation of a combined x-ray CT-scintillation camera imaging system for localizing and measuring radionuclide uptake: experiments in phantoms and patients," IEEE Trans on Nucl Sei 46: 551-557, 1999. 9. JK Brown, HR Tang, RS Hattner, M Bocher, NW Ratzlaff, PP Kadkade, BH Hasegawa and EH Botvinick, "Intrinsic dual-energy processing of myocardial perfusion images," To appear in J of Nucl Med, 2000. 10. AJ Da Silva, HR Tang, KH Wong, MC Wu, MW Dae and BH Hasegawa, "Absolute in vivo quantitation of myocardial activity," To appear in IEEE Trans on Nucl Sei, 2000. 11. HR Tang, AJ Da Silva and BH Hasegawa, "The relative impact of scatter on absolute myocardial perfusion quantitation: an EGS4 Monte Carlo study," To appear in IEEE Trans on Nucl Sei, 2000. 12. MC Wu, HR Tang, DW Gao, A Ido, JW O'Connell, BH Hasegawa and MW Dae, "ECG- Gated pinhole SPECT in mice," To appear in IEEE Trans on Nucl Sei, 2000. 13. HR Tang, AJ Da Silva, KK Matthay, DC Price, JP Huberty, RA Hawkins and BH Hasegawa, "Neuroblastoma imaging using a combined x-ray CT scanner-scintillation camera and iodine-131-labeled metaiodobenzylguanidine (mlBG)," Submitted to J of Nucl Med, 2000.
Conference Papers 1. HR Tang, JK Brown, X Wu and BH Hasegawa, "Uniformity and homogeneity issues
"wiiL. cvj^uiiv.iu ii^tidv^ iewuxis'uuUioii algorithms," Conference Record of the 1995 IEEE ■ - ■ ■ Nuclear Science Symposium and Medical Imaging Conference, San Francisco, CA, Oct 21-28, 1995, pp. 1203-1206. 2. X Wu, JK Brown, HR Tang, SC Blankespoor and BH Hasegawa, "Concurrent iterative reconstruction algorithms (CIRA) in multi-headed SPECT systems," Conference Record of the 1995 IEEE Nuclear Science Symposium and Medical Imaging Conference, San Francisco, CA, Oct 21-28, 1995, pp. 1170-1174. 3. BH Hasegawa, JK Brown, K Kalki, JA Heanue, S Blankespoor, X Wu, HR Tang, M Chin, C Stillson, M Dae, CE Cann and RG Gould. "SPECT-CT: Research and development," Physica Medica 12 (Supplement 1): 52-61, 1996. 4. HR Tang, JK Brown and BH Hasegawa, "Use of x-ray CT-defined regions of interest for the determination of SPECT recovery coefficients," Conference Record of the 1996 IEEE Nuclear Science Symposium and Medical Imaging Conference, Anaheim, CA, Nov 2-9, 1996, pp. 1840-1844. ^

Concept Proposal Submission Form
5. JA Heanue, JK Brown, HR Tang and BH Hasegawa, "The effect of radionuclide scatter in emission-transmission CT," Conference Record of the 1996 IEEE Nuclear Science Symposium and Medical Imaging Conference, Anaheim, CA, Nov 2-9, 1996, pp. 1513-1517. 6. HR Tang, JK Brown and BH Hasegawa, "An x-ray CT-assisted method for radionuclide activity measurement using planar views," Conference Record of the 1997 IEEE Nuclear Science Symposium and Medical Imaging Conference, Albuquerque, NM, Nov 9-15, 1997, pp. 1620-1624. 7. AJ Da Silva, HR Tang, BH Hasegawa, "Absolute quantitation of myocardial activity in phantoms," Conference Record of the 1998 IEEE Nuclear Science Symposium and Medical Imaging Conference, Toronto, ON, Nov 8-14, 1998, pp. 1762-1769. 8. MC Wu, HR Tang, JW O'Connell, DW Gao, A Ido, AJ Da Silva, K Iwata, BH Hasegawa, and MW Dae, "An ultra high resolution ECG-gated myocardial imaging system for small animals," Conference Record of the 1998 IEEE Nuclear Science Symposium and Medical Imaging Conference, Toronto, ON, Nov 8-14, 1998, pp. 1506-1508. 9. HR Tang, JK Brown, AJ Da Silva, KK Matthay, D Price, RA Hawkins and BH Hasegawa, "Implementation of a combined x-ray CT-scintillation camera imaging system for localizing and measuring radionuclide uptake: experiments in phantoms and patients," Conference Record of the 1998 IEEE Nuclear Science Symposium and Medical Imaging Conference, Toronto, ON, Nov 8-14, 1998, pp. 1243-1249. 10. AJ Da Silva, HR Tang, KH Wong, MC Wu, MW Dae and BH Hasegawa, "Absolute in vivo quantitation of myocardial activity," Conference Record of the 1999 IEEE Nuclear Science Symposium and Medical Imaging Conference, Seattle, WA, Oct 27-30, 1999. 11. BH Hasegawa, HR Tang, AJ Da Silva, K Iwata, MC Wu and KH Wong, "Implementation and applications of a combined CT/SPECT system," Conference Record of the 1999 IEEE Nuclear Science Symposium and Medical Imaging Conference, Seattle, WA, Oct 27- 30, 1999. 12. HR Tang, AJ Da Silva and BH Hasegawa, "The relative impact of scatter on absolute myocardial perfusion quantitation: an EGS4 Monte Carlo study," Conference Record of the 1999 IEEE Nuclear Science Symposium and Medical Imaging Conference, Seattle, WA, Oct 27- 30, 1999. 13. MC Wu, HR Tang, DW Gao, A Ido, JW O'Connell, BH Hasegawa and MW Dae, "ECG- Gated pinhole SPECT in mice," Conference Record of the 1999 IEEE Nuclear Science Sj.nipo.siuiri c-.idlvleulctii Liidging Conference, Seattle, WA, Oct 27-30, 1999. *
Abstracts 1. HR Tang, SC Blankespoor, JK Brown and BH Hasegawa, "Effect of iodine contrast media in quantitative SPECT with emission-transmission imaging systems (abstract)," J of Nucl Med37:218P, 1996. 2. HR Tang, JK Brown and BH Hasegawa, "A novel kinetic phantom for dynamic imaging (abstract)," J of Nucl Med 38: 22P, 1997. 3. JK Brown, HR Tang, EH Botvinick, RS Hattner, M Bocher, NW Ratzlaff, PP Kadkade and BH Hasegawa, "Characterizing the local impact of attenuation in myocardial SPECT using intrinsic dual energy processing (IDEP) (abstract)," J of Nucl Med 38: 63P, 1997. 4. HR Tang, JK Brown and BH Hasegawa, "Radionuclide measurement using projections of X-ray CT-derived templates onto planar nuclear scans (abstract)," J of Nucl Med 39: 98P, 1998.

Concept Proposal Submission Form
5. HR Tang, CE Schreck, BH Hasegawa and RA Hawkins, "ECT Attenuation Maps from X-ray CT Images (abstract)," J of Nucl Med 40:113P, 1999. 6. KH Wong, AJ Da Silva, HR Tang, MC Wu and BH Hasegawa, "A combined CT/SPECT system can improve therapeutic radionuclide dosimetry (abstract)," J of Nucl Med 40:148P, 1999. 7. AJ Da Silva, HR Tang, KH Wong, MC Wu, MW Dae and BH Hasegawa, "Absolute in vivo quantitation of myocardial activity using a combined x-ray CT and SPECT system (abstract)," J of Nucl Med 40:182P, 1999. 8. HR Tang, AJ Da Suva, KK Matthay, DC Price, JP Huberty, RA Hawkins and BH Hasegawa, "I-131-MIBG Imaging with the UCSF X-ray CT-SPECT System (abstract)," J of Nucl Med 40:282P, 1999. 9. MCWu,HRTang, JW O'Connell, DW Gao, Aldo,. BH Hasegawa and MW Dae, "An ECG-gated pinhole SPECT system for myocardial imaging of small animals (abstract)," J of Nucl Med 40:283P, 1999. 10. MC Wu, HR Tang, KH Wong, DW Gao, A Ido, JW O'Connell, BH Hasegawa and MW Dae, "ECG-Gated pinhole SPECT in mice (abstract)," Presented at the 1999 High Resolution Imaging in Small Animals with PET, MR and Other Modalities Conference (HiRes99), Amsterdam, The Netherlands, Sep 27-29, 1999. 11. BH Hasegawa, HR Tang, AJ Da Silva, K Iwata, MC Wu and KH Wong, "Combined CT/SPECT imaging system (abstract)," Presented at the International Conference on Medical Imaging, Medical Physics, and Precision Radiation Therapy, Guangzhou, China, October 4-6, 1999. 12. HR Tang, AJ Da Silva, BH Hasegawa and RA Hawkins, "Absolute SPECT quantitation using a point source calibration (abstract)," To be presented at the 47th Annual Meeting of the Society of Nuclear Medicine, St. Louis, 2000. 13. AJ Da Silva, HR Tang and BH Hasegawa, "Scatter correction for dual-isotope imaging (abstract)," To be presented at the 47th Annual Meeting of the Society of Nuclear Medicine, St. Louis, 2000. 14. KH Wong, HR Tang, AJ Da Silva, MC Wu, K Iwata and BH Hasegawa, "Improved quantitative imaging for 11 lln-Prostascint using CT/SPECT and dual-energy reconstruction (abstract)," To be presented at the 47th Annual Meeting of the Society of Nuclear Medicine, St. Louis, 2000. 15. MCV/u, IIRTaug,XH Wong, DW Gao, Aldo, BH Hasegawa andMWDu., "Myocardial imaging of mice using pinhole SPECT (abstract)," To be presented at the 47th Annual Meeting of the Society of Nuclear Medicine, St. Louis, 2000. 16. HR Tang, BH Hasegawa and RA Hawkins, "Measuring radiolabeled drug uptake with a combination imaging system (abstract)," To be presented at the U.S. Army Breast Cancer Research Program's Era of Hope Meeting, Atlanta, 2000. 17. HR Tang, BH Hasegawa and RA Hawkins, "Quantitative radionuclide imaging with a combined x-ray CT-scintillation camera (abstract)," To be presented at the U.S. Army Breast Cancer Research Program's Era of Hope Meeting, Atlanta, 2000. 18. HR Tang, AI Da Silva, RA Hawkins and BH Hasegawa, "Radionuclide scatter estimation using EGS4-generated convolution kernels (abstract)," To be presented at the World Congress of Medical Physics and Biomedical Engineering, Chicago, 2000. 19. HR Tang, RA Hawkins and BH Hasegawa, "Quantitative mammoscintigraphy using combined x-ray CT-radionuclide imaging (abstract)," To be presented at the World Congress of

^
Concept Proposal Submission Form
Medical Physics and Biomedical Engineering, Chicago, 2000. 20. CJ Huntzinger, K Brooks, HR Tang, B Hasegawa, R Mohan, "The MTF of IMRT (abstract)," To be presented at the World Congress of Medical Physics and Biomedical Engineering, Chicago, 2000.

The Relative Impact of Scatter on Absolute Myocardial Perfusion Quantitation: An EGS4 Monte Carlo Study
H. Roger Tang, Member, IEEE, Angela J. Da Silva, and Bruce H. Hasegawa, Member, IEEE Department of Radiology
University of California, San Francisco
Abstract Increased inferior activity in attenuation-corrected
myocardial images has been attributed to scatter from the liver. To study this effect, we used EGS4 to simulate the SPECT acquisition of a 1.5-cm thick spherical shell placed inside a 24-cm diameter tank. The distance between the shell and a liver-simulating hemisphere was varied from 0.1 to 2 cm and the shelhliver activity concentration ratio was varied from 4:1 to 1:1 to estimate the impact of liver scatter. Profiles through the projection data demonstrated that about 20% of detected counts were scatter, with almost no bias on the side of the shell closest to the liver, except when the shell was very close to the liver. Resulting MLEM-reconstructed images showed only a very small bias proximal to the liver, with quantitative errors dominated by resolution effects. Our modeled quantitation procedure underestimated the overall activity concentration by 15% but showed only small regional bias due to liver scatter.
I. INTRODUCTION
With attenuation correction, both researchers and clinicians have observed increased inferior activity in MLEM- reconstructed images of the heart. Most researchers have attributed this phenomenon to both the limited resolution of radionuclide imaging and scatter from hepatic activity [1]. However, in vivo measurements made in our laboratory using a porcine model of myocardial perfusion using Tc-99m-MIBI have correlated well with in vitro measurements, with little clear evidence of biased estimates due to scatter from the liver [2]. Therefore, we have studied the effects of scatter in quantitative myocardial imaging using a' Monte Carlo simulation of our imaging geometry. The goals were two- fold: (1) to study the relative numerical effects of scatter in our imaging process versus the "ideal" situation where we can reject all scattered photons; and (2) to estimate the relative effect of the presence of a nearby radioactive "liver-like" source for scatter photons.
II. METHODS
The EGS4 Monte Carlo code [3] was used to model the SPECT acquisition of two different phantoms in our imaging system. The first was a 19-cm diameter uniform tank filled with Tc-99m, used to calibrate the reconstructed data for our "imaging system," as is our practice experimentally [4]. A total of 10 million photon emissions per view were modeled for this phantom with 64 views over 360°. The second modeled phantom (Figure 1) was an approximation of the
animal anatomy that we have observed experimentally: a 24- cm diameter cylinder filled with lung-simulating material with a central attenuating sphere to model the heart and a hemisphere at the bottom of the cylinder to model the liver. Ten million photons were emitted from a 1.5-cm thick spherical shell in the central sphere to mimic the myocardial wall in a Tc-99m-MIBI perfusion study. Corresponding photon emissions were generated separately from the total liver volume to simulate a 4:1 shell:liver activity concentration. Because projection data for the shell and liver were modeled separately, the data were later rescaled to model relative activity ratios at 2:1 and 1:1, providing a range of activity concentrations bracketing what we observe experimentally in our animal studies. Again, 64 views over 360° were simulated.
cyldiam
radius of rotation
radius of rotation
1 Figure 1. EGS4 geometry for the myocardium scatter simulation, where: cyldiam = 24 cm; cylheight = 24 cm; liver radius = 10 cm; heart outer radius = 4.5 cm; heart inner radius = 3 cm; radius of rotation = 24.5 cm; collimator acceptance angle = 0.0414 radians; detector bin size = 0.432 cm; d = 0.1, 0.5, 1.0, 1.5, 2.0 cm. Numerical labels correspond to region or interface indices in the geometry specifications for EGS4 [3].
Projection data were calculated with EGS4 for the object geometries taking into account the diverging field of view of the collimator bores, approximately matching the distance- dependent resolution of our existing low-energy, high- resolution collimator. The planar data were quantized into 0.432 cm square detector bins. In each detector bin, detected photons were further separated into one keV bins and divided into primary, once Compton-scattered, multiply Compton- scattered, and Rayleigh scattered photons. To model the energy response of the Nal detector, the energy spectrum of

the signal in each detector bin was convolved in an energy- dependent manner by a Gaussian of variable width. Of course, the width of the Gaussian was varied as the square root of the detected photon energy [5] and was constrained such that the energy resolution matched that of our GE 600XR/T at 140 keV (approximately 9.4% FWHM). The detected counts in each detector bin were then calculated using an energy window centered at 140 keV with a 15% width to model our standard SPECT acquisition parameters. "Scatter-free" data sets (consisting of only primary photons) were also generated to represent idealized cases. Both the scatter-free and energy-blurred projection data were reconstructed using 30 iterations of MLEM [6] using the known object attenuation maps that were generated separately. In both cases, the attenuation values in the maps were the narrow beam linear attenuation coefficients for water (0.15 cm'1) and lung (0.05 cm"1) for the respective materials. No attempt was made at modeling the collimator response in the reconstruction.
A central region of interest (ROI) was defined in the reconstructed uniform tank to determine the conversion factor between emissions per unit volume and reconstructed voxel values for the both the scatter-free and the energy-blurred data. These calibration factors were used to scale the corresponding reconstructed values in the shell-liver phantom data to absolute activity concentration, as is our practice experimentally.
For the reconstructed images of the shell, the spherical shell was divided into two ROI's based on the shell's physical boundaries. One ROI was the shell hemisphere proximal to the liver-simulating hemisphere, while the other ROI was distal to the liver. The mean reconstructed activity concentration was determined for these ROI's to determine if there was a quantifiable difference between the section of the sphere closest to the liver and the section further away. In addition, the shell hemisphere proximal to the liver-simulating hemisphere was further divided into nine equally spaced annular ROI's (slices) as illustrated in Figure 2. The maximums along 64 equally spaced angles in each slice were determined and averaged to determine if there was a systematic quantitative trend in the activity concentration estimates toward the side of the sphere adjacent to the liver.
distal hemisphere
annular slices proximal hemisphere
Figure 2. Regions of interest for the quantitative evaluation of the reconstructed shell-liver phantom.
III. RESULTS
Modeled projection data for the different shell-liver distances are shown in Figure 3 for a 2:1 shell:liver activity concentration. Visually, there is little evidence of large
quantitative biases due strictly to scatter in the areas of the sphere nearest the liver, although there may be slight biases. The images of the primary photon distribution suggest that some fraction of increased activity proximal to the liver may be a consequence of the limited resolution of the collimator when the sphere is very close to the liver.
Figure 3. Projection images of the shell-liver EGS4 Monte Carlo phantom with 2:1 shell:liver activity concentration. Going across are the images for different shell to liver distances, d (0.1, 0.5, 1.0, 1.5, and 2.0 cm). The top row shows the scatter-free data, the middle row shows the single Compton-scattered photons in the 15% window, and the bottom row shows the multiple Compton-scattered photons in the 15% wide energy window.
Vertical profiles through the center of the d = 0.1 cm and 2.0 cm cases of Figure 3 are shown in Figure 4. The profiles show that the majority of the detected scatter photons in this acquisition geometry are once-scattered photons, comprising about 20% of the detected counts in each bin. The profiles also suggest that the fractional amount of detected scatter photons is slightly higher in the liver than in the heart. When the sphere is very close to the liver, this complicates the quantitation of sphere activity near the liver since the limited spatial resolution blurs the liver and its corresponding higher scatter fraction into the projection of the heart. For a 2.0 cm separation between the shell and the liver, the vertical profiles show only a very small (less than a few percent) bias on the side of the shell closer to the liver.
Figures 5 and 6 show the effects of increasing liver concentration for d = 0.1 cm and 2.0 cm for scatter-free data and data that include all of the scattered photons. Clearly, when the shell is very close to the liver, the effect of resolution is very important, although there is a small effect due to scatter. For larger shell-liver separations, the spatial resolution is less important and the quantitative effects due to scatter remain relatively small.
Figure 7 shows the mean reconstructed activity concentration in the two hemisphere of the shell for the scatter-free case, demonstrating only small quantitative differences between the proximal and distal sides of the shell when the shell-liver separation is small. Figure 8 shows the mean reconstructed activity concentration in the two hemispheres of the shell for the case where scatter was included in the model. In all cases, the reconstructed values were normalized by the corresponding calibration factors obtained from the reconstructed uniform tank. The actual

activity concentration in the shell was 1.86x10 emissions/cm3. Therefore, as expected, the activity concentrations in the shell are underestimated due to spatial resolution losses. The "scatter-free" case indicates that the mean activity concentration in the ROI's should be 62% of the expected activity concentration due to spatial resolution effects. However, the data that include the effects of scatter are only 56% of the expected activity concentration, i.e. lower than what would be expected due to spatial resolution errors alone. This is because the uniform calibration tank emits fractionally more detectable scatter photons than the shell and the scatter due to the "liver" source does not hugely affect the perceived counts from the shell.
Figure 8 shows that there is at most an additional 10% difference in the mean activity concentration estimated in the hemisphere closer to the liver due to scattered photons originating from the liver source. This additional bias decreases as a function of distance from the liver source and decreases for lower liver activity.
Figure 9 shows the results of analyzing the sub-slices of the shell hemisphere closest to the liver for d = 0.1 cm. The analysis of the reconstructed images shows that sections of the sphere closest to the liver are slightly higher in estimated activity concentration, especially for high liver activities. The cause of this bias is partially due to spatial resolution, as demonstrated by the scatter-free case. However, there is also a larger scatter component in slices closer to the liver than in slices further away, most likely due to the larger scatter fraction of the liver and a small amount of scatter off of the heart.
In general (for Figures 7-9), it is clear that there is an overall quantitative difference between the estimated activity concentrations when using scatter-free data and more realistic data, arising primarily from the calibration factor differences.
IV. DISCUSSION
Our basic model suggests that regional quantitative variations can exist due specifically to the effects of scatter. For our specific peometry, which cjoselv models ^° animal , anatomy that we have been investigating [2], the variation can be as much as 10%, and perhaps higher, if the object is immediately adjacent to the liver. However, this regional bias decreases when the "heart" is further away from the liver, or when the liver activity is lower. In fact, it is only possible to detect these small regional variations if we are able to overcome the other, larger, physical perturbations that affect our quantitative measurements, specifically spatial resolution limitations and motion. For example, the mean activity concentration estimate was only 62% of the actual activity concentration because of resolution effects alone. This is further complicated in actual practice by the regional variation in the wall thickness of the myocardium that may be larger than the variations due to scatter. In addition, the effects of motion (cardiac, respiratory, and voluntary) are non-trivial.
Although our analysis does not necessarily extend to the situation in humans because of anatomical differences, we can extrapolate our model to the potential effects of scatter in
geometric situations similar to the one that we have modeled. For example, if the inferior wall of the heart appears to have significantly higher activity that is not explainable by a geometric situation similar to ours, then other physical effects must dominate, such as thickness variations in the myocardium, respiratory motion, or actual uptake variations.
Overall, the human anatomy can be quite different from our model. In anatomies where the line of sight from the detector crosses both the heart and substantial sub- diaphragmatic activity, there will probably be a larger scatter problem because views of sub-diaphragmatic activity have a higher fraction of scattered photons than views of an isolated spherical shell. It is probably in these anatomical situations where scatter has a large impact quantitatively. Another potentially important situation is in the case of a perfusion deficit. Activity outside such a defect will have a tendency to contribute to the perceived activity in the deficit region because of low spatial resolution and scatter from other parts of the myocardium.
In our situation, one obvious effect of scatter is on our calibration scheme. While some of the quantitative effects of scatter are accounted for indirectly using a uniform tank for calibration purposes, there should still be a slight quantitative bias in estimating the myocardial activity. This bias is due to the geometric differences between a uniform tank and the actual cardiac anatomy, which does not necessarily contain the fractional amount of scatter that exists in a uniform activity tank. This analysis of our quantitation procedure suggests that using an empirical calibration from a uniform tank, we should underestimate the activity concentration in the heart by about 10-15%, although we do not observe this experimentally. In practice, other physical effects and uncertainties probably overwhelm this error. For example, non-cardiac activity in the lungs and other surrounding tissues may contribute additional "spill-in" counts that would tend to reduce this error.
V. CONCLUSIONS
This model of our experimental procedure predicts that the quantitative biases in our estimates of activity concentration iiiOui'J be on ehe oraci of 15% if'we do not äccöurk for the effects of scatter. The expected regional variation due to scatter should be less than 10%, depending on anatomy and liver activity concentration. As we improve our methods for compensating the activity estimates for the effects of attenuation and limited spatial resolution, and thus improve our measurement accuracy, we will be able to observe the quantitative effects of scatter.
VI. ACKNOWLEDGEMENTS
This work was supported, in part, by a grant from the National Institutes of Health (Grant 2 ROI CA 50539). This research was performed during the tenure of an Established Investigatorship from the American Heart Association for Bruce H. Hasegawa. H. Roger Tang acknowledges support from a US Army Breast Cancer Research Program Postdoctoral Fellowship (DAMD17-98-1-8192).
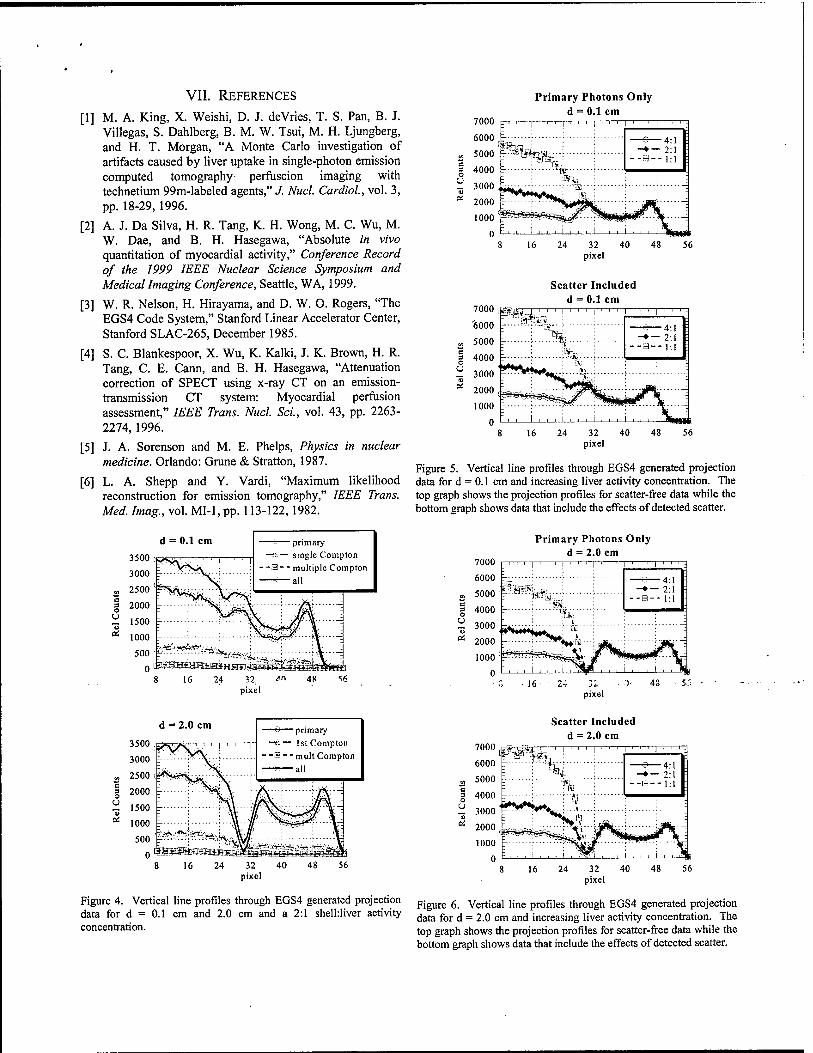
VII. REFERENCES
[1] M. A. King, X. Weishi, D. J. deVries, T. S. Pan, B. J. Villegas, S. Dahlberg, B. M. W. Tsui, M. H. Ljungberg, and H. T. Morgan, "A Monte Carlo investigation of artifacts caused by liver uptake in single-photon emission computed tomography perfuscion imaging with technetium 99m-labeled agents," J. Nucl. Cardiol, vol. 3, pp. 18-29,1996.
[2] A. J. Da Silva, H. R. Tang, K. H. Wong, M. C. Wu, M. W. Dae, and B. H. Hasegawa, "Absolute in vivo quantitation of myocardial activity," Conference Record of the 1999 IEEE Nuclear Science Symposium and Medical Imaging Conference, Seattle, WA, 1999.
[3] W. R. Nelson, H. Hirayama, and D. W. O. Rogers, "The EGS4 Code System," Stanford Linear Accelerator Center, Stanford SLAC-265, December 1985.
[4] S. C. Blankespoor, X. Wu, K. Kalki, J. K. Brown, H. R. Tang, C. E. Cann, and B. H. Hasegawa, "Attenuation correction of SPECT using x-ray CT on an emission- transmission CT system: Myocardial perfusion assessment," IEEE Trans. Nucl. Sei., vol. 43, pp. 2263- 2274,1996.
[5] J. A. Sorenson and M. E. Phelps, Physics in nuclear medicine. Orlando: Grune & Stratton, 1987.
[6] L. A. Shepp and Y. Vardi, "Maximum likelihood reconstruction for emission tomography," IEEE Trans. Med. Imag., vol. MI-1, pp. 113-122,1982.
Primary Photons Only d = 0.1 cm
Scatter Included d = 0.1 cm
Figure 5. Vertical line profiles through EGS4 generated projection data for d = 0.1 cm and increasing liver activity concentration. The top graph shows the projection profiles for scatter-free data while the bottom graph shows data that include the effects of detected scatter.
et
d - 0.1 cm 3500 -i T~— single Compton v*S>t' I ' ' ' 1 ' ' ' I
3000
vt J?TL.\
- -a - - multiple Compton
2500 (
2000
1500 ^H^iV/\ -: 1000 \*$gm--- \— 500 '
j*|;^^A-^y.JV4 = 0°
16 .24 '2. pixel
48
7000
6000
5000
Primary Photons Only d = 2.0 cm
g 4000
~ 3<MM> £ rt 2000
p"-~J--'tö%.;--:-
pixel
—S 4 -♦ — 2
d = 2.0 cm
'S et
*~> primary ->*•— 1st Compton
- -B - - mult Compton —w—all
Scatter Included d = 2.0 cm 7000 <mm-
u "5 et
4:1 2:1 1:1
Figure 4. Vertical line profiles through EGS4 generated projection data for d = 0.1 cm and 2.0 cm and a 2:1 shelhliver activity concentration.
Figure 6. Vertical line profiles through EGS4 generated projection data for d = 2.0 cm and increasing liver activity concentration. The top graph shows the projection profiles for scatter-free data while the bottom graph shows data that include the effects of detected scatter.
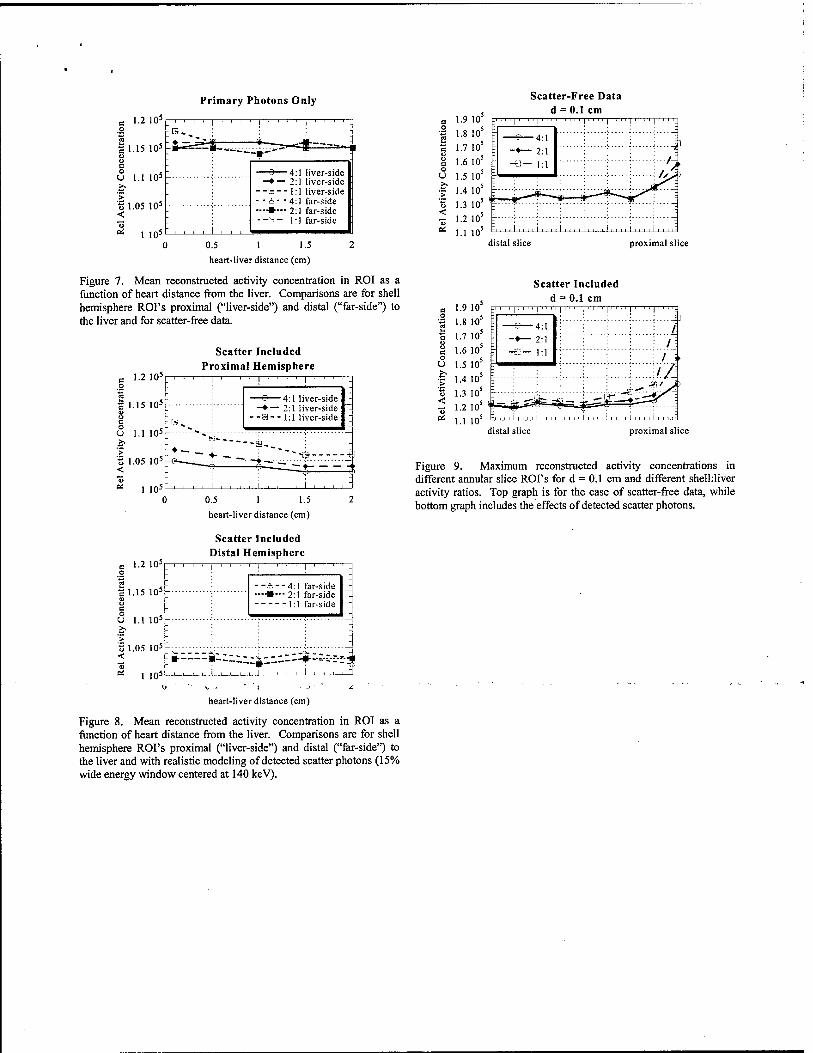
Primary Photons Only
1.2 105
1.15 105
Scatter-Free Data d = 0.1 cm
o 1.1 105
'§ 1.05 105
* 1 10s
ijU^^.^^gfr
~ä—4:1 liver-side -♦— 2:1 liver-side -B-- 1:1 liver-side ■ &• -4:1 far-side •-»•-- 2:1 far-side --- 1:1 far-side ■S 1-2 10-
* 1.1 10 0 0.5 1 1.5 2
heart-liver distance (cm)
Figure 7. Mean reconstructed activity concentration in ROI as a function of heart distance from the liver. Comparisons are for shell hemisphere ROI's proximal ("liver-side") and distal ("far-side") to the liver and for scatter-free data.
distal slice proximal slice
Scatter Included d = 0.1 cm
c 1-2 105r
| 1.15 105:
o c U 1.1 105:
'§ 1.05 105
<
Scatter Included Proximal Hemisphere
1 10=
_ , . . , 1 , , , 1 ! ' ' ' ' 1 ' ' ' -
:B^ :
- —♦—2:1 liver-side
- -a- - 1:1 liver-side
'-:--<--I "-*---._ ! ~
— .Tl ,*, — * . H
: *? V - , , , , i , , , , i , , , , i , , , , "
1.2 105 o
r .15 105
n> c o
1.1 105
> t> ,05 105 < <u et 1 105
0.5 1 1.5
heart-liver distance (cm)
Scatter Included Distal Hemisphere
: ! , , . 1 , , -
- -a- -4:1 far-side —■—2:1 far-side -_
\ i
: I \
itZ-'-J--!-- i , , ,
*:i
1.9 1.8 1.7 1.6 1.5 1.4 1.3 1.2 1.1
" ' 1' " 1111
„ 4:1
-*— 2:1 -e — 1:1
distal slice proximal slice
Figure 9. Maximum reconstructed activity concentrations in different annular slice ROI's for d = 0.1 cm and different shelhliver activity ratios. Top graph is for the case of scatter-free data, while bottom graph includes the effects of detected scatter photons.
heart-liver distance (cm)
Figure 8. Mean reconstructed activity concentration in ROI as a function of heart distance from the liver. Comparisons are for shell hemisphere ROI's proximal ("liver-side") and distal ("far-side") to the liver and with realistic modeling of detected scatter photons (15% wide energy window centered at 140 keV).
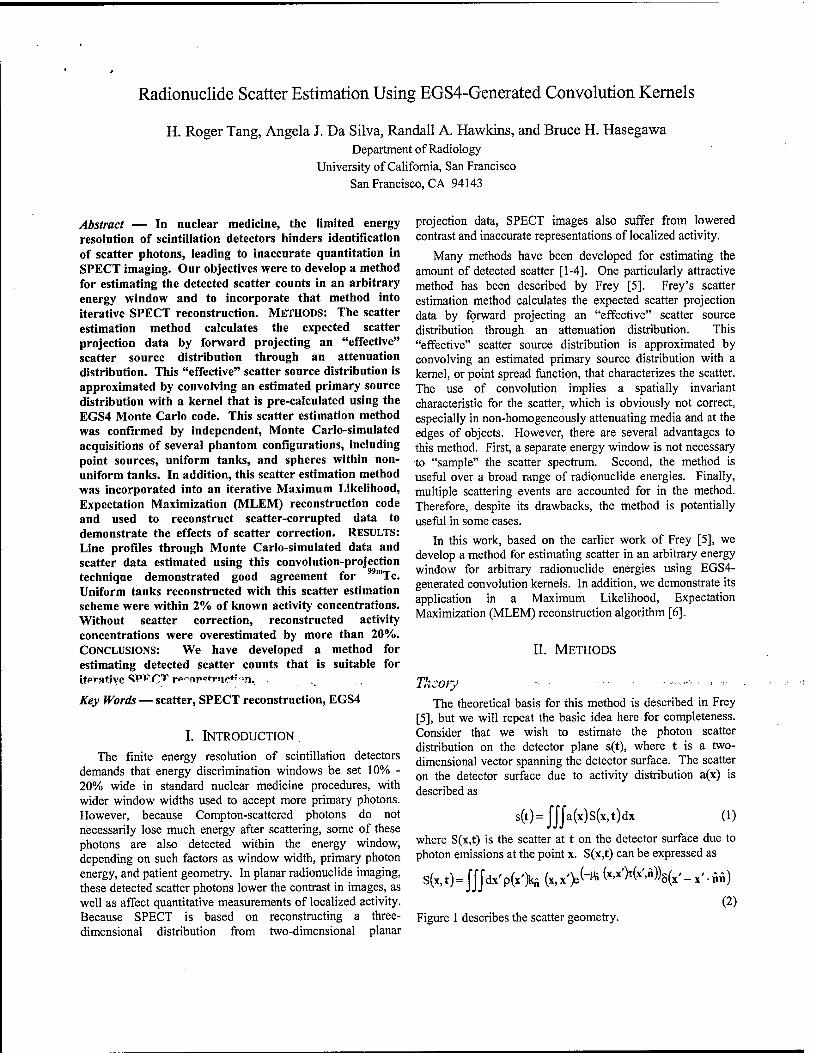
Radionuclide Scatter Estimation Using EGS4-Generated Convolution Kernels
H. Roger Tang, Angela J. Da Silva, Randall A. Hawkins, and Bruce H. Hasegawa Department of Radiology
University of California, San Francisco San Francisco, CA 94143
Abstract — In nuclear medicine, the limited energy resolution of scintillation detectors hinders identification of scatter photons, leading to inaccurate quantitation in SPECT imaging. Our objectives were to develop a method for estimating the detected scatter counts in an arbitrary energy window and to incorporate that method into iterative SPECT reconstruction. METHODS: The scatter estimation method calculates the expected scatter projection data by forward projecting an "effective" scatter source distribution through an attenuation distribution. This "effective" scatter source distribution is approximated by convolving an estimated primary source distribution with a kernel that is pre-calculated using the EGS4 Monte Carlo code. This scatter estimation method was confirmed by independent, Monte Carlo-simulated acquisitions of several phantom configurations, including point sources, uniform tanks, and spheres within non- uniform tanks. In addition, this scatter estimation method was incorporated into an iterative Maximum Likelihood, Expectation Maximization (MLEM) reconstruction code and used to reconstruct scatter-corrupted data to demonstrate the effects of scatter correction. RESULTS: Line profiles through Monte Carlo-simulated data and scatter data estimated using this convolution-projection technique demonstrated good agreement for mTc. Uniform tanks reconstructed with this scatter estimation scheme were within 2% of known activity concentrations. Without scatter correction, reconstructed activity concentrations were overestimated by more than 20%. CONCLUSIONS: We have developed a method for estimating detected scatter counts that is suitable for itpratiye SP^CT r^nr*trjn*?«n.
Key Words — scatter, SPECT reconstruction, EGS4
I. INTRODUCTION.
The finite energy resolution of scintillation detectors demands that energy discrimination windows be set 10% - 20% wide in standard nuclear medicine procedures, with wider window widths used to accept more primary photons. However, because Compton-scattered photons do not necessarily lose much energy after scattering, some of these photons are also detected within the energy window, depending on such factors as window width, primary photon energy, and patient geometry. In planar radionuclide imaging, these detected scatter photons lower the contrast in images, as well as affect quantitative measurements of localized activity. Because SPECT is based on reconstructing a three- dimensional distribution from two-dimensional planar
projection data, SPECT images also suffer from lowered contrast and inaccurate representations of localized activity.
Many methods have been developed for estimating the amount of detected scatter [1-4]. One particularly attractive method has been described by Frey [5]. Frey's scatter estimation method calculates the expected scatter projection data by forward projecting an "effective" scatter source distribution through an attenuation distribution. This "effective" scatter source distribution is approximated by convolving an estimated primary source distribution with a kernel, or point spread function, that characterizes the scatter. The use of convolution implies a spatially invariant characteristic for the scatter, which is obviously not correct, especially in non-homogeneously attenuating media and at the edges of objects. However, there are several advantages to this method. First, a separate energy window is not necessary to "sample" the scatter spectrum. Second, the method is useful over a broad range of radionuclide energies. Finally, multiple scattering events are accounted for in the method. Therefore, despite its drawbacks, the method is potentially useful in some cases.
In this work, based on the earlier work of Frey [5], we develop a method for estimating scatter in an arbitrary energy window for arbitrary radionuclide energies using EGS4- generated convolution kernels. In addition, we demonstrate its application in a Maximum Likelihood, Expectation Maximization (MLEM) reconstruction algorithm [6].
II. METHODS
T,icoiy »--•-*• • ■• The theoretical basis for this method is described in Frey
[5], but we will repeat the basic idea here for completeness. Consider that we wish to estimate the photon scatter distribution on the detector plane s(t), where t is a two- dimensional vector spanning the detector surface. The scatter on the detector surface due to activity distribution a(x) is described as
s(t)=j]"Ja(x)s(x,t)dx (1)
where S(x,t) is the scatter at t on the detector surface due to photon emissions at the point x. S(x,t) can be expressed as
S(x,t)= jJJdx'pCx'k (x,x')e(-Wi (x'x'Mx'A))8(x'-x'.nn)
(2) Figure 1 describes the scatter geometry.
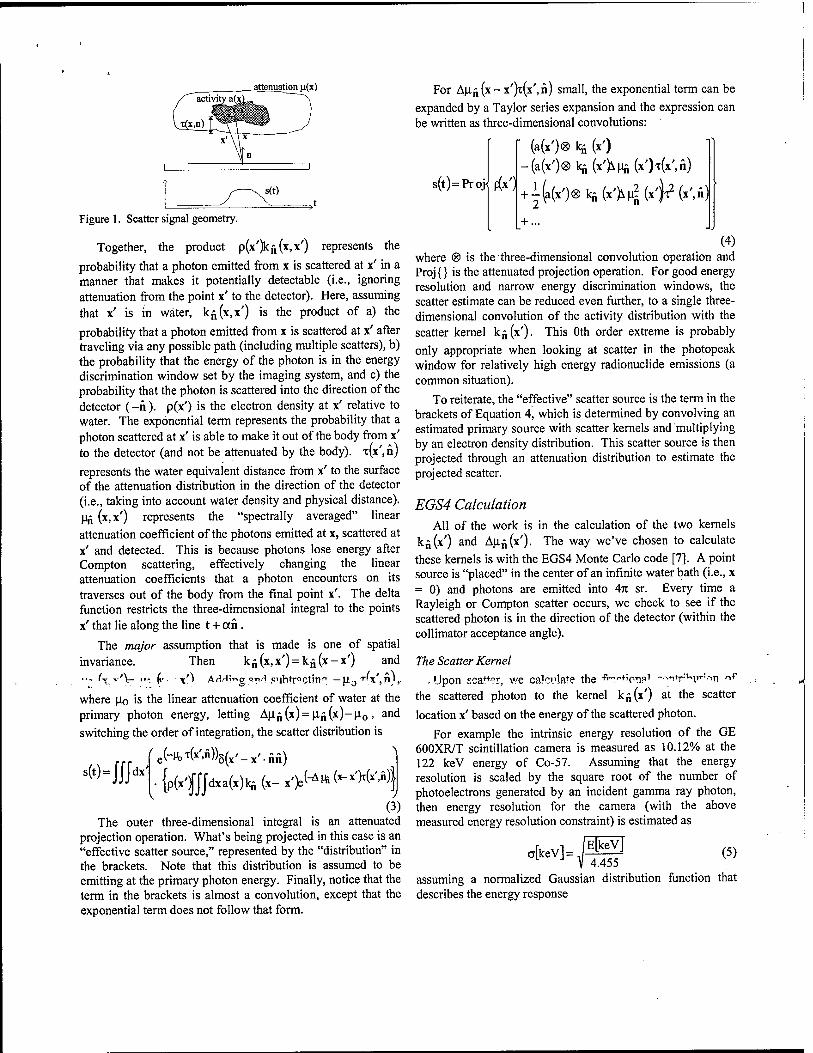
attenuation n(x)
Figure 1. Scatter signal geometry.
Together, the product p(x')kfi(x,x') represents the
probability that a photon emitted from x is scattered at x' in a manner that makes it potentially detectable (i.e., ignoring attenuation from the point x' to the detector). Here, assuming that x' is in water, kj(x,x') is the product of a) the
probability that a photon emitted from x is scattered at x' after traveling via any possible path (including multiple scatters), b) the probability that the energy of the photon is in the energy discrimination window set by the imaging system, and c) the probability that the photon is scattered into the direction of the detector (-n). p(x') is the electron density at x' relative to water. The exponential term represents the probability that a photon scattered at x' is able to make it out of the body from x' to the detector (and not be attenuated by the body). T(X',ä)
represents the water equivalent distance from x' to the surface of the attenuation distribution in the direction of the detector (i.e., taking into account water density and physical distance). U£ (x,x') represents the "spectrally averaged" linear attenuation coefficient of the photons emitted at x, scattered at x' and detected. This is because photons lose energy after Compton scattering, effectively changing the linear attenuation coefficients that a photon encounters on its traverses out of the body from the final point x'. The delta function restricts the three-dimensional integral to the points x' that lie along the line t + an.
The major assumption that is made is one of spatial invariance. Then kü(x,x')=k£(x-x') and ■ •- (y v'Xr ,■-. (,■ x') AHHir>cr qti.-i .subtracting — jx0 T'X',^),.
where po is the linear attenuation coefficient of water at the primary photon energy, letting Apfi(x)=Pn(x)-p0, and switching the order of integration, the scatter distribution is
' ^(*'>Ä))5(x'-x'.nn)
•{p(x')fJJdxa(x)kii(x-x')e^^(-x'Wx'Ä)|
(3) The outer three-dimensional integral is an attenuated
projection operation. What's being projected in this case is an "effective scatter source," represented by the "distribution" in the brackets. Note that this distribution is assumed to be emitting at the primary photon energy. Finally, notice that the term in the brackets is almost a convolution, except that the exponential term does not follow that form.
S(t) = UJdx'
For AU^(X-X')T(X',ä) small, the exponential term can be expanded by a Taylor series expansion and the expression can be written as three-dimensional convolutions:
s(t) = Proj
• (a(x')® kji (x')
^ -(a(x')®kn(x'>Mn(»'H*'.fi) p(x1+i(a(x')®lqi(x>U?(x'^(x')n)
2 + ...
(4) where ® is the three-dimensional convolution operation and Proj {} is the attenuated projection operation. For good energy resolution and narrow energy discrimination windows, the scatter estimate can be reduced even further, to a single three- dimensional convolution of the activity distribution with the scatter kernel k„(x'). This Oth order extreme is probably only appropriate when looking at scatter in the photopeak window for relatively high energy radionuclide emissions (a common situation).
To reiterate, the "effective" scatter source is the term in the brackets of Equation 4, which is determined by convolving an estimated primary source with scatter kernels and multiplying by an electron density distribution. This scatter source is then projected through an attenuation distribution to estimate the projected scatter.
EGS4 Calculation All of the work is in the calculation of the two kernels
k„(x') and AUn(x'). The way we've chosen to calculate these kernels is with the EGS4 Monte Carlo code [7]. A point source is "placed" in the center of an infinite water bath (i.e., x = 0) and photons are emitted into An sr. Every time a Rayleigh or Compton scatter occurs, we check to see if the scattered photon is in the direction of the detector (within the collimator acceptance angle).
The Scatter Kernel
Upon sealer, we calculate the f^^ipTip1 -••-i+r;H>+:->n ~f
the scattered photon to the kernel k„(x') at the scatter
location x' based on the energy of the scattered photon.
For example the intrinsic energy resolution of the GE 600XR/T scintillation camera is measured as 10.12% at the 122 keV energy of Co-57. Assuming that the energy resolution is scaled by the square root of the number of photoelectrons generated by an incident gamma ray photon, then energy resolution for the camera (with the above measured energy resolution constraint) is estimated as
,[kev]=S£V L J V 4.455
(5)
assuming a normalized Gaussian distribution function that describes the energy response

OV27t exp
(E~Em)2
2c2 (6)
where Em is the energy of the "detectable" photon. Therefore, if the energy discrimination windows are set at EH and EL, then the fractional contribution of the photon scattered at x' to the kernel k^ (x') is fweight, calculated using the error
function (erf):
fweight = — 2
erf EH_Em
WI -erf ■^m
cV2 (7)
Even after the photon is flagged and binned as "detectable," we continue to follow the photon until it has fallen below a preset photon energy cutoff (e.g., 50 keV). The reason for continuing to track the photon even after it has been "binned" is in the event that the photon is rescattered such that it is again detectable. The second (and further) detected photons are weighted by the product of the previous fweight factor(s) and the current fweight factor. We track the number of these multiple "detections" to confirm that such occurrences are relatively rare.
To calculate the scatter kernel k^(x'), we simply generate
billions of photon emissions from x = 0 and sum the resulting fractional contributions at locations x'. If we divide the resulting distribution by the number of emissions, the distribution can be viewed as the probability of (possible) detection as a function of location x'.
The Differential Attenuation Coefficient Kernel
Next, we calculate a running average of the energy of the detectable photons at each position x' using EGS4. For each "detectable" photon, the average energy (in the energy window) of the current "fractional" photon scattered at x' is
"avg fweight V27C
2a2
/ —e\
(EL-Emr 2a2
(8) The running average for each location x' is calculated as
, ,, _ Erunning(*')old ■ fweight(x')o|d +Eavg- fweight ^ Erunningl* Jnew - fweight(x')0id + fweight
Therefore, after generating the history for billions of photons, we have the spatial distribution of average energies of the "detectable" photons, Erunning(x'). We then have to convert this energy distribution into an attenuation distribution using the relationship between energy and the linear attenuation coefficient for water [8]. We scale the three- dimensional running average, Emming(\'), on a voxel by voxel basis to linear attenuation coefficients according to this relationship and then subtract a constant (Jo (the linear attenuation coefficient of water at the emission energy of interest) from every voxel to obtain the differential attenuation coefficient kernel, Au.fi (x').
Other Terms
The electron density relative to water, p(x0, can be approximated from a correlated attenuation map. We divide the attenuation map on a voxel by voxel basis by the linear attenuation coefficient of water at the energy of interest, po, to estimate the electron density map relative to water. x(x',n) is
calculated by first building a detection probability map p (x',t), the probability that a photon emitted at x' is detected
in the detector t. The detection probability map is built by walking the attenuation map volume from the detector face, decreasing the probability of detection (due to attenuation) along lines away from the detector. Finally, t(x',n) is
estimated from the detection probability map by
log(p(x',t)) r(x',n)=-
M-o (10)
MLEM Reconstruction The convolution-projection scatter estimation method was
incorporated into the forward projector of an iterative MLEM reconstruction algorithm. Monte Carlo-simulated acquisitions of several uniform tanks 14 to 20 cm in diameter were performed, creating sets of "scatter-corrupted" planar projection data at 64 stops over 360° for each phantom. The scatter-corrupted data were reconstructed using 10 iterations of MLEM with and without scatter estimation in the projector. For each view in the reconstruction process, the primary source and attenuation map estimates were rotated and re- sampled into a standard geometry so that the pre-calculated kernels could be applied consistently. The mean activity concentration in a central volume of interest in each reconstructed image was determined to demonstrate the quantitative difference between "scatter correction" with the convolution-projection model and no scatter correction.
III. RESULTS AND DISCUSSION
99mTc Kernels
Figure 2 (left) is a central suce*iuröugh me' c^euiated' scatter kernel, k^(x'), for the GE 600XR/T scintillation
camera equipped with a low-energy, high-resolution (LEHR) collimator and with energy windows set at 129 keV and 151 keV for the 140 keV emissions from 99mTc. The calculated kernel is the result of generating 2.4x10⁹ total initial photons at x = 0.
Figure 2. EGS4 calculated scatter kernels for *ymTc using a 129-151 keV energy window. Left is the scatter kernel and right is the average energy of the detectable photons scattered at locations x' emitted from x = 0. The detector direction is toward the bottom of the image.
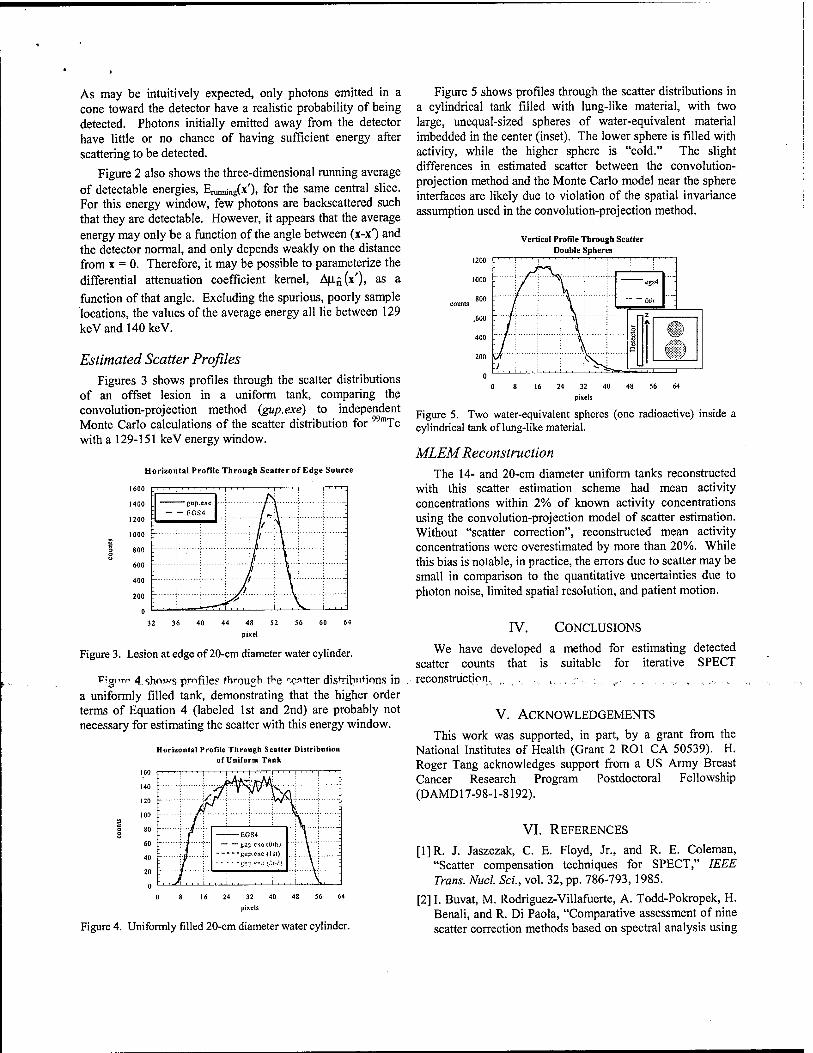
As may be intuitively expected, only photons emitted in a cone toward the detector have a realistic probability of being detected. Photons initially emitted away from the detector have little or no chance of having sufficient energy after scattering to be detected.
Figure 2 also shows the three-dimensional running average of detectable energies, E^^x'), for the same central slice. For this energy window, few photons are backscattered such that they are detectable. However, it appears that the average energy may only be a function of the angle between (x-x^ and the detector normal, and only depends weakly on the distance from x = 0. Therefore, it may be possible to parameterize the differential attenuation coefficient kernel, Au./,(x'), as a function of that angle. Excluding the spurious, poorly sample locations, the values of the average energy all lie between 129 keVandMOkeV.
Estimated Scatter Profiles Figures 3 shows profiles through the scatter distributions
of an offset lesion in a uniform tank, comparing the convolution-projection method (gup.exe) to independent Monte Carlo calculations of the scatter distribution for with a 129-151 keV energy window.
Horizontal Profile Through Scatter of Edge Source
99m. Tc
Figure 3. Lesion at edge of 20-cm diameter water cylinder.
Figure 4. shows pmfile? through the "cotter distributions in a uniformly filled tank, demonstrating that the higher order terms of Equation 4 (labeled 1st and 2nd) are probably not necessary for estimating the scatter with this energy window.
Horizontal Profile Through Scatter Distribution of Uniform Tank
160
140
120
100
20
0
. ' ' ' 1 ■■■>■■■>' , , | i, , i . i . | , . , | i
r \/jt.\
~r\T"jrA&:
■ Xyv
r \ ••;V-j -_ -EGS4
7 : — - iioxi ete tüilij •V--:
L ; -gup.exe <tsi) ...;.....V..: -
'- •] "!;<•? <\ü ;."'J! ■■[ Yj J
. , J\ ... i ... i . , . 1 . , . 1 , , . i . . . \, , ,
Figure 5 shows profiles through the scatter distributions in a cylindrical tank filled with lung-like material, with two large, unequal-sized spheres of water-equivalent material imbedded in the center (inset). The lower sphere is filled with activity, while the higher sphere is "cold." The slight differences in estimated scatter between the convolution- projection method and the Monte Carlo model near the sphere interfaces are likely due to violation of the spatial invariance assumption used in the convolution-projection method.
Vertical Profile Through Scatter Double Spheres
16 24 32 40 48 56 64 pixels
Figure 4. Uniformly filled 20-cm diameter water cylinder.
pixels
Figure 5. Two water-equivalent spheres (one radioactive) inside a cylindrical tank of lung-like material.
MLEM Reconstruction The 14- and 20-cm diameter uniform tanks reconstructed
with this scatter estimation scheme had mean activity concentrations within 2% of known activity concentrations using the convolution-projection model of scatter estimation. Without "scatter correction", reconstructed mean activity concentrations were overestimated by more than 20%. While this bias is notable, in practice, the errors due to scatter may be small in comparison to the quantitative uncertainties due to photon noise, limited spatial resolution, and patient motion.
IV. CONCLUSIONS
We have developed a method for estimating detected scatter counts that is suitable for iterative SPECT reconstruction. ,. . ., ,. . ■ :, ,. ., ., x., ...
V. ACKNOWLEDGEMENTS
This work was supported, in part, by a grant from the National Institutes of Health (Grant 2 ROl CA 50539). H. Roger Tang acknowledges support from a US Army Breast Cancer Research Program Postdoctoral Fellowship (DAMD17-98-1-8192).
VI. REFERENCES
[1]R. J. Jaszczak, C. E. Floyd, Jr., and R. E. Coleman, "Scatter compensation techniques for SPECT," IEEE Trans. Nucl. Sei., vol. 32, pp. 786-793,1985.
[2] I. Buvat, M. Rodriguez-Villafuerte, A. Todd-Pokropek, H. Benali, and R. Di Paola, "Comparative assessment of nine scatter correction methods based on spectral analysis using

Monte Carlo simulations," J. Nucl. Med., vol. 36, pp. 1476-1488,1995.
[3]E. C. Frey and B. M. W. Tsui, "Modeling the scatter response function in inhomogeneous scattering media for SPECT," IEEE Trans. Nucl. Sei., vol. 41, pp. 1585-1593, 1994.
[4] A. Welch, G. T. Gullberg, P. E. Christian, F. L. Date, and H. T. Morgan, "A transmission-map-based scatter correction technique for SPECT in inhomogeneous media," Med. Phys., vol. 22, pp. 1627-1635,1995.
[5]E. C. Frey and B. M. W. Tsui, "A new method for modeling the spatially-variant, object-dependent scatter response function in SPECT," Conference Record of the 1996 IEEE Nuclear Science Symposium and Medical Imaging Conference, Anaheim, CA, USA, vol. 2, pp. 1082- 1086., 1996.
[6]L. A. Shepp and Y. Vardi, "Maximum likelihood reconstruction for emission tomography," IEEE Trans. Med. Imag., vol. MI-1, pp. 113-122,1982.
[7] W. R. Nelson, H. Hirayama, and D. W. O. Rogers, "The EGS4 Code System," Stanford Linear Accelerator Center, Stanford SLAC-265, December 1985.
[8]J. H. Hubbell, "Photon mass attenuation and energy- absorption coefficients from 1 keV to 20 MeV," Int. J. Appl. Radiat. hot, vol. 33, pp. 1269-1290,1982.
ABSOLUTE SPECT QUANTITATION USING A POINT SOURCE CALIBRATION
H. R. Tang, A. J. Da Silva, B. H. Hasegawa, and R. A. Hawkins University of California at San Francisco
Presented at the 47th Annual Meeting of the Society of Nuclear Medicine St. Louis, Missouri
June 3-7, 2000 (Journal of Nuclear Medicine 4L101P, 2000)
Objective: In practice, many quantitation schemes use a SPECT scan of a uniform tank to determine the calibration factor between reconstructed SPECT data and absolute physical units (MBq/cm3). Our aim was to develop a method that used only a point source. Methods: The quantification technique requires only a single planar scan of a point source of known activity using the same energy windows as used for the SPECT scan. From this point source scan, the camera sensitivity is determined in (counts/sec) per MBq. SPECT projection data are reconstructed using an MLEM implementation that produces reconstructed images in units of "detectable counts" emitted per cm3. In addition to compensating for attenuation using a correlated attenuation map, the quantitation procedure also estimates the detected scatter using a convolution method [Frey and Tsui, 1996 IEEE NSS/MIC Conf. Rec, p. 1082-6] and models the collimator response using distance-dependent blurring. Finally, we obtain the physical activity concentration (MBq/cm3) in the SPECT images after dividing the reconstructed images by the scan time per view and the camera sensitivity. This method was confirmed by Monte Carlo-simulated acquisitions of 14-cm and 20-cm diameter tanks and experimental scans of a 12-cm diameter uniform tank with activity concentrations ranging from 8.4kBq/cm3 to 84kBq/cm . Results: The estimated activities were within 2% of the known values for the Monte Carlo-simulated data. The estimated activities in the experimental data were within 15% of their measured values. Conclusions: We have developed an absolute quantitation method that is calibrated by a single planar scan of a point source.
QUANTITATIVE MAMMOSCINTIGRAPHY USING COMBINED X-RAY CT-RADIONUCLIDE IMAGING
H. R. Tang, R. A. Hawkins, and B. H. Hasegawa University of California at San Francisco
Presented at the World Congress of Medical Physics and Biomedical Engineering Chicago, IL
July 23-28, 2000
Quantitative measurements of radiopharmaceutical uptake in breast cancer may prove beneficial for cancer management. Therefore, our goal was to develop a planar imaging method for quantifying localized lesion activity using spatially registered x-ray CT-radionuclide images.
METHODS: X-ray CT and planar radionuclide images are registered using a combined x-ray CT- scintillation camera imaging system. Volumes of interest (VOI's) delineating the lesion and the non-lesion background are defined anatomically on the x-ray CT images and projected onto planar radionuclide scans using physical models of the radionuclide imaging process, including the effects of attenuation, spatial resolution, and scatter. Through this VOI projection process, the relative geometric contributions of lesion and background to each pixel of a planar image are known. Therefore, the lesion and background activities can be estimated using a least-squares fit of the modeled activities to the measured planar data. This technique was tested using Monte Carlo-simulated acquisitions of a sphere of uniform background containing lesions ranging from 0.5-20cm3 in size with lesionrbackground activity concentration as low as 2:1.
RESULTS: The measurement accuracy error was less than 10% using 99mTc for objects as small as l-2cm3 and for lesiombackground activity concentrations as low as 2:1.
CONCLUSIONS: Accurate quantification methods have been developed for planar radionuclide imaging using correlated imaging. Using simulation studies, we have demonstrated that it is possible to measure the uptake in anatomically definable lesions to within 10% of the absolute activity.
This research was supporteH by an enuio^eritpraTit from GF Medical Systems.,

Absolute In Vivo Quantitation of Myocardial Activity
Angela J. Da Silva1, H. Roger Tang1, Kenneth H. Wong3, Max C. Wu3, Michael W. Dae
and Bruce H. Hasegawa1'3
'Department of Radiology, and Cardiovascular Research Institute, University of California San Francisco, California 94143 3Bioengineering Graduate Group, University of California San Francisco and Berkeley, California 94720
Abstract Quantitation of myocardial SPECT images corrected for
attenuation underestimates the true radionuclide content due to partial volume errors. To measure radionuclide uptake more accurately, we have developed a technique to compensate these images for partial volume errors using coregistered X- ray CT images. The CT image is used to define a template that approximates the geometrical extent of the myocardium. Once defined, the template is assigned unit activity and is mathematically projected using a realistic physical model of the radionuclide imaging process. These projections are then reconstructed and used to compensate the SPECT image for partial volume errors. The method was tested in a porcine model of myocardial perfusion using Tc-99m sestamibi. With attenuation correction alone, the in vivo activity concentration in the porcine myocardium had an error in the range -40% to -60% compared to the true activity concentration. By also correcting for partial volume errors, the in vivo activity concentration was determined to within 10% of the true value.
I. INTRODUCTION
Current techniques for assessing myocardial perfusion rely on visual interpretation or use maximum-count circumferential profiles normalized by count values that are assumed to represent normally perfused regions [1]. Quantitative radionuclide imaging, on an absolute rather than relative basis, would provide a more rational basis for assessing metabolic function and coronary disease [2]. One instance where absolute quantitation of myocardial perfusion images would
.be highly beneficial, i? in the ?<=<;essmeii* ff natirvts with triple-vessel disease. While qualitative analysis may identify the most severely stenosed coronary artery, less severely stenosed arteries may not be identified without an absolute measure of the radionuclide uptake in the myocardium. And in the case of balanced triple-vessel disease [3], an overall reduction in activity concentration could go unnoticed if examined on a relative scale but may be quite obvious when evaluated on an absolute scale. More generally, absolute quantitation may improve reproducibility, reduce inter- observer variability, and lead to more standardized, objective reports.
Despite the advent of patient-specific attenuation correction, the relatively poor spatial resolution of single photon emission computed tomography (SPECT) remains a major limiting factor for the accuracy of quantitative studies. The direct consequence of limited spatial resolution is the loss of signal for structures with dimensions smaller than about 2-3 times the FWHM of the imaging system [4]. Our previous
studies in phantoms and animals [5-7] show that once attenuation corrections have been applied, partial volume effects become a major source of error for absolute radionuclide quantitation in myocardial SPECT measurements and cause the true radionuclide content to be underestimated by approximately 50%. A further consequence of these partial volume errors is the inability of SPECT to account for structurally-dependent variations in reconstructed myocardial activity between individuals [8, 9], or for regional variations in wall thickness within a given individual [10].
To achieve absolute quantitation of single-photon radiopharmaceuticals using a non-invasive technique, we must find a way to compensate for these effects. Traditionally, radionuclide quantitation has focused on methods that compensate the radionuclide image for physical errors such as photon attenuation, scatter radiation and partial volume errors. However, methods that correct the radionuclide data for partial volume errors using collimator response models cannot recover spatial frequencies that are lost during image acquisition. Similarly, use of recovery coefficients [11, 12] requires a priori information about object size and shape, and generally is only used for simple target geometries (e.g., spheres). We therefore have departed from the traditional paradigm of correcting the radionuclide SPECT images prior to quantitation by developing a method that incorporates physical models, not in image reconstruction, but rather into the quantitation process itself [7]. This technique is similar to methods used to correct for partial volume errors in positron emission tomography of the brain using registered magnetic resonance images [13-16]. In this paper, we review our partial volume correction technique and present validation results irom animal experiments.
II. METHODS
A. System Description and Data Acquisition We have developed a combined CT/SPECT imaging
system [17] to record coregistered anatomical information from CT and functional information from SPECT. The imaging system combines a commercial x-ray CT scanner and a single-headed scintillation camera using a common imaging table. X-ray CT scans and tomographic radionuclide scans are acquired in succession via a simple translation of the imaging table. The resulting 3-dimensional anatomical and functional data sets are coregistered in software with linear translation and rigid-body rotation of the CT and SPECT images. Volumes of interest defined in one image space can be easily transferred into the other image space using the rigid-body

transformation matrix derived from the images of fiducial markers scanned in the CT/SPECT system [6]. Furthermore, transmission data can be used to derive an object-specific attenuation map that can be used to compensate SPECT images for photon-attenuation errors [5, 6, 18, 19]. Details of the image registration technique and the attenuation map generation can be found elsewhere [6,20].
For these studies, x-ray CT data were acquired at 140 kVp, 70 mA, with a 2 second scan-time and a 48 cm field-of-view. Axial slice collimation and spacing was 3 mm over the entire extent of the heart, typically extending past the dome of the liver. The CT images were reconstructed with a 512 x 512 format using the filtered back-projection algorithm provided by the scanner manufacturer (General Electric, Milwaukee, WI) before being transferred to a workstation for further processing.
The correlated radionuclide images were acquired with 128 angular views over 360 degrees using a 128 x 128 matrix, 15 seconds/view, a 15% energy window centered at 140 keV, a 46 cm scan diameter and a low-energy, high resolution (LEHR) collimator. The radionuclide data were reconstructed as 128 x 128 images using 30 iterations of a maximum- likelihood expectation maximization (ML-EM) algorithm [21] both with and without attenuation compensation using the object-specific attenuation map derived from the x-ray CT image. As demonstrated by previous experiments in our laboratory [19], 30 iterations are sufficient to reach near- convergence with the ML-EM algorithm.
To calibrate the reconstructed image values into units of uCi/ml, a 14.3-cm diameter cylindrical water phantom containing a known uniform activity concentration of Tc-99m was also imaged in the CT/SPECT system. To avoid any errors due to changes in camera efficiency or technique, the calibration factor was measured for each animal study.
B. Animal Study Protocol The partial volume correction technique was tested in a
porcine model of myocardial perfusion using Tc-99m sestamibi--,',hii's.t1"* nbc^l"<--" .'" "b"- Tiea<mrerr""its °f the radionuclide uptake in the myocardium could be compared to ex vivo activity measurements of the excised myocardium. All animal studies were approved by the institutional committee on animal research. Eight adult pigs, each weighing approximately 30 kg (mean weight 28.3 ± 1.5 kg, range 26.3 kg to 30.6 kg) were anesthetized and mechanically ventilated on a respirator (Harvard Apparatus Dual Phase Control respirator, Harvard Apparatus, Inc., South Natick, MA). Their ECG was continuously monitored throughout the study. Prior to imaging, each animal was injected intravenously with 1.11 GBq (30 mCi) of Tc-99m sestamibi. In some cases, regional myocardial blood flow was modified either by a vasodilator (dipyridamole) or by LAD occlusion. A vasodilator was used in two animals. For these animals, dipyridamole was infused over a 4-minute period with the Tc-99m sestamibi administered 7 minutes after the start of the dipyridamole infusion. Three animals were prepared with an LAD occlusion. A left lateral thoracotomy was performed in the
fifth intercostal space and the left anterior descending coronary artery, distal to the first major diagonal branch, was isolated. A snare occluder was placed around the artery and the ribs were repositioned to approximate a closed-chest configuration. Once the animal was positioned on the imaging table, the occlusion was initiated by tightening the snare occluder surrounding the LAD. The occlusion was maintained for a total of 6 minutes (2 minutes prior to the Tc- 99m sestamibi injection and 4 minutes following the injection) to allow for blood clearance of the radiopharmaceutical.
For all imaging studies, each animal was placed on the imaging table in the supine position. During the CT data acquisition, iodinated contrast (Omnipaque, 300 mg I/ml) was continuously infused intravenously at a rate of 5 ml/minute to opacify the cardiac blood pool allowing the myocardium to be visualized... In addition, to reduce streak artifacts due to respiratory motion, the ventilator was suspended during CT image acquisition. Following CT imaging, SPECT data were acquired at 128 angular views over 360 degrees. To reduce effects due to hepatic activity, SPECT imaging was not started until at least 60 minutes after the radiopharmaceutical injection. After the desired images were acquired, the animal was euthanized and a set of CT and SPECT images was acquired without any respiratory or cardiac motion effects.
After the imaging study, the heart was removed from the euthanized animal. In each case, the heart was sliced into approximately 1-cm-thick short axis slices. The left ventricle was separated from the right ventricle and, using the junction of the right ventricle as a reference, the left ventricle was further divided into four roughly equal-sized pieces corresponding to the septal, anterior, lateral and inferior walls. (The apical slice was typically left intact.) The individual tissue samples were then weighed and their activities were measured by placing them directly on the face of the scintillation camera with a vial containing a known activity of Tc-99m as a calibration source. For identification purposes, the myocardial segments were numbered according to the layout shown in Figure 1.
Anterior
Inferior Figurel. Schematic bullseye plot indicating the numbering sequence used to identify the various myocardial segments.
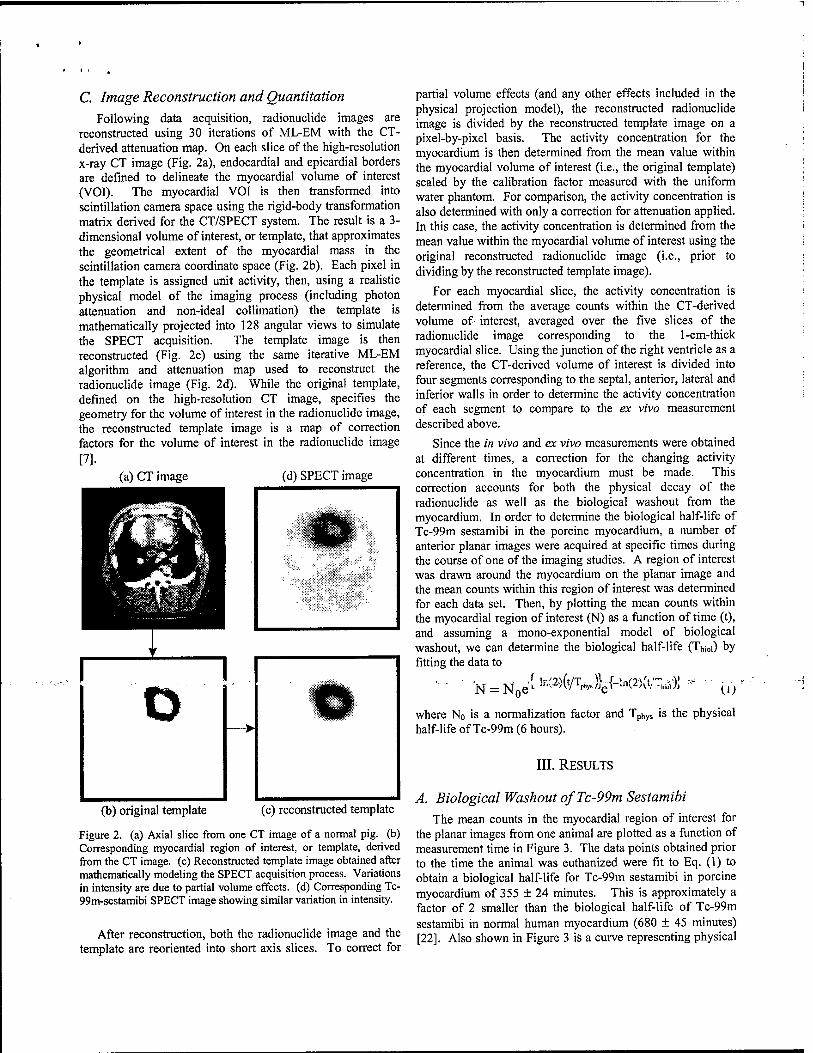
C. Image Reconstruction and Quantitation Following data acquisition, radionuclide images are
reconstructed using 30 iterations of ML-EM with the CT- derived attenuation map. On each slice of the high-resolution x-ray CT image (Fig. 2a), endocardial and epicardial borders are defined to delineate the myocardial volume of interest (VOI). The myocardial VOI is then transformed into scintillation camera space using the rigid-body transformation matrix derived for the CT/SPECT system. The result is a 3- dimensional volume of interest, or template, that approximates the geometrical extent of the myocardial mass in the scintillation camera coordinate space (Fig. 2b). Each pixel in the template is assigned unit activity, then, using a realistic physical model of the imaging process (including photon attenuation and non-ideal collimation) the template is mathematically projected into 128 angular views to simulate the SPECT acquisition. The template image is then reconstructed (Fig. 2c) using the same iterative ML-EM algorithm and attenuation map used to reconstruct the radionuclide image (Fig. 2d). While the original template, defined on the high-resolution CT image, specifies the geometry for the volume of interest in the radionuclide image, the reconstructed template image is a map of correction factors for the volume of interest in the radionuclide image [7].
(a) CT image (d) SPECT image
(b) original template (c) reconstructed template
Figure 2. (a) Axial slice from one CT image of a normal pig. (b) Corresponding myocardial region of interest, or template, derived from the CT image, (c) Reconstructed template image obtained after mathematically modeling the SPECT acquisition process. Variations in intensity are due to partial volume effects, (d) Corresponding Tc- 99m-sestamibi SPECT image showing similar variation in intensity.
After reconstruction, both the radionuclide image and the template are reoriented into short axis slices. To correct for
partial volume effects (and any other effects included in the physical projection model), the reconstructed radionuclide image is divided by the reconstructed template image on a pixel-by-pixel basis. The activity concentration for the myocardium is then determined from the mean value within the myocardial volume of interest (i.e., the original template) scaled by the calibration factor measured with the uniform water phantom. For comparison, the activity concentration is also determined with only a correction for attenuation applied. In this case, the activity concentration is determined from the mean value within the myocardial volume of interest using the original reconstructed radionuclide image (i.e., prior to dividing by the reconstructed template image).
For each myocardial slice, the activity concentration is determined from the average counts within the CT-derived volume of- interest, averaged over the five slices of the radionuclide image corresponding to the 1-cm-thick myocardial slice. Using the junction of the right ventricle as a reference, the CT-derived volume of interest is divided into four segments corresponding to the septal, anterior, lateral and inferior walls in order to determine the activity concentration of each segment to compare to the ex vivo measurement described above.
Since the in vivo and ex vivo measurements were obtained at different times, a correction for the changing activity concentration in the myocardium must be made. This correction accounts for both the physical decay of the radionuclide as well as the biological washout from the myocardium. In order to determine the biological half-life of Tc-99m sestamibi in the porcine myocardium, a number of anterior planar images were acquired at specific times during the course of one of the imaging studies. A region of interest was drawn around the myocardium on the planar image and the mean counts within this region of interest was determined for each data set. Then, by plotting the mean counts within the myocardial region of interest (N) as a function of time (t), and assuming a mono-exponential model of biological washout, we can determine the biological half-life (Tb;0i) by fitting the data to
NJ = N eL K'"l 'piWjgi-'rMnv 'MA (0* U)
where No is a normalization factor and TPhys is the physical half-life of Tc-99m (6 hours).
III. RESULTS
A. Biological Washout ofTc-99m Sestamibi The mean counts in the myocardial region of interest for
the planar images from one animal are plotted as a function of measurement time in Figure 3. The data points obtained prior to the time the animal was euthanized were fit to Eq. (1) to obtain a biological half-life for Tc-99m sestamibi in porcine myocardium of 355 ± 24 minutes. This is approximately a factor of 2 smaller than the biological half-life of Tc-99m sestamibi in normal human myocardium (680 ± 45 minutes) [22]. Also shown in Figure 3 is a curve representing physical
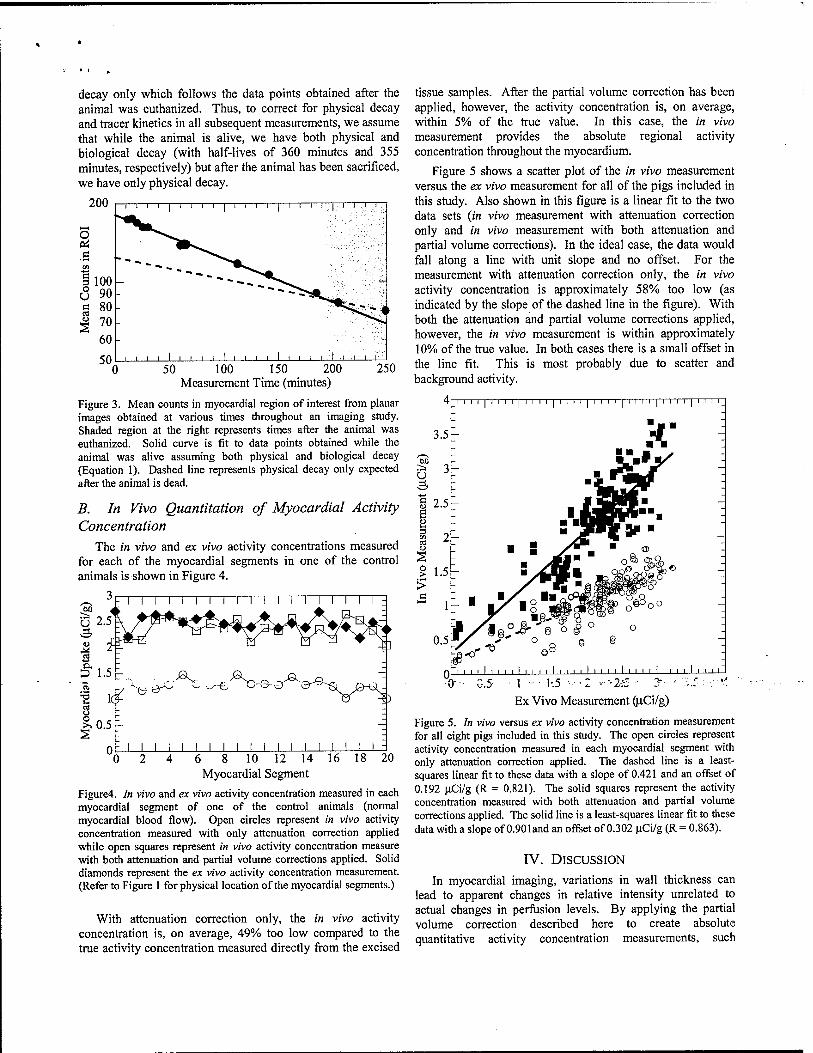
decay only which follows the data points obtained after the animal was euthanized. Thus, to correct for physical decay and tracer kinetics in all subsequent measurements, we assume that while the animal is alive, we have both physical and biological decay (with half-lives of 360 minutes and 355 minutes, respectively) but after the animal has been sacrificed, we have only physical decay.
50 _L _L _L 50 100 150 200
Measurement Time (minutes) 250
Figure 3. Mean counts in myocardial region of interest from planar images obtained at various times throughout an imaging study. Shaded region at the right represents times after the animal was euthanized. Solid curve is fit to data points obtained while the animal was alive assuming both physical and biological decay (Equation 1). Dashed line represents physical decay only expected after the animal is dead.
B. In Vivo Quantitation of Myocardial Activity Concentration
The in vivo and ex vivo activity concentrations measured for each of the myocardial segments in one of the control animals is shown in Figure 4.
U 2.5
<u
£> 1.5
'S lc cd
| 0.5^
I I I I I I I I I I I I I I I I I I I
0
^ ^V/^ ^ae-
[ i i i i i i i 6 8 10 12 14 16 18 20
Myocardial Segment
Figure4. In vivo and ex vivo activity concentration measured in each myocardial segment of one of the control animals (normal myocardial blood flow). Open circles represent in vivo activity concentration measured with only attenuation correction applied while open squares represent in vivo activity concentration measure with both attenuation and partial volume corrections applied. Solid diamonds represent the ex vivo activity concentration measurement. (Refer to Figure 1 for physical location of the myocardial segments.)
With attenuation correction only, the in vivo activity concentration is, on average, 49% too low compared to the true activity concentration measured directly from the excised
tissue samples. After the partial volume correction has been applied, however, the activity concentration is, on average, within 5% of the true value. In this case, the in vivo measurement provides the absolute regional activity concentration throughout the myocardium.
Figure 5 shows a scatter plot of the in vivo measurement versus the ex vivo measurement for all of the pigs included in this study. Also shown in this figure is a linear fit to the two data sets (in vivo measurement with attenuation correction only and in vivo measurement with both attenuation and partial volume corrections). In the ideal case, the data would fall along a line with unit slope and no offset. For the measurement with attenuation correction only, the in vivo activity concentration is approximately 58% too low (as indicated by the slope of the dashed line in the figure). With both the attenuation and partial volume corrections applied, however, the in vivo measurement is within approximately 10% of the true value. In both cases there is a small offset in the line fit. This is most probably due to scatter and background activity.
T i i i i I i i i i T T T
\i.y i I.J ^ - ^'.~ - — ■
Ex Vivo Measurement (uCi/g)
Figure 5. In vivo versus ex vivo activity concentration measurement for all eight pigs included in this study. The open circles represent activity concentration measured in each myocardial segment with only attenuation correction applied. The dashed line is a least- squares linear fit to these data with a slope of 0.421 and an offset of 0.192 uCi/g (R = 0.821). The solid squares represent the activity concentration measured with both attenuation and partial volume corrections applied. The solid line is a least-squares linear fit to these data with a slope of 0.901and an offset of 0.302 uCi/g (R = 0.863).
IV. DISCUSSION
In myocardial imaging, variations in wall thickness can lead to apparent changes in relative intensity unrelated to actual changes in perfusion levels. By applying the partial volume correction described here to create absolute quantitative activity concentration measurements, such

geometrical effects can be removed resulting in more accurate assessment of myocardial perfusion.
While no direct scatter correction was included in this analysis, we were able to determine the myocardial radionuclide concentration to within 10% of the absolute value. We should point out, however, that the calibration factor was determined from a water phantom measurement that contains scatter, as a result, some of the effects of scatter may have been accounted for indirectly. Simulation studies performed by our group suggest that large regional variations are not expected across the myocardium due to scatter from liver activity [23]. As a result, by including the effects of scatter only indirectly (i.e., by using the water tank calibration factor) we are still able to determine the regional myocardial activity concentration relatively accurately.
In the data presented here, no explicit attempt was made to correct for cardiac or respiratory motion. Since the CT image is obtained while the heart is beating, however, cardiac motion is accounted for indirectly. The myocardial template, as defined by the CT image, becomes slightly thicker than the myocardial wall due to motion blur. The accuracy we were able to achieve in determining the regional myocardial activity concentration suggests that motion effects are relatively small in this study (on the order of 10%).
V. CONCLUSIONS
We have established a new technique for compensating myocardial SPECT images for partial volume errors using coregistered x-ray CT images. The CT image provides both an object-specific attenuation map for SPECT reconstruction, and an anatomical template to define regions of interest for quantitation of the SPECT images. The effectiveness of this technique has been demonstrated in animal experiments where we have been able to achieve absolute regional radionuclide quantitation in porcine myocardium.
VI. ACKNOWLEDGMENTS
This v"»rV .in supported in part by NTH, grant 2R01-.- CA50539-07. In addition, this work is performed under the tenure of an Established Investigatorship from the American Heart Association for Bruce H. Hasegawa and H. Roger Tang acknowledges support from a US Army Breast Cancer Research Program Postdoctoral Fellowship (DAMD17-98-1- 8192). Finally, the authors acknowledge a significant equipment grant from GE Medical Systems that made this research study possible.
VII. REFERENCES
[1] E. V. Garcia, K. Van Train, J. Maddahi, F. Prigent, J. Friedman, J. Areeda, A. Waxman, and D. S. Berman, "Quantification of rotational thallium-201 myocardial tomography," J. Nucl. Med., vol. 26, pp. 17-26,1985.
[2] R. E. Patterson, S. F. Horowitz, and R. L. Eisner, "Comparison of modalities to diagnose coronary
artery disease," Semin. Nucl. Med., vol. 24, pp. 286- 310,1994.
[3] W. Martin, A. C. Tweddel, and I. Hutton, "Balanced triple-vessel disease: Enhanced detection by estimated myocardial thallium uptake," Nucl. Med. Commun., vol. 13, pp. 149-153, 1992.
[4] R. J. Jaszczak, R. E. Coleman, and F. R. Whitehead, "Physical factors affecting quantitative measurements using camera-based single photon emission computed tomography (SPECT)," IEEE Trans. Nucl. Sei., vol. 28, pp. 69-80,1981.
[5] K. Kalki, S. C. Blankespoor, J. K. Brown, B. H. Hasegawa, M. W. Dae, M. Chin, and C. Stillson, "Myocardial perfusion imaging with a combined x- ray CT and SPECT system," J. Nucl. Med., vol. 38, pp, 1535-1540, 1997.
[6] S. C. Blankespoor, X. Wu, K. Kalki, J. K. Brown, H. R. Tang, C. E. Cann, and B. H. Hasegawa, "Attenuation correction of SPECT using x-ray CT on an emission-transmission CT system: Myocardial perfusion assessment," IEEE Trans. Nucl. Sei., vol. 43, pp. 2263-2274,1996.
[7] A. J. Da Silva, H. R. Tang, M. C. Wu, and B. H. Hasegawa, "Absolute quantitation of myocardial activity in phantoms," IEEE Trans. Nucl. Sei., vol. 46, pp. 659-666, 1999.
[8] M. L. Bartlett, S. L. Bacharach, L. M. Voipio-Pulkki, and V. Dilsizian, "Artifactual inhomogeneities in myocardial PET and SPECT scans in normal subjects,"/. Nucl. Med., vol. 36,pp. 188-195, 1995.
[9] J. R. Gait, E. V. Garcia, and W. L. Robbins, "Effects of myocardial wall thickness on SPECT quantification," IEEE Trans. Med. Imag., vol. 9, pp. 144-150, 1990.
[10] M. Clausen, A. N. Bice, A. C. Civelek, G. M. Hutchins, and H. N. J. Wagner, "Circumferential wall thickness measurements of the human left ventricle: Reference data for thallium-201 single-photon emission computed tomography," Am. J. Cardiol, vol. 58, pp. 827-831,1986.
[1*1] ' E. J: Hüffiuäii, Sv'v.. 'llUSL,t;. ....u ■;.;. E." ".-hclpi, "Quantitation in positron emission computed tomography: 1. Effect of object size," J. Comput. Assist. Tomogr., vol. 3, pp. 299-308,1979.
[12] R. M. Kessler, J. R. Ellis, and M. Eden, "Analysis of emission tomographic scan data: Limitations imposed by resolution and background," J. Comput. Assist. Tomogr., vol. 8, pp. 514-522, 1984.
[13] H. W. Müller-Gärtner, J. M. Links, J. L. Prince, R. N. Bryan, E. McVeigh, J. P. Leal, C. Davatzikos, and J. J. Frost, "Measurement of radiotracer concentration in brain gray matter using positron emission tomography: MRI-based correction for partial volume effects," J. Cereb. Blood Flow Metab., vol. 12, pp. 571-583,1992.
[14] C. C. Meltzer, J. K. Zubieta, J. M. Links, P. Brakeman, M. J. Stumpf, and J. J. Frost, "MR-based correction of brain PET measurements for heterogeneous gray matter radioactivity distribution,"

J. Cereb. Blood Flow Metab., vol. 16, pp. 650-658, 1996.
[15] J. M. Links, J. K. Zubieta, C. C. Meltzer, M. J. Stumpf, and J. J. Frost, "Influence of spatially heterogeneous background activity on "hot object" [20] quantitation in brain emission computed tomography," J. Comput. Assist. Tomogr., vol. 20, pp. 680-687,1996.
[16] O. G. Rousset, Y. Ma, and A. C. Evans, "Correction for partial volume effects in PET: Principle and validation," J. Nucl. Med., vol. 39, pp. 904-911, 1998. [21]
[17] S. C. Blankespoor, B. H. Hasegawa, J. K. Brown, J. A. Heanue, R. G. Gould, and C. E. Cann, "Development of an emission-transmission CT [22] system combining x-ray CT and SPECT," Conf. Rec. IEEE Nucl. Sei. Symp. Med. Imag. Conf, vol. 4, pp. 1758-1761, 1995.
[18] K. J. LaCroix, B. M. W. Tsui, B. H. Hasegawa, and J. K. Brown, "Investigation of the use of x-ray CT [23] images for attenuation in SPECT," IEEE Trans. Nucl. Sei., vol. 41, pp. 2793-2799,1994.
[19] B. H. Hasegawa, T. F. Lang, J. K. Brown, E. L. Gingold, S. M. Reilly, S. C. Blankespoor, S. C. Liew,
B. M. W. Tsui, and C. Ramanathan, "Object-specific attenuation correction of SPECT with correlated dual-energy x-ray CT," IEEE Trans. Nucl. Sei., vol. 40, pp. 1242-1252,1993. H. R. Tang, J. K. Brown, A. J. Da Silva, K. K. Matthay, D. C. Price, J. P. Huberty, R. A. Hawkins, and B. H. Hasegawa, "Implementation of a combined x-ray CT-scintillation camera imaging system for localizing and measuring radionuclide uptake: Experiments in phantoms and patients," IEEE Trans. Nucl. Sei., vol. 46, pp. 551-557,1999. L. A. Shepp and Y. Vardi, "Maximum likelihood reconstruction for emission tomography," IEEE Trans. Med. Imag, vol. 1, pp. 113-122,1982. G. Munch, J. Neverve, I. Matsunari, G. Schröter, and M< Schwaiger, "Myocardial technetium-99m- tetrofosmin and technetium-99m-sestamibi kinetics in normal subjects and patients with coronary artery disease,"/. Nucl. Med., vol. 38,pp. 428-432, 1997. H. R. Tang, A. J. Da Silva, and B. H. Hasegawa, "The relative impact of scatter on absolute myocardial perfusion quantitation: an EGS4 monte carlo study," Conf. Rec. IEEE Nucl. Set. Symp. Med. Imag. Conf, 1999.
IMPROVED QUANTITATIVE IMAGING FOR mIn-PROSTASCINT® USING CT/SPECT AND DUAL-ENERGY RECONSTRUCTION
K. H. Wong, H. R. Tang, A. J. Da Silva, M. C. Wu, K. Iwata, and B. H. Hasegawa University of California, San Francisco
Presented at the 47th Annual Meeting of the Society of Nuclear Medicine St. Louis, Missouri
June 3-7, 2000 {Journal of Nuclear Medicine 41:18P, 2000)
Objectives: We have developed and tested new iterative reconstruction techniques for the UCSF CT/SPECT system that enhance the quantitative accuracy of niIn-ProstaScint® imaging. Methods: We use high-resolution CT scans to correct for attenuation, and calibration measurements to correct for collimator resolution loss and energy-dependent efficiency. Because niIn emits photons at both 171 and 245 keV, our reconstruction also fully models its dual-energy emissions, using either (1) separate energy windows and attenuation maps or (2) a combined energy window and an 'effective attenuation map', which accounts for the preferential attenuation of the 171 keV photons. We have tested these reconstruction algorithms in phantom studies, using a 20 cm diameter cylindrical tank containing spheres (38-18 mm diameter) representing tumors, with a tumonbackground activity ratio of 8:1. The tank also contained 99mTc to simulate the blood-pool imaging used in ulIn-ProstaScint® scans. We acquired SPECT projections using energy windows at 140, 171, and 245 keV. CT slices of the phantom were acquired, registered to SPECT data, and scaled to produce attenuation maps. We then reconstructed the SPECT data using the new dual-energy methods, filtered backprojection, and a conventional ML- EM code with no dual-energy capabilities; quantitative accuracy was determined by measuring the activity in the spheres and comparing against their known activity. Results: The dual-energy methods produced the least error (11%), followed by conventional ML-EM (48%) and filtered backprojection (>100%). Furthermore, the combined window method produced results within 10% of the separate window method, while requiring roughly 50% less reconstruction time. Conclusion: Our new dual-energy methods can significantly improve quantitation of niIn-ProstaScint® images.

SCATTER CORRECTION FOR DUAL-ISOTOPE IMAGING
A. J. Da Silva, H. R. Tang, and B. H. Hasegawa University of California at San Francisco
Presented at the 47th Annual Meeting of the Society of Nuclear Medicine St. Louis, Missouri
June 3-7, 2000 (Journal of Nuclear Medicine 41:134P, 2000)
Objective: Simultaneous dual-isotope imaging of myocardial perfusion is severely limited by down scatter of the higher energy photons into the lower energy window. We have implemented a scatter correction method that may overcome this difficulty. Methods: The scatter estimation method calculates the expected scatter projection data from an effective scatter source distribution. The effective scatter distribution is approximated by convolving the primary source distribution with a point-spread function that is pre-calculated (by Monte Carlo methods) from a point source in an infinite water medium. The method was tested using an anthropomorphic torso phantom with a tillable defect in the wall of the cardiac insert. The defect and the myocardial wall were filled with a uniform concentration of Tc-99m while a known concentration of Tl-201 was added only to the myocardial wall to simulate a stress-induced defect in the Tl image. Tl-201 and Tc-99m were also added to the hepatic compartment of the phantom in concentrations typically found in clinical myocardial perfusion studies. The scatter-corrected Tc image was used to estimate the down scatter into the Tl data. Results: A short axis slice of the Tl image (with defect) is shown in the figure. The left image is prior to scatter correction while the central image is after scatter correction. For comparison, the image on the right is that obtained without Tc-99m in the phantom. Conclusions: We have implemented a scatter correction method that improves defect contrast and may allow for simultaneous dual-isotope imaging.