TARARA, DANIEL THOMAS, Ed.D. A Preliminary Clinical ...
169
TARARA, DANIEL THOMAS, Ed.D. A Preliminary Clinical Prediction Model for Upper-Extremity Injury in Collegiate Baseball: A Single-Center Retrospective Study (2013) Directed by Dr. Randy Schmitz. 159 pp. Context: Evidence-based practice (EBP) has become a point of emphasis in athletic training education and clinical practice. One approach to EBP is utilizing clinical prediction models (CPM) to assist clinicians in the screening, diagnosis, prognosis, and treatment of injury. A number of isolated risk factors, which can be categorized as: (a) self-report outcome scores, (b) sport performance factors, or (c) functional performance measures (FPMs), have been identified and suggested to be causal with regard to upper- extremity (UE) sports related injury (SRI) in baseball athletes. Objective: to develop a preliminary CPM for UE SRI derived from multiple factors specific to self-reported outcome measures, sport performance risk factors, and FPMs. Design: Retrospective cohort study. Setting: National Collegiate Athletic Association Division I baseball program. Subjects: Thirty-six athletes who completed the preseason pre-participation examination, the Kerlan-Jobe Orthopaedic Clinic overhead athlete shoulder and elbow score (KJOC-SES,) and the Targeted Enhanced Athletic Movement Screen (TEAM-S). Main Outcome Measures: Independent variables for this study included the self-reported outcome measures (KJOC-SES), sport performance risk factors, and FPMs (TEAM-S). The dependent variable for this study was self-reported history of UE SRI. Results: Univariate analyses identified nine predictor variables that differed between injured and non-injured athletes (p ≤ 0.10): KJOC-SES, playing position (pitcher), single leg squat stride foot, single leg squat balance foot, shoulder mobility test throwing arm, shoulder
Transcript of TARARA, DANIEL THOMAS, Ed.D. A Preliminary Clinical ...

TARARA, DANIEL THOMAS, Ed.D. A Preliminary Clinical Prediction Model for
Upper-Extremity Injury in Collegiate Baseball: A Single-Center Retrospective Study
(2013)
Directed by Dr. Randy Schmitz. 159 pp.
Context: Evidence-based practice (EBP) has become a point of emphasis in
athletic training education and clinical practice. One approach to EBP is utilizing clinical
prediction models (CPM) to assist clinicians in the screening, diagnosis, prognosis, and
treatment of injury. A number of isolated risk factors, which can be categorized as: (a)
self-report outcome scores, (b) sport performance factors, or (c) functional performance
measures (FPMs), have been identified and suggested to be causal with regard to upper-
extremity (UE) sports related injury (SRI) in baseball athletes. Objective: to develop a
preliminary CPM for UE SRI derived from multiple factors specific to self-reported
outcome measures, sport performance risk factors, and FPMs. Design: Retrospective
cohort study. Setting: National Collegiate Athletic Association Division I baseball
program. Subjects: Thirty-six athletes who completed the preseason pre-participation
examination, the Kerlan-Jobe Orthopaedic Clinic overhead athlete shoulder and elbow
score (KJOC-SES,) and the Targeted Enhanced Athletic Movement Screen (TEAM-S).
Main Outcome Measures: Independent variables for this study included the self-reported
outcome measures (KJOC-SES), sport performance risk factors, and FPMs (TEAM-S).
The dependent variable for this study was self-reported history of UE SRI. Results:
Univariate analyses identified nine predictor variables that differed between injured and
non-injured athletes (p ≤ 0.10): KJOC-SES, playing position (pitcher), single leg squat
stride foot, single leg squat balance foot, shoulder mobility test throwing arm, shoulder

mobility test non-throwing arm, CKCUEST (TEAM-S score), and CKCUEST (absolute
score). Forward step-wise logistic regression yielded a resultant two-factor clinical
prediction model consisting of playing position and KJOC-SES. The two-factor CPM
based on KJOC-SES scores ≤ 86 and playing position (pitcher) yielded diagnostic utility
measures as follows: Sensitivity of 83% (95% CI: 0.55 to 95); Specificity of 95% (95%
CI: 79 to 99); Positive likelihood ratio of 22.0 (95% CI: 2.88 to 138.5); and negative
likelihood ratio of 0.17 (95% CI: 0.04 to 0.61). Conclusion: A preliminary two-factor
CPM comprised of KJOC-SES (≤ 86) and playing position (pitcher) retrospectively
predicted UE SRI in a cohort of baseball players with strong diagnostic utility.

A PRELIMINARY CLINICAL PREDICTION MODEL FOR UPPER-EXTREMITY
INJURY IN COLLEGIATE BASEBALL: A SINGLE-CENTER
RETROSPECTIVE STUDY
By
Daniel Thomas Tarara
A Dissertation Submitted to
the Faculty at The Graduate School at
The University of North Carolina at Greensboro
in Partial Fulfillment
of the Requirements for the Degree
Doctor of Education
Greensboro
2013
Approved by
__________________________________
Committee Chair

ii
APPROVAL PAGE
This dissertation written by Daniel Thomas Tarara has been approved by the
following committee of the Faculty of The Graduate School at The University of North
Carolina at Greensboro.
Committee Chair __________________________________
Dr. Randy Schmitz
Committee Members __________________________________
Dr. William Karper
_________________________________
Dr. Jolene Henning
_________________________________
Dr. Aaron Terranova
____________________________
Date of Acceptance by Committee
_________________________
Date of Final Oral Examination

iii
ACKNOWLEDGEMENTS
I am indebted to so many people for offering support and guidance throughout
this journey. Words cannot fully express my gratitude for all you have done for me
personally and professionally. It would not have been possible to complete my doctoral
work without you. I would like to specifically mention several people who have been
instrumental in helping me achieve this goal.
First and foremost, I would like to thank my wife Rosie for her unwavering
sacrifice throughout the past eight years. Life-balance would not have been possible
without her unconditional love and patience. Her support has kept me grounded through
the peaks and valleys.
I would like to thank Dr. Randy Schmitz, committee chair, for supporting my
graduate work and guided me throughout the dissertation process.
I would like to thank my committee members, Dr. William Karper, Dr. Jolene
Henning, and Dr. Aaron Terranova, for their support and encouragement.
I would also like to thank my High Point University colleagues Dr. Dennis
Carroll, Dr. Carole Stoneking, Dr. Daniel Erb, Dr. Eric Hegedus, Dr. Tony Kemerly, Dr.
Alexis Wright and Dr. Kevin Ford for your support, guidance and friendship.
Finally, I would like to thank all the students that I have had the privilege of
teaching over the years. You inspire me to be a lifelong learner.

iv
TABLE OF CONTENTS
Page
LIST OF TABLES ............................................................................................................. vi
LIST OF FIGURES ......................................................................................................... viii
CHAPTER
I. INTRODUCTION .................................................................................................1
Objectives and Hypotheses ..........................................................................7
Objective ..........................................................................................7
Specific Aim One .............................................................................7
Specific Aim Two ............................................................................8
Operational Definitions ................................................................................8
Limitations and Assumptions ....................................................................10
Delimitations ..............................................................................................10
II. REVIEW OF LITURATURE ..............................................................................11
Evidence-Based Practice ............................................................................11
Clinical Prediction Models ........................................................................22
Predictive Factors of a Preliminary CPM ..................................................27
Self-Reported Outcome Measures .................................................29
Sport Performance Risk Factors ....................................................34
Functional Performance Measures .................................................40
Baseball UE SRI Epidemiology.................................................................48
Conclusion .................................................................................................50
III. METHODOLOGY ..............................................................................................51
Participants .................................................................................................51
Instrumentation ..........................................................................................52
Self-Reported Outcome Measures .................................................53
Sport Performance Risk Factors ....................................................54
Functional Performance Measures .................................................55
Approach for Specific Aim One ................................................................59
Approach for Specific Aim Two................................................................60
Variables ....................................................................................................60
Statistical Analyses ....................................................................................60
v
IV. RESULTS ............................................................................................................63
Participants .................................................................................................63
Self-Reported Outcome Measures .............................................................64
Sport Performance Risk Factors ................................................................64
Functional Performance Measures .............................................................65
Clinical Prediction Model ..........................................................................74
V. DISCUSSION ......................................................................................................79
Specific Aim One .......................................................................................80
Self-Reported Outcome Measures .................................................80
Sport Performance Risk Factors ....................................................85
Functional Performance Measures .................................................89
Single Leg Squat ................................................................90
Shoulder Mobility Test ......................................................92
CKCUEST .........................................................................94
Specific Aim Two ......................................................................................95
Clinical Prediction Model ..............................................................96
Clinical Application .................................................................................101
Limitations ...............................................................................................104
Recommendations for Future Research ...................................................108
Conclusion ...............................................................................................111
REFERENCES ................................................................................................................112
APPENDIX A. KERLAN-JOBE ORTHOPAEDIC CLINIC SHOULDER &
ELBOW SCORE (KJOC-SES)..........................................................131
APPENDIX B. TARGETED ENHANCED ATHLETIC MOVEMENT
SCREEN (TEAM-S) ..........................................................................135
APPENDIX C. HIGH POINT UNIVERSITY INSTITUTUTIONAL REVIEW
BOARD PROTOCOL APPROVAL .................................................153
APPENDIX D. INFORMED CONSENT FORM ...........................................................155
APPENDIX E. RECEIVER OPERATOR CHARACTERISTIC (ROC)
CURVES ............................................................................................158

vi
LIST OF TABLES
Page
Table 1. 2x2 Contingency Table for Diagnostic Test Results .............................................8
Table 2. Likelihood Ratio Interpretation Guide .................................................................17
Table 3. Methodological Approaches for CPM Validation ...............................................25
Table 4. Hierarchy of Evidence for CPMs.........................................................................25
Table 5. Common Self-Reported Shoulder Outcome Measures ........................................30
Table 6. Classification Hierarchy for the Assessment of Function in Individuals ............41
Table 7. Comparison of Functional Performance Screening Batteries ..............................43
Table 8. TEAM-S Functional Performance Measures Including Assessment
Level and Previously Reported Reliability ......................................................47
Table 9. Independent Variables for CPM Development: Self-Report Measures
and Sports Performance Risk Factors ..............................................................54
Table 10. Functional Performance Measures: TEAM-S Item Scoring Criteria .................56
Table 11. Independent Variables for CPM Development: Functional Performance
Measure Risk Factors .....................................................................................58
Table 12. Self-Reported UE SRI .......................................................................................64
Table 13. Descriptive Data for Self-Reported Measures and Sport Performance
Risk Factors ..................................................................................................65
Table 14. Descriptive Data for TEAM-S Individual Items and Total Score .....................67
Table 15. 2x2 Contingency Table for KJOC-SES Score ...................................................69
Table 16. 2x2 Contingency Table for CKCUEST Absolute Score ...................................70
Table 17. 2x2 Contingency Table for Playing Position .....................................................70
Table 18. 2x2 Contingency Table for Single Leg Squat - TEAM-S Score .......................71

vii
Table 19. 2x2 Contingency Table for Single Leg Squat Stride Foot .................................71
Table 20. 2x2 Contingency Table for Single Leg Squat Balance Foot .............................71
Table 21. 2x2 Contingency Table for Shoulder Mobility Test Throwing Arm .................71
Table 22. 2x2 Contingency Table for Shoulder Mobility Test Non-Throwing Arm .........72
Table 23. 2x2 Contingency Table for CKCUEST - TEAM-S Score .................................72
Table 24. Diagnostic Utility Values of Significant Predictors Variables ..........................73
Table 25. Correlational Matrix for Predictor Variables .....................................................75
Table 26. Logistic Regression Prediction of UE SRI ........................................................76
Table 27. 2x2 Contingency Table for Two-Factor Statistical Model ................................77
Table 28. Diagnostic Utility Values of Two-Factor Models .............................................77
Table 29. 2x2 Contingency Table for Two-Factor CPM ...................................................78
Table 30. Summary of Reported KJOC-SES Values.........................................................81
Table 31. Diagnostic Utility of CPMs. ............................................................................100

viii
LIST OF FIGURES
Page
Figure 1. Likelihood Ratio Scale of Clinical Importance ..................................................16
Figure 2. Fagan’s Nomogram ............................................................................................19
Figure 3. Typical Receiver Operating Characteristic (ROC) Curve ..................................20
Figure 4. Fagan’s Nomogram for KJOC-SES ≤ 86 ...........................................................84
Figure 5. Fagan’s Nomogram for Playing Position ...........................................................87
Figure 6. Fagan’s Nomogram for Two-Factor CPM .........................................................98

1
CHAPTER I
INTRODUCTION
The concepts of evidence-based practice (EBP) have recently become a point of
emphasis in athletic training clinical practice (BOC, 2010; NATA, 2010). Coinciding
with this, educational reform in entry-level athletic training education has established
competencies related to the development of EBP knowledge and skills (NATA, 2011).
Although EBP may seem new within athletic training professional practice and
education, the concepts have been well established in other healthcare professions for
over 25 years (AMA, 2002; Guyatt, Rennie, Meade, & Cook, 2008; Sackett, Straus,
Richardson, Rosenberg, & Haynes, 1997). The lag in athletic training’s alignment with
EBP was formally recognized in 2004 (Hootman, 2004). Initiatives by the National
Athletic Trainers’ Association (NATA) and Board of Certification (BOC) have raised
awareness of the importance of EBP; however, advances in evidence–based (EB) clinical
research are still lacking in the field.
One approach to EB clinical research relates to the development of clinical
prediction models (CPMs). CPMs are statistical models used to estimate probability
related to screening, diagnosis, prognosis, or treatment interventions (Aronoff et al.,
2010; Banks, Gilmartin, & Fink, 2010; Hicks, Fritz, Delitto, & McGill, 2005; Jewell,
2011; Steyerberg, 2010). A combination of factors relating to patient history,
pathophysiology, symptomology, risk factors, test results, functional performance

2
measures (FPMs), and subjective outcome measures can be clustered to aid in clinical
decision-making (Bainbridge, Nasmith, Orchard, & Wood, 2010; Banks et al., 2010).
This approach is a departure from an overreliance on single factors or heuristics for
clinical decision making (Bainbridge et al., 2010). CPMs can subsequently be an
important tool for enhancing clinical practice (Atiya, 2002) and provide clinicians with
the ability to gain clarity when confronted with uncertain or complex patient cases
(Bainbridge et al., 2010). The utilization of CPMs is predicated on combining existing
evidence, patient preference, and clinical expertise to reach an informed clinical decision
(Glynn & Weisbach, 2011), which in turn are the foundational components of EBP
(Guyatt et al., 2008; Jewell, 2011; Sackett et al., 1997).
CPMs should be considered an effective method of improving patient-oriented
health care (Haworth, Hopkins, Ells, Ackroyd, & Mowat, 1981). This approach is in
contrast to traditional biomedical research models (Portney & Watkins, 2009), which
emphasize a causal or linear relationship between pathology and subsequent impairments
(Portney & Watkins, 2009). Although the two strategies may seem parallel, the
biomedical research strategy does not commonly account for the psychosocial
dimensions of how a patient is affected by injury or illness. This is most evident in
biomedical injury prevention paradigms which center largely on etiology, internal and
external risk factors, incident rates, and categorization of mechanisms (Bahr &
Krosshaug, 2005; Chalmers, 2002; Van Tiggelen, Wickes, Stevens, Roosen, &
Witvrouw, 2008). Although there is a strong relationship between the biomedical model
and sports related injury (SRI) epidemiology, the model often fails to include the self-

3
reported outcome measures in approaching diagnostic, prognostic, and treatment
strategies (Finch, Gabbe, et al., 2011; Finch, Ullah, & McIntosh, 2011). This indicates a
need for patient-centered research models (Hawk, Long, & Boulanger, 1998; Sauers &
Snyder, 2011) that advance clinical practice (Snyder et al., 2008; Valovich McLeod et al.,
2008).
Self-reported measures for determining functional disability in clinical research
have received recent consideration (Cosby & Hertel, 2011; Evans & Lam, 2011;
Mattacola, 2011; Michener, 2011; Parsons & Snyder, 2011). Specific to the current
investigation, self-reported outcome measures have served as a tool for quantifying
functional disability in upper-extremity (UE) athletes (Alberta et al., 2010; Domb et al.,
2010; Neuman et al., 2011; Sauers, Dykstra, Bay, Bliven, & Snyder, 2011; Thigpen &
Shanley, 2011). Development and validation of these self-reported outcome measures
have been important initial steps in quantifying injury risk stratification and treatment
outcomes (Alberta et al., 2010; Thigpen & Shanley, 2011). Qualifying functional status
through outcome measurement scales represents a departure from relying on return-to-
play (RTP) as a benchmark for successful treatment outcomes in high functioning athletic
populations (Conway, Jobe, Glousman, & Pink, 1992). Although RTP is a common
term, a standardized definition has not emerged in literature. This can contribute to
confusion and disagreement between clinicians as to what criteria best define a successful
treatment outcome (Creighton, Shrier, Shultz, Meeuwisse, & Matheson, 2010). Specific
to overhand-throwing athletes, qualifying successful treatment outcomes have been
problematic because RTP is not sensitive in determining functional status (Alberta et al.,

4
2010). Such problems are highlighted by reports of professional baseball players who
RTP but still present with functional limitations: e.g., pain, weakness, instability, loss of
power, altered mechanics, and loss of pitch control (Domb et al., 2010; Neuman et al.,
2011). Subsequently, the inclusion of self-reported outcome measures should be an
important component of developing a CPM.
Baseball is a popular international sport and is played on youth, high school,
college, and professional levels. The epidemiology of SRI in baseball has been widely
reported (Dick et al., 2007; Hootman, Dick, & Agel, 2007; Janda, 2003; Kerut, Kerut,
Fleisig, & Andrews, 2008; Lyman & Fleisig, 2005; Magra, Caine, & Maffulli, 2007;
McFarland & Wasik, 1998; Posner, Cameron, Wolf, Belmont, & Owens, 2011).
Baseball, in comparison to other sports, has a relatively low overall injury rate of 0.23 per
1,000 athlete exposures (Hootman et al., 2007). However, the rate of UE SRI for
baseball players increases in relationship to competitive level with a reported 5% in little
league and high school (Fleisig et al., 2010), 25% in collegiate (Dick et al., 2007), and
50% in professional (Anz et al., 2010). Over the past decade there has been a
disproportionate rise in UE SRI necessitating surgery (Petty, Andrews, Fleisig, & Cain,
2004). This trend had been described as an injury epidemic (Fleisig, 2012) and has led to
a call for further clarification in understanding the relationship between risk factors and
injury (McHugh et al., 2012). Within this population, clarifying the relationship between
risk factors and UE SRI is complex because most athletes who sustain injury present with
multiple risk factors (Petty et al., 2004). In this respect a CPM specific to UE SRI in
baseball would be beneficial in advancing the body of knowledge in this area.

5
A number of intrinsic risk factors have been identified and suggested to be causal
to UE SRI in baseball athletes. These risk factors include: muscle strength deficits
(Brown, Niehues, Harrah, Yavorsky, & Hirshman, 1988; Yildiz et al., 2006), muscle
fatigue (Mullaney, McHugh, Donofrio, & Nicholas, 2005); internal and external strength
imbalance (Lewis & Valentine, 2007); glenohumeral internal rotation deficient (GIRD)
(Borsa, Dover, Wilk, & Reinold, 2006; Dines, Frank, Akerman, & Yocum, 2009; Wilk et
al., 2010); scapula dyskinesis (Cooper, Donley, Verna, & Morgan, 2002; Kibler &
McMullen, 2003); maximum pitch velocity (Bushnell, Anz, Noonan, Torry, & Hawkins,
2010); pitching volume (Fleisig et al., 2010; Olsen, Fleisig, Dun, Loftice, & Andrews,
2006); pitch type (e.g., slider , curveball) (Escamilla, Fleisig, Barrentine, Zheng, &
Andrews, 1998; Fleisig et al., 2010; Fleisig et al., 2006); playing position (Fleisig et al.,
2010; Olsen et al., 2006); throwing biomechanics (Fleisig, Andrews, Dillman, &
Escamilla, 1995; Fleisig, Barrentine, Escamilla, & Andrews, 1996); and low self-reported
functional assessment measures (Alberta et al., 2010; Domb et al., 2010; Neuman et al.,
2011). These risk factors can be categorized into three areas: (a) self-report outcome
measures, (b) sport performance risk factors, and (c) FPMs. Despite making progress in
identifying individual injury risk factors, a single multifactorial injury prediction model
that accounts for these three risk factor categories has not been presented in literature.
The studies that have identified a broad range of injury risk factors relating to UE
SRI in baseball have been largely descriptive (Fleisig et al., 2010; Mueller, Marshall, &
Kirby, 2001; Olsen et al., 2006). Corresponding analyses have been dominated by
traditional statistics (e.g. correlations, descriptive distributions) verses Bayesian inference

6
(e.g. sensitivity, specificity, likelihood ratios). A Bayesian approach provides an
advantage in establishing inference based on observed data (Wagenmakers, Lee,
Lodewyckx, & Iverson, 2008) and can be applied clinically to improve diagnostic and
prognostic decision-making (Guyatt et al., 2008). The utilization of Bayesian statistics in
establishing a CPM may be an important step in identifying a set of factors specific to UE
SRI in college baseball players to assist in diagnostic and prognostic decision-making.
Additionally, such a CPM may be clinically beneficial in identifying low- or high-risk
athletes for injury prevention programs based on evidence. To date, we have been unable
to locate any CPMs specific to UE SRI in colligate baseball athletes.
Although a number of baseball-specific risk factors have been independently
described (Fleisig et al., 2010; Hootman et al., 2007; Olsen et al., 2006; Wilk et al.,
2010), a multifactorial model has not been developed to aid in the clinical diagnosis of
UE SRI. The collective inclusion of self-reported outcome measures (Domb et al., 2010;
Neuman et al., 2011; Thigpen & Shanley, 2011), sport performance risk factors (Fleisig
et al., 2010; Olsen et al., 2006), and FPMs (G. Cook, Burton, & Hoogenboom, 2006a,
2006b; G. Cook, Burton, Kiesel, Rose, & Bryant, 2010; Kiesel, Plisky, & Voight, 2007)
may be important in establishing a CPM specific to the baseball population.
As a decision-making tool, CPMs have potential to assist in diagnosis, prognosis,
and treatment strategies. This is particularly relevant in the context of complex patient
groups or injury patterns encountered in clinical practice. Collegiate baseball players are
one such specialized patient group and often present with complex UE injury patterns.
The diagnosis, prognosis, and treatment of UE SRI in collegiate baseball players are

7
complex. Consequently, there is a need to improve the decision-making process to assist
clinicians in improving patient outcomes. A CPM of UE SRI would be an important
advancement in assisting clinicians in navigating the complexities of this patient
population. Therefore, the purpose of this study was to develop a preliminary clinical
prediction model for UE SRI derived from multiple factors specific to self-reported
outcome measures, sport performance risk factors, and FPMs in a retrospective cohort of
collegiate baseball players, and to determine if the model is retrospectively predictive of
UE SRI.
Objectives and Hypotheses
Objective
To develop and assess a preliminary CPM for UE SRI in a retrospective cohort of
collegiate baseball players.
Specific Aim One
Identify individual factors specific to self-reported outcome measures, sport
performance risk factors, and FPMs that differ between previously injured and uninjured
cohorts. Secondarily to this, through the construction of 2x2 contingency tables we will
determine the diagnostic utility (as measured by sensitivity, specificity, positive
likelihood ratio, and negative likelihood ratio) of individual factors that significantly
differ between injured and uninjured cohorts. We hypothesized that multiple individual
factors will be statistically significant in retrospectively predicting UE SRI in a cohort of
college baseball players.

8
Specific Aim Two
Determine whether the individual factors identified in Specific Aim One
collectively can retrospectively predict injury status. We hypothesized that a multivariate
CPM will retrospectively predict UE SRI in a cohort of college baseball players with a
greater degree of diagnostic utility than individual factor diagnostic utility measures.
Operational Definitions
1. The two-by-two (2x2) contingency table used for calculating diagnostic utility values
is listed in Table 1.
Table 1. 2x2 Contingency Table for Diagnostic Test Results
Reference Standard /
Target Condition
Positive Negative Total
Diagnostic Test /
Clinical Measure /
Risk Factor
Positive a
(True positive)
b
(False positive) a + b
Negative c
(False negative)
d
(True negative) c + d
Total a + c b + d N
Note. Adapted from Portney & Watkins (2009), and Sackett et al. (1997)
2. Sensitivity: The proportion of subjects with the target condition who will have a
positive test result (Guyatt et al., 2008; Sackett et al., 1997; Wagenmakers et al., 2008).
Sensitivity = (a/(a + c) (Portney & Watkins, 2009).
3. Specificity: The proportion of subjects without the target condition who will have a
negative test result (Guyatt et al., 2008; Sackett et al., 1997; Wagenmakers et al., 2008).
Specificity = (d/(b + d) (Portney & Watkins, 2009).

9
4. Positive Likelihood Ratio (LR+): The probability of a subject with the target condition
having a positive test result divided by the probability of an individual without the target
condition having a positive test result (Akobeng, 2005). LR+ = sensitivity/(1 –
specificity) (Portney & Watkins, 2009).
5. Negative Likelihood Ratio (LR-): The probability of a subject with the target
condition having a negative test result divided by the probability of an individual without
the target condition having a negative test result (Akobeng, 2005). LR- = (1 –
specificity)/specificity (Portney & Watkins, 2009).
6. Diagnostic Odds Ratio (DOR): An index which summarizes a test’s accuracy as a
single number that expresses how many times greater the odds are of finding a positive
test result in an injured versus a non-injured person. DOR = positive likelihood
ratio/negative likelihood ratio = (sensitivity x specificity)/(1- sensitivity) x
(1-specificity) (Glas, Lijmer, Prins, Bonsel, & Bossuyt, 2003; Macaskill, Gatsonis,
Deeks, Harbord, & Takwoingi, 2010).
7. Prevalence: The number of target conditions in proportion to the total sample size at a
given time. Prevalence = (a+c)/(a+b+c+d) (Portney & Watkins, 2009).
8. Pre-test Probability: The probability that a target condition exists prior to performing a
diagnostic test. Pre-test Probability is equal to the target condition’s prevalence (Portney
& Watkins, 2009).
9. Pre-test Odds: The odds that the patient has the target condition before a diagnostic
test is performed. Pre-test Odds = (pre-test probability)/(1 – pre-test probability)
(CEBM, 2012).

10
10. Post-test Odds: The odds that the patient has the target condition after a diagnostic
test is performed (pre-test odds x likelihood ratio) (CEBM, 2012).
11. Post-test Probability: The proportion of patients with a target condition after
performing a diagnostic test. Post-test Probability = (post-test odds)/(post-test odds +1)
(Portney & Watkins, 2009).
12. Diagnostic Utility: The discriminative potential of a diagnostic test to identify a
target condition based on measures of sensitivity, specificity, and likelihood ratios.
Limitations and Assumptions
1. All participants provided honest and accurate health and injury information.
2. All participants performed at their maximum effort during functional performance
testing.
3. The findings of this study are limited to the tested cohort.
4. Injury status was established from a self-reported history of injury question as part of
the KJOC-SES instrument. The reporting of a diagnosed injury to the shoulder or elbow
did not provide information about the time of sustaining an UE SRI.
Delimitations
1. The results of this dissertation are limited to the retrospectively tested cohort and
cannot be generalized to a broader population or other UE sports.

11
CHAPTER II
REVIEW OF LITURATURE
The purpose of this review is to provide supporting information and a framework
for a clinical prediction model (CPM) of upper-extremity (UE) sports related injury (SRI)
in college baseball players. This model will be developed and assessed by examining
select self-reported outcome measures, sport performance risk factors, and functional
performance measures (FPMs). This review of literature will encompass the following:
(a) evidence-based practice (EBP), (b) CPMs, (c) self-reported injury risk factors, (d)
sport performance injury risk factors, (e) functional performance injury risk factors, and
(f) UE SRI related to baseball.
Evidence-Based Practice
The EBP paradigm encapsulates a broad spectrum of topics related to the field of
medicine. A full review of the paradigm has been presented in a number of seminal
works (Guyatt et al., 2008; Sackett et al., 1997). EBP concepts recently have become a
point of emphasis in athletic training professional practice (BOC, 2010; NATA, 2010).
Coinciding with this, educational reform in entry-level athletic training education has
established competencies related to EBP knowledge and skills (NATA, 2011). Although
EBP may seem new within athletic training professional practice and education, the
concepts have been well established in other healthcare professions for over 25 years
(AMA, 2002; Guyatt et al., 2008; Sackett et al., 1997). The lag in athletic training’s use

12
of EBP was formally recognized in 2004 (Hootman, 2004). Initiatives by the National
Athletic Trainers’ Association (NATA) and Board of Certification (BOC) have raised
awareness of the importance of EBP; however, advances in evidence–based (EB) clinical
research are still lacking in the field. Specifically there is a need for EB research models
(Hawk et al., 1998; Sauers & Snyder, 2011) which advance patient–oriented clinical
practice (Snyder et al., 2008; Valovich McLeod et al., 2008).
With respect to this dissertation, primary importance lies in the EBP concepts
related to clinical measures and diagnostic test accuracy. The overlap between EBP
concepts and Bayesian statistical inference is central in approaching diagnostic questions
in the context of clinical practice (Hawkins, 2005). Specifically, two-by-two (2x2)
contingency tables provide the foundation for determining the statistical measures of
validity (Jewell, 2011; Portney & Watkins, 2009) and testing the significance for
categorical frequency (Norman & Streiner, 2008). See Table 1 for an example of a 2x2
contingency table for diagnostic test results.
Traditionally, 2x2 contingency tables are constructed based on a known reference
standard and a clinical diagnostic test (Norman & Streiner, 2008; Portney & Watkins,
2009). A reference standard is usually based on a “gold standard” in the context of the
presenting clinical question or target condition. In the absence of a gold standard,
Bayesian statistical models can also be constructed based on norm or criterion reference
variables (Jewell, 2011). A clear or true reference standard may not be obtainable in
approaching some clinical questions, in which case, dichotomous patient data may serve
as a reference criterion standard (e.g., “prior injury” versus “no prior injury”) (Portney &

13
Watkins, 2009). The clinical diagnostic test used in constructing a 2x2 contingency table
can encompass a broad range of procedures (e.g., orthopedic special tests, x-ray results,
lab work, etc.) but may include any variable with a statistical relationship to the target
condition. This allows for the inclusion of unique variables such as self-reported
outcome measures, sport performance risk factors, and FPMs as screening or clinical
diagnostic tools (Portney & Watkins, 2009).
A 2x2 contingency table provides a means of charting a diagnostic test’s four
possible outcomes: (a) true positive, (b) true negative, (c) false positive, and (d) false
negative (Portney & Watkins, 2009). A true positive test result occurs when a diagnostic
test correctly identifies the target condition. For a true negative, a diagnostic test
correctly rules out a target condition. A false positive occurs when a diagnostic test is
positive in the absence of the target condition. Finally, a false negative response is when
the clinical test is negative in the presence of the target condition. Once these values
have been tabulated, the validity of a diagnostic test can be expressed in terms of
sensitivity (Sn) and specificity (Sp) (Portney & Watkins, 2009).
Sn and Sp are measures of validity for diagnostic tests and are valuable decision-
making tools in EBP (Portney & Watkins, 2009). Sn is classically defined as the
proportion of patients with a positive test result among those with the target condition
(Guyatt et al., 2008; Sackett et al., 1997; Wagenmakers et al., 2008); Sn = (a/(a + c)
(Portney & Watkins, 2009). Sp is defined as the proportion of patients without the target
condition who will have a negative test result (Guyatt et al., 2008; Sackett et al., 1997;
Wagenmakers et al., 2008); Sp = (d/(b + d) (Portney & Watkins, 2009). More simply

14
stated, Sn is the true positive rate while Sp is the true negative rate (Portney & Watkins,
2009).
The clinical utility of Sn and Sp may be counterintuitive in clinical practice.
Diagnostic tests with high Sn are useful at identifying people with a target condition and
have a very low false negative rate (Jewell, 2011). Thus, a negative test result is
beneficial in ruling out the presence of the target disorder. By contrast, diagnostic tests
with high Sp are useful at identifying people without the target condition and yield very
low false positive rates (Jewell, 2011). Subsequently, a positive test result is beneficial in
ruling in the presence of the target disorder.
In addition to Sn and Sp, positive predictive value (PPV) and negative predictive
value (NPV) are measures of probability that are also derived from a 2x2 table (Akobeng,
2007a; Portney & Watkins, 2009). PPV is the proportion of people with a positive test
who have the target condition. PPV is considered the post-test probability of a target
condition given a positive test (Akobeng, 2007a). PPV = a/(a +b) (Portney & Watkins,
2009). NPV is the proportion of people with a negative test that do not have the target
condition; it is considered the post-test probability of not having the target condition
given a negative test (Akobeng, 2007a). NPV = d/(c +d) (Portney & Watkins, 2009).
PPV and NPV depend upon the prevalence of the target condition represented in the 2x2
contingency table data (Jewell, 2011; Portney & Watkins, 2009). Prevalence in the
context of a small sample size may not be a true reflection of the prevalence for a larger
population (Portney & Watkins, 2009). Consequently, prevalence may fluctuate
naturally over time because of the influence of prevention or treatment strategies (Jewell,
15
2011; Portney & Watkins, 2009). Because PPV and NPV vary with changes in
prevalence (Akobeng, 2007a), these measures are not considered useful for determining
diagnostic test validity in clinical practice (Jewell, 2011).
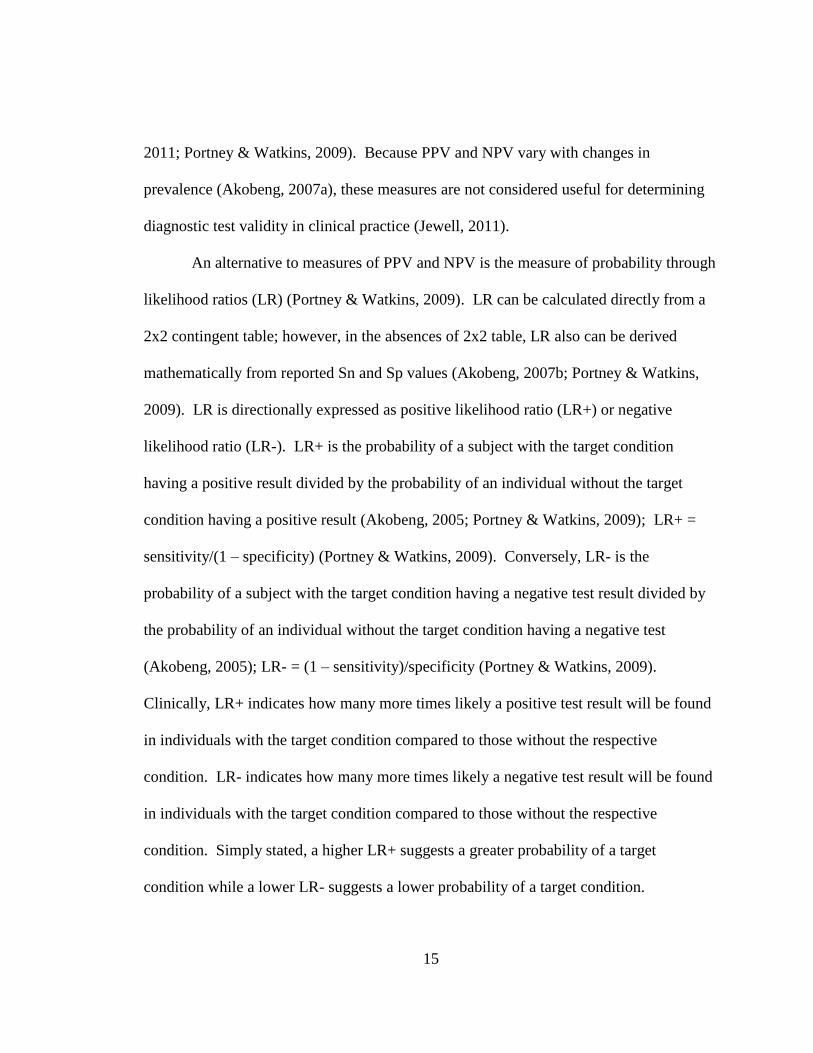
An alternative to measures of PPV and NPV is the measure of probability through
likelihood ratios (LR) (Portney & Watkins, 2009). LR can be calculated directly from a
2x2 contingent table; however, in the absences of 2x2 table, LR also can be derived
mathematically from reported Sn and Sp values (Akobeng, 2007b; Portney & Watkins,
2009). LR is directionally expressed as positive likelihood ratio (LR+) or negative
likelihood ratio (LR-). LR+ is the probability of a subject with the target condition
having a positive result divided by the probability of an individual without the target
condition having a positive result (Akobeng, 2005; Portney & Watkins, 2009); LR+ =
sensitivity/(1 – specificity) (Portney & Watkins, 2009). Conversely, LR- is the
probability of a subject with the target condition having a negative test result divided by
the probability of an individual without the target condition having a negative test
(Akobeng, 2005); LR- = (1 – sensitivity)/specificity (Portney & Watkins, 2009).
Clinically, LR+ indicates how many more times likely a positive test result will be found
in individuals with the target condition compared to those without the respective
condition. LR- indicates how many more times likely a negative test result will be found
in individuals with the target condition compared to those without the respective
condition. Simply stated, a higher LR+ suggests a greater probability of a target
condition while a lower LR- suggests a lower probability of a target condition.
16
LRs provide three distinct advantages over Sn, Sp, PPV, and NPV measures in
determining the probability of a target condition. First, LRs are independent of disease
prevalence (Akobeng, 2007b; Jewell, 2011; Portney & Watkins, 2009). Second, LRs can
be applied to individual patient cases whereas Sn, Sp, PPV, and NPV are group (data set)
specific (Jewell, 2011; Portney & Watkins, 2009). Third, LRs are relevant across the
spectrum of test results irrespective of a positive or negative finding (Jewell, 2011).
These three factors highlight the clinical utility of LRs in understanding and applying
diagnostic test results in clinical practice (Akobeng, 2007b).
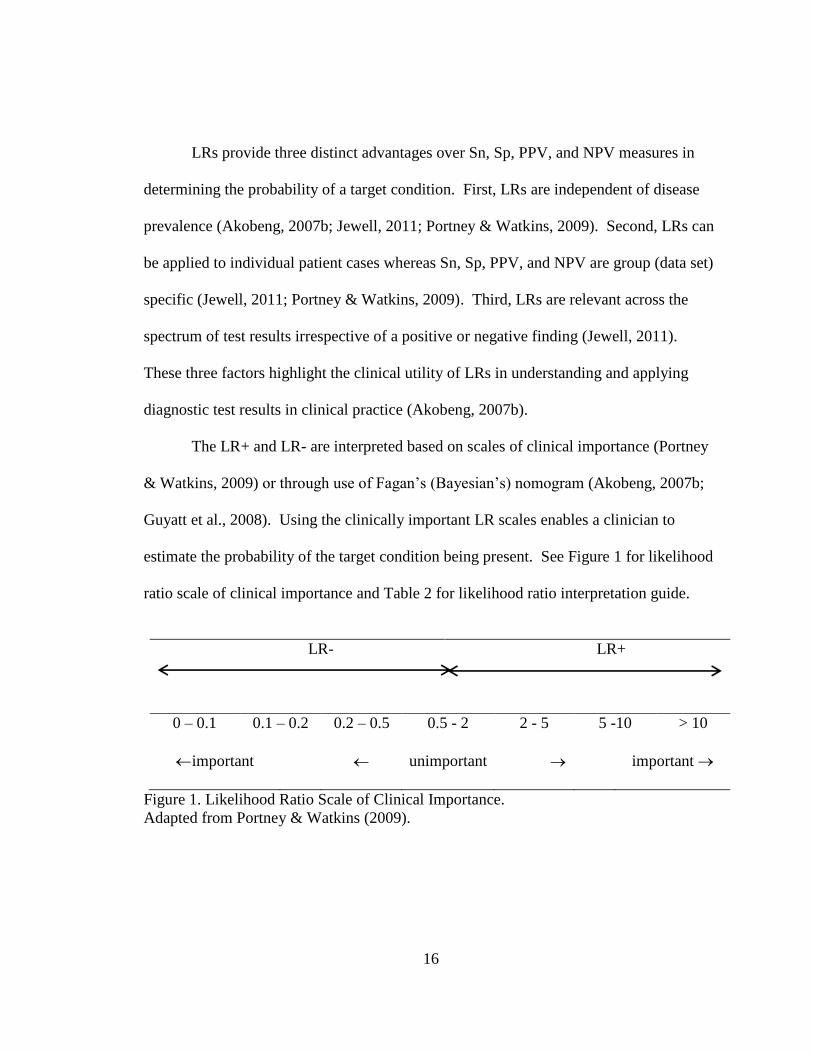
The LR+ and LR- are interpreted based on scales of clinical importance (Portney
& Watkins, 2009) or through use of Fagan’s (Bayesian’s) nomogram (Akobeng, 2007b;
Guyatt et al., 2008). Using the clinically important LR scales enables a clinician to
estimate the probability of the target condition being present. See Figure 1 for likelihood
ratio scale of clinical importance and Table 2 for likelihood ratio interpretation guide.
LR-
LR+
0 – 0.1 0.1 – 0.2 0.2 – 0.5 0.5 - 2 2 - 5 5 -10 > 10
important unimportant important
Figure 1. Likelihood Ratio Scale of Clinical Importance.
Adapted from Portney & Watkins (2009).

17
Table 2. Likelihood Ratio Interpretation Guide
LR- Shift in Probability LR+
< 0.1 large, conclusive > 10
0.1 to 0.2 moderate, important 5 to 10
0.5 to 0.2 small, but sometimes important 2 to 5
0.5 to 1 very small, clinically irrelevant 1 to 2
Note. Adapted from C. E. Cook & Hegedus (2013), Glynn & Weisbach (2011), and
Guyatt et al. (2008).
Probability estimation occurs pragmatically in the dynamic context of an
individual patient case. For example, after taking a patient history, a clinician begins to
formulate a preliminary working diagnosis. This hypothesized diagnosis can beformulate
a preliminary working diagnosis. This hypothesized diagnosis can be confirmed or
excluded through selective applications of diagnostic tests. Diagnostic test selection is
usually based on clinical estimation of the patient’s probability of having a target
condition before an actual test result is known (referred to as pre-test probability)
(Akobeng, 2007b). Pre-test probability of a target condition may be based on reported
prevalence in literature, preliminary clinical exam findings, or a “best guess” based on
clinical experience (heuristics) (Akobeng, 2007b; Portney & Watkins, 2009). By
combining pre-test probability and the LR of a diagnostic test, a clinician can determine
the post-test probability of a patient having the respective target condition. Specifically,
a positive test result increases the post-test probability that the patient has the target
condition while a negative test result implies the opposite. This relationship is expressed

18
through Bayes’ theorem: post-test odds = pre-test odds x likelihood ratio (Akobeng,
2007b; Portney & Watkins, 2009). The mathematical calculation of Bayes’ theorem has
been simplified and represented in Fagan’s nomogram to facilitate the use of LR in
clinical practice. See Figure 2 for Fagan’s nomogram.
In the case of continuous scale test results, the calculation of Sn and Sp can be
determined from a receiver operating characteristic (ROC) curve (Akobeng, 2007c;
Portney & Watkins, 2009). See Figure 3 for an example of an ROC Curve. An ROC
curve is a graphic plot of the Sn and 1-Sp for continuous test values. The data point
closest to the upper-left hand corner or at the inflection point of the curve of the ROC
curve represents the best balance between true positive and false positive tests (Porney &
Watkins, 2009). This data point may serve as a cutoff score for discriminating between
individuals with and without the target condition. By determining a cutoff score, the
diagnostic utility (e.g., Sn, Sp, LR+, LR-, and diagnostic odds ratio [DOR]) of test results
can be calculated appropriately. ROC curves have three benefits in this respect: (a)
determining a cutoff score for optimal Sn and Sp, (b) assessing the diagnostic utility of a
test, and (c) comparing the usefulness of two or more combined tests (Akobeng, 2007c).
It is important to recognize that ROC curves serve as a decision-making guide in
balancing the Sn and Sp of a diagnostic test (Portney & Watkins, 2009).

19
Figure 2. Fagan’s Nomogram.
Taken from Glasziou (2001) and is an adaptation of Fagan’s nomogram for Bayes’
theorem (Fagan, 1975). The nomogram is used by drawing a straight line from the pre-
test probability of the target condition through the likelihood ratio for the diagnostic test
to the post-test probability.

20
Figure 3. Typical Receiver Operating Characteristic (ROC) Curve.
The Y axis represents a diagnostic test’s sensitivity; the X axis represents a diagnostics
test’s one minus specificity (1- specificity) x100; the diagonal center line represents a line
of non-discrimination where the true positives and the false positives are equal; the
graphed curve from the origin to the upper right hand corner represents test scores based
on the relationship between the true positives and the false positives (Jewell, 2011;
Portney & Watkins, 2009).
An optimal cutoff score may be moved subjectively to safeguard against false positive or
false negative interpretive findings. This allows a clinician to use a test result as a
screening tool to stratify a patient based on binary classification (e.g., high or low risk)
for a target condition.
DOR may be used to summarize a diagnostic test’s performance characteristics as
a single number (Glas et al., 2003). DOR numerically describes how many times greater
are the odds of a positive test result in a population with the target condition verses those
without the target condition (CEBM, 2012); DOR = positive likelihood ratio/negative
likelihood ratio = (sensitivity x specificity)/(1- sensitivity) x (1-specificity) (Glas et al.,
0
0.2
0.4
0.6
0.8
1
0 0.2 0.4 0.6 0.8 1
Sen
sati
vit
y
1 - Sensativity

21
2003; Macaskill et al., 2010). DOR values may range from zero to infinity. Diagnostic
tests with higher DOR values provide greater discrimination among individuals with and
without the target condition. A DOR value ≤1 means that a diagnostic test does not have
discriminatory power (Glas et al., 2003). Although a single number as an index of a
diagnostic test’s performance characteristics may seem beneficial, DOR are not
appropriate for direct clinical application (CEBM, 2012). DOR typically are used in
systematic reviews or meta-analyses but may be of value in comparing or ranking tests
(Glas et al., 2003). Collectively, Sn, Sp, PPV, NPV, LR+, LR-, ROC curves, and DOR
are advanced tools in EBP. Practitioners should have an understanding of the definitions
and application of these Bayesian statistics to facilitate diagnostic and prognostic clinical
decision making (Portney & Watkins, 2009).
However, in the scope of clinical practice, individual screening or diagnostic tools
may not be sufficient to identify target conditions in complex patient conditions (Portney
& Watkins, 2009). A combination or cluster of factors may be required to enhance
diagnostic or prognostic utility beyond heuristics (Portney & Watkins, 2009). Greater
clarity can be derived from employing more advanced methods to quantify the
contributions of multiple variables (Norman & Streiner, 2008; Portney & Watkins, 2009;
Steyerberg, 2010). CPMs are one viable approach to statistically cluster multiple factors
and thus enhance diagnostic and prognostic utility (Glynn & Weisbach, 2011; Guyatt et
al., 2008; Jewell, 2011; Portney & Watkins, 2009).

22
Clinical Prediction Models
CPMs are statistical models used to estimate probability related to screening,
diagnosis, prognosis, or treatment interventions (Aronoff et al., 2010; Banks et al., 2010;
Hicks et al., 2005; Jewell, 2011; Steyerberg, 2010). Clinically, CPMs are used to identify
a cluster of predictors to support a diagnostic or prognostic assessment (Portney &
Watkins, 2009). The range of predictive factors may include patient history,
pathophysiology, symptomology, risk factors, test results, and outcome measures
(Bainbridge et al., 2010; Banks et al., 2010). The advantage of clustering a set of factors
in a CPM is to reduce the number of potential factors which strategically guide clinical
decision-making when approaching complex patient cases (Brasher & Beattie, 2009;
Bruce & Wilkerson, 2010a).
A broad range of CPMs exist in sports medicine to facilitate diagnostic and
prognostic decisions (Glynn & Weisbach, 2011). The Ottawa Ankle Rule, for example,
is a diagnostic CPM for determining the necessity of radiograph to rule out a fracture in
the foot and ankle (Stiell et al., 1992). In orthopedic rehabilitation, prognostic CPMs
have been developed for identifying treatment responsiveness for low back pain (Cai,
Pua, & Lim, 2009; Hicks et al., 2005), neck pain (Cai et al., 2009), hip fractures (Steiner,
Kramer, Eilertsen, & Kowalsky, 1997), spinal manipulation (Childs et al., 2004; Fritz,
Childs, & Flynn, 2005), and hip osteoarthritis (A. A. Wright, Cook, Baxter, Dockerty, &
Abbott, 2011; A. A. Wright, Cook, Baxter, Garcia, & Abbott, 2010; A. A. Wright, Cook,
Flynn, Baxter, & Abbott, 2011). More recently, CPMs are being developed in athletic
populations to identify modifiable risk factors that can be addressed through targeted

23
injury prevention strategies (Bruce & Wilkerson, 2010a, 2010b; Wilkerson, Giles, &
Seibel, 2012; Wilkerson, 2010).
The methodological approach to designing CPMs exists along a spectrum of
quality, validity, and clinical utility (Glynn & Weisbach, 2011; Steyerberg, 2010). It is
important to recognize the multiphase approach to establishing a CPM. CPM
development has been defined as a three phase process: (a) derivation, (b) validation, and
(c) impact analysis (Childs et al., 2004; McGinn et al., 2000) or recalibration of the
model (Steyerberg, 2010). The combination of the research design and degree of
development defines a hierarchy of evidence for evaluating CPMs (Portney & Watkins,
2009).
The first phase in constructing a CPM is the derivation stage. The derivation
phase is characterized by identifying a set of preliminary factors related to a specific
outcome (Portney & Watkins, 2009). The preliminary factors may be generated from a
combination of methods such as expert opinion, review of literature, prior research, and
clinical practice (Childs et al., 2004). Derivation models are typically constructed in a
select cohort without a comparison or control group (Glynn & Weisbach, 2011). Single
center retrospective cohort design is one of the primary means to initiate the development
process for a CPM without the constraints of a randomized controlled longitudinal
prospective study (Steyerberg, 2010). The derivation process is important in determining
whether a small set of factors may predict an outcome prior to investing in longitudinal
prospective validation research designs. Subsequently, derivation models need further
development before being applied clinically (Portney & Watkins, 2009). For this reason,

24
the hierarchy of evidence for prediction models categorizes derivation of CPMs as level
IV (lowest quality) on the continuum of evidence (Portney & Watkins, 2009).
Validation is the second stage in developing a CPM. This stage is a critical step in
authenticating predictor variables in a new cohort (Glynn & Weisbach, 2011). The
validation process encompasses an extensive range of methodological approaches
(Steyerberg, 2010); see Table 3. Practically, the approach to validating CPMs occurs in
prospective cohorts or randomized controlled trials (Glynn & Weisbach, 2011). When
validated in small prospective samples, CPMs are classified as level III on the hierarchy
of evidence for prediction models. Table 4 provides an overview of the hierarchy of
evidence for evaluating CPMs. Such CPMs can be applied only in similar patient groups
and may have limited clinical application (Portney & Watkins, 2009). Level II CPMs
have been validated in a broader spectrum of patients or multiple settings, have
demonstrated accuracy, and have been found appropriate for clinical application (Portney
& Watkins, 2009).

25
Table 3. Methodological Approaches for CPM Validation
Large scale retrospectivea
New cohort of cliniciansb
New patient sample b
Prospective cohort b
Cohort study for prognosis a
One narrow prospective samplec
Case-control a
Case-series a
Nested case-controla
Cross-sectional a
Multiple small center prospective sample c
One center large broad spectrum prospective sample of new patients c
One center large broad spectrum prospective sample of new clinicians c
One center large broad spectrum prospective sample of new patients and clinicians c
Randomized clinical trial b
Multivariate modeling a
Predictors and outcomes modeling a
Note. a Steyerberg (2010). b Glynn & Weisbach (2011). c Guyatt et al. (2008).
Table 4. Hierarchy of Evidence for CPMs
Level Type of Evidence Clinical Application
I Model has been validated in a large
prospective patient population AND
one impact analysis study has been
performed demonstrating improved
outcomes and/or benefit.
Model can be accurately used to change
clinician behavior or patient outcomes in
a wide spectrum of clinical settings.
II Model has been validated in a large
scale prospective study with a broad
spectrum of patients and/or clinicians
OR the model has been validated in
multiple diverse setting.
Model can be accurately used in a wide
spectrum of clinical settings.
II Prospectively validated in narrow
sample.
Model may only be applied in patient
populations similar to study’s
prospective sample.
IV Preliminary or derivation models based
on retrospective design, statistical
modeling, or single center split sample.
Model needs to be validated before being
generalized beyond sample; lacks
clinical utility.
Note. Adapted from Portney & Watkins (2009).
26
The third phase in developing CPMs relates to impact analysis (Childs & Cleland,
2006; Glynn & Weisbach, 2011; Guyatt et al., 2008; Portney & Watkins, 2009) or model
recalibration (Steyerberg, 2010). Impact analysis is intended to determine how a CPM
influences clinical practice specific to changed behavior, modified decision making, or
improved outcomes (Guyatt et al., 2008). Recalibration refers to a process of adjusting a
predictive model based on how a CPM performs clinically. Advances in diagnostic
procedures, changes in patient populations, changes in treatment strategies, or other
factors may influence the characteristics of a CPM and necessitate recalibration or
versioning of predictor or outcome variables (Glynn & Weisbach, 2011; Steyerberg,
2010). The concepts of impact analysis and recalibration are variations of validation
procedures and entail prospective research design. CPMs that use validation based on
impact analysis or recalibration are classified as Level I on the hierarchy of evidence for
prediction models (Portney & Watkins, 2009).
CPMs are commonly used in sports medicine (Glynn & Weisbach, 2011) and are
applicable to athletic training practice. As a decision-making tool, CPMs have potential
to assist in diagnosis, prognosis, and treatment strategies. This is particularly relevant in
the context of complex patient groups or injury patterns encountered in clinical practice.
Collegiate baseball players are one such specialized patient group and often present with
complex UE injury patterns. The diagnosis, prognosis, and treatment of UE SRI in
collegiate baseball players is complex. Consequently, there is a need to improve the
decision-making process to assist clinicians in improving patient outcomes. A CPM of

27
UE SRI would be an important advancement in assisting clinicians in navigating the
complexities of this patient population.
We have been unable to locate a CPM specific to UE SRI in baseball in the
present literature. However, a prospective derivation prediction model for UE overuse
injury in Division I softball players (n = 35) has been described (Bruce & Wilkerson,
2010b). Although softball and baseball are both UE throwing sports, the mechanics of
underhand windmill pitching (Oliver, Plummer, & Keeley, 2011; Werner et al., 2005;
Werner, Jones, Guido, & Brunet, 2006) and overhand pitching (Fleisig et al., 1996)
motions are distinctly different. Furthermore, the epidemiologies associated with
collegiate softball and baseball injuries are distinctly different (Dick et al., 2007;
Marshall, Hamstra-Wright, Dick, Grove, & Agel, 2007). Collectively this indicates that
the prediction model specific to collegiate softball should not be applied to collegiate
baseball; thus there remains a need for development of a CPM for UE SRI in baseball.
Predictive Factors of a Preliminary CPM
As stated earlier, generating a list of predictive factors related to a specified
outcome parameter is the initial step in creating a CPM (Childs et al., 2004). A well-
constructed CPM is predicated on predictor factors having a strong relationship with the
outcome measure (Glynn & Weisbach, 2011; Steyerberg, 2010). The rationale for
selecting predictor factors should be supported through review of literature, expert
opinion, or a conceptual framework (GH Guyatt, Bombardier, & Tugwell, 1986; Streiner
& Norman, 2008). The task of identifying potential predictor factors in a derivation stage
of model development may stem from expert brainstorming (Childs et al., 2004) or a
28
pragmatic approach of choosing available factors present in clinical practice (Steyerberg,
2010). A researcher must review available data and make judgments on the feasibility of
potential factors (Streiner & Norman, 2008). In the context of a single-center
retrospective cohort design, the availability and completeness of predictors may be
limited to available data (Steyerberg, 2010). Predictor factors collected clinically often
include demographics, patient history, comorbidity(s), physical exam findings, self-report
measures of health status and quality of life, basic laboratory tests, or physical functional
status (Beattie & Nelson, 2006; Falk & Fahey, 2009; Glynn & Weisbach, 2011; McGinn
et al., 2000; Steyerberg, 2010).
A broad range of risk factors has been identified and suggested as causal for UE
SRI in baseball athletes. These risk factors include: muscle strength deficits (Brown et
al., 1988; Yildiz et al., 2006), muscle fatigue (Mullaney et al., 2005), internal and
external strength imbalance (Lewis & Valentine, 2007), glenohumeral internal rotation
deficit (GIRD) (Borsa et al., 2006; Dines et al., 2009; Wilk et al., 2010), scapula
dyskinesis (Cooper et al., 2002; Kibler & McMullen, 2003), maximum pitch velocity
(Bushnell et al., 2010), pitching volume (Fleisig et al., 2010; Olsen et al., 2006), pitch
type (e.g. slider , curveball) (Escamilla et al., 1998; Fleisig et al., 2010; Fleisig et al.,
2006), playing position (Fleisig et al., 2010; Olsen et al., 2006), throwing biomechanics
(Fleisig et al., 1995; Fleisig et al., 1996), and low self-reported functional assessment
measures (Alberta et al., 2010; Domb et al., 2010; Neuman et al., 2011). These risk
factors can be conceptually categorized into three areas: (a) self-reported outcome scores,
(b) sport performance factors, and (c) FPMs.

29
Self-Reported Outcome Measures
Self-reported outcome measures are a branch of a broader field related to health
measurement scales (Streiner & Norman, 2008). Health measurement scales originated
as a means to quantify psychometric parameters in the social sciences (DeVellis, 2003).
The use of health measurement scales is well represented in a broad spectrum of sports
medicine literature (Suk, Hanson, Norvell, & Helfet, 2009) and clinical practice settings
(Streiner & Norman, 2008). Health measurement scales traditionally have been classified
under one of the following: (a) general health, (b) disease specific pathology, (c) regional
specific, (d) dimension specific, and (e) summary items (Valovich McLeod et al., 2008;
R. W. Wright & Baumgarten, 2010). The selection of a particular health measurement
scale should appropriately match the patient population or presenting medical condition
(Streiner & Norman, 2008; Suk et al., 2009).
Within orthopedic medicine, between 30 and 50 musculoskeletal outcome
measures and instruments related to the shoulder have been reported (Suk et al., 2009; R.
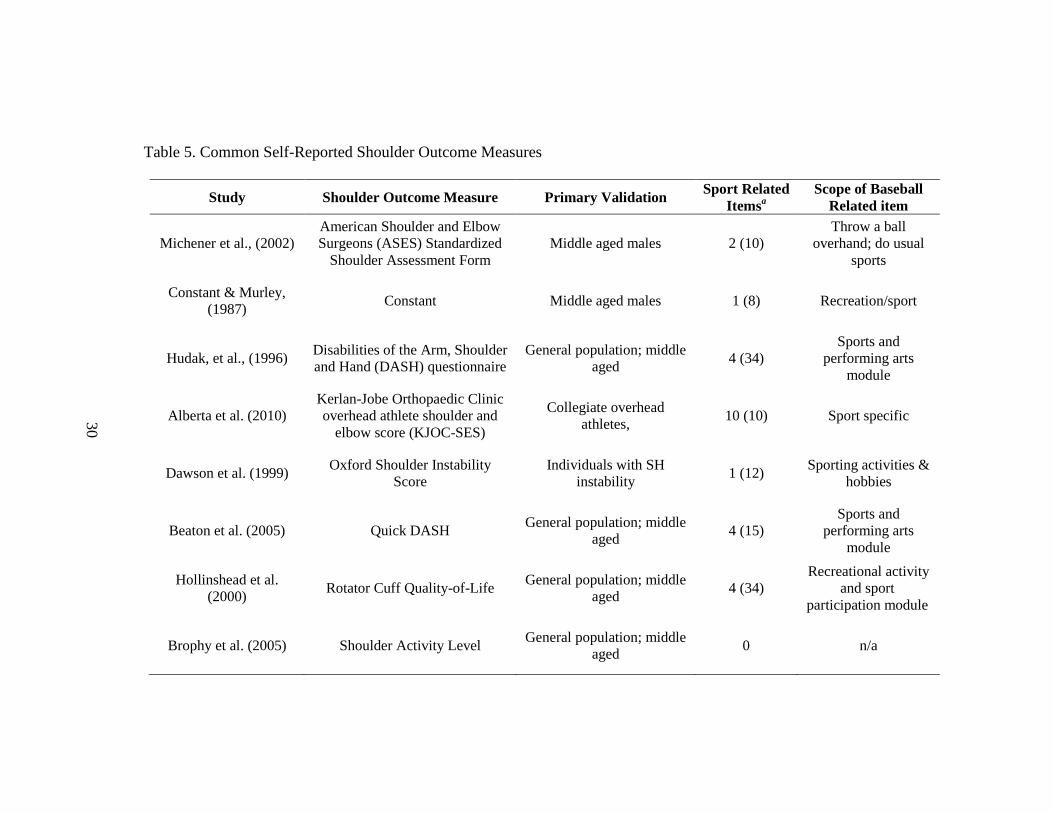
W. Wright & Baumgarten, 2010). Wright and Baumgartner (2010) identified ten
shoulder outcome measures appropriate for clinical practice (see Table 5 - Common
Shoulder Outcome Measures, for an overview). Despite the number of available UE
specific outcome measures, no validated self-report instrument to measure functional
status of the upper extremity in the overhead athlete was reported until recently (Alberta
et al., 2010; Domb et al., 2010; Neri, ElAttrache, Owsley, Mohr, & Yocum, 2010;
Neuman et al., 2011; Sauers et al., 2011; Sauers, Thigpen, Huxel, & Bay, 2009).
30
Table 5. Common Self-Reported Shoulder Outcome Measures
Study Shoulder Outcome Measure Primary Validation Sport Related
Itemsa
Scope of Baseball
Related item
Michener et al., (2002)
American Shoulder and Elbow
Surgeons (ASES) Standardized
Shoulder Assessment Form
Middle aged males 2 (10)
Throw a ball
overhand; do usual
sports
Constant & Murley,
(1987) Constant Middle aged males 1 (8) Recreation/sport
Hudak, et al., (1996) Disabilities of the Arm, Shoulder
and Hand (DASH) questionnaire
General population; middle
aged 4 (34)
Sports and
performing arts
module
Alberta et al. (2010)
Kerlan-Jobe Orthopaedic Clinic
overhead athlete shoulder and
elbow score (KJOC-SES)
Collegiate overhead
athletes, 10 (10) Sport specific
Dawson et al. (1999) Oxford Shoulder Instability
Score
Individuals with SH
instability 1 (12)
Sporting activities &
hobbies
Beaton et al. (2005) Quick DASH General population; middle
aged 4 (15)
Sports and
performing arts
module
Hollinshead et al.
(2000) Rotator Cuff Quality-of-Life
General population; middle
aged 4 (34)
Recreational activity
and sport
participation module
Brophy et al. (2005) Shoulder Activity Level General population; middle
aged 0 n/a

31
Table 5 (continued)
Williams et al. (1999) Single Assessment Numeric
Evaluation (SANE)
Patients who underwent SH
surgery for impingement or
AC separation
0 n/a
Ellman et al. (1986) UCLA Shoulder Score General population, middle
aged 0 n/a
Kirkley et al. (1998). Western Ontario Instability
Index (WOSI)
General population; middle
aged 4 (21)
Sport, recreation, and
work module
Lo et al. (2001) Western Ontario Osteoarthritis of
the Shoulder (WOOS) Index
General population; middle
aged 4 (19)
Sport, recreation, and
work module
Note. Adapted from Suk et al. (2009) and R. W. Wright & Baumgarten (2010). aNumber of sport specific items (total number of items).

32
The Kerlan-Jobe Orthopaedic Clinic overhead athlete shoulder and elbow score (KJOC-SES)
(Alberta et al., 2010) and the Functional Arm Scale for Throwers© (FAST©) (Sauers,
Ellery, Snyder, & Bay, 2008; Sauers et al., 2009) are self-report instruments developed
specifically to measure functional status of the shoulder and elbow in overhead athletes.
Existing self-report outcome instruments such as the Disabilities of the Arm, Shoulder
and Hand (DASH) and American Shoulder and Elbow Surgeons (ASES) Standardized
Shoulder Assessment Form) are limited in their ability to evaluate functional outcomes
(Alberta et al., 2010) or health related quality of life (HRQOL) (Sauers et al., 2011) in
overhead athletes. The DASH and ASES instruments do not have items to measure
overhead function specific to game and practice conditions. Furthermore, the common
shoulder outcome measures do DASH and ASES instruments do not have items to
measure overhead function specific to game and practice conditions. Furthermore, the
common shoulder outcome measures do not discriminate among sporting activities,
recreation, and work. Subsequently, the KJOC-SES and FAST© were developed to
provide valid and responsive self-report outcome measures specific to the high demands
of overhead athlete populations (Alberta et al., 2010; Sauers et al., 2008).
The KJOC-SES has demonstrated a high correlation to existing shoulder outcome
measures like the DASH and the ASES, but provides the advantage of correctly
stratifying functional status in overhead athletes based on UE SRI history (Alberta et al.,
2010) whereas the others do not. Since its development, the KJOC-SES has been
validated in subgroups of baseball players who are asymptomatic (Kraeutler et al., 2012),
have undergone ulnar collateral ligamnet (UCL) recontruction (Domb et al., 2010), type

33
II superior labral anterior-posterior (SLAP) lesion repairs (Neri et al., 2010; Neuman et
al., 2011), capsular plication for anterior shoulder instability (Hsu, Gould, Fonseca-
Sabune, & Hausman, 2009), or present with medial elbow pain (Sweitzer et al., 2012).
The KJOC-SES is reported to be a more sensitive and accurate outcome measure
compared to the DASH and the ASES in discriminating changes in functional status in
collegiate overhand athletes (Alberta et al., 2010; Neuman et al., 2011)
In addition to the KJOC-SES, an alternative self-reported outcome measure specific to
throwing athletes has recently been reported (Sauers et al., 2011). Functional Arm Scale
for Throwers© (FAST©) is a single self-report measure designed to measure health-
related quality of life (HRQOL) based on the five disablement domains: pain,
impairment, functional limitation, disability, and societal limitation. The FAST©
instrument was validated in a cohort of adolescent pitchers (n = 21) and was found to
better discriminate between those with and without positive pain and histories of UE SRI
compared to the DASH (Sauers et al., 2009). Subsequently, FAST© has been validated
as a regional specific self-report measure in a cohort (n = 25) high school and college
softball pitchers (Sauers et al., 2011). It should be noted that FAST© is a copyright-
protected instrument and to date has not been made available through the literature or
public domain.
Incorporating a self-report scale such as the KJOC-SES into clinical research is
consistent with the EBP because these scales provide patient-specific assessment of
functional (Reiman & Manske, 2011). It is important to recognize that self-reported
outcome measures are not intended to be used in isolation but are part of a

34
comprehensive approach to patient management. Obtaining a more comprehensive
clinical picture needs to include a broad spectrum of information to quantify the
impairment, functional limitations, and disability domains. In this respect, self-report
measures can be coupled with sport performance risk factors and FPMs to develop a
more comprehensive understanding of the relationship between SRI and disablement in
high functioning athletic populations. To date there are no known investigations of injury
risk which incorporate self-reported outcome measures in combination with other risk
factors in baseball players.
Sport Performance Risk Factors
An understanding of injury causation has been suggested to be a cornerstone of
SRI prevention (Bahr & Krosshaug, 2005). Identifying risk factors, which may
predispose an athlete to SRI, can be delineated as intrinsic (e.g., age, gender, anatomy) or
extrinsic (e.g., injury exposure rates, environmental conditions, sport performance
variables) (Bahr & Krosshaug, 2005). A range of baseball performance extrinsic injury
risk factors have been presented (Bradbury & Forman, 2012; Bushnell et al., 2010;
Fleisig et al., 2010; Olsen et al., 2006). Baseball injury risk factors commonly have been
reduced in clinical terms to a nebulous collection of issues such as mechanical flaws,
excessive pitching, improper strength and conditioning, or improper rest (Ortiz, 2011).
Reducing these risk factors into broad categories (such as mechanical flaws, and pitching
volume, strength deficits) without quantified descriptors provides little clarity in
furthering understanding the relationship between risk factors and UE SRI. Fortunately,
evidence has begun to emerge that identifies specific risk factors for shoulder and elbow

35
injuries in baseball players (Bradbury & Forman, 2012; Bushnell et al., 2010; Fleisig et
al., 2010; Olsen et al., 2006). Understanding this literature is paramount to developing a
comprehensive CPM for UE SRI in baseball athletes.
Maximum pitch velocity has been identified anecdotally (Ortiz, 2011) and
prospectively as a risk factor for elbow injury in professional (Bushnell et al., 2010) and
for shoulder and elbow injuries in adolescent baseball pitchers (Olsen et al., 2006).
Anecdotal data have been used to indicate that maximum pitch velocities over 100 mph
are a risk factor for injury in professional baseball players (Ortiz, 2011). However, these
data have not been substantiated in the literature. The work of Bushnell et al. (2010) in a
small prospective cohort (n = 23) has been instrumental in describing the association
between maximum pitch velocity and ulnar collateral ligament injury. High average
pitch velocity of 39.88 m/s (89.22 mph) versus low average pitch velocity 38.09 m/s
(85.22 mph) has been associated with an increased risk of ulnar collateral ligament sprain
(Bushnell et al., 2010). The relationship between maximum pitch velocity and risk of
injury is independent of pitching role (starter versus reliever), games played, innings
pitched, total pitches thrown, or pitches per game (Bushnell et al., 2010). A relationship
may exist among the length of playing career, maximum pitch velocity, and UCL injury
(Bushnell et al., 2010). In adolescent aged pitchers, average fastball velocity above 85
mph has been established as the threshold for increasing injury risk (Olsen et al., 2006).
It is important to note that the use of maximal or average pitch velocity as a risk factor
has not been established in high school, or collegiate pitchers. Incorporating maximum
or average pitch velocity as a predictive factor thus warrants consideration.

36
An ROC curve from the Bushnell et al. (2010) data set yields an average velocity
of 84 mph that may serve as a velocity threshold for increased risk of UE SI. Hand
tabulation of a 2x2 contingency table with UCL injury as a reference standard and pitch
velocity dichotomized as high velocity ( > 84 mph) and low velocity ( 83.9) yields an
Sn of 0.46, Sp of 0.75, LH+ 1.86 of and LH- 0.71. This indicates that pitch velocity as a
single risk factor lacks clinical utility in predicting injury despite the reported statistical
relationship between pitching velocity and UCL injury. This may be an initial step in
establishing velocity as a risk factor; however, the Bushnell et al. (2010) sample size (n =
23) may limit generalization.
Pitch type also has commonly been identified as a risk factor for injury (Andrews
& Fleisig, 1998). The curveball was believed to increase risk of shoulder pain by 52%
while the slider has been associated with an 86% increased risk of elbow pain (Lyman,
Fleisig, Andrews, & Osinski, 2002). Recent longitudinal prospective analysis has refuted
the notion that breaking pitches in youth baseball players correlate with shoulder or
elbow injuries (Fleisig et al., 2010). This evidence has been substantiated by
biomechanical analysis that indicates that curveballs do not produce greater kinetic force
in the shoulder or elbow in collegiate pitchers (Barrentine, Matsuo, Escamilla, Fleisig, &
Andrews, 1998; Fleisig et al., 2006). Evidence has not correlated the slider with an
increased prevalence of injury; however, the pitch produces greater joint torques
compared to the fastball in mature pitchers (Escamilla et al., 1998). This evidence
collectively suggests that pitch type may not be a definitive risk factor of UE SRI in
baseball pitchers.

37
Pitching volume is another proposed risk factor for UE SRI in youth (Fleisig et
al., 2010) and professional pitchers (Bradbury & Forman, 2012). An increased pitching
volume in youth has been correlated with an increased risk for shoulder and elbow injury
with a suggested threshold of 100+ innings per season (Fleisig et al., 2010). Pitching
volume thresholds have not been specified for high school, collegiate, or professional
levels. Recently, cumulative pitching load in combination with decreased rest days has
been quantified as a negative factor in pitching performance and hypothesized as a
potential risk factor for UE SRI in professional baseball pitchers (Bradbury & Forman,
2012). Bradbury and Forman (2010) suggest that the negative impact of high pitching
volume may be more likely correlated with a decline in pitching performance (e.g., ERA,
strike-to-balls ratio, homeruns) versus UE SRI rate. Additionally, extended pitch counts
of 150 pitches per game have been found to adversely affect shoulder kinematics, which
may predispose a collegiate player to increased risk of injury (Kohlmeyer, 2005). A pitch
count of 70 pitches per game has been suggested as the threshold for producing
significant differences in pitching mechanics (Kohlmeyer, 2005); however, a correlation
with UE SRI has not been established based on this finding. Collectively, although the
exact statistical relationship between pitching volume and UE SRI has not been clearly
established in skeletally mature pitchers, such data warrant further consideration.
In addition to pitch counts, throwing volume by position has been described in
collegiate baseball players (Barrett & Burton, 2002). The number of active (direct game
play) and inactive (unrelated to direct game play) throws contributes to the collective
throwing volume sustained in the context game play. The frequency of observed game

38
play throws by position were reported as follows: pitchers 51%, catchers 29%, infielders
17% and outfielders 3% (Barrett & Burton, 2002). These data indicate that throwing
volume is position specific and that game play throwing volume in combination with
pitch count predisposes pitchers and catchers to the highest volume of arm related
throwing stress. This would account for the increased prevalence of UE SRI specifically
in pitchers (Dick et al., 2007; Fleisig et al., 1995; Posner et al., 2011). Furthermore,
throwing volume by position also accounts for the increased injury rates in multiple
position players who participate as a starting pitcher and catcher in the same game
(Fleisig et al., 2010). The relationship between game-day throwing volume and playing
position is a risk factor for UE SRI in lower levels of baseball and may be a risk factor
for multiple-position collegiate players.
Level of experience has been suggested as another risk factor for UE SRI
(Chambless, Knudtson, Eck, & Covington, 2000). Rookie professional baseball players
sustain a significantly higher injury rate than more experiences players. The higher
injury rates are attributed to participating at a high level of play without sufficient time to
condition and adapt to longer playing seasons and higher competitive demands. It can be
posited that a similar relationship may exist when athletes transition from little league to
high school and from high school to college.
Collectively, sports performance risk factors can be grouped into five distinct
categories: (a) game-play exposure, (b) average fastball velocity (pitcher specific), (c)
throwing volume (pitcher specific), (d) playing experience, and (e) playing position
(pitcher versus fielder). Although progress has been made in clarifying sport
39
performance risk factors in adolescent baseball players, additional investigation is needed
to understand the multifactorial nature of risk factors in relationship to UE SRI in
baseball. The influence of these sport performance risk factor categories has not been
fully considered in collegiate and professional baseball players. One could suggest that
these sport performance factors are important in understanding the risk for UE SRI in
more advanced levels of baseball competition; however, the magnitude of these risk
factor categories warrants further study.
Recently, advancements have been made in understanding the risk factors for UE
SRI in adolescent baseball pitchers. A 10-year prospective investigation by Fleisig et al.
(2011) identified a number of important risk factors for serious UE SRI in youth baseball
pitchers. Although the investigation is a landmark study, the investigators did not present
a multifactorial analysis of risk factors nor describe a CPM. Olsen et al. (2006)
prospectively developed multivariate logistic regression models of risk factors in
adolescent baseball pitchers. The model identifies four factors associated with SRI: (a)
pitching more than eight months, (b) pitching more than 80 pitchers per game, (c) fastball
velocity greater than 85 mph, and (d) pitching with arm fatigue (Olsen et al., 2006).
Despite identifying multiple factors, the model of Olsen et al. (2006) included only
single-factor statistical analysis and failed to present a single multifactorial model to
account for a composite of risk factors. A CPM that identifies a composite of risk factors
may further our understanding of athletes at risk for significant UE SRI.

40
Functional Performance Measures
FPMs are physical testing procedures used for the assessment of physical abilities
(Reiman & Manske, 2011). Function can be measured through impairment measures
(e.g., manual muscle testing, joint range of motion), self-report measures (e.g., pain
scales, DASH, KJOC-SES), and physical performance measures (e.g., muscle endurance
testing, dynamic balance, jump/hop testing) (Reiman & Manske, 2011). Reiman and
Manske (2009) have cataloged approximately 140 individual FPMs which span 10
parameters: anthropometric; muscle length; fundamental movements; balance; aerobic;
strength and power; speed, agility, and quickness; trunk; upper extremity; and lower
extremity (Reiman & Manske, 2009). Because of the large number of available tests, the
inclusion of specific FPMs in clinical practice may be confusing for clinicians. In an
effort to simplify screening procedures, clusters of tests have been grouped to form
batteries to quantify the characteristics of function, injury assessment, sport performance,
and injury prediction in athletic populations (Butler, Plisky, Southers, Scoma, & Kiesel,
2011; G. Cook et al., 2006a, 2006b; G. Cook et al., 2010; Frohm, Heijne, Kowalski,
Svensson, & Myklebust, 2011; Kiesel, Plisky, & Butler, 2009; Kiesel et al., 2007; Minick
et al., 2010; Plisky et al., 2009; Plisky, Rauh, Kaminski, & Underwood, 2006;
Schneiders, Davidsson, Horman, & Sullivan, 2011). Using a battery of tests allows for a
standardized approach to the assessment of function to aid clinical practice and to
facilitate the long-term study of the reliability and validity of FPMs (Reiman & Manske,
2011).
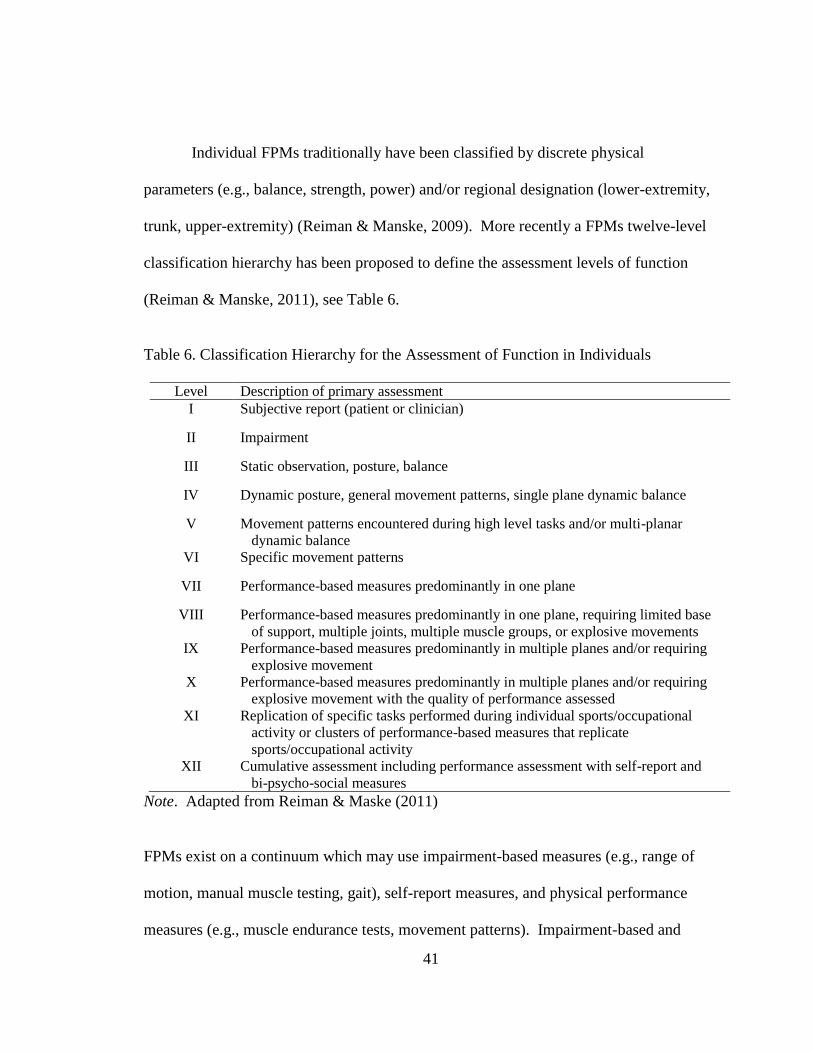
41
Individual FPMs traditionally have been classified by discrete physical
parameters (e.g., balance, strength, power) and/or regional designation (lower-extremity,
trunk, upper-extremity) (Reiman & Manske, 2009). More recently a FPMs twelve-level
classification hierarchy has been proposed to define the assessment levels of function
(Reiman & Manske, 2011), see Table 6.
Table 6. Classification Hierarchy for the Assessment of Function in Individuals
Level Description of primary assessment
I Subjective report (patient or clinician)
II Impairment
III Static observation, posture, balance
IV Dynamic posture, general movement patterns, single plane dynamic balance
V Movement patterns encountered during high level tasks and/or multi-planar
dynamic balance
VI Specific movement patterns
VII Performance-based measures predominantly in one plane
VIII Performance-based measures predominantly in one plane, requiring limited base
of support, multiple joints, multiple muscle groups, or explosive movements
IX Performance-based measures predominantly in multiple planes and/or requiring
explosive movement
X Performance-based measures predominantly in multiple planes and/or requiring
explosive movement with the quality of performance assessed
XI Replication of specific tasks performed during individual sports/occupational
activity or clusters of performance-based measures that replicate
sports/occupational activity
XII Cumulative assessment including performance assessment with self-report and
bi-psycho-social measures
Note. Adapted from Reiman & Maske (2011)
FPMs exist on a continuum which may use impairment-based measures (e.g., range of
motion, manual muscle testing, gait), self-report measures, and physical performance
measures (e.g., muscle endurance tests, movement patterns). Impairment-based and

42
observation-based (e.g., static posture) assessments of function are classified as lower
level while multi-plane (e.g., figure-8 hop) or explosive movements (e.g., triple hop for
distance) are classified as higher level functional assessments. In general, the closer an
FPM approximates an actual sport, occupational, or daily activity the higher the
respective classification rating (Reiman & Manske, 2011). Reiman and Manske (2011)
suggest that function should be assessed along a continuum and include multiple
measures. An optimal approach for functional assessment in athletic populations should
incorporate a range of physical parameters and a balance of regional designations across
several assessment levels. Such an approach would necessitate transitioning from
individual tests to a cluster of FPMs to obtain a
global assessment and a high level of classification.
FPMs have been clustered to form a battery of tests that incorporate multiple
discrete parameters and regional designations to derive a global assessment measure of
function (G. Cook et al., 2006a, 2006b; Frohm et al., 2011; Hegedus, 2011; Kiesel et al.,
2009). The most noted FPM batteries are the Functional Movement Screen (FMS)
(G. Cook et al., 2010) and Frohm’s nine-test screening battery for athletes (Frohm et al.,
2011). Recently an alternative global battery of tests, the Targeted Enhanced Athletic
Movement Screen (TEAM-S) has been developed for athletic populations (Hegedus,
2011). An overview or comparison of the FMS, Frohm’s nine-test screening battery,
and TEAM-S is provided in Table 7.
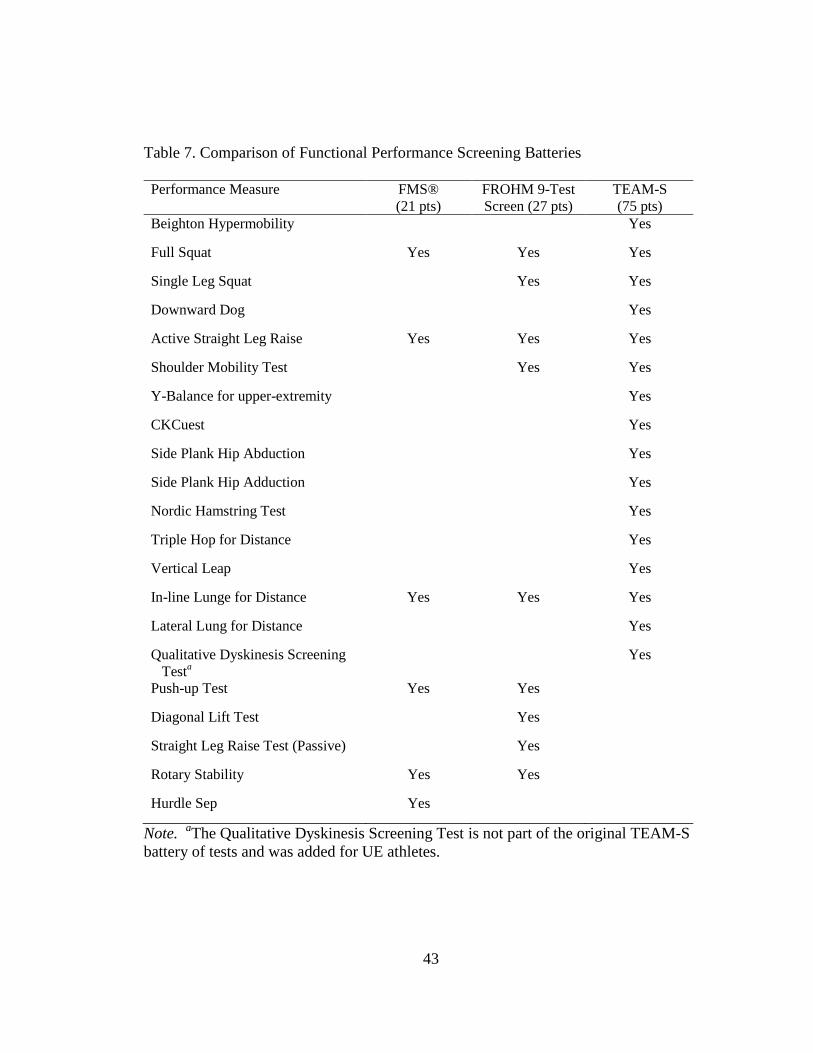
43
Table 7. Comparison of Functional Performance Screening Batteries
Performance Measure FMS®
(21 pts)
FROHM 9-Test
Screen (27 pts)
TEAM-S
(75 pts)
Beighton Hypermobility Yes
Full Squat Yes Yes Yes
Single Leg Squat Yes Yes
Downward Dog Yes
Active Straight Leg Raise Yes Yes Yes
Shoulder Mobility Test Yes Yes
Y-Balance for upper-extremity Yes
CKCuest Yes
Side Plank Hip Abduction Yes
Side Plank Hip Adduction Yes
Nordic Hamstring Test Yes
Triple Hop for Distance Yes
Vertical Leap Yes
In-line Lunge for Distance Yes Yes Yes
Lateral Lung for Distance Yes
Qualitative Dyskinesis Screening
Testa
Yes
Push-up Test Yes Yes
Diagonal Lift Test Yes
Straight Leg Raise Test (Passive) Yes
Rotary Stability Yes Yes
Hurdle Sep Yes
Note. aThe Qualitative Dyskinesis Screening Test is not part of the original TEAM-S
battery of tests and was added for UE athletes.

44
FPMs batteries integrate a variety of measures in an attempt to capture an envelope of
function central to active populations This is an important consideration in determining
the relationship between functional or athletic performance and injury risk (Reiman &
Manske, 2011).
The FMS is a commercialized functional assessment system comprised of a
seven item battery intended to identify functional imbalances thought to affect
performance and prevent injury (G. Cook et al., 2010). The maximum score for the
FMSTM
is 21 points. Each individual FPM item is subjectively scored on a 4-point scale
(0-1-2-3): 0 if pain present; 1 = movement pattern is incomplete or not performed
consistent with the FMS definition; 2 = movement pattern demonstrates compensation,
faulty form, or loss of alignment consistent with the FMS definition; 3 = movement
pattern is complete and consistent with FMS definition (G. Cook et al., 2010). It is
important to note that the original text describing the FMSTM
did not report reliability or
validity despite claims of its clinical utility for improving performance and injuryvalidity
despite claims of its clinical utility for improving performance and injury prevention (G.
Cook et al., 2010). Recent studies have reported normative values of the FMSTM
in
young active populations (15.7, 95% CI [15.4-15.9]) (Schneiders et al., 2011),
professional football athletes (16.9±3.0) (Kiesel et al., 2007), and active military service
members (15.7±0.2) (Teyhen et al., 2012). Individual item reliability (kappa) has been
reported to range from 0.73 to 1.00 (Schneiders et al., 2011), while total score reliability
(ICC) has ranged from 0.74 (Teyhen et al., 2012) to 0.92 (Minick et al., 2010).

45
The validity of the FMS to predict injury is disputed. Kiesel et al. (2007) reported a
cutoff score equal to or less than 14 was predictive of serious injury (Sp of 0.91, Sn of
0.54, LR+ of 5.92, and a LR- of 0.51) in a cohort (n = 46) of professional football
players. Based on these original data, a cutoff score of 14 correctly identified 53.8% (7
of 13) of the injury cases. In contrast, Teyhen et al. (2012) reported that an FMSTM
cutoff
score of ≤ 14 identified correctly only 15.6% of the injury cases in a cohort (n = 64) of
active military service members. The discrepancy in correctly identifying injury calls
into question the validity of the FMSTM
as a viable screening tool and highlights the need
for additional and larger longitudinal investigations to determine the screen’s
psychometric properties (Teyhen et al., 2012).
The Frohm nine-test screening battery was developed over a 5 to 10-year period
of clinical practice by selectively combining items from the FMS and the United States
Tennis Association High-Performance Profile screening system (Frohm et al., 2011).
Each test item is subjectively scored on a four point scale (0-1-2-3); 0 if pain is present; 1
= not correct despite compensatory movement; 2 = correct but with compensatory
movement; 3 = correct without compensatory movement. The normative composite
score in healthy elite male soccer athletes was established between 18.3 (95%CI [14.9-
21.7]) and 18.0 (95%CI [14.4-21.7]) with a test-retest reliability of ICC of 0.81 to 0.80
(Frohm et al., 2011). Normative and reliability values were based on a small cohort (n =
26) of healthy elite level male soccer players (Frohm et al., 2011) and may not be
generalized to other populations. Frohm et al. (2011) suggested that the screening battery
may be limited in clinical utility because it has not been validated for injury prevention,

46
rehabilitation, or performance enhancement. Aside from the original investigation, we
were unable to locate other references of the Frohm nine-test screening battery in the
literature.
Hegedus (2011) developed and proposed the TEAM-S as an alternative to the
commercialization of a functional performance screening system and to develop a
screening battery consistent with EBP. The individual test items that comprise the
TEAM-S originally were selected based on 20 years of physical therapy clinical
experience with functional performance screening in a broad spectrum of healthy and
injured recreational, high school, collegiate, and professional athletes (E. J. Hegedus,
personal communication). Individual TEAM-S items were selected based on providing a
mixture of upper-extremity, trunk, and lower-extremity functional measures to reflect a
composite of functional screens related to sports activity. Most importantly, individual
TEAM-S items have established reliability measures reported in the literature; see Table
8. Each TEAM-S item is scored on a 6 point rating scale (0-1-2-3-4-5) with a maximum
score of 75 points. Unlike the FMSTM
or the Frohm nine-test screen, the scoring of a
TEAM-S item is based upon a combination of subjective scoring criteria and objective
measurements. Appendix B is the TEAM-S score sheet and provides a description of
each test and its respective scoring criteria. The psychometric properties of the TEAM-S
are currently under investigation in an international multicenter research project. The
global reliability and validity of TEAM-S and has not been reported in literature.
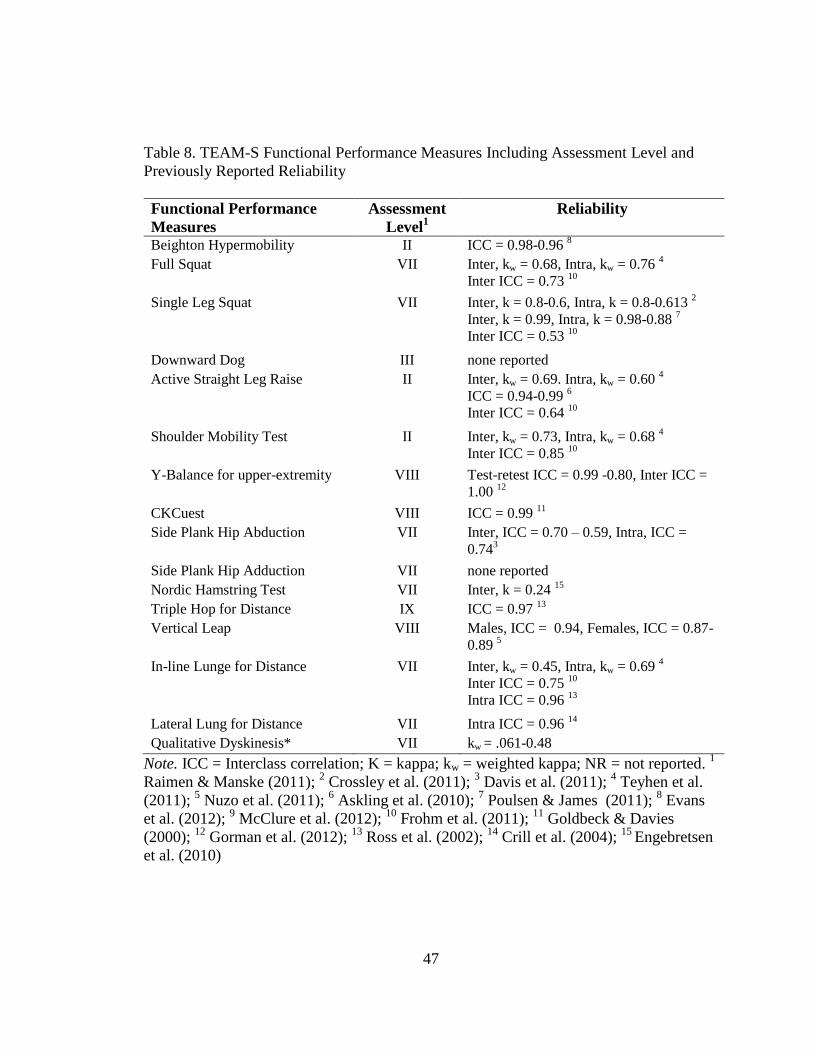
47
Table 8. TEAM-S Functional Performance Measures Including Assessment Level and
Previously Reported Reliability
Functional Performance
Measures
Assessment
Level1
Reliability
Beighton Hypermobility II ICC = 0.98-0.96 8
Full Squat VII Inter, kw = 0.68, Intra, kw = 0.76 4
Inter ICC = 0.73 10
Single Leg Squat VII Inter, k = 0.8-0.6, Intra, k = 0.8-0.613 2
Inter, k = 0.99, Intra, k = 0.98-0.88 7
Inter ICC = 0.53 10
Downward Dog III none reported
Active Straight Leg Raise II Inter, kw = 0.69. Intra, kw = 0.60 4
ICC = 0.94-0.99 6
Inter ICC = 0.64 10
Shoulder Mobility Test II Inter, kw = 0.73, Intra, kw = 0.68 4
Inter ICC = 0.85 10
Y-Balance for upper-extremity VIII Test-retest ICC = 0.99 -0.80, Inter ICC =
1.00 12
CKCuest VIII ICC = 0.99 11
Side Plank Hip Abduction VII Inter, ICC = 0.70 – 0.59, Intra, ICC =
0.743
Side Plank Hip Adduction VII none reported
Nordic Hamstring Test VII Inter, k = 0.24 15
Triple Hop for Distance IX ICC = 0.97 13
Vertical Leap VIII Males, ICC = 0.94, Females, ICC = 0.87-
0.89 5
In-line Lunge for Distance VII Inter, kw = 0.45, Intra, kw = 0.69 4
Inter ICC = 0.75 10
Intra ICC = 0.96 13
Lateral Lung for Distance VII Intra ICC = 0.96 14
Qualitative Dyskinesis* VII kw = .061-0.48
Note. ICC = Interclass correlation; K = kappa; kw = weighted kappa; NR = not reported. 1
Raimen & Manske (2011); 2 Crossley et al. (2011);
3 Davis et al. (2011);
4 Teyhen et al.
(2011); 5 Nuzo et al. (2011);
6 Askling et al. (2010);
7 Poulsen & James (2011);
8 Evans
et al. (2012); 9 McClure et al. (2012);
10 Frohm et al. (2011);
11 Goldbeck & Davies
(2000); 12
Gorman et al. (2012); 13
Ross et al. (2002); 14
Crill et al. (2004); 15
Engebretsen
et al. (2010)

48
In the context of this dissertation, developing a CPM for UE SRI in college baseball
players that incorporates the TEAM-S would be a valuable contribution in establishing
the instrument’s validity in the area of injury prediction.
The assessment of function limitations at the level of the whole person has gained
increased importance in athletic populations (Reiman & Manske, 2011). The screening
of dysfunctional movement patterns prior to the onset of pain, functional limitations, or
injury is an important consideration (Arnason, Tenga, Engebretsen, & Bahr, 2004).
Functional screening tools that are sensitive to functional limitations and asymmetry are
needed in clinical practice (Bahr, 2009). The FMS, Frohm’s nine-test screening
battery, and TEAM-S are viable functional performance screens for quantifying the
characteristics of function, injury assessment, sport performance, and injury prediction in
athletic populations. However, determining which combination of functional assessment
measures best assesses injury risk requires further investigation (Reiman & Manske,
2011). Specifically, the relationship between functional movement screens and injury
should be investigated in combination with self-report measures and risk factors (Reiman
& Manske, 2011).
Baseball UE SRI Epidemiology
Differing injury rates and incidences have been reported for youth, high school,
collegiate and professional baseball levels (Comstock, Collins, & McIlvain, 2011; Dick et
al., 2007; Hootman et al., 2007; Janda, 2003; Kerut et al., 2008; Lyman & Fleisig, 2005;
Magra et al., 2007; McFarland & Wasik, 1998; Posner et al., 2011). It has been reported
that upwards of 164,800 injuries per year are sustained in little league (Pasternack,

49
Veenema, & Callahan, 1996) and 46,700 injuries per year in high school (Comstock et
al., 2011). About 440 major league baseball players per year are placed on the disabled
list. In comparison to other sports, baseball has a relatively low overall injury rate of
0.23 per 1,000 athlete exposures (Hootman et al., 2007). The collegiate and professional
preseason injury rates (2.87 and 5.73 per 1,000 exposures) have been reported to be
higher than in-season injuries rates (1.58 and 0.54 per 1,000 exposures) (Dick et al.,
2007; Posner et al., 2011). Injury rates are about three time higher in games (5.78 per
1,000 exposures) than practices (1.85 per 1,000 exposures) (Dick et al., 2007). Despite
the relatively low injury rates, the incidence of UE SRI for baseball players increases
with competitive level. Incidence rates have been reported to be 5% in little league and
high school (Fleisig et al., 2010), 25% in collegiate (Dick et al., 2007), and 50% in
professional (Anz et al., 2010) baseball. The primary injuries of concern (associated with
extended time loss) are ulnar collateral ligament (UCL) sprains/tears (Cain, Dugas, Wolf,
& Andrews, 2003; Domb et al., 2010; Jazrawi et al., 2006; Wood, Konin, & Nofsinger,
2010), superior labrum tears from anterior to posterior (SLAP lesions) (Burkhart &
Morgan, 1998; Burkhart & Morgan, 2001; Burkhart, Morgan, & Kibler, 2003), rotator
cuff pathologies (Gerstman, Malanga, & Ferrer, 2009; Jobe & Bradley, 1988; Namdari,
Baldwin, Ahn, Huffman, & Sennett, 2011; Yanagisawa, Niitsu, Takahashi, & Itai, 2003),
and impingement syndromes (Burkhart, 2006; Kuhn, 2009). It has been reported that the
severity of these injuries has led to a four-fold increase in elbow and a six-fold increase in
shoulder surgical intervention (Fleisig et al., 2006). The rise in serious UE SRI in
50
baseball has prompted interest in research focused on identifying risk factors for the
purpose of injury prevention strategies.
Conclusion
Recently, there has been an increase in the prevalence of serious UE SRI in all
levels of baseball which has sparked increased research interest in identifying injury risk
factors. A number of investigations have focused on recognizing potential sport-specific
injury risk factors but have not approached the issue from an EBP paradigm. The
development of a CPM that includes self-reported outcome measures, sport performance
risk factors, and FPMs would be a critical step in advancing the body of knowledge.
Furthermore, a CPM based on Bayesian statistics (e.g., Sn, Sp, and LRs) would directly
assist clinicians in the screening and evaluation of baseball players at risk for UE SRI.

51
CHAPTER III
METHODOLOGY
The purpose of this research was to develop and assess a preliminary clinical
prediction model (CPM) for upper-extremity (UE) sports related injury (SRI) in a
retrospective cohort of collegiate baseball players. The research design was a single-
center retrospective cohort study.
Participants
In the fall of 2011, 156 Division I athletes from the sports of baseball (n = 37),
men’s basketball ( n = 10), women’s basketball (n = 15 ), cheerleading (n = 18), men’s
cross-country (n = 13), women’s cross-country (n = 10 ), men’s track and field (n = 5),
women’s track and field (n = 7), women’s lacrosse (n = 28), and volleyball (n = 13)
participated in High Point University’s (HPU) annual pre-participation examination
(PPE). An individual from the research team other than this dissertation author provided
participants with a verbal and written explanation of the research project. Written
informed consent was obtained as approved by the HPU Institutional Review Board. The
researchers were unaware of who consented until after completion of screening. Data
belonging to subjects who did not consent to voluntary participation were excluded
The HPU PPE consisted of the following: (a) HPU Athletic PPE Form
New/Transfer Athlete Medical History Form, (b) HPU Waiver for Athletics, (c) National.
Collegiate Athletic Association (NCAA) HIPAA Form, (d) HPU HIPAA Form, (e) HPU

52
Athletic Insurance Policy, (f) HPU Medical Insurance Form, (g) NCAA ADHD/ADD
Notification Document, and (h) NCAA Sickle Cell Screening Notification Document.
Following medical clearance by team physicians, athletes completed the Targeted
Enhanced Athletic Movement Screen (TEAM-S) and sport specific pre-season
conditioning tests. In addition, UE athletes (volleyball and baseball) completed the
Kerlan-Jobe Orthopaedic Clinic overhead athlete shoulder and elbow score (KJOC-SES)
in conjunction with the TEAM-S. All testing procedures were standard policy and
procedure of the HPU intercollegiate athletic department, athletic training department,
and strength and conditioning program.
From the 156 tested athletes, thirty-seven Division I baseball players were
selected (age [yrs] 19.53 ± 0.9; height [cm] 183.3 ± 7.1; weight [kg] 85.6 ± 10.5). The
baseball players’ data from the TEAM-S and KJOC-SES were utilized to develop a CPM
for UE SRI in collegiate baseball players. One baseball athlete completed the PPE
process and TEAM-S but did not complete the KJOC-SES. This subject’s data was
excluded from data analysis resulting in a final n = 36.
Instrumentation
The CPM predictive factors were derived from three domains: (a) self-reported
outcome measures, (b) sport performance risk factors, and (c) functional performance
measures (FPMs). The self-reported outcome measure included the KJOC-SES
functional assessment tool as described by Albert et al. (2010) (Appendix A). Sport
performance risk factors were a range of variables derived from game-play statistics.

53
FPMs were derived from the TEAM-S instrument as presented by Hegedus (2011) (see
Appendix B). A more in-depth description of each of these three domain areas follows.
Self-Reported Outcome Measures
All participants completed the KJOC-SES (Alberta et al., 2010) (Appendix A).
The KJOC-SES is a patient-centered, self-report outcome measure specific to overhead
athletes. The instrument requests information about UE SRI history, level of
competition, and contains a 10-item physical functional inventory. The KJOC-SES UE
SRI history information for each participant was reviewed and coded by the principal
investigator as “1” for positive history or “0” for a negative history. Dichotomizing UE
SRI history allowed the establishment of a criterion reference for establishing two
groups: injured and non-injured. A self-reported UE SRI was operationally defined by
one or more of the following conditions: ulnar collateral ligament (UCL) sprains/tears
(Cain et al., 2003; Domb et al., 2010; Jazrawi et al., 2006; Wood et al., 2010), superior
labrum tears from anterior to posterior (SLAP lesions) (Burkhart & Morgan, 1998;
Burkhart & Morgan, 2001; Burkhart, Morgan, et al., 2003), rotator cuff pathologies
(Gerstman et al., 2009; Jobe & Bradley, 1988; Namdari et al., 2011; Yanagisawa et al.,
2003), and impingement syndromes (Burkhart, 2006; Kuhn, 2009).
Each KJOC-SES physical functional inventory item (e.g., Item 1: “How difficult
is it for you to get loose or warm prior to competition or practice?”; Item 4: “How
unstable does your shoulder or elbow feel during competition?”; Item 9: “How much has
your control (of pitches, serves, strokes, etc.) suffered due to your arm?” was scored on a
10-cm visual analog scale. The 10 physical functional inventory items yielded a total

54
score (100 maximum points) as previously described by Alberta et al. (2010). A Lower
score represents lesser perceived function.
Sport Performance Risk Factors
Individual game-by-game statistics for the 2009, 2010, and 2011 baseball seasons
were publicly available from the HPU sports information department web site. The sport
performance risk factors derived from game statistics encompassed the following
variables: playing position, average game appearances per season (GA) by playing
position, average innings pitched per season per season (IP), average number of pitches
per season (NP), average number of pitches per game appearances per season (NP/GA),
average number of pitches per innings pitched per season (NP /IP), and average at-bats
per season (AB). Subjects were dichotomously labeled “pitcher” or “fielder” based on an
athlete’s primary playing position. Direct game play exposure was determined from GA,
IP, NP, NP/ GA, NP/IP, and AB. Sport Performance variables are listed in Table 9.
Table 9. Independent Variables for CPM Development: Self-Report Measures and Sport
Performance Risk Factors
Domain Predictor Variable(s) Variable Type
Self-Report Measures
KJOC-SES Score Continuous
Sport Performance Risk Factors
playing position Nominal
game appearances- pitchera Continuous
game appearances- fieldera Continuous
innings pitcheda Continuous
number of pitchesa Continuous
number of pitches per game appearancea Continuous
number of pitches per inninga Continuous
at-batsa Continuous
Note. aaverage per season.

55
Functional Performance Measures
FPMs were derived from the TEAM-S (Hegedus, 2011) (Appendix B). The
TEAM-S is a 15-item screening battery that also includes a qualitative dyskinesis
screening test as a separate item for UE dominant athletes (baseball and volleyball). The
TEAM-S was scored as described by Hegedus (2011) with individual items being scored
on 6-point rating (0, 1, 2, 3, 4, 5) based on specific scoring criteria. For items that had
recorded left and right measures, the lower score was utilized in determining the item’s
rating scale score. A brief summary of individual TEAM-S item scoring criteria is
provided in Table 10 and described in the TEAM-S scoring sheet (see Appendix B). A
TEAM-S composite score was derived by summing the 15 items and the qualitative
dyskinesis screening test for a maximum score of 80 points. Table 10 provides a list of
the individual TEAM-S items and their respective scoring metrics.
The TEAM-S was administered by a group of clinicians consisting of two
physical therapists, three athletic trainers, two certified strength and condition coaches,
and three undergraduate exercise science students. Experienced raters reviewed the
TEAM-S scoring sheet and received verbal instructions on the procedure for
administering the TEAM-S battery of FPMs from the research team’s principal
investigator (E. J. Hegedus) prior to data collection. Student raters underwent a similar
orientation, but also were required to observe a group testing session prior to data
collection. Student raters were intentionally assigned TEAM-S items that required
timekeeping and repetitive counting skills. The intra- and inter-rater reliability for
experienced and student raters was not determined.

56
Table 10. Functional Performance Measures: TEAM-S Item Scoring Criteria
TEAM-S Item Predictor
Variable(s)
Rating
Scale
Scoring Criteria
1 Beighton
Hypermobility
Brighton Score 0 to 5 Beighton index
2 Full Squat Full Squat Score 0 to 5 Qualitative assessment
3 Single Leg
Squata
Single Leg Squat
Score
0 to 5 Qualitative assessment
4 Downward Dog Downward Dog
Score
0 to 5 Qualitative assessment
5 Active Straight
Leg Raise
Active Straight Leg
Raise Score
0 to 5 Qualitative assessment
6 Shoulder
Mobility Testa
Shoulder Mobility
Test Score
0 to 5 Qualitative assessment
7 Y-Balance for
Upper-
extremitya
Y-Balance Score 0 to 5 Sum of greatest 3 reaches (cm)
divided by 3 x 100; percentage of
right versus left.
8 CKCuest CKCuest Score 0 to 5 Number of repetitions in 15
seconds
9 Side Plank Hip
Abductiona
Side Plank Hip
Abduction Score
0 to 5 Number of repetitions in 30
seconds
10 Side Plank Hip
Adduction a
Side Plank Hip
Adduction Score
0 to 5 Number of repetitions in 30
seconds
11 Nordic
Hamstring Test
Nordic Score 0 to 5 Knee flexion angle (degrees)
12 Triple Hop for
Distancea
Triple Hop Score 0 to 5 Total distance (in) jumped on
each leg; least distance /greatest
distance x 100
13 Vertical Leap Vertical Leap Score 0 to 5 Vertical jump height (in)
14 In-line lunge for
Distance a
In-line Lunge Score 0 to 5 Total lunge distance (in) each leg;
least distance /greatest distance x
100
15 Lateral Lunge
for Distancea
Lateral Lung Score 0 to 5 Total lunge distance (in) each leg;
least distance /greatest distance x
100
16 Qualitative
Dyskinesis
Screening Testa
Scapula Dyskinesis
Score
0 to 5 Qualitative assessment
Total TEAM-S Total
Scoreb
0-80
Note. Each TEAM-S item is scored on a 6-point rating scale (0-1-2-3-4-5). The criteria
for the rating scale are unique to each item and are specified in the TEAM-S scoring
sheet, refer to Appendix B; aItem measured bilaterally;
bTeam-S Total Score is based on
the sum of 16 items; in = inches; cm = centimeters.

57
TEAM-S items based on left and right side measures were coded based on
dominant throwing arm. For right handed dominant throwers, right side UE variables
were coded as “throwing arm” and left side UE variables were coded as “non-throwing
arm.” Lower-extremity (LE) variables were coded as follows: for right handed dominant
throwers, right side LE variables were coded as “balance foot” and left side LE variables
were coded as “stride foot”. TEAM-S variables for left handed dominant throwers were
coded similarly, with opposing designations. Coding based on arm dominance allowed
for comparisons of throwing arm, non-throwing arm, stride foot, and balance foot in
addition to a right versus left comparison. The calculation of UE ratios were derived
from the percentage of the throwing arm versus the non-throwing arm. LE ratios were
derived from the percentage of the stride foot versus the balance foot. See Table 11 for a
listing of UE and LE ratio variables.

58
Table 11. Independent Variables for CPM Development: Functional Performance
Measure Risk Factors
Domain Predictor Variable(s) Variable Type
Functional Performance Measures
TEAM-S Total Score Continuous
Brighton Score Ordinal
Full Squat Score Ordinal
Single Leg Squat Score Ordinal
Single Leg Squat Stride Foot Ordinal
Single Leg Squat Balance Foot Ordinal
Downward Dog Score Ordinal
Active Straight Leg Raise Score Ordinal
Active Straight Leg Raise Stride Foot Ordinal
Active Straight Leg Raise Balance Foot Ordinal
Shoulder Mobility Test Score Ordinal
Shoulder Mobility Test Non-Throwing Arm Ordinal
Shoulder Mobility Test Throwing Arm Ordinal
Y-Balance Score Ordinal
Y-Balance Non-throwing Arm (cm) Continuous
Y-Balance Throwing Arm (cm) Continuous
Y-Balance Ratio b
Continuous
CKCuest Score Ordinal
CKCuest Absolutea Continuous
Side Plank Hip Abduction Score Ordinal
Side Plank Hip Abduction Stride Foot Absolute a Continuous
Side Plank Hip Abduction Balance Foot Absolute a Continuous
Side Plank Hip Abduction Ratio c Continuous
Side Plank Hip Adduction Score Ordinal
Side Plank Hip Adduction Stride Foot Absolute a Continuous
Side Plank Hip Adduction Balance Foot Absolute a Continuous
Side Plank Hip Adduction Ratio c Continuous
Nordic Score Ordinal
Triple Hop Score Ordinal
Tripe Hop Stride Foot (in) Continuous
Triple Hop Balance Foot (in) Continuous
Triple Hop Ratio c Continuous
Vertical Leap Score Ordinal
Vertical Leap Absolute (in) Continuous
In-line Lunge Score Ordinal

59
Table 11 (continued)
Domain Predictor Variable(s) Variable Type
Functional Performance Measures
In-line Lunge Stride Foot (in) Continuous
In-line Lunge Balance Foot (in) Continuous
In-line Lunge Ratio c Continuous
Lateral Lunge Score Ordinal
Lateral Lunge Stride Foot (in) Continuous
Lateral Lunge Balance Foot (in) Continuous
Lateral Lunge Ratio c Continuous
Scapula Dyskinesis Score Ordinal
Note. a Number of repetitions; b Upper extremity ratio is the percentage of throwing arm
versus non-throwing arm; c Lower extremity ratio is the percentage of stride foot versus
balance foot); in = inches; cm = centimeters.
Approach for Specific Aim One
Specific Aim One was to identify individual factors specific to self-reported
outcome measures (as measured by KJOC score), sport performance risk factors (as
measured by game statistics and coaching measures), and FPMs (as measured by scores
from TEAM-S items) that differed between previously injured and uninjured cohorts.
Factors that statistically differed by injury status were retained for additional analysis
(Specific Aim Two) to develop a multifactorial CPM. Through the construction of 2x2
contingency tables we determined the diagnostic utility of individual factors (see Tables 9
– 11) that significantly differed between injured and non-injured cohorts. Individual
factors were binary coded as positive (1) or negative (0) for injury status and
wereexpressed through Bayesian statistics (Sn, Sp, LR+, LR-, and DOR).

60
Approach for Specific Aim Two
Specific Aim Two was to determine whether the individual factors identified in
Specific Aim One collectively would retrospectively predict injury status. Individual
factors were analyzed through forward stepwise logistic regression to determine the best
combination of factors for predicting injury status. The diagnostic utility of the
multifactorial CPM was expressed through Bayesian statistics (Sn, Sp, LR+, LR-, and
DOR).
Variables
Independent variables for this study included predictors from the self-reported
outcome measures, sport performance risk factors, and FPMs. Tables 10 and 11 provide
a detailed list of the independent variables extracted from the self-report outcome
measures, sport performance risk factors, and FPMs as previously described. The
dependent variable for this study was self-reported history of UE SRI and was
categorized as non-injured (0) or injured (1).
Statistical Analyses
After subjects were dichotomously categorized based on UE SRI history to create
two outcome groups (non-injured and injured), we determined which factors would be
included in the CPM by group (non-injured or injured) comparison of each independent
variable using univariate analysis (Specific Aim One). Continuous independent variables
were tested using an independent sample t test. Nominal categorical independent
variables were tested using the Chi-square test. Ordinal scale independent variables were
tested using the Mann-Whitney U test. This approach for univariate analysis has been

61
outlined by Bruce & Wilkerson (2010) and was representative of reported statistical
approaches for CPM development (Hicks et al., 2005; Raney et al., 2009; Teyhen, Flynn,
Childs, & Abraham, 2007). Independent variables with a p-value of ≤ 0.1 were retained
as potential predictor variables for the CPM (Bruce & Wilkerson, 2010a; Hicks et al.,
2005; Raney et al., 2009; Teyhen et al., 2007; Wilkerson et al., 2012). A liberal
significance level was utilized for univariate analysis to ensure appropriate identification
of potential predictor variables for the subsequent multivariate analysis. The purpose of
screening independent variables with a liberal significance level in the derivation phase
of developing a CPM was to identify and retain potential predictive values that may
individually have a weak relationship to the outcome variable but when combined with
other predictive values in a multifactorial model may demonstrate a stronger statistical
relationship to the outcome variable (Bruce & Wilkerson, 2010a).
Secondarily for Specific Aim One, statistically significant continuous variables
were further analyzed by constructing receiver operator characteristic (ROC) curves.
ROC curves were used to establish a cutoff score with the greatest diagnostic utility and
to define a positive risk factor. Once a cutoff score was established for each predictor
variable, each case was coded as positive (1) or negative (0) with respect to the cutoff
score. Contingency tables (2x2) were used to calculate Sn, Sp, LR+, LR-, and DOR with
corresponding 95% confidence intervals (CI) based on the cutoff scores. The cutoff
scores for significant ordinal variables were based on the whole number score of the
injured group. Once a cutoff score was established for each predictor variable, each case
was then coded as positive (1) or negative (0) with respect to the cutoff score.

62
Contingency tables (2x2) were used to calculate Sn, Sp, LR+, LR-, and DOR with
corresponding 95% confidence intervals (CI) based on the cutoff scores. Significant
nominal variables were coded as positive (1) or negative (0) for each case. 2x2
contingency tables were used to calculate Sn, Sp, LR+, LR-, and DOR with
corresponding 95% CI for each respective variable. The purpose of binary coding of
statistically significant predictor variables as positive (1) and negative (0) was to establish
the diagnostic utility of a given factor in relationship to the outcome variable (non-injured
or injured). This allowed for the calculation of the number of true positive, true negative,
false positive, and false negative cases in a 2x2 contingency table and the subsequent
calculation of Sn, Sp, LR+, LR-, and DOR for each predictor variable.
After completing univariate analysis to determine which predictor variables
significantly differed by injury status, a correlational matrix was used to determine
whether similar predictor variables were highly correlated. To minimize
multicollinearity in logistic regression analysis, redundant correlated variables were
eliminated based on the correlational matrix and DOR values prior to generating a final
set of variables for multivariate analysis (Pallant, 2010). Forward step-wise logistic
regression analysis was used to determine which combination of these predictor variables
provided the strongest predictive value of UE SRI history (Specific Aim Two). A priori
significance was set at p ≤ 0.05. The multifactorial CPM of injury status was then
analyzed per case and input into a 2x2 contingency table for the calculation of Sn, Sp,
LR+, LR-, and DOR. Data analysis was performed using IBM® SPSS® V20.0 (SPSS,
Inc., Chicago, IL).

63
CHAPTER IV
RESULTS
The study developed and assessed a preliminary clinical prediction model (CPM)
for upper-extremity (UE) sports related injury (SRI) in a retrospective cohort of collegiate
baseball players. The research design was a single-center retrospective cohort study.
This chapter provides the descriptive data and statistical analyses for each hypothesis.
Participants
A total of thirty-seven Division I baseball players completed the PPE process,
TEAM-S, and KJOC-SES. The baseball players’ data from the TEAM-S and KJOC-SES
were utilized to develop a CPM for UE SRI in collegiate baseball players. One baseball
athlete completed the PPE process and TEAM-S but did not complete the KJOC-SES.
This subject’s data were excluded from the analysis, resulting in a final cohort of 36
participants; (19.5 ±1.0 yrs, 183.3 ± 7.1 cm, 85.6 ± 10.6 kg) with 13.9 ± 3.1 years of
playing experience.
The cohort was comprised of 19 (53%) pitchers and 17 (47%) field position
players. The prevalence of dominant throwing arm SRI in this cohort (33%) was based
on twelve self-reported injuries: five ulnar collateral ligament sprains, three shoulder
impingements, two labium pathologies, and two rotator cuff tendinopathies (see Table
12). Based on this self-reported UE SRI history the cohort was divided dichotomously
into non-injured (n = 24) and injured (n = 12) groups for univariate analyses.

64
Table 12. Self-Reported UE SRI
Pathology Cases (n = 12)
Ulnar Collateral Ligament 5
Shoulder Impingement 3
Labrum 2
Rotator Cuff Tendinopathy 2
Note. UE SRI were for dominant throwing arm.
Self-Reported Outcome Measures
KJOC-SES scores differed significantly (p = .001) between non-injured and
injured players (see Table 13).
Sport Performance Risk Factors
The non-injured group was comprised of eight (22%) pitchers and 16 (44%) field
position players. The injured group was comprised eleven (31%) pitchers and one (3%)
field position player. Chi square analysis of injury status by playing position revealed a
significantly higher (10.92, df = 1, p = 0.001) injury rate for pitchers than expected.
Sport performance risk factors for average game appearances per season (GA) for
pitchers and fielders, average innings pitched per season (IP), average number of pitches
per season (NP), average number of pitches per game appearances per season (NP/GA),
average number of pitches per innings pitched per season (NP /IP), and average at-bats
per season (AB) were not significantly different between the non-injured and injured
groups. Summary data for these variables can be found in Table 13.
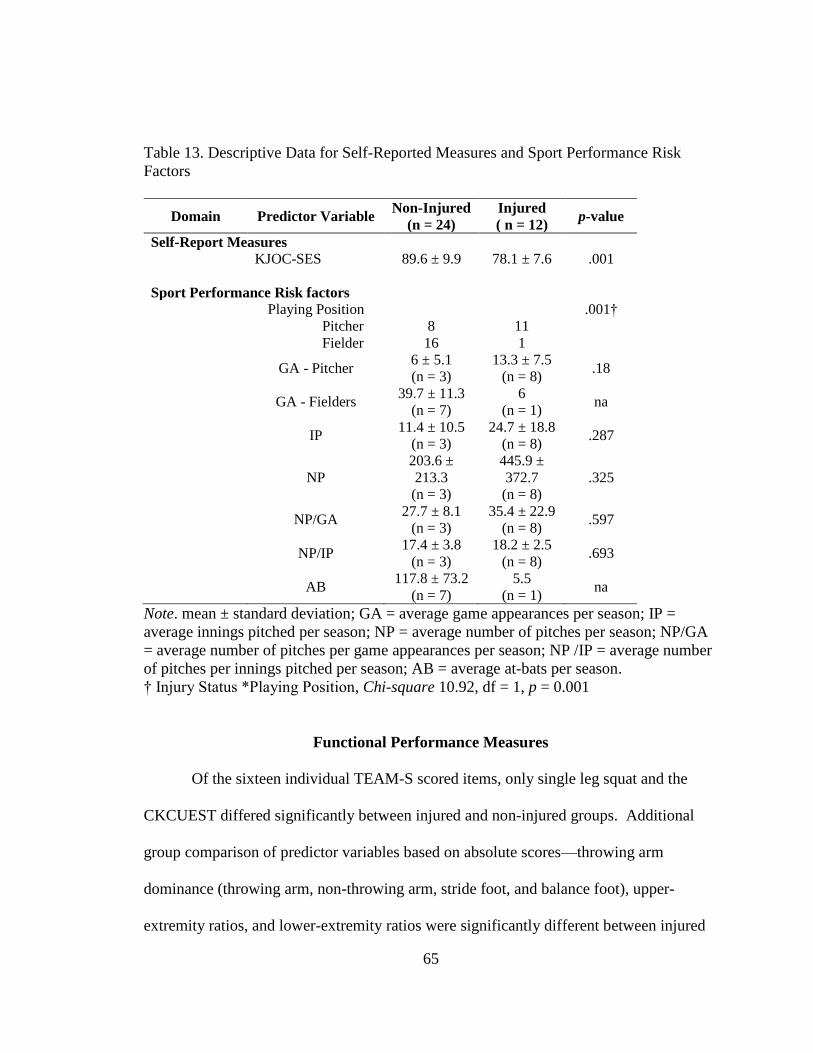
65
Table 13. Descriptive Data for Self-Reported Measures and Sport Performance Risk
Factors
Domain Predictor Variable Non-Injured
(n = 24)
Injured
( n = 12) p-value
Self-Report Measures
KJOC-SES 89.6 ± 9.9 78.1 ± 7.6 .001
Sport Performance Risk factors
Playing Position .001†
Pitcher 8 11
Fielder 16 1
GA - Pitcher
6 ± 5.1
(n = 3)
13.3 ± 7.5
(n = 8) .18
GA - Fielders
39.7 ± 11.3
(n = 7)
6
(n = 1) na
IP
11.4 ± 10.5
(n = 3)
24.7 ± 18.8
(n = 8) .287
NP
203.6 ±
213.3
(n = 3)
445.9 ±
372.7
(n = 8)
.325
NP/GA
27.7 ± 8.1
(n = 3)
35.4 ± 22.9
(n = 8) .597
NP/IP
17.4 ± 3.8
(n = 3)
18.2 ± 2.5
(n = 8) .693
AB
117.8 ± 73.2
(n = 7)
5.5
(n = 1) na
Note. mean ± standard deviation; GA = average game appearances per season; IP =
average innings pitched per season; NP = average number of pitches per season; NP/GA
= average number of pitches per game appearances per season; NP /IP = average number
of pitches per innings pitched per season; AB = average at-bats per season.
† Injury Status *Playing Position, Chi-square 10.92, df = 1, p = 0.001
Functional Performance Measures
Of the sixteen individual TEAM-S scored items, only single leg squat and the
CKCUEST differed significantly between injured and non-injured groups. Additional
group comparison of predictor variables based on absolute scores—throwing arm
dominance (throwing arm, non-throwing arm, stride foot, and balance foot), upper-
extremity ratios, and lower-extremity ratios were significantly different between injured

66
and non-injured for the following variables: single leg squat stride foot, single leg squat
balance foot, shoulder mobility test throwing arm, shoulder mobility test non-throwing
arm, and CKCUEST (absolute score). The TEAM-S total score was not different
between the injured and non-injured groups. Table 14 provides a data summary of all
TEAM-S predictor variables and total scores.
Collectively, univariate analyses identified nine significant (p ≤ 0.10) predictor
variables: KJOC-SES, playing position (pitcher), single leg squat stride foot, single leg
squat balance foot, shoulder mobility test throwing arm, shoulder mobility test non-
throwing arm, CKCUEST (TEAM-S score), and CKCUEST (absolute score).
To determine a discriminatory cutoff score for injured vs. non-injured, receiver
operator characteristic (ROC) curves were constructed for continuous predictor variables.
ROC analysis for KJOC-SES yielded a cutoff score of ≤ 86 and an area under the curve
of 0.854. ROC analysis for CKCUEST (absolute score) yielded a cutoff score of 24 and
an area under the curve of 0.698 (see Appendix E for ROC curves). Cutoff scores were
then used to construct two-by-two (2x2) contingency tables and the subsequent
calculation of diagnostic utility measures of sensitivity (Sn), specificity (Sp), positive
likelihood ratio (LR+), negative likelihood ratios (LR-), and diagnostic odds ratio (DOR).
Tables 15 and 16 provide the 2x2 contingency tables for these predictor variables.
Playing position was a significant predictor variable for injury status. Because
playing position was dichotomously coded into two categories, pitcher or fielder, a 2x2
contingency table was constructed without the necessity of determining a discriminatory
cutoff score. Table 17 provides the 2x2 contingency table for playing position.

67
Table 14. Descriptive Data for TEAM-S Individual Items and Total Score
Domain Predictor Variable
Non-
Injured
(n = 24)
Injured
(n = 12)
p-value
Functional Performance Measures
1 Beighton
Hypermobility
4.7 ± 0.5
(24)
4.5 ± 0.6
(12)
.266
2 Full Squat 4.4 ± 0.9
(24)
4.3 ± 0.9
(12)
1.00
3a Single Leg Squat 4.2 ± 0.6
(24)
4.9 ± 0.2
(12)
.005
3b Single Leg Squat
Stride Foot
4.5 ± 0.6
(24)
4.9 ± 0.2
(12)
.041
3c Single Leg Squat
Balance Foot
4.4 ± 0.6
(23)
4.9 ± 0.2
(12)
.015
4 Downward Dog 2.9 ± 1.2
(24)
3.0 ± 1.3
(12)
.498
5a Active Straight Leg
Raise
3.5 ± 0.7
(24)
3.5 ± 0.5
(12)
.955
5b Active Straight Leg
Raise Stride Foot
3.6 ± 0.7
(24)
3.75 ± 0.5
(12)
.683
5c Active Straight Leg
Raise Balance
Foot
3.5 ± 0.7
(24)
3.5 ± 0.5
(12)
.955
6a Shoulder Mobility
Test
2.3 ± 0.4
(24)
2.7 ± 0.7
(12)
.136
6b Shoulder Mobility
Test Non-
Throwing Arm
2.83 ± 0.5
(24)
3.25 ± 0.4
(12)
.035
6c Shoulder Mobility
Test Throwing Arm 2.3 ± 0.4
(24)
2.8 ± 0.8
(12)
.099
7a Y-Balance for
Upper-Extremity 4.8±0.3
(22)
4.7±0.6
(11)
.668
7b Y-Balance Non-
throwing Arm
(cm)
279.9 ± 20.1
(22)
289.9 ± 21.3
(12) .185
7c Y-Balance
Throwing Arm
(cm)
282.3 ± 20.3
(24)
288.6 ± 21.7
(11) .413
7d Y-Balance Ratiob 1.0 ± 0.0
(22)
1.0 ± 0.1
(11) .949
8a CKCUEST 3.9 ± 0.8
(23)
3.3 ± 0.5
(11) .046

68
Table 14 (continued)
8b CKCUEST
Absolutea
26.0 ± 3.8
(23)
23.8 ± 2.4
(11) .08
9a Side Plank Hip
Abduction
5.0 ± 0.0
(24)
5.0 ± 0.0
(12) 1.00
9b Side Plank Hip
Abduction Stride
Foot Absolutea
54.9 ± 11.6
(24)
54.1 ± 8.8
(12) .837
9c Side Plank Hip
Abduction
Balance Foot
Absolutea
60.6 ± 11.1
(24)
55.75 ± 9.8
(12) .203
9d Side Plank Hip
Abduction Ratio†
0.91 ± 0.1
(24)
0.98 ± 0.1
(12) .187
10a Side Plank Hip
Adduction
5.0 ± 0.0
(24)
4.9 ± 0.2
(12) .157
10b Side Plank Hip
Adduction Stride
Foot Absolutea
53.3 ± 8.7
(24)
48.9 ± 10.2
(12) .184
10c Side Plank Hip
Adduction
Balance Foot
Absolutea
54.5 ± 8.8
(24)
52.1 ± 8.8
(12) .460
10d Side Plank Hip
Adduction Ratioc
0.99 ± 0.1
(24)
0.94 ± 0.1
(12) .463
11 Nordic Hamstring
Test
2.5 ± 0.9
(24)
2.5 ± 0.9
(12) .888
12a Triple Hop for
Distance
4.5 ± 0.5
(24)
4.7 ± 0.4
(11) .420
12b Tripe Hop Stride
Foot (in)
230.2 ± 21.4
(24)
240.5 ± 30.6
(12) .260
12c Triple Hop Balance
Foot (in)
228.0 ± 19.3
(24)
240.4 ± 31.1
(12) .152
12d Triple Hop Ratioc 1.01 ± 0.6
(24)
0.99 ± 0.5
(12) .434
13a Vertical Leap 3.8 ± 0.9
(24)
3.4 ± 1.0
(12) .283
13b Vertical Leap
Absolute (in)
27.0 ± 3.8
(24)
25.4 ± 3.9
(12) .268
14a In-line lunge for
Distance
4.5 ± 0.8
(24)
4.6 ± 0.6
(12) .591
14b In-line Lunge Stride
Foot (in)
51.4 ± 5.3
(24)
50.4 ± 4.2
(12) .559
14c In-line Lunge
Balance Foot (in)
52.2 ± 5.0
(24)
50.8 ± 4.9
(12) .416

69
Table 14 (continued)
14d In-line Lunge Ratio
c 0.98 ± 0.7
(24)
0.99 ± 0.0
(12) .711
15a Lateral Lung for
Distance
4.7 ± 0.4
(24)
4.5 ± 0.5
(12) .460
15b Lateral Lunge Stride
Foot (in)
56.3 ± 4.5
(24)
55.2 ± 4.1
(12) .492
15c Lateral Lunge
Balance Foot (in)
56.6 ± 5.0
(24)
54.4 ± 5.4
(12) .243
15d Lateral Lunge
Ratio†
.99 ± 0.4
(24)
1.01 ± 0.1
(12) .175
16a Qualitative
Dyskinesis
1.1 ± 0.3
(24)
1.1 ± 0.3
(12) .737
16b Scapula Dyskinesis
Non-Throwing
Arm
2.3 ±0.7
(24)
2.5 ±0.6
(12) .798
16c Scapula Dyskinesis
Throwing Arm
2.2 ±0.8
(24)
2.2 ±0.9
(12) .552
Total Score 61.9 ± 3.7
(24)
61.5 ± 4.0
(12) .951
Note. mean ± standard deviation ;Each TEAM-S item is scored on a 6-point rating scale
(0-1-2-3-4-5). The criteria for the rating scale are unique to each item and are specifically
outlined in the TEAM-S scoring sheet; refer to Appendix B. a Number of repetitions; b
Upper extremity ratio is the percentage of throwing arm versus non-throwing arm; c
Lower extremity ratio is the percentage of stride foot versus balance foot); in = inches;
cm = centimeters.
Table 15. 2x2 Contingency Table for KJOC-SES Score
UE SRI
Positive Negative Total
KJOC-SES 86
Positive
86
11
(True positive)
4
(False positive)
15
Negative
> 86
1
(False negative)
20
(True negative)
21
Total 12 24 36

70
Table 16. 2x2 Contingency Table for CKCUEST Absolute Score
UE SRI
Positive Negative Total
CKCUEST Absolute
Score ≤24
Positive
≤ 24
8
(True positive)
7
(False positive)
15
Negative
> 24
3
(False negative)
16
(True negative)
19
Total 11 23 34
Table 17. 2x2 Contingency Table for Playing Position
UE SRI
Positive Negative Total
Playing Position
Pitcher 11
(True positive)
8
(False positive)
19
Fielder 1
(False negative)
16
(True negative)
17
Total 12 24 36
The cutoff scores for significant ordinal predictor variables (single leg squat stride
foot, single leg squat balance foot, shoulder mobility test throwing arm, shoulder mobility test
non-throwing arm, and CKCUEST [TEAM-S score]) were based on the whole number
score of the injured group. Once a cutoff score was established for each predictor
variable, each case was coded as positive (1) or negative (0) and 2x2 contingency tables
were used to calculate Sn, Sp, LR+, LR-, and DOR.
Tables 18, 19, 20, 21, 22, and 23 provide the 2x2 contingency tables for Single
Leg Squat, single leg squat stride foot, single leg squat balance foot, shoulder mobility test
throwing arm, shoulder mobility test non-throwing arm, and CKCUEST (TEAM-S score)
respectively. Table 24 provides a summary of diagnostic utility measures for all
significant predictor variables.

71
Table 18. 2x2 Contingency Table Single Leg Squat - TEAM-S Score
UE SRI
Positive Negative Total
Single Leg Squat
TEAM-S Score
Yes
5
11
(True positive)
10
(False positive)
21
No
≤ 4
1
(False negative)
14
(True negative)
15
Total 12 24 36
Table 19. 2x2 Contingency Table for Single Leg Squat Stride Foot
UE SRI
Positive Negative Total
Single Leg Squat
Stride Foot
Yes
5
11
(True positive)
14
(False positive)
25
No
≤ 4
1
(False negative)
10
(True negative)
11
Total 12 24 36
Table 20. 2x2 Contingency Table for Single Leg Squat Balance Foot
UE SRI
Positive Negative Total
Single Leg Squat
Balance Foot
Yes
5
11
(True positive)
12
(False positive)
23
No
≤ 4
1
(False negative)
12
(True negative)
13
Total 12 15 36
Table 21. 2x2 Contingency Table for Shoulder Mobility Test Throwing Arm
UE SRI
Positive Negative Total
Shoulder Mobility
Test Throwing
Arm
Yes
≥ 3
7
(True positive)
9
(False positive)
16
No
< 3
5
(False negative)
15
(True negative)
20
Total 12 24 36

72
Table 22. 2x2 Contingency Table for Shoulder Mobility Test Non-Throwing Arm
UE SRI
Positive Negative Total
Shoulder Mobility
Test Non-
Throwing Arm
Yes
≥ 3
12
(True positive)
18
(False positive)
30
No
< 3 (0.5)
a
(False negative)
6
(True negative)
6
Total 12 24 36
Note. a
The actual false negative rate for the shoulder mobility test non-throwing arm is
zero. The calculation of diagnostic utility measures requires a numerical value for each
cell within the contingency table. To resolve this issue, 0.5 is substituted for zero.
Table 23. 2x2 Contingency Table for CKCUEST - TEAM-S Score
UE SRI
Positive Negative Total
CKCUEST -
TEAM-S Score
Yes
≤ 3
7
(True positive)
7
(False positive)
14
No
≥ 4
4
(False negative)
16
(True negative)
20
Total 12 23 34

73
Table 24. Diagnostic Utility Values of Significant Predictor Variables
Predictor Variable Sensitivity
a Specificity LR+ LR- DOR
Continuous
KJOC-SES 86 0.91
(0.64-0.98)
0.83
(0.64-0.93)
5.5
(2.2-13.6)
0.10
(0.01-0.65)
55.0
(5.4-554.9)
CKCUEST (absolute) ≤ 24 0.72
(0.43-0.84)
0.69
(.49-.84)
2.3
(1.1-4.8)
0.39
(0.14-1.06)
6.0
(1.2-30.0)
Categorical
Playing Position (pitcher) 0.91
(0.64-0.98)
0.66
(0.46-0.82)
2.7
(1.5-4.9)
0.12
(0.01-0.83)
22.0
(2.3-201.7)
Ordinal
Single Leg Squat -
TEAM-S Score
0.91
(0.64-.98)
0.58
(0.38-0.75)
2.2
(1.3-3.6)
0.14
(0.02-0.96)
15.4
(1.7-139.2)
Single Leg Squat
Stride Foot
0.91
(0.64-0.98)
0.41
(0.24-0.61)
1.5
(1.0-2.2)
0.2
(0.02-1.3
7.85
(0.8-71.0)
Single leg Squat Balance Foot 0.91
(0.64-0.98)
0.5
(0.31-0.68)
1.8
(1.1-2.8)
0.16
(0.02-1.1)
11.0
(1.2-99.0)
Shoulder Mobility Test
Throwing Arm
0.58
(0.31-0.80)
0.62
(.42-0.78)
1.5
(0.7-3.1)
0.66
(0.31-1.3)
2.33
(0.5-9.5)
Shoulder Mobility Test
Non-Throwing Arm
0.96
(0.70-0.99)
0.25
(0.12-0.44)
1.2
(0.99-1.6)
0.16
(0.01-2.6)
8.0
(0.4-156.8)
CKCUEST-TEAM S 0.63
(0.35-0.84)
0.69
(0.49-0.84)
2.0
(0.9-4.4)
0.52
(0.17-1.14)
4.0
(0.8-18.2)
Note. a Value (95% Confidence Interval); LR+ = positive likelihood ratio; LR- = negative likelihood ratio;
DOR = diagnostic odds ratio

74
Clinical Prediction Model
Specific Aim Two of this study was to determine whether the individual factors
related to self-reported outcome measures, sport performance risk factors statistics, and
FPMs identified in Specific Aim One would retrospectively predict injury status in a
Clinical Prediction Model (CPM). Within the set of identified risk factor variables,
duplication existed among (a) single leg squat, single leg squat stride foot, and single leg
squat balance foot, (b) shoulder mobility test throwing arm and shoulder mobility test
non-throwing arm, and (c) CKCUEST (TEAM-S score) and CKCUEST (absolute score).
Given the relatively low n of the study and the large number (n = 9) of predictor
variables, a correlational analyses was performed to determine collinearity of
similarpredictor variables (see Table 25). Single leg squat was correlated with the single
leg squat stride foot (p 0.0001; r = 0.846) and the single leg squat balance foot (p
0.0001; r = 0.904). Shoulder mobility test throwing arm and shoulder mobility test non-
throwing arm also were correlated (p = 0.009; r = 0.943). CKCUEST (TEAM-S score)
and CKCUEST (absolute score) had a significant (p 0.0001) and very strong positive
correlation (r = 0.901). Based on these correlational analyses and DOR values, we
elected to only retain the single leg squat, shoulder mobility test throwing arm, and
CKCUEST (absolute score) for multivariate analysis. Thus, KJOC-SES, playing position,
single leg squat, shoulder mobility test throwing arm, and CKCUEST (absolute score)
variables were used in a forward step-wise logistic regression to retrospectively predict
injury status in the cohort of 36 collegiate baseball players.

75
Table 25. Correlational Matrix for Predictor Variables
Variable‡ SLS
SLS
SF
SLS
BL
SHMT
TA
SHMT
NTA
CKCUEST
TEAM-S
CKCUEST
(absolute)
SLS
Pearson r 1
Sig. (2-
tailed)
n 36
SLS SF
Pearson r .846**
1
Sig. (2-
tailed) .000
n 36 36
SLS BL
Pearson r .904**
.685**
1
Sig. (2-
tailed) .000 .000
n 36 36 36
SHMT TA
Pearson r .367* .284 .428
** 1
Sig. (2-
tailed) .028 .093 .009
n 36 36 36 36
SHMT
NTA
Pearson r .039 -.031 .049 .431**
1
Sig. (2-
tailed) .821 .857 .775 .009
n 36 36 36 36 36
CKCUEST
TEAM-S
Pearson r -.202 -.076 -.249 -.172 .103 1
Sig. (2-
tailed) .251 .671 .156 .330 .562
n 34 34 34 34 34 34
CKCUEST
(absolute)
Pearson r -.177 -.151 -.187 -.213 .057 .901**
1
Sig. (2-
tailed) .318 .395 .290 .227 .751 .000
n 34 34 34 34 34 34 34
Note. ‡SLS = Single Leg Squat; SLS SF = Single Leg Squat Stride Foot; SLS BF =
Single Leg Squat Balance Foot; SHMT TA = Shoulder Mobility Test Throwing Arm;
SHMT NTA = Shoulder Mobility Test Non-Throwing Arm; **Correlation is significant
at the 0.01 level; * Correlation is significant at the 0.05 level.

76
The resultant model included two predictor variables; playing position and KJOC-SES.
Table 26 provides the logistic regression prediction for UE SRI. A test of the full model
against a constant-only model was significant (Chi square = 22.4, p < 0.0001; df = 2).
Table 26. Logistic Regression Prediction of UE SRI
Variables in the Equation
B S.E. Wald df Sig. Odds Ratio
95% C.I. for
Odds Ratio
Lower Upper
Step 1a Playing
Position 3.129 1.143 7.502 1 .006 22.85 2.435 214.555
Constant -2.773 1.031 7.235 1 .007 .06
Step 2b Playing
Position 5.002 2.127 5.532 1 .019 148.63 2.301 9599.488
KJOC -.179 .076 5.593 1 .018 .83 .721 .970
Constant 10.817 5.223 4.289 1 .038 49883.39
Note. aVariable(s) entered on step 1: Playing Position;
bVariable(s) entered on step 2:
KJOC; Final model contained two-factors, Playing Position and KJOC-SES.
The full model explained between 48.1% (Cox and Snell R2) and 67.2%
(Nagelkerke’s R2) of the variance in injury status, and correctly classified 85.3% of the
cases (81.8% for injured and 87% for non-injured). The strongest predictor for reported
UE SRI was playing position with pitcher having an odds ratio of 148. This indicates
that pitchers were 148.6 times more likely to report an UE SRI. An odds ratio of 0.84 for
KJOC-SES (i.e., <1) indicated that for every point lower scored on the KJOC-SES,
baseball players were 0.16 times more likely to report a UE SRI.

77
A 2x2 contingency table for the two-factor statistical model derived from logistic
regression was constructed (see Table 27) with the diagnostic utility measures for the
model presented in Table 28. The KJOC-SES based on the cutoff score of 86 and
playing position (pitcher) were applied to the original raw data (n = 36). Cases which
met both KJOC-SES (≤ 86) and playing position (pitcher) were coded as positive (1)
while all other cases were coded as negative (0). A 2x2 contingency table based on the
application of these predictive factors was constructed (see Table 29). The corresponding
diagnostic utility values for the CPM are presented in Table 28.
Table 27. 2x2 Contingency Table for Two-Factor Statistical Model
UE SRI
Positive Negative Total
Two-Factor Statistical Model
Yes
9
(True positive)
2
(False positive)
11
No
3
(False negative)
20
(True negative)
23
Total 12 22 34
Note. The data reflects a two-factor statistical model derived from forward step-wise
logistic regression and was comprised of KJOC-SES and Player Position. For the logistic
regression analysis, KJOC-SES data were retained in a continuous variable state, while
Player Position was binary coded as pitcher (1) and fielder (0).
Table 28. Diagnostic Utility Values of Two-Factor Models
Model Sensitivity Specificity LR+ LR- DOR
Statistical
Model
0.75
(0.42.- 0.94)
0.90
(0.70-.98)
8.25
(2.1-32.1)
0.27
(0.1-0.74)
30.0
(4.2-211.8)
CPM 0.83
(0.55 - 0.95)
0.95
(0.79 -0.99)
22.0
(2.88-138.5)
0.17
(0.04-0.61)
115.0
(9.32-1418.8)
Note. Value with 95% Confidence Interval; LR+ = positive likelihood ratio; LR- =
negative likelihood ratio; DOR = diagnostic odds ratio

78
Table 29. 2x2 Contingency Table for Two-Factor CPM
UE SRI
Positive Negative Total
Two-Factor CPM
Yes
10
(True positive)
1
(False positive)
11
No
2
(False negative)
23
(True negative)
25
Total 12 24 36
Note. The data reflect a two-factor CPM comprised of the predictor variables KJOC-SES
(≤ 86) and Playing Position (pitcher).

79
CHAPTER V
DISCUSSION
Baseball is a popular international sport played on youth, high school, collegiate,
and professional levels. Over the past decade there has been a disproportional rise in
serious upper-extremity (UE) sports related injury (SRI) necessitating surgery (Petty et
al., 2004). This trend has led to a call for further clarification of the relationship between
risk factors and injury (McHugh et al., 2012). Understanding the relationship between
risk factors and UE SRI is complex because most athletes who sustain injury present with
multiple risk factors (Petty et al., 2004). Although a number of baseball-specific risk
factors have been independently described (Fleisig et al., 2010; Hootman et al., 2007;
Olsen et al., 2006; Wilk et al., 2010), a multifactorial model has not been developed to
aid in the clinical diagnosis of UE SRI. The collective inclusion of risk factors based on
self-reported outcome measures (Domb et al., 2010; Neuman et al., 2011; Thigpen &
Shanley, 2011), sport performance risk factors (Fleisig et al., 2010; Olsen et al., 2006),
and functional performance measures (FPM) (G. Cook et al., 2006a, 2006b; G. Cook et
al., 2010; Kiesel et al., 2007) may be important in establishing a clinical prediction model
(CPM) specific to the baseball population. Furthermore, the recent emphasis on the
evidence-based practice paradigm in athletic training (BOC, 2010; NATA, 2010)
demands consideration of research models that advance patient-oriented clinical practice
(Snyder et al., 2008; Valovich McLeod et al., 2008). A CPM that includes patient-

80
oriented outcome measures may be advantageous in clarifying the relationship between
risk factors and baseball specific UE SRI. Thus the purpose of this study was to develop
and assess a preliminary CPM for UE SRI in a retrospective cohort of collegiate baseball
players. The CPM was derived from injury risk factors specific to self-reported outcome
scores, sport performance, and FPM. The main finding of our study was that a two-factor
CPM which included player position and a self-reported outcome measure score
retrospectively predicted UE SRI in a cohort of collegiate baseball players.
Specific Aim One
Hypothesis one was accepted as KJOC-SES, playing position, single leg squat
(Team-S score), squat leg squat stride foot, single leg squat balance foot, shoulder
mobility test throwing arm, shoulder mobility test non-throwing arm, CKCUEST
(TEAM-S score), and CKCUEST (absolute score) were each independently significant
retrospective predictor variables of UE SRI in a cohort of college baseball players.
Self-Reported Outcome Measures
The KJOC-SES previously has been employed as a population-appropriate self-
report outcome measure for baseball players (Alberta et al., 2010; Domb et al., 2010;
Neri et al., 2010; Neuman et al., 2011). Our reported KJOC-SES values for injured and
non-injured athletes were consistent with previously reported scores. Table 30 provides a
details summary of KJOC-SES values for this study and previous investigations.
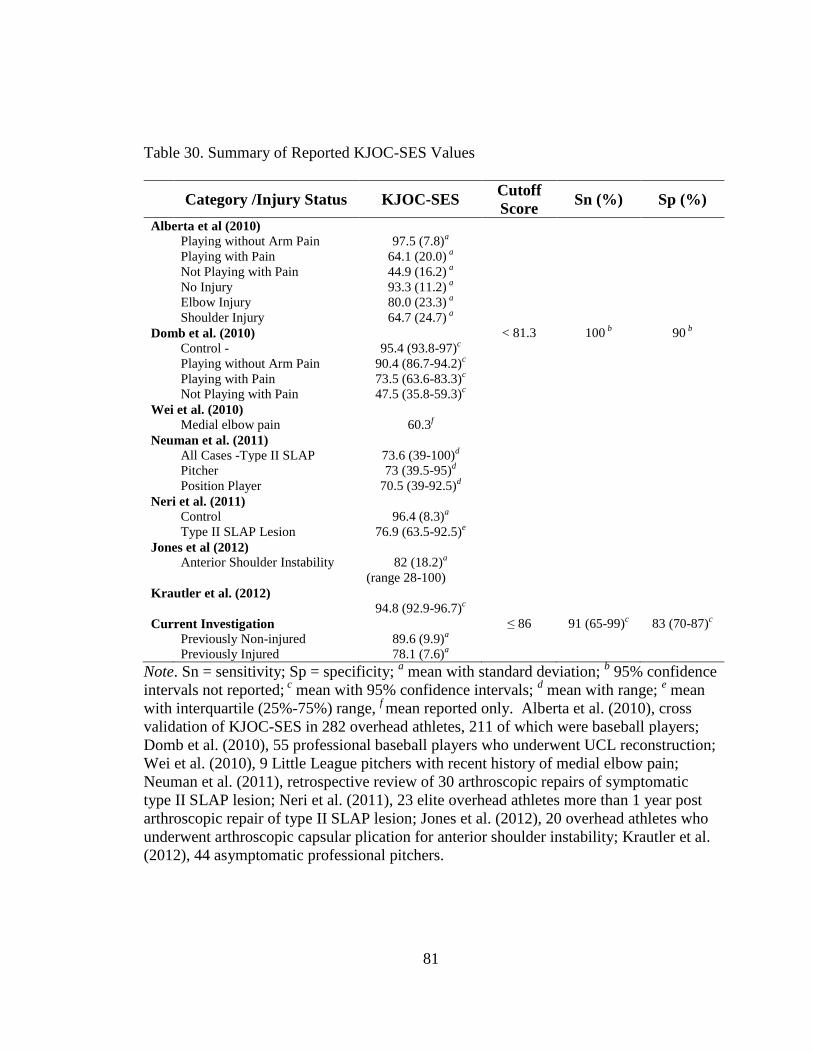
81
Table 30. Summary of Reported KJOC-SES Values
Category /Injury Status KJOC-SES
Cutoff
Score Sn (%) Sp (%)
Alberta et al (2010)
Playing without Arm Pain 97.5 (7.8)a
Playing with Pain 64.1 (20.0) a
Not Playing with Pain 44.9 (16.2) a
No Injury 93.3 (11.2) a
Elbow Injury 80.0 (23.3) a
Shoulder Injury 64.7 (24.7) a
Domb et al. (2010) < 81.3 100 b 90
b
Control - 95.4 (93.8-97)c
Playing without Arm Pain 90.4 (86.7-94.2)c
Playing with Pain 73.5 (63.6-83.3)c
Not Playing with Pain 47.5 (35.8-59.3)c
Wei et al. (2010)
Medial elbow pain 60.3f
Neuman et al. (2011)
All Cases -Type II SLAP 73.6 (39-100)d
Pitcher 73 (39.5-95)d
Position Player 70.5 (39-92.5)d
Neri et al. (2011)
Control 96.4 (8.3)a
Type II SLAP Lesion 76.9 (63.5-92.5)e
Jones et al (2012)
Anterior Shoulder Instability 82 (18.2)a
(range 28-100)
Krautler et al. (2012)
94.8 (92.9-96.7)c
Current Investigation ≤ 86 91 (65-99)c
83 (70-87)c
Previously Non-injured 89.6 (9.9)a
Previously Injured 78.1 (7.6)a
Note. Sn = sensitivity; Sp = specificity; a mean with standard deviation;
b 95% confidence
intervals not reported; c mean with 95% confidence intervals;
d mean with range;
e mean
with interquartile (25%-75%) range, f mean reported only. Alberta et al. (2010), cross
validation of KJOC-SES in 282 overhead athletes, 211 of which were baseball players;
Domb et al. (2010), 55 professional baseball players who underwent UCL reconstruction;
Wei et al. (2010), 9 Little League pitchers with recent history of medial elbow pain;
Neuman et al. (2011), retrospective review of 30 arthroscopic repairs of symptomatic
type II SLAP lesion; Neri et al. (2011), 23 elite overhead athletes more than 1 year post
arthroscopic repair of type II SLAP lesion; Jones et al. (2012), 20 overhead athletes who
underwent arthroscopic capsular plication for anterior shoulder instability; Krautler et al.
(2012), 44 asymptomatic professional pitchers.

82
The KJOC-SES values with respect to UE SRI have been validated primarily
through retrospective descriptive studies (Alberta et al., 2010; Domb et al., 2010; Hsu et
al., 2009; Neri et al., 2010; Neuman et al., 2011). In asymptomatic overhead athletes,
KJOS-SES scores were reported to range from 94.4 to 96.4 (Alberta et al., 2010; Domb et
al., 2010; Kraeutler et al., 2012; Neri et al., 2010). Albert et al. (2010) reported mean
KJOC-SES ranging from 64.7 (elbow) to 80.0 (shoulder) in those with a positive history
of injury. In overhand athletes who underwent arthroscopic repair of Type II SLAP
lesions, KJOC-SES scores ranged from 76.9 (Neri et al., 2010) to 73.6 (Neuman et al.,
2011). In overhand athletes who underwent arthroscopic capsular plication for
microtraumatic anterior shoulder instability had average KJOC-SES scores of 82 (Hsu et
al., 2009). In professional baseball players who had undergone UCL reconstruction
KJOC-SES scores ranged from 47.5 (not playing because of arm pain) to 90.4 (playing
without arm pain) with a cutoff score of <81.3 (Domb et al., 2010). In Little League
pitchers with medial elbow pain the KJOC-SES score averaged 60.3 (Sweitzer et al.,
2012). Our KJOC-SES values were 89.6 (non-injured) and 78.1 (injured) with a
discriminatory threshold of <86 identifying athletes with a positive UE SRI history.
Thus, the KJOC-SES scores from this study were consistent with previously reported
values (Alberta et al., 2010; Domb et al., 2010; Neri et al., 2010).
In the current study, KJOC-SES values had the strongest individual diagnostic
utility (see Table 24) of all measures assessed. A KJOC-SES threshold score of ≤ 86
(positive test) yielded high Sn of 91% and Sp of 83%. A Sn of 91% indicates a high
probability of a positive test (KJOC-SES ≤ 86) in athletes with a history of UE SRI.

83
Conversely, a KJOC-SES score of >86 (negative test) with a Sn of 88% indicates a high
probability of a negative score in athletes without a history of UE SRI. Collectively,
KJOC-SES, Sn, and Sp demonstrate a very low false negative and slightly higher false
positive (see Table 15).
Corresponding KJOC-SES likelihood ratios were LR+ = 5.5; LR- = 0.1. An LR+
>5 is interpreted as a moderate, important shift in pre-test to post-test probability while a
LR- ≤0.1 yields a large, conclusive shift (Glynn & Weisbach, 2011; Guyatt et al., 2008).
The interpretation of likelihood ratios for the KJOC-SES reiterates that a positive test
(KJOC-SES ≤ 86) produced moderate diagnostic utility as an individual predictor of UE
SRI. Based on our UE SRI prevalence of 33% (pre-test odds), a positive test (KJOC-SES
≤86) shifts the post-test probability to approximately 75%. A negative test (KJOC-
SES>86) shifts the pre-test probability of 33% to a post-test probability of < 3%. These
shifts in probability based on a KJOC-SES cutoff score of ≤ 86 indicate that both positive
and negative test results provide greater clarity in the diagnostic screening of UE SRI.
Figure 4 provides a representation of Fagan’s nomogram based on our pretest probability
for UE SRI and the associated likelihood ratios for the KJOC-SES.
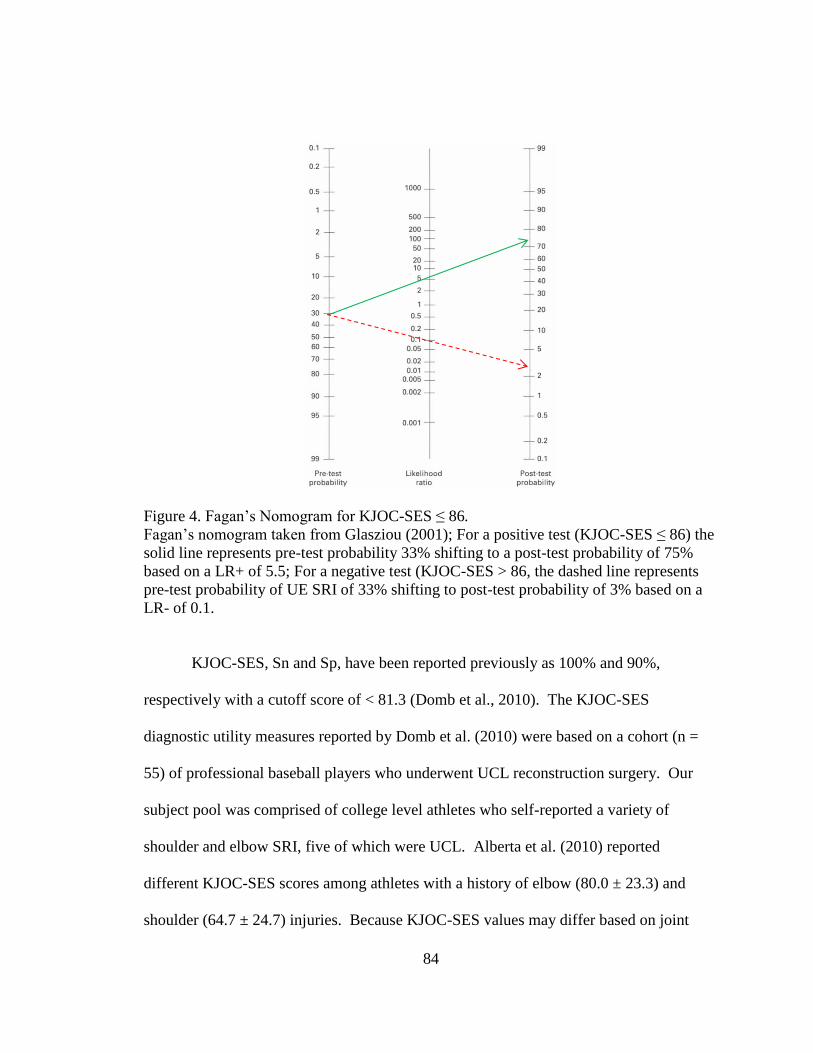
84
Figure 4. Fagan’s Nomogram for KJOC-SES ≤ 86.
Fagan’s nomogram taken from Glasziou (2001); For a positive test (KJOC-SES ≤ 86) the
solid line represents pre-test probability 33% shifting to a post-test probability of 75%
based on a LR+ of 5.5; For a negative test (KJOC-SES > 86, the dashed line represents
pre-test probability of UE SRI of 33% shifting to post-test probability of 3% based on a
LR- of 0.1.
KJOC-SES, Sn and Sp, have been reported previously as 100% and 90%,
respectively with a cutoff score of < 81.3 (Domb et al., 2010). The KJOC-SES
diagnostic utility measures reported by Domb et al. (2010) were based on a cohort (n =
55) of professional baseball players who underwent UCL reconstruction surgery. Our
subject pool was comprised of college level athletes who self-reported a variety of
shoulder and elbow SRI, five of which were UCL. Alberta et al. (2010) reported
different KJOC-SES scores among athletes with a history of elbow (80.0 ± 23.3) and
shoulder (64.7 ± 24.7) injuries. Because KJOC-SES values may differ based on joint

85
specificity, it is difficult to provide a direct comparison of our KJOC-SES diagnostic
utility values with previously reported values. Indirectly, our data appear consistent with
Domb et al. (2010).
Collectively, the diagnostic utility of the KJOC-SES ≤ 86 cutoff was clinically
useful in delineating between injured and non-injured athletes based on retrospective
analysis of UE SRI. The combination of a very low false negative rate, high Sn, and low
LR- suggests that the KJOC-SES, as a stand-alone clinical measurement, may be an
excellent diagnostic screening tool in predicting UE SRI.
Sport Performance Risk Factors
Playing position was the only significant sport performance risk factor in
distinguishing injured and non-injured groups, as pitchers had higher self-reported UE
SRI rates compared to fielders (see Table 13). This finding was consistent with existing
evidence that UE SRI rates are higher among pitchers than field position players
(Chambless et al., 2000; Fleisig et al., 2010; Kerut et al., 2008; Olsen et al., 2006).
Playing position yielded low to moderate diagnostic utility as an individual
predictor variable for UE SRI. Playing position, coded positive test (pitcher) and
negative test (fielder) had a high Sn of 91% but a moderate Sp of 66%. Furthermore, it is
important to recognize that playing position as a diagnostic screening measure was
associated with a low false negative rate (2.7%) but a high false positive rate (22.2%).
This suggests that a positive result (pitcher) over-identified the presence of UE SRI in
non-injured athletes. Subsequently, in the context of a high Sn and moderate Sp, a
negative test (fielder) was more valuable at ruling out the probability of an UE SRI.

86
The likelihood ratios for playing position were LR+ = 2.75; LR- = 0.12. An LR+
between 2 and 5 is interpreted as having a small but sometimes important shift in pre-test
to post-test probability while a LR- between 0.1 and 0.2 yields a moderate, important
shift (Glynn & Weisbach, 2011; Guyatt et al., 2008). The interpretation of likelihood
ratios by playing position demonstrates that a positive test (pitcher) produced low
diagnostic utility as an individual predictor variable for UE SRI. Based on our UE SRI
prevalence of 33.3% (pre-test odds), a positive test shifts the post-test probability to
47.8%. Conversely, a negative test (fielder) shifted the pre-test probability from 33% to a
post-test probability of 3.8%. These shifts in probability based on playing position
indicate that a negative test (fielder) provided greater diagnostic clarity versus a positive
test (pitcher). Figure 5 provides a representation of Fagan’s nomogram based on our
pretest probability for UE SRI and the associated likelihood ratios for playing position.
Collectively, pitchers had a higher injury rate than fielders. However, the
diagnostic utility of playing position provides low predictive value in relationship to UE
SRI history. This conclusion is based on two important factors. First, a high false
positive rate overestimates the presence of UE SRI. Second, due to the high Sn and
moderate Sp, a negative test (fielder) provides a stronger prediction of not having an UE
SRI versus having a history of UE SRI. Generally, diagnostic tests with high Sn are
useful in identifying people without a target condition because of a very low false
negative rate (Jewell, 2011).

87
Figure 5. Fagan’s Nomogram for Playing Position.
Fagan’s Nomogram taken from Glasziou (2001);For a positive test (pitcher), the solid
line represents a pre-test probability of 33% shifting to post-test probability of
approximately 47.82% based on a LR+ of 2.75; For a negative test (fielder), the dashed
line represents a pre-test probability of 33.3% shifting to a post-test probability of 3.8%
based on a LR- of 0.12.
The diagnostic utility of playing position is an illustrated case of the mnemonic
“SnNout”: high Sensitivity, a Negative test rules out the diagnosis (Portney & Watkins,
2009; Sackett et al., 1997). The interpretation of Sn often seems counterintuitive in
clinical practice. Diagnostic measures with high Sn are useful in identifying people
without a target condition because of their very low false negative rate. Logically it may
be assumed that a positive test result would translate as ruling in the presence of a target
condition. However, Sn does not account for false positive results. Sn must be viewed in
the context of Sp which does account for false positive test results. Thus, when

88
adiagnostic test with a high Sn yields a negative test result, there is greater certainty in
ruling out the target condition. Despite pitchers having a higher injury rate than fielders,
playing position as a diagnostic utility measure provides greater clinical interpretive
value when negative (fielder coded as negative).
The remaining sport performance risk factors of average game appearances per
season (GA) for pitchers and fielders, average innings pitched per season per season (IP),
average number of pitches per season (NP), average number of pitches per game
appearances per season (NP/GA), average number of pitches per innings pitched per
season (NP/IP), and average at-bats per season (AB) did not differ between the non-
injured and injured groups. Theses finding are contrary to the reported link between
select sport performance variables and UE SRI. Specifically, throwing volume as
measured through IP, NP, GA has been reported as a primary predisposing risk factor for
UE SRI (Bradbury & Forman, 2012; Fleisig et al., 2010; Kohlmeyer, 2005; Olsen et al.,
2006). Throwing volume is a distinct sport-related extrinsic risk factor that contributes to
acute and overuse UE SRI (Fleisig et al., 2010; Lockard, 2006; Olsen et al., 2006).
Subsequently, injury prevention strategies universally center on restricting IP, NP, and
GA (Andrews & Fleisig, 1998; Fleisig et al., 2010; Fleisig & Andrews, 2012; Fleisig,
Weber, Hassell, & Andrews, 2009; Olsen et al., 2006; Sciascia & Kibler, 2006). Thus we
included measures of throwing volume as sport performance risk factors to parallel the
recent work of Olson et al. (2006) and Fleisig et al. (2010). However, the current
investigation did not support the relationship between UE SRI and throwing volume
based on the sport performance measures of GA, IP, NP, NP/GA, NP/IP, or AB.

89
The inability of using sport performance measures of GA, IP, NP, NP/GA, NP/IP,
or AB to predict UE SRI in our study may have been due to a number of factors. First,
our sample size may have been too small to provide the statistical power necessary to
determine whether a difference existed between injured versus non-injured athletes.
Second, the retrospective availability of individual game-by-game statistics was not
equitable for all subjects across groups. Individual game-by-game statistics were only
available for 11 of the 19 (58%) pitchers and eight of 17 (47%) fielders. This was
attributed to redshirt or first year players who had not yet participated in games to
generate game-by-game statistics. Third, the use of game play statistical data to establish
injury risk has only been demonstrated in a retrospective case with a control group design
(Olsen et al., 2006) and a 10-year prospective cohort design using adolescent baseball
players (Fleisig et al., 2010). Ultimately, the relationship between game play statistics
and injury risk remains to be established for collegiate and professional baseball
populations.
Functional Performance Measures
FPMs were obtained through the Targeted Enhanced Athletic Movement Screen
(TEAM-S) global battery of physical performance measures. The TEAM-S composite
score did not differ between injured and non-injured groups. This contradicts findings
that an FPM battery (e.g., FMS™) could predict prospectively serious injury in
professional football players (Kiesel et al., 2007). However, more recently a growing
body of evidence has called into question the validity of FPM batteries to predict injury
in active military service members (Teyhen et al., 2012) and collegiate athletes (Winke,

90
Dalton, Mendell, & Nicchi, 2012). It is believed that individual functional performance
test scores derived from an FPM battery may be more predictive of specific injury types
than a composite FPM score (Winke et al., 2012). The absence of a significant TEAM-S
composite score supports an emerging body of evidence that questions the validity of
composite FPM scores in predicting those at risk of injury.
From the individual measures that comprise the TEAM-S battery, a compilation
of 45 individual predictor variables (see Table 14), only seven differed significantly
between non-injured players and those with UE SRI: (a) single leg squat (TEAM-S), (b)
single leg squat stride foot, (c) single leg squat balance foot, (d) shoulder mobility test-
throwing arm, (e) shoulder mobility test- non-throwing arm, (f) CKCUEST (TEAM-S),
and (g) CKCUEST (absolute score).
Single Leg Squat
The measures of single leg squat (TEAM-S), single leg squat stride foot, and
single leg squat balance foot were considered qualitative measures of dynamic
lumbopelvic control during a unilateral squat (see Appendix B). The injured group
scored higher in all three measures versus the non-injured group. This finding contradicts
the common assumption that injured athletes typically present with balance deficits
compared to non-injured athletes (Hrysomallis, 2011). Previous investigations have
demonstrated a relationship between lower balance scores with respect to pitching
performance (Chaudhari, McKenzie, Borchers, & Best, 2011; Hrysomallis, 2011; Marsh,
Richard, Williams, & Lynch, 2004). However, a relationship between lower extremity
balance and UE injury rates has not been found (Chaudhari et al., 2011; Donatelli et al.,

91
1999). Because of this evidence, it is unknown why our data demonstrated higher single
leg squat scores in the injured group.
Single leg squat (TEAM-S), single leg squat stride foot, and single leg squat
balance foot collectively demonstrated poor diagnostic utility (see Table 24). All three
measures yielded the same Sn of 91% (95% CI 64 - 98) with Sp values ranging from 41%
(95% CI 24 – 61) to 58% (95% CI 38 - 75). Although these Sn and Sp values are
representative of established orthopedic special tests (C.E. Cook & Hegedus, 2013), all
three measures present with high false positive rates ranging between 27.7 to 36% (see
Tables 18, 19, and 20).
The likelihood ratios ranges for the three single leg squat measures are LR+ = 1.5
to 2.2 and LR- = 0.1.4 to 0.2; they provide very small diagnostic utility and are clinically
irrelevant. The single leg squat (Team-S) yielded higher quality likelihood ratios
compared to single leg squat stride foot and single leg squat balance foot with an LR+ =
2.2 and an LR- = 0.14. Based on our UE SRI prevalence of 33.3% (pre-test odds), a
positive test (score of 5) shifts the post-test probability to 42.8%, while a negative test
(score ≤4) shifts the post-test probability to 4.4%. These shifts in probability are of little
help in making clinical decisions about injury status.
Collectively, single leg squat (TEAM-S), single leg squat stride foot, and single
leg squat balance foot are confounding positive findings with respect to common clinical
thinking. The diagnostic utility of the measures are characterized by high false positive
rates, moderate Sp, and low LRs. As stand-alone diagnostic screening measures, single

92
leg squat measures demonstrate significant values in delineating between injured and
non-injured, but in a clinical context do not provide substantial diagnostic utility.
Shoulder Mobility Test
Specific adaptations in passive and active range of motion (ROM) patterns have
been reported for overhead throwing athletes. Passive external rotation (ER) and internal
rotation (IR) at 90° abduction in the throwing shoulder have been measured between 128
and 142°, and between 55 and 68° respectively, compared to 119 to 135° and 68 to 78° in
the non-throwing shoulder (Borsa et al., 2006; Borsa et al., 2005; Crockett et al., 2002;
Lintner, Mayol, Uzodinma, Jones, & Labossiere, 2007). This loss of IR has been termed
glenohumeral internal rotation deficit (GIRD) and is hypothesized to result in greater
forces being absorbed by the shoulder and/or elbow complex. Although GIRD has been
identified in those with UE SRI (Bach & Goldberg, 2006; Laudner, Sipes, & Wilson,
2008; Lintner et al., 2007; Tokish, Curtin, Kim, Hawkins, & Torry, 2008), the current
study did not include direct glenohumeral joint ROM measures. Instead, the shoulder
mobility test provided a dynamic assessment of UE ROM (see Appendix B), which
revealed no significant difference in shoulder mobility test scores between the throwing
and non-throwing arm. This finding contradicts the reported adaptive ROM patterns
specific to throwing athletes that result in ROM asymmetry between dominant and non-
dominant throwing arms. Unexpectedly, we found lower shoulder mobility test scores in
the throwing arm than in the non-throwing arm irrespective of UE SRI status. Again, this
finding contradicts evidence indicating a loss of glenohumeral ROM, particularly GIRD,

93
is related to an increased risk of UE SRI. Additionally, our finding seems to indicate that
the shoulder mobility test may not be a valid ROM measure for baseball players.
Typically the ROM values of the dominant arm are used as a risk factor for UE
SRI. However, diagnostic utility measures of the shoulder mobility test scores (≥ 3) were
stronger for the non-throwing arm (albeit low quality) than the throwing arm (see Table
24). A positive shoulder mobility test non-throwing arm score (≥ 3) yielded zero false
negative test results but a 50% false positive rate (see table 22). The diagnostic utility
measures for shoulder mobility test non-throwing arm (≥ 3) yielded a very high Sn
(96%), very low Sp (25%) and very small, clinically irrelevant likelihood ratios with
overlapping 95% confidence intervals (see Table 24). A high Sn and low Sp may
initially appear to be clinically valuable; however, overlapping likelihood ratios render
the shoulder mobility test non-throwing arm (≥ 3) clinically useless as an individual
screening tool for UE SRI.
Current data collectively indicate that ROM as an injury risk factor in baseball
players should not be assessed dynamically as is the shoulder mobility test. Our shoulder
mobility test throwing arm and shoulder mobility test non-throwing arm scores resulted
in an atypical statistical and clinical relationship between injured and non-injured
athletes. The diagnostic utility of both shoulder mobility tests are of poor quality and are
difficult to interpret in screening for UE SRI. Although reported to be reliable (Frohm et
al., 2011; Teyhen et al., 2012), the measure needs to be validated with respect to
traditional shoulder ROM measures in overhead throwing populations to determine its
value as a screening measure.

94
CKCUEST
The Closed Kinetic Chain Upper Extremity Stability Test (CKCUEST ) was
developed as a functional UE test to quantify patient progress in rehabilitation settings
(Roush, Kitamura, & Waits, 2007). Our reported CKCUEST (absolute score) values
ranged from 23.8±2.4 (injured) to 26.0±3.8 (non-injured). The CKCUEST (absolute
score) values in the non-injured group were consistent with reference values for the
CKCUEST scores ranging from 27.8 ±1.8 in college-aged males (Ellenbecker, Manske,
& Davies, 2000) to 30.41±3.4 in healthy, non-injured collegiate baseball players (Roush
et al., 2007). Normative values for CKCUEST in injured athletes had not been reported
previously. Our ROC analysis for CKCUEST (absolute scores) yielded a cutoff score of
≤ 24 as the discriminatory threshold associated with UE SRI.
The CKCUEST (TEAM-S) and CKCUEST (absolute score) demonstrated similar
outcomes with the injured group scoring lower than the non-injured group. Because the
scoring metric for CKCUEST (TEAM-S) has a direct relationship with the number of
touches in 15 seconds (CKCUEST absolute score) (see Appendix B), similar 2x2
contingency tables (see Tables 16 and 23) and measures of diagnostic utility (see Table
24) were found when comparing the measures. Because the CKCUEST (≤ 24) is a direct
reflection of raw data and demonstrated a higher diagnostic odds ratio (DOR) than
CKCUEST (TEAM-S), the diagnostic utility of this FPM is best represented by the
CKCUEST (≤ 24) data.
A CKCUEST threshold cutoff score of ≤ 24 (positive test) yielded modest Sn of
72% and Sp of 69%. A Sn of 72% indicates a higher probability of a positive test
95
(CKCUEST ≤ 24) in athletes with a history of UE SRI and was subject to an 8.8% false
negative rate. Conversely, a CKCUEST score of > 24 (negative test) yielded a Sn of
69%, indicating a higher probability of a negative score in athletes without a history of
UE SRI, but is limited by high false positive rate (20.5%).
The corresponding CKCUEST(< 24) likelihood ratios of LR+ = 2.3 and LR- =
0.39 indicate that a positive test (score ≤ 24) produced modest diagnostic utility as an
individual predictor variable for UE SRI. Based on our UE SRI prevalence of 33% (pre-
test odds), a positive test (CKCUEST ≤ 24) shifted the post-test probability to
approximately 43.3% while a negative test (CKCUEST > 24) shifted the pre-test
probability from 33% to a post-test probability of 11.5%. These shifts in probability
based on a CKCUEST cutoff score of ≤ 24 indicate that a positive or negative test result
provides little diagnostic clarity in the screening of UE SRI.
Despite significant outcomes, the global diagnostic utility of the CKCUEST ≤ 24
is not clinically useful in delineating between injured and non-injured athletes based on
retrospective analysis of UE SRI. The combination of a very high false positive rate,
moderate Sn and Sp, and low LRs indicates that the CKCUEST as a stand-alone clinical
measurement should not be used as a stand-alone diagnostic screening tool in predicting
UE SRI.
Specific Aim Two
Hypothesis two was accepted as a two-factor CPM, comprised of KJOC-SES and
playing position, retrospectively predicted UE SRI in a cohort of college baseball players
with a greater degree of diagnostic utility than did the individual factors of KJOC-SES,

96
playing position, single leg (Team-S score), squat leg squat-stride foot, single leg squat-
balance foot, shoulder mobility test-throwing arm, shoulder mobility test-non-throwing
arm, CKCUEST (TEAM-S Score), and CKCUEST (absolute score).
Clinical Prediction Model
The forward step-wise logistic regression analysis produced a two-factor
statistical model comprised of KJOC-SES and playing position. This model was based
on n = 34 because CKCUEST data were missing for two subjects. It should be noted that
for the logistic regression analysis, continuous predictor variables (KJOC-SES and
CKCUEST) were retained in their natural state rather than dichotomized based on
receiver operator characteristic (ROC) curve cutoff values to preserve the integrity of the
statistical approach. The resultant statistical model yielded a strong set of diagnostic
utility measures: Sn of 75% (95% CI: 42 to 94); Sp of 90% (95% CI: 70 to 98); LR+ of
8.25 (95% CI: 2.11 to 32.18); and LR- of 0.28 (95% CI: 0.1 to 0.74).
The two-factor statistical model was applied to the original data set using the
ROC curve cutoff value for KJOC-SES and playing position. This provided the
opportunity to maximize the number of available subjects and to test the statistical model
clinically. Because the KJOC-SES is scored on a continuous scale (0 to 100), it is
difficult for a clinician to translate a score into a positive or negative finding without a
normative reference score. A KJOC-SES cutoff score ≤ 86 allows a clinician to
interpreter the instrument’s results as positive or negative for diagnostic purposes.
Therefore, applying the two-factor model based on a KJOC-SES ≤ 86 and playing
position (pitcher) allowed the logistical regression statistical model to be translated into a

97
simplified set of clinical diagnostic parameters. In essence this allows a statistical model
to become an accessible clinical model (CPM) that can be applied directly in a patient
context.
The two-factor CPM applied to the original 36 subjects based on KJOC-SES ≤ 86
and playing position (pitcher) yielded diagnostic utility measures as follows: Sn of 83%
(95% CI: 0.55 to 95); Sp of 95% (95% CI: 79 to 99); LR+ of 22.0 (95% CI: 2.88 to
138.5); and LR- of 0.17 (95% CI: 0.04 to 0.61). By comparison, the CPM demonstrated
improved diagnostic utility for Sn, Sp, LRs, and DOR compared to the primary statistical
model (see Table 28). A Sn of 83% is indicative of a high probability of a positive test in
athletes with a history of UE SRI, while an Sp of 95% indicates a high probability of a
negative score in athletes without a history of UE SRI. Collectively the two-factor CPM
demonstrated both low false negative (2.7%) and false positive (5.5%) rates (see Table
28). The CPM’s likelihood ratios were 22.0 (LR+) and 0.17 (LR-) and affirm that
positive and negative test results are equally important in predicting injury status. Based
on our UE SRI prevalence of 33% pre-test odds, a positive test shifts the post-test
probability to approximately 88%. A negative test shifts the pre-test probability from
33% to a post-test probability of < 5.3%. These shifts in pre-test to post-test probability
are large and conclusive for diagnostic use. Figure 6 provides a representation of Fagan’s
nomogram based on our pretest probability for UE SRI and the associated likelihood
ratios for the two-factor CPM.

98
Figure 6. Fagan’s Nomogram for Two-Factor CPM.
Fagan’s nomogram taken from Glasziou (2001); For a positive screen, solid line
represents pre-test probability 33% shifting to post-test probability of 88% based on a
LR+ of 22.0; For a negative screen, the dashed line represents pre-test probability of UE
SRI of 33% shifting to post-test probability of 5.3% based on a LR- of 0.17.
To the best of our knowledge, this investigation provides the first CPM to predict
UE SRI in college baseball players. Ideally, our results should be viewed in direct
comparison to other multifactorial baseball injury prediction models. In the absence of
other baseball specific CPMs, it is important to contextualize our model with respect to
other SRI diagnostics (Bruce & Wilkerson, 2010b; Wilkerson, 2010) and traditional UE
diagnostic models (Altman et al., 1990; Litaker, Pioro, El Bilbeisi, & Brems, 2000; Park,
Yokota, Gill, El Rassi, & McFarland, 2005; Wainner et al., 2005).

99
Our study was initially modeled from the preliminary works of Bruce
&Wilkerson (2010) and Wilkerson (2010) who developed CPMs specifically for athletic
training. Their CPMs were developed by combining select FPM and self-report outcome
measures in single center cohorts for retrospectively predicting UE overuse injury in
collegiate softball players (Bruce & Wilkerson, 2010b) and prospectively predicting core
and lower extremity strains and sprains in collegiate football players (Wilkerson, 2010).
Although we included FPMs as potential predictor variables, our final two-factor CPM
did not include modifiable functional parameters such as the side bridge hold (Bruce &
Wilkerson, 2010b), trunk flexion hold (Bruce & Wilkerson, 2010b; Wilkerson, 2010),
and wall-sit hold (Wilkerson, Bullard, & Bartal, 2010). Our study and Wilkerson (2010)
both included regionally specific self-report functional outcome measures, the KJOC-
SES, and Oswestry Disability Index respectively. With respect to diagnostic utility, our
model yielded stronger measures for Sn, Sp, and LR+ and comparable LR- to Bruce &
Wilkerson (2010) and Wilkerson (2010) (see Table 31).
Traditionally, UE SRIs are diagnosed through a clinical examination sequence
that includes patient history and orthopedic special tests. Clusters of special tests have
been combined to improve the accuracy of the clinical examination finding. Several
CPMs comprised of special test clusters have been developed to diagnose pathologies
(Altman et al., 1990; Litaker et al., 2000; Park et al., 2005; Wainner et al., 2005). With
respect to the diagnostic utility of CPM special test clusters, our two-factor CPM
demonstrated comparable of Sn, Sp, LR+, and LR- measures (see Table 31).

100
Table 31. Diagnostic Utility of CPMs
Study Sensitivity Specificity LR+ LR- Evidence
Level*
SRI Prediction Models
Bruce et al. (2010)
0.42
(0.19, 0.68)
0.96
(0.79, 0.99)
9.58
(1.3, 73.0)
0.61
(0.4, 1.0) IV
Wilkerson et al. (2012)
.62
(0.46 - 75)
.91
(0.79 - 0.96) 6.8
a 0.09
a IV
Current Investigation
0.83
(0.55 0.95)
0.95
(0.79 - 0.99)
22.0
(2.88 - 138.5)
0.17
(0.04 - 0.61) IV
Diagnostic Special Test Clusters: UE Diagnostic Models
Altman et al. (1990)
88%b 93%
b 12.5
a 0.07
a III
Litaker et al. (2000)
49%b 95%
b 9.8
b 0.05
b III
Wainner et al. (2005)
0.18
(.03 – .31)
0.99
(0.97 – 1.0)
18.3
(1.0 – 328.3)
0.18
(.03 – 0.31) IV
Park et al. (2005)
† NR NR 10.56b 0.17
b IV
‡ NR NR 15.57b 0.16
b IV
Note. Value (95% Confidence Interval); LR+ = positive likelihood ratio; LR- = negative
likelihood ratio; * CPM evidence level adapted from Glynn & Weishbach (2011); a
Likelihood ratios not reported, calculated from Sn and Sp; b
95% confidence intervals not
reported; Bruce et al. (2010) two-factor model for UE overuse injury in intercollegiate
softball players (n = 35); Wilkerson et al. (2012) ≥3 factor model for core and LE strains
and sprains in collegiate football players (n = 83); Altman et al. (1990) five-factor model
for the diagnostic classification of osteoarthritis of the hand (n = 194); Litaker et al.
(2000) three factor model for diagnosing rotator cuff tears (n = 448); Wainner et al.
(2005) ≥ 4 factor model for diagnosing carpal tunnel syndrome (n = 82); Park et al.
(2005) (n =1127) † three-factor model for diagnosing impingement syndrome, ‡ three-
factor model for diagnosing full thickness rotator cuff tears.

101
This indicates that our CPM’s diagnostic utility characteristics fall within a range
acceptable for clinical practice. Collectively, the diagnostic utility of our CPM was
clinically useful in delineating between injured and non-injured athletes based on
retrospective analysis of UE SRI. The model correctly classified 85.5% of the cases
(81.8% for the injured and 87% for the non-injured). The combination of these
diagnostic utility measures indicates that the two-factor CPM may be an excellent
diagnostic screening tool for both ruling in and ruling out UE SRI in collegiate baseball
players.
Clinical Application
The results from this study may provide a number of benefits in advancing
evidence-based clinical practice. First and foremost, we provided a review of diagnostic
utility and their interpretive context for practicing clinicians. The concepts of Sn, Sp,
LR+, and LR- are important for clinicians to understand with respect to diagnostic special
tests and screening. Furthermore, clinicians need working knowledge of how
diagnosticutility measures relate to pre-test and post-test probability in forming a clinical
diagnosis. Clinicians who have a stronger understanding of diagnostic utility measures
and know how to interpret them may improve their clinical reasoning skills in evaluating
pathologies. Specifically, diagnostic tests and screening with dichotomous outcomes
need to be interpreted and applied beyond elemental reasoning grounded in binary
outcomes; (e.g., a positive test automatically equates to the presence of a given
pathology). In the process of a clinical assessment sequence, a clinician should consider
procedures that have high diagnostic utility and eliminate ones of little value (Denegar &
102
Cordova, 2012). Once a clinician knows the diagnostic metrics of a special test or screen,
the results need to be contextualized based on pre-test and post-test probabilities.
Clinicians who have an improved ability to interpret clinical findings may arrive at more
conclusive clinical diagnoses. Such an approach is a departure from clinical reasoning
anchored in experience that is based in heuristics (Kassirer, Wong, & Kopelman, 2010).
In day-to-day clinical practice, heuristics are a problem solving short cut predicated upon
one’s experience in recognizing general diagnostic patterns with respect to a given
pathology. To some extent pattern recognition relies on the likelihood of an event based
on the typical clinical presentation of a hypothesized pathology. This may serve a
clinician well when a patient presents with classic signs and symptoms or in emergency
situations when time is limited, but is prone to error in complex or atypical cases
(Kassirer et al., 2010). Because of the risks of misdiagnosis, it is important for clinicians
to use clinical reasoning skills consistent with the application and interpretation of
appropriate diagnostic tests and screenings. This study provides a link between
definitional concepts and interpretations of diagnostic utility measures that may facilitate
clinical reasoning skills consistent with the evidence-based paradigm.
Our CPM is a preliminary model based on a retrospective analysis of a single-
center cohort. As a derivation stage model, the CPM should undergo additional
validation and impact analysis as part of the development process before being
generalized beyond the original sample (Portney & Watkins, 2009). However, the model
was consistent with the literature on two foundational points: (a) pitchers are at higher
risk of UE SRI than field position players (Dick et al., 2007; Fleisig et al., 2010;

103
McFarland & Wasik, 1998); and (b) KJOC-SES were able to predict injury status
(Alberta et al., 2010; Domb et al., 2010; Neri et al., 2010; Neuman et al., 2011). The
standard for determining positive functional outcomes in baseball athletes has historically
been return-to-play; however, the standard of return-to-play does not adequately quantify
an athlete’s functional status (Alberta et al., 2010). Pragmatically, our results support the
notion that clinicians should incorporate self-reported outcome measures as a compulsory
element of clinical practice. This form of clinical outcome assessment is foundational to
EBP and should be a standard component of patient care (Sauers & Snyder, 2011). A
clinician could easily incorporate our CPM as part of the pre-participation physical
process or the injury evaluation and rehabilitation examination sequence when working
with baseball athletes. The self-report outcomes assessments should be a routine part of
clinical practice. Most clinicians (90%) recognize the importance of self-reported
outcome measure; however only 48% of physical therapists incorporate them as part of
patient assessment (Jette, Halbert, Iverson, Miceli, & Shah, 2009). The use of self-
reported outcome measures among athletic trainers is unknown (Michener, 2011).
Beyond the aforementioned direct application, our study builds on the theoretical
framework for developing CPMs in athletic populations to predict SRI (Bruce &
Wilkerson, 2010a). Developing injury prediction models similar to ours and others
(Bruce & Wilkerson, 2010b; Wilkerson, 2010) may be advantageous in other populations
to gain knowledge related to risk factors and SRI. Simplistically, an athletic trainer could
develop a CPM as part of a retrospective injury analysis as seasons end to determine risk
factor patterns. On a more complex level, researchers could partner with clinicians to
104
work collaboratively in developing CPMs to enhance clinical practice. If coupled with
measures of diagnostic utility, practitioners could find themselves at the nexus of patient-
centered evidence-based clinical practice.
Collectively, the principles of evidence-based practice have emerged as an
important focus within sports medicine clinical practice. Clinicians should possess a skill
set in understanding and applying diagnostic utility measures. Employing CPMs to
understand the relationship between multiple risk factors and injury are vital for
improving diagnosis as well as treatment based prognosis. The addition of self-reported
outcome measures is also an important element of clinical practice that is beneficial in
quantifying the heath and injury status of athletic populations. Thus the scope of this
study advances the body of knowledge in these areas of evidence-based clinical practice
which is central to 21st century health care (Evans & Lam, 2011).
Limitations
There are a number of limitations associated with this study that warrant
consideration, particularly retrospective methodology, FMS reliability, and sample size.
Researchers may not be able to control the completeness or reliability of the data
collection process in retrospective studies (Portney & Watkins, 2009). Individual game-
by-game statistics were only available for 11 of the 19 (58%) pitchers and eight of 17
(47%) fielders. This reduced the sample size for univariate analysis for the majority of
sport performance risk factors (see Table 13). Secondly, CKCUEST data were missing
for two subjects, both pitchers, one with a history of UE SRI. The reason for the missing
data is unknown, but could have resulted from subject refusal to participate in the

105
individual FPM, a data recording error, or database entry error. Subsequently this
reduced the sample size from 36 to 34 for univariate analysis related to CKCUEST
(absolute score) and CKCUEST (TEAM-S). The multivariate analysis treated the data
set associated with these two subjects as missing cases and excluded them the logistic
regression statistical modeling. Analysis of an incomplete data set may have influenced
our findings.
With respect to reliability, the TEAM-S was used to generate predictor variables
related to FPM. As a new battery of functional performance screening measures, TEAM-
S does not have established reliability or validity metrics. Although the reliability of
TEAM-S is unknown, the individual tests that comprise the battery are similar to tests
comprising the FMS® and the FROHM 9-Test Screen. FMS® and the FROHM 9-Test
Screen have been shown to be reliable (Frohm et al., 2011; Minick et al., 2010;
Schneiders et al., 2011; Teyhen et al., 2012). Additionally, it is important to recognize
that the individual tests comprising the TEAM-S have established reliability metrics (see
Table 6). Ideally, FPM data should have been obtained from a battery of tests with an
established composite score reliability. However, this study was only able to obtain FPM
through the TEAM-S process.
The TEAM-S was administered in a field rather than a laboratory setting by
experienced (physical therapists, certified athletic trainers, certified strength and
condition coaches) and novice (undergraduate students) clinician/raters with minimal
training. The intra- and inter-rater reliability for experienced and student raters was not
determined prior to data collection. For the most part, individual FPMs have previously

106
demonstrated good to excellent intra- and inter-rater reliability among clinicians with
varied experience (Minick et al., 2010; Teyhen et al., 2012).
Sample size is critical with respect to the number of positive cases and the number
of included predictive variables (Pallant, 2010). It is common practice to include 10 to
15 subjects per predictor variable in the final CPM (Glynn & Weisbach, 2011), but a
larger sample size to account for 10 to15 subjects per potential predictor variable in the
overall study has been suggested to avoid over-fitting a regression model (Beneciuk,
Bishop, & George, 2009). In the current investigation (n = 36) there were twelve positive
cases with five predictor variables entered into the logistic regression, which resulted in a
two-factor CPM. Our final model is within the constraints of 10 to 15 subjects per factor
in the final model, but inconsistent with the suggested 10 to 15 subjects per predictor
variable within the overall study. A larger sample size would likely be beneficial in
strengthening the development of a CPM on the basis of greater statistical power.
Specifically, the model demonstrates strong diagnostic utility measures; however, the
95% confidence intervals associated with LR+ (2.88 to 138.5), LR- (0.04 to 0.61), and
DOR (9.32 to 1418.8) are wide. A larger sample size would narrow the 95% confidence
intervals and the accuracy of the diagnostic utility measures (Bruce & Wilkerson, 2010b).
In addition to these primary concerns, other limitations should be considered.
Injury status as the dependent outcome variable was established from self-reported
history as part of the KJOC-SES instrument. The KJOC-SES does not establish a time-
course for injury occurrence nor does the instrument provide an operational definition for
what constitutes an UE SRI. Additionally, the instrument requires ten response items

107
without temporal context. The items require a respondent to quantify a perception
without providing a time frame (e.g., with the past month or with the past year). The lack
of temporal context requires a respondent unconsciously to use subjective impressions of
stability and change to derive an interpretive response that may be unrelated to the intent
of the instrument’s context (Streiner & Norman, 2008). This may bias item responses,
causing measurement error or undermining the measurement scale’s reliability (DeVellis,
2003). Consequently, the recall accuracy of self-report health measures is an issue in
health measurement scale methodology (Streiner & Norman, 2008). This may be
particularly true in disorders with fluctuating symptoms (e.g., osteoarthritis, depression)
or when pain is a primary variable (Litcher-Kelly, Martino, Broderick, & Stone, 2007;
Stone, Broderick, Kaell, DelesPaul, & Porter, 2000; Stone, Broderick, Shiffman, &
Schwartz, 2004). However, recall accuracy of self-reported sport injury history in athletes
has been reported to be 80% (Gabbe, Finch, Bennell, & Wajswelner, 2003).
An additional concern related to SRI history is the number and type of injuries
that were reported in our cohort. Twelve (33%) of the participants had a self-reported
history of a serious UE SRI: five ulnar collateral ligament sprains, three shoulder
impingements, two labium pathologies, and two rotator cuff tendinopathies. The nature
of these self-reported injuries was consistent and representative of time-loss UE SRI
reported in literature (Burkhart, 2006; Burkhart, Craig, & Kibler, 2003; Burkhart &
Morgan, 2001; Cain et al., 2003; Domb et al., 2010; Gerstman et al., 2009; Jazrawi et al.,
2006; Jobe & Bradley, 1988; Kuhn, 2009; Namdari et al., 2011; Wood et al., 2010). The
current retrospective reporting of a 33% injury rate was similar to the 25% injury rate

108
previously reported in collegiate baseball (Dines et al., 2007). Typically, sport injury
rates are expressed as a ratio of injures per 1,000 units of practice and/or game exposures.
Because of the nature of this retrospective study, we were unable to calculate an injury
rate per 1,000 exposures to determine whether our injury rate was consistent with
reported values of 0.54 to 5.73 per 1,000 (Dick et al., 2007; Posner et al., 2011). It is
important to consider that injury prevalence in the context of a small sample size may not
reflect well the prevalence in a larger population (Portney & Watkins, 2009). Thus
caution is warranted in placing the results of this investigation into a broader context.
Despite the existence of these limitations, the study fits within in the context of derivation
stage CPM. Our primary findings are consistent with current evidence related to UE SRI
in baseball players. The strength of our two-factor CPM warrants consideration in an
appropriate context and provides a foundation for future research.
Recommendations for Future Research
The current findings resulted in a preliminary two-factor CPM comprised of
KJOC-SES (≤ 86) and playing position (pitcher). The model was developed in a small
sample (n = 36) pooled from a single center. It appears that the CPM is a viable clinical
screening tool for UE SRI in baseball players. However, the model is only consistent
with a level IV evidence rating for CPM and should undergo additional development to
address issues related to sample size, validity, and impact analysis (Portney & Watkins,
2009).
The natural progression for CPM development after the derivation stage is
validation and impact analysis (Childs & Cleland, 2006; Toll, Janssen, Vergouwe, &

109
Moons, 2008). Validation encompasses reproduction of the CPM to assess the model’s
metrics in a different or expanded population set. Validation also may entail
conformation of the original set of predictor variables or consideration of alternative
variables that were excluded from the initial design. On a basic level, our CPM and its
diagnostic utility metrics need to be conformed in a larger sample. This should occur in a
prospective design to determine whether the retrospective diagnostic properties of the
model are transferable to a prognostic screening tool.
The greater challenge of validating the model would be to update the preliminary
set of contributory variables (Toll et al., 2008). Our predictor variables were derived
from the KJOC-SES, sport performance statistics, and the TEAM-S. Due to the
availability of retrospective data, we obviously could not address the full spectrum of risk
factors previously identified as causal for UE SRI in baseball athletes. Specifically, we
did not include direct measurements of muscle strength deficits (Brown et al., 1988;
Yildiz et al., 2006), muscle fatigue (Mullaney et al., 2005), internal and external strength
imbalance (Lewis & Valentine, 2007), GIRD (Borsa et al., 2006; Dines et al., 2009; Wilk
et al., 2010), maximum pitching velocity (Bushnell et al., 2010), or throwing
biomechanics (Fleisig et al., 1995; Fleisig et al., 1996). Conceptually we categorized risk
factors into three areas consisting of (a) self-reported outcome scores; (b) sport
performance factors; and (c) FPM. Future studies should include direct measures such as
muscle strength deficits, muscle fatigue, internal and external strength imbalance, GIRD,
maximum pitch velocity, or biomechanics. This may improve understanding of the
multifactorial relationship between risk factors and UE SRI. It may generate a different

110
model that includes a set of modifiable predictor variables (e.g., strength imbalance,
ROM deficits) that could translate into a specific injury prevention program.
In addition to the recommendation for expanding the number of risk factors, it is
important to consider the role of FPM in clinical research. Our results provide additional
confirmation on the lack of evidence between FPM batteries and injury prediction.
Future work in this area should focus on clarifying the TEAM-S normative values and
envelope of function. This may contribute to establishing the reliability and validity of
TEAM-S in identifying functional limitations and injury risk in athlete populations.
Impact analysis of CPM pertains to how a model is utilized by clinicians, affects
clinical decision making, and improves patient outcomes (Toll et al., 2008). The
fundamental issue relating to impact analysis centers on sensibility and begs the question:
“Can a CPM be easily incorporated into route clinical practice, produce interpretable
results, and lead to tangible patient-oriented outcomes?” (C. E. Cook, 2008). One might
assume that our two-factor CPM could be incorporated easily into clinical practice as a
pre-season baseline measure. However, the use of self-report outcome measures has been
lacking in sports medicine settings such as athletic training. Translational research may
help orient clinicians to how a CPM can be implemented and applied in sports injury
management and rehabilitation. This in turn may lead to evidence that demonstrates how
a CPM shapes clinical decision making and leads to improved patient-oriented outcomes.
The logical next step in our research centers on two potential approaches, the first
of which is to employ the KJOC-SES as a prognostic screening tool. Through
retrospective design, the KJOC-SES has demonstrated respectable diagnostic utility in
111
identifying overhead athletes with UE SRI and self-reported functional limitations. The
question that remains is whether the KJOC-SES can predict injury prospectively.
Investigating this question would benefit identifying individual athletes for preventive
treatment strategies. Second, the work of Wilkerson (2010) provides evidence that self-
reported outcome measures coupled with select FPMs that assess altered neuromuscular
activation patterns (e.g., muscular endurance fatigue) are supported as a preseason injury-
risk screening tool in collegiate football players. A similar approach in baseball athletes
has not yet been established. Moving forward, research that combines the KJOC-SES
with modifiable neuromuscular risk factors may provide a more definitive CPM in
predicting UE SRI in baseball players.
Conclusion
Based on the findings of this study, a preliminary two-factor CPM comprised of
KJOC-SES (≤ 86) and playing position (pitcher) retrospectively predicted UE SRI in a
cohort of baseball players with strong diagnostic utility. The CPM demonstrated greater
diagnostic utility than did individual risk factors in predicting UE SRI in injured versus
non-injured groups. Although retrospective designs and derivation models have
limitations, the two-factor CPM improves on current understanding of risk factors and
UE SRI in baseball. The diagnostic utility measures for the two-factor CPM in this
population have not been reported previously and comprise a novel approach to injury
evaluation consistent with the evidence-based paradigm.

112
REFERENCES
Akobeng, A. K. (2005). Understanding measures of treatment effect in clinical trials.
Archives of Disease in Childhood, 90(1), 54-56. doi: 10.1136/adc.2004.052233
Akobeng, A. K. (2007a). Understanding diagnostic tests 1: sensitivity, specificity and
predictive values. Acta Paediatrica, 96(3), 338-341. doi: 10.1111/j.1651-
2227.2006.00180.x
Akobeng, A. K. (2007b). Understanding diagnostic tests 2: likelihood ratios, pre- and
post-test probabilities and their use in clinical practice. Acta Paediatrica, 96(4),
487-491. doi: 10.1111/j.1651-2227.2006.00179.x
Alberta, F. G., ElAttrache, N. S., Bissell, S., Mohr, K., Browdy, J., Yocum, L., & Jobe, F.
(2010). The development and validation of a functional assessment tool for the
upper extremity in the overhead athlete. The American Journal of Sports
Medicine, 38(5), 903-911. doi: 0363546509355642 [pii]
10.1177/0363546509355642 [doi]
Altman, R., Alarcon, G., Appelrouth, D., Bloch, D., Borenstein, D., Brandt, K., . . . et al.
(1990). The American College of Rheumatology criteria for the classification and
reporting of osteoarthritis of the hand. Arthritis Rheum, 33(11), 1601-1610.
AMA. (2002). Users' Guides to the Medical Literature: A Manual for Evidence-Based
Clinical Practice (2nd ed.). Chicago, IL: American Medical Association.
Andrews, J. R., & Fleisig, G. S. (1998). Preventing throwing injuries. Journal of
Orthopaedic & Sports Physical Therapy, 27(3), 187-188.
Anz, A. W., Bushnell, B. D., Griffin, L. P., Noonan, T. J., Torry, M. R., & Hawkins, R. J.
(2010). Correlation of torque and elbow injury in professional baseball pitchers.
The American Journal of Sports Medicine, 38(7), 1368-1374. doi:
10.1177/0363546510363402
Arnason, A., Tenga, A., Engebretsen, L., & Bahr, R. (2004). A prospective video-based
analysis of injury situations in elite male football: football incident analysis. Am J
Sports Med, 32(6), 1459-1465. doi: 10.1177/0363546504262973

113
Aronoff, S. C., Evans, B., Fleece, D., Lyons, P., Kaplan, L., & Rojas, R. (2010).
Integrating evidence based medicine into undergraduate medical education:
combining online instruction with clinical clerkships. Teaching and Learning in
Medicine, 22(3), 219-223. doi: 10.1080/10401334.2010.488460Atiya, A. S.
(2002). Teaching of evidence-based medicine to medical undergraduates. The
Medical Journal of Malaysia, 57 Suppl E, 105-108.
Bach, H. G., & Goldberg, B. A. (2006). Posterior Capsular Contracture of the Shoulder. J
Am Acad Orthop Surg, 14(5), 265-277.
Bahr, R. (2009). No injuries, but plenty of pain? On the methodology for recording
overuse symptoms in sports. Br J Sports Med, 43(13), 966-972. doi:
10.1136/bjsm.2009.066936
Bahr, R., & Krosshaug, T. (2005). Understanding injury mechanisms: a key component
of preventing injuries in sport. British Journal of Sports Medicine, 39(6), 324-
329. doi: 39/6/324 [pii] 10.1136/bjsm.2005.018341
Bainbridge, L, Nasmith, L, Orchard, C, & Wood, V. (2010). Competencies for
Interprofessional Collaboration. Journal of Physical Therapy Education, 24(1), 6-
11.
Banks, C. M., Gilmartin, H., & Fink, R. M. (2010). Education methods for maintaining
nursing competency in low-volume, high-risk procedures in the rural setting:
bridging the theory to practice gap. Journal for Nurses in Staff Development,
26(3), E1-7. doi: 10.1097/NND.0b013e3181aa2f54
Barrentine, S. W., Matsuo, T, Escamilla, R. F., Fleisig, G. S., & Andrews, James R.
(1998). Kinematic Analysis of the Wrist and Forearm During Baseball Pitching.
Journal of Applied Biomechanics, 14(1), 24-39.
Barrett, David D., & Burton, Allen W. (2002). Throwing patterns used by collegiate
baseball players in actual games. Research Quarterly for Exercise and Sport,
73(1), 19-27.
Beaton, D. E., Wright, J. G., & Katz, J. N. (2005). Development of the QuickDASH:
comparison of three item-reduction approaches. The Journal of Bone and Joint
Surgery, 87(5), 1038-1046. doi: 87/5/1038 [pii] 10.2106/JBJS.D.02060 [doi]
Beattie, P., & Nelson, R. (2006). Clinical prediction rules: what are they and what do
they tell us? The Australian Journal of Physiotherapy, 52(3), 157-163.
Beneciuk, J. M., Bishop, M. D., & George, S. Z. (2009). Clinical prediction rules for
physical therapy interventions: a systematic review. Phys Ther, 89(2), 114-124.
doi: 10.2522/ptj.20080239

114
BOC. (2010). The 2009 Athletic Trainer Role Delineation Study. S. B. Johnson (Ed.)
Borsa, P. A., Dover, G. C., Wilk, K. E., & Reinold, M. M. (2006). Glenohumeral range of
motion and stiffness in professional baseball pitchers. Medicine and Science in
Sports and Exercise, 38(1), 21-26. doi: 00005768-200601000-00005 [pii]
Borsa, P. A., Wilk, K. E., Jacobson, J. A., Scibek, J. S., Dover, G. C., Reinold, M. M., &
Andrews, J. R. (2005). Correlation of range of motion and glenohumeral
translation in professional baseball pitchers. The American Journal of Sports
Medicine, 33(9), 1392-1399. doi: 0363546504273490 [pii]
Bradbury, J. C., & Forman, S. L. (2012). The Impact of Pitch Counts and Days of Rest on
Performance among Major-League Baseball Pitchers. Journal of Strength and
Conditioning Research. doi: 10.1519/JSC.0b013e31824e16fe
Brasher, P. M., & Beattie, W. S. (2009). Adjusting clinical prediction rules: an academic
exercise or the potential for real world clinical applications in perioperative
medicine? Can J Anaesth, 56(3), 190-193. doi: 10.1007/s12630-009-9050-9
Brophy, R. H., Beauvais, R. L., Jones, E. C., Cordasco, F. A., & Marx, R. G. (2005).
Measurement of shoulder activity level. Clinical Orthopaedics and Related
Research, 439, 101-108. doi: 00003086-200510000-00022 [pii]
Brown, L. P., Niehues, S. L., Harrah, A., Yavorsky, P., & Hirshman, H. P. (1988). Upper
extremity range of motion and isokinetic strength of the internal and external
shoulder rotators in major league baseball players. The American Journal of
Sports Medicine, 16(6), 577-585.
Bruce, S. L., & Wilkerson, G. B. (2010a). Clinical Prediction Rules, Part 1: Conceptual
Overview. Athletic Therapy Today, 15(2), 4-9.
Bruce, S. L., & Wilkerson, G. B. (2010b). Clinical Prediction Rules, Part 2: Data Anaysis
Procusdues and Clinical Application of Results. Athletic Therapy Today, 15(2),
10-13.
Burkhart, S. S., & Morgan, C. D. (1998). The peel-back mechanism: its role in producing
and extending posterior type II SLAP lesions and its effect on SLAP repair
rehabilitation. Arthroscopy, 14(6), 637-640.
Burkhart, S. S. (2006). Internal impingement of the shoulder. Instructional Course
Lectures, 55, 29-34.
Burkhart, S. S., Craig, D. M., & Kibler, W. B. (2003). The disabled throwing shoulder:
Spectrum of pathology: Part I: Pathoanatomy and biomechanics. Arthroscopy,
19(4), 404-420.

115
Burkhart, S. S., & Morgan, C. D. (2001). SLAP LESIONS IN THE OVERHEAD
ATHLETE. Orthopedic Clinics of North America, 32(3), 431-441.
Burkhart, S. S., Morgan, C. D., & Kibler, W. B. (2003). The disabled throwing shoulder:
spectrum of pathology. Part II: evaluation and treatment of SLAP lesions in
throwers. Arthroscopy, 19(5), 531-539. doi: 10.1053/jars.2003.50139 [doi]
S0749806303001701 [pii]
Bushnell, B. D., Anz, A. W., Noonan, T. J., Torry, M. R., & Hawkins, R. J. (2010).
Association of maximum pitch velocity and elbow injury in professional baseball
pitchers. The American Journal of Sports Medicine, 38(4), 728-732. doi:
10.1177/0363546509350067
Butler, R. J., Plisky, P. J., Southers, C., Scoma, C., & Kiesel, K. B. (2011).
Biomechanical analysis of the different classifications of the Functional
Movement Screen deep squat test. Sports Biomechanics, 9(4), 270-279. doi:
10.1080/14763141.2010.539623
Cai, C., Pua, Y. H., & Lim, K. C. (2009). A clinical prediction rule for classifying
patients with low back pain who demonstrate short-term improvement with
mechanical lumbar traction. European Spine Journal, 18(4), 554-561. doi:
10.1007/s00586-009-0909-9
Cain, E. L, Jr., Dugas, J. R., Wolf, R. S., & Andrews, J R. (2003). Elbow Injuries in
Throwing Athletes: A Current Concepts Review. The American Journal of Sports
Medicine, 31(4), 621-635.
CEBM. (2012). EBM Tools. Retrieved Novermber 19, 2012, from
http://www.cebm.net/index.aspx?o=1023
Chalmers, D. J. (2002). Injury prevention in sport: not yet part of the game? Injury
Prevention, 8 Suppl 4, IV22-25.
Chambless, K. M., Knudtson, J., Eck, J. C., & Covington, L. A. (2000). Rate of injury in
minor league baseball by level of play. Am J Orthop (Belle Mead NJ), 29(11),
869-872.
Chaudhari, A. M., McKenzie, C. S., Borchers, J. R., & Best, T. M. (2011). Lumbopelvic
control and pitching performance of professional baseball pitchers. J Strength
Cond Res, 25(8), 2127-2132. doi: 10.1519/JSC.0b013e31820f5075
Childs, J. D., & Cleland, J. A. (2006). Development and application of clinical prediction
rules to improve decision making in physical therapist practice. Phys Ther, 86(1),
122-131.

116
Childs, J. D., Fritz, J. M., Flynn, T. W., Irrgang, J. J., Johnson, K. K., Majkowski, G. R.,
& Delitto, A. (2004). A clinical prediction rule to identify patients with low back
pain most likely to benefit from spinal manipulation: a validation study. Annals of
Internal Medicine, 141(12), 920-928.
Comstock, R. D., Collins, C. L., & McIlvain, N. M. (2011). National High School Sports-
related Injury Surveillance Study: 2010-2011 School Year (pp. 166). Columbus,
OH Center for Injury Research and Policy, The Research Institute at Nationwide
Children’s Hospital.
Constant, C. R., & Murley, A. H. (1987). A clinical method of functional assessment of
the shoulder. Clinical Orthopaedics and Related Research(214), 160-164.
Conway, J. E., Jobe, F. W., Glousman, R. E., & Pink, M. (1992). Medial instability of the
elbow in throwing athletes. Treatment by repair or reconstruction of the ulnar
collateral ligament. The Journal of Bone and Joint Surgery, 74(1), 67-83.
Cook, C. E. (2008). Potential pitfalls of clinical prediction rules. J Man Manip Ther,
16(2), 69-71.
Cook, C. E., & Hegedus, E. J. (2013). Orthopedic Physical Examination Test: An
Evidence-based Appraoch (2nd ed.). New York, New York: Pearson.
Cook, G., Burton, L., & Hoogenboom, B. (2006a). Pre-participation screening: the use of
fundamental movements as an assessment of function - part 1. North American
Journal of Sports Physical Therapy, 1(2), 62-72.
Cook, G., Burton, L., & Hoogenboom, B. (2006b). Pre-participation screening: the use of
fundamental movements as an assessment of function - part 2. North American
Journal of Sports Physical Therapy, 1(3), 132-139.
Cook, G., Burton, Lee, Kiesel, Kyle, Rose, Greg, & Bryant, Milo F. (2010). Movement:
Functional Movement Systems: Screening, Assessment, Corrective Strategies
(July, 15, 2010 ed.). Aptos, CA: On Target Publications
Cooper, J., Donley, P., Verna, C., & Morgan, C. (2002). The relationship between
glenohumeral internal roation deficit and shoulder and elbow pain. PBATS
Newsletter, 15(2), 4-5.

117
Cosby, N. L., & Hertel, J. (2011). Clinical assessment of ankle injury outcomes: case
scenario using the foot and ankle ability measure. Journal of Sport Rehabilitation,
20(1), 89-99.
Creighton, D. W., Shrier, I., Shultz, R., Meeuwisse, W. H., & Matheson, G. O. (2010).
Return-to-play in sport: a decision-based model. Clinical Journal of Sport
Medicine, 20(5), 379-385. doi: 10.1097/JSM.0b013e3181f3c0fe 00042752-
201009000-00012 [pii]
Crockett, H. C., Gross, L. B., Wilk, K. E., Schwartz, M. L., Reed, J., O'Mara, J., . . .
Andrews, J. R. (2002). Osseous adaptation and range of motion at the
glenohumeral joint in professional baseball pitchers. The American Journal of
Sports Medicine, 30(1), 20-26.
Dawson, J., Fitzpatrick, R., & Carr, A. (1999). The assessment of shoulder instability.
The development and validation of a questionnaire. The Journal of Bone and
Joint Surgery: British Volume, 81(3), 420-426.
Denegar, C. R., & Cordova, M. L. (2012). Application of Statistics in Establishing
Diagnostic Certainty. Journal of Athletic Training, 47(2), 233-236.
DeVellis, R. F. (2003). Scale Development: Theory and Application. (2nd ed. Vol. 26).
Thousand Oaks, California: Sage Publications.
Dick, R., Sauers, E. L., Agel, J., Keuter, G., Marshall, S. W., McCarty, K., & McFarland,
E. (2007). Descriptive epidemiology of collegiate men's baseball injuries:
National Collegiate Athletic Association Injury Surveillance System, 1988-1989
through 2003-2004. Journal of Athletic Training, 42(2), 183-193.
Dines, J. S., Frank, J. B., Akerman, M., & Yocum, L. A. (2009). Glenohumeral internal
rotation deficits in baseball players with ulnar collateral ligament insufficiency.
The American Journal of Sports Medicine, 37(3), 566-570. doi:
10.1177/0363546508326712
Domb, B. G., Davis, J. T., Alberta, F. G., Mohr, K. J., Brooks, A. G., Elattrache, N. S., . .
. Jobe, F. W. (2010). Clinical follow-up of professional baseball players
undergoing ulnar collateral ligament reconstruction using the new Kerlan-Jobe
Orthopaedic Clinic overhead athlete shoulder and elbow score (KJOC Score). The
American Journal of Sports Medicine, 38(8), 1558-1563. doi: 0363546509359060
[pii] 10.1177/0363546509359060 [doi]
Donatelli, R., Wooden, M., Ekedahl, S. R., Wilkes, J. S., Cooper, J., & Bush, A. J.
(1999). Relationship between static and dynamic foot postures in professional
baseball players. J Orthop Sports Phys Ther, 29(6), 316-325; discussion 326-330.

118
Ellenbecker, T.S., Manske, R., & Davies, G.J. . (2000). Closed kinetic chain testing
techniques of the upper extremities. Orthopaedic Physical Therapy Clinics of
North America, 9, 219-229.
Ellman, H., Hanker, G., & Bayer, M. (1986). Repair of the rotator cuff. End-result study
of factors influencing reconstruction. The Journal of Bone and Joint Surgery,
68(8), 1136-1144.
Escamilla, R. F., Fleisig, G. S., Barrentine, S. W., Zheng, N., & Andrews, J. R. (1998).
Kinematic Comparisons of Throwing Different Types of Baseball Pitches.
Journal of Applied Biomechanics, 14(1), 1-23.
Evans, T. A., & Lam, K. C. (2011). Clinical outcomes assessment in sport rehabilitation.
Journal of Sport Rehabilitation, 20(1), 8-16.
Fagan, T. J. (1975). Letter: Nomogram for Bayes theorem. N Engl J Med, 293(5), 257.
doi: 10.1056/NEJM197507312930513
Falk, G., & Fahey, T. (2009). Clinical Prediction rules. British Medical Journal, 339,
b2899. doi: 10.1136/bmj.b2899
Finch, C. F., Gabbe, B. J., Lloyd, D. G., Cook, J., Young, W., Nicholson, M., . . . Doyle,
T. L. (2011). Towards a national sports safety strategy: addressing facilitators and
barriers towards safety guideline uptake. Inj Prev, 17(3), e4. doi: ip.2010.031385
[pii] 10.1136/ip.2010.031385
Finch, C. F., Ullah, S., & McIntosh, A. S. (2011). Combining epidemiology and
biomechanics in sports injury prevention research: a new approach for selecting
suitable controls. Sports Medicine, 41(1), 59-72. doi: 4 [pii] 10.2165/11537260-
000000000-00000
Fleisig, G. S. (2012). Epidemic of Elbow Injuries in High School Baseball Pitchers
Requiring UCL Reconstruction (“Tommy John Surgery”). American Sports
Medicine Institute. Retrieved September 9, 2012, from
http://www.asmi.org/asmiweb/research/hsbaseball.htm
Fleisig, G. S., Andrews, J. R., Cutter, G. R., Weber, A., Loftice, J., McMichael, C., . . .
Lyman, S. (2010). Risk of serious injury for young baseball pitchers: a 10-year
prospective study. The American Journal of Sports Medicine, 39(2), 253-257. doi:
0363546510384224 [pii] 10.1177/0363546510384224
Fleisig, G. S., & Andrews, J. R. (2012). Prevention of elbow injuries in youth baseball
pitchers. Sports Health, 4(5), 419-424. doi: 10.1177/1941738112454828
119
Fleisig, G. S., Andrews, James R., Dillman, Charles J. , & Escamilla, Rafael F. (1995).
Kinetics of baseball pitching with implications about injury mechanism. The
American Journal of Sports Medicine, 23(2), 233-239.
Fleisig, G. S., Barrentine, S. W., Escamilla, R. F., & Andrews, J. R. (1996).
Biomechanics of overhand throwing with implications for injuries. Sports
Medicine, 21(6), 421-437.
Fleisig, G. S., Kingsley, D. S., Loftice, J. W., Dinnen, K. P., Ranganathan, R., Dun, S., . .
. Andrews, J. R. (2006). Kinetic Comparison Among the Fastball, Curveball,
Change-up, and Slider in Collegiate Baseball Pitchers. The American Journal of
Sports Medicine, 34(3), 423-430. doi: 10.1177/0363546505280431
Fleisig, G. S., Weber, A., Hassell, N., & Andrews, J. R. (2009). Prevention of elbow
injuries in youth baseball pitchers. Curr Sports Medicine Rep, 8(5), 250-254. doi:
10.1249/JSR.0b013e3181b7ee5f
Fritz, J. M., Childs, J. D., & Flynn, T. W. (2005). Pragmatic application of a clinical
prediction rule in primary care to identify patients with low back pain with a good
prognosis following a brief spinal manipulation intervention. BMC Fam Pract,
6(1), 29. doi: 10.1186/1471-2296-6-29
Frohm, A., Heijne, A., Kowalski, J., Svensson, P., & Myklebust, G. (2011). A nine-test
screening battery for athletes: a reliability study. Scand J Med Sci Sports. doi:
10.1111/j.1600-0838.2010.01267.x
Gabbe, B. J., Finch, C. F., Bennell, K. L., & Wajswelner, H. (2003). How valid is a self
reported 12 month sports injury history? British Journal of Sports Medicine,
37(6), 545-547. doi: 10.1136/bjsm.37.6.545
Gerstman, B. A., Malanga, G. A., & Ferrer, S. (2009). Rotator cuff tear in a 12-year-old
baseball pitcher: a case report. PM R, 1(7), 687-690. doi:
10.1016/j.pmrj.2009.03.018
Glas, A. S., Lijmer, J. G., Prins, M. H., Bonsel, G. J., & Bossuyt, P. M. (2003). The
diagnostic odds ratio: a single indicator of test performance. J Clin Epidemiol,
56(11), 1129-1135.
Glasziou, P. (2001). Which methods for bedside Bayes? Evidence Based Medicine, 6(6),
164-166. doi: 10.1136/ebm.6.6.164
Glynn, P. E., & Weisbach, P. C. (2011). Clinical Prediction Rules: A physical therapy
reference mannual. Sudbury, MA: Jones and BArtlett Publishers.

120
Guyatt, G. H., Bombardier, C, & Tugwell, P. X. (1986). Measuring disease-specific
quality of life in clinical trials. Canadian Medical Association Journal, 134(8),
889-895.
Guyatt, G., Rennie, D. , Meade, M. O., & Cook, Deborah J. (2008). Users' guides to the
medical liturature: A manual for evidence-based clinical practice (2nd ed.). New
York, NY: McGraw-Hill.
Hawk, C., Long, C. R., & Boulanger, K. (1998). Development of a practice-based
research program. J Manipulative Physiol Ther, 21(3), 149-156.
Hawkins, R. C. (2005). The Evidence Based Medicine approach to diagnostic testing:
practicalities and limitations. The Clinical biochemist. Review, 26(2), 7-18.
Haworth, R. J., Hopkins, J., Ells, P., Ackroyd, C. E., & Mowat, A. G. (1981).
Expectations and outcome of total hip replacement. Rheumatol Rehabil, 20(2),
65-70.
Hegedus, E. J. (2011). Targeted Enhanced Athletic Movement Screen (TEAM Screen).
Department of Physical Therapy. High Point University. High Point, NC.
Hicks, G. E., Fritz, J. M., Delitto, A., & McGill, S. M. (2005). Preliminary development
of a clinical prediction rule for determining which patients with low back pain
will respond to a stabilization exercise program. Archives of Physical Medicine
and Rehabilitation, 86(9), 1753-1762. doi: 10.1016/j.apmr.2005.03.033
Hollinshead, R. M., Mohtadi, N. G., Vande Guchte, R. A., & Wadey, V. M. (2000). Two
6-year follow-up studies of large and massive rotator cuff tears: comparison of
outcome measures. Journal of Shoulder and Elbow Surgery, 9(5), 373-381. doi:
S1058-2746(00)16854-5 [pii] 10.1067/mse.2000.108389 [doi]
Hootman, J. M. (2004). Editorial: New Section in JAT: Evidence-Based Practice. Journal
of Athletic Training, 39(1), 9.
Hootman, J. M., Dick, R., & Agel, J. (2007). Epidemiology of collegiate injuries for 15
sports: Summary and recommendations for injury prevention initiatives. Journal
of Athletic Training, 42(2), 311-319.
Hrysomallis, C. (2011). Balance ability and athletic performance. Sports Med, 41(3),
221-232. doi: 10.2165/11538560-000000000-00000
Hsu, J. W., Gould, J. L., Fonseca-Sabune, H., & Hausman, M. H. (2009). The Emerging
Role of Elbow Arthroscopy in Chronic Use Injuries and Fracture Care. Hand
Clinics, 25(3), 305-321. doi: 10.1016/j.hcl.2009.05.009
121
Hudak, P. L., Amadio, P. C., & Bombardier, C. (1996). Development of an upper
extremity outcome measure: the DASH (disabilities of the arm, shoulder and
hand) [corrected]. The Upper Extremity Collaborative Group (UECG). Am J Ind
Med, 29(6), 602-608. doi: 10.1002/(SICI)1097-0274(199606)29:6<602::AID-
AJIM4>3.0.CO;2-L
Janda, D. H. (2003). The prevention of baseball and softball injuries. Clinical
Orthopaedics and Related Research(409), 20-28. doi:
10.1097/01.blo.0000057789.10364.e3
Jazrawi, L. M., Leibman, M., Mechlin, M., Yufit, P., Ishak, C., Schweitzer, M., &
Rokito, A. (2006). Magnetic resonance imaging evaluation of the ulnar collateral
ligament in young baseball pitchers less than 18 years of age. Bull Hosp Jt Dis,
63(3-4), 105-107.
Jette, D. U., Halbert, J., Iverson, C., Miceli, E., & Shah, P. (2009). Use of standardized
outcome measures in physical therapist practice: perceptions and applications.
Physical Therapy, 89(2), 125-135. doi: ptj.20080234 [pii] 10.2522/ptj.20080234
[doi]
Jewell, D. V. (2011). Evidence-Based Physical Therapy Practice (2nd ed.). Sudbury,
MA: Jones & Bertlett Learning.
Jobe, F. W., & Bradley, J. P. (1988). Rotator cuff injuries in baseball. Prevention and
rehabilitation. Sports Medicine, 6(6), 378-387.
Kassirer, J., Wong, J., & Kopelman, R. (2010). Learning Clinical Reasoning (2nd ed.).
Baltimore, MD: Lippin Williams & Wilkins.
Kerut, E. K., Kerut, D. G., Fleisig, G. S., & Andrews, J. R. (2008). Prevention of arm
injury in youth baseball pitchers. J La State Med Soc, 160(2), 95-98.
Kibler, W. B., & McMullen, J. (2003). Scapular dyskinesis and its relation to shoulder
pain. J Am Acad Orthop Surg, 11(2), 142-151.
Kiesel, K., Plisky, P., & Butler, R. (2009). Functional movement test scores improve
following a standardized off-season intervention program in professional football
players. Scand J Med Sci Sports, 21(2), 287-292. doi: SMS1038 [pii]
10.1111/j.1600-0838.2009.01038.x
Kiesel, K., Plisky, P. J., & Voight, M. L. (2007). Can Serious Injury in Professional
Football be Predicted by a Preseason Functional Movement Screen? North
American Journal of Sports Physical Therapy, 2(3), 147-158.
122
Kirkley, A., Griffin, S., McLintock, H., & Ng, L. (1998). The development and
evaluation of a disease-specific quality of life measurement tool for shoulder
instability. The Western Ontario Shoulder Instability Index (WOSI). The
American Journal of Sports Medicine, 26(6), 764-772.
Kohlmeyer, E. A. (2005). Effects of extended pitch count on shoulder kinematics in
intercollegiate baseball pitchers. (Master's of Science), University of Pittsburg,
Pittsburg, PA.
Kraeutler, M. J., Ciccotti, M. G., Dodson, C. C., Frederick, R. W., Cammarota, B., &
Cohen, S. B. (2012). Kerlan-Jobe Orthopaedic Clinic overhead athlete scores in
asymptomatic professional baseball pitchers. Journal of Shoulder and Elbow
Surgery(0). doi: 10.1016/j.jse.2012.02.010
Kuhn, J. (2009). Impingement II: The Scapula in Rotator Cuff Disease. . Paper presented
at the Shoulder Symposium: Whay you need to know about the SCAPULA. The
Shoulder Center of Kentucky. , Lexington, KY. .
Laudner, K. G., Sipes, R. C., & Wilson, J. T. (2008). The acute effects of sleeper
stretches on shoulder range of motion. Journal of Athletic Training, 43(4), 359-
363.
Lewis, J. S., & Valentine, Rachel. (2007). The pectoralis minor length test: a study of the
intra-rater reliability and diagnostic accuracy in subjects with and without
shoulder symptoms. BMC Musculoskeletal Disorders, 8(1), 64.
Lintner, D., Mayol, M., Uzodinma, O., Jones, R., & Labossiere, D. (2007). Glenohumeral
Internal Rotation Deficits in Professional Pitchers Enrolled in an Internal Rotation
Stretching Program. Am J Sports Med, 35(4), 617-621. doi:
10.1177/0363546506296736
Litaker, D., Pioro, M., El Bilbeisi, H., & Brems, J. (2000). Returning to the bedside:
using the history and physical examination to identify rotator cuff tears. J Am
Geriatr Soc, 48(12), 1633-1637.
Litcher-Kelly, L., Martino, S. A., Broderick, J. E., & Stone, A. A. (2007). A Systematic
Review of Measures Used to Assess Chronic Musculoskeletal Pain in Clinical and
Randomized Controlled Clinical Trials. J Pain, 8(12), 906-913.
Lo, I. K., Griffin, S., & Kirkley, A. (2001). The development of a disease-specific quality
of life measurement tool for osteoarthritis of the shoulder: The Western Ontario
Osteoarthritis of the Shoulder (WOOS) index. Osteoarthritis Cartilage, 9(8), 771-
778. doi: 10.1053/joca.2001.0474 [doi] S1063-4584(01)90474-1 [pii]

123
Lockard, M. (2006). Clinical Biomechanics of the Elbow. Journal of Hand Therapy,
19(2), 72-81. doi: 10.1197/j.jht.2006.02.004
Lyman, S., & Fleisig, G. S. (2005). Baseball injuries. Medicine and Sports Science, 49, 9-
30. doi: 10.1159/000085340 [pii] 10.1159/000085340 [doi]
Lyman, S., Fleisig, G. S., Andrews, J. R., & Osinski, E. D. (2002). Effect of pitch type,
pitch count, and pitching mechanics on risk of elbow and shoulder pain in youth
baseball pitchers. The American Journal of Sports Medicine, 30(4), 463-468.
Macaskill, P. , Gatsonis, C., Deeks, J.J. , Harbord, R.M. , & Takwoingi, Y. . (2010).
Chapter 10 Analysing and Presenting Results. In J. J. Deeks, P. M. Bossuyt & C.
Gatsonis (Eds.), Cochrane Handbook for Systematic Reviews of Diagnostic Test
Accuracy Version 1.0: The Cochrane Collaboration
Magra, M., Caine, D., & Maffulli, N. (2007). A review of epidemiology of paediatric
elbow injuries in sports. Sports Medicine, 37(8), 717-735.
Marsh, D. W., Richard, L. A., Williams, L. A., & Lynch, K. J. (2004). The relationship
between balance and pitching error in college baseball pitchers. J Strength Cond
Res, 18(3), 441-446. doi: 10.1519/r-13433.1
Marshall, S. W., Hamstra-Wright, K. L., Dick, R., Grove, K. A., & Agel, J. (2007).
Descriptive epidemiology of collegiate women's softball injuries: National
Collegiate Athletic Association Injury Surveillance System, 1988-1989 through
2003-2004. Journal of Athletic Training, 42(2), 286-294.
Mattacola, C. G. (2011). Outcomes assessment in sport rehabilitation. Journal of Sport
Rehabilitation, 20(1), 1-2.
McFarland, E. G., & Wasik, M. (1998). Epidemiology of collegiate baseball injuries.
Clinical Journal of Sport Medicine, 8(1), 10-13.
McGinn, T. G., Guyatt, G. H., Wyer, P. C., Naylor, C. D., Stiell, I. G., & Richardson, W.
S. (2000). Users' guides to the medical literature: XXII: how to use articles about
clinical decision rules. Evidence-Based Medicine Working Group. The Journal of
the American Medical Association, 284(1), 79-84.
McHugh, M. P., Tyler, T. F., Shanley, E., Rauh, M. J., Michener, L. A., Ellenbecker, T.
S., . . . Thigpen, C. A. (2012). Shoulder and elbow injuries in high school softball
and baseball players: letter to the editor. Am J Sports Med, 40(9), NP21-22. doi:
10.1177/0363546512457626
Michener, L. A. (2011). Patient- and clinician-rated outcome measures for clinical
decision making in rehabilitation. Journal of Sport Rehabilitation, 20(1), 37-45.

124
Michener, L. A., McClure, P. W., & Sennett, B. J. (2002). American Shoulder and Elbow
Surgeons Standardized Shoulder Assessment Form, patient self-report section:
reliability, validity, and responsiveness. Journal of Shoulder and Elbow Surgery,
11(6), 587-594. doi: 10.1067/mse.2002.127096 [doi] S1058274602000940 [pii]
Minick, K. I., Kiesel, K. B., Burton, L., Taylor, A., Plisky, P., & Butler, R. J. (2010).
Interrater reliability of the functional movement screen. Journal of Strength and
Conditioning Research, 24(2), 479-486. doi: 10.1519/JSC.0b013e3181c09c04
Mueller, F. O., Marshall, S. W., & Kirby, D. P. (2001). Injuries in Little League Baseball
from 1987 through 1996 - Implications for prevention. Physician and
Sportsmedicine, 29(7), 41-48.
Mullaney, M. J., McHugh, M. P., Donofrio, T. M., & Nicholas, S. J. (2005). Upper and
Lower Extremity Muscle Fatigue After a Baseball Pitching Performance. The
American Journal of Sports Medicine, 33(1), 108-113. doi:
10.1177/0363546504266071
Namdari, S., Baldwin, K., Ahn, A., Huffman, G. R., & Sennett, B. J. (2011). Performance
after rotator cuff tear and operative treatment: a case-control study of major
league baseball pitchers. Journal of Athletic Training, 46(3), 296-302.
NATA. (2010). Evidence-Based Medince. Retrieved July 25, 2010, from
http://www.nata.org/EvidenceBasedEdu
NATA (Ed.). (2011). Athlteic Training Education Competencies (5th ed.): National
Athletic Trainers’ Association.
Neri, B. R., ElAttrache, N. S., Owsley, K. C., Mohr, K., & Yocum, L. A. (2010).
Outcome of type II superior labral anterior posterior repairs in elite overhead
athletes: Effect of concomitant partial-thickness rotator cuff tears. The American
Journal of Sports Medicine, 39(1), 114-120. doi: 0363546510379971 [pii]
10.1177/0363546510379971
Neuman, B. J., Boisvert, C. B., Reiter, B., Lawson, K., Ciccotti, M. G., & Cohen, S. B.
(2011). Results of Arthroscopic Repair of Type II Superior Labral Anterior
Posterior Lesions in Overhead Athletes: Assessment of Return to Preinjury
Playing Level and Satisfaction. The American Journal of Sports Medicine. doi:
0363546511412317 [pii] 10.1177/0363546511412317
Norman, G. R., & Streiner, D. L. (2008). Biostatistics:The bare essentials (3rd ed.).
Hamilton, Ontario: B.C. Decker Inc.

125
Oliver, G. D., Plummer, H. A., & Keeley, D. W. (2011). Muscle activation patterns of the
upper and lower extremity during the windmill softball pitch. Journal of Strength
and Conditioning Research, 25(6), 1653-1658. doi:
10.1519/JSC.0b013e3181db9d4f
Olsen, S. J., Fleisig, G. S., Dun, S., Loftice, J., & Andrews, J. R. (2006). Risk factors for
shoulder and elbow injuries in adolescent baseball pitchers. The American
Journal of Sports Medicine, 34(6), 905-912. doi: 10.1177/0363546505284188
Ortiz, J. L. (2011). Baseball's hardest throwers also among most injury-prone, USA
Today.
Pallant, J. (2010). SPSS Survival Mannual (4th ed.). Berkshire, England: Open University
Press.
Park, H. B., Yokota, A., Gill, H. S., El Rassi, G., & McFarland, E. G. (2005). Diagnostic
accuracy of clinical tests for the different degrees of subacromial impingement
syndrome. J Bone Joint Surg Am, 87(7), 1446-1455. doi: 10.2106/JBJS.D.02335
Parsons, J. T., & Snyder, A. R. (2011). Health-related quality of life as a primary clinical
outcome in sport rehabilitation. Journal of Sport Rehabilitation, 20(1), 17-36.
Pasternack, J. S., Veenema, K. R., & Callahan, C. M. (1996). Baseball Injuries: A Little
League Survey. Pediatrics, 98(3), 445-448.
Petty, D. H., Andrews, J. R., Fleisig, G. S., & Cain, E. L. (2004). Ulnar collateral
ligament reconstruction in high school baseball players: clinical results and injury
risk factors. The American Journal of Sports Medicine, 32(5), 1158-1164. doi:
10.1177/0363546503262166
Plisky, P. J., Gorman, P. P., Butler, R. J., Kiesel, K. B., Underwood, F. B., & Elkins, B.
(2009). The reliability of an instrumented device for measuring components of the
star excursion balance test. North American Journal of Sports Physical Therapy,
4(2), 92-99.
Plisky, P. J., Rauh, M. J., Kaminski, T. W., & Underwood, F. B. (2006). Star Excursion
Balance Test as a predictor of lower extremity injury in high school basketball
players. Journal of Orthopaedic & Sports Physical Therapy, 36(12), 911-919.
Portney, L. G., & Watkins, M. P. (2009). Foundations of Clinical Research: Applications
to Practice (3rd ed.). Upper Saddle River, NJ: Pearson Education, INC.
126
Posner, M., Cameron, K. L., Wolf, J. M., Belmont, P. J., Jr., & Owens, B. D. (2011).
Epidemiology of major league baseball injuries. The American Journal of Sports
Medicine, 39(8), 1676-1680. doi: 0363546511411700 [pii]
10.1177/0363546511411700
Raney, N. H., Petersen, E. J., Smith, T. A., Cowan, J. E., Rendeiro, D. G., Deyle, G. D.,
& Childs, J. D. (2009). Development of a clinical prediction rule to identify
patients with neck pain likely to benefit from cervical traction and exercise. Eur
Spine J, 18(3), 382-391. doi: 10.1007/s00586-008-0859-7
Reiman, M. P., & Manske, R. C. (2011). The assessment of function: How is it
measured? A clinical perspective. J Man Manip Ther, 19(2), 91-99. doi:
10.1179/106698111X12973307659546
Reiman, M. P., & Manske, R. C. (2009). Functional Testing in Human Performance.
Champaign, IL: Human Kinetics.
Roush, J. R., Kitamura, J., & Waits, M. C. (2007). Reference Values for the Closed
Kinetic Chain Upper Extremity Stability Test (CKCUEST) for Collegiate
Baseball Players. North American Journal of Sports Physical Therapy, 2(3), 159-
163.
Sackett, D., Straus, S., Richardson, W., Rosenberg, W., & Haynes, R. (1997). Evidence-
based medicine. How to teach and practice EBM (7th ed.). New York, NY:
Churchhill Livingstone.
Sauers, E. L., Dykstra, D. L., Bay, R. C., Bliven, K. H., & Snyder, A. R. (2011). Upper
extremity injury history, current pain rating, and health-related quality of life in
female softball pitchers. Journal of Sport Rehabilitation, 20(1), 100-114.
Sauers, E. L., Ellery, T. E. , Snyder, A. R. , & Bay, R. C. . (2008). The Design and
Development of the Functional Arm Scale for Throwers© (FAST©). Post-
Professional Athletic Training Program, A. T. Still University. Mesa, AZ.
Sauers, E. L., & Snyder, A. R. (2011). A team approach: demonstrating sport
rehabilitation's effectiveness and enhancing patient care through clinical outcomes
assessment. Journal of Sport Rehabilitation, 20(1), 3-7.
127
Sauers, E. L., Thigpen, C., Huxel, K., & Bay, R. C. (2009). The Relationships Between
Self-Reported Pain and Injury History, the Functional Arm Scale for Throwers©
(FAST©), and the Disabilities of the arm, Shoulder, and Hand (DASH) in
Adolescent Baseball Pitchers. Paper presented at the 2009 Annual Conference
Abstracts, Post-Professional Athletic Training Program, A. T. Still University,
Mesa, AZ, . http://www.asset-
usa.org/Materials/2009AnnualConferenceAbstracts/Sauers_ASSET_09_Research.
Schneiders, A. G., Davidsson, A., Horman, E., & Sullivan, S. J. (2011). Functional
movement screen normative values in a young, active population. Int J Sports
Physical Therapy, 6(2), 75-82.
Sciascia, A., & Kibler, W. B. (2006). The pediatric overhead athlete: What is the real
problem? Clinical Journal of Sport Medicine, 16(6), 471-477.
Snyder, A. R., Parsons, J. T., Valovich McLeod, T. C., Curtis Bay, R., Michener, L. A.,
& Sauers, E.L. (2008). Using disablement models and clinical outcomes
assessment to enable evidence-based athletic training practice, part I: disablement
models. Journal of Athletic Training, 43(4), 428-436.
Steiner, J. F., Kramer, A. M., Eilertsen, T. B., & Kowalsky, J. C. (1997). Development
and validation of a clinical prediction rule for prolonged nursing home residence
after hip fracture. Journal of the American Geriatrics Society, 45(12), 1510-1514.
Steyerberg, E. W. (2010). Clinical Prediction Models: A practical approach to
development, validation, and updating. New York, NY: Springer.
Stiell, I. G., McKnight, R. D., Greenberg, G. H., Nair, R. C., McDowell, I., & Wallace,
G. J. (1992). Interobserver agreement in the examination of acute ankle injury
patients. Am J Emerg Med, 10(1), 14-17.
Stone, A. A., Broderick, J. E., Kaell, A. T., DelesPaul, P. A., & Porter, L. E. (2000). Does
the peak-end phenomenon observed in laboratory pain studies apply to real-world
pain in rheumatoid arthritics? J Pain, 1(3), 212-217. doi: 10.1054/jpai.2000.7568
Stone, A. A., Broderick, J. E., Shiffman, S. S., & Schwartz, J. E. (2004). Understanding
recall of weekly pain from a momentary assessment perspective: absolute
agreement, between- and within-person consistency, and judged change in weekly
pain. Pain, 107(1-2), 61-69.
Streiner, D. L, & Norman, G. R. (2008). Health Measures Scales: A practical Guide to
their development and use (4th ed.). New York, New York: Oxford University
Press.

128
Suk, M., Hanson, B. P., Norvell, D. C., & Helfet, D. L. (2009). AO Handbook
Musculoskeletal Outcomes Measures and Instrument (Vol. 1 Selection and
Assessment Upper Extremity). New York: Thieme.
Sweitzer, B. A., Thigpen, C. A., Shanley, E., Stranges, G., Wienke, J. R., Storey, T., . . .
Wyland, D. J. (2012). A Comparison of Glenoid Morphology and Glenohumeral
Range of Motion Between Professional Baseball Pitchers With and Without a
History of SLAP Repair. Arthroscopy: The Journal of Arthroscopic &
Related Surgery, 28(9), 1206-1213. doi: 10.1016/j.arthro.2012.02.023
Teyhen, D. S., Flynn, T. W., Childs, J. D., & Abraham, L. D. (2007). Arthrokinematics in
a subgroup of patients likely to benefit from a lumbar stabilization exercise
program. Phys Ther, 87(3), 313-325. doi: 10.2522/ptj.20060253
Teyhen, D. S., Shaffer, S. W., Lorenson, C. L., Halfpap, J. P., Donofry, D. F., Walker, M.
J., . . . Childs, J. D. (2012). The functional movement screen: a reliability study. J
Orthop Sports Phys Ther, 42(6), 530-540. doi: 10.2519/jospt.2012.3838
Thigpen, C., & Shanley, E. (2011). Clinical assessment of upper extremity injury
outcomes. Journal of Sport Rehabilitation, 20(1), 61-73.
Tokish, J. M, Curtin, M. S., Kim, Y. K., Hawkins, R. J., & Torry, M. R. (2008).
Glenohumeral internal rotation deficit in the asymptomatic professional pitcher
and its relationship to humeral retroversion. Journal of Sports Science and
Medicine, 7(1), 78-83.
Toll, D. B., Janssen, K. J., Vergouwe, Y., & Moons, K. G. (2008). Validation, updating
and impact of clinical prediction rules: a review. J Clin Epidemiol, 61(11), 1085-
1094. doi: 10.1016/j.jclinepi.2008.04.008
Valovich McLeod, T. C., Snyder, A. R., Parsons, J. T., Curtis Bay, R., Michener, L. A.,
& Sauers, E.L. (2008). Using disablement models and clinical outcomes
assessment to enable evidence-based athletic training practice, part II: clinical
outcomes assessment. Journal of Athletic Training, 43(4), 437-445.
Van Tiggelen, D., Wickes, S., Stevens, V., Roosen, P., & Witvrouw, E. (2008). Effective
prevention of sports injuries: a model integrating efficacy, efficiency, compliance
and risk-taking behaviour. British Journal of Sports Medicine, 42(8), 648-652.
doi: bjsm.2008.046441 [pii] 10.1136/bjsm.2008.046441
Wagenmakers, E. J., Lee, M., Lodewyckx, T., & Iverson, G. J. (2008). Bayesian Versus
Frequentist Inference Bayesian Evaluation of Informative Hypotheses. In H.
Hoijtink, I. Klugkist & P. A. Boelen (Eds.), (pp. 181-207): Springer New York.

129
Wainner, R. S., Fritz, J. M., Irrgang, J. J., Delitto, A., Allison, S., & Boninger, M. L.
(2005). Development of a clinical prediction rule for the diagnosis of carpal
tunnel syndrome. Arch Phys Med Rehabil, 86(4), 609-618. doi:
10.1016/j.apmr.2004.11.008
Werner, S. L., Guido, J. A., McNeice, R. P., Richardson, J. L., Delude, N. A., & Stewart,
G. W. (2005). Biomechanics of youth windmill softball pitching. The American
Journal of Sports Medicine, 33(4), 552-560. doi: 10.1177/0363546504269253
Werner, S. L., Jones, D. G., Guido, J. A., Jr., & Brunet, M. E. (2006). Kinematics and
kinetics of elite windmill softball pitching. The American Journal of Sports
Medicine, 34(4), 597-603. doi: 10.1177/0363546505281796
Wilk, K. E., Macrina, L. C., Fleisig, G. S., Porterfield, R., Simpson, C. D., 2nd, Harker,
P., . . . Andrews, J. R. (2010). Correlation of glenohumeral internal rotation deficit
and total rotational motion to shoulder injuries in professional baseball pitchers.
The American Journal of Sports Medicine, 39(2), 329-335. doi:
0363546510384223 [pii] 10.1177/0363546510384223
Wilkerson, G. B. (2010). Prediction of Core and Lower Extremity Strains and Sprains in
College Football Players: A Preliminary Study. . The University of Tennessee at
Chattanooga. Chattanooga, TN.
Wilkerson, G. B., Bullard, J. T., & Bartal, D. W. (2010). Identification of
cardiometabolic risk among collegiate football players. J Athl Train, 45(1), 67-74.
doi: 10.4085/1062-6050-45.1.67
Wilkerson, G. B., Giles, J. L., & Seibel, D. K. (2012). Prediction of core and lower
extremity strains and sprains in college football players. Journal of Athletic
Training, 47(3), 264-272. doi: 10.4085/1062-6050-47.3.17
Wilkerson, G. B. (2010). Prediction of Core and Lower Extremity Strains and Sprains in
College Football Players: A Preliminary Study. The University of Tennessee at
Chattanooga,. Chattanooga, TN.
Williams, G. N., Gangel, T. J., Arciero, R. A., Uhorchak, J. M., & Taylor, D. C. (1999).
Comparison of the Single Assessment Numeric Evaluation method and two
shoulder rating scales. Outcomes measures after shoulder surgery. The American
Journal of Sports Medicine, 27(2), 214-221.
Winke, M. R. , Dalton, K., Mendell, J., & Nicchi, M. (2012). Functional Movement
Screen; Injury prediction; Prehabilitation Paper presented at the ACSM Annual
Meeting, San Fransico, CA.

130
Wood, N., Konin, J. G., & Nofsinger, C. (2010). Diagnosis of an ulnar collateral ligament
tear using musculoskeletal ultrasound in a collegiate baseball pitcher: a case
report. North American Journal of Sports Physical Therapy, 5(4), 227-233.
Wright, A. A., Cook, C. E., Baxter, G. D., Dockerty, J. D., & Abbott, J. H. (2011). A
comparison of 3 methodological approaches to defining major clinically
important improvement of 4 performance measures in patients with hip
osteoarthritis. Journal of Orthopaedic & Sports Physical Therapy, 41(5), 319-
327. doi: 10.2519/jospt.2011.3515
Wright, A. A., Cook, C. E., Baxter, G. D., Garcia, J., & Abbott, J. H. (2010).
Relationship between the Western Ontario and McMaster Universities
Osteoarthritis Index Physical Function Subscale and physical performance
measures in patients with hip osteoarthritis. Archives of Physical Medicine and
Rehabilitation, 91(10), 1558-1564. doi: 10.1016/j.apmr.2010.07.016
Wright, A. A., Cook, C. E., Flynn, T. W., Baxter, G. D., & Abbott, J. H. (2011).
Predictors of response to physical therapy intervention in patients with primary
hip osteoarthritis. Physical Therapy, 91(4), 510-524. doi: 10.2522/ptj.20100171
Wright, R. W., & Baumgarten, K. M. (2010). Shoulder outcomes measures. J Am Acad
Orthop Surg, 18(7), 436-444. doi: 18/7/436 [pii]
Yanagisawa, O., Niitsu, M., Takahashi, H., & Itai, Y. (2003). Magnetic resonance
imaging of the rotator cuff muscles after baseball pitching. Journal of Sports
Medicine and Physical Fitness, 43(4), 493-499.
Yildiz, Y., Aydin, T., Sekir, U., Kiralp, M. Z., Hazneci, B., & Kalyon, T. A. (2006).
Shoulder terminal range eccentric antagonist/concentric agonist strength ratios in
overhead athletes. Scandinavian Journal of Medicine & Science in Sports, 16(3),
174-180. doi: 10.1111/j.1600-0838.2005.00471.x

131
APPENDIX A
KERLAN-JOBE ORTHOPAEDIC CLINIC SHOULDER & ELBOW SCORE
(KJOC-SES)

132

133

134

135
APPENDIX B
TARGETED ENHANCED ATHLETIC MOVEMENT SCREEN (TEAM-S)

136

137
Athlete’s Name:
Date today:
Date of Birth:
Age: Gender (circle one): Male Female
Sport:
Position:
Year in School:
TOTAL SCORE: _________/75
X 100= ____________%
Scoring is done by taking the score of each individual test and adding them together.
If the test has more than 1 score (ex: left and right scores) then the LOWEST of
those scores is taken to compute the overall TOTAL SCORE.

138
SCORING SHEETS
1. BEIGHTON HYPERMOBILITY
L R
Hands on the floor with knees straight 1
Elbow hyperextension 1 1
Knee hyperextension 1 1
Thumb to forearm 1 1
Little finger 90 degrees or more 1 1
TOTAL ________/9
points 0-1 2-3 4-5 6-7 8-9 pain
SCORE 5 4 3 2 1 0

139
2. FULL SQUAT
Description:
3 reps to allow views from different
angles
PVC overhead and 2x4 under heels as
needed. Feet shoulder width apart, toes
point straight ahead, heels stay on
ground, squat below parallel
Common Errors: Knees to midline, heels come off ground, shoulders flex forward,
lean left or right, toes rotate out
Score (check one): COMMENTS:
Full squat (below
90), no substitutions
5
Squat to parallel, no
substitutions
4
Full squat with 2x4
no substitutions
3
Squat to parallel with
2x4, no substitutions
2
Unable to squat
without substitutions
to parallel even with
a 2x4
1
Pain with test 0

140
3. SINGLE LEG SQUAT
Description:
5 reps with worst of last 2 reps scored.
Subject stands on 1 leg and touches their
rear to a stool, then stands back up. The
stool is at a height where the squat is
parallel to the floor (90 deg). Watch for
the common errors listed below
Common Errors: Loss of balance, knees to midline, lack of depth, toe in/out, lateral
trunk lean
Score (check one): COMMENTS:
L
R
0-1 error present 5
5
2 errors present 4
4
3 errors present 3
3
4 errors present 2
2
5+ errors present
1
1
Pain with test 0 0

141
4. Downward Dog
Description:
Start on all fours, knees under hips and
hands one hand length in front of
shoulders. Straighten legs and arms,
flattening scapula to back forming and
inverted V.
Common Errors: heels don’t touch ground, inverted U shape
Score (check one): COMMENTS:
patient able to touch
heels to floor and
assume inverted V
position
5
both heels to floor
with adjusted hand
position, and flat
back
4
both heels to floor
with adjusted hand
position and rounded
back
3
one heel to floor with
other leg lifted
straight back
2
unable to get heel to
floor with one leg
lifted straight back
1
Pain with test 0

142
5. Active Straight Leg Raise
Description:
Patient lays on back with legs straight,
toes pointing toward ceiling and 2x4
under knees. Arms flat on ground.
Instruct subject to lift their leg keeping it
straight. Examiner places dowel in line
with the medial malleolus. Test is named
for the leg lifted
Common Errors: bent knee on either leg, leg rotates outward (either leg)
Score (check one): COMMENTS:
L
R
dowel lines up with
greater trochanter
(GT) or above
(90+degrees of hip
flexion)
5
5
dowel lines up
between mid-thigh
and GT
4
4
dowel lines up
between patella and
mid-thigh
3
3
dowel lines up
between patella and
mid-shin
2
2
dowel lines up below
mid-shin
1
1
Pain with test
0 0
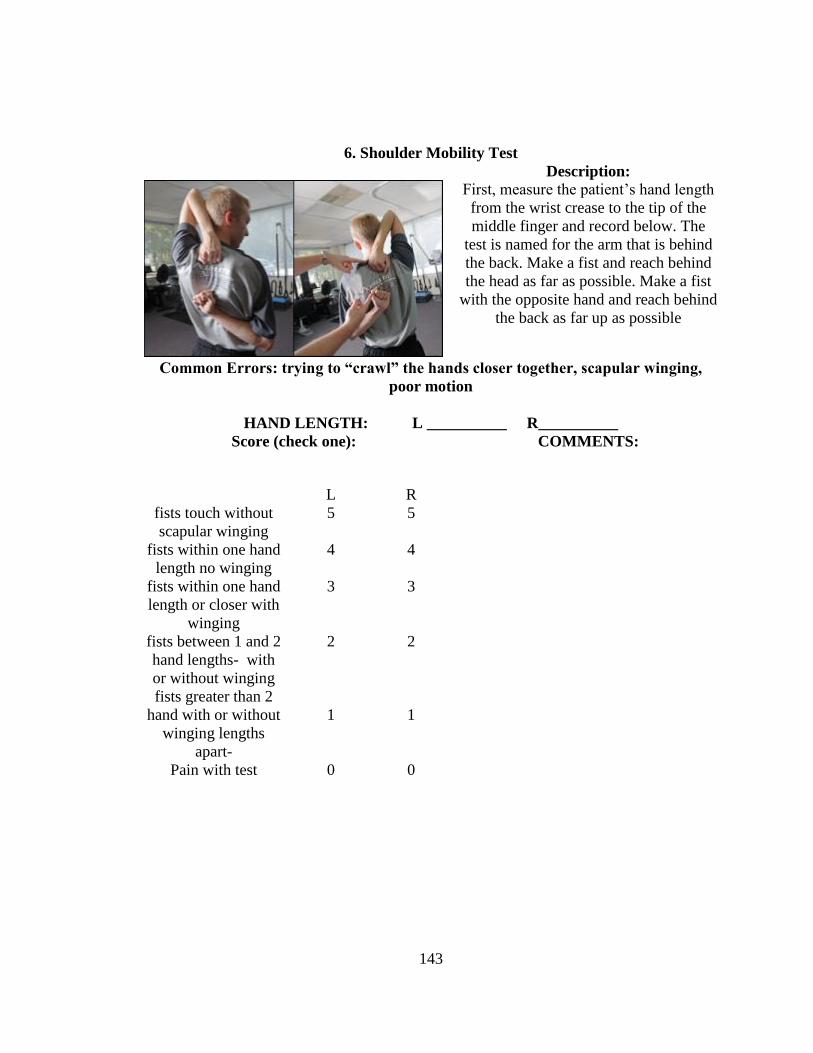
143
6. Shoulder Mobility Test
Description:
First, measure the patient’s hand length
from the wrist crease to the tip of the
middle finger and record below. The
test is named for the arm that is behind
the back. Make a fist and reach behind
the head as far as possible. Make a fist
with the opposite hand and reach behind
the back as far up as possible
Common Errors: trying to “crawl” the hands closer together, scapular winging,
poor motion
HAND LENGTH: L __________ R__________
Score (check one): COMMENTS:
L
R
fists touch without
scapular winging
5
5
fists within one hand
length no winging
4
4
fists within one hand
length or closer with
winging
3
3
fists between 1 and 2
hand lengths- with
or without winging
2
2
fists greater than 2
hand with or without
winging lengths
apart-
1
1
Pain with test
0 0

144
7. Y-Balance for UE
Trial
Reach
Directio
n
1
L
R
2
L
R
3
L
R
Lateral
Overhe
ad
Undern
eath
Description:
Measure C7 spinous process to longest
fingertip with arm in 90 degrees
abduction. Assume push-up position. 3
trials will be performed in each direction.
All 3 directions (lateral, inferomedial,
superomedial) performed without rest.
The sum of the greatest reach in each
direction is divided by 3x the limb length
then multiplied by 100. Test is named for
the non-reaching arm
Common Errors: trying to “crawl” the hands closer together, scapular winging,
poor motion
LIMB LENGTH: L __________ R__________
Sum of greatest 3 reaches: L_________/3 x 100= _______________
R_________/3 x 100= _______________
Score (check one): COMMENTS:
one arm 95%-100%
of the other
5
One arm 90%- 94%
of the other
4
One arm 85%- 89%
of the other
3
One arm 80%- 84%
of the other
2
One arm 79% or less
of the other
1
Pain with test
0

145
8. CKCUEST
Description:
2 pieces of tape 36 inches apart. Athlete
places their arms in a shoulder width,
push-up position between the pieces of
tape. Athlete alternates touching the
pieces of tape. Record # of cross-body
touches in 15 sec
Common Errors: poor quickness
Score (check one): COMMENTS:
patient able to touch
30+ times
5
patient able to touch
25-29 times
4
patient able to touch
20-24 times
3
patient able to touch
15-19 times
2
patient able to touch
14 or less times
1
Pain with test 0

146
9. Side Plank Hip Abduction
Description:
Subject is in a side plank position on
elbow with feet together and opposite
hand on hips. Only bottom foot (not leg)
and elbow should touch the ground. Lift
top leg at least 8 inches and return to
start as many times as possible in 30 sec.
Rest 2 minutes, and repeat on the
opposite side. Test is named for the leg
lifted
Common Errors: top leg cannot be lifted, top leg flexes forward during test, entire
lower leg of bottom leg touches the ground, trunk flexes
Score (check one): COMMENTS:
L
R
30+ reps 5
5
25-29 4
4
20-24 3
3
15-19 2
2
14 or less
1
1
Pain with test
0 0

147
10. Side Plank Hip Adduction
Description:
Subject is in a side plank position on
elbow with one foot touching the ground
and the other resting on a bench. Or
chair The opposite hand rests on hips.
Only bottom foot (not leg) and elbow
should touch the ground. Lift bottom leg
at least 8 inches and return to start as
many times as possible in 30 sec. Rest 2
minutes, and repeat on the opposite side.
Test is named for the leg lifted
Common Errors: bottom leg cannot be lifted, bottom leg flexes forward during test,
entire lower leg of bottom leg touches the ground, trunk flexes
Score (check one): COMMENTS:
L
R
35+ reps 5
5
30-34 4
4
25-29 3
3
20-24 2
2
23 or less
1
1
Pain with test
0 0

148
11. Nordic Hamstring Test
Description:
Subject kneels and
examiner holds ankles.
Keeping a perfectly
straight body with arms
at the ready (push-up
position), the subject
leans slowly forward.
Examiner measures knee
flexion angle at failure
(athlete lets go)
Common Errors: butt sticks out, trunk flexes, hamstring cramp
Score (check one): COMMENTS:
45 degrees + 5
35-44 degrees 4
25-34 degrees 3
15-24 degrees 2
5-14 degrees
1
Pain with test or less than 5
degrees
0

149
12. Triple Hop for Distance
Description:
Measure leg length in standing from ASIS
to beneath the lateral malleolus. Hands on
hips, jump and land 3 consecutive times
on the same leg. Each athlete may have
one practice trial. They must stick the
landing. Record the total distance jumped
on each leg. The hop will he measured
from the starting line to the back of the
heel after the third hop on each trial.
Common Errors: use of hands, fall off balance
LIMB LENGTH: L __________ R__________
Distance hopped: L_________ R_________
Least distance/greatest distance x 100= _______________
Score (check one): COMMENTS:
one leg 95%-100% of
the other
5
One leg 90%- 94% of
the other
4
One leg 85%- 89% of
the other
3
One leg 80%- 84% of
the other
2
One leg 79% or less
of the other
1
Pain with test
0

150
13. Vertical Leap
Description:
First, record stand-and-reach height by
having the participant extend the
preferred reach hand as high as possible
with feet flat on the floor. Subject
should bend the hips and knees, and,
without pausing, jump as high as
possible. Arm swing is allowed. Record
jump-and-reach height. VJ height is
calculated by subtracting the stand-and-
reach height from the jump-and-reach
height. Participants are permitted 1
practice jump before completing 3 test
trials. The maximal height reached
during the 3 test trials is recorded.
Common Errors: any steps taken
(a)Stand and reach height: ____________in. (b)Jump and Reach Height:
_________in.
VJ Height: (b) – (a) ________________in.
Score (check one): COMMENTS:
Men- 30+ in.
Women- 20+ in.
5
Men- 26-29 in.
Women- 16-19 in.
4
Men- 22-25 in.
Women- 12-15 in.
3
Men- 18-21 in.
Women- 8-11 in.
2
Men- 17 or less in.
Women- 7 or less in.
1
Pain with test 0

151
14. In-Line Lunge for Distance
Description:
First, measure leg length from beneath
the ASIS to beneath the lateral
malleolus. Toes are behind a line on the
floor, hands on hips. Subject steps out as
far as possible with one leg while toe of
the other leg must stay behind the start
line. Measure distance by heel of the
lead leg. Take the best of 3 trials for
each leg. The test is named for the
trail leg
Common Errors: dragging the rear foot forward, losing balance
LIMB LENGTH: L __________ in. R__________ in.
Distance Lunged: L_________ in. R_________ in.
Score (check one): COMMENTS:
L
R
one leg 95%-100%
of the other
5
5
One leg 90%- 94%
of the other
4
4
One leg 85%- 89%
of the other
3
3
One leg 80%- 84%
of the other
2
2
One leg 79% or less
of the other
1
1
Pain with test
0 0

152
15. Lateral Lunge for Distance
Description:
First, measure leg length from beneath
the ASIS to beneath the lateral
malleolus. Medial aspect of trail leg is
behind a line on the floor, hands on hips.
Subject steps out as far as possible with
one leg while foot of the other leg must
stay behind the start line and flat to the
floor. Measure distance by the medial
border of the lead leg (toes pointing
straight ahead). Take the best of 3 trials
for each leg.
The test is named for the trail leg
Common Errors: dragging the rear foot forward, losing balance, rotating the lead
foot outward
LIMB LENGTH: L __________ in. R__________ in.
Distance Lunged: L_________ in. R_________ in.
Score (check one): COMMENTS:
L
R
one leg 95%-100%
of the other
5
5
One leg 90%- 94%
of the other
4
4
One leg 85%- 89%
of the other
3
3
One leg 80%- 84%
of the other
2
2
One leg 79% or less
of the other
1
1
Pain with test
0 0

153
APPENDIX C
HIGH POINT UNIVERSITY INSTITUTIONAL REVIEW BOARD PROTOCOL
APPROVAL

154

155
APPENDIX D
INFORMED CONSENT FORM

156

157

158
APPENDIX E
RECEIVER OPERATOR CHARACTERISTIC (ROC) CURVES

159
Figure E1. ROC Curve for KJOC-SES Score
AUC = 0.854.
Figure E2. ROC Curve for CKCUEST Absolute Score
AUC = 0.698.