Tania Mukherjee Department of Earth And Atmospheric Sciences University of Houston April 28, 2010...
17
Tania Mukherjee Department of Earth And Atmospheric Sciences University of Houston April 28, 2010 Near-surface geophysical imaging in a highly structured area, Beartooth Mountains, Montana
-
Upload
reynard-ramsey -
Category
Documents
-
view
214 -
download
1
Transcript of Tania Mukherjee Department of Earth And Atmospheric Sciences University of Houston April 28, 2010...

Tania MukherjeeDepartment of Earth And Atmospheric Sciences
University of Houston
April 28, 2010
Near-surface geophysical imaging in a highly structured area, Beartooth Mountains, Montana

Content• Introduction to the geology and motive of the survey• Acquisition and instrumentation
Well log (Gamma,SP, resistivity,sonic, acoustic televiewer ,neutron porosity)
VSP (simultaneous three component near offset VSP in two borehole)
Surface seismic (2D seismic line )
Gravity ( two perpendicular gravity profile near borehole)• Interpretation Core samples Well log VSP Surface seismic Gravity• Conclusion• Future work• Acknowledgement

N
Simplified statigraphy ( Kauffman et al.(2008)
Geology of Beartooth,Montana

Survey Layout
YBRA CAMP
Gravity profile 1
YB 1 YB2Seismic line
Gravity profile 2
Tear Zone
Index
Borehole Gravity profile Seismic lineTear Fault

Data acquisition (well logging)
Logging cable
winch
Tripod stand
Well
Following logs has been run in YB1 and YB2
• Natural gamma,• Spontaneous Potential• Resistivity, • Full wave sonic, • Acoustic televiewer • Neutron porosity.
Century geophysicalStudents log the wells along with field instructors.
Well 2

Data acquisition VSP
3-C Downhole Geophone
Geostuff Data Collector
GeostuffDigitizer Inverter
VSP recording cables
Source Trigger Cable
VSP source, 10 lb hammer
No of well 2 (YB1 &YB2) Cemented and cased (PVC)
Location of the wells YBRA camp
Distance between wells
6.3 m
Well depth Yb1 :30 m , Yb2 :60 m
Type of sensor 3 component down-hole locking geophone.
Recording unit Dell Tough book laptop
Sampler and digitizer Geostuff and geode
Controller software Seismodule by Geometrics
Sampling interval 0.5 ms
Record length 1.0 s
Source 10 lb Hammer
Shot location 3.77 m from YB2
Vertical Seismic Profiling was conducted simultaneously in two wells.
VSP geometry

Data acquisition (surface seismic)
• Propelled • Energy • Generator
• Data • Recorder• [Geometrics• Stratavisor]
• Vertical planted • Oyo Geophone • Survey line
Line Location YBRA camp near 70 m from well 2 ( camp location:45°11’15”N 109°14’55” )
Line orientation E-W
No of geophone 48 vertical geophones
Source 100 lb accelerated weight drop
Recording unit Stratavisor
Geophone interval 3 m
Source interval 3 m (between geophones)
Sampling 0.25ms
Record length 1.0 s
No of shots/station 4
Raw Data

YB1
Processing and Interpretation Lithology interpretation from cuttings
• The wells were drilled with a water-well rig by Douglas
Drilling using compressed air.
• Cutting samples were collected every 5 ft .
• From the cuttings, the first 7m is interpreted to be
regolith (landslide, colluvium, and pediment deposits).
• At 7m (22 ft), carbonates were encountered (possibly
Mississippian Madison limestone),
• At 40m (122 ft), a red bed was entered (unconformable
Amsden formation or the later Triassic Chugwater
formation).
40 m
7 m
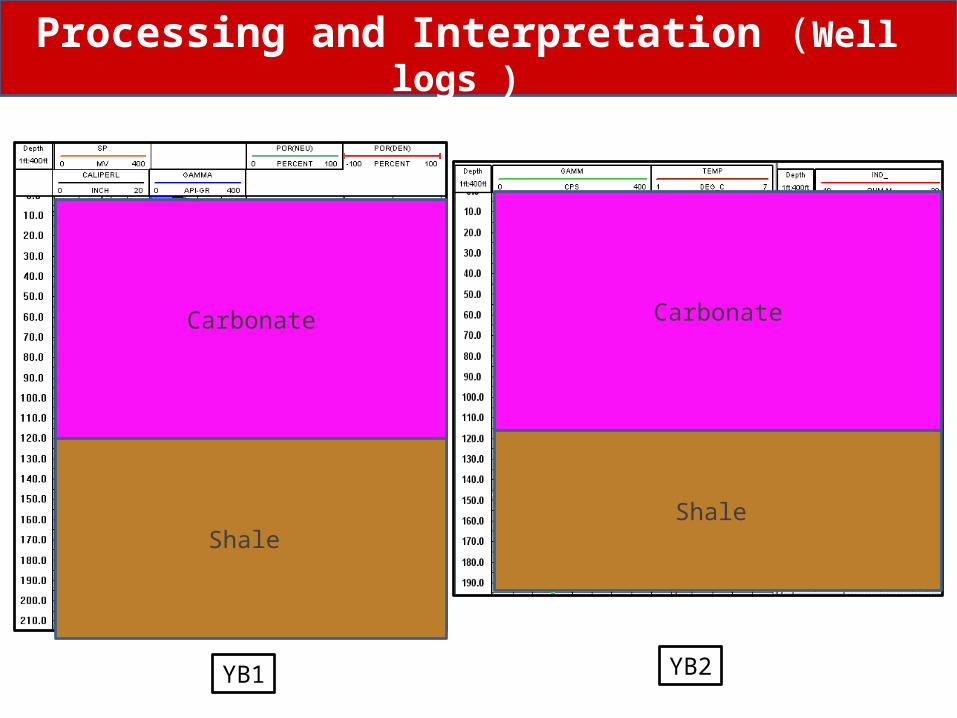
Processing and Interpretation (Well logs )
YB1 YB2
Carbonate
Shale
Carbonate
Shale

Well log (Televiewer)
Processing and Interpretations
Caliper Gamma Amp 0 360 Caliper Gamma Amp 0 360
Dipping beds
Fracture

Processing and Interpretations (VSP)
Raw vertical component VSP from YB1.Two simultaneous run are plotted together for comparison of repeatability
Frequency and amplitude spectrum of vertical component VSP if YB1 . The dominant frequency is 45-55 Hz.
Raw vertical component VSP from YB2. Frequency and amplitude spectrum of vertical component VSP of YB2 . The dominant frequency is 35-40 Hz.
P and S wave velocity inversion from first break peaks (YB2).
First breaks plot for P
First breaks plot for S
Average velocity (P)
Average velocity (S)
Internal velocity (P)
Internal velocity (S)
First breaks plot for S
P and S wave velocity inversion from first break peaks (YB1).
First breaks plot for P
Average velocity (P)
Average velocity (S)
Internal velocity (P)
Internal velocity (S)

Processing and Interpretation
Comparison of computed velocities and Vp/Vs plots from surface Waves (MASW method) and VSP.
Vp from MASW and VSP Vs from MASW and VSP
MASW by S. Roy
Vp from MASW Vp from VSP
Vs from VSP Vs from MASW
mm

High density to low density
Processing and Interpretation (gravity)

2D line near well YB 2
Processing and Interpretation (gravity)
O.Omoboya

Conclusion• The carbonate (Madison LS?) shows a lower velocity (2600 m/s) than the
competent shale beneath(2800 m/s).
• The high gamma ray count in carbonate indicates radioactive impurities .
• There is a highly fractured zone at about 130 ft (39m). The petrophysical and seismic evidence indicate the transition from carbonate to red shale occurs around 40 m.
• The dip of the formation is about 40-45° towards the south.
• Near-surface velocities from surface seismic MSAW and VSP are repetitively consistent.
• Processed 2D line shows no structure (parallel to fault ).
• A Vp / Vs value of 2.2 for the limestone and 1.7 for the shaley unit.
Future work
Allied Geophysical Lab, University of Houston. GEDCO and IonGXT. Dr.Robert R. Stewart (University of Houston ). Dr. Christopher Liner (University of Houston ). Dr.Stewart Hall (University of Houston).Dr. Joe Wong (University of Calgary). Graduate students Zimin Zhang, S. Roy and O.Omoboya
Acknowledgement
• Multi azimuth and Walkaway VSP.• 2D seismic line perpendicular to the present line.• Core sample analysis by geologist .• Well log correlation to find out vertical shift between two wells.
Thank you