Tamil Nadu Urban Infrastructure Financial Services Limited ... · Tamil Nadu Urban Infrastructure...
50
Tamil Nadu Urban Infrastructure Financial Services Limited (TNUIFSL) Final Report Conversion of City Corporate Plan to Business Plan for Kumbakonam Municipality June 2007 ICRA Management Consulting Services Limited
Transcript of Tamil Nadu Urban Infrastructure Financial Services Limited ... · Tamil Nadu Urban Infrastructure...
Tamil Nadu Urban Infrastructure Financial Services Limited (TNUIFSL)
Final Report
Conversion of City Corporate Plan to Business Plan for Kumbakonam Municipality
June 2007
ICRA Management Consulting Services Limited
Conversion of CCP to BP – Kumbakonam Municipality
Table of Contents
1. INTRODUCTION ....................................................................................................................................... 1
1.1 BACKGROUND TO THE STUDY ................................................................................................................ 1 1.2 SCOPE OF WORK ..................................................................................................................................... 1 1.3 IMACS APPROACH TO THE STUDY ......................................................................................................... 1
2. KUMBAKONAM - A BRIEF PROFILE ...................... ............................................................................ 4
2.1 LOCATION AND CONNECTIVITY .............................................................................................................. 4 2.2 SOCIAL AND DEMOGRAPHIC CHARACTERISTICS ..................................................................................... 4 2.3 ECONOMIC DEVELOPMENT .................................................................................................................... 5 2.4 HERITAGE DEVELOPMENT AND TOURISM POTENTIAL ............................................................................. 6 2.5 LAND USE MANAGEMENT ....................................................................................................................... 7 2.6 STRATEGY FOR DEVELOPMENT .............................................................................................................. 8
3. REVIEW OF OPERATING PERFORMANCE OF KUM ............ .......................................................... 9
3.1 WATER SUPPLY ..................................................................................................................................... 9 3.2 SANITATION ......................................................................................................................................... 11 3.3 STORM WATER DRAINS ........................................................................................................................ 11 3.4 SOLID WASTE MANAGEMENT .............................................................................................................. 12 3.5 ROADS AND TRANSPORT CHARACTERISTICS ........................................................................................ 12 3.6 STREET LIGHTS .................................................................................................................................... 13 3.7 OTHER FACILITIES ................................................................................................................................ 13 3.8 CAPITAL INVESTMENT PLAN ................................................................................................................ 14
4. ANALYSIS OF FINANCIAL PERFORMANCE ................. .................................................................. 17
4.1 INCOME AND EXPENDITURE SUMMARY ................................................................................................ 17 4.2 REVENUE STREAMS OF ULB IN TAMIL NADU ...................................................................................... 17 4.3 REVENUES ........................................................................................................................................... 18 4.4 ANALYSIS OF COSTS ............................................................................................................................ 22 4.5 TRENDS IN CAPITAL EXPENDITURE ..................................................................................................... 24 4.6 LOANS AND FINANCE CHARGES ........................................................................................................... 25
5. POTENTIAL AREAS FOR IMPROVEMENT ...................................................................................... 26
5.1 PUBLIC PRIVATE PARTNERSHIPS (PPP) ................................................................................................. 26 5.2 POTENTIAL FOR REVENUE ENHANCEMENT ........................................................................................... 26 5.3 MEASURES FOR COST MANAGEMENT ................................................................................................... 29 5.4 OTHER MEASURES / INTERVENTIONS .................................................................................................... 30
6. BUSINESS PLAN AND INVESTMENT CAPACITY .......................................................................... 31
6.1 FINANCIAL AND OPERATING PLAN – TIME HORIZON AND SCENARIOS .................................................. 31 6.2 BASIS AND ASSUMPTIONS .................................................................................................................... 31 6.3 RESULTS OF FINANCIAL PROJECTIONS ................................................................................................. 35 6.4 IMPACT OF POTENTIAL IMPROVEMENTS ............................................................................................... 35 6.5 KEY RESULTS ....................................................................................................................................... 36
Conversion of CCP to BP – Kumbakonam Municipality
List of Exhibits
Exhibit 1.1 IMaCS approach to the study ............................................................................................................... 1
Exhibit 2.1 Population trend ................................................................................................................................... 4
Exhibit 2.2 Commercial centres and activities ....................................................................................................... 6
Exhibit 2.2 Land-use in Kumbakonam ................................................................................................................... 7
Exhibit 3.1 Water Supply in Kumbakonam - key aspects ...................................................................................... 9 Exhibit 3.2 Water Supply – Service level ............................................................................................................. 10
Exhibit 3.3 Sanitation facilities – coverage of population .................................................................................... 11 Exhibit 3.4 Storm water drain network ................................................................................................................. 11
Exhibit 3.5 Solid Waste Management - current status .......................................................................................... 12
Exhibit 3.6 Road network ..................................................................................................................................... 12 Exhibit 3.7 Existing Street Lighting Facilities ...................................................................................................... 13
Exhibit 3.8 KuM - Felt needs (2007-12) ............................................................................................................... 15
Exhibit 3.9 KuM - Phasing of CIP (2006-15) ....................................................................................................... 16
Exhibit 4.1 Income and Expenditure of KuM - Last five years ............................................................................ 17 Exhibit 4.2 Revenue streams - ULBs in Tamil Nadu ........................................................................................... 18
Exhibit 4.3 Analysis of Revenues ......................................................................................................................... 19
Exhibit 4.4 Property tax - analysis of key revenue drivers ................................................................................... 19
Exhibit 4.5 Property Tax - breakup of assessees ................................................................................................. 20
Exhibit 4.6 Professional Tax - revenue drivers ..................................................................................................... 20
Exhibit 4.7 Professional Tax – assessee break up ................................................................................................. 21
Exhibit 4.8 Water charges - revenue drivers ......................................................................................................... 21
Exhibit 4.9 Water charges - category wise connections and tariff ........................................................................ 22 Exhibit 4.10 Costs (as a % of income – FY 2001 and FY 2005 ........................................................................... 23 Exhibit 4.11 Segment wise salary expenditure ..................................................................................................... 23
Exhibit 4.12 Operations and maintenance expenditure - Sector wise break up .................................................... 24 Exhibit 4.13 Share of Power cost ......................................................................................................................... 24
Exhibit 4.14 Capital Expenditure - Last five years ............................................................................................... 24
Exhibit 4.14 Loans outstanding (FY 2001-05) ..................................................................................................... 25
Exhibit 5.1 Key issues and suggested measures ................................................................................................... 27
Exhibit 6.1 Assumptions for other income ........................................................................................................... 33
Exhibit 6.2 Expenditure ........................................................................................................................................ 33 Exhibit 6.3 Assumptions - Assets ......................................................................................................................... 33
Exhibit 6.4 Loan Statement as on 30.09.2005 (Rs in lakh) ................................................................................. 34 Exhibit 6.5 New loans .......................................................................................................................................... 34 Exhibit 6.6 Other Liabilities ................................................................................................................................. 34 Exhibit 6.7 Income and Expenditure projections .................................................................................................. 35
Exhibit 6.8 – Potential for Revenue Improvement (figures in Rs. Lakh) ............................................................. 36 Exhibit 6.9 Summary of results of FOP ............................................................................................................... 37
Conversion of CCP to BP – Kumbakonam Municipality
List of abbreviations
BOT Build –Operate –Transfer
CAGR Cumulative Annual Growth Rate
CIP Capital Investment Program
CCP City Corporate Plan
FOP Financial and Operating Plan
GLR Ground Level Reservoir
IMaCS ICRA Management Consulting Services
KuM Kumbakonam Municipality
LPCD Litres per capita per day
MSW Municipal Solid Waste
OHT Over Head Tanks
PPP Public Private Partnerships
STP Sewerage Treatment Plant
SWM Solid Waste Management
TNUDF Tamil Nadu Urban Development Fund
TNUDP Tamil Nadu Urban Development Program
TNUIFSL Tamil Nadu Urban Infrastructure Financial Services Limited
UGD Under Ground Drainage
Conversion of CCP to BP – Kumbakonam Municipality 5
Executive Summary
The Tamil Nadu Urban Infrastructure Financial Services (TNUIFSL) mandated ICRA
Management Consulting Services (IMaCS) for conversion of City Corporate Plan (CCP) of
Kumbakonam Municipality (KUM) into a Business Plan. The CCP for Kumbakonam was
prepared in 2002, under the Tamil Nadu Urban Development Project - II (TNUDP-II) to develop
vision, strategies and tasks to be carried out by KUM. Subsequently, KuM has prepared a Vision
Plan, identifying various projects that it plans to undertake during 2004-09. The objective of this
study is to enable effective implementation of projects envisaged in its CCP and Vision Plan
through preparation of this report on conversion of the City Corporate Plan to a Business Plan.
City profile and growth potential
Kumbakonam is a special grade municipal town,
located 313 km from Chennai on the South, 90 km
from Trichy on the East, and 40 km from Thanjavur
on the Northeast. The town is famous for Mahamagam
festival, which is celebrated once in 12 years.
The population growth has slowed down during the last couple of decades. This has primarily
been due to Kumbakonam’s geographical constraints in terms of limited land area and industrial
potential. Kumbakonam is a temple town in the vicinity of large-scale agricultural activity, which
supports trading and commercial activities. Thus there are limited avenues for primary activities
within the town. A significant 44% of the land is non-urban area due to the presence of rivers,
lakes, water bodies, agricultural land etc, while vacant areas accounts for less than 2 % of the land
available. Select interventions identified in the CCP in this regard are highlighted below
• Decongesting city areas - The limited land available in the town makes it congested and
there is a need to direct commercial activities to the periphery of the town.
• Focused heritage area restoration - KuM needs to undertake some focused actions to
restore and preserve its heritage areas.
• Water front development - Encroachment and pollution have led to degradation of the
town’s canals/water fronts. These issues need to be addressed on priority.
• Master Plan - The CCP observes that there is a need for better coordination among nodal
agencies with respect to land-use management and preparation of town planning schemes.
Kumbakonam has potential to leverage its heritage infrastructure and spur economic development
through tourism initiatives. But this would require focused interventions in terms for restoring
heritage sites and in providing necessary infrastructural facilities relating to connectivity,
hospitality and sanitation.
Parameter Details
Population (2001) 140021
Decadal Growth (1991-2001) 0.4 %
No. of Wards 45
Sex Ratio 1010
Literacy rate – 2001 78 %
Conversion of CCP to BP – Kumbakonam Municipality 6
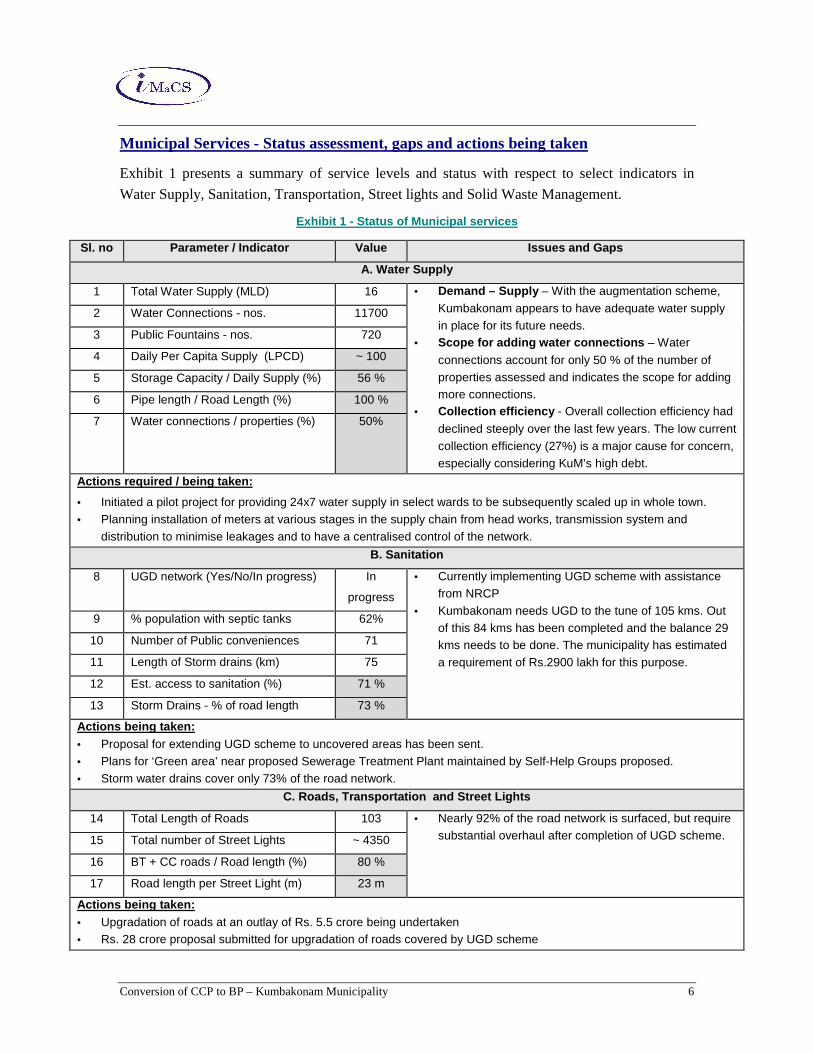
Municipal Services - Status assessment, gaps and actions being taken
Exhibit 1 presents a summary of service levels and status with respect to select indicators in
Water Supply, Sanitation, Transportation, Street lights and Solid Waste Management.
Exhibit 1 - Status of Municipal services
Sl. no Parameter / Indicato r Value Issues and Gaps
A. Water Supply
1 Total Water Supply (MLD) 16 • Demand – Supply – With the augmentation scheme,
Kumbakonam appears to have adequate water supply in place for its future needs.
• Scope for adding water connections – Water
connections account for only 50 % of the number of properties assessed and indicates the scope for adding more connections.
• Collection efficiency - Overall collection efficiency had
declined steeply over the last few years. The low current collection efficiency (27%) is a major cause for concern, especially considering KuM’s high debt.
2 Water Connections - nos. 11700
3 Public Fountains - nos. 720
4 Daily Per Capita Supply (LPCD) ~ 100
5 Storage Capacity / Daily Supply (%) 56 %
6 Pipe length / Road Length (%) 100 %
7 Water connections / properties (%) 50%
Actions required / being taken:
• Initiated a pilot project for providing 24x7 water supply in select wards to be subsequently scaled up in whole town. • Planning installation of meters at various stages in the supply chain from head works, transmission system and
distribution to minimise leakages and to have a centralised control of the network.
B. Sanitation
8 UGD network (Yes/No/In progress) In
progress
• Currently implementing UGD scheme with assistance from NRCP
• Kumbakonam needs UGD to the tune of 105 kms. Out of this 84 kms has been completed and the balance 29 kms needs to be done. The municipality has estimated a requirement of Rs.2900 lakh for this purpose.
9 % population with septic tanks 62%
10 Number of Public conveniences 71
11 Length of Storm drains (km) 75
12 Est. access to sanitation (%) 71 %
13 Storm Drains - % of road length 73 %
Actions being taken: • Proposal for extending UGD scheme to uncovered areas has been sent. • Plans for ‘Green area’ near proposed Sewerage Treatment Plant maintained by Self-Help Groups proposed. • Storm water drains cover only 73% of the road network.
C. Roads, Transportation and Street Lights
14 Total Length of Roads 103 • Nearly 92% of the road network is surfaced, but require substantial overhaul after completion of UGD scheme. 15 Total number of Street Lights ~ 4350
16 BT + CC roads / Road length (%) 80 %
17 Road length per Street Light (m) 23 m
Actions being taken: • Upgradation of roads at an outlay of Rs. 5.5 crore being undertaken • Rs. 28 crore proposal submitted for upgradation of roads covered by UGD scheme
Conversion of CCP to BP – Kumbakonam Municipality 7
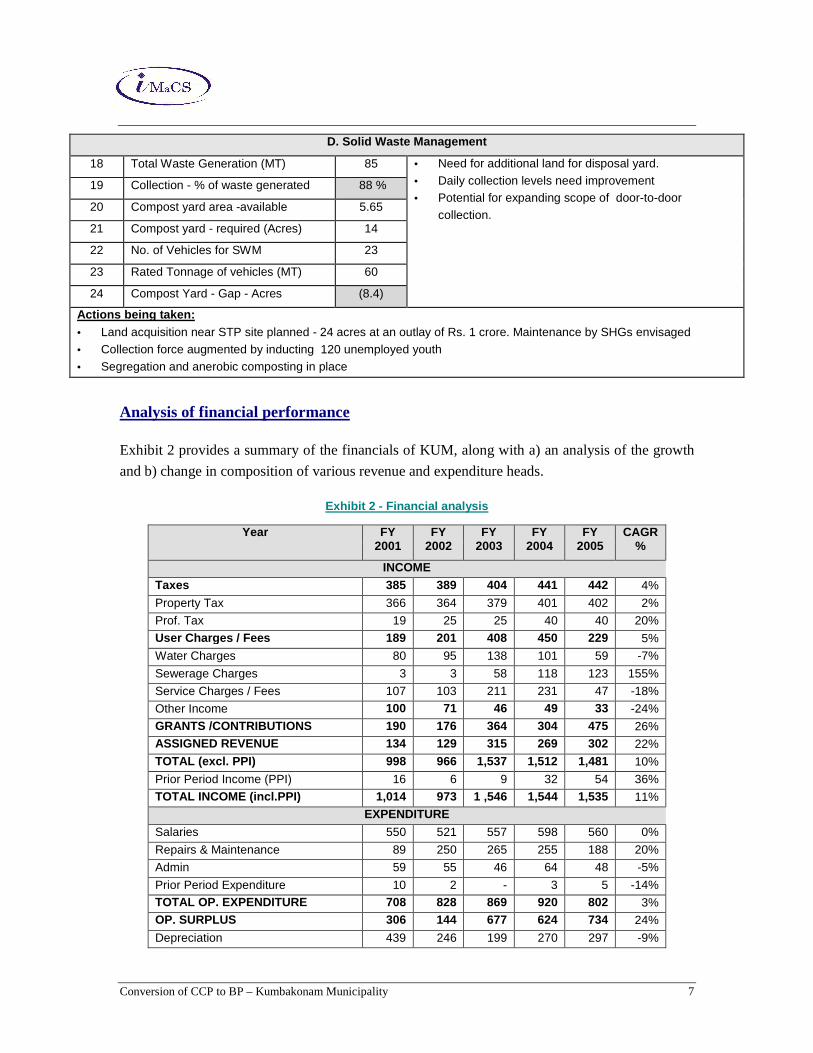
D. Solid Waste Management
18 Total Waste Generation (MT) 85 • Need for additional land for disposal yard. • Daily collection levels need improvement • Potential for expanding scope of door-to-door
collection.
19 Collection - % of waste generated 88 %
20 Compost yard area -available 5.65
21 Compost yard - required (Acres) 14
22 No. of Vehicles for SWM 23
23 Rated Tonnage of vehicles (MT) 60
24 Compost Yard - Gap - Acres (8.4)
Actions being taken: • Land acquisition near STP site planned - 24 acres at an outlay of Rs. 1 crore. Maintenance by SHGs envisaged • Collection force augmented by inducting 120 unemployed youth • Segregation and anerobic composting in place
Analysis of financial performance
Exhibit 2 provides a summary of the financials of KUM, along with a) an analysis of the growth
and b) change in composition of various revenue and expenditure heads.
Exhibit 2 - Financial analysis
Year FY 2001
FY 2002
FY 2003
FY 2004
FY 2005
CAGR %
INCOME Taxes 385 389 404 441 442 4%
Property Tax 366 364 379 401 402 2%
Prof. Tax 19 25 25 40 40 20%
User Charges / Fees 189 201 408 450 229 5%
Water Charges 80 95 138 101 59 -7%
Sewerage Charges 3 3 58 118 123 155%
Service Charges / Fees 107 103 211 231 47 -18%
Other Income 100 71 46 49 33 -24%
GRANTS /CONTRIBUTIONS 190 176 364 304 475 26% ASSIGNED REVENUE 134 129 315 269 302 22%
TOTAL (excl. PPI) 998 966 1,537 1,512 1,481 10%
Prior Period Income (PPI) 16 6 9 32 54 36%
TOTAL INCOME (incl.PPI) 1,014 973 1 ,546 1,544 1,535 11% EXPENDITURE
Salaries 550 521 557 598 560 0%
Repairs & Maintenance 89 250 265 255 188 20%
Admin 59 55 46 64 48 -5%
Prior Period Expenditure 10 2 - 3 5 -14% TOTAL OP. EXPENDITURE 708 828 869 920 802 3% OP. SURPLUS 306 144 677 624 734 24%
Depreciation 439 246 199 270 297 -9%

Conversion of CCP to BP – Kumbakonam Municipality 8
Finance Charges 111 57 84 104 93 -4% TOTAL EXPENDITURE 856 448 960 998 1,123 7%
SURPLUS (After Dep and Interest) 158 525 586 546 412 27% a) There has been a growth in operating surplus (CAGR-24%) during FY 2001-2005.
However this has been achieved primarily by growth in Grants/ Devolution income (CAGR-
26%) and assigned revenue (CAGR-22%).
b) There has been hardly any growth in KuM’s own income (CAGR – 1%), which coupled
with the poor collection efficiencies is a major cause for concern
c) KuM has an outstanding loan of Rs. 2516 lakh in FY 2005. Finance charges have declined
from 11% of income to 6% of income over the last five year. However, overall debt servicing
is likely to increase, as repayment of water supply loan (Rs. 1700 lakh) becomes due. KuM
wold need to improve its financial position and its collection efficiencies in order to meet its
debt servicing obligations in the future.
Capital Investment Plan
We have compiled the felt needs of the city under various service areas, based on
• Review of projects recommended in the City Corporate Plan
• Status and progress on projects identified as part of the Vision Plan (2004-09)
• Consultations with stakeholders and
• Discussion with officials
Exhibit 3 provides a summary of the CIP for KUM.
Exhibit 3 Capital Investment Plan along with phasin g - Short Term (2006-10 and 2011-15)
2006-10 2011-15Water Supply 2,000 1,000 1,000 Sewerage and Sanitation 2,900 2,000 900 Storm Water Drains 1,000 500 500 Solid Waste Management 850 500 350 Roads 1,525 750 775 Street Lights 75 50 25 Remunerative Infrastructure 2,000 1,000 1,000 Slum Development 9,000 3,000 6,000 Education 55 30 25 Others 71 50 21 TOTAL 19,476 8,880 10,596
Segment Outlay Phasing
Conversion of CCP to BP – Kumbakonam Municipality 9
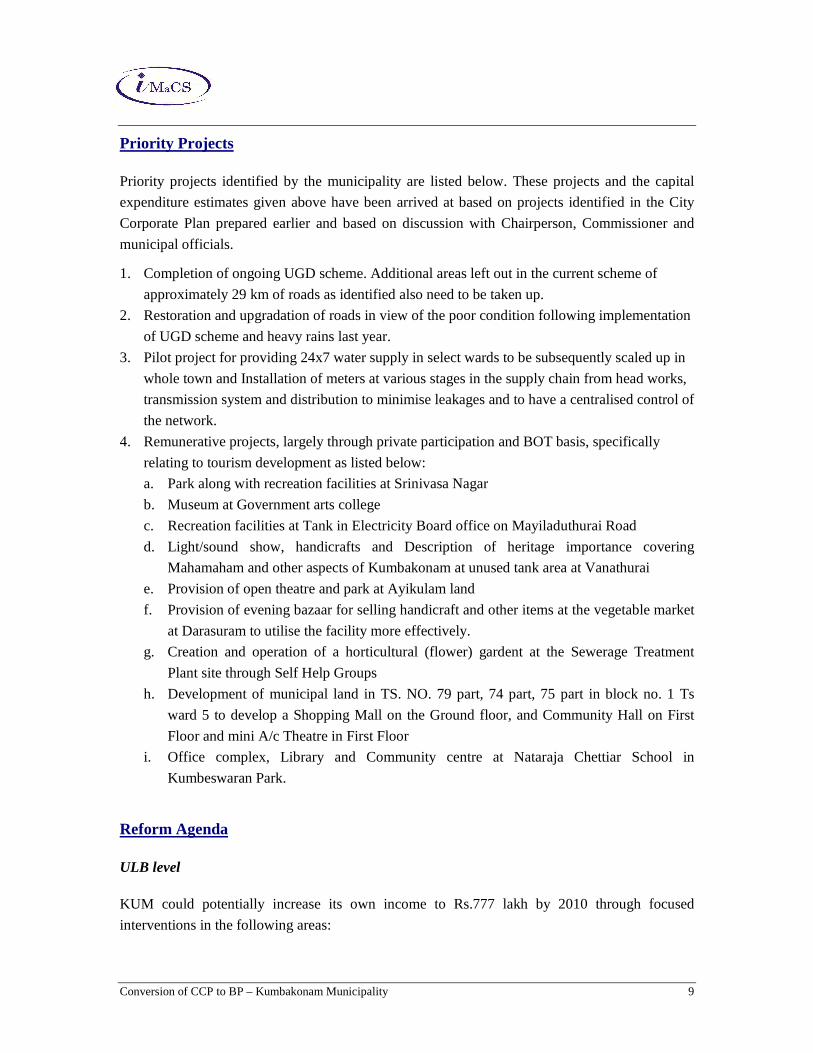
Priority Projects
Priority projects identified by the municipality are listed below. These projects and the capital
expenditure estimates given above have been arrived at based on projects identified in the City
Corporate Plan prepared earlier and based on discussion with Chairperson, Commissioner and
municipal officials.
1. Completion of ongoing UGD scheme. Additional areas left out in the current scheme of
approximately 29 km of roads as identified also need to be taken up.
2. Restoration and upgradation of roads in view of the poor condition following implementation
of UGD scheme and heavy rains last year.
3. Pilot project for providing 24x7 water supply in select wards to be subsequently scaled up in
whole town and Installation of meters at various stages in the supply chain from head works,
transmission system and distribution to minimise leakages and to have a centralised control of
the network.
4. Remunerative projects, largely through private participation and BOT basis, specifically
relating to tourism development as listed below:
a. Park along with recreation facilities at Srinivasa Nagar
b. Museum at Government arts college
c. Recreation facilities at Tank in Electricity Board office on Mayiladuthurai Road
d. Light/sound show, handicrafts and Description of heritage importance covering
Mahamaham and other aspects of Kumbakonam at unused tank area at Vanathurai
e. Provision of open theatre and park at Ayikulam land
f. Provision of evening bazaar for selling handicraft and other items at the vegetable market
at Darasuram to utilise the facility more effectively.
g. Creation and operation of a horticultural (flower) gardent at the Sewerage Treatment
Plant site through Self Help Groups
h. Development of municipal land in TS. NO. 79 part, 74 part, 75 part in block no. 1 Ts
ward 5 to develop a Shopping Mall on the Ground floor, and Community Hall on First
Floor and mini A/c Theatre in First Floor
i. Office complex, Library and Community centre at Nataraja Chettiar School in
Kumbeswaran Park.
Reform Agenda
ULB level
KUM could potentially increase its own income to Rs.777 lakh by 2010 through focused
interventions in the following areas:
Conversion of CCP to BP – Kumbakonam Municipality 10
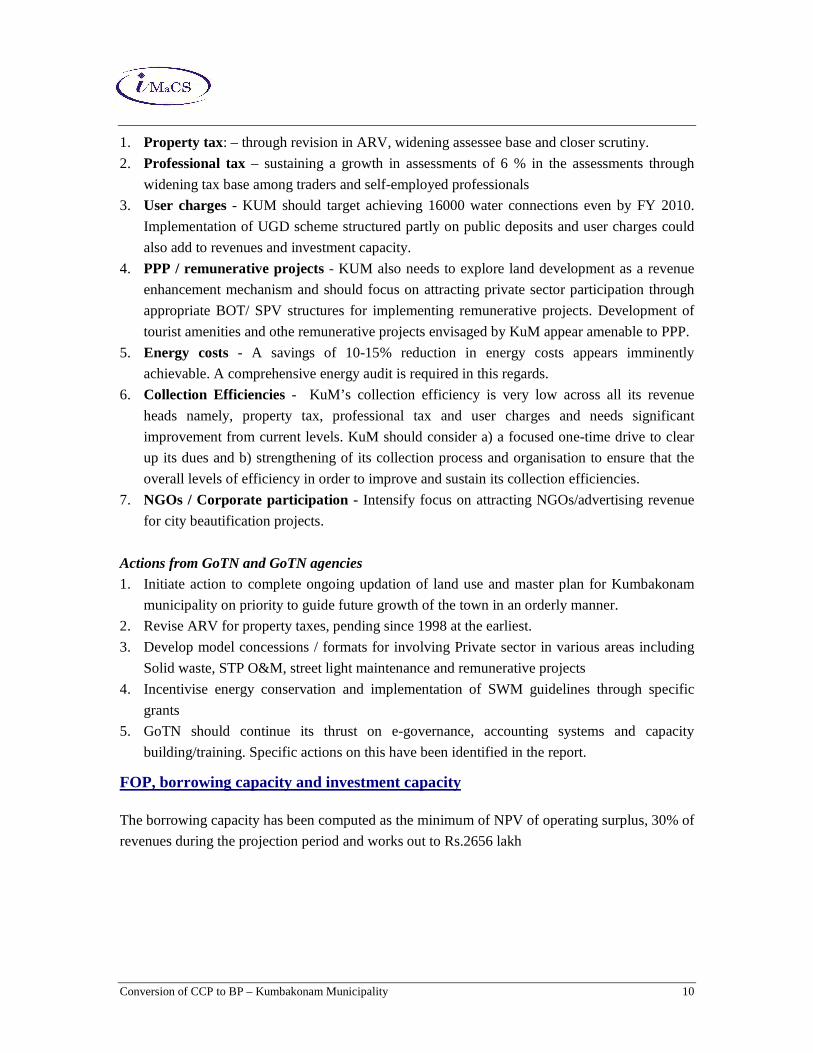
1. Property tax: – through revision in ARV, widening assessee base and closer scrutiny.
2. Professional tax – sustaining a growth in assessments of 6 % in the assessments through
widening tax base among traders and self-employed professionals
3. User charges - KUM should target achieving 16000 water connections even by FY 2010.
Implementation of UGD scheme structured partly on public deposits and user charges could
also add to revenues and investment capacity.
4. PPP / remunerative projects - KUM also needs to explore land development as a revenue
enhancement mechanism and should focus on attracting private sector participation through
appropriate BOT/ SPV structures for implementing remunerative projects. Development of
tourist amenities and othe remunerative projects envisaged by KuM appear amenable to PPP.
5. Energy costs - A savings of 10-15% reduction in energy costs appears imminently
achievable. A comprehensive energy audit is required in this regards.
6. Collection Efficiencies - KuM’s collection efficiency is very low across all its revenue
heads namely, property tax, professional tax and user charges and needs significant
improvement from current levels. KuM should consider a) a focused one-time drive to clear
up its dues and b) strengthening of its collection process and organisation to ensure that the
overall levels of efficiency in order to improve and sustain its collection efficiencies.
7. NGOs / Corporate participation - Intensify focus on attracting NGOs/advertising revenue
for city beautification projects.
Actions from GoTN and GoTN agencies 1. Initiate action to complete ongoing updation of land use and master plan for Kumbakonam
municipality on priority to guide future growth of the town in an orderly manner.
2. Revise ARV for property taxes, pending since 1998 at the earliest.
3. Develop model concessions / formats for involving Private sector in various areas including
Solid waste, STP O&M, street light maintenance and remunerative projects
4. Incentivise energy conservation and implementation of SWM guidelines through specific
grants
5. GoTN should continue its thrust on e-governance, accounting systems and capacity
building/training. Specific actions on this have been identified in the report.
FOP, borrowing capacity and investment capacity
The borrowing capacity has been computed as the minimum of NPV of operating surplus, 30% of
revenues during the projection period and works out to Rs.2656 lakh
Conversion of CCP to BP – Kumbakonam Municipality 11
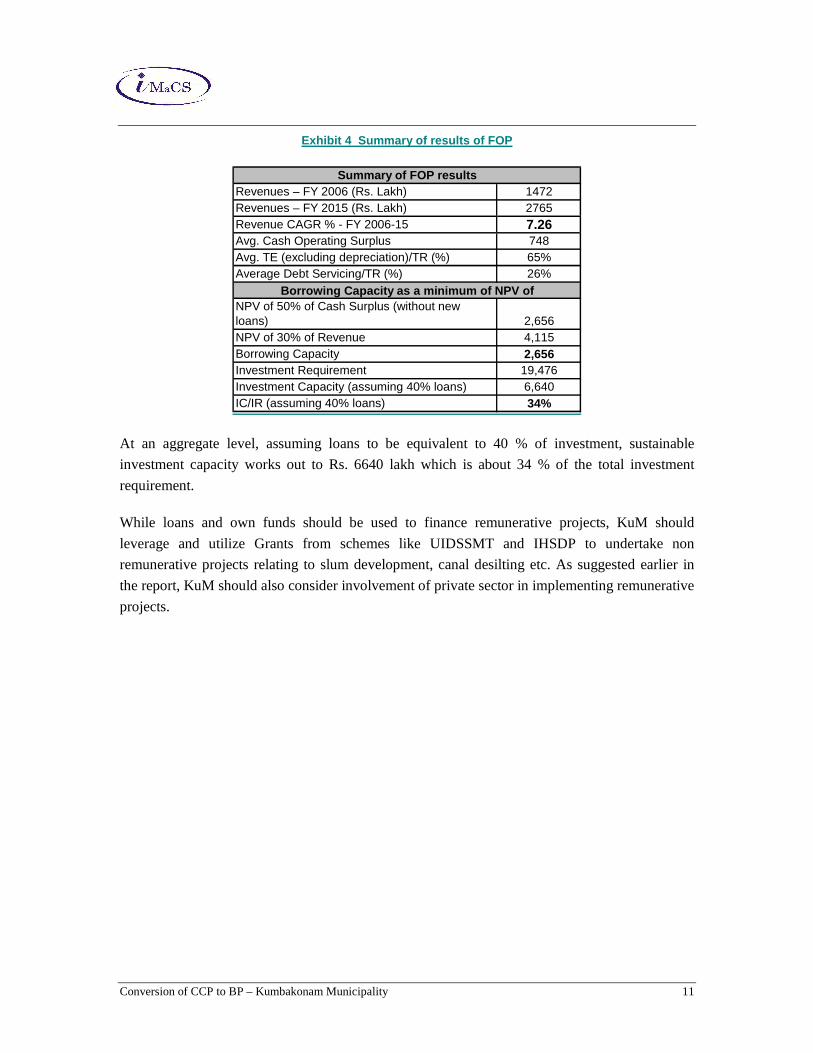
Exhibit 4 Summary of results of FOP
Revenues – FY 2006 (Rs. Lakh) 1472Revenues – FY 2015 (Rs. Lakh) 2765Revenue CAGR % - FY 2006-15 7.26Avg. Cash Operating Surplus 748Avg. TE (excluding depreciation)/TR (%) 65%Average Debt Servicing/TR (%) 26%
NPV of 50% of Cash Surplus (without new loans) 2,656 NPV of 30% of Revenue 4,115 Borrowing Capacity 2,656 Investment Requirement 19,476 Investment Capacity (assuming 40% loans) 6,640 IC/IR (assuming 40% loans) 34%
Summary of FOP results
Borrowing Capacity as a minimum of NPV of
At an aggregate level, assuming loans to be equivalent to 40 % of investment, sustainable
investment capacity works out to Rs. 6640 lakh which is about 34 % of the total investment
requirement.
While loans and own funds should be used to finance remunerative projects, KuM should
leverage and utilize Grants from schemes like UIDSSMT and IHSDP to undertake non
remunerative projects relating to slum development, canal desilting etc. As suggested earlier in
the report, KuM should also consider involvement of private sector in implementing remunerative
projects.
Conversion of CCP to BP – Kumbakonam Municipality 12
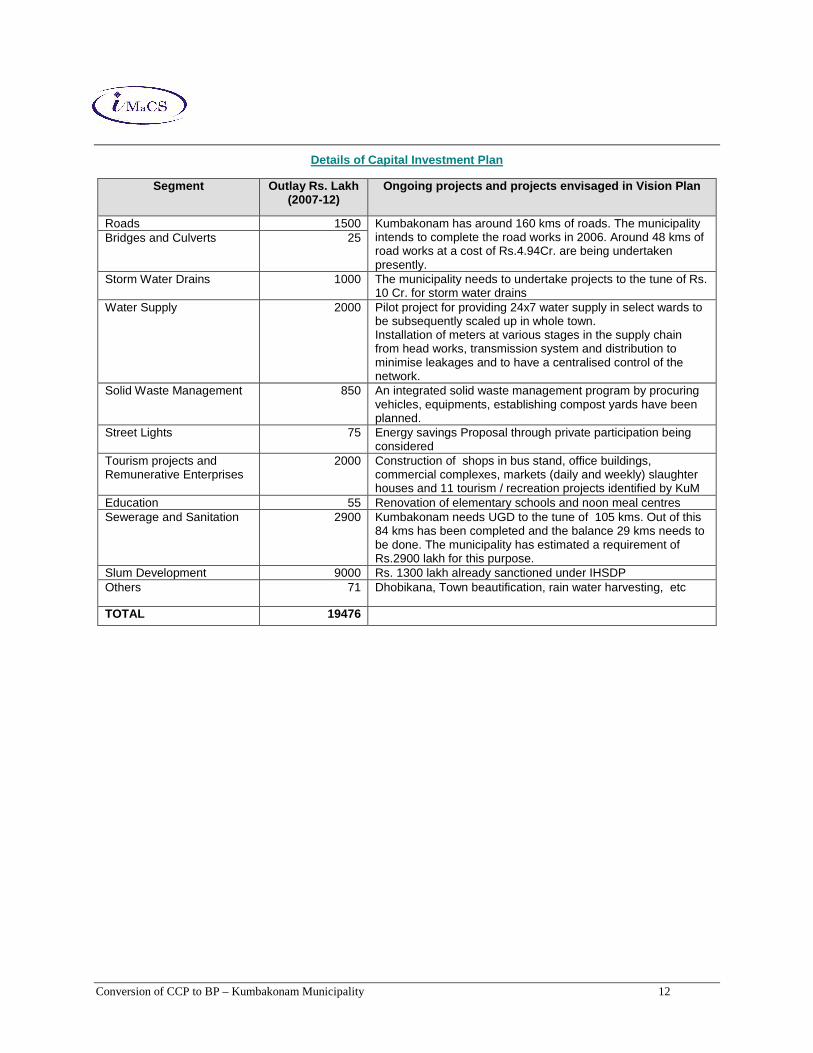
Details of Capital Investment Plan
Segment Outlay Rs. Lakh (2007-12)
Ongoing projects and projects envisaged in Vision Pl an
Roads 1500 Kumbakonam has around 160 kms of roads. The municipality intends to complete the road works in 2006. Around 48 kms of road works at a cost of Rs.4.94Cr. are being undertaken presently.
Bridges and Culverts 25
Storm Water Drains 1000 The municipality needs to undertake projects to the tune of Rs. 10 Cr. for storm water drains
Water Supply 2000 Pilot project for providing 24x7 water supply in select wards to be subsequently scaled up in whole town. Installation of meters at various stages in the supply chain from head works, transmission system and distribution to minimise leakages and to have a centralised control of the network.
Solid Waste Management 850 An integrated solid waste management program by procuring vehicles, equipments, establishing compost yards have been planned.
Street Lights 75 Energy savings Proposal through private participation being considered
Tourism projects and Remunerative Enterprises
2000 Construction of shops in bus stand, office buildings, commercial complexes, markets (daily and weekly) slaughter houses and 11 tourism / recreation projects identified by KuM
Education 55 Renovation of elementary schools and noon meal centres Sewerage and Sanitation 2900 Kumbakonam needs UGD to the tune of 105 kms. Out of this
84 kms has been completed and the balance 29 kms needs to be done. The municipality has estimated a requirement of Rs.2900 lakh for this purpose.
Slum Development 9000 Rs. 1300 lakh already sanctioned under IHSDP Others 71 Dhobikana, Town beautification, rain water harvesting, etc
TOTAL 19476
Conversion of CCP to BP – Kumbakonam Municipality 1
1. Introduction
1.1 Background to the study
Kumbakonam is a special grade municipal town and the second biggest in terms of administrative
status in Thanjavur district. Under the Tamil Nadu Urban Development Project - II (TNUDP-II), a
City Corporate Plan (CCP) was prepared for Kumbakonam Municipality (KuM). The objective of the
CCP was to outline a vision for development of the city and to identify strategies and tasks to be
carried out by KuM. Subsequently, KuM has also developed a 5-year Vision Plan (2004-09),
identifying projects that it plans to undertake during this period. In order to enable effective
implementation of projects envisaged in its CCP and Vision Plan, the Tamil Nadu Urban
Infrastructure Financial Services (TNUIFSL) mandated ICRA Management Consulting Services
(IMaCS) for conversion of City Corporate Plan (CCP) into a Business Plan (BP).
1.2 Scope of work
The scope of work for the study covered a) assessment of the financial and operating aspects of KoM,
b) Review issues relating to revenue realisation and cost management and identification of
improvement (revenue enhancement and cost reduction) measures and c) Development of a Financial
and Operating Plan (FOP), taking into account potential revenue enhancement and cost reduction
measures.
1.3 IMaCS approach to the study
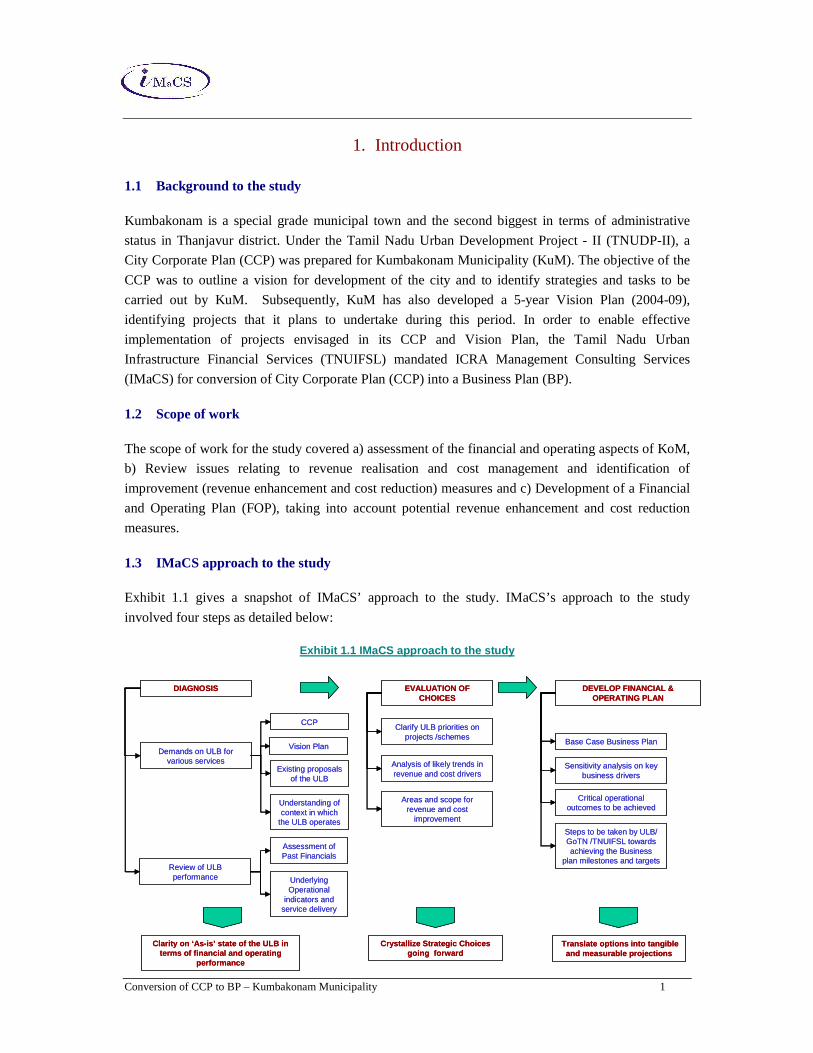
Exhibit 1.1 gives a snapshot of IMaCS’ approach to the study. IMaCS’s approach to the study
involved four steps as detailed below:
Exhibit 1.1 IMaCS approach to the study
EVALUATION OF CHOICES
DEVELOP FINANCIAL & OPERATING PLAN
Demands on ULB for various services
Review of ULB performance
DIAGNOSIS
CCP
Vision Plan
Existing proposals of the ULB
Assessment of Past Financials
Underlying Operational
indicators and service delivery
Understanding of context in which
the ULB operates
Clarity on ‘As-is’ state of the ULB in terms of financial and operating
performance
Analysis of likely trends in revenue and cost drivers
Clarify ULB priorities on projects /schemes
Areas and scope for revenue and cost
improvement
Crystallize Strategic Choices going forward
Base Case Business Plan
Critical operational outcomes to be achieved
Steps to be taken by ULB/ GoTN /TNUIFSL towards achieving the Business
plan milestones and targets
Sensitivity analysis on key business drivers
Translate options into tangible and measurable projections
Conversion of CCP to BP – Kumbakonam Municipality 2
1.3.1 Step I – Diagnostic review
The diagnostic review involved an assessment of the current status of KuM, its activities and financial
performance, review of the City Corporate Plan (CCP) and discussions with TNUIFSL and KuM. We
had the opportunity to interact with the Commissioner and had extensive interactions with officials
and select ward members of the municipality during our field visits.
We collected relevant information on the performance (operational and financial) from KuM. Our
review was focused on the following areas:
• Financial position
• Operational performance
• Demands on urban services in the town/municipality
The diagnostic review was directed towards achieving a clear understanding of the operating and
financial performance of KuM.
1.3.2 Step II – Evaluation of options for financial improvement and projects
Based on the diagnostic review, we crystallised the options for KuM covering a) analysis of potential
for revenue enhancement and cost management and b) Felt needs in terms of projects and estimate of
capital outlay.
1.3.3 Step III – Projection of financial statements and estimation of investment and borrowing capacity
We have projected financial statements for KuM under two scenarios namely, a) base case and b) with
potential improvements. Under both scenarios, the optimum borrowing capacity and sustainable
investment capacity have been computed.
1.3.4 Step IV - Consultations and Finalisation
The Draft Final Report for the study was presented to the office of CMA, officials of KuM and
TNUIFSL in April 2006.
Subsequently, the report was discussed with Chairperson and officials in November 2007 to factor the
views and aspirations of the Council in the report.
Conversion of CCP to BP – Kumbakonam Municipality 3
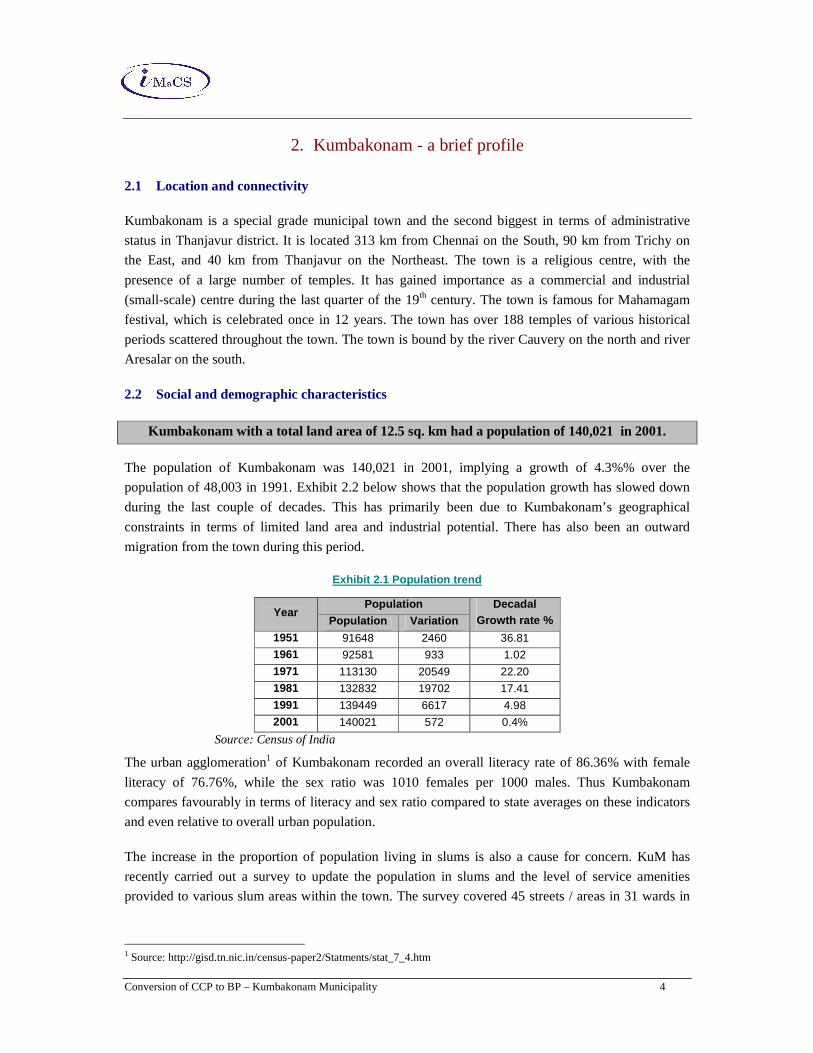
1.4 Structure of the report
This report presents our findings and recommendations from the study and is organised as follows:
• Section 1 Introduction
• Section 2 Kumbakonam - a brief profile
• Section 3 Review of operating performance
• Section 4 Analysis of financial performance
• Section 5 Potential areas for improvement
• Section 6 Business plan and investment capacity of KuM
Conversion of CCP to BP – Kumbakonam Municipality 4
2. Kumbakonam - a brief profile
2.1 Location and connectivity
Kumbakonam is a special grade municipal town and the second biggest in terms of administrative
status in Thanjavur district. It is located 313 km from Chennai on the South, 90 km from Trichy on
the East, and 40 km from Thanjavur on the Northeast. The town is a religious centre, with the
presence of a large number of temples. It has gained importance as a commercial and industrial
(small-scale) centre during the last quarter of the 19th century. The town is famous for Mahamagam
festival, which is celebrated once in 12 years. The town has over 188 temples of various historical
periods scattered throughout the town. The town is bound by the river Cauvery on the north and river
Aresalar on the south.
2.2 Social and demographic characteristics
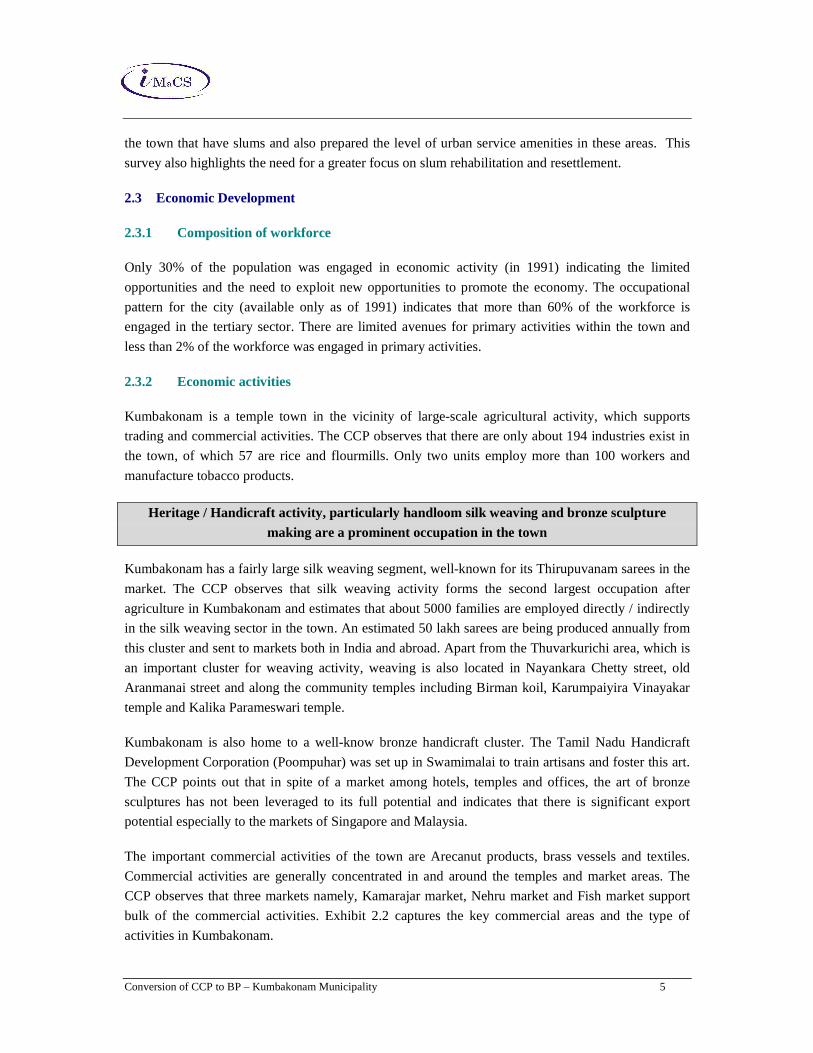
Kumbakonam with a total land area of 12.5 sq. km had a population of 140,021 in 2001.
The population of Kumbakonam was 140,021 in 2001, implying a growth of 4.3%% over the
population of 48,003 in 1991. Exhibit 2.2 below shows that the population growth has slowed down
during the last couple of decades. This has primarily been due to Kumbakonam’s geographical
constraints in terms of limited land area and industrial potential. There has also been an outward
migration from the town during this period.
Exhibit 2.1 Population trend
Year Population Decadal
Growth rate % Population Variation
1951 91648 2460 36.81
1961 92581 933 1.02
1971 113130 20549 22.20
1981 132832 19702 17.41
1991 139449 6617 4.98
2001 140021 572 0.4%
Source: Census of India
The urban agglomeration1 of Kumbakonam recorded an overall literacy rate of 86.36% with female
literacy of 76.76%, while the sex ratio was 1010 females per 1000 males. Thus Kumbakonam
compares favourably in terms of literacy and sex ratio compared to state averages on these indicators
and even relative to overall urban population.
The increase in the proportion of population living in slums is also a cause for concern. KuM has
recently carried out a survey to update the population in slums and the level of service amenities
provided to various slum areas within the town. The survey covered 45 streets / areas in 31 wards in
1 Source: http://gisd.tn.nic.in/census-paper2/Statments/stat_7_4.htm
Conversion of CCP to BP – Kumbakonam Municipality 5
the town that have slums and also prepared the level of urban service amenities in these areas. This
survey also highlights the need for a greater focus on slum rehabilitation and resettlement.
2.3 Economic Development
2.3.1 Composition of workforce
Only 30% of the population was engaged in economic activity (in 1991) indicating the limited
opportunities and the need to exploit new opportunities to promote the economy. The occupational
pattern for the city (available only as of 1991) indicates that more than 60% of the workforce is
engaged in the tertiary sector. There are limited avenues for primary activities within the town and
less than 2% of the workforce was engaged in primary activities.
2.3.2 Economic activities
Kumbakonam is a temple town in the vicinity of large-scale agricultural activity, which supports
trading and commercial activities. The CCP observes that there are only about 194 industries exist in
the town, of which 57 are rice and flourmills. Only two units employ more than 100 workers and
manufacture tobacco products.
Heritage / Handicraft activity, particularly handlo om silk weaving and bronze sculpture making are a prominent occupation in the town
Kumbakonam has a fairly large silk weaving segment, well-known for its Thirupuvanam sarees in the
market. The CCP observes that silk weaving activity forms the second largest occupation after
agriculture in Kumbakonam and estimates that about 5000 families are employed directly / indirectly
in the silk weaving sector in the town. An estimated 50 lakh sarees are being produced annually from
this cluster and sent to markets both in India and abroad. Apart from the Thuvarkurichi area, which is
an important cluster for weaving activity, weaving is also located in Nayankara Chetty street, old
Aranmanai street and along the community temples including Birman koil, Karumpaiyira Vinayakar
temple and Kalika Parameswari temple.
Kumbakonam is also home to a well-know bronze handicraft cluster. The Tamil Nadu Handicraft
Development Corporation (Poompuhar) was set up in Swamimalai to train artisans and foster this art.
The CCP points out that in spite of a market among hotels, temples and offices, the art of bronze
sculptures has not been leveraged to its full potential and indicates that there is significant export
potential especially to the markets of Singapore and Malaysia.
The important commercial activities of the town are Arecanut products, brass vessels and textiles.
Commercial activities are generally concentrated in and around the temples and market areas. The
CCP observes that three markets namely, Kamarajar market, Nehru market and Fish market support
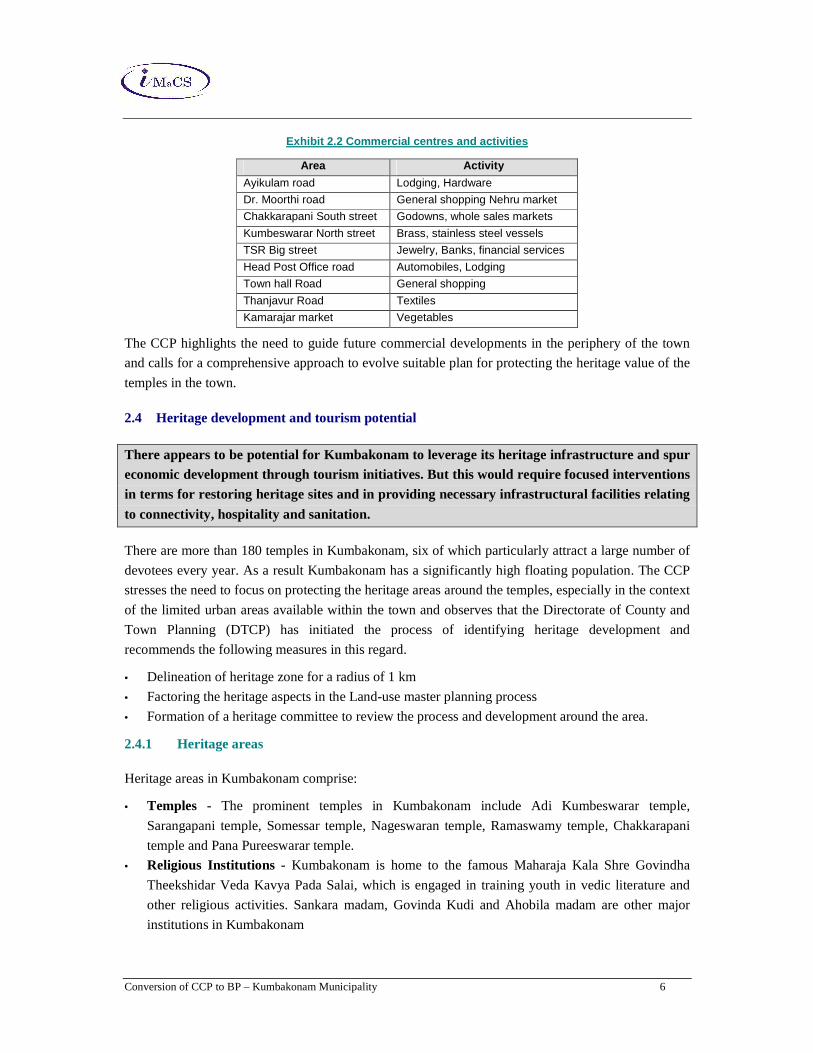
bulk of the commercial activities. Exhibit 2.2 captures the key commercial areas and the type of
activities in Kumbakonam.
Conversion of CCP to BP – Kumbakonam Municipality 6
Exhibit 2.2 Commercial centres and activities
Area Activity
Ayikulam road Lodging, Hardware
Dr. Moorthi road General shopping Nehru market
Chakkarapani South street Godowns, whole sales markets
Kumbeswarar North street Brass, stainless steel vessels
TSR Big street Jewelry, Banks, financial services
Head Post Office road Automobiles, Lodging
Town hall Road General shopping
Thanjavur Road Textiles
Kamarajar market Vegetables
The CCP highlights the need to guide future commercial developments in the periphery of the town
and calls for a comprehensive approach to evolve suitable plan for protecting the heritage value of the
temples in the town.
2.4 Heritage development and tourism potential
There appears to be potential for Kumbakonam to leverage its heritage infrastructure and spur economic development through tourism initiatives. But this would require focused interventions in terms for restoring heritage sites and in providing necessary infrastructural facilities relating
to connectivity, hospitality and sanitation.
There are more than 180 temples in Kumbakonam, six of which particularly attract a large number of
devotees every year. As a result Kumbakonam has a significantly high floating population. The CCP
stresses the need to focus on protecting the heritage areas around the temples, especially in the context
of the limited urban areas available within the town and observes that the Directorate of County and
Town Planning (DTCP) has initiated the process of identifying heritage development and
recommends the following measures in this regard.
• Delineation of heritage zone for a radius of 1 km
• Factoring the heritage aspects in the Land-use master planning process
• Formation of a heritage committee to review the process and development around the area.
2.4.1 Heritage areas
Heritage areas in Kumbakonam comprise:
• Temples - The prominent temples in Kumbakonam include Adi Kumbeswarar temple,
Sarangapani temple, Somessar temple, Nageswaran temple, Ramaswamy temple, Chakkarapani
temple and Pana Pureeswarar temple. • Religious Institutions - Kumbakonam is home to the famous Maharaja Kala Shre Govindha
Theekshidar Veda Kavya Pada Salai, which is engaged in training youth in vedic literature and
other religious activities. Sankara madam, Govinda Kudi and Ahobila madam are other major
institutions in Kumbakonam
Conversion of CCP to BP – Kumbakonam Municipality 7
• Environmentally sensitive areas - These include the numerous holy tanks and riverfront areas
and include the renowned Mahamaham tank (famous for its Mahamaham festival held every 12
years during which devotees throng to Kumbakonam to take a holy dip in the tank), Porthamarai
Theertham, Paga Theertham and Ghats of River Cauvery and Arasalar • Minor Heritage areas - These include the traditional settlements of various social groups. The
traditional houses are linear and endowed with architectural features including the Columnar
Thinai, Madam, Muttrum etc.
Absence of organised parking areas around the temples and creation of shops and commercial
establishments in their vicinity is leading to devaluation of these heritage structures. Some heritage
structures are in dilapidated condition and are in need of restoration. Water in the temple tanks tend to
become polluted and act as breeding ground for mosquitoes. There is also a need to limit the
development of high rise buildings in the temple area to protect the view of these heritage structures.
The limited road width and approach geometry becomes a constraining factor during the Mahamaham
festival. Encroachments and residential developments are affecting the river front and leading to
environmental degradation.
2.5 Land use management
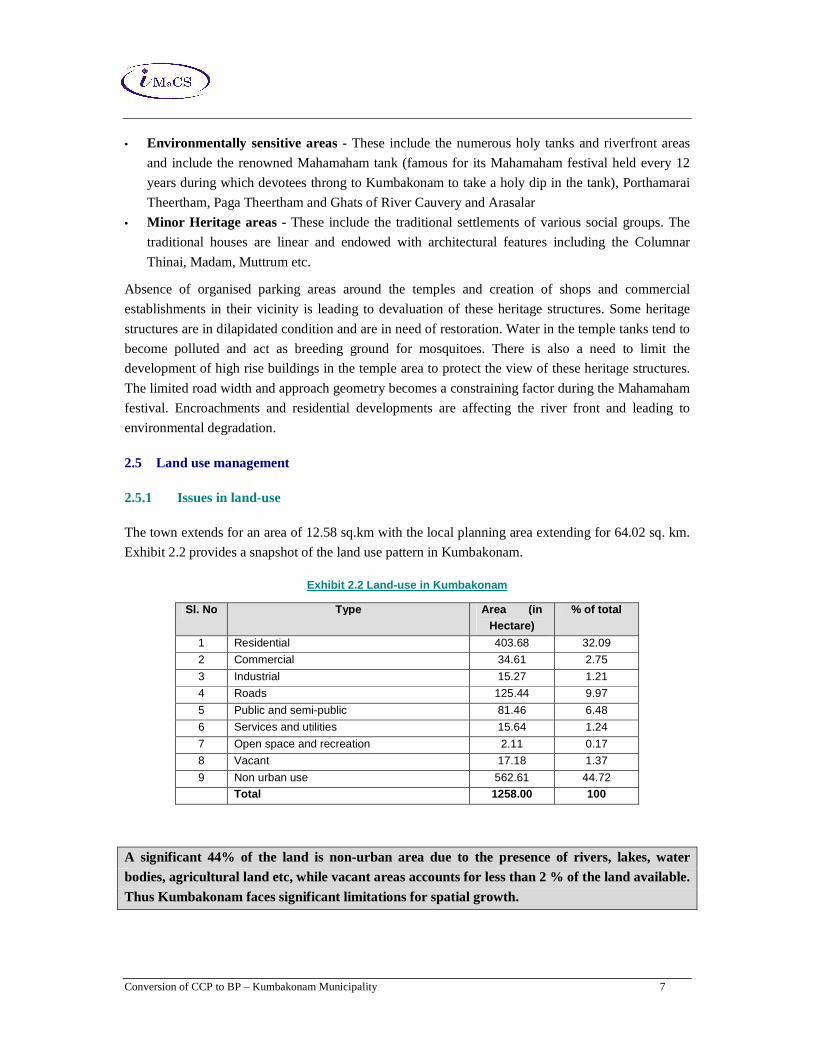
2.5.1 Issues in land-use
The town extends for an area of 12.58 sq.km with the local planning area extending for 64.02 sq. km.
Exhibit 2.2 provides a snapshot of the land use pattern in Kumbakonam.
Exhibit 2.2 Land-use in Kumbakonam
Sl. No Type Area (in Hectare)
% of total
1 Residential 403.68 32.09
2 Commercial 34.61 2.75
3 Industrial 15.27 1.21
4 Roads 125.44 9.97
5 Public and semi-public 81.46 6.48
6 Services and utilities 15.64 1.24
7 Open space and recreation 2.11 0.17
8 Vacant 17.18 1.37
9 Non urban use 562.61 44.72
Total 1258.00 100
A significant 44% of the land is non-urban area due to the presence of rivers, lakes, water bodies, agricultural land etc, while vacant areas accounts for less than 2 % of the land available.
Thus Kumbakonam faces significant limitations for spatial growth.
Conversion of CCP to BP – Kumbakonam Municipality 8
Being a temple town, residential areas account for nearly 32% of the total land area. Roads account
for nearly 10% of the total area while public/semi-public areas account for nearly 7 % of the land
area. Land for commercial activities accounts for less than 3% of the total area. The CCP points out
the congestion due to this within the city areas and points out the need to direct commercial activities
to the periphery of the town.
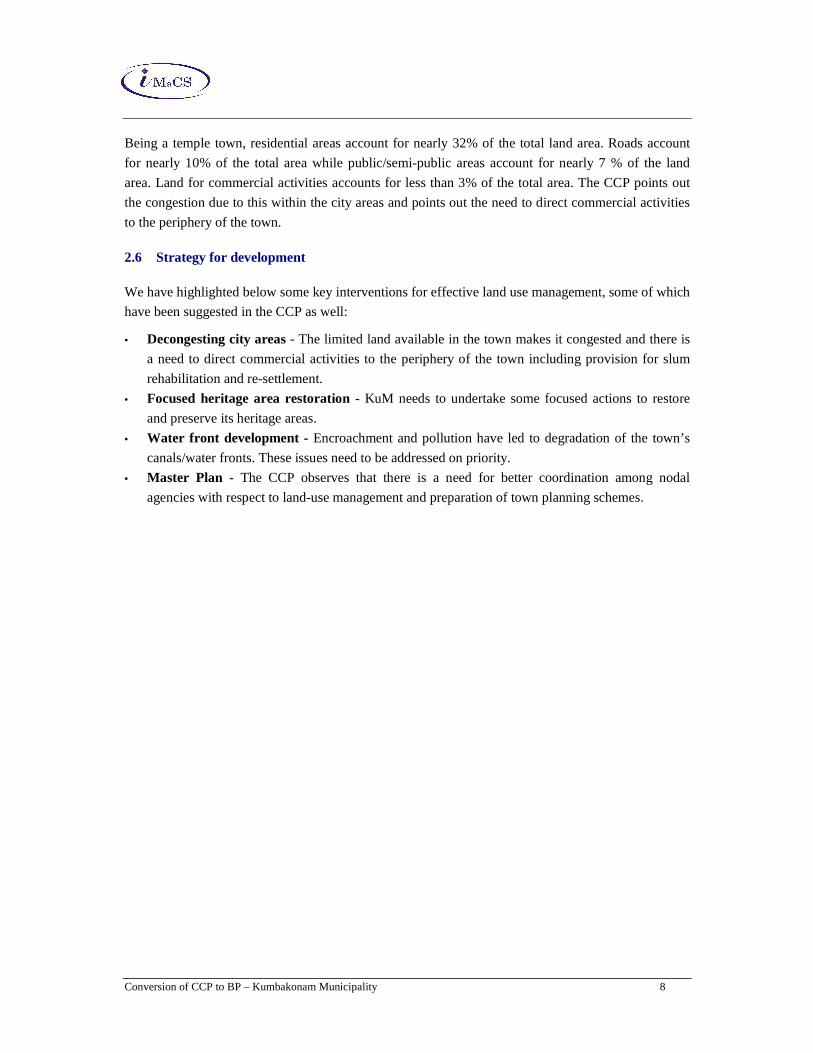
2.6 Strategy for development
We have highlighted below some key interventions for effective land use management, some of which
have been suggested in the CCP as well:
• Decongesting city areas - The limited land available in the town makes it congested and there is
a need to direct commercial activities to the periphery of the town including provision for slum
rehabilitation and re-settlement.
• Focused heritage area restoration - KuM needs to undertake some focused actions to restore
and preserve its heritage areas.
• Water front development - Encroachment and pollution have led to degradation of the town’s
canals/water fronts. These issues need to be addressed on priority.
• Master Plan - The CCP observes that there is a need for better coordination among nodal
agencies with respect to land-use management and preparation of town planning schemes.
Conversion of CCP to BP – Kumbakonam Municipality 9
3. Review of operating performance of KuM
This section presents a review of the status of infrastructure development undertaken by KuM.
3.1 Water Supply
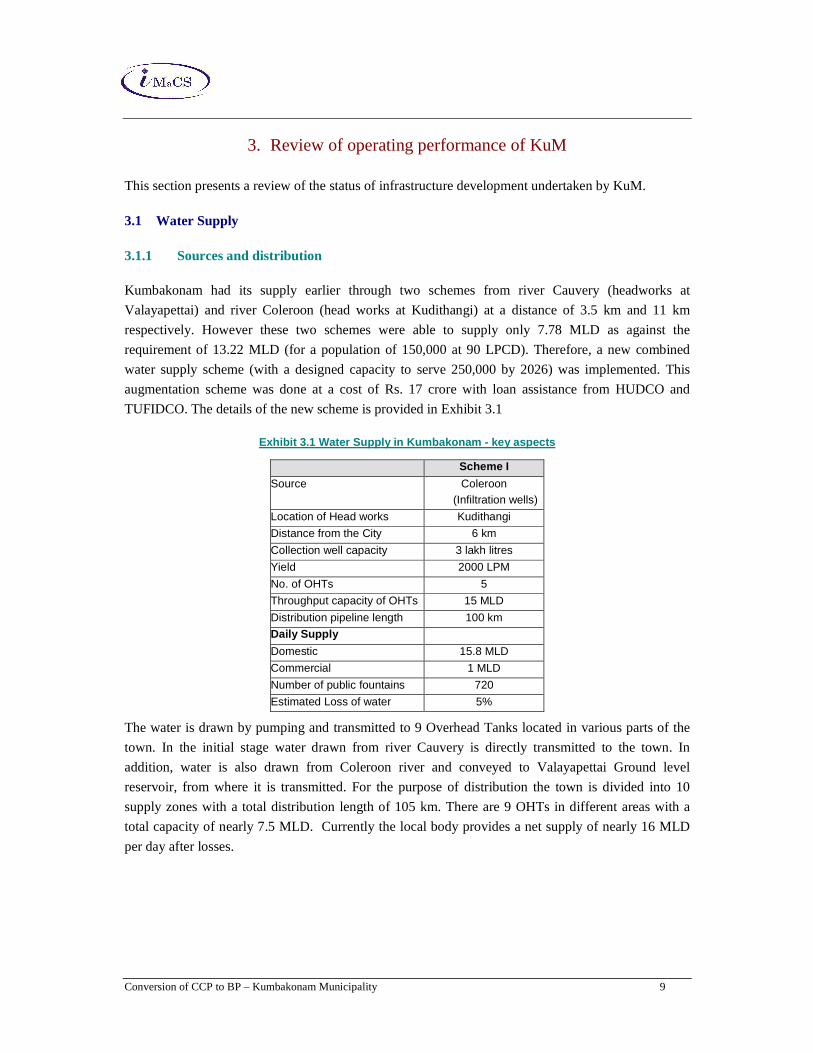
3.1.1 Sources and distribution
Kumbakonam had its supply earlier through two schemes from river Cauvery (headworks at
Valayapettai) and river Coleroon (head works at Kudithangi) at a distance of 3.5 km and 11 km
respectively. However these two schemes were able to supply only 7.78 MLD as against the
requirement of 13.22 MLD (for a population of 150,000 at 90 LPCD). Therefore, a new combined
water supply scheme (with a designed capacity to serve 250,000 by 2026) was implemented. This
augmentation scheme was done at a cost of Rs. 17 crore with loan assistance from HUDCO and
TUFIDCO. The details of the new scheme is provided in Exhibit 3.1
Exhibit 3.1 Water Supply in Kumbakonam - key aspect s
Scheme I
Source Coleroon (Infiltration wells)
Location of Head works Kudithangi
Distance from the City 6 km
Collection well capacity 3 lakh litres
Yield 2000 LPM
No. of OHTs 5
Throughput capacity of OHTs 15 MLD
Distribution pipeline length 100 km
Daily Supply
Domestic 15.8 MLD
Commercial 1 MLD
Number of public fountains 720
Estimated Loss of water 5%
The water is drawn by pumping and transmitted to 9 Overhead Tanks located in various parts of the
town. In the initial stage water drawn from river Cauvery is directly transmitted to the town. In
addition, water is also drawn from Coleroon river and conveyed to Valayapettai Ground level
reservoir, from where it is transmitted. For the purpose of distribution the town is divided into 10
supply zones with a total distribution length of 105 km. There are 9 OHTs in different areas with a
total capacity of nearly 7.5 MLD. Currently the local body provides a net supply of nearly 16 MLD
per day after losses.
Conversion of CCP to BP – Kumbakonam Municipality 10
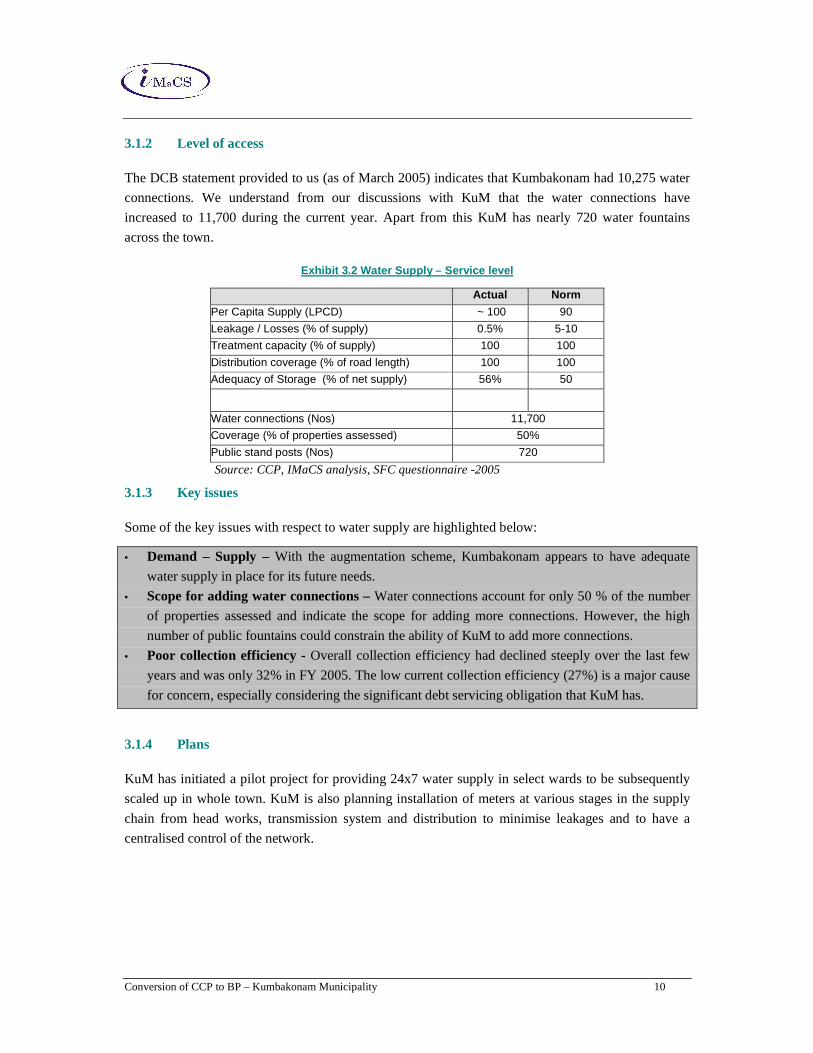
3.1.2 Level of access
The DCB statement provided to us (as of March 2005) indicates that Kumbakonam had 10,275 water
connections. We understand from our discussions with KuM that the water connections have
increased to 11,700 during the current year. Apart from this KuM has nearly 720 water fountains
across the town.
Exhibit 3.2 Water Supply – Service level
Actual Norm
Per Capita Supply (LPCD) ~ 100 90
Leakage / Losses (% of supply) 0.5% 5-10
Treatment capacity (% of supply) 100 100
Distribution coverage (% of road length) 100 100
Adequacy of Storage (% of net supply) 56% 50
Water connections (Nos) 11,700
Coverage (% of properties assessed) 50%
Public stand posts (Nos) 720
Source: CCP, IMaCS analysis, SFC questionnaire -2005
3.1.3 Key issues
Some of the key issues with respect to water supply are highlighted below:
• Demand – Supply – With the augmentation scheme, Kumbakonam appears to have adequate
water supply in place for its future needs.
• Scope for adding water connections – Water connections account for only 50 % of the number
of properties assessed and indicate the scope for adding more connections. However, the high
number of public fountains could constrain the ability of KuM to add more connections. • Poor collection efficiency - Overall collection efficiency had declined steeply over the last few
years and was only 32% in FY 2005. The low current collection efficiency (27%) is a major cause
for concern, especially considering the significant debt servicing obligation that KuM has.
3.1.4 Plans
KuM has initiated a pilot project for providing 24x7 water supply in select wards to be subsequently
scaled up in whole town. KuM is also planning installation of meters at various stages in the supply
chain from head works, transmission system and distribution to minimise leakages and to have a
centralised control of the network.
Conversion of CCP to BP – Kumbakonam Municipality 11
3.2 Sanitation
Kumbakonam is currently implementing an Underground sewerage system with assistance
from the National River Conservation Directorate (NRCD)
Kumbakonam is in the process of implementing a comprehensive Underground drainage scheme with
assistance from NRCD at an outlay of Rs. 60 crore. Nearly 80 km of the pipeline for the project has
been completed with nearly 25 km work in progress. KuM is also in the process of deciding the
configuration and other details for the Sewerage Treatment Plant. KuM is contemplating O&M of the
Sewerage Treatment Plant through private sector participation. Exhibit 3.3 provides details of the
existing sanitation facilities in Kumbakonam.
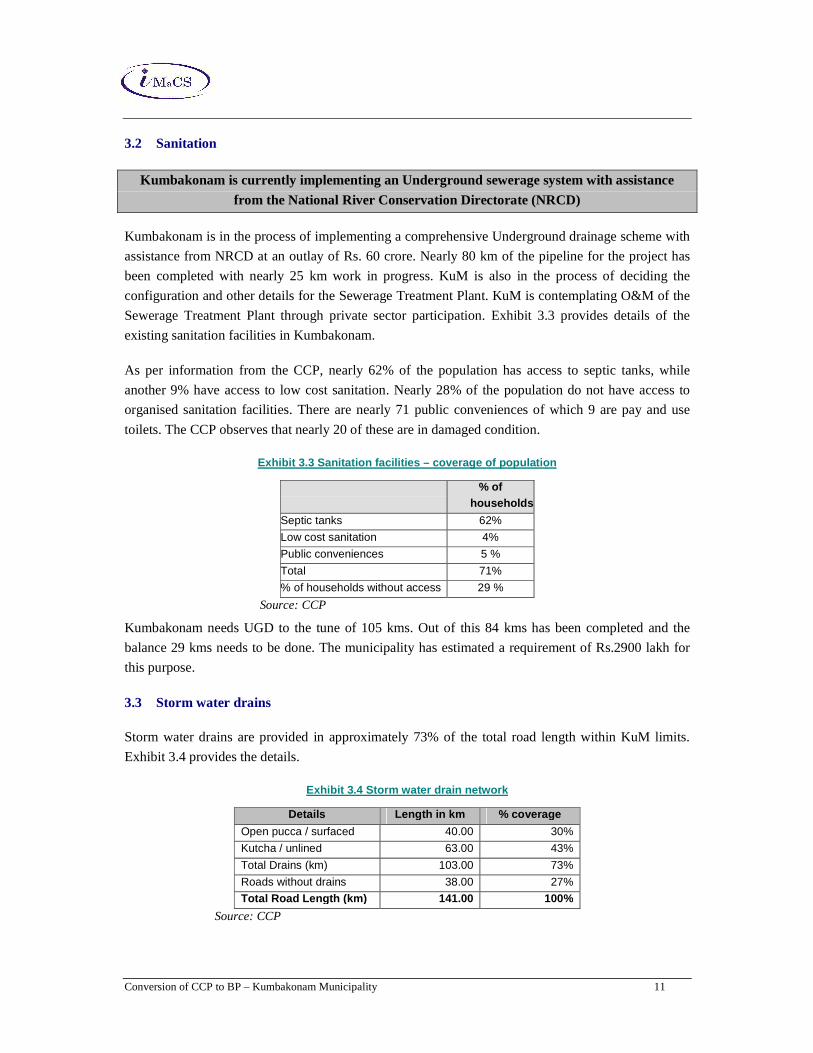
As per information from the CCP, nearly 62% of the population has access to septic tanks, while
another 9% have access to low cost sanitation. Nearly 28% of the population do not have access to
organised sanitation facilities. There are nearly 71 public conveniences of which 9 are pay and use
toilets. The CCP observes that nearly 20 of these are in damaged condition.
Exhibit 3.3 Sanitation facilities – coverage of pop ulation
% of households
Septic tanks 62%
Low cost sanitation 4%
Public conveniences 5 %
Total 71%
% of households without access 29 %
Source: CCP
Kumbakonam needs UGD to the tune of 105 kms. Out of this 84 kms has been completed and the
balance 29 kms needs to be done. The municipality has estimated a requirement of Rs.2900 lakh for
this purpose.
3.3 Storm water drains
Storm water drains are provided in approximately 73% of the total road length within KuM limits.
Exhibit 3.4 provides the details.
Exhibit 3.4 Storm water drain network
Details Lengt h in km % coverage
Open pucca / surfaced 40.00 30%
Kutcha / unlined 63.00 43%
Total Drains (km) 103.00 73%
Roads without drains 38.00 27%
Total Road Length (km) 141.00 100%
Source: CCP

Conversion of CCP to BP – Kumbakonam Municipality 12
Nearly 61% of the existing drains are Kutcha and unlined, which require upgradation to pucca
surfaced drains. During our interactions with KuM, officials pointed out the need to develop the roads
/ storm water drains in an integrated manner and that they plan to undertake this development on
completion of the ongoing UGD scheme.
3.4 Solid Waste Management
Kumbakonam generates nearly 85 MT of solid waste per day, of which nearly 75 MT (or 88%) is
collected. Exhibit 3.5 gives the current status of solid waste management. The disposal yard is located
in Sesambadi villages about 12 km from the town and is not adequate (vis-à-vis the norm of 1 acre per
1000 population). KuM is in the process of adding another 15 acres of land.
The CCP observes the need to add additional equipment for waste collection and to enable 100%
coverage. It also suggests involvement of private participation/involvement of NGOs in primary waste
collection.
Exhibit 3.5 Solid Waste Management - current status
Source: Discussion with KuM officials
KuM’s Vision Plan outlined the following priorities with respect to Solid Waste Management
3.5 Roads and transport characteristics
Exhibit 3.6 provides details of the road network under the jurisdiction of KuM.
Exhibit 3.6 Road network
Generation / day
Domestic 32
Commercial 22
Industrial 11
Public and semi public 14
Market waste 10
Total 89
Collection / day 75 MT
Disposal yard / area 1/ 5.6 acres
Method of disposal 20 T per day through anerobic composting
Action Outlay (Rs. Lakh)
Development of modern compost yard 92.00
Development of 2 transfer stations 48.20
Cost of land for additional yard 15.00
Awareness program 1.80
Total 157. 00
Conversion of CCP to BP – Kumbakonam Municipality 13
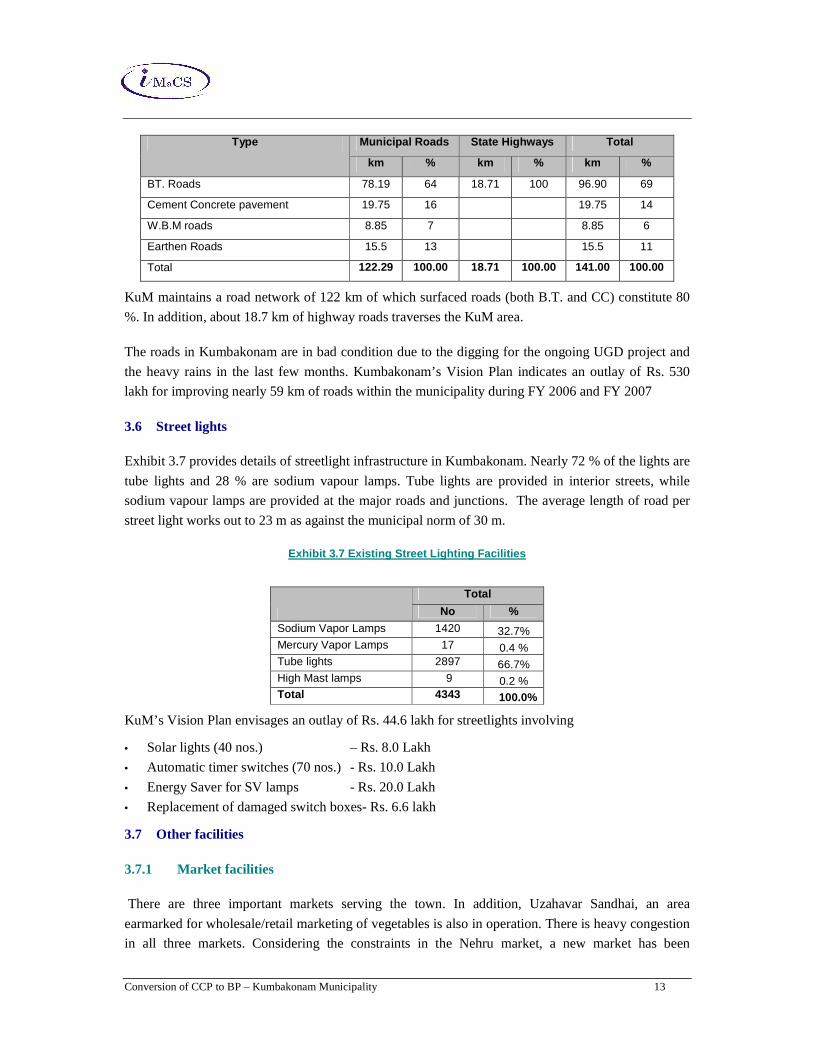
Type Municipal Roads State Highways Total
km % km % km %
BT. Roads 78.19 64 18.71 100 96.90 69
Cement Concrete pavement 19.75 16 19.75 14
W.B.M roads 8.85 7 8.85 6
Earthen Roads 15.5 13 15.5 11
Total 122.29 100.00 18.71 100.00 141.00 100.00
KuM maintains a road network of 122 km of which surfaced roads (both B.T. and CC) constitute 80
%. In addition, about 18.7 km of highway roads traverses the KuM area.
The roads in Kumbakonam are in bad condition due to the digging for the ongoing UGD project and
the heavy rains in the last few months. Kumbakonam’s Vision Plan indicates an outlay of Rs. 530
lakh for improving nearly 59 km of roads within the municipality during FY 2006 and FY 2007
3.6 Street lights
Exhibit 3.7 provides details of streetlight infrastructure in Kumbakonam. Nearly 72 % of the lights are
tube lights and 28 % are sodium vapour lamps. Tube lights are provided in interior streets, while
sodium vapour lamps are provided at the major roads and junctions. The average length of road per
street light works out to 23 m as against the municipal norm of 30 m.
Exhibit 3.7 Existing Street Lighting Facilities
Total
No %
Sodium Vapor Lamps 1420 32.7% Mercury Vapor Lamps 17 0.4 % Tube lights 2897 66.7% High Mast lamps 9 0.2 % Total 4343 100.0%
KuM’s Vision Plan envisages an outlay of Rs. 44.6 lakh for streetlights involving
• Solar lights (40 nos.) – Rs. 8.0 Lakh
• Automatic timer switches (70 nos.) - Rs. 10.0 Lakh
• Energy Saver for SV lamps - Rs. 20.0 Lakh
• Replacement of damaged switch boxes- Rs. 6.6 lakh
3.7 Other facilities
3.7.1 Market facilities
There are three important markets serving the town. In addition, Uzahavar Sandhai, an area
earmarked for wholesale/retail marketing of vegetables is also in operation. There is heavy congestion
in all three markets. Considering the constraints in the Nehru market, a new market has been
Conversion of CCP to BP – Kumbakonam Municipality 14
constructed at Darasuram at an outlay of Rs. 500 lakh. In addition, KuM has also modernised the fish
market at an outlay of Rs. 100 lakh.
3.7.2 Bus stand
A new bus stand has been in operation in Kumbakonam since 1995. With over 50 bus bays and shops,
the bus stand provides a range of facilities to the commuters. However, the demand for shops in the
bus stand has been low. The CCP highlights that the bus stand infrastructure is adequate to meet the
needs of the town.
3.7.3 Burial grounds
There are 4 burial grounds maintained by the municipality. All burial grounds are provided with
lighting facilities and approach roads, water supply and burning sheds. Since the burial grounds are
located adjacent to the river front, they pose environmental hazards. KuM has a proposal to develop a
new Electric Crematorium.
3.7.4 Slaughter house
There are 3 slaughterhouses operating within KuM, but facilities within these are limited. There is a
need to improve the hygiene conditions in the slaughter house and the CCP observes that there is a
need to create a modern slaughter house in the town
3.7.5 Slum Development
KuM has conducted a comprehensive survey of slums in the town. As per information available from
the survey, there are 45 slums in Kumbakonam with an overall population of 49117. The survey
covered 45 streets / areas in 31 wards in the town that have slums and also prepared the level of urban
service amenities in these areas. As per estimates prepared by KuM, about Rs. 400 lakh is required
for providing infrastructure amenities to the slum population in the short term. The municipality
estimates that Rs. 9000 lakh would be required for slum development of which Rs. 1300 lakh has
already been sanctioned under IHSDP.
3.8 Capital Investment Plan
We have compiled the felt needs of the city under various service areas, based on
• Review of projects recommended in the City Corporate Plan prepared earlier under TNUDP - II
• Status and progress on projects identified as part of the Vision Plan (2004-09) prepared by KuM
• Discussion with KuM officials and Council members.
Exhibit 3.8 provides project components of the Capital Investment Plan over the next ten years for
various services and the estimated outlay for implementing these projects. Nearly Rs. 194 crore of
investment is required over the next ten years to address these felt needs.
Conversion of CCP to BP – Kumbakonam Municipality 15
Priority projects identified by the municipality are listed below. These projects and the capital
expenditure estimates given above have been arrived at based on projects identified in the City
Corporate Plan prepared earlier and based on discussion with Chairperson, Commissioner and
municipal officials.
5. Completion of ongoing UGD scheme. Additional areas left out in the current scheme of
approximately 29 km of roads as identified also need to be taken up.
6. Restoration and upgradation of roads in view of the poor condition following implementation of
UGD scheme and heavy rains last year.
7. Pilot project for providing 24x7 water supply in select wards to be subsequently scaled up in
whole town and Installation of meters at various stages in the supply chain from head works,
transmission system and distribution to minimise leakages and to have a centralised control of the
network.
8. Remunerative projects, largely through private participation and BOT basis, specifically relating
to tourism development as listed below:
a. Park along with recreation facilities at Srinivasa Nagar
b. Museum at Government arts college
c. Recreation facilities at Tank in Electricity Board office on Mayiladuthurai Road
d. Light/sound show, handicrafts and Description of heritage importance covering Mahamaham
and other aspects of Kumbakonam at unused tank area at Vanathurai
e. Provision of open theatre and park at Ayikulam land
f. Provision of evening bazaar for selling handicraft and other items at the vegetable market at
Darasuram to utilise the facility more effectively.
g. Creation and operation of a horticultural (flower) gardent at the Sewerage Treatment Plant
site through Self Help Groups
h. Development of municipal land in TS. NO. 79 part, 74 part, 75 part in block no. 1 Ts ward 5
to develop a Shopping Mall on the Ground floor, and Community Hall on First Floor and
mini A/c Theatre in First Floor
i. Office complex, Library and Community centre at Nataraja Chettiar School in Kumbeswaran
Park.
Exhibit 3.8 provides a brief snapshot of the felt needs of KuM over the next ten years for various
services and the estimated outlay for implementing these projects.
Exhibit 3.8 KuM - Felt needs (2007-12)
Conversion of CCP to BP – Kumbakonam Municipality 16
Segment Outlay Rs. Lakh (2007-12)
Ongoing projects and projects envisaged in Vision P lan
Roads 1500 Kumbakonam has around 160 kms of roads. The municipality intends to complete the road works in 2006. Around 48 kms of road works at a cost of Rs.4.94Cr. are being undertaken presently.
Bridges and Culverts 25
Storm Water Drains 1000 The municipality needs to undertake projects to the tune of Rs. 10 Cr. for storm water drains
Water Supply 2000 Pilot project for providing 24x7 water supply in select wards to be subsequently scaled up in whole town. Installation of meters at various stages in the supply chain from head works, transmission system and distribution to minimise leakages and to have a centralised control of the network.
Solid Waste Management 850 An integrated solid waste management program by procuring vehicles, equipments, establishing compost yards have been planned.
Street Lights 75 Energy savings Proposal through private participation being considered
Tourism projects and Remunerative Enterprises
2000 Construction of shops in bus stand, office buildings, commercial complexes, markets (daily and weekly) slaughter houses and 11 tourism / recreation projects identified by KuM
Education 55 Renovation of elementary schools and noon meal centres
Sewerage and Sanitation 2900 Kumbakonam needs UGD to the tune of 105 kms. Out of this 84 kms has been completed and the balance 29 kms needs to be done. The municipality has estimated a requirement of Rs.2900 lakh for this purpose.
Slum Development 9000 Rs. 1300 lakh already sanctioned under IHSDP
Others 71 Dhobikana, Town beautification, rain water harvesting, etc
TOTAL 19476
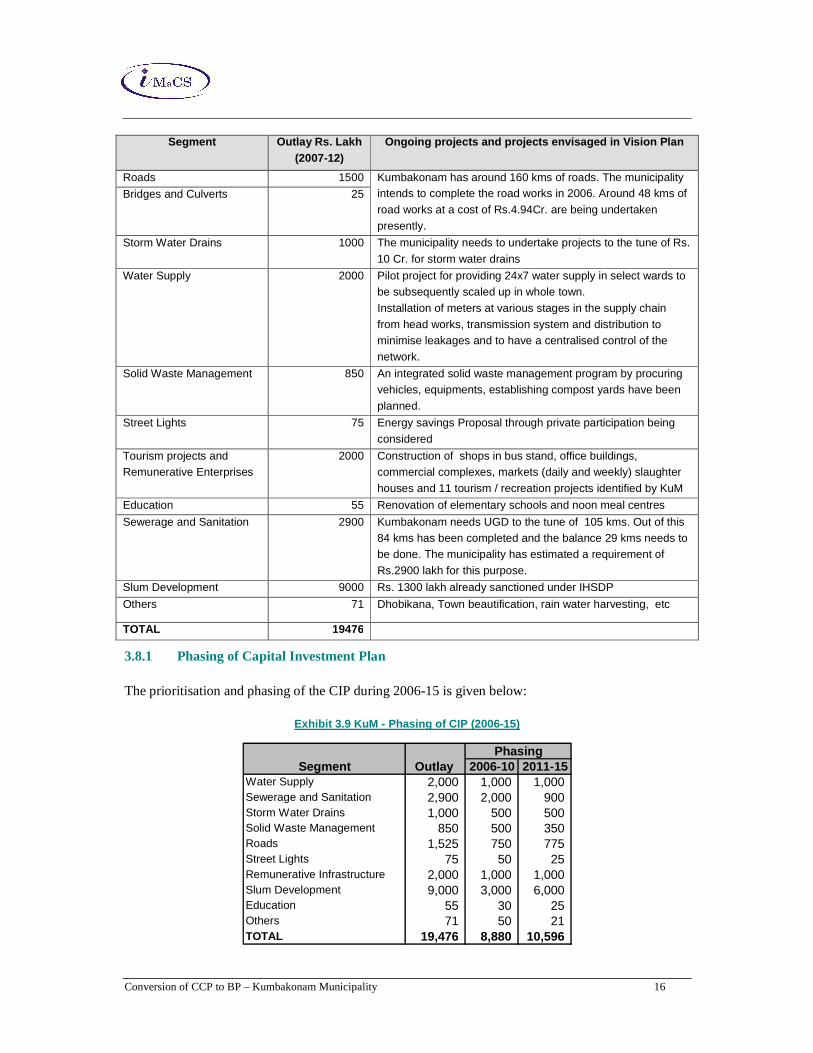
3.8.1 Phasing of Capital Investment Plan
The prioritisation and phasing of the CIP during 2006-15 is given below:
Exhibit 3.9 KuM - Phasing of CIP (2006-15)
2006-10 2011-15Water Supply 2,000 1,000 1,000 Sewerage and Sanitation 2,900 2,000 900 Storm Water Drains 1,000 500 500 Solid Waste Management 850 500 350 Roads 1,525 750 775 Street Lights 75 50 25 Remunerative Infrastructure 2,000 1,000 1,000 Slum Development 9,000 3,000 6,000 Education 55 30 25 Others 71 50 21 TOTAL 19,476 8,880 10,596
Segment Outlay Phasing
Conversion of CCP to BP – Kumbakonam Municipality 17
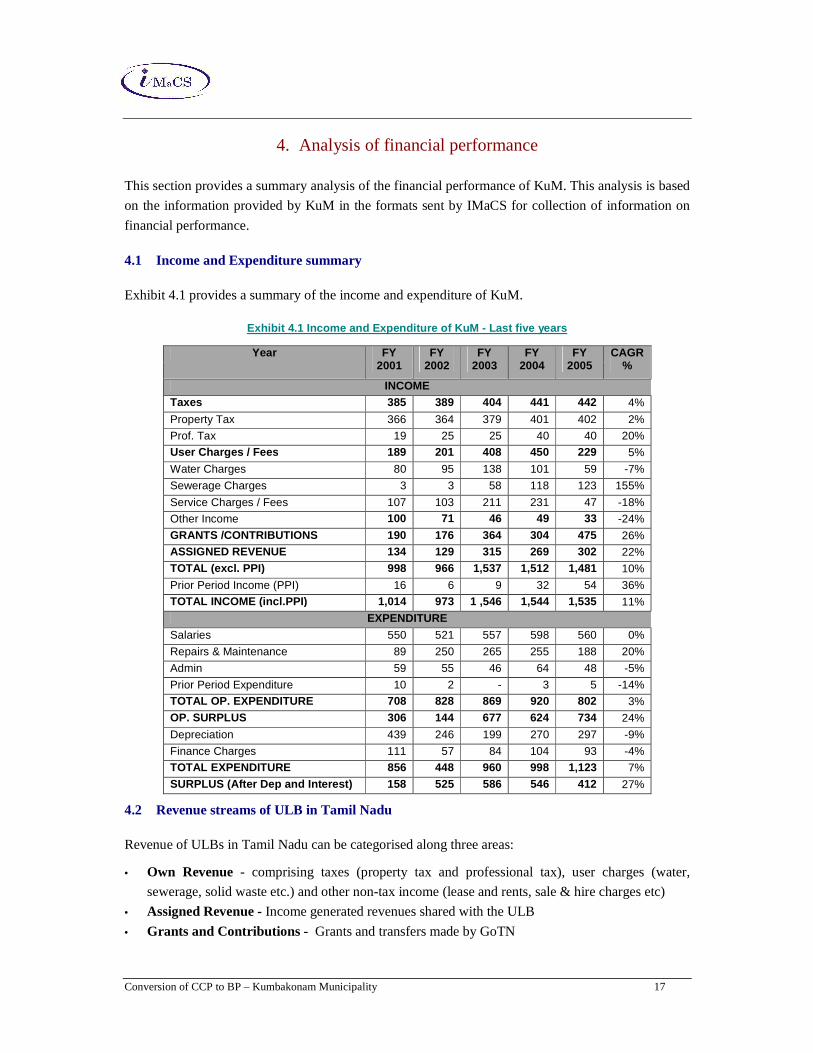
4. Analysis of financial performance
This section provides a summary analysis of the financial performance of KuM. This analysis is based
on the information provided by KuM in the formats sent by IMaCS for collection of information on
financial performance.
4.1 Income and Expenditure summary
Exhibit 4.1 provides a summary of the income and expenditure of KuM.
Exhibit 4.1 Income and Expenditure of KuM - Last fi ve years
Year FY 2001
FY 2002
FY 2003
FY 2004
FY 2005
CAGR %
INCOME Taxes 385 389 404 441 442 4%
Property Tax 366 364 379 401 402 2%
Prof. Tax 19 25 25 40 40 20%
User Charges / Fees 189 201 408 450 229 5%
Water Charges 80 95 138 101 59 -7%
Sewerage Charges 3 3 58 118 123 155%
Service Charges / Fees 107 103 211 231 47 -18%
Other Income 100 71 46 49 33 -24%
GRANTS /CONTRIBUTIONS 190 176 364 304 475 26% ASSIGNED REVENUE 134 129 315 269 302 22%
TOTAL (excl. PPI) 998 966 1,537 1,512 1,481 10%
Prior Period Income (PPI) 16 6 9 32 54 36%
TOTAL INCOME (incl.PPI) 1,014 973 1 ,546 1,544 1,535 11%
EXPENDITURE
Salaries 550 521 557 598 560 0%
Repairs & Maintenance 89 250 265 255 188 20%
Admin 59 55 46 64 48 -5%
Prior Period Expenditure 10 2 - 3 5 -14%
TOTAL OP. EXPENDITURE 708 828 869 920 802 3%
OP. SURPLUS 306 144 677 624 734 24%
Depreciation 439 246 199 270 297 -9%
Finance Charges 111 57 84 104 93 -4%
TOTAL EXPENDITURE 856 448 960 998 1,123 7%
SURPLUS (After Dep and Interest) 158 525 586 546 412 27%
4.2 Revenue streams of ULB in Tamil Nadu
Revenue of ULBs in Tamil Nadu can be categorised along three areas:
• Own Revenue - comprising taxes (property tax and professional tax), user charges (water,
sewerage, solid waste etc.) and other non-tax income (lease and rents, sale & hire charges etc)
• Assigned Revenue - Income generated revenues shared with the ULB
• Grants and Contributions - Grants and transfers made by GoTN
Conversion of CCP to BP – Kumbakonam Municipality 18
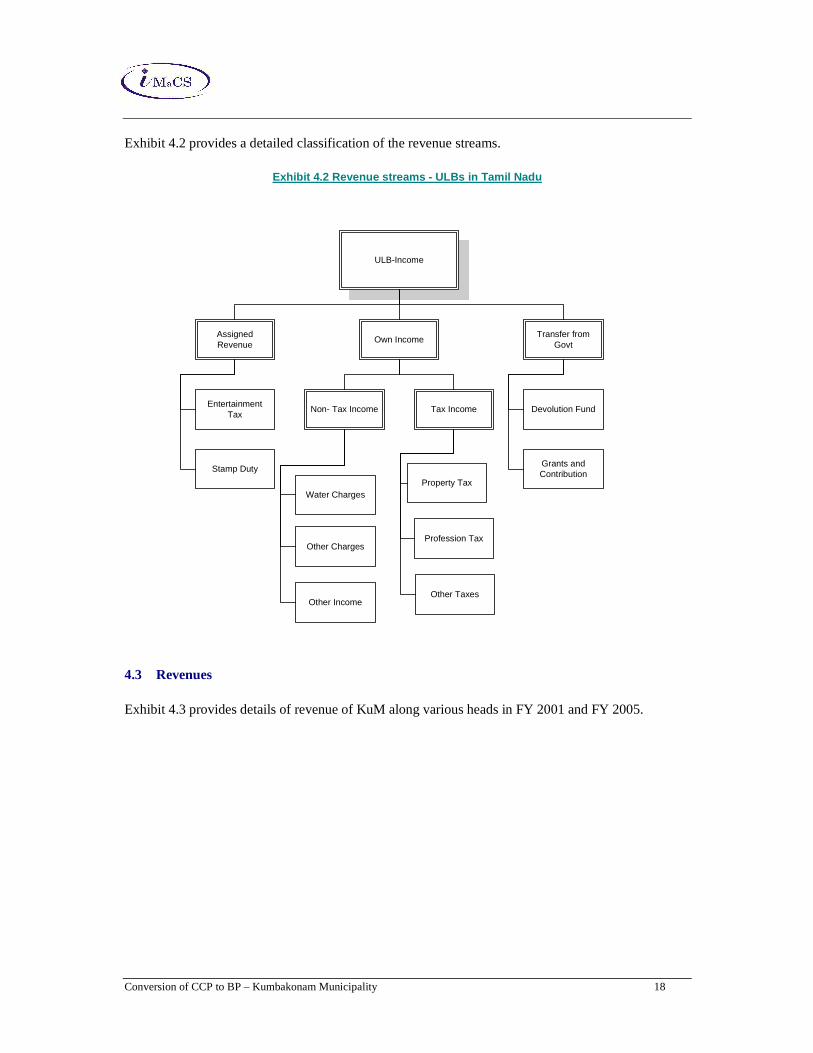
Exhibit 4.2 provides a detailed classification of the revenue streams.
Exhibit 4.2 Revenue streams - ULBs in Tamil Nadu
4.3 Revenues
Exhibit 4.3 provides details of revenue of KuM along various heads in FY 2001 and FY 2005.
ULB-Income
AssignedRevenue
EntertainmentTax
Stamp Duty
Own Income
Non- Tax Income
Other Charges
Other Income
Water Charges
Tax Income
Other Taxes
Profession Tax
Property Tax
Transfer fromGovt
Devolution Fund
Grants andContribution
Conversion of CCP to BP – Kumbakonam Municipality 19
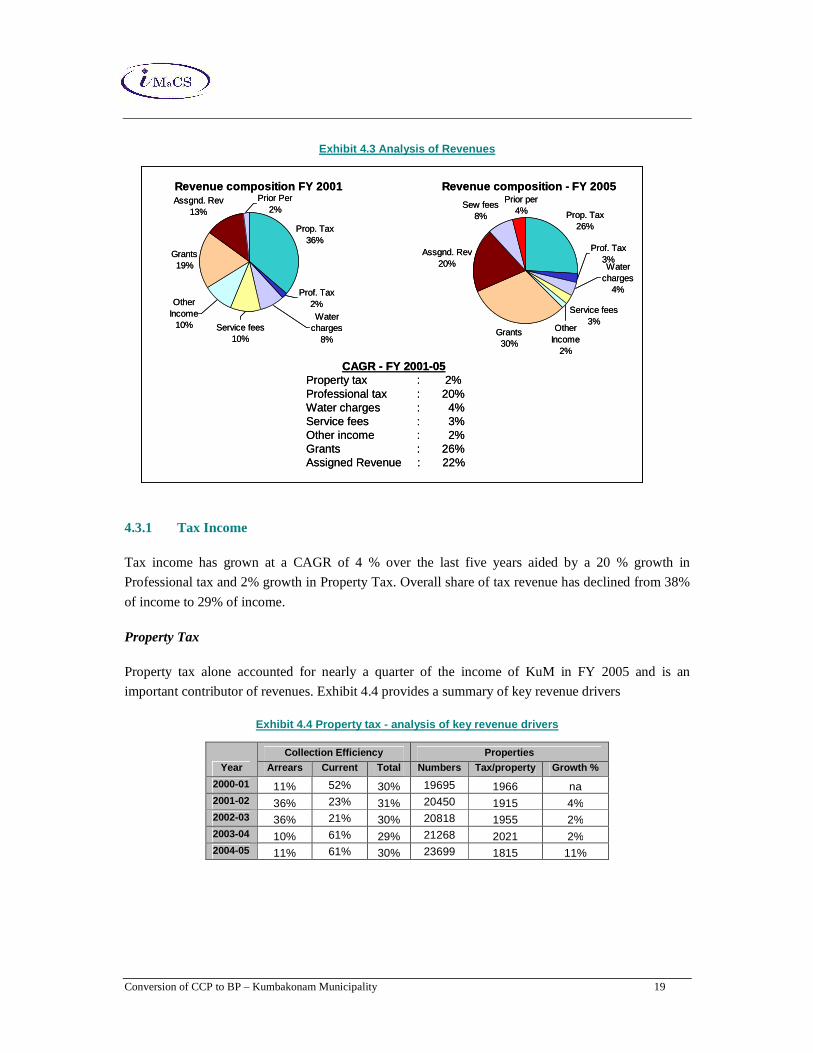
Exhibit 4.3 Analysis of Revenues
4.3.1 Tax Income
Tax income has grown at a CAGR of 4 % over the last five years aided by a 20 % growth in
Professional tax and 2% growth in Property Tax. Overall share of tax revenue has declined from 38%
of income to 29% of income.
Property Tax
Property tax alone accounted for nearly a quarter of the income of KuM in FY 2005 and is an
important contributor of revenues. Exhibit 4.4 provides a summary of key revenue drivers
Exhibit 4.4 Property tax - analysis of key revenue drivers
Year
Collection Efficiency Properties
Arrears Current Total Numbers Tax/property Growth %
2000-01 11% 52% 30% 19695 1966 na 2001-02 36% 23% 31% 20450 1915 4% 2002-03 36% 21% 30% 20818 1955 2% 2003-04 10% 61% 29% 21268 2021 2% 2004-05 11% 61% 30% 23699 1815 11%
Revenue composition FY 2001
Prop. Tax36%
Grants19%
Assgnd. Rev13%
Other Income
10%
Prior Per2%
Service fees10%
Prof. Tax2%Water
charges8%
Revenue composition - FY 2005
Prop. Tax26%
Grants30%
Assgnd. Rev20%
Sew fees8%
Prior per4%
Service fees3%
Other Income
2%
Prof. Tax3%Water
charges4%
CAGR - FY 2001-05Property tax : 2%Professional tax : 20%Water charges : 4%Service fees : 3%Other income : 2% Grants : 26%Assigned Revenue : 22%
Conversion of CCP to BP – Kumbakonam Municipality 20
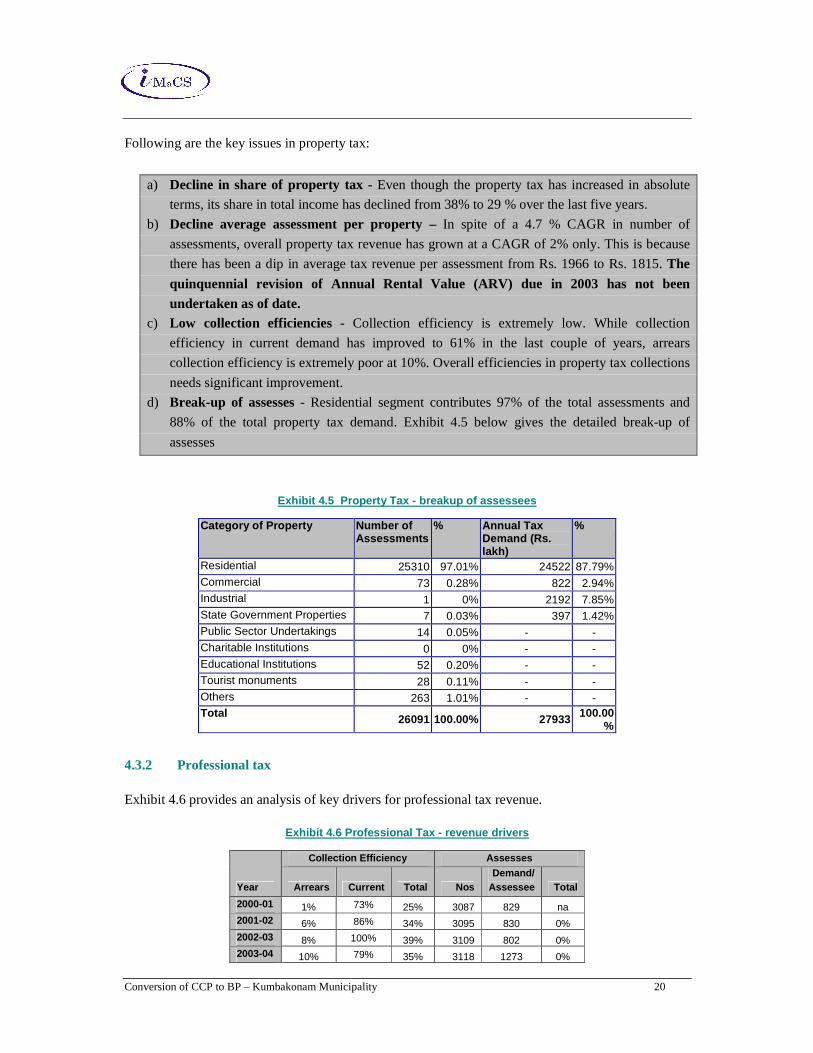
Following are the key issues in property tax:
a) Decline in share of property tax - Even though the property tax has increased in absolute
terms, its share in total income has declined from 38% to 29 % over the last five years.
b) Decline average assessment per property – In spite of a 4.7 % CAGR in number of
assessments, overall property tax revenue has grown at a CAGR of 2% only. This is because
there has been a dip in average tax revenue per assessment from Rs. 1966 to Rs. 1815. The
quinquennial revision of Annual Rental Value (ARV) due in 2003 has not been undertaken as of date.
c) Low collection efficiencies - Collection efficiency is extremely low. While collection
efficiency in current demand has improved to 61% in the last couple of years, arrears
collection efficiency is extremely poor at 10%. Overall efficiencies in property tax collections
needs significant improvement.
d) Break-up of assesses - Residential segment contributes 97% of the total assessments and
88% of the total property tax demand. Exhibit 4.5 below gives the detailed break-up of
assesses
Exhibit 4.5 Property Tax - breakup of assessees
Category of Property Number of Assessments
% Annual Tax Demand (Rs. lakh)
%
Residential 25310 97.01% 24522 87.79% Commercial 73 0.28% 822 2.94% Industrial 1 0% 2192 7.85% State Government Properties 7 0.03% 397 1.42% Public Sector Undertakings 14 0.05% - - Charitable Institutions 0 0% - - Educational Institutions 52 0.20% - - Tourist monuments 28 0.11% - - Others 263 1.01% - - Total 26091 100.00% 27933 100.00
%
4.3.2 Professional tax
Exhibit 4.6 provides an analysis of key drivers for professional tax revenue.
Exhibit 4.6 Professional Tax - revenue drivers
Year
Collection Efficiency Assesses
Arrears Current Total Nos Demand/
Assessee Total
2000-01 1% 73% 25% 3087 829 na 2001-02 6% 86% 34% 3095 830 0% 2002-03 8% 100% 39% 3109 802 0% 2003-04 10% 79% 35% 3118 1273 0%
Conversion of CCP to BP – Kumbakonam Municipality 21
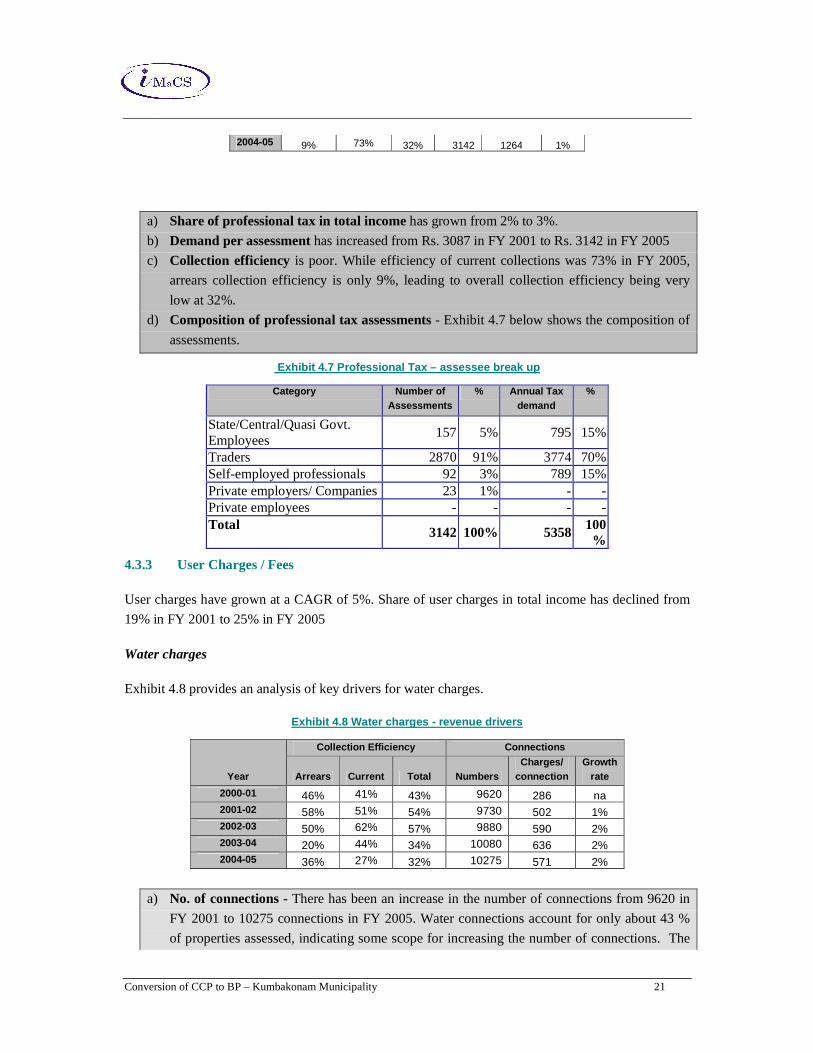
2004-05 9% 73% 32% 3142 1264 1%
a) Share of professional tax in total income has grown from 2% to 3%.
b) Demand per assessment has increased from Rs. 3087 in FY 2001 to Rs. 3142 in FY 2005
c) Collection efficiency is poor. While efficiency of current collections was 73% in FY 2005,
arrears collection efficiency is only 9%, leading to overall collection efficiency being very
low at 32%.
d) Composition of professional tax assessments - Exhibit 4.7 below shows the composition of
assessments.
Exhibit 4.7 Professional Tax – assessee break up
Category Number of Assessments
% Annual Tax demand
%
State/Central/Quasi Govt. Employees
157 5% 795 15%
Traders 2870 91% 3774 70% Self-employed professionals 92 3% 789 15% Private employers/ Companies 23 1% - - Private employees - - - - Total 3142 100% 5358 100
%
4.3.3 User Charges / Fees
User charges have grown at a CAGR of 5%. Share of user charges in total income has declined from
19% in FY 2001 to 25% in FY 2005
Water charges
Exhibit 4.8 provides an analysis of key drivers for water charges.
Exhibit 4.8 Water charges - revenue drivers
Year
Collection Efficiency Connections
Arrears Current Total Numbers Charges/
connection Growth
rate
2000-01 46% 41% 43% 9620 286 na 2001-02 58% 51% 54% 9730 502 1% 2002-03 50% 62% 57% 9880 590 2% 2003-04 20% 44% 34% 10080 636 2% 2004-05 36% 27% 32% 10275 571 2%
a) No. of connections - There has been an increase in the number of connections from 9620 in
FY 2001 to 10275 connections in FY 2005. Water connections account for only about 43 %
of properties assessed, indicating some scope for increasing the number of connections. The
Conversion of CCP to BP – Kumbakonam Municipality 22
low penetration is also due to the availability of water fountains in several areas (covering
nearly 35% of population) which lead to loss of revenue for KuM.
b) Average water fees / connection has increased from about Rs. 286 per year per connection
in FY 2001 to Rs. 571 per connection in FY 2005.
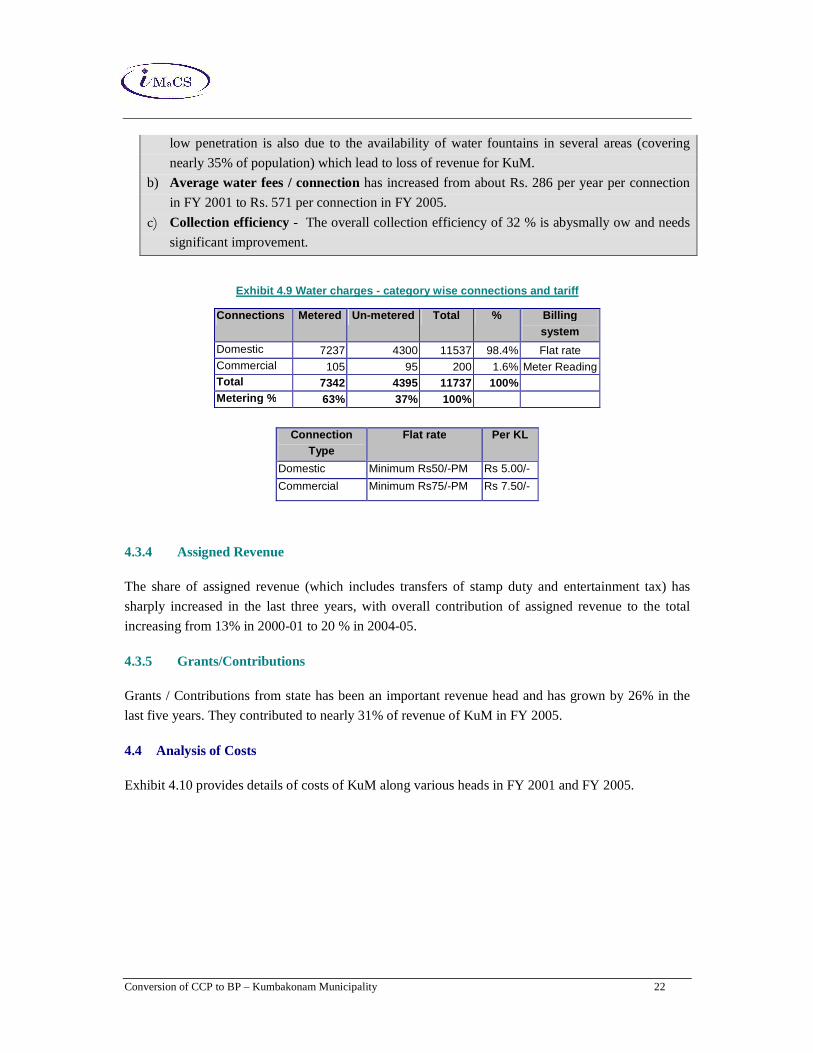
c) Collection efficiency - The overall collection efficiency of 32 % is abysmally ow and needs
significant improvement.
Exhibit 4.9 Water charges - category wise connectio ns and tariff
Conn ections Metered Un-metered Total % Billing system
Domestic 7237 4300 11537 98.4% Flat rate Commercial 105 95 200 1.6% Meter Reading Total 7342 4395 11737 100% Metering % 63% 37% 100%
Connection Type
Flat rate Per KL
Domestic Minimum Rs50/-PM Rs 5.00/-
Commercial Minimum Rs75/-PM Rs 7.50/-
4.3.4 Assigned Revenue
The share of assigned revenue (which includes transfers of stamp duty and entertainment tax) has
sharply increased in the last three years, with overall contribution of assigned revenue to the total
increasing from 13% in 2000-01 to 20 % in 2004-05.
4.3.5 Grants/Contributions
Grants / Contributions from state has been an important revenue head and has grown by 26% in the
last five years. They contributed to nearly 31% of revenue of KuM in FY 2005.
4.4 Analysis of Costs
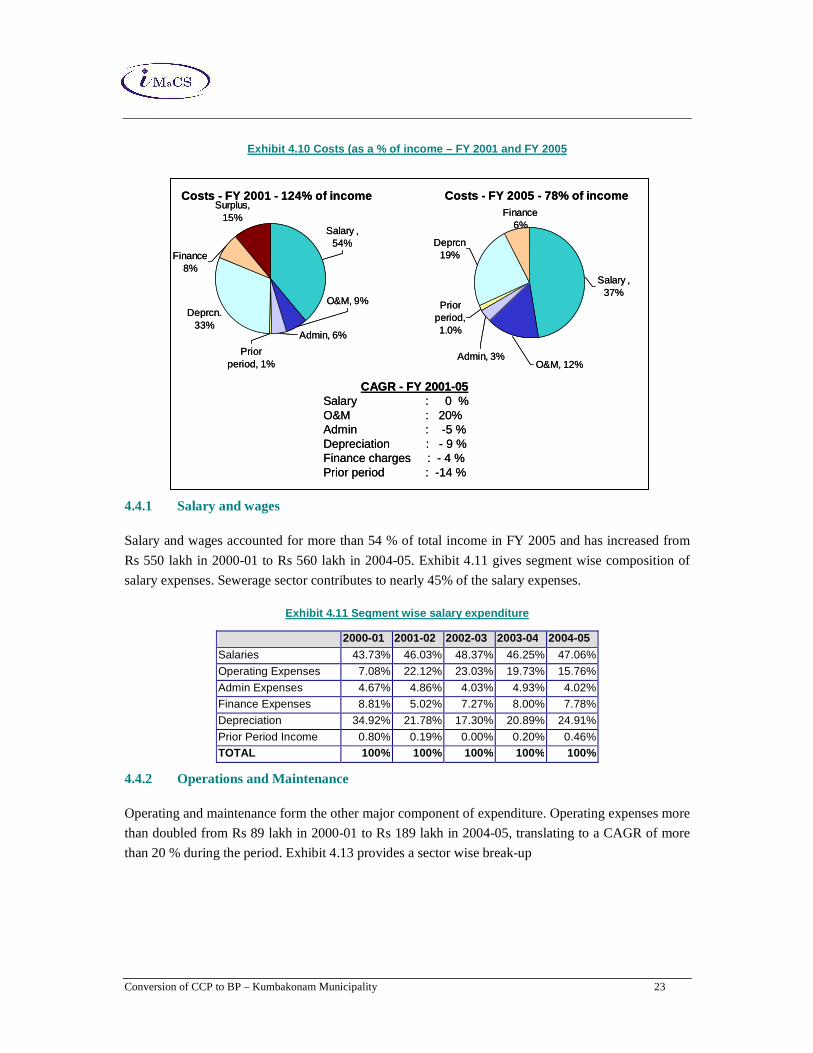
Exhibit 4.10 provides details of costs of KuM along various heads in FY 2001 and FY 2005.
Conversion of CCP to BP – Kumbakonam Municipality 23
Exhibit 4.10 Costs (as a % of income – FY 2001 and FY 2005
4.4.1 Salary and wages
Salary and wages accounted for more than 54 % of total income in FY 2005 and has increased from
Rs 550 lakh in 2000-01 to Rs 560 lakh in 2004-05. Exhibit 4.11 gives segment wise composition of
salary expenses. Sewerage sector contributes to nearly 45% of the salary expenses.
Exhibit 4.11 Segment wise salary expenditure
2000-01 2001-02 2002-03 2003-04 2004-05
Salaries 43.73% 46.03% 48.37% 46.25% 47.06%
Operating Expenses 7.08% 22.12% 23.03% 19.73% 15.76%
Admin Expenses 4.67% 4.86% 4.03% 4.93% 4.02%
Finance Expenses 8.81% 5.02% 7.27% 8.00% 7.78%
Depreciation 34.92% 21.78% 17.30% 20.89% 24.91%
Prior Period Income 0.80% 0.19% 0.00% 0.20% 0.46% TOTAL 100% 100% 100% 100% 100%
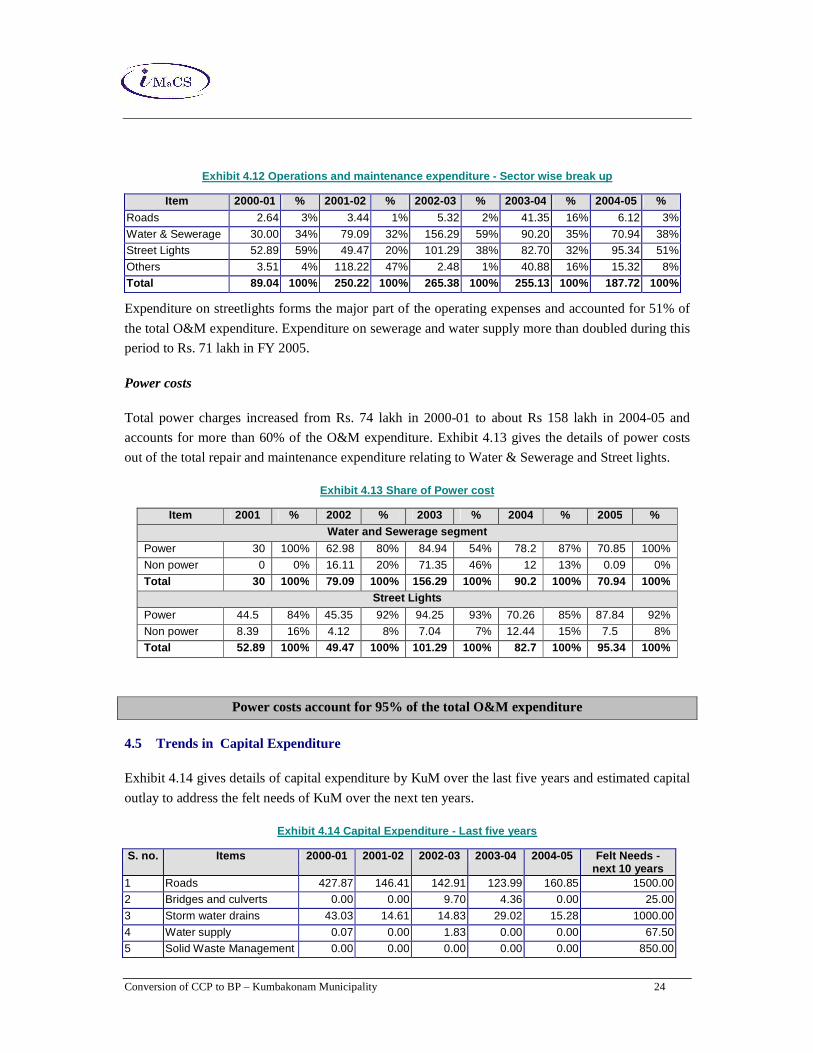
4.4.2 Operations and Maintenance
Operating and maintenance form the other major component of expenditure. Operating expenses more
than doubled from Rs 89 lakh in 2000-01 to Rs 189 lakh in 2004-05, translating to a CAGR of more
than 20 % during the period. Exhibit 4.13 provides a sector wise break-up
Costs - FY 2001 - 124% of incomeSurplus,
15%
Deprcn.33%
Salary , 54%
Finance 8%
Prior period, 1%
O&M, 9%
Admin, 6%
CAGR - FY 2001-05Salary : 0 % O&M : 20%Admin : -5 %Depreciation : - 9 %Finance charges : - 4 %Prior period : -14 %
Costs - FY 2005 - 78% of income
Deprcn19%
Salary , 37%
Finance 6%
Prior period, 1.0%
O&M, 12%Admin, 3%
Conversion of CCP to BP – Kumbakonam Municipality 24
Exhibit 4.12 Operations and maintenance expenditure - Sector wise break up
Item 2000-01 % 2001-02 % 2002-03 % 2003-04 % 2004-05 %
Roads 2.64 3% 3.44 1% 5.32 2% 41.35 16% 6.12 3%
Water & Sewerage 30.00 34% 79.09 32% 156.29 59% 90.20 35% 70.94 38%
Street Lights 52.89 59% 49.47 20% 101.29 38% 82.70 32% 95.34 51%
Others 3.51 4% 118.22 47% 2.48 1% 40.88 16% 15.32 8%
Total 89.04 100% 250.22 100% 265.38 100% 255.13 100% 187.72 100%
Expenditure on streetlights forms the major part of the operating expenses and accounted for 51% of
the total O&M expenditure. Expenditure on sewerage and water supply more than doubled during this
period to Rs. 71 lakh in FY 2005.
Power costs
Total power charges increased from Rs. 74 lakh in 2000-01 to about Rs 158 lakh in 2004-05 and
accounts for more than 60% of the O&M expenditure. Exhibit 4.13 gives the details of power costs
out of the total repair and maintenance expenditure relating to Water & Sewerage and Street lights.
Exhibit 4.13 Share of Power cost
Item 2001 % 2002 % 2003 % 2004 % 2005 % Water and Sewerage segment
Power 30 100% 62.98 80% 84.94 54% 78.2 87% 70.85 100%
Non power 0 0% 16.11 20% 71.35 46% 12 13% 0.09 0%
Total 30 100% 79.09 100% 156.29 100% 90.2 100% 70.94 100% Street Lights
Power 44.5 84% 45.35 92% 94.25 93% 70.26 85% 87.84 92%
Non power 8.39 16% 4.12 8% 7.04 7% 12.44 15% 7.5 8%
Total 52.89 100% 49.47 100% 101.29 100% 82.7 100% 95.34 100%
Power costs account for 95% of the total O&M expenditure
4.5 Trends in Capital Expenditure
Exhibit 4.14 gives details of capital expenditure by KuM over the last five years and estimated capital
outlay to address the felt needs of KuM over the next ten years.
Exhibit 4.14 Capital Expenditure - Last five years
S. no. Items 2000-01 2001-02 2002-03 2003-04 2004-05 Felt Needs - next 10 years
1 Roads 427.87 146.41 142.91 123.99 160.85 1500.00
2 Bridges and culverts 0.00 0.00 9.70 4.36 0.00 25.00
3 Storm water drains 43.03 14.61 14.83 29.02 15.28 1000.00
4 Water supply 0.07 0.00 1.83 0.00 0.00 67.50
5 Solid Waste Management 0.00 0.00 0.00 0.00 0.00 850.00
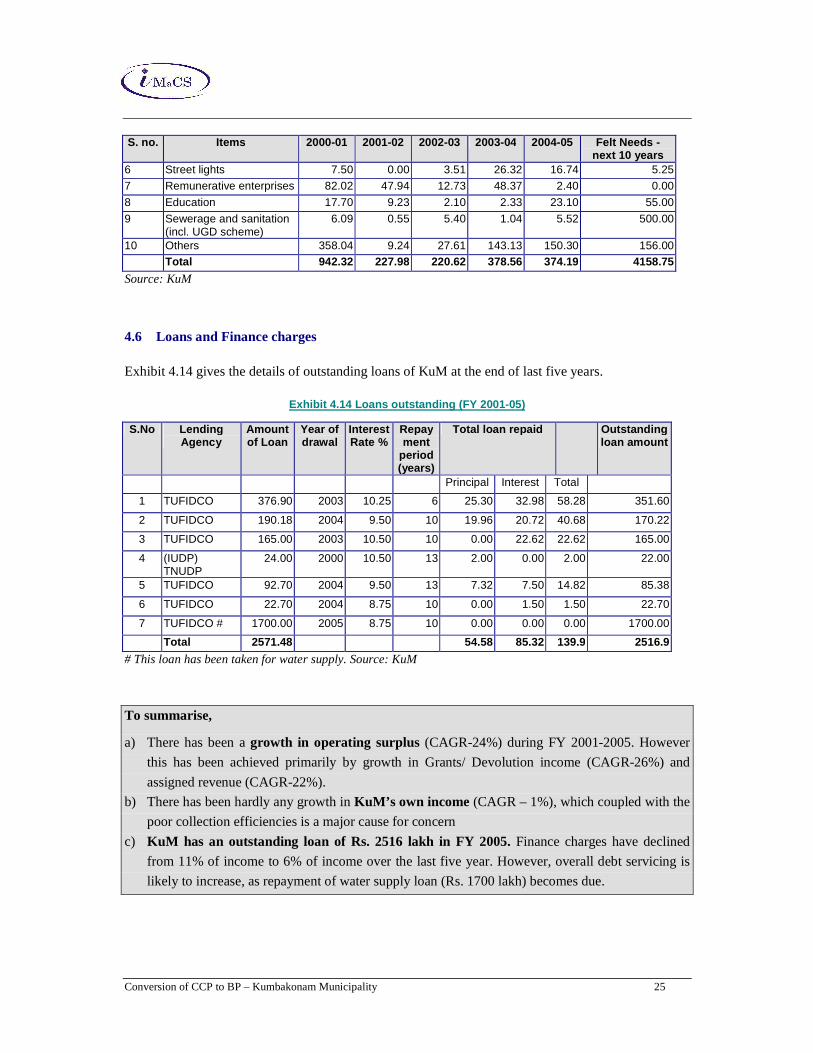
Conversion of CCP to BP – Kumbakonam Municipality 25
S. no. Items 2000-01 2001-02 2002-03 2003-04 2004-05 Felt Needs - next 10 years
6 Street lights 7.50 0.00 3.51 26.32 16.74 5.25
7 Remunerative enterprises 82.02 47.94 12.73 48.37 2.40 0.00
8 Education 17.70 9.23 2.10 2.33 23.10 55.00
9 Sewerage and sanitation (incl. UGD scheme)
6.09 0.55 5.40 1.04 5.52 500.00
10 Others 358.04 9.24 27.61 143.13 150.30 156.00 Tota l 942.32 227.98 220.62 378.56 374.19 4158.75
Source: KuM
4.6 Loans and Finance charges
Exhibit 4.14 gives the details of outstanding loans of KuM at the end of last five years.
Exhibit 4.14 Loans outstanding (FY 2001-05)
S.No Lending Agency
Amount of Loan
Year of drawal
Interest Rate %
Repayment
period (years)
Total loan repaid Outstanding loan amount
Principal Interest Total
1 TUFIDCO 376.90 2003 10.25 6 25.30 32.98 58.28 351.60
2 TUFIDCO 190.18 2004 9.50 10 19.96 20.72 40.68 170.22
3 TUFIDCO 165.00 2003 10.50 10 0.00 22.62 22.62 165.00
4 (IUDP) TNUDP
24.00 2000 10.50 13 2.00 0.00 2.00 22.00
5 TUFIDCO 92.70 2004 9.50 13 7.32 7.50 14.82 85.38
6 TUFIDCO 22.70 2004 8.75 10 0.00 1.50 1.50 22.70
7 TUFIDCO # 1700.00 2005 8.75 10 0.00 0.00 0.00 1700.00
Total 2571.48 54.58 85.32 139.9 2516.9
# This loan has been taken for water supply. Source: KuM
To summarise,
a) There has been a growth in operating surplus (CAGR-24%) during FY 2001-2005. However
this has been achieved primarily by growth in Grants/ Devolution income (CAGR-26%) and
assigned revenue (CAGR-22%).
b) There has been hardly any growth in KuM’s own income (CAGR – 1%), which coupled with the
poor collection efficiencies is a major cause for concern
c) KuM has an outstanding loan of Rs. 2516 lakh in FY 2005. Finance charges have declined
from 11% of income to 6% of income over the last five year. However, overall debt servicing is
likely to increase, as repayment of water supply loan (Rs. 1700 lakh) becomes due.

Conversion of CCP to BP – Kumbakonam Municipality 26
5. Potential areas for improvement
5.1 Public private partnerships (PPP)
KuM is considering handling the operations and maintenance of the Sewerage Treatment Plant of the
ongoing UGD scheme through private sector particaption. KuM should explore more areas to
augment its own resources through use of PPPs. PPPs have been found to be very effective in
addressing efficiency and asset management (through pre-defined service levels and accountability for
operations and maintenance) aspects of infrastructure development. In this regard,
1. CMA, GoTN should develop a framework for PPP including specific policies and guidelines.
2. KuM should explore use of private sector participation in undertaking its proposed projects in
tourism and recreational facilities. through public private partnerships.
3. Being part of an heritage circuit, KuM should actively pursue projects that improve the tourist
experience in the town. Several initiatives relating to tourism development can be pursued in
partnership with private sector investment / corporate donations and NGO/Self Help Group
partnerships. Specifically, KuM should
• Encourage corporate / NGO partnerships for heritage preservation and city beautification
projects, including development and maintenance of parks.
• Consider addition of more identified parking zones and pay-and-use toilets in the town. These
could be maintained through Self-Help Groups.
• Explore the feasibility of provision of integrated concrete roads with ducts for underground
cabling and storm water drains around important heritage/tourist areas and align traffic movement
to ensure ease of tourist movement during festivals. This would also enable better tourist
experience and better maintenance of heritage centres.
4. TNUIFSL should provide assistance covering necessary capacity building (in terms of evaluating mechanisms - BOT, SPV etc) and financing for developing projects through
private sector participation.
5.2 Potential for revenue enhancement
5.2.1 Property Tax
Exhibit 5.1 highlights the key issues and recommended interventions with respect to property tax.
While a substantial improvement in property tax is contingent upon implementation of ARV revision
(due in 2003), there are other interventions that would enable effective property tax realisation.
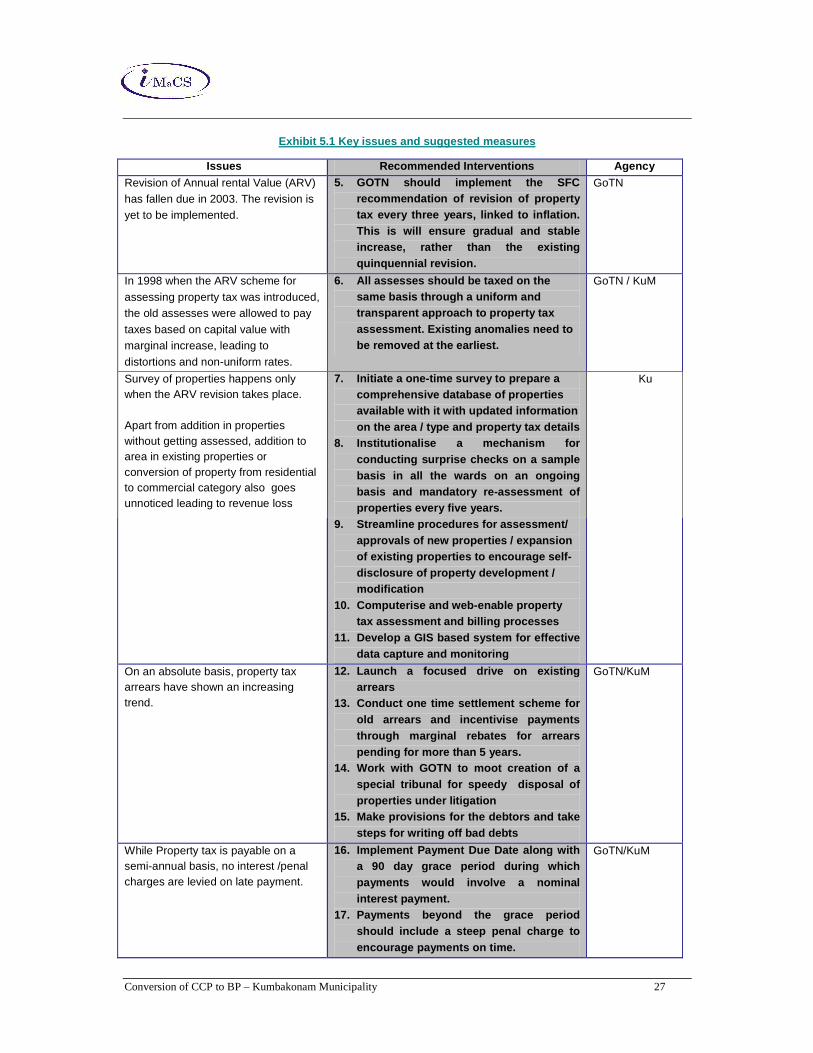
Conversion of CCP to BP – Kumbakonam Municipality 27
Exhibit 5.1 Key issues and suggested measures
Issues Recommended Interventions Agency
Revision of Annual rental Value (ARV) has fallen due in 2003. The revision is yet to be implemented.
5. GOTN should implement the SFC recommendation of revision of property tax every three years, linked to inflation. This is will ensure gradual and stable increase, rather than the existing quinquennial revision.
GoTN
In 1998 when the ARV scheme for
assessing property tax was introduced, the old assesses were allowed to pay
taxes based on capital value with marginal increase, leading to
distortions and non-uniform rates.
6. All assesses should be taxed on the same basis through a uniform and transparent approach to property tax assessment. Existing anomalies need to be removed at the earliest.
GoTN / KuM
Survey of properties happens only when the ARV revision takes place. Apart from addition in properties without getting assessed, addition to area in existing properties or conversion of property from residential to commercial category also goes unnoticed leading to revenue loss
7. Initiate a one -time survey to prepare a comprehensive database of properties available with it with updated information on the area / type and property tax details
8. Institutionalise a mechanism for conducting surprise checks on a sample basis in all the wards on an ongoing basis and mandatory re-assessment of properties every five years.
Ku
9. Streamline procedures for assessment/ approvals of new properties / expansion of existing properties to encourage self-disclosure of property development / modification
10. Computerise and web-enable property tax assessment and billing processes
11. Develop a GIS based system for effective data capture and monitoring
On an absolute basis, property tax arrears have shown an increasing trend.
12. Launch a fo cused drive on existing arrears
13. Conduct one time settlement scheme for old arrears and incentivise payments through marginal rebates for arrears pending for more than 5 years.
14. Work with GOTN to moot creation of a special tribunal for speedy disposal of properties under litigation
15. Make provisions for the debtors and take steps for writing off bad debts
GoTN/KuM
While Property tax is payable on a semi-annual basis, no interest /penal charges are levied on late payment.
16. Implement Payment Due Date along wi th a 90 day grace period during which payments would involve a nominal interest payment.
17. Payments beyond the grace period should include a steep penal charge to encourage payments on time.
GoTN/KuM
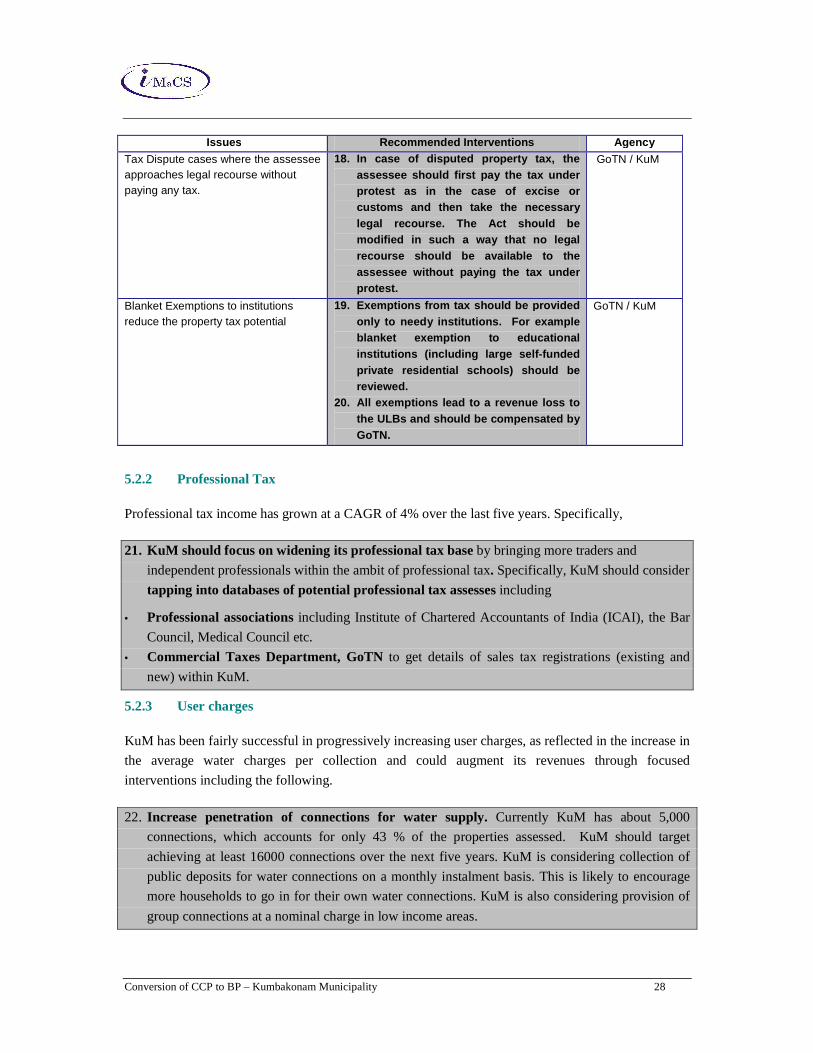
Conversion of CCP to BP – Kumbakonam Municipality 28
Issues Recommended Interventions Agency
Tax Dispute cases where the assessee approaches legal recourse without paying any tax.
18. In case of disputed property tax, the assessee should first pay the tax under protest as in the case of excise or customs and then take the necessary legal recourse. The Act should be modified in such a way that no legal recourse should be available to the assessee without paying the tax under protest.
GoTN / KuM
Blanket Exemptions to institutions reduce the property tax potential
19. Exemptions from tax should be provided only to needy institutions. For example blanket exemption to educational institutions (including large self-funded private residential schools) should be reviewed.
20. All exemptions lead to a revenue loss to the ULBs and should be compensated by GoTN.
GoTN / KuM
5.2.2 Professional Tax
Professional tax income has grown at a CAGR of 4% over the last five years. Specifically,
21. KuM should focus on widening its professional tax base by bringing more traders and
independent professionals within the ambit of professional tax. Specifically, KuM should consider tapping into databases of potential professional tax assesses including
• Professional associations including Institute of Chartered Accountants of India (ICAI), the Bar
Council, Medical Council etc.
• Commercial Taxes Department, GoTN to get details of sales tax registrations (existing and
new) within KuM.
5.2.3 User charges
KuM has been fairly successful in progressively increasing user charges, as reflected in the increase in
the average water charges per collection and could augment its revenues through focused
interventions including the following.
22. Increase penetration of connections for water supply. Currently KuM has about 5,000
connections, which accounts for only 43 % of the properties assessed. KuM should target
achieving at least 16000 connections over the next five years. KuM is considering collection of
public deposits for water connections on a monthly instalment basis. This is likely to encourage
more households to go in for their own water connections. KuM is also considering provision of
group connections at a nominal charge in low income areas.
Conversion of CCP to BP – Kumbakonam Municipality 29
23. Provide water fountains only in areas with a predominantly low-income population to minimise revenue loss.
24. Improve revenue per connection through implementation of either a graded water tariff scheme (as is being considered by CMA, GoTN) or a metering based tariff. While the
metering based system would a better system in principle (charges on the basis of usage) and in
terms of incentivising water conservation, ULBs have faced resistance in implementation of
metered tariffs.
25. Consider implementing user charges for door-to-door collection of Solid Waste.
26. Adopt measures to improve collection efficiency. Overall collection efficiency in water charges
is very low and needs to be improved. KuM should consider stiff penalties for non-payment of
user charges. Specifically KuM should consider implementation of late payment fines and in case
of extreme overdue situations, disconnecting supply.
5.2.4 Measures to improve collection efficiency
27. KuM’s collection efficiency is very low across all its revenue heads namely, property tax,
professional tax and user charges and needs significant improvement from current levels. KuM
should consider a) a focused one-time drive to clear up its dues and b) strengthening of its
collection process and organisation to ensure that the overall levels of efficiency in order to
improve and sustain its collection efficiencies.
5.3 Measures for cost management
5.3.1 Energy efficiency
KuM needs to take steps to address its power costs, which comprise nearly 60% of its operations and
maintenance costs. The following steps are needed in this direction:
28. KuM should conduct a comprehensive energy audit to identify areas for reducing power
consumption and related costs. KuM should implement automatic time based dimmers on street
light network and ensure that all pumps / motors are energy efficient.
29. GoTN should also consider a specific grant / capital subsidy scheme to incentivise energy conservation initiatives for not just KuM, but for all ULBs.
30. CMA, GoTN and TNUDF should develop and implement minimum standards related to
energy conservation including installation of energy efficient motors, right sized pumps etc.
Conversion of CCP to BP – Kumbakonam Municipality 30
5.4 Other measures / interventions
5.4.1 Accounting /Audit
While all ULBs in GoTN have implemented a double entry accounting system, most of the ULBs
including KuM require significant improvement in their accounting practices. Several ULBs have
redundant systems involving manual and computerised book keeping and errors often creep into MIS.
Often, the MIS in the form of DCB statements and information provided in accounting statements are
not reconciled.
31. CMA, GoTN should consider an outlay for technical assistance to ULBs to improve their accounting systems and practices and to provide adequate training to staff on the concepts of
double entry book keeping.
32. Property tax system has been computerised but the software for accounting developed seems to
have some errors. TNUDF should take steps to eliminate these teething problems in the
accounting software.
33. GoTN should issue an order for phasing out manual books like the property tax DCB registers as
the same data is being maintained both manually and also in computer database.
34. The LFA should also be given training in auditing through computer so that the manual books can
be avoided in future.
35. GoTN should insist and implement closing of accounts and audit of the same within a fixed time period subsequent to the completion of financial year. The government should continue to
provide for the payment of common accountants and computer assistant to work in the ULB
which it was providing till date. GoTN should also evaluate the option of employing a local CA
firm to give guidance and training to ULB staff on a regular basis. CMA,
36. TNUDF should consider a grading system to categorise ULBs on the basis of accounting and
reporting practices
Conversion of CCP to BP – Kumbakonam Municipality 31
6. Business plan and investment capacity
6.1 Financial and Operating Plan – time horizon and scenarios
The FOP has been prepared for a ten-year period i.e., FY 2006-2015 for 2 different scenarios as given
below:
• Scenario I - Base projections
• Scenario II – Projections with ‘potential improvements’
The basis and assumptions underlying income and expenditure projections for the FOP are detailed in
section 6.2
6.2 Basis and assumptions
6.2.1 Revenues
Property tax
Property tax projections have been arrived at as a product of average tax per assessment and the
number of properties assessed. Assumptions on these revenue drivers are given below:
• Scenario I –Base case
� Assessments growth – 4.74% per annum (in line with the CAGR over the last five years),
with a cap on the number of assessments at 32,000 properties. The base number of
assessments has been taken as 23699 properties.
� Average tax per property - Rs. 1815 per property assessed, in line with the average tax per
property collected in FY 2005.
� Arrears collection efficiency - 36 % for FY 2006 (maximum during FY 2001-05) in FY 2002
and assumed to increase by 2 % every year (38% in FY 2007 and so on)
� Current collection efficiency - 61 % for FY 2006 (maximum during FY 2001-05) in FY 2005
and assumed to increase by 2 % every year (63% in FY 2007 and so on)
• Scenario II – with improvements
� Assessments growth – 8% per annum, with a cap on the number of assessments at 32,000
properties.
� Average tax per property - Rs. 1815 per property assessed in FY 2006 with a one-time
upward revision of 25% in FY 2007
� Collection efficiency are kept at the same levels as Scenario I
Profession tax
Profession tax has been arrived at as a product of average tax per assessee and the number of
assessments. Assumptions on these revenue drivers are given below:
Conversion of CCP to BP – Kumbakonam Municipality 32
• Scenario I –Base case
� Assessments growth – 1 % per annum (assumed as the CAGR over the last five years is very
low), with a cap on the number of assessments at 10,000. The base number of assessments has
been taken as 3142 assessments.
� Average tax per assessment - Rs. 1264 per assessment, in line with the average in FY 2005.
No revision has been assumed for the base case.
� Arrears collection efficiency – 50% for FY 2006 (maximum during FY 2001-05) in FY 2003
and assumed to increase by 2 % every year (52% in FY 2007 and so on)
� Current collection efficiency –86 % for FY 2006 (maximum during FY 2001-05) in FY 2002
and assumed to increase by 1% every year (87% in FY 2007 and so on).
• Scenario II – with improvements
� Assessments growth – 5 % per annum (in line with the CAGR over the last five years), with a
cap on the number of assessments at 10,000
� Average tax per assessment - Rs. 1264 per assessment, in line with the average in FY 2005.
� Collection efficiency are kept at the same levels as Scenario I
Water Charges
Water charges have been arrived at as a product of average water charges per connection and the
number of connections.
• Scenario I –Base case
� The number of connections has been assumed to grow at 1.66% per annum, which is based on
the past trend in connections growth. The base connections has been taken as 10275.
� The average rate of water charges per connection has been worked as Rs.571 per connection
based on the data given by the ULB
� The base collection efficiency for arrears is assumed at 80% maximum collection efficiency
achieved by the ULB during the period 2001-05, with an increase of 1% every year.
� For current demand, collection efficiency is assumed at 62 % maximum collection efficiency
achieved by the ULB during the period 2001-05, with an increase of 2% every year.
• Scenario II – with improvements
� Under this scenario, connections are assumed to grow at 5% per annum.
� Average tariff per connection in FY 2006 is assumed at Rs. 571 per connection, with a tariff
increase of 5% every three years. Collection efficiency is at the same levels as Scenario I.
Other income
The assumptions made in case of other income is summarised in the table below:
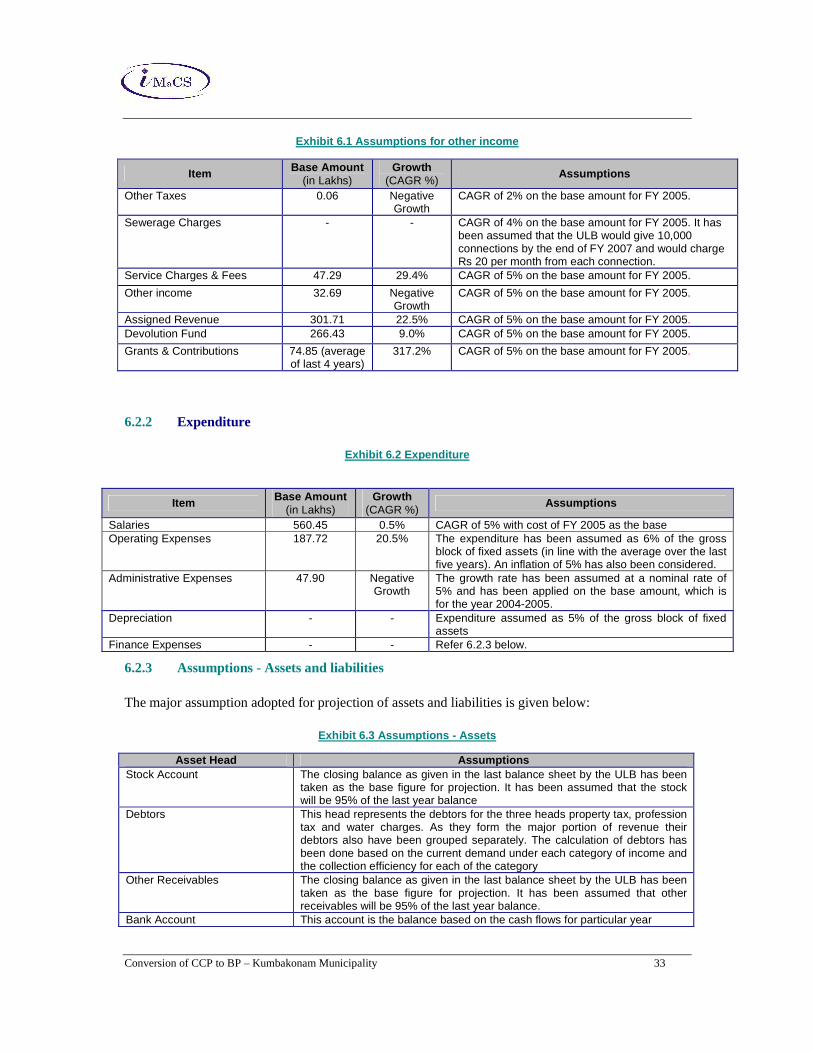
Conversion of CCP to BP – Kumbakonam Municipality 33
Exhibit 6.1 Assumptions for other income
Item Base Amount (in Lakhs)
Growth (CAGR %)
Assumptions
Other Taxes 0.06 Negative Growth
CAGR of 2% on the base amount for FY 2005.
Sewerage Charges - - CAGR of 4% on the base amount for FY 2005. It has been assumed that the ULB would give 10,000 connections by the end of FY 2007 and would charge Rs 20 per month from each connection.
Service Charges & Fees 47.29 29.4% CAGR of 5% on the base amount for FY 2005.
Other income 32.69 Negative Growth
CAGR of 5% on the base amount for FY 2005.
Assigned Revenue 301.71 22.5% CAGR of 5% on the base amount for FY 2005. Devolution Fund 266.43 9.0% CAGR of 5% on the base amount for FY 2005.
Grants & Contributions 74.85 (average of last 4 years)
317.2% CAGR of 5% on the base amount for FY 2005.
6.2.2 Expenditure
Exhibit 6.2 Expenditure
Item Base Amount (in Lakhs)
Growth (CAGR %)
Assumptions
Salaries 560.45 0.5% CAGR of 5% with cost of FY 2005 as the base Operating Expenses 187.72 20.5% The expenditure has been assumed as 6% of the gross
block of fixed assets (in line with the average over the last five years). An inflation of 5% has also been considered.
Administrative Expenses 47.90 Negative Growth
The growth rate has been assumed at a nominal rate of 5% and has been applied on the base amount, which is for the year 2004-2005.
Depreciation - - Expenditure assumed as 5% of the gross block of fixed assets
Finance Expenses - - Refer 6.2.3 below.
6.2.3 Assumptions - Assets and liabilities
The major assumption adopted for projection of assets and liabilities is given below:
Exhibit 6.3 Assumptions - Assets
Asset Head Assumptions Stock Account The closing balance as given in the last balance sheet by the ULB has been
taken as the base figure for projection. It has been assumed that the stock will be 95% of the last year balance
Debtors This head represents the debtors for the three heads property tax, profession tax and water charges. As they form the major portion of revenue their debtors also have been grouped separately. The calculation of debtors has been done based on the current demand under each category of income and the collection efficiency for each of the category
Other Receivables The closing balance as given in the last balance sheet by the ULB has been taken as the base figure for projection. It has been assumed that other receivables will be 95% of the last year balance.
Bank Account This account is the balance based on the cash flows for particular year
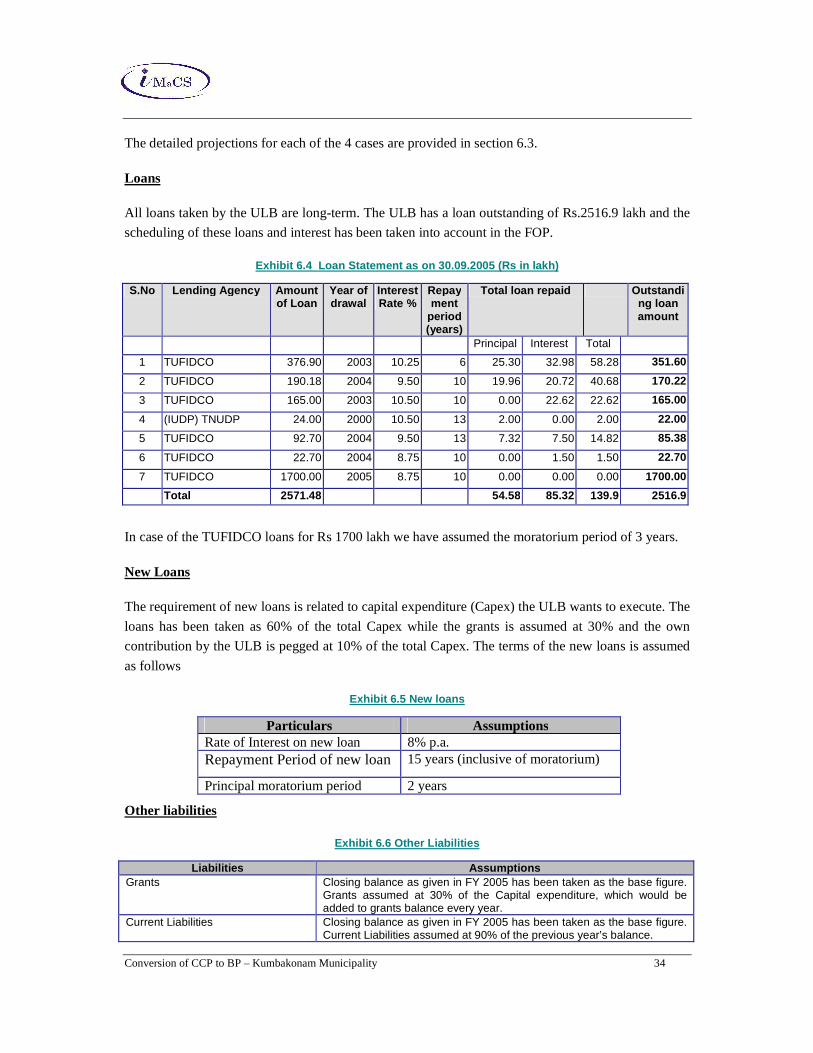
Conversion of CCP to BP – Kumbakonam Municipality 34
The detailed projections for each of the 4 cases are provided in section 6.3.
Loans
All loans taken by the ULB are long-term. The ULB has a loan outstanding of Rs.2516.9 lakh and the
scheduling of these loans and interest has been taken into account in the FOP.
Exhibit 6.4 Loan Statement as on 30.09.2005 (Rs in lakh)
S.No Lending Agency Amount of Loan
Year of drawal
Interest Rate %
Repayment
period (years)
Total loan repaid Outstanding loan amount
Principal Interest Total
1 TUFIDCO 376.90 2003 10.25 6 25.30 32.98 58.28 351.60
2 TUFIDCO 190.18 2004 9.50 10 19.96 20.72 40.68 170.22
3 TUFIDCO 165.00 2003 10.50 10 0.00 22.62 22.62 165.00
4 (IUDP) TNUDP 24.00 2000 10.50 13 2.00 0.00 2.00 22.00
5 TUFIDCO 92.70 2004 9.50 13 7.32 7.50 14.82 85.38
6 TUFIDCO 22.70 2004 8.75 10 0.00 1.50 1.50 22.70
7 TUFIDCO 1700.00 2005 8.75 10 0.00 0.00 0.00 1700.00
Total 2571.48 54.58 85.32 139.9 2516.9
In case of the TUFIDCO loans for Rs 1700 lakh we have assumed the moratorium period of 3 years.
New Loans
The requirement of new loans is related to capital expenditure (Capex) the ULB wants to execute. The
loans has been taken as 60% of the total Capex while the grants is assumed at 30% and the own
contribution by the ULB is pegged at 10% of the total Capex. The terms of the new loans is assumed
as follows
Exhibit 6.5 New loans
Particulars Assumptions Rate of Interest on new loan 8% p.a. Repayment Period of new loan 15 years (inclusive of moratorium)
Principal moratorium period 2 years
Other liabilities
Exhibit 6.6 Other Liabilities
Liabilities Assumptions Grants Closing balance as given in FY 2005 has been taken as the base figure.
Grants assumed at 30% of the Capital expenditure, which would be added to grants balance every year.
Current Liabilities Closing balance as given in FY 2005 has been taken as the base figure. Current Liabilities assumed at 90% of the previous year’s balance.
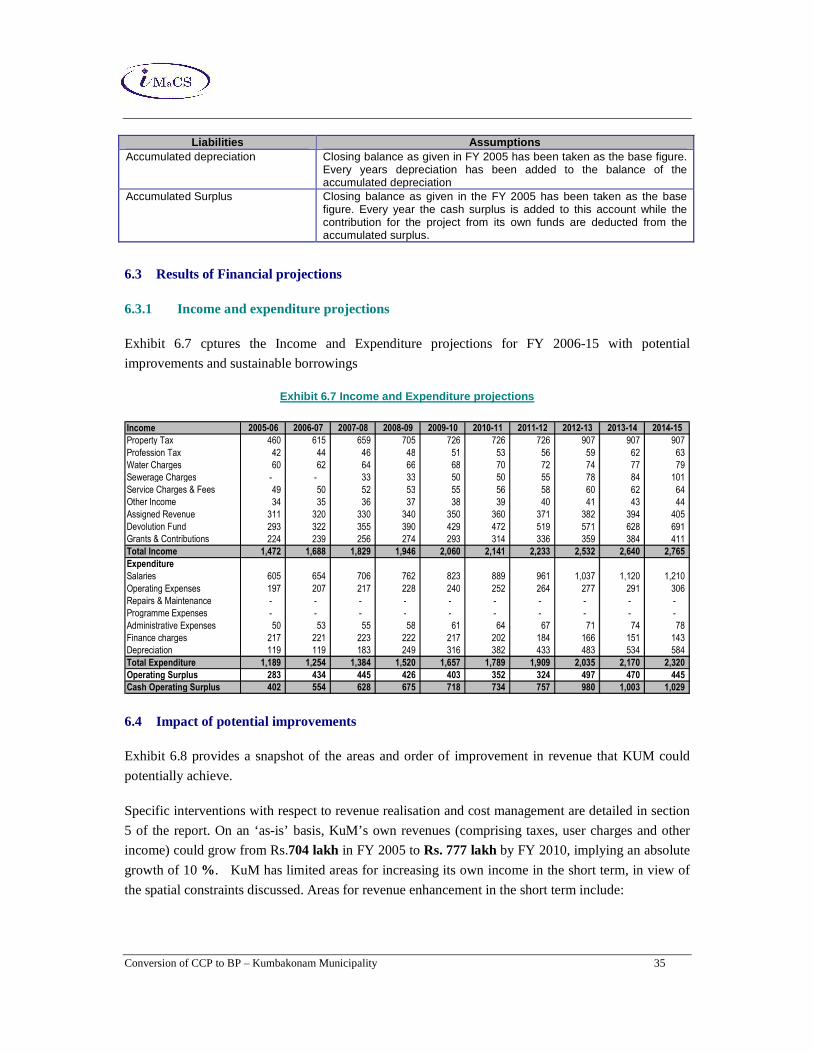
Conversion of CCP to BP – Kumbakonam Municipality 35
Liabilities Assumptions Accumulated depreciation Closing balance as given in FY 2005 has been taken as the base figure.
Every years depreciation has been added to the balance of the accumulated depreciation
Accumulated Surplus Closing balance as given in the FY 2005 has been taken as the base figure. Every year the cash surplus is added to this account while the contribution for the project from its own funds are deducted from the accumulated surplus.
6.3 Results of Financial projections
6.3.1 Income and expenditure projections
Exhibit 6.7 cptures the Income and Expenditure projections for FY 2006-15 with potential
improvements and sustainable borrowings
Exhibit 6.7 Income and Expenditure projections
Income 2005-06 2006-07 2007-08 2008-09 2009-10 2010-11 2011-12 2012-13 2013-14 2014-15
Property Tax 460 615 659 705 726 726 726 907 907 907
Profession Tax 42 44 46 48 51 53 56 59 62 63
Water Charges 60 62 64 66 68 70 72 74 77 79
Sewerage Charges - - 33 33 50 50 55 78 84 101
Service Charges & Fees 49 50 52 53 55 56 58 60 62 64
Other Income 34 35 36 37 38 39 40 41 43 44
Assigned Revenue 311 320 330 340 350 360 371 382 394 405
Devolution Fund 293 322 355 390 429 472 519 571 628 691
Grants & Contributions 224 239 256 274 293 314 336 359 384 411
Total Income 1,472 1,688 1,829 1,946 2,060 2,141 2,233 2,532 2,640 2,765
Expenditure
Salaries 605 654 706 762 823 889 961 1,037 1,120 1,210
Operating Expenses 197 207 217 228 240 252 264 277 291 306
Repairs & Maintenance - - - - - - - - - -
Programme Expenses - - - - - - - - - -
Administrative Expenses 50 53 55 58 61 64 67 71 74 78
Finance charges 217 221 223 222 217 202 184 166 151 143
Depreciation 119 119 183 249 316 382 433 483 534 584
Total Expenditure 1,189 1,254 1,384 1,520 1,657 1,789 1,909 2,035 2,170 2,320
Operating Surplus 283 434 445 426 403 352 324 497 470 445
Cash Operating Surplus 402 554 628 675 718 734 757 980 1,003 1,029
6.4 Impact of potential improvements
Exhibit 6.8 provides a snapshot of the areas and order of improvement in revenue that KUM could
potentially achieve.
Specific interventions with respect to revenue realisation and cost management are detailed in section
5 of the report. On an ‘as-is’ basis, KuM’s own revenues (comprising taxes, user charges and other
income) could grow from Rs.704 lakh in FY 2005 to Rs. 777 lakh by FY 2010, implying an absolute
growth of 10 % . KuM has limited areas for increasing its own income in the short term, in view of
the spatial constraints discussed. Areas for revenue enhancement in the short term include:
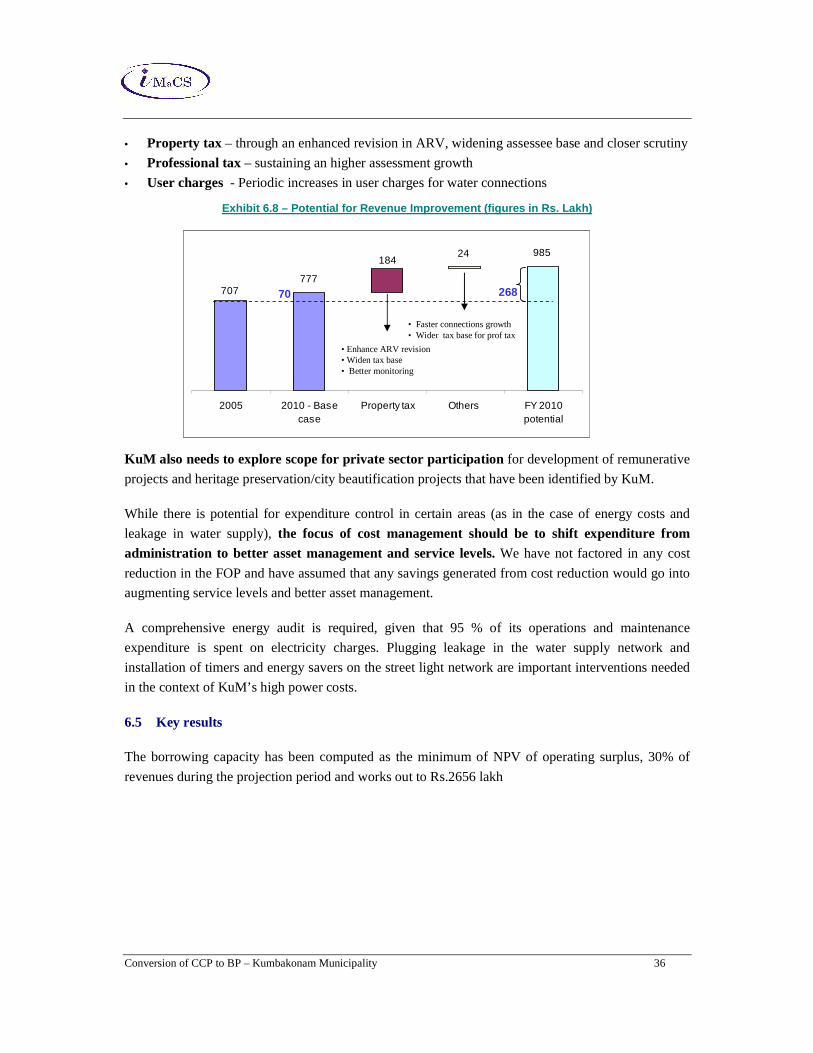
Conversion of CCP to BP – Kumbakonam Municipality 36
• Property tax – through an enhanced revision in ARV, widening assessee base and closer scrutiny
• Professional tax – sustaining an higher assessment growth
• User charges - Periodic increases in user charges for water connections
Exhibit 6.8 – Potential for Revenue Improvement (fi gures in Rs. Lakh)
KuM also needs to explore scope for private sector participation for development of remunerative
projects and heritage preservation/city beautification projects that have been identified by KuM.
While there is potential for expenditure control in certain areas (as in the case of energy costs and
leakage in water supply), the focus of cost management should be to shift expenditure from administration to better asset management and service levels. We have not factored in any cost
reduction in the FOP and have assumed that any savings generated from cost reduction would go into
augmenting service levels and better asset management.
A comprehensive energy audit is required, given that 95 % of its operations and maintenance
expenditure is spent on electricity charges. Plugging leakage in the water supply network and
installation of timers and energy savers on the street light network are important interventions needed
in the context of KuM’s high power costs.
6.5 Key results
The borrowing capacity has been computed as the minimum of NPV of operating surplus, 30% of
revenues during the projection period and works out to Rs.2656 lakh
707777
985 184
24
2005 2010 - Basecase
Property tax Others FY 2010potential
26870
• Enhance ARV revision• Widen tax base• Better monitoring
• Faster connections growth• Wider tax base for prof tax
707777
985 184
24
2005 2010 - Basecase
Property tax Others FY 2010potential
26870
• Enhance ARV revision• Widen tax base• Better monitoring
• Faster connections growth• Wider tax base for prof tax
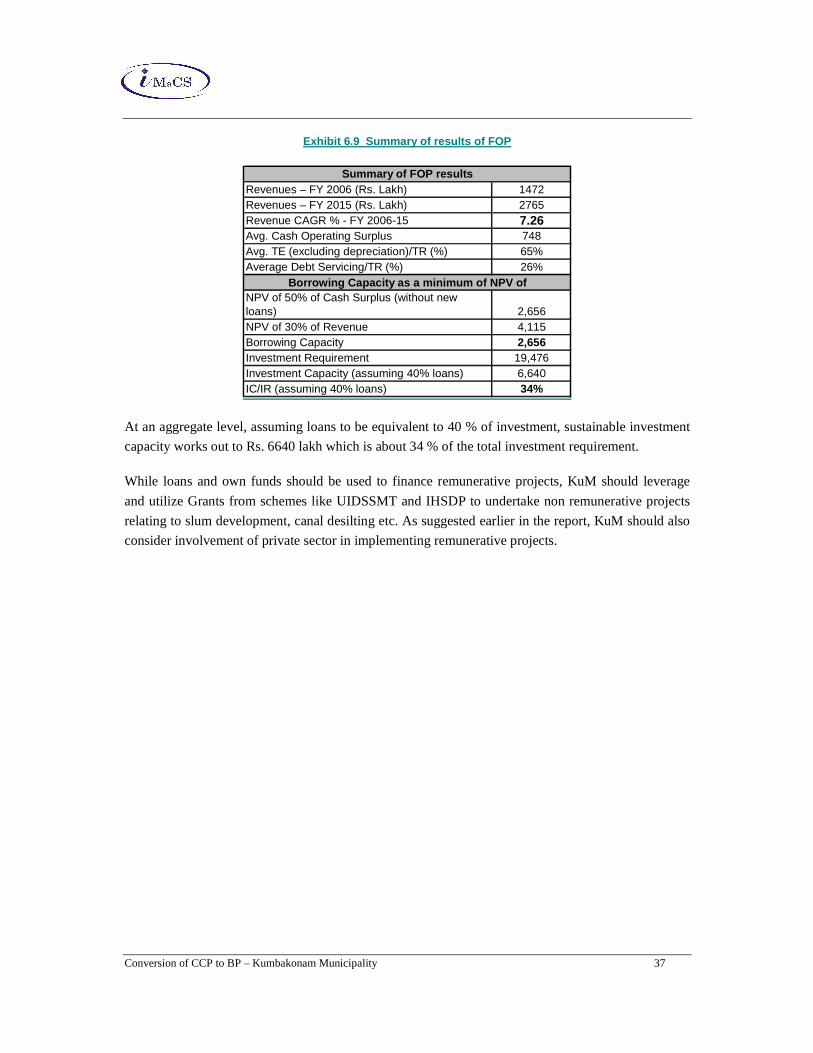
Conversion of CCP to BP – Kumbakonam Municipality 37
Exhibit 6.9 Summary of results of FOP
Revenues – FY 2006 (Rs. Lakh) 1472Revenues – FY 2015 (Rs. Lakh) 2765Revenue CAGR % - FY 2006-15 7.26Avg. Cash Operating Surplus 748Avg. TE (excluding depreciation)/TR (%) 65%Average Debt Servicing/TR (%) 26%
NPV of 50% of Cash Surplus (without new loans) 2,656 NPV of 30% of Revenue 4,115 Borrowing Capacity 2,656 Investment Requirement 19,476 Investment Capacity (assuming 40% loans) 6,640 IC/IR (assuming 40% loans) 34%
Summary of FOP results
Borrowing Capacity as a minimum of NPV of
At an aggregate level, assuming loans to be equivalent to 40 % of investment, sustainable investment
capacity works out to Rs. 6640 lakh which is about 34 % of the total investment requirement.
While loans and own funds should be used to finance remunerative projects, KuM should leverage
and utilize Grants from schemes like UIDSSMT and IHSDP to undertake non remunerative projects
relating to slum development, canal desilting etc. As suggested earlier in the report, KuM should also
consider involvement of private sector in implementing remunerative projects.
Conversion of CCP to BP – Kumbakonam Municipality
For information about this report, please contact: ICRA Management Consulting Services Ltd Building No. 8, 2nd Floor, Tower - A, DLF Cyber City, Phase - II, Gurgaon - 122002 Ph : 91 124 4545 800 Fax: 91 124 4545 850
Disclaimer: The report is based on information collected by IMaCS from sources believed to be
reliable. While all reasonable care has been taken to ensure that the information contained herein
is not untrue or misleading, IMaCS is not responsible for any losses that the client may incur
from the use of this report or its contents. The assessment is based on information that is currently available and is liable to change. The analysis that follows should not be construed to be a credit
rating assigned by ICRA’s Rating Division for any of the company’s debt instruments. IMaCS is
not a legal firm and our advice/recommendations should not be construed as legal advice on any
issue.