Talk and Action: What Individual Investors Say and … AND ACTION: WHAT INDIVIDUAL INVESTORS SAY AND...
45
Review of Finance (2005) 9: 437–481 © Springer 2005 Talk and Action: What Individual Investors Say and What They Do DANIEL DORN 1 and GUR HUBERMAN 2 1 LeBow College of Business, Drexel University; 2 Graduate School of Business, Columbia University Abstract. Combining survey responses and trading records of clients of a German retail broker, this paper examines some of the causes for the apparent failure to buy and hold a well-diversified portfolio. The subjective investor attributes gleaned from the survey help explain the variation in actual portfolio and trading choices. Self-reported risk aversion is the single most important determ- inant of both portfolio diversification and turnover; other things equal, investors who report being more risk tolerant hold less diversified portfolios and trade more aggressively. Less experienced investors similarly tend to churn poorly diversified portfolios. The effect of perceived knowledge on portfolio choice is less clear cut; holding other attributes constant, investors who think themselves knowledgeable about financial securities indeed hold better diversified portfolios, but those who think themselves more knowledgeable than the average investor churn their portfolios more. 1. Introduction Traditional finance theory recommends that individual investors simply buy and hold the market portfolio, or at least a well-diversified portfolio of stocks. The typical retail investor doesn’t; most of those who hold stocks directly hold just a handful of stocks rather than a diversified portfolio (see, e.g., Blume and Friend (1975) and the 1998 U.S. Survey of Consumer Finances (SCF)). Moreover, many retirement plan participants allocate a substantial fraction of their discretionary retirement funds to company stock (see Benartzi (2001), Huberman (2001), and Huberman and Sengmüller (2004)). Analyzing the common stock investments of clients at a US discount brokerage, Goetzmann and Kumar (2002) report that younger and lower-income clients hold less diversified portfolios and suggest a lack of investor sophistication as explanation for poorly diversified portfolios. The second part of the buy-and-hold suggestion is that individuals do not churn their portfolios which also appears to be rejected in the data. At the end of the 1990s, turnover on the New York Stock Exchange (NYSE) was well above 75% (NYSE (2001)). Although the NYSE is dominated by large institutional investors, We thank Carol Bertaut, Anne Dorn, Larry Glosten, Will Goetzmann, Charles Himmelberg, Wei Jiang, Alexander Ljungqvist, Theo Nijman, Paul Sengmüller, Ralph Walkling, Elke Weber, and participants at the 2003 European Finance Association meetings in Glasgow for their comments. DOI 10.1007/s10679-005-4997-z
-
Upload
nguyenkien -
Category
Documents
-
view
213 -
download
0
Transcript of Talk and Action: What Individual Investors Say and … AND ACTION: WHAT INDIVIDUAL INVESTORS SAY AND...
Review of Finance (2005) 9: 437–481 © Springer 2005
Talk and Action: What Individual Investors Say andWhat They Do �
DANIEL DORN1 and GUR HUBERMAN2
1LeBow College of Business, Drexel University; 2Graduate School of Business, ColumbiaUniversity
Abstract. Combining survey responses and trading records of clients of a German retail broker,this paper examines some of the causes for the apparent failure to buy and hold a well-diversifiedportfolio. The subjective investor attributes gleaned from the survey help explain the variation inactual portfolio and trading choices. Self-reported risk aversion is the single most important determ-inant of both portfolio diversification and turnover; other things equal, investors who report beingmore risk tolerant hold less diversified portfolios and trade more aggressively. Less experiencedinvestors similarly tend to churn poorly diversified portfolios. The effect of perceived knowledge onportfolio choice is less clear cut; holding other attributes constant, investors who think themselvesknowledgeable about financial securities indeed hold better diversified portfolios, but those who thinkthemselves more knowledgeable than the average investor churn their portfolios more.
1. Introduction
Traditional finance theory recommends that individual investors simply buy andhold the market portfolio, or at least a well-diversified portfolio of stocks. Thetypical retail investor doesn’t; most of those who hold stocks directly hold just ahandful of stocks rather than a diversified portfolio (see, e.g., Blume and Friend(1975) and the 1998 U.S. Survey of Consumer Finances (SCF)). Moreover, manyretirement plan participants allocate a substantial fraction of their discretionaryretirement funds to company stock (see Benartzi (2001), Huberman (2001), andHuberman and Sengmüller (2004)). Analyzing the common stock investments ofclients at a US discount brokerage, Goetzmann and Kumar (2002) report thatyounger and lower-income clients hold less diversified portfolios and suggest alack of investor sophistication as explanation for poorly diversified portfolios.
The second part of the buy-and-hold suggestion is that individuals do not churntheir portfolios which also appears to be rejected in the data. At the end of the1990s, turnover on the New York Stock Exchange (NYSE) was well above 75%(NYSE (2001)). Although the NYSE is dominated by large institutional investors,
� We thank Carol Bertaut, Anne Dorn, Larry Glosten, Will Goetzmann, Charles Himmelberg,Wei Jiang, Alexander Ljungqvist, Theo Nijman, Paul Sengmüller, Ralph Walkling, Elke Weber, andparticipants at the 2003 European Finance Association meetings in Glasgow for their comments.
DOI 10.1007/s10679-005-4997-z

438 DANIEL DORN AND GUR HUBERMAN
many of the institutions invest on behalf of individuals; most of the turnover inNasdaq 100 stocks during 2000 and 2001 can be attributed to individual investors(Griffin et al. (2003)).1 Using trading records for a sample of U.S. discount broker-age clients, Barber and Odean (2000) report that the frequent traders performabout as well as other investors ignoring trading costs, but do considerably worsewhen trading costs are taken into account. This is hard to explain with conven-tional motives for trading such as savings or risk sharing; Odean (1998) suggestsoverconfidence as an explanation.
This paper is one of the first to confront investors’ actual portfolio and tradingchoices with their stated attitudes toward investing in order to shed light on theapparent failure to buy and hold a well-diversified portfolio. Survey responses,available for a sample of German discount brokerage clients, reveal objective in-vestor attributes such as age, gender, and income as well as subjective attributessuch as perceived knowledge, self-reported risk attitude, and the perceived controlover investments. The existing empirical literature on investor behavior focuseson objective attributes as proxies for psychological traits – gender as a proxy foroverconfidence, for example (see, e.g., Barber and Odean (2001)). This paper de-parts from the prior literature by using stated perceptions and self-assessments todevelop measures for unobservable psychological attributes.
Unobservable psychological attributes, such as risk aversion and overconfid-ence, are central to the traditional theory of investor behavior as well as to thebehavioral approach. Variation in the behavior of investors is often associated withvariation in the levels of the attributes across investors, and therefore an empiricalexamination of these models calls for the elicitation and estimation of these attrib-utes. Such elicitation and estimation is done with questionnaires or experimentsin which individuals are asked to answer a series of questions or perform certaintasks. The presumption is that an individual’s responses proxy the individual’s levelof the attribute.
The use of questionnaire- or experiment-based proxies poses two problems.First, in the presence of multiple proposed proxies for the same attribute, it isoften the case that individuals’ responses are domain-specific and poorly correl-ated across the proxies. (For measures of risk aversion, see, e.g., the brief reviewin Weber et al. (2002). For measures of overconfidence, see Glaser and Weber(2004).) This lack of consistency counsels caution in the interpretation of suchproxies. The second problem is that studies based on such proxies are difficult toextend to other populations because one would have to estimate those proxies in anew study. Moreover, the proxy may lose its validity for another population.
1 Contrary to the lack of diversification, however, portfolio churning is concentrated among relat-ively few individuals; according to survey evidence, nine out of ten retail investors report followinga buy-and-hold investment strategy and a similar fraction reports trading less than once a month (ICIand SIA (1999) and the 1998 SCF); Samuelson and Zeckhauser (1988) and Agnew et al. (2003)report little portfolio turnover in retirement accounts.

TALK AND ACTION: WHAT INDIVIDUAL INVESTORS SAY AND WHAT THEY DO 439
An alternative to using questionnaire- or experiment-based proxies is to useobservables such as gender, age, and location. Their advantage is that they aremeasured accurately, and can easily be observed for people who were not part ofthe studied population. The difficulty is in the interpretation of these observablesin the context of current models of investor behavior because they do not appearexplicitly in the models. Combining information of both types will help in theempirical examination of investor behavior.
In this study, we find that the inclusion of subjective investor attributes offersseveral insights into investor behavior. Our main result is that the investor’s riskattitude, elicited on an ordinal four-point scale similar to that of the US Survey ofConsumer Finances, is the most successful variable in explaining cross-sectionalvariation in both portfolio diversification and turnover. The average annual portfo-lio volatility among the least risk-averse investors between January 1995 and May2000 is 45% versus 28% for the most risk-averse investors; on average, portfoliosof risk-averse investors contain twice as many positions as those of risk-tolerantinvestors. The average monthly portfolio turnover of a respondent in the leastrisk-averse category is more than 30%; by contrast, average turnover in the mostrisk-averse category is less than 10%. Moreover, including self-reported risk aver-sion as an explanatory variable in a regression of portfolio turnover on objectiveinvestor attributes renders previously documented age and gender effects much lesssignificant (see Barber and Odean (2001)).
The evidence that investor sophistication is associated with better portfoliochoices is mixed. Investors who report being wealthier hold better diversified port-folios and churn their portfolios less (see, e.g., Goetzmann and Kumar (2002),Vissing-Jørgensen (2003), and Zhu (2002)). Those who have been investing longeralso make better portfolio choices. The effect of perceived knowledge, however,is less clear-cut. Those who perceive themselves as knowledgeable about financialsecurities indeed hold better diversified portfolios (see Graham et al. (2004)), butthose who perceive themselves as better informed about financial securities thanthe average investor churn their portfolios. Such self-professed relative knowledgecould be interpreted as a proxy for overconfidence as the sample investors areunlikely to be better informed than the professional investors they are trading with.
Otherwise, support for the hypothesis that overconfidence causes trading – el-egantly stated by Odean (1998) – is weak. Survey responses allow us to constructproxies of attributes that have been previously identified as drivers of overconfid-ence such as an investor’s perceived control over his investments or his tendencyto attribute gains to his skill and losses to bad luck (see Daniel et al. (1998) andGervais and Odean (2001)). These measures fail to explain much difference inportfolio diversification and turnover.
Other studies that examine the relation between questionnaire-based proxies foroverconfidence and investor behavior in an experiment or actual investor behaviorreport mixed results. Whereas Biais et al. (2004) and Glaser and Weber (2004)report no relation between an investor’s tendency to overestimate the precision of

440 DANIEL DORN AND GUR HUBERMAN
his knowledge and his trading activity, Deaves et al. (2003) do. Glaser and Weber(2004) propose six other proxies for overconfidence and report that none of themhelps explain variation in portfolio turnover unless the most aggressive traders areexcluded from the analysis.
Although recent papers increasingly rely on surveys to elicit investor attributes(see, e.g., Glaser and Weber (2004), Graham et al. (2004), Guiso et al. (2005),and Vissing-Jørgensen (2003)), the use of surveys raises issues such as inaccur-ate responses (see, e.g., Campbell (2003)), misunderstood questions (see Bertrandand Mullainathan (2001)), and non-responses biases, in addition to the attributeobservability issues mentioned above.
While we cannot independently check the accuracy of, say, self-reported wealth,we find that more than nine out of ten respondents report allocations among twelvedifferent asset classes that sum up to exactly 100%. The self-perception of investorsrevealed by their survey responses is also fairly accurate. For example, investorswho report to be more knowledgeable about financial securities do better on a quizwhich tests such knowledge. Investors who report to be more risk tolerant alsoreport holding a considerably greater fraction of their wealth in risky assets suchas equities and options as opposed to safe assets such as CDs or money marketaccounts (see also Kapteyn and Teppa (2002) who report that subjective measuresof risk aversion help explain variation in self-reported risk postures).
As only a fraction of those invited to participate in the survey choose to do so,a selection bias might affect our results. To control for this potential bias, we usethe investor attributes contained in the brokerage records, which are available forall investors whether they choose to participate in they survey or not, to estimateHeckman two-stage selection models corresponding to our main regressions. Theresults are little changed.
The remainder of the paper proceeds as follows: Next is a description of thetransaction records and the survey data. Section 3 summarizes demographic, socio-economic, and subjective attributes of the survey respondents. Section 4 comparesself-reported behavior with actual behavior by relating attributes and attitudes ofthe sample investors to their actual behavior inferred from the trading records.Section 5 concludes.
2. Data
The analysis in this paper draws on transaction records and questionnaire dataobtained for a sample of clients at one of Germany’s three largest online brokers.“Online” refers to the broker’s ability to process online orders; customers can alsoplace their orders by telephone, fax, or in writing. The broker could be labelled asa “discount” broker because no investment advice is given. Because of their lowfees and breadth of their product offering, German online brokers attract a largecross-section of clients ranging from day-traders to retirement savers (during thesample period, the selection of mutual funds offered by online brokers is much

TALK AND ACTION: WHAT INDIVIDUAL INVESTORS SAY AND WHAT THEY DO 441
greater than that offered by full-service brokers – typically divisions of the largeGerman universal banks that are constrained to sell the products of the banks’ assetmanagement divisions). In June 2000, at the end of our sample period, there werealmost 1.5 million retail accounts at the five largest German discount brokers (seeVan Steenis and Ossig (2000)) – a sizable number, given that the total numberof German investors with exposure to individual stocks at the end of 2000 wasestimated to be 6.2 million (see Deutsches Aktieninstitut (2003)). Note that allGerman retail and discount brokerage accounts are taxable accounts as opposed tothe US, where tax-deferred accounts, often with a restricted investment menu suchas 401(k) accounts, play an important role.
2.1. BROKERAGE RECORDS
The opening position as well as complete transaction records from the accountopening date (as early as January 1, 1995) until May 31, 2000 or the accountclosing date – whichever comes first – are available for all 21,500 prospective parti-cipants in the survey, regardless of whether they choose to participate in the surveyor not. With these transaction records, client portfolios can be unambiguously re-constructed at a daily frequency. The typical record consists of an identificationnumber, account number, transaction date, buy/sell indicator, type of asset traded,security identification code, number of shares traded, gross transaction value, andtransaction fees. In principle, brokerage clients can trade all the bonds, stocks, andoptions listed on German exchanges, as well as all the mutual funds registeredin Germany. Here, the focus is on the investors’ individual stock and mutual fundholdings and trades for which Datastream provides comprehensive daily asset pricecoverage: stocks on Datastream’s German research stocks list, dead or delistedstocks on Datastream’s dead stocks list for Germany (this includes foreign stocks),and mutual funds registered either in Germany or in Luxembourg. As of May2000, the lists contain daily prices for 8,213 domestic and foreign stocks and 4,845mutual funds. These stocks and mutual funds represent over 90% of the clients’holdings and 80% of the trading volume, with the remainder split between bonds,options, and unidentified stocks and mutual funds.2
Stocks are classified as domestic or foreign primarily by the first two digits ofthe stock’s International Security Identification Number (ISIN), which identify thecountry in which the company is registered. This initial classification is manuallychecked against a data base of company data maintained by WM Datenservice, theorganization that officially assigns ISINs to companies registering on German stockexchanges. Mutual funds can be classified into domestic or foreign funds becausethe broker maintains a list of all the mutual funds offered, classifying them by assetclass and geographic focus or investment topic.
2 The value of the bonds, options, and unidentified stocks and mutual funds held and traded canbe estimated from the transaction records.

442 DANIEL DORN AND GUR HUBERMAN
Upon opening an account, brokerage clients also provide their contact inform-ation from which their zip code and gender can be inferred; most account holdersalso supply their birth date. To calculate the distance between the investor and theGerman companies in which he holds stock, we collect the zip codes of companyheadquarters for over 1,200 German companies from WM Datenservice. The zipcodes of investors and firms are translated into geographic longitude and latitudeby matching them against a list of zip codes and the corresponding geographiccoordinates for 6,900 German municipalities.3
2.2. SURVEY SAMPLING AND SELECTION
In July 2000, the broker mailed a paper questionnaire to a stratified random sampleof 2,300 clients who had opened their account after January 1, 1995, and a randomsample of 120 former clients who had closed their account sometime between Janu-ary 1995 and May 2000. The sample of active clients was stratified based on thenumber of transactions and the average portfolio size during 1999 – the most recentperiod for which data were available – to ensure a balanced sample of invited parti-cipants that corresponded to the brokerage population. At the same time, an onlineversion of the questionnaire was made available to a random sample of 19,000clients for whom an email address was on file at the time. The questionnaire elicitedinformation on the investors’ investment objectives, risk attitudes and perceptions,investment experience and knowledge, portfolio structure, and demographic andsocio-economic status; the time to fill out the questionnaire was estimated to be 20–25 minutes (see Appendix A for details). The goal of the survey – stated on its firstpage – was to “improve our [the broker’s] products to better meet your [the clients’]demands”; brokerage clients who responded to the questionnaire could enroll in araffle to win Deutsche Mark (DEM) 6,000 (about 3,500 US dollars (USD) at theaverage DEM/USD rate of 1.73 during the sample period) or a weekend for two inNew York City. By the end of August 2000, the firm had collected 577 responsesto the paper survey and 768 responses to the online survey.
Table I contrasts account and investor characteristics of respondents and non-respondents. Average account statistics across the two groups are quite similar.Portfolios are worth around DEM 130,000, on average, slightly less than half ofthe portfolio is invested in domestic stocks either held directly or through mu-tual funds, the ratio of the distance between account holder and account assetsto distance between account holder and the market portfolio of stocks is 92%(meaning that the investor’s actual portfolio is 8% closer to his home than themarket portfolio of German stocks (see Coval and Moskowitz (1999))), averageprior monthly returns are 2%, and portfolio volatility, measured as the annualizedstandard deviation of daily portfolio returns, is 35%. In particular, respondentsand non-respondents exhibit similar trading intensities; average monthly portfolioturnover – measured as average monthly purchases and sales divided by twice the
3 This list can be downloaded from http://www.astrologix.de/download/, last viewed 3/26/02.

TALK AND ACTION: WHAT INDIVIDUAL INVESTORS SAY AND WHAT THEY DO 443
Tabl
eI.
Cha
ract
eris
tics
ofsu
rvey
resp
onde
nts
and
non-
resp
onde
nts
Port
folio
char
acte
rist
ics
are
calc
ulat
edfr
omth
eco
mpl
ete
daily
tran
sact
ion
hist
ory
avai
labl
efo
rea
chcl
ient
–w
heth
erhe
choo
ses
orre
fuse
sto
resp
ond
–fr
omth
eda
yw
hen
the
acco
unt
was
open
edun
tilM
ay31
,20
00or
the
day
whe
nth
eac
coun
tw
ascl
osed
,w
hich
ever
com
esfir
st.
Ave
rage
mon
thly
turn
over
isde
fined
asth
eab
solu
tesu
mof
purc
hase
san
dsa
les
ofst
ocks
and
mut
ual
fund
sdi
vide
dby
the
num
ber
ofm
onth
sth
eac
coun
tha
sbe
enac
tive
times
the
aver
age
port
folio
valu
eof
stoc
ksan
dm
utua
lfu
nds
(por
tfol
iova
lues
are
calc
ulat
edat
the
end
ofev
ery
mon
thth
eac
coun
tha
sbe
enop
en).
Toes
timat
epo
rtfo
liovo
latil
ity,
we
assu
me
that
the
clie
nts
will
hold
thei
rm
onth
-end
posi
tions
for
one
mon
than
dca
lcul
ate
ava
lue-
wei
ghte
dpo
rtfo
liore
turn
for
the
follo
win
gm
onth
;the
aver
age
mon
thly
port
folio
retu
rnis
the
geom
etri
cav
erag
eof
thes
em
onth
lyre
turn
s.A
nnua
lized
port
folio
vola
tility
isth
est
anda
rdde
viat
ion
ofth
elo
gari
thm
ofm
onth
lyre
turn
sm
ultip
lied
by√ 12
.The
Her
finda
hl-H
irsc
hman
nIn
dex,
valu
e,ho
me
bias
,an
dlo
cal
bias
ofth
epo
rtfo
lioar
eca
lcul
ated
asof
5/31
/200
0(o
ras
aver
ages
acro
ssac
tive
acco
unt
mon
ths
for
clie
nts
who
clos
eth
eir
acco
unts
befo
re5/
31/2
000)
–se
eal
soFi
gure
1fo
ra
defin
ition
ofth
epo
rtfo
lioat
trib
utes
.Por
tfol
iova
lue
isre
port
edin
Deu
tsch
eM
ark
[DE
M];
duri
ngth
esa
mpl
epe
riod
,one
US
Dol
lar
[USD
]co
rres
pond
sto
roug
hly
DE
M1.
7.“F
ract
ion
ofdo
mes
ticas
sets
”re
fers
toth
eD
EM
valu
eof
Ger
man
stoc
ksan
dm
utua
lfu
nds
inve
stin
gin
Ger
man
asse
tsas
afr
actio
nof
the
DE
Mva
lue
ofal
lst
ocks
and
mut
ual
fund
she
ldby
the
clie
nt.T
helo
cal
bias
ofa
port
folio
isde
fined
ason
em
inus
the
ratio
ofth
edi
stan
cebe
twee
nth
ein
vest
oran
dhi
spo
rtfo
liodi
vide
dby
the
dist
ance
betw
een
the
inve
stor
and
the
mar
ketp
ortf
olio
.All
inve
stor
char
acte
rist
ics
are
glea
ned
from
info
rmat
ion
reco
rded
byth
ebr
oker
upon
acco
unto
peni
ng(a
ndac
coun
tclo
sing
).T
hege
nder
ofth
eac
coun
tho
lder
isin
ferr
edfr
omth
esa
luta
tion
whi
chis
part
ofth
ead
dres
sto
whi
chac
coun
tin
form
atio
nis
sent
(e.g
.,if
the
acco
unt
isjo
intly
owne
dby
aco
uple
but
the
acco
unt
corr
espo
nden
ceis
addr
esse
dto
the
fem
ale
part
ner,
the
acco
unt
hold
erw
ould
beid
entifi
edas
fem
ale)
.A
geis
supp
lied
volu
ntar
ilyup
onac
coun
top
enin
g.T
he“d
ista
nce
tobr
oker
”is
calc
ulat
edba
sed
onth
edi
stan
cebe
twee
nth
ezi
pco
des
ofin
vest
oran
dbr
oker
;th
edi
stan
ceis
mis
sing
ifth
eac
coun
tho
lder
lives
outs
ide
ofG
erm
any.
Ifth
ere
isa
stat
istic
ally
sign
ifica
ntdi
ffer
ence
betw
een
attr
ibut
em
eans
,pro
port
ions
,or
med
ians
repo
rted
for
the
two
sam
ples
,it
isno
ted
byas
teri
sks
inth
em
ean
and
med
ian
colu
mns
ofth
eno
n-re
spon
dent
sam
ple.
The
mea
nco
mpa
riso
nte
sts
allo
wfo
rdi
ffer
ent
vari
ance
sw
ithin
the
two
grou
ps;
***/
**/*
indi
cate
that
the
mea
ns,
prop
ortio
ns,
orm
edia
nsar
esi
gnifi
cant
lydi
ffer
enta
tthe
1%/5
%/1
0%le
vel.
Num
ber
ofob
serv
atio
ns1,
345
Res
pond
ents
20,1
83N
on-r
espo
nden
ts
Por
tfol
ioch
arac
teri
stic
sU
nits
Nob
sM
ean
Std
Med
ian
Nob
sM
ean
Std
Med
ian
Ave
rage
mon
thly
port
foli
otu
rnov
er1,
343
17%
34%
9%20
,093
16%
63%
8%
Ann
ualiz
edpo
rtfo
liovo
latil
ity1,
341
35%
17%
30%
20,0
6335
%18
%30
%
Mon
thly
port
foli
ore
turn
1,34
22.
0%2.
6%1.
8%20
,110
1.9%
3.9%
1.7%
Her
find
ahl-
Hir
schm
ann
Inde
x1,
343
20%
24%
11%
20,1
1325
%**
*29
%14
%
Por
tfol
iova
lue
DE
M’0
00s
1,34
513
023
755
20,1
8313
437
247
Fra
ctio
nof
dom
esti
cas
sets
1,34
346
%33
%44
%20
,113
46%
35%
42%
Loc
albi
asof
port
foli
o1,
271
8.0%
32.3
%4.
9%18
,672
7.7%
34.1
%4.
3%

444 DANIEL DORN AND GUR HUBERMAN
Tabl
eI.
Cha
ract
eris
tics
ofsu
rvey
resp
onde
nts
and
non-
resp
onde
nts
(con
tinu
ed)
Num
ber
ofob
serv
atio
ns1,
345
Res
pond
ents
20,1
83N
on-r
espo
nden
ts
Inve
stor
char
acte
rist
ics
Uni
tsN
obs
Mea
nS
tdM
edia
nN
obs
Mea
nS
tdM
edia
n
Fra
ctio
nm
ale
1,34
288
%19
,708
83%
***
Age
ofac
coun
thol
der
year
s1,
022
38.9
11.1
36.3
15,5
0839
.7**
12.9
37.5
Acc
ount
tenu
reye
ars
1,34
53.
31.
32.
920
,183
3.2*
*1.
32.
9
Fra
ctio
nof
form
ercu
stom
ers
1,34
51%
20,1
831%
Dis
tanc
eto
brok
erkm
1,31
330
319
031
419
,676
311
192
305

TALK AND ACTION: WHAT INDIVIDUAL INVESTORS SAY AND WHAT THEY DO 445
Figure 1. Definition of variables constructed from brokerage records.
average portfolio value (all averages are calculated between account opening andMay 31, 2000 or account closing, whichever comes first) – is 17% for respondentsand 16% for non-respondents. The one difference is that survey respondents holdless concentrated portfolios. The average Herfindahl-Hirschmann Index (HHI),the sum of squared portfolio weights, of a respondent’s portfolio is 20%, whichcorresponds to an equally weighted portfolio of five stocks; the average HHI ofa non-respondent’s portfolio is 25%, which corresponds to an equally weightedportfolio of four stocks. Respondents are more predominantly male, ten monthsyounger, and have been clients for about one month longer, on average.
3. Self-Reported Investor Attributes
This section summarizes the sample of survey respondents along different char-acteristics that will be used to explain cross-sectional variation in actual investorbehavior. The characterization allows us to contrast the sample with the greaterpopulation of German households and household investors. Moreover, we assessthe quality and internal consistency of self-reported attitudes.
3.1. OBJECTIVE ATTRIBUTES
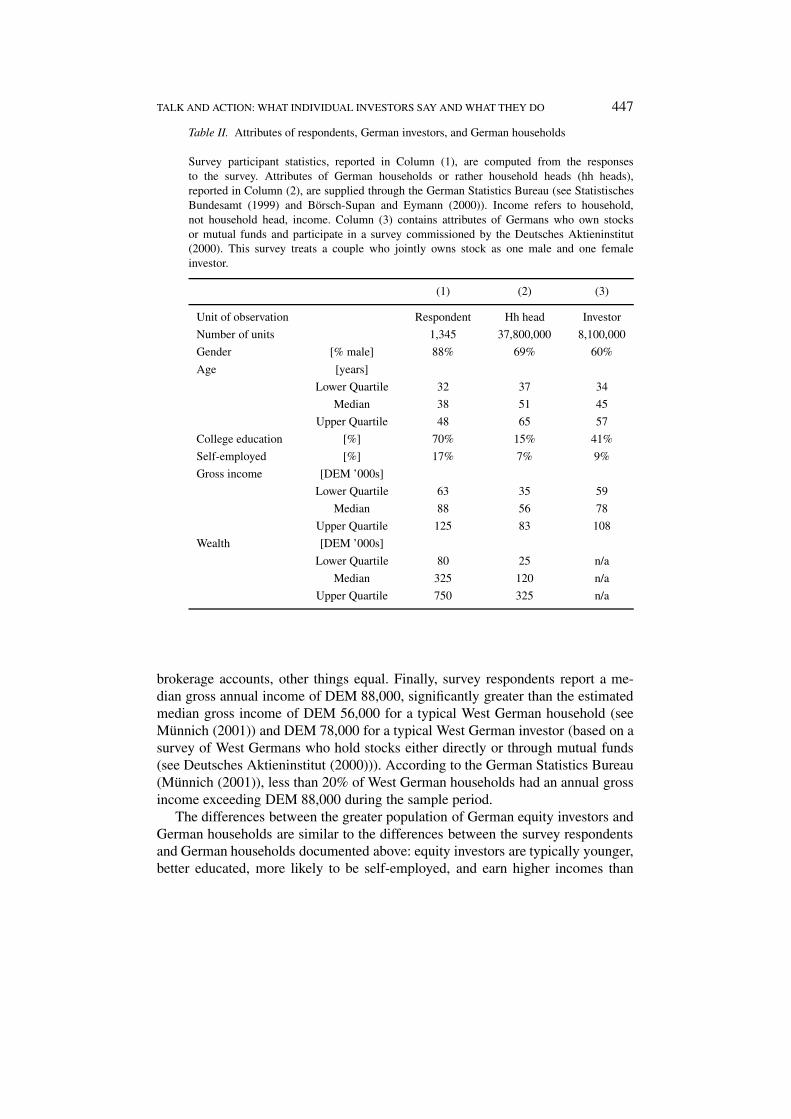
The sample of brokerage clients differs substantially from the broader populationof German households along demographic and socio-economic dimensions. TableII provides the details. Almost nine out of ten respondents are male, far exceeding
446 DANIEL DORN AND GUR HUBERMAN
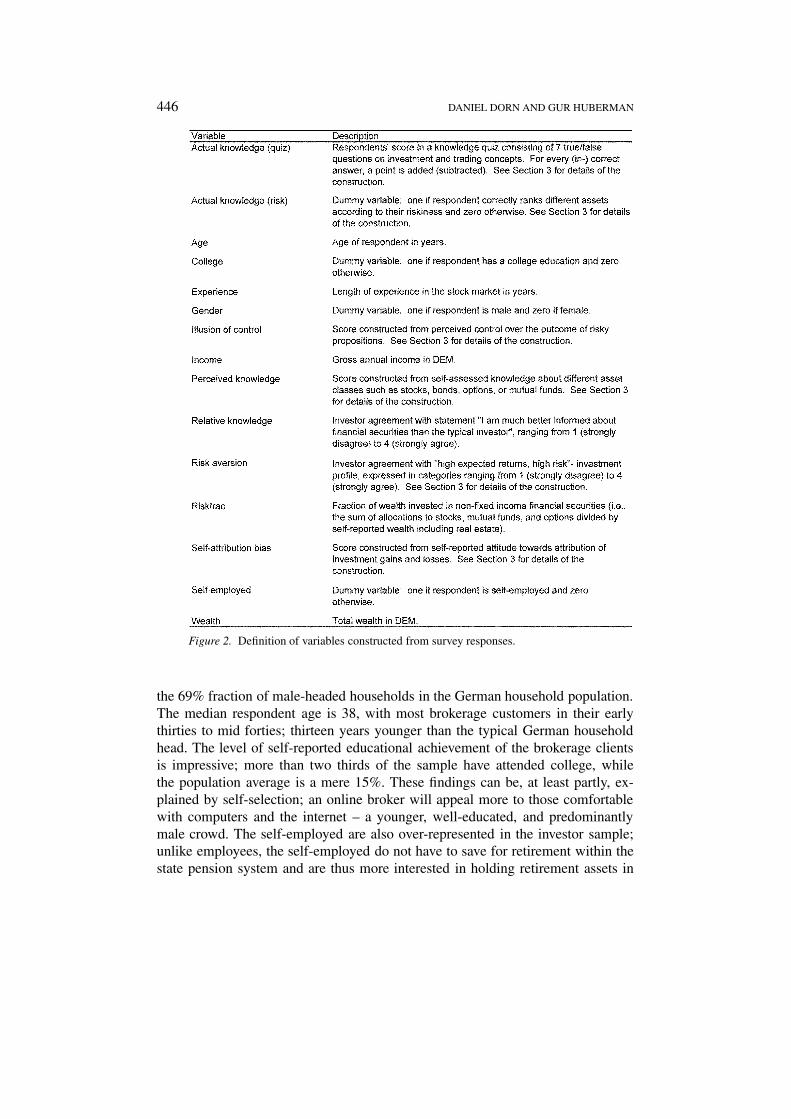
Figure 2. Definition of variables constructed from survey responses.
the 69% fraction of male-headed households in the German household population.The median respondent age is 38, with most brokerage customers in their earlythirties to mid forties; thirteen years younger than the typical German householdhead. The level of self-reported educational achievement of the brokerage clientsis impressive; more than two thirds of the sample have attended college, whilethe population average is a mere 15%. These findings can be, at least partly, ex-plained by self-selection; an online broker will appeal more to those comfortablewith computers and the internet – a younger, well-educated, and predominantlymale crowd. The self-employed are also over-represented in the investor sample;unlike employees, the self-employed do not have to save for retirement within thestate pension system and are thus more interested in holding retirement assets in
TALK AND ACTION: WHAT INDIVIDUAL INVESTORS SAY AND WHAT THEY DO 447
Table II. Attributes of respondents, German investors, and German households
Survey participant statistics, reported in Column (1), are computed from the responsesto the survey. Attributes of German households or rather household heads (hh heads),reported in Column (2), are supplied through the German Statistics Bureau (see StatistischesBundesamt (1999) and Börsch-Supan and Eymann (2000)). Income refers to household,not household head, income. Column (3) contains attributes of Germans who own stocksor mutual funds and participate in a survey commissioned by the Deutsches Aktieninstitut(2000). This survey treats a couple who jointly owns stock as one male and one femaleinvestor.
(1) (2) (3)
Unit of observation Respondent Hh head Investor
Number of units 1,345 37,800,000 8,100,000
Gender [% male] 88% 69% 60%
Age [years]
Lower Quartile 32 37 34
Median 38 51 45
Upper Quartile 48 65 57
College education [%] 70% 15% 41%
Self-employed [%] 17% 7% 9%
Gross income [DEM ’000s]
Lower Quartile 63 35 59
Median 88 56 78
Upper Quartile 125 83 108
Wealth [DEM ’000s]
Lower Quartile 80 25 n/a
Median 325 120 n/a
Upper Quartile 750 325 n/a
brokerage accounts, other things equal. Finally, survey respondents report a me-dian gross annual income of DEM 88,000, significantly greater than the estimatedmedian gross income of DEM 56,000 for a typical West German household (seeMünnich (2001)) and DEM 78,000 for a typical West German investor (based on asurvey of West Germans who hold stocks either directly or through mutual funds(see Deutsches Aktieninstitut (2000))). According to the German Statistics Bureau(Münnich (2001)), less than 20% of West German households had an annual grossincome exceeding DEM 88,000 during the sample period.
The differences between the greater population of German equity investors andGerman households are similar to the differences between the survey respondentsand German households documented above: equity investors are typically younger,better educated, more likely to be self-employed, and earn higher incomes than
448 DANIEL DORN AND GUR HUBERMAN
household heads without exposure to the stock market. Especially the differences ineducation and income between stock market participants and non-participants areconsistent with Haliassos and Bertaut (1995) and Vissing-Jørgensen (2002) whoreport that informational barriers as well as lower and more volatile non-financialincome help explain limited stock market participation.
In addition to gross income, the survey respondents report their wealth as wellas their overall asset allocation across financial and real estate categories (see Ap-pendix E). The internal consistency of the answers is remarkable; although thereare twelve asset categories and the allocation question is towards the end of alengthy questionnaire, nine out of ten respondents report allocations that sum toexactly 100% (on average, respondents report allocations to four asset classes).About one third of the respondents’ combined wealth is in real estate, 30% inindividual stocks, and 15% in stock funds. The remaining fifth is split betweenlife insurance, bonds, and short- to medium-term savings. In contrast, Germanhouseholds held over half of their combined net financial and real estate wealthin real estate and less than 10% in individual stocks and mutual funds at the endof 1997, according to statistics compiled by the Deutsche Bundesbank (1999) (seealso Börsch-Supan and Eymann (2000)).
3.2. SUBJECTIVE ATTRIBUTES
In addition to objective attributes such as gender or income, the survey elicits at-tributes that require the respondents to make an assessment, e.g., regarding theirknowledge about financial assets or their preferences for investments featuringhigh risk and high expected returns. On the one hand, using answers to subjectivequestions raises obvious concerns, e.g., that people might give inaccurate answersor that they might “not mean what they say” (see, e.g., Bertrand and Mullainathan(2001)). On the other hand, subjective questions could be appealing because theyare relatively easy to understand. Kapteyn and Teppa (2002) report that measuresof risk aversion based on answers to subjective questions are better at explaining in-vestor behavior – specifically, the cross-sectional variation in the fraction of wealthinvested in risky assets – than measures of risk aversion based on the respondents’choices in gambles over lifetime income (the method used by Barsky et al. (1997)).
3.2.1. Investment experience and knowledge
Survey responses allow us to construct measures of investment experience andknowledge. In addition to objective attributes – education, income, and wealth,for example – self-assessments of experience and knowledge about financial assetscan be proxies for investor sophistication. In turn, measures for sophistication canbe related to actual investor behavior such as trading activity to address whethermore sophisticated investors churn their portfolios less, for example.
Investors report the length of their financial experience (see Appendix B), on av-erage seven and a half years. They also assess their knowledge of eleven categories

TALK AND ACTION: WHAT INDIVIDUAL INVESTORS SAY AND WHAT THEY DO 449
of financial instruments in terms of how well they could explain the instruments toan imaginary friend (see Appendix B) on a scale of 1 (don’t know/cannot explain)to 4 (know/can explain very well). The sum of the knowledge scores across thedifferent assets, ranging from 11 to 44, is a measure of perceived knowledge. Mostrespondents claim to be able to explain all the financial asset categories eitherwell or very well: the median respondent scores a 38 out of 44; this score will bereferred to as perceived knowledge. The respondents also assess their knowledgeof financial securities relative to that of the average investor by reporting theiragreement with “I am significantly better informed about financial securities thanthe average investor” on a scale of 1 (strongly disagree) to 4 (strongly agree); weuse the scale to construct a relative knowledge variable. Almost nine out of tenrespondents either agree or strongly agree with the notion of being better informedthan the average investor.
Panels A–C of Table III report characteristics of investors grouped by self-reported experience, perceived knowledge, and relative knowledge across assetclasses. Those with longer stock market experience and those who perceive them-selves as more knowledgeable – in absolute terms or relative to other investors– are more predominantly male, better educated, wealthier, and earn higher in-comes. Investor age is strongly positively correlated with the length of experience,only weakly correlated with perceived knowledge, and uncorrelated with relativeknowledge.
In addition to measures of perceived knowledge, the survey offers two naturalproxies for actual knowledge. After assessing their knowledge about financial se-curities, the survey participants are given a short quiz (see Appendix C), consistingof seven true/false questions. The quiz score is calculated as follows: for eachcorrect answer, one point is added to the score, and for each incorrect answer, onepoint is subtracted. The questions test knowledge of investing terms and concepts,e.g., whether investors know the tax implications of short-term investments, thedefinition of a price earnings ratio, or that of a stop-loss order. On average, re-spondents get four out of the seven questions right. Panel D of Table III shows thatthose who perceive themselves as more knowledgeable – male, better educated,and higher-income respondents – also do better on the quiz.
Another measure of actual knowledge can be derived from the respondents’risk evaluations of different asset classes. Survey participants rank the riskiness ofdifferent asset categories on a scale from 1 (safe) to 10 (extremely risky) (see Ap-pendix D). We assign a dummy variable that takes a value of one if the respondents’ranking of asset categories satisfies the following inequalities: bonds are at least asrisky (≥) as savings accounts, bonds ≥ bond funds, stocks > bonds, stocks ≥ stockfunds, stocks ≥ index certificates, options > stocks. Three out of five respondents– in particular younger and better educated respondents – make risk assessments inline with the above inequalities. These respondents also do significantly better onthe quiz; on average, they get one more question right.

450 DANIEL DORN AND GUR HUBERMAN
Tabl
eII
I.D
emog
raph
ican
dso
cio-
econ
omic
attr
ibut
esof
inve
stor
sgr
oupe
dby
soph
isti
cati
on
Pane
lsA
thro
ugh
Dch
arac
teri
zein
vest
ors
grou
ped
bydi
ffer
ent
self
-rep
orte
dm
easu
res
ofso
phis
ticat
ion:
(A)
leng
thof
stoc
k-m
arke
tex
peri
ence
(rep
orte
din
year
s),
(B)
self
-ass
esse
dkn
owle
dge
(asc
ore
betw
een
11an
d44
),(C
)pe
rcei
ved
know
ledg
ere
lativ
eto
the
aver
age
inve
stor
(exp
ress
edon
anor
dina
lfo
ur-p
oint
scal
era
ngin
gfr
om“m
uch
less
info
rmed
”to
“muc
hbe
tter
info
rmed
”–
we
com
bine
the
cate
gori
esof
the
rela
tivel
y“m
uch
less
info
rmed
”an
d“l
ess
info
rmed
”as
only
seve
nre
spon
dent
sco
nsid
erth
emse
lves
muc
hle
ssin
form
edth
anth
eav
erag
ein
vest
or),
(D)
actu
alkn
owle
dge
mea
sure
dby
the
inve
stor
’spe
rfor
man
cein
ash
ortq
uiz
(asc
ore
rang
ing
betw
een
zero
and
seve
n),a
nd(E
)ac
tual
know
ledg
em
easu
red
byth
eir
rank
ing
diff
eren
tass
etcl
asse
sac
cord
ing
tori
sk(a
dum
my
vari
able
that
ison
eif
resp
onde
nts
corr
ectl
yra
nkth
ere
lativ
eri
skin
ess
ofth
eas
set
clas
ses)
.See
Fig
ures
1an
d2
for
ade
fini
tion
ofth
eat
trib
utes
and
thei
rso
urce
s.In
Pane
lsA
,B,a
ndD
,the
cate
gori
esar
efo
rmed
byso
rtin
gin
vest
ors
alon
gth
eco
rres
pond
ing
attr
ibut
ein
toap
prox
imat
ely
equa
llysi
zed
grou
ps.
Due
tocl
uste
ring
ofth
eat
trib
utes
atce
rtai
nva
lues
,the
frac
tion
ofho
useh
olds
ina
“qua
rtile
”m
ayde
viat
efr
om25
%.N
ote:
***/
**/*
indi
cate
that
the
mea
nsor
prop
orti
ons
ofth
eto
pan
dbo
ttom
grou
psar
esi
gnifi
cant
lydi
ffer
enta
tthe
1%/5
%/1
0%le
vel,
allo
win
gfo
run
equa
lvar
ianc
esw
hen
test
ing
for
diff
eren
ces
inm
eans
.
(1)
(2)
(3)
(4)
(5)
(6)
(7)
Gen
der
ofC
olle
geS
elf-
Inco
me
Wea
lth
Fra
ctio
nof
resp
onde
ntM
ean
age
degr
eeem
ploy
edM
ean
Mea
n
resp
onde
nts
[%m
ale]
[yea
rs]
[%]
[%]
[DE
M’0
00s]
[DE
M’0
00s]
Pane
lA:L
engt
hof
expe
rien
ce
1(s
hort
est)
10%
84%
3564
%14
%74
168
228
%85
%38
70%
16%
8626
8
332
%89
%40
68%
17%
9035
8
4(l
onge
st)
30%
94%
***
46**
*72
%*
19%
110*
**56
1***
Pane
lB:P
erce
ived
know
ledg
e
1(l
ow)
26%
82%
3963
%14
%80
262
226
%90
%41
67%
15%
9436
2
324
%92
%41
74%
16%
9738
8
4(h
igh)
24%
91%
***
41**
75%
***
23%
***
103*
**48
9***

TALK AND ACTION: WHAT INDIVIDUAL INVESTORS SAY AND WHAT THEY DO 451
Tabl
eII
I.D
emog
raph
ican
dso
cio-
econ
omic
attr
ibut
esof
inve
stor
sgr
oupe
dby
soph
isti
cati
on(c
onti
nued
)
(1)
(2)
(3)
(4)
(5)
(6)
(7)
Gen
der
ofC
olle
geS
elf-
Inco
me
Wea
lth
Fra
ctio
nof
resp
onde
ntM
ean
age
degr
eeem
ploy
edM
ean
Mea
n
resp
onde
nts
[%m
ale]
[yea
rs]
[%]
[%]
[DE
M’0
00s]
[DE
M’0
00s]
Pane
lC:R
elat
ive
know
ledg
e
1an
d2
(low
)10
%78
%41
69%
12%
8227
3
347
%90
%41
69%
15%
9335
9
4(h
igh)
43%
91%
***
4170
%21
%**
97**
*44
4***
Pane
lD:A
ctua
lkno
wle
dge
(qui
zsc
ore)
1(l
ow)
31%
85%
4161
%17
%83
316
240
%89
%41
72%
17%
9738
0
344
%91
%41
70%
14%
9639
0
4(h
igh)
15%
93%
***
4079
%**
*21
%95
**41
4***
Pane
lE:A
ctua
lkno
wle
dge
(ris
kas
sess
men
t)
0(w
rong
)39
%87
%43
64%
17%
9135
6
1(r
ight
)61
%91
%**
40**
*73
%**
*17
%95
383

452 DANIEL DORN AND GUR HUBERMAN
Do those who report knowing more actually know more? Table IV reports theresults of OLS and ordered probit regressions of perceived knowledge and relat-ive knowledge on demographic and socio-economic investor attributes as well asmeasures of actual knowledge. Perceived knowledge, with its 34 different categor-ies, is treated as a continuous variable and the regressions are estimated using OLS.The relative knowledge regressions are estimated using ordered probit, as there areonly four relative knowledge categories. However, the sign and statistical signi-ficance of the coefficients in both regressions are insensitive to the specificationchosen. The results of the regression of perceived knowledge on demographic andsocio-economic investor attributes, reported in Column (1) of Table IV, revealstwo differences relative to the univariate correlations reported in Table III; theexplanatory power of the wealth variable swamps that of the income variable inall regressions and investor age is negatively related to perceived knowledge, otherthings equal. Column (2) of Table IV shows that perceived knowledge is stronglypositively related to measures of experience and actual knowledge – those who re-port to know more actually know more. Combining the explanatory variables fromthe two previous regressions yields similar results (see Column (4) of Table IV).The remaining columns of Table IV report similar regressions, but with relativeknowledge as the dependent variable. Column (4) and (5) of Table IV show that allbut one of the investor attributes that explain differences in perceived knowledgealso explain differences in relative knowledge; college-educated investors considerthemselves more knowledgeable than those without a college education, but donot assert to know more than the average investor, other things equal. Column (6)reports the results of a regression with investor attributes and objective measuresof knowledge as explanatory variables. Including measures of actual knowledgerenders the gender coefficient insignificant which suggests that male investors’belief in their greater relative knowledge is based on fact rather than hubris. Finally,Column (7) shows that differences in perceived knowledge can explain substantialvariation in relative knowledge, holding other investor attributes constant.
3.2.2. Drivers of Overconfidence
Recent theoretical work, e.g., by Benos (1998) and Odean (1998), proposes thatoverconfidence causes trading. Overconfident investors trade more readily on sig-nals about differences between current and future prices of an asset because theyoverestimate the precision of their signals relative to the precision of other traders’signals or, more generally, they overestimate their trading skills. Analyzing asample of US discount brokerage clients who switch from phone-based to on-line trading, Barber and Odean (2002) “posit that online investors become moreoverconfident once online for three reasons: the self-attribution bias, an illusion ofknowledge, and an illusion of control.” (see also Daniel et al. (1998) and Gervaisand Odean (2001)). Overconfidence is an appealing theoretical concept. Empir-ically, however, it is challenging to produce an observable which correlates withindividuals’ overconfidence.

TALK AND ACTION: WHAT INDIVIDUAL INVESTORS SAY AND WHAT THEY DO 453
Tabl
eIV
.P
erce
ived
and
rela
tive
know
ledg
eve
rsus
disp
laye
dkn
owle
dge
The
depe
nden
tva
riab
lein
Col
umns
(1)–
(3)
isa
scor
eof
perc
eive
dkn
owle
dge
cons
truc
ted
from
resp
onde
nts
asse
ssin
gth
eir
know
ledg
eab
out
finan
cial
secu
ritie
s(s
eeA
ppen
dix
B).
Col
umns
(1)–
(3)
repo
rtO
LS
estim
ates
from
regr
essi
ons
ofth
epe
rcei
ved
know
ledg
esc
ore
onva
riou
sin
vest
orat
trib
utes
.Col
umns
(4)–
(7)
repo
rtor
dere
dpr
obit
esti
mat
esfr
omre
gres
sion
sof
rela
tive
know
ledg
eon
diff
eren
tset
sof
inve
stor
attr
ibut
es.S
eeF
igur
es1
and
2fo
ra
defin
ition
ofth
eat
trib
utes
and
thei
rso
urce
s.ln
deno
tes
the
natu
ral
loga
rith
m.
Sta
ndar
der
rors
are
inpa
rent
hese
s.T
hest
anda
rder
rors
inC
olum
ns(1
)–(3
)ar
eco
rrec
ted
for
hete
rosk
edas
tici
tyas
sugg
este
dby
Whi
te(1
980)
.N
ote:
***/
**/*
indi
cate
that
the
coef
fici
ent
esti
mat
esar
esi
gnifi
cant
lydi
ffer
ent
from
zero
atth
e1%
/5%
/10%
leve
l. (1)
(2)
(3)
(4)
(5)
(6)
(7)
Per
ceiv
edP
erce
ived
Per
ceiv
edR
elat
ive
Rel
ativ
eR
elat
ive
Rel
ativ
e
Dep
ende
ntva
riab
lekn
owle
dge
know
ledg
ekn
owle
dge
know
ledg
ekn
owle
dge
know
ledg
ekn
owle
dge
Con
stan
t29
.448
***
28.2
76**
*25
.318
***
(1.3
39)
(0.6
81)
(1.3
62)
Gen
der
2.20
6***
1.39
7**
0.27
4**
0.11
40.
029
(0.5
89)
(0.5
43)
(0.1
20)
(0.1
23)
(0.1
25)
Age
−0.0
43**
*−0
.043
***
−0.0
12**
*−0
.015
***
−0.0
13**
*
(0.0
15)
(0.0
14)
(0.0
04)
(0.0
04)
(0.0
04)
Col
lege
educ
atio
n1.
369*
**1.
042*
**−0
.025
−0.0
89−0
.161
**
(0.3
59)
(0.3
32)
(0.0
78)
(0.0
80)
(0.0
81)
Sel
f-em
ploy
ed0.
278
0.45
90.
207*
*0.
262*
**0.
244*
*
(0.4
15)
(0.3
87)
(0.0
97)
(0.0
99)
(0.1
00)

454 DANIEL DORN AND GUR HUBERMAN
Tabl
eIV
.P
erce
ived
and
rela
tive
know
ledg
eve
rsus
disp
laye
dkn
owle
dge
(con
tinu
ed)
(1)
(2)
(3)
(4)
(5)
(6)
(7)
Per
ceiv
edP
erce
ived
Per
ceiv
edR
elat
ive
Rel
ativ
eR
elat
ive
Rel
ativ
e
Dep
ende
ntva
riab
lekn
owle
dge
know
ledg
ekn
owle
dge
know
ledg
ekn
owle
dge
know
ledg
ekn
owle
dge
ln(I
ncom
e)0.
153
0.11
20.
013
0.00
1−0
.003
(0.3
03)
(0.2
84)
(0.0
67)
(0.0
68)
(0.0
69)
ln(W
ealt
h)1.
145*
**0.
625*
**0.
201*
**0.
098*
**0.
061
(0.1
58)
(0.1
50)
(0.0
35)
(0.0
37)
(0.0
38)
Exp
erie
nce
0.32
7***
0.27
5***
0.07
1***
0.07
1***
0.05
6***
(0.0
32)
(0.0
34)
(0.0
09)
(0.0
10)
(0.0
10)
Act
ualk
now
ledg
e1.
178*
**1.
065*
**0.
245*
**0.
239*
**0.
182*
**
(qui
z)(0
.117
)(0
.118
)(0
.029
)(0
.030
)(0
.031
)
Act
ualk
now
ledg
e0.
764*
*0.
452
0.01
1−0
.034
−0.0
64
(ris
kas
sess
men
t)(0
.296
)(0
.293
)(0
.074
)(0
.076
)(0
.077
)
Per
ceiv
edkn
owle
dge
0.06
2***
(0.0
08)
Anc
illa
ryst
atis
tics
Num
ber
ofob
serv
atio
ns10
6810
6810
6810
6810
6810
6810
68
(Pse
udo)
R2
10.8
%19
.5%
23.2
%2.
6%7.
7%9.
0%11
.9%

TALK AND ACTION: WHAT INDIVIDUAL INVESTORS SAY AND WHAT THEY DO 455
Survey responses allow us to construct direct measures of drivers of overcon-fidence and therefore conduct tighter tests of the overconfidence hypothesis thanpossible in the earlier literature (e.g., Barber and Odean (2001) and Barber andOdean (2002)). The self-enhancing attribution bias refers to the tendency to overlyattribute successes to one’s skill (the psychological evidence for a self-protectiveattribution bias, i.e., the tendency to blame external factors for failure, is moremixed (see, e.g., the survey of Miller and Ross (1975))). To estimate the self-enhancing attribution bias, we consider the extent to which survey participantsagree – on a four-point scale from 1 (totally disagree) to 4 (fully agree)– withthe following statement: “My past investment successes were, above all, due tomy specific skills.” Investors are also asked to indicate their agreement with thestatement “My instinct has often helped me to make financially successful invest-ments.” The responses to the two statements are significantly positively correlatedand the results reported below are robust to the choice of the bias measure. It is alsonoteworthy that the two proxies for drivers of overconfidence are positively correl-ated; the correlation coefficient between the proxy for self-attribution bias and theproxy for illusion of control is 0.25 and significant at the 1% level. Column (1) ofTable V reports the results of an ordered probit regression of this proxy for the self-enhancing attribution bias on the demographic and socio-economic variables. Maleand wealthier investors are more prone to taking responsibility for their investmentsuccesses, other things equal. Interestingly, the gender and wealth coefficients arerendered insignificant when we include the investment experience and knowledgevariables (see Column (2) of Table V.) Relative knowledge, in particular, is stronglypositively correlated with the tendency to attribute success to skill.
“Illusion of control” usually refers to a decision maker’s erroneous expectationto be able to affect chance outcomes or to do better than what would be warrantedby objective probabilities (see Langer (1975)). Survey participants indicate theiragreement – on a four-point scale from 1 (strongly disagree) to 4 (strongly agree)– with four statements designed to elicit perceived control of the decision makerin risky situations: 1. “When I make plans, I am certain that they will work out,”2. “I always know the status of my personal finances,” 3. “I am in control of mypersonal finances,” and 4. “I control and am fully responsible for the results ofmy investment decisions.” Cronbach’s alpha for the control score – the average ofthe individual scores – is 76%, indicating that the four survey items reliably elicita single underlying construct.4 Presumably, individuals with higher control scoresare more likely to suffer from an illusion of control. The results of an ordered probitregression of the control score on the demographic and socio-economic variables,reported in Column (3) of Table V, show that younger and wealthier investorsfeel more strongly in control of their finances and investments, other things equal.
4 Cronbach’s measure is defined as α ≡ NN−1
[1 −
∑Nj=1 σ 2
j∑Nj=1
∑Nk=1 σjk
], where N is the number of
individual scores (here three), σ 2j
is the variance of individual score j , and σjk is the covariance ofthe scores j and k (see Cronbach (1951)).

456 DANIEL DORN AND GUR HUBERMAN
Table V. The relation between proxies for overconfidence and other investor attributes
This table report the estimates from ordered probit regressions of proxies for overconfidenceon objective and subjective investor attributes. The dependent variable in Columns (1) and (2)is the extent to which respondents take responsibility for their investment successes, measuredon an ordinal four-point scale, which serves as a proxy for the self-enhancing attribution bias.The dependent variable in Columns (3) and (4) is the extent to which respondents feel “incontrol” of their investments which serves as a proxy for “illusion of control”. See Figures1 and 2 for a definition of the attributes and their sources. ln denotes the natural logarithm.Standard errors are in parentheses. Note: ***/**/* indicate that the coefficient estimates aresignificantly different from zero at the 1%/5%/10% level.
Dependent variable: (1) (2) (3) (4)
Self-enhancing attribution bias Illusion of control
Gender 0.264** 0.198 0.180 0.078
(0.123) (0.127) (0.123) (0.126)
Age 0.000 0.004 −0.012*** −0.008**
(0.004) (0.004) (0.004) (0.004)
College education −0.121 −0.128 0.020 −0.010
(0.079) (0.082) (0.079) (0.081)
Self-employed −0.063 −0.123 −0.091 −0.144
(0.095) (0.097) (0.094) (0.095)
ln(Income) 0.017 0.007 −0.073 −0.082
(0.067) (0.068) (0.067) (0.068)
ln(Wealth) 0.089** 0.020 0.125*** 0.049
(0.035) (0.038) (0.035) (0.038)
Experience 0.003 −0.005
(0.010) (0.010)
Actual knowledge −0.007 0.049
(quiz) (0.032) (0.031)
Actual knowledge 0.010 0.040
(risk assessment) (0.077) (0.075)
Perceived knowledge −0.003 0.012
(0.008) (0.008)
Relative knowledge 0.613*** 0.503***
(0.064) (0.061)
Ancillary statistics
Number of observations 974 974 974 974
Pseudo R2 0.8% 6.3% 0.6% 4.0%

TALK AND ACTION: WHAT INDIVIDUAL INVESTORS SAY AND WHAT THEY DO 457
However, when relative knowledge is included as an explanatory variable, objectiveinvestor attributes lose their explanatory power (see Column (4) of Table V).
The strong correlation between relative knowledge and the proxies for overcon-fidence is noteworthy. One interpretation is that relative knowledge itself is a moredirect driver of overconfidence. The overwhelming tendency of the respondentsto think themselves better informed than the average investor is reminiscent ofSvenson (1981) who reports that a majority of US and Swedish students considerthemselves better drivers than their peers. The interpretation in our case is not asstraightforward, however. First, the peer group – the “average investor” – is not asclearly defined. While the sample investors are probably better informed than thetypical German investor who holds some type of equity (including company stockand stock mutual funds), they are on average much less informed than the profes-sional investors they are likely trading with in the marketplace. Second, even if oneaccepts relative knowledge as a proxy for overconfidence, it is unclear whetheroverconfidence about knowledge translates into overconfidence about portfoliochoices. Notwithstanding these reservations, relative knowledge – or the discrep-ancy between perceived knowledge and actual knowledge, defined as the residualof a regression of perceived knowledge on length of experience, actual knowledgeinferred from the quiz performance, and actual knowledge inferred from the re-spondent’s risk assessment – seems to be an attractive proxy for overconfidence.After all, respondents who claim to be much more knowledgeable than the typicalinvestor, or those who overestimate how much they know, may not be aware ofthe identity of the counterparty to the trade or underestimate the counterparty –likely a professional investor with access to vastly superior resources. Yet such anawareness is key to no-trade theorems (see, e.g., Milgrom and Stokey (1982) andTirole (1982)).
3.2.3. Risk aversion
One would expect measures of risk aversion to be systematically related to port-folio choices such as portfolio volatility. And, although both risk-averse andrisk-tolerant investors should hold a well-diversified portfolio of financial assets,there is evidence that some investors are unable to distinguish systematic from un-systematic risk (see, e.g., Kroll et al. (1988) and Siebenmorgen and Weber (2001));risk tolerant investors may thus be willing to take on more of both types of risk,leaving their portfolios less diversified. Moreover, people might trade into and outof equities in response to changes in risk aversion. However, the high frequencywith which many sample investors trade into and out of individual stocks whileleaving their overall exposure to equities roughly constant, can hardly be explainedby changes in risk aversion. Another possibility is that most of the trading is donefor speculative purposes, i.e., people act on a signal about the difference betweencurrent and future prices of an asset. Models à la Grossman (1976) or Varian (1989)suggest that the greater someone’s risk aversion, the smaller the change in theinvestor’s position resulting from the signal, other things equal.

458 DANIEL DORN AND GUR HUBERMAN
Survey respondents indicate their risk aversion on a four-point scale from “notat all willing to bear high risk in exchange for high expected returns” to “verywilling to bear high risk in exchange for high expected returns”.5
Table VI documents the characteristics of respondents grouped by self-assessedrisk aversion. Males are disproportionately represented in the least risk-aversegroup; about 95% of the least risk-averse investors are men as opposed to 85%in the most risk-averse group. The least risk-averse investors are also substantiallyyounger than their risk-averse counterparts – 37 years of average age versus 45years. Self-employment is negatively correlated with risk aversion.6
Column (1) of Table VII contains the results from an ordered probit regressionof risk aversion on demographic and socio-economic investor attributes. Otherthings equal, younger and self-employed investors are less risk-averse, confirmingthe sign and significance of the univariate correlations. Male investors also tend toreport to be less risk-averse, although the effect of gender is not robust to includ-ing the proxies for investor sophistication and for drivers of overconfidence (seeColumn (2) of Table VII). With the exception of perceived knowledge, all measuresof investor sophistication and overconfidence are negatively correlated with self-reported risk aversion, most of them significantly so. In particular, respondents whoreport to know more than their peers and those who do well on the knowledge quizthink themselves risk-tolerant.
Kapteyn and Teppa (2002) report that subjective measures of risk aversion con-structed from answers to this type of survey questions can explain considerablevariation in self-reported portfolio choices. If the measure of risk aversion werea good proxy for the respondents’ risk preferences, one would expect it to bepositively correlated with the riskiness of the respondents’ portfolios of financialand non-financial assets. Survey participants report the fraction of wealth investedacross different asset classes. The fraction of wealth invested in non-fixed incomefinancial securities, that is, the sum of allocations to stocks, mutual funds, and op-tions (“risky assets”) is a simple measure of the riskiness of the self-reported wealthprofile. Column (3) of Table VII contains the results of regressing the fraction ofrisky assets on demographic and socio-economic investor attributes, and Column(4) reports the results of a similar regression with proxies for investor sophistic-ation, overconfidence, and risk aversion as additional explanatory variables. Thecoefficient on risk aversion is highly significant, both in statistical and in economic
5 The U.S. Survey of Consumer Finances elicits the risk aversion of its respondents in a similarmanner, by asking “Which of the statements on this page comes closest to the amount of financialrisk that you are willing to take when you save or make investments?”, letting survey participantsindicate one of the following: (1) “[. . . ] take substantial financial risks expecting to earn substantialreturns”, (2) “take above average financial risks expecting to earn above average returns”, (3) “takeaverage financial risks expecting to earn average returns”, and (4) “not willing to take any financialrisks”.
6 Except for the lack of correlation between education and risk aversion, the univariate correla-tions between sample investor characteristics and risk aversion resemble those documented for thesample of 1998 SCF households with brokerage accounts.

TALK AND ACTION: WHAT INDIVIDUAL INVESTORS SAY AND WHAT THEY DO 459
Tabl
eV
I.S
elf-
repo
rted
risk
aver
sion
ofdi
ffer
enti
nves
tor
grou
ps
The
tabl
ere
port
sde
mog
raph
ican
dso
cio-
econ
omic
attr
ibut
esof
the
sam
ple
inve
stor
sgr
oupe
dby
self
-ass
esse
dri
skav
ersi
on.
Gro
up1
cons
ists
ofth
em
ost
risk
aver
sein
vest
ors.
Mea
nsor
prop
orti
ons
are
repo
rted
inth
efi
rst
row
for
each
grou
p.W
hen
appl
icab
le,
stan
dard
devi
atio
nsar
ere
port
edin
the
seco
ndro
wfo
rea
chgr
oup.
The
last
row
ofth
eta
ble
repo
rts
the
stat
isti
cal
sign
ifica
nce
ofm
ean
orpr
opor
tion
com
pari
son
test
sbe
twee
ngr
oups
1an
d4;
***/
**/*
indi
cate
that
the
mea
nsor
prop
orti
ons
are
sign
ifica
ntly
diff
eren
tatt
he1%
/5%
/10%
leve
l.
(1)
(2)
(3)
(4)
(5)
(6)
(7)
Col
lege
Sel
f-In
com
eW
ealt
h
Self
-rep
orte
dF
ract
ion
ofG
ende
rM
ean
age
degr
eeem
ploy
edM
ean
Mea
n
Ris
kav
ersi
onre
spon
dent
s[%
mal
e][y
ears
][%
][%
][D
EM
][D
EM
]
1(L
east
RA
)17
%95
%37
69%
22%
93,0
0033
6,00
0
1054
,000
322,
000
230
%92
%40
72%
17%
92,0
0035
8,00
0
1148
,000
321,
000
339
%87
%41
69%
16%
95,0
0037
0,00
0
1146
,000
325,
000
4(M
ostR
A)
14%
85%
4574
%13
%94
,000
438,
000
1351
,000
348,
000
Mos
tRA
–L
east
RA
***
***
****
*

460 DANIEL DORN AND GUR HUBERMAN
Table VII. Self-reported investor attributes versus self-reported risk postures
Unless otherwise mentioned, all attributes are defined as in Figures 1 and 2. Riskfracis the fraction of wealth invested in non-fixed income financial securities (i.e., the sum ofallocations to stocks, mutual funds, and options divided by self-reported wealth including realestate) calculated from survey responses. ln denotes the natural logarithm. Standard errorsare in parentheses. Note: ***/**/* indicate that the coefficient estimates are significantlydifferent from zero at the 1%/5%/10% level.
(1) (2) (3) (4)
Dependent variable Risk aversion Risk aversion Riskfrac Riskfrac
Constant 1.284*** 1.194***
(0.084) (0.133)
Gender −0.207* −0.123 0.051 0.040
(0.123) (0.125) (0.035) (0.034)
Age 0.019*** 0.018*** −0.002** −0.002
(0.004) (0.004) (0.001) (0.001)
College 0.115 0.131 0.026 0.035
(0.078) (0.080) (0.022) (0.022)
Self-employed −0.287*** −0.298*** −0.013 −0.022
(0.093) (0.094) (0.026) (0.026)
ln(Income) −0.094 −0.101 −0.051*** −0.052***
(0.067) (0.067) (0.019) (0.018)
ln(Wealth) 0.000 0.070* −0.082*** −0.085***
(0.035) (0.038) (0.010) (0.010)
Experience −0.017* 0.001
(0.010) (0.003)
Actual knowledge −0.089*** 0.018**
(quiz) (0.031) (0.009)
Actual knowledge −0.036 −0.017
(risk) (0.075) (0.020)
Perceived knowledge 0.009 −0.006***
(0.008) (0.002)
Relative knowledge −0.255*** 0.038**
(0.064) (0.018)
Self-attribution bias −0.094* 0.003
(0.054) (0.015)
Illusion of control −0.106 0.055**
(0.085) (0.023)
Risk aversion −0.042***
(0.011)
Ancillary statistics
Nobs 947 947 947 947
Pseudo R2 1.9% 4.3% 21.1% 27.5%

TALK AND ACTION: WHAT INDIVIDUAL INVESTORS SAY AND WHAT THEY DO 461
terms; the least risk-averse investors hold almost twice the fraction in risky assetsas their most risk averse peers, other things equal.
4. Self-Reported Versus Actual Behavior
4.1. DETERMINANTS OF POOR DIVERSIFICATION
Thus far, our analysis has relied on self-reported information. Merging the surveydata with the brokerage transaction records allows us to contrast self-reported andactual behavior. Specifically, one can ask whether self-reported risk aversion ispositively correlated with actual risk taking and whether investors who could bejudged sophisticated by their self-reported attributes are actually better diversified.The clients’ survey responses and trading records reveal investor and portfolioattributes that reflect different aspects of investor sophistication. In addition, aninvestor’s tendency to prefer nearby stocks – either a preference for domestic overforeign stocks (home bias) or a preference for local domestic over remote domesticstocks (local bias), or both – can be interpreted as a lack of sophistication (see alsoHuberman (2001), Grinblatt and Keloharju (2001), and Zhu (2002)). Proxies forthe home bias and the local bias can be readily calculated as the account fractioninvested in German stocks and mutual funds investing in German stocks, and thedistance between the investor and his portfolio relative to the distance between theinvestor and the market portfolio.7 The local bias measure, pioneered by Coval andMoskowitz (1999), is defined as follows:
LBi ≡N∑
j=1
(mj − hi,j
) di,j
dMi
= 1 −∑N
j=1 hi,j di,j
dMi
(1)
where dMi ≡ ∑N
j=1 mjdi,j , mj is the weight of stock j in the benchmark (mar-ket) portfolio, hi,j is the weight of stock j in investor i’s portfolio, and di,j isthe distance between investor i and firm j . If investors with a preference for thefamiliar indeed bought and held just a few near-by stocks as conjectured by Huber-man (2001), one would expect the home and local bias measures to be negativelycorrelated with account diversification.
In the mean-variance framework of portfolio theory, the portfolio’s aggregatevolatility is the only measure of risk an investor should be concerned with. Portfoliovolatility is measured as the annualized standard deviation of daily portfolio returnsfrom the day the account was opened until May 31, 2000 or when the account wasclosed, whichever comes first. Figure 3 shows a histogram of annualized portfoliovolatility. The distribution is skewed to the right with a median portfolio volatilityof 30% and an average of 35%; the DAX 100, a broad index of German stocks, has
7 Given latitude (lat) and longitude (lon) coordinates for respondent i and firm j, the distancebetween i and j is calculated as di,j = earth radius · acos(sin (latj )sin(lati ) + cos(latj )cos (lati )cos(lonj − loni )).
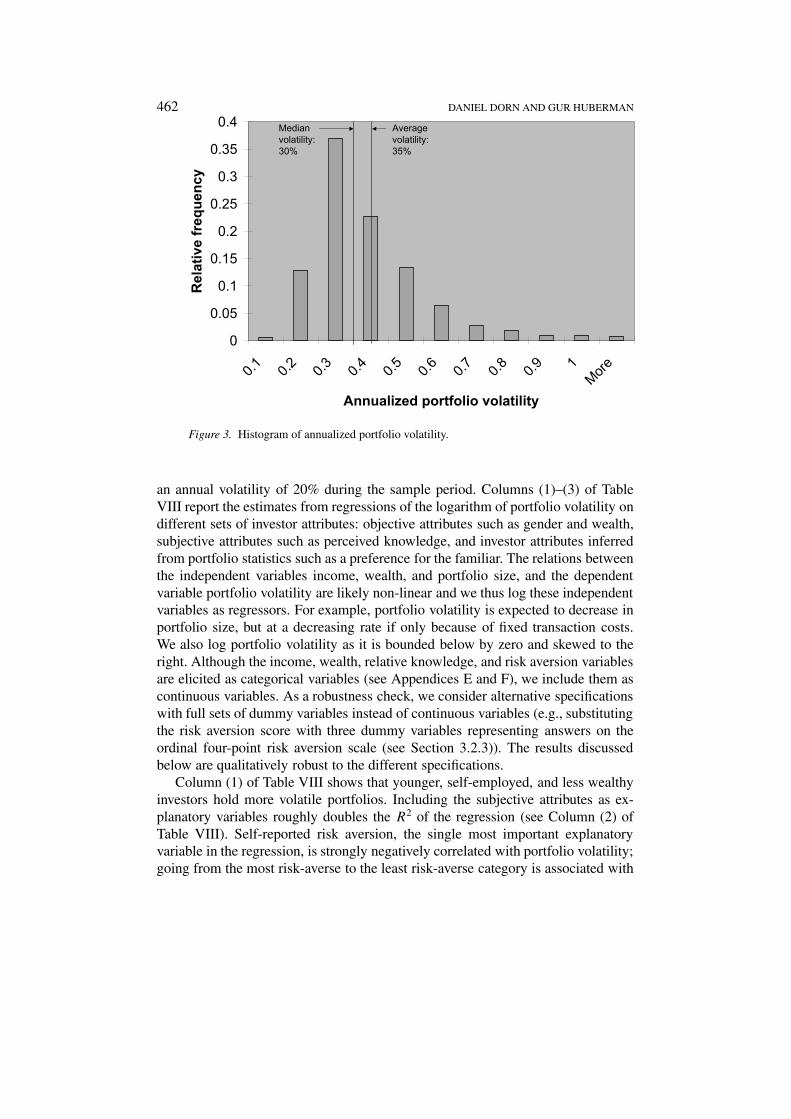
462 DANIEL DORN AND GUR HUBERMAN
0
0.05
0.1
0.15
0.2
0.25
0.3
0.35
0.4
0.1 0.2 0.3 0.4 0.5 0.6 0.7 0.8 0.9 1More
Annualized portfolio volatility
Rel
ativ
e fr
eque
ncy
Medianvolatility:30%
Averagevolatility:35%
Figure 3. Histogram of annualized portfolio volatility.
an annual volatility of 20% during the sample period. Columns (1)–(3) of TableVIII report the estimates from regressions of the logarithm of portfolio volatility ondifferent sets of investor attributes: objective attributes such as gender and wealth,subjective attributes such as perceived knowledge, and investor attributes inferredfrom portfolio statistics such as a preference for the familiar. The relations betweenthe independent variables income, wealth, and portfolio size, and the dependentvariable portfolio volatility are likely non-linear and we thus log these independentvariables as regressors. For example, portfolio volatility is expected to decrease inportfolio size, but at a decreasing rate if only because of fixed transaction costs.We also log portfolio volatility as it is bounded below by zero and skewed to theright. Although the income, wealth, relative knowledge, and risk aversion variablesare elicited as categorical variables (see Appendices E and F), we include them ascontinuous variables. As a robustness check, we consider alternative specificationswith full sets of dummy variables instead of continuous variables (e.g., substitutingthe risk aversion score with three dummy variables representing answers on theordinal four-point risk aversion scale (see Section 3.2.3)). The results discussedbelow are qualitatively robust to the different specifications.
Column (1) of Table VIII shows that younger, self-employed, and less wealthyinvestors hold more volatile portfolios. Including the subjective attributes as ex-planatory variables roughly doubles the R2 of the regression (see Column (2) ofTable VIII). Self-reported risk aversion, the single most important explanatoryvariable in the regression, is strongly negatively correlated with portfolio volatility;going from the most risk-averse to the least risk-averse category is associated with

TALK AND ACTION: WHAT INDIVIDUAL INVESTORS SAY AND WHAT THEY DO 463
Tabl
eV
III.
Det
erm
inan
tsof
port
foli
odi
vers
ifica
tion
Unl
ess
othe
rwis
em
enti
oned
,al
lat
trib
utes
are
defin
edas
inF
igur
es1
and
2.T
helo
gof
port
foli
ovo
lati
lity
,th
ede
pend
ent
vari
able
inC
olum
ns(1
)–(3
),is
calc
ulat
edus
ing
mon
thly
retu
rns
duri
ngth
een
tire
peri
odth
eac
coun
tis
open
.T
helo
gof
the
Her
find
ahl-
Hir
schm
ann
Inde
x,th
ede
pend
ent
vari
able
inC
olum
ns(4
)–(6
),is
calc
ulat
edas
of5/
31/2
000
(or
asa
peri
odav
erag
efo
rac
coun
tsth
atar
ecl
osed
befo
reth
een
dof
the
sam
ple
peri
od).
The
stan
dard
erro
rsin
pare
nthe
ses
are
corr
ecte
dfo
rhe
tero
sked
asti
city
assu
gges
ted
byW
hite
(198
0).
Not
e:**
*/**
/*in
dica
teth
atth
eco
effi
cien
tes
tim
ates
are
sign
ifica
ntly
diff
eren
tfro
mze
roat
the
1%/5
%/1
0%le
vel.
(1)
(2)
(3)
(4)
(5)
(6)
Dep
ende
ntva
riab
leln
(Vol
)ln
(Vol
)ln
(Vol
)ln
(HH
I)ln
(HH
I)ln
(HH
I)
Con
stan
t−0
.436
***
0.12
20.
447*
*−0
.428
1.72
4**
2.36
6***
(0.1
15)
(0.1
88)
(0.1
91)
(0.4
06)
(0.6
95)
(0.6
64)
Gen
der
0.02
40.
028
0.03
6−0
.257
−0.2
31−0
.120
(0.0
55)
(0.0
54)
(0.0
52)
(0.1
62)
(0.1
69)
(0.1
43)
Age
−0.0
07**
*−0
.005
***
−0.0
04**
*−0
.019
***
−0.0
20**
*−0
.014
***
(0.0
01)
(0.0
02)
(0.0
01)
(0.0
05)
(0.0
06)
(0.0
05)
Col
lege
−0.0
30−0
.002
−0.0
06−0
.149
−0.0
57−0
.039
(0.0
30)
(0.0
29)
(0.0
28)
(0.1
12)
(0.1
12)
(0.1
03)
Sel
f-em
ploy
ed0.
092*
*0.
060
0.05
60.
066
0.00
50.
004
(0.0
38)
(0.0
37)
(0.0
35)
(0.1
33)
(0.1
33)
(0.1
16)
ln(I
ncom
e)−0
.011
−0.0
17−0
.015
−0.0
47−0
.072
−0.1
14
(0.0
27)
(0.0
25)
(0.0
23)
(0.0
92)
(0.0
91)
(0.0
79)
ln(W
ealt
h)−0
.073
***
−0.0
49**
*−0
.004
−0.1
25**
−0.0
770.
157*
**
(0.0
14)
(0.0
14)
(0.0
15)
(0.0
52)
(0.0
56)
(0.0
57)
Exp
erie
nce
−0.0
12**
*−0
.011
***
0.01
10.
012
(0.0
03)
(0.0
03)
(0.0
14)
(0.0
12)

464 DANIEL DORN AND GUR HUBERMAN
Tabl
eV
III.
Det
erm
inan
tsof
port
foli
odi
vers
ifica
tion
(con
tinu
ed)
(1)
(2)
(3)
(4)
(5)
(6)
Dep
ende
ntva
riab
leln
(Vol
)ln
(Vol
)ln
(Vol
)ln
(HH
I)ln
(HH
I)ln
(HH
I)
Act
ualk
now
ledg
e0.
010
0.01
6−0
.008
0.00
3
(qui
z)(0
.012
)(0
.012
)(0
.047
)(0
.041
)
Act
ualk
now
ledg
e0.
000
0.00
3−0
.306
***
−0.2
71**
*
(ris
kas
sess
men
t)(0
.028
)(0
.027
)(0
.104
)(0
.095
)
Per
ceiv
edkn
owle
dge
−0.0
10**
*−0
.011
***
−0.0
27**
−0.0
24**
(0.0
03)
(0.0
03)
(0.0
12)
(0.0
11)
Rel
ativ
ekn
owle
dge
0.02
50.
034
−0.0
360.
036
(0.0
23)
(0.0
23)
(0.0
91)
(0.0
83)
Sel
f-at
trib
utio
nbi
as0.
024
0.02
40.
003
0.00
6
(0.0
20)
(0.0
19)
(0.0
74)
(0.0
65)
Sel
fco
ntro
l−0
.046
−0.0
34−0
.113
−0.0
83
(0.0
33)
(0.0
31)
(0.1
24)
(0.1
10)
Ris
kav
ersi
on−0
.124
***
−0.1
13**
*−0
.248
***
−0.1
90**
*
(0.0
15)
(0.0
14)
(0.0
56)
(0.0
51)
Loc
albi
as−0
.024
0.51
1***
(0.0
53)
(0.1
61)
Hom
ebi
as0.
087*
*1.
429*
**
(0.0
43)
(0.1
59)
ln(P
ortf
olio
size
)−0
.075
***
−0.3
36**
*
(0.0
11)
(0.0
39)
Anc
illa
ryst
atis
tics
Num
ber
ofob
serv
atio
ns87
487
487
487
487
487
4
R2
11.3
%20
.6%
25.6
%4.
8%8.
9%18
.5%
TALK AND ACTION: WHAT INDIVIDUAL INVESTORS SAY AND WHAT THEY DO 465
an increase in annual portfolio volatility from 26% to 39%, holding other investorattributes constant. By itself, cross-sectional variation in risk aversion explainsmore than 9% of the total cross-sectional variation in portfolio volatility. Given thatrisk aversion is reported on an ordinal scale, its explanatory power is remarkable.One explanation is that the observed investors use the same information channels orinteract in chat rooms and therefore perceive risk similarly (even though they havedifferent preferences for risk). Length of experience and perceived knowledge arealso strongly negatively correlated with portfolio volatility; a one-standard devi-ation increase in experience or perceived knowledge is associated with a volatilitydecrease from 32% to 30%, other things equal. The relevance of the subjective at-tributes is unaffected by including the proxies for the local and home biases and logportfolio size (see Column (3) of Table VIII). Investors with smaller accounts andthose with a greater preference for domestic stocks hold more volatile portfolios.In part, the positive correlation between the proxy for the home bias and volatilityis due to a greater reluctance to delegate investment decisions; investors with apreference for domestic stocks hold a smaller fraction of their equities in mutualfunds. Neither of the proxies for drivers of overconfidence is significantly relatedto portfolio volatility.
While portfolio volatility might be the most relevant measure of risk an in-vestor should be concerned with, it is by no means clear that individual investorsactually pay attention to aggregate volatility as opposed to other risk measures(see, e.g., Kroll et al. (1988), Kroll and Levy (1992), and Siebenmorgen andWeber (2001)). Holding more positions is arguably the easiest way to becomebetter diversified. The extent of portfolio concentration can be captured by theHerfindahl-Hirschmann Index (HHI), defined as
HHI ≡n∑
i=1
w2i (2)
where wi is the portfolio weight of stock i and one tenth of the portfolio weightof stock fund i. Underlying the weight assigned to stock funds is the assumptionthat each fund holds 100 equally-weighted positions that do not appear in anotherholding of the investor. The index lies between zero and one; higher values indicateless diversified portfolios. The index value for a portfolio of n equally-weightedstocks is 1
n.8 An investor whose entire portfolio consists of one mutual fund has
an HHI of 0.01; an investor holding two mutual funds has an HHI of 0.005. TheHHI is probably the most salient of the risk measures and its calculation the mostreliable since it does not rely on any assumptions about the stochastic process thatgenerates returns. Using all available holdings data for the survey respondents, themean period-average HHI value is found to be 0.32, corresponding to an equally
8 Blume and Friend (1975) motivate the HHI as a measure of how closely an individual portfolioapproximates the market portfolio:
∑Ni=1(wi − wm
i)2 ≈ ∑N
i=1 w2i
≡ HHI , since the marketweights of individual stocks are small.

466 DANIEL DORN AND GUR HUBERMAN
0
0.05
0.1
0.15
0.2
0.25
0.3
0.35
0.05 0.1 0.1
5 0.2 0.25 0.3 0.3
5 0.4 0.45 0.5 Mo
re
Herfindahl-Hirschmann Index (HHI)
Rel
ativ
e fr
eque
ncy
MedianHHI:10%
AverageHHI:20%
Figure 4. Histogram of end-of-period HHI.
weighted position in little more than three individual stocks. In May 2000, at theend of the sample period, the average HHI is 0.2 which corresponds to an equallyweighted position in five individual stocks. The typical HHI of a portfolio is only0.1, however, indicating that the distribution of HHIs is skewed to the right (seeFigure 4).
Columns (3)–(6) of Table VIII report the estimates from regressions of the log-arithm of HHI on the same set of investor attributes used to explain cross-sectionalvariation in portfolio volatility. The coefficient estimates are qualitatively similar tothose obtained in the volatility regression, with few exceptions. Again, the explan-atory power of the regression nearly doubles when subjective investor attributesare considered in addition to the demographic and socio-economic attributes (seeColumn (4)). Risk aversion as well as actual knowledge inferred from investor riskassessments and perceived knowledge are negatively correlated with portfolio con-centration (see Column (5)). In contrast to the volatility regressions, the local biasmeasure is strongly positively correlated with the dependent variable – more locallybiased clients hold concentrated portfolios of nearby stocks, consistent with thefamiliarity hypothesis (see Column (6)). Account size is strongly negatively cor-related with portfolio volatility. Other things equal, wealth is positively correlatedwith portfolio volatility. An entertainment account effect might be at work here:for a given account size, an increase in wealth means that the observed portfoliobecomes a less important piece of the investor’s wealth.
One concern is that the analysis in Table VIII is plagued by a specificationerror due to sample selection. Although portfolio attributes such as volatility can

TALK AND ACTION: WHAT INDIVIDUAL INVESTORS SAY AND WHAT THEY DO 467
be calculated for all the clients invited to participate in the survey – whether theychoose to participate or not – the subjective investor attributes as well as manydemographic and socio-economic attributes are only available for participants. Wetherefore re-estimate the regressions using the two-step procedure suggested byHeckman (1979), but none of the above inferences change as a result.9 We alsoconsider the possibility that investors increase their risk exposure following periodsof high returns by regressing log portfolio volatility, calculated for the period Janu-ary 2000-May 2000, on investor attributes and lagged portfolio returns, calculatedfor the period January 1999–December 1999 (see also Thaler and Johnson (1990)and Massa and Simonov (2005)). Lagged portfolio returns are positively correlatedwith end-of-sample volatility, but the correlation turns insignificant once we controlfor lagged portfolio volatility as well; thus, the correlation could be an artifact ofpersistently volatile stocks such as technology stocks doing well in 1999.
In summary, subjective investor attributes help explain the substantial variationin individual risk postures. In particular, both self-reported and actual risk pos-tures correspond well to self-reported risk aversion. In addition, more sophisticatedinvestors appear to make better portfolio choices; other things equal, those who re-port to be more experienced, knowledgeable, or are actually more knowledgeable,are also better diversified. By contrast, there is no evidence that investors whomight be subject to an illusion of control or a self-enhancing attribution bias – andthus more overconfident – take bolder positions.
4.2. DETERMINANTS OF PORTFOLIO CHURNING
Every month, the sample investors turn over more than one sixth of their portfolio,on average – average monthly turnover is defined as one plus the sum of purchasesand sales during the number of months the account has been active (active months),divided by twice the period-average portfolio value times the number of activemonths. Figure 5 shows that the distribution of average monthly turnover acrossclients is substantially skewed to the right, but even the typical client turns overhis portfolio at a rate of almost 9% per month – about once every year. The groupof the most aggressive traders earns significantly lower portfolio returns than theleast aggressive traders; before transaction costs, however, their performance issimilar – aggressive trading hurts portfolio performance because trading is costly(see Barber and Odean (2000) for a similar result).
Traditional finance theory shows that there is little room for speculative tradingamong rational agents (see, e.g., Milgrom and Stokey (1982) and Tirole (1982)).Moreover, non-speculative trading should occur in portfolios rather than individualstocks (see, e.g., Subrahmanyam (1991) and Gorton and Pennacchi (1993)). Giventhis theoretical perspective and the high cost of trading, active trading in individualstocks is puzzling (unless perhaps it involved shorting employer stock, the oppos-
9 Detailed results of the first- and second-stage regressions are available from the authors uponrequest.

468 DANIEL DORN AND GUR HUBERMAN
0
0.05
0.1
0.15
0.2
0.25
0.3
0.35
0.05 0.1 0.1
5 0.2 0.25 0.3 0.3
5 0.4 0.45 0.5 Mo
re
Portfolio turnover
Rel
ativ
e fr
eque
ncy
Medianturnover:9%
Averageturnover:18%
Figure 5. Histogram of monthly portfolio turnover.
ite of which is observed (see Huberman and Sengmüller (2004))). Examining thedeterminants of the cross-sectional variation in portfolio turnover will help informnew theories to explain the observed trading volume. If aggressive trading weredue to decision-making biases arising from lack of sophistication or overconfidence(see Odean (1998)), one would expect portfolio turnover to be negatively correlatedwith measures of investor sophistication and positively correlated with more directmeasures of overconfidence such as those constructed in Section 3.2.2 of this paper.
To analyze the multivariate relations between portfolio turnover and investorcharacteristics, we regress the logarithm of average monthly turnover estimatedacross all observations for an account on a similar set of investor attributes as inthe portfolio risk regressions. Table IX contains detailed results. When we confineour attention to demographic and socio-economic variables, the age and genderfindings reported in Barber and Odean (2001) obtain: Column (1) of Table IXshows that, other things equal, younger respondents and male respondents trademore actively than their older and female counterparts. Moreover, wealthier in-vestors churn their portfolios less. At first glance, this seems to be at odds withVissing-Jørgensen (2003), who finds that wealthier households report placing moretrades, using responses from the 1998 and 2001 Survey of Consumer Finances.Wealthier investors in our sample also place more trades, but they turn over theirportfolios less frequently, other things equal. Portfolio turnover is a better measurefor churning because it reflects the magnitude of trading relative to the portfoliosize; investors who save for retirement by splitting a fraction of their income every

TALK AND ACTION: WHAT INDIVIDUAL INVESTORS SAY AND WHAT THEY DO 469
month among a few mutual funds, for example, are likely to be classified as heavytraders when trading activity is measured by the number of trades.
Column (2) of Table IX reports the results of a similar regression with thevariables constructed from the survey as additional explanatory variables. As inthe portfolio risk regression, the inclusion of subjective investor attributes greatlyimproves the explanatory power of the regression; the R2 jumps from 6.6% to17.3%. Less risk-averse respondents turn over their portfolio more aggressively;going from the most risk-averse to the least risk-averse category is associatedwith an increase in monthly portfolio turnover from 6% to 15%, holding otherinvestor attributes constant. Note that the inference is quantitatively similar whenrisk aversion is modelled non-linearly, i.e., as three dummy variables reflectingthe respondent’s answer on the ordinal four-point scale. Investors who could bedeemed more sophisticated by their displayed knowledge trade more aggressively.This result should be cautiously interpreted as it is possible that investors acquireknowledge about financial markets through trading. The interpretation of relativeknowledge being positively correlated with turnover is less ambiguous – if aninvestor believes that he is better informed about the securities he trades than hiscounterparty, he may be more likely to trade.10 To the extent that he is likely to tradewith a well-informed market maker or other professional investor, such a beliefcould be interpreted as overconfidence. By contrast, the two proxies for drivers ofoverconfidence fail to explain cross-sectional variation in trading intensity. Con-sistent with Gervais and Odean (2001), survey respondents with longer investmentexperience trade substantially less; a one-standard deviation increase in experienceis associated with a decrease in monthly turnover from 9.5% to 8%, other thingsequal.
Consistent with Huberman’s (2001) conjecture, investors with a preference forthe familiar – as measured by the distance between the investor and his portfoliorelative to the distance between the investor and the market portfolio – appearcontent to buy and hold a few local stocks (see Column (3) of Table IX). It ispossible that holdings of company stock also help explain the observed correlationbetween local bias and portfolio turnover.11 At a minimum, the correlation betweenlocal bias and portfolio turnover suggests that individual investors do not hold localstocks to exploit real or imagined informational advantages; if this were the case,
10 In an unreported regression, we include an alternative relative knowledge variable: the discrep-ancy between perceived knowledge and actual knowledge measured as the residual from a regressionof perceived knowledge on experience and the two measures of actual knowledge (see Section 3.2.2).The coefficient estimate is not significantly different from zero.
11 We thank an anonymous referee for pointing this out. Large publicly traded German companieshave employee share purchase programs where employees can buy company stock at a discount ifthey commit to holding the shares for a certain period, mostly between one and five years. We suspectthat the incidence of restricted holdings in our sample is very limited, however, since such shares aretypically held by the company on behalf of their employees in an aggregate account at no cost to theemployee.

470 DANIEL DORN AND GUR HUBERMAN
Table IX. Determinants of portfolio turnover
Columns (1)–(3) report the results of OLS regressions of the logarithm of averagemonthly turnover on investor and portfolio attributes. Turnover is defined as one plus thesum of purchases and sales divided by the period-average portfolio value. Average monthlyturnover is turnover divided by the number of months the account has been active. In Column(4), only trading volume deemed speculative is considered in the turnover calculation. SeeFigures 1 and 2 for a definition of the attributes. ln denotes the natural logarithm. Thestandard errors in parentheses are corrected for heteroskedasticity as suggested by White(1980). Note: ***/**/* indicate that the coefficient estimates are significantly different fromzero at the 1%/5%/10% level.
(1) (2) (3) (4)Dependent variable ln(Turnover) ln(Turnover) ln(Turnover) ln(Speculative turnover)
Constant −0.883*** −1.239*** −1.231*** −7.962***(0.295) (0.462) (0.463) (1.926)
Gender 0.310*** 0.249** 0.242** 1.295**(0.115) (0.108) (0.109) (0.563)
Age −0.010*** 0.000 0.000 0.011(0.004) (0.004) (0.004) (0.015)
College −0.008 −0.008 −0.004 −0.044(0.073) (0.067) (0.067) (0.293)
Self-employed 0.218** 0.142* 0.133 −0.139(0.089) (0.084) (0.084) (0.354)
ln(Income) 0.019 0.016 0.031 0.123(0.068) (0.063) (0.064) (0.279)
ln(Wealth) −0.146*** −0.143*** −0.139*** −0.218(0.033) (0.033) (0.033) (0.138)
Experience −0.032*** −0.032*** −0.056(0.009) (0.009) (0.035)
Actual knowledge 0.054* 0.058** 0.376***(quiz) (0.028) (0.028) (0.119)Actual knowledge 0.165** 0.150** 0.344(risk assessment) (0.065) (0.065) (0.275)Perceived knowledge −0.001 −0.001 −0.026
(0.008) (0.008) (0.030)Relative knowledge 0.123** 0.116* 0.553**
(0.060) (0.059) (0.242)Self-attribution bias −0.024 −0.021 −0.166
(0.049) (0.049) (0.194)Self control 0.075 0.076 0.620*
(0.072) (0.072) (0.316)Risk aversion −0.292*** −0.291*** −0.689***
(0.037) (0.037) (0.140)Local bias −0.242** −0.705*
(0.099) (0.416)Home bias −0.052 −1.625***
(0.109) (0.439)Ancillary statistics
Number of observations 874 874 874 874R2 6.6% 17.3% 17.9% 10.9%

TALK AND ACTION: WHAT INDIVIDUAL INVESTORS SAY AND WHAT THEY DO 471
one would expect them to aggressively buy and sell in response to signals ratherthan buy and hold.
To address the concern that differences in turnover might be primarily dueto differing non-speculative motives such as differing savings rates and liquid-ity needs, rebalancing activities, and tax-loss selling, we estimate an alternativeturnover measure excluding “non-speculative” trades. To that end, we extend thedefinition of speculative trades proposed by Barber and Odean (2002) as follows.The transaction records indicate whether a transaction is part of an automatic in-vestment or an automatic withdrawal plan that exist for more than one hundredindividual stocks and mutual funds. Such transactions are likely driven by savingsmotives and are excluded. Next, we only count speculative sales and purchasesthat follow within three weeks of speculative sales. To be classified as speculative,sales transactions have to meet all of the following criteria: 1. they are followed bya purchase within three weeks (to exclude liquidity-driven sales), 2. they are madefor a profit (to exclude tax-loss sales), and 3. the sell order is for the entire position(to eliminate rebalancing sales). The results from regressing the modified turnovermeasure on investor and portfolio attributes are shown in Column (4) of Table IX.The earlier inferences regarding the relation between the investor’s risk aversionand turnover and between actual/relative knowledge and turnover become evensharper. The degree to which respondents feel in control over their investments ismarginally positively correlated with speculative turnover.
To check whether the results are affected by sample selection, we re-estimatethe turnover regressions using Heckman’s (1979) two-step procedure. The resultsare quantitatively similar to those without the correction for selection bias.
In sum, self-reported risk aversion is the most successful attribute in explain-ing variation in turnover. This suggests that overconfidence has a limited role inexplaining differences in the propensity to trade.
5. Conclusion
The neoclassical approach has not adequately explained the huge trading volumeand the widespread lack of diversification observed in individual investor port-folios. The behavioral approach offers some hope of doing just that; however, itwill not be easy. Behavioral hypotheses such as “overconfidence causes trading”are theoretically appealing but empirically hard to assess because the underlyingpersonal attributes are unobservable.
The existing empirical literature on investor behavior focuses on the relationbetween behavior and objective investor attributes such as age, gender, and incometo test behavioral hypotheses. Such objective attributes are relatively easy to elicitbut may capture little of the underlying psychological construct. Our paper departsfrom the prior literature by relating actual investor behavior to subjective attributesof investors – attributes that require the investor’s assessment such as whether he

472 DANIEL DORN AND GUR HUBERMAN
is risk averse, knowledgeable about investments, or whether his investment gainsand losses are due to skill or luck – as well as objective attributes.
When confining ourselves to objective attributes to explain investor behavior,we get results similar to those reported in earlier papers – e.g., younger and maleinvestors trade more aggressively than older and female investors (Barber andOdean (2001)), and older or more experienced and better educated investors holdless concentrated portfolios (Goetzmann and Kumar (2002)).
The inclusion of subjective attributes offers several insights. The self-perceptionof investors revealed by their survey responses is fairly accurate. For example,investors who report to be more knowledgeable about financial securities do betteron a quiz which tests such knowledge. The variation in self-reported risk aversionhelps to explain the variation in actual risk taking measured by portfolio volatilityand concentration. Perhaps more surprisingly, the variation in self-reported riskaversion also helps to explain the variation in portfolio turnover.
This paper is one of the first to confront actual investor behavior with bothobjective and subjective investor attributes. The paper uncovers a prominent rolefor self-reported risk aversion in explaining variation in investor behavior. By con-trast, there is little evidence that differences in overconfidence are associated withdifferences in behavior. These results should be interpreted in light of the samplesize, definition of proxies, and the cross-sectional nature of the analysis; largersamples, different proxies for overconfidence, and availability of panel data, mayproduce different results.
Given the present data, the appropriate conclusion is that risk attitudes of in-vestors are key to understanding two of the most puzzling aspects of their behavior– poor diversification and high turnover. A better understanding of what shapesinvestor risk attitudes and perceptions thus appears to be a promising avenue offuture research.

TALK AND ACTION: WHAT INDIVIDUAL INVESTORS SAY AND WHAT THEY DO 473
Appendix A. Questionnaire Design

474 DANIEL DORN AND GUR HUBERMAN
Appendix B. Experience and Perceived Knowledge

TALK AND ACTION: WHAT INDIVIDUAL INVESTORS SAY AND WHAT THEY DO 475
Appendix C. Actual Knowledge

476 DANIEL DORN AND GUR HUBERMAN
Appendix D. Risk Assessment

TALK AND ACTION: WHAT INDIVIDUAL INVESTORS SAY AND WHAT THEY DO 477
Appendix E. Allocation of Total Wealth

478 DANIEL DORN AND GUR HUBERMAN
Appendix F. Demographic and Socio-economic Characteristics
6. Personal questions
Kindly answer a few questions regarding yourself.
1 Your gender?� female
� male
2 Your age? _ _ years old
3 Marital status?
� single
� married
� divorced
� widowed
4Do you have children (ifyes, how many)?
� no children _ _ children (please enter number)
5To which job category doyou belong?
� Retired
� Housewife/ -man
� Student
� Blue-collar
� White-collar
� Self-employed
� Civil servant
� Other _________________________
6What is your level ofeducation or degree?
� Apprenticeship
� Advanced vocational degree
� College or University degree
� Other degree
� Other: _________________________
7What is your averagegross annual income?
� No income
� up to DM 50.000,-
� DM 50.000,- to DM 75.000,-
� DM 75.000,- to DM 100.000,-
� DM 100.000,- to DM 150.000,-
� DM 150.000,- to DM 200.000,-
� greater than DM 200.000,-

TALK AND ACTION: WHAT INDIVIDUAL INVESTORS SAY AND WHAT THEY DO 479
References
Agnew, J., Balduzzi, P., and Sundén, A. (2003) Portfolio choice and trading in a large 401(K) plan,American Economic Review 93(1), 193–215.
Barber, B. and Odean, T. (2000) Trading is hazardous to your wealth: The common stock investmentperformance of individual investors, Journal of Finance 55(2), 773–806.
Barber, B. and Odean, T. (2001) Boys will be boys: Gender, overconfidence, and common stockinvestment, Quarterly Journal of Economics 116(1), 261–292.
Barber, B. and Odean, T. (2002) Online investors: Do the slow die first?, Review of Financial Studies15(2), 455–487.
Barsky, R. B., Juster, F. T., Kimball, M. S., and Shapiro, M. D. (1997) Preference parameters andbehavioral heterogeneity: An experimental approach in the health and retirement study, QuarterlyJournal of Economics 112(2), 537–579.
Benartzi, S. (2001) Excessive extrapolation and the allocation of 401(k) accounts to company stock,Journal of Finance 56(5), 1747–1764.
Benos, A. (1998) Aggressiveness and survival of overconfident traders, Journal of Financial Markets1(3–4), 353–83.
Bertrand, M. and Mullainathan, S. (2001) Do people mean what they say? Implications for subjectivesurvey data, American Economic Review 91(2), 67–72.
Biais, B., Hilton, D., Mazurier, K., and Pouget, S. (2005) Judgmental overconfidence, self-monitoringand trading performance in an experimental financial market, Review of Economic Studies 72(2),287–312.
Blume, M. E. and Friend, I. (1975) The asset structure of individual portfolios with some implicationsfor utility functions, Journal of Finance 30(2), 585–603.
Börsch-Supan, A. and Eymannm, A. (2000) Household portfolios in Germany, working paper,University of Mannheim.
Campbell, J. Y. (2003) Discussion of “perspectives on behavioral finance: Does irrationalitydisappear with wealth?”, NBER Macroeconomics Annual 2003.
Coval, J. D. and Moskowitz, T. J. (1999) Home bias at home: Local equity preference in domesticportfolios, Journal of Finance 54(6), 145–166.
Cronbach, L. J. (1951) Coefficient alpha and the internal structure of tests, Psychometrika 16, 297–334.
Daniel, K. D., Hirshleifer, D., and Subrahmanyam, A. (1998) Investor psychology and securitymarket under- and over-reactions, Journal of Finance 53(6), 1839–1886.
Deaves, R., Lüders, E., and Luo, G. Y. (2003) An experimental test of the impact of overconfidenceand gender on trading activity, working paper.
Deutsche Bundesbank (1999) Zur Entwicklung der privaten Vermögenssituation seit Beginn derneunziger Jahre, (The evolution of private household wealth since the beginning of the 90s),Monatsbericht.
Deutsches Aktieninstitut (2000) Factbook 1999, Frankfurt am Main.Deutsches Aktieninstitut (2003) Factbook 2002, Frankfurt am Main.Gervais, S. and Odean, T. (2001) Learning to be overconfident, Review of Financial Studies 14(1),
1–27.Glaser, M. and Weber, M. (2004) Overconfidence and trading volume, working paper, University of
Mannheim.Goetzmann, W. N. and Kumar, A. (2002) Equity portfolio diversification, working paper, Yale
International Center for Finance.Gorton, G. B. and Pennacchi, G. G. (1993) Security baskets and index-linked securities, Journal of
Business 66(1), 1–27.Graham, J. R., Harvey, C. R., and Huang, H. (2004) Investor competence, trading frequency, and
home bias, working paper, Duke University.

480 DANIEL DORN AND GUR HUBERMAN
Griffin, J. M., Harris, J., and Topaloglu, S. (2003) Investor behavior over the rise and fall of nasdaq,working paper.
Grinblatt, M. and Keloharju, M. (2001) How distance, language and culture influence stockholdingsand trades, Journal of Finance 56(3), 1053–1073.
Grossman, S. (1976) On the efficiency of competitive stock markets where trades have diverseinformation, Journal of Finance 31(2), 573–585.
Guiso, L., Sapienza, P., and Zingales, L. (2005) Trusting the stock market, working paper.Haliassos, M. and Bertaut, C. (1995) Why do so few hold stocks?, Economic Journal 105, 1110–
1129.Heckman, J. J. (1979) Sample selection bias as a specification error, Econometrica 47(1), 153–162.Huberman, G. (2001) Familiarity breeds investment, Review of Financial Studies 14(3), 659–680.Huberman, G. and Sengmüller, P. (2004) Performance and employer stock in 401(K) plans, Review
of Finance 8(3), 403–443.ICI and SIA (1999) Equity ownership in America, Investment Company Institute and the Securities
Industry Association.Kapteyn, A. and Teppa, F. (2002) Subjective measures of risk aversion and portfolio choice, Rand
working paper.Kroll, Y. and Levy, H. (1992) Further tests of the separation theorem and the capital asset pricing
model, American Economic Review 82(3), 664–670.Kroll, Y., Levy, H., and Rapoport, A. (1988) Experimental tests of the separation theorem and the
capital asset pricing model, American Economic Review 78(3), 500–519.Langer, E. J. (1975) The illusion of control, Journal of Personality and Social Psychology 32, 311–
328.Massa, M. and Simonov, A. (2005) Behavioral biases and investment, Review of Finance 9(4), 483–
507.Milgrom, P. and Stokey, N. (1982) Information, trade and common knowledge, Journal of Economic
Theory 26(1), 17–27.Miller, D. T. and Ross, M. (1975) Self-serving bias in attribution of causality: Fact or fiction?,
Psychological Bulletin 82, 213–225.Münnich, M. (2001) Einkommens- und Geldvermögensverteilung privater Haushalte in Deutschland,
(The distribution of income and financial wealth of private households in Germany), Wirtschaftund Statistik 2, 121–137.
NYSE (2001) U.S. shareholders and online trading, New York Stock Exchange, Inc.Odean, T. (1998) Volume, volatility, price and profit when all traders are above average, Journal of
Finance 53(6), 1887–1934.Samuelson, W. and Zeckhauser, R. (1988) Status-quo bias in decision making, Journal of Risk and
Uncertainty 1, 7–59.Siebenmorgen, N. and Weber, M. (2001) A behavioral model for asset allocation, working paper,
University of Mannheim.Subrahmanyam, A. (1991) A theory of trading in stock index futures, Review of Financial Studies
4(1), 17–51.Svenson, O. (1981) Are we all less risky and more skillful than our fellow drivers?, Acta Psychologica
47, 143–148.Thaler, R. and Johnson, E. J. (1990) Gambling with the house money and trying to break even: The
effects of prior outcomes on risky choice, Management Science 36, 643–660.Tirole, J. (1982) On the possibility of speculation under rational expectations, Econometrica 50(5),
1163–1182.Van Steenis, H. and Ossig, C. (2000) European online investor, JP Morgan Equity Research Report.Varian, H. R. (1989) Differences of opinion in financial markets, in Financial Risk: Theory, Evid-
ence and Implications. Proceedings of the Eleventh Annual Economic Policy Conference of theFederal Reserve Bank of St. Louis, Boston.

TALK AND ACTION: WHAT INDIVIDUAL INVESTORS SAY AND WHAT THEY DO 481
Vissing-Jørgensen, A. (2002) Toward an explanation of household portfolio choice heterogeneity:Nonfinancial income and participation cost structures, working paper, University of Chicago.
Vissing-Jørgensen, A. (2003) Perspectives on behavioral finance: Does “irrationality” disappear withwealth? Evidence from expectations and actions, in M. Gertler and K. Rogoff (eds.), NBERMacro Annual, The MIT Press, Cambridge Mass.
Weber, E. U., Blais, A.-R., and Betz, N. E. (2002) A domain-specific risk-attitude scale: Measuringrisk perceptions and risk behavior, Journal of Behavioral Decision Making 15, 263–290.
White, H. (1980) A heteroskedasticity-consistent covariance estimator and direct test for heteroske-dasticity, Econometrica 48, 817–838.
Zhu, N. (2002) The local bias of individual investors, working paper, Yale University.