
Taking Stock: Conducted by: secondary opportunities and ... · secondary opportunities and the...
12
Taking Stock: secondary opportunities and the agile future Conducted by: Supported by: An academic research survey conducted by Northumbria University Published August 2015
Transcript of Taking Stock: Conducted by: secondary opportunities and ... · secondary opportunities and the...
Taking Stock:secondary opportunities and the agile future
Conducted by:
Supported by:
An academic research survey conducted by Northumbria UniversityPublished August 2015

Executive SummaryThis research studied 27 towns and cities across England, Wales and Scotland.
21st Century businesses are agile. Tenants want less space, more from it and on their own terms.
34% of vacant secondary stock was built in the pre-war period while 37% was built during the 1960’s and 1970’s. Both eras of construction offer opportunities for the new economy.
Agile tenants have voted with their feet. Over 29m sq ft of offices are lying empty. Around 26 ½ m sq ft or 90% of the vacant office stock is in the secondary market. This could be the tip of the iceberg.
Geographical analysis indicates that secondary office property can be a niche investment class, part of a mix of office types or a disruptive alternative to traditional office development.
Landlords could miss out on £4.8bn of profit over the next 10 years. Landlords are loosing nearly £325m of losses on rent alone per year and are paying almost £170m in holding costs.
The world of work has changed
A new lease of life for secondary stock
Vacancy shockwave
The geography of resilience
£4.8bn office timebomb
Everyone is talking about the shortfall in prime office property and the urgent need to create new business space, but no one is discussing how the secondary office market can help to plug this shortfall, or the quality, value and variety of this stock.
When I came across some initial research by academics at Northumbria University, I was intrigued, and I wanted to know more. I was shocked to learn that the UK has vacant office space equalling double the total stock in Leeds, and as a result, landlords are likely to lose over £4.8bn in rent over the next ten years. Concerning me the most was the lack of awareness around the problem and the impact it has on business and the economy.
This ‘Office Timebomb’ really hit home and we supported the independent experts at Northumbria University to delve deeper into the issue. This research document is the first of what will be quarterly reports into this secondary office market and the huge threats and opportunities this brings.
Other factors we must consider with this research include business rates and empty property rate avoidance. Also, changes to permitted development rights for office to residential conversion is one of the single biggest threats to office provision. To accommodate the UK’s thriving businesses the secondary office market will become increasingly integral.
It makes truly compelling reading. The enlightened building owners who grasp the challenge of the agile future and the opportunity that secondary property presents, could benefit hugely.
Steve Jude, Chief Executive Officer, Citibase plc
£4.8bn

Commercial office stock in the Northumbria University database
SecondaryMarket
PrimeMarket
7
Aberdeen
Glasgow
Newcastle &Gateshead
Leeds
ManchesterLiverpool
Nottingham
Leicester
Cardiff
Exeter
Plymouth
Portsmouth
Southampton
Guildford
Croydon
Chelmsford
Ipswich
Cambridge
Reading
Oxford
Bath & NorthEast Somerset
Type No. of properties
Floorspace (m2)
Floorspace (Sqft)
Rateable Value(£)
Retail 560,150 118,151,000 1,271,304,760 £17,488,000,000
Office 355,990 9,272,000 99,766,720 £14,092,000,000
Industrial 450,910 323,101,000 3,476,566,760 £11,786,000,000
TOTAL 1,367,050 450,524,000 4,847,638,240 £43,366,000,000
Traditional assessments of the office market focus on estimates of take up and absorption, concentrating on the prime market. However, these studies rarely ground their findings in an appraisal of overall stock. In response, for the first time we present a representation of all vacant office stock.
We reveal an 18% average vacancy rate.
Astonishingly, the real rate could be double this figure if grey space is taken into account. Grey space describes those office properties that are leased but surplus to requirements and likely account for a further 20% of stock.
Milton Keynes
Hemel Hempstead
Windsor & Maidenhead
Luton
Watford
Welwyn & Hatfield
Locations surveyed in this study

SWO
T
Secondary Swot Analysis
STRENGTHS• Lots of it (which means there is discriminatory choice)
• Often have good accessibility/proximity to transport networks
• Often in prestigious locations
• Convenient proximity to service and social amenities
• Lots of the these buildings have identity recognition
• Often have better parking provision associated with historical infrastructure
WEAKNESSES• Market overhang (which means lots of availability)
• Loss of rent and holding cost (opportunity to reverse and maximise)
• Perception of functional redundancy (counteracted by the emergence of new technology such as WIFI and flexible working practices)
• Perception of economic redundancy (the potential buoyant rental levels in central locations counteract this situation)
OPPORTUNITIES• To change a negative story into a positive
future (instead of Empty Property Rates [EPR] avoidance promote a climate of new business entrepreneurialism)
• Transformation (within and across use)
• There has been a revalorisation of commercial office space. Tenants want less of it and more from what they get.
• The agile tenant is small, creative and flexible and want office space that reflects their cultural taste and status
THREATS• Write down of property book value
(Stranded assets trapped in inertia)
• Empty property rates
• 2018 Minimum Energy Performance Standard (MEPS) legislation
• 2017 statutory valuation exercise uncertainty. This could be both positive and negative. In prime areas high property values are likely to be locked in. However, elsewhere the value of secondary assets are likely to fall (the last valuation exercise took place at the top of the market in 2008). This will make secondary assets more attractive as business rates will fall for tenants (and empty property rates for landlords)
The secondary office market is often overlooked and seen as the Cinderella of the property market. Perceptions of weaknesses and threats are often used to justify new office development.
However, the genuine strengths and exciting opportunities that these office properties present often outweigh this pessimism. The purpose of this report is to illustrate this situation.
Changing Business Practices:The world of work has changed forever
The old way The new way
inflexible agilespacious fast turnaround
good locationflexibleover specified
over resourced
expensiveleases
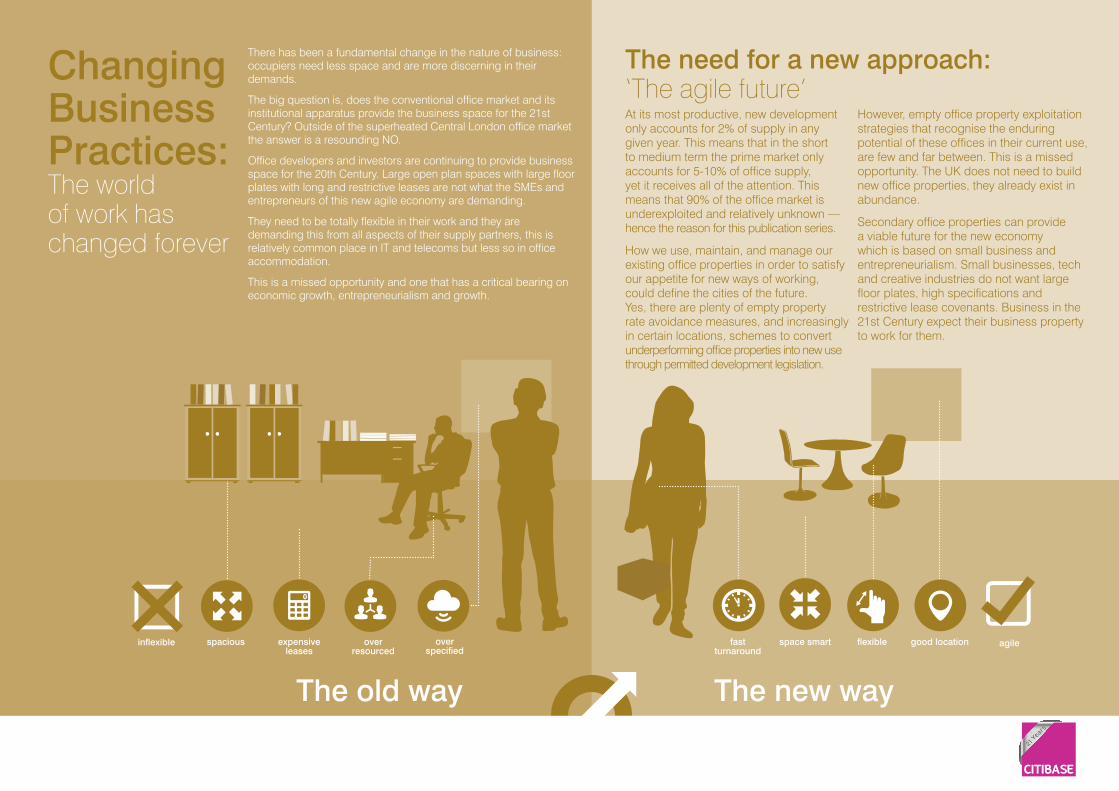
There has been a fundamental change in the nature of business: occupiers need less space and are more discerning in their demands.
The big question is, does the conventional office market and its institutional apparatus provide the business space for the 21st Century? Outside of the superheated Central London office market the answer is a resounding NO.
Office developers and investors are continuing to provide business space for the 20th Century. Large open plan spaces with large floor plates with long and restrictive leases are not what the SMEs and entrepreneurs of this new agile economy are demanding.
They need to be totally flexible in their work and they are demanding this from all aspects of their supply partners, this is relatively common place in IT and telecoms but less so in office accommodation.
This is a missed opportunity and one that has a critical bearing on economic growth, entrepreneurialism and growth.
The need for a new approach: ‘The agile future’ At its most productive, new development only accounts for 2% of supply in any given year. This means that in the short to medium term the prime market only accounts for 5-10% of office supply, yet it receives all of the attention. This means that 90% of the office market is underexploited and relatively unknown — hence the reason for this publication series.
How we use, maintain, and manage our existing office properties in order to satisfy our appetite for new ways of working, could define the cities of the future. Yes, there are plenty of empty property rate avoidance measures, and increasingly in certain locations, schemes to convert underperforming office properties into new use through permitted development legislation.
However, empty office property exploitation strategies that recognise the enduring potential of these offices in their current use, are few and far between. This is a missed opportunity. The UK does not need to build new office properties, they already exist in abundance.
Secondary office properties can provide a viable future for the new economy which is based on small business and entrepreneurialism. Small businesses, tech and creative industries do not want large floor plates, high specifications and restrictive lease covenants. Business in the 21st Century expect their business property to work for them.
space smart
Whole Market m2
Whole Market Sqft
RateableValue
Vacancy Rate %
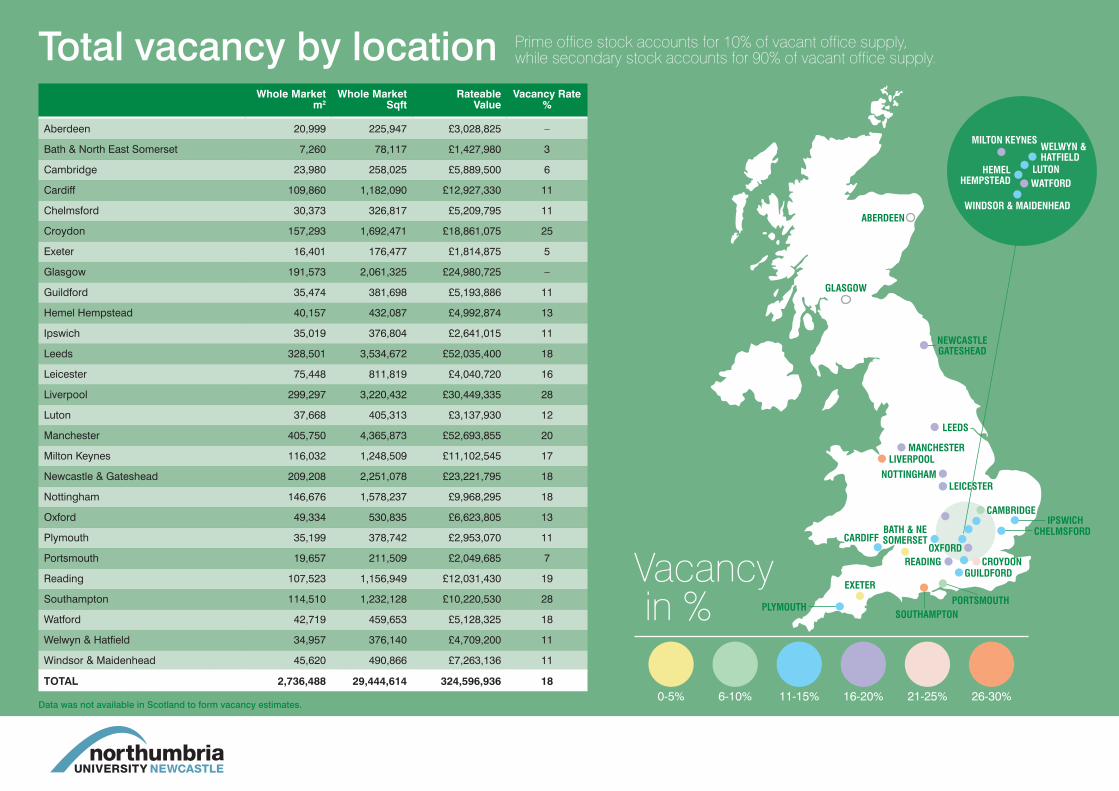
Aberdeen 20,999 225,947 £3,028,825 –
Bath & North East Somerset 7,260 78,117 £1,427,980 3
Cambridge 23,980 258,025 £5,889,500 6
Cardiff 109,860 1,182,090 £12,927,330 11
Chelmsford 30,373 326,817 £5,209,795 11
Croydon 157,293 1,692,471 £18,861,075 25
Exeter 16,401 176,477 £1,814,875 5
Glasgow 191,573 2,061,325 £24,980,725 –
Guildford 35,474 381,698 £5,193,886 11
Hemel Hempstead 40,157 432,087 £4,992,874 13
Ipswich 35,019 376,804 £2,641,015 11
Leeds 328,501 3,534,672 £52,035,400 18
Leicester 75,448 811,819 £4,040,720 16
Liverpool 299,297 3,220,432 £30,449,335 28
Luton 37,668 405,313 £3,137,930 12
Manchester 405,750 4,365,873 £52,693,855 20
Milton Keynes 116,032 1,248,509 £11,102,545 17
Newcastle & Gateshead 209,208 2,251,078 £23,221,795 18
Nottingham 146,676 1,578,237 £9,968,295 18
Oxford 49,334 530,835 £6,623,805 13
Plymouth 35,199 378,742 £2,953,070 11
Portsmouth 19,657 211,509 £2,049,685 7
Reading 107,523 1,156,949 £12,031,430 19
Southampton 114,510 1,232,128 £10,220,530 28
Watford 42,719 459,653 £5,128,325 18
Welwyn & Hatfield 34,957 376,140 £4,709,200 11
Windsor & Maidenhead 45,620 490,866 £7,263,136 11
TOTAL 2,736,488 29,444,614 324,596,936 186-10% 11-15% 16-20% 21-25%0-5% 26-30%
Total vacancy by location Prime office stock accounts for 10% of vacant office supply, while secondary stock accounts for 90% of vacant office supply.
MANCHESTER
NEWCASTLE GATESHEAD
MILTON KEYNES
LUTON
WELWYN & HATFIELD
HEMEL HEMPSTEAD WATFORD
WINDSOR & MAIDENHEADABERDEEN
GLASGOW
LEEDS
LIVERPOOL
CARDIFFBATH & NE SOMERSET
SOUTHAMPTONPLYMOUTH
EXETER
PORTSMOUTH
GUILDFORDCROYDONREADING
CHELMSFORD
CAMBRIDGE
OXFORD
NOTTINGHAMLEICESTER
IPSWICH
Vacancy in %
Data was not available in Scotland to form vacancy estimates.

PRIMARY MARKET SECONDARY MARKET
m2 Sqft m2 Sqft
Aberdeen 2,017 21,705 18,982 204,241
Bath & North East Somerset 716 7,704 6,544 70,413
Cambridge – 0 23,980 258,025
Cardiff 11,549 124,266 98,311 1,057,824
Chelmsford 628 6,757 29,745 320,060
Croydon – 0 157,293 1,692,471
Exeter 846 9,099 15,556 167,377
Glasgow 29,802 320,670 161,771 1,740,656
Guildford 1,008 10,841 34,466 370,857
Hemel Hempstead 7,572 81,473 32,585 350,615
Ipswich 194 2,087 34,825 374,717
Leeds 55,985 602,403 272,516 2,932,269
Leicester 4,105 44,173 71,343 767,646
Liverpool 20,893 224,805 278,404 2,995,627
Luton 1,942 20,893 35,727 384,419
Manchester 44,644 480,373 361,106 3,885,500
Milton Keynes 13,656 146,944 102,376 1,101,565
Newcastle & Gateshead 21,033 226,315 188,175 2,024,763
Nottingham 5,576 59,992 141,101 1,518,245
Oxford 1,881 20,241 47,453 510,594
Plymouth 4,474 48,140 30,725 330,602
Portsmouth 4,122 44,353 15,535 167,157
Reading 20,042 215,654 87,481 941,295
Southampton 6,847 73,674 107,663 1,158,454
Watford 7,381 79,416 35,338 380,237
Welwyn & Hatfield 1,677 18,047 33,280 358,093
Windsor & Maidenhead 11,222 120,751 34,397 370,116
TOTAL 279,812 3,010,776 2,456,676 26,433,837
Our findings indicate that there is a clear divide between the prime and secondary office market.
Primary and secondary market vacancy
25% 50% 75% 100%
ABERDEE
N
BATH
& N
ORTH
EAS
T SO
MER
SET
CAM
BRID
GE
CARD
IFF
CHEL
MSF
ORDCROYDONEXETER
GLASGOWGUILDFORD
HEMEL HEMPSTEADIPSWICH
LEEDS
LEICESTER
LIVERPPOOL
LUTON
MANCHESTE
R
MILT
ON K
EYNE
S
NEW
CAST
LE &
GAT
ESHE
AD
NOTT
INGH
AM
OXFORD
PLYMOUTH
PORTSMOUTH
READING
SOUTHAMPTON
WATFORD
WELWYN & HATFIELD
WINDSOR & MAIDENHEAD
SECONDARY MARKET VACANCY26.4m sqft
90%
Secondary Market
% SPLIT OF TOTAL VACANCY’
Primary Market
Vacancy levels by
floorspace

Aber
deen
Bath
& N
orth
E
ast S
omer
set
Cam
brid
ge
Card
iff
Chel
msf
ord
Croy
don
Exet
er
Glas
gow
Guild
ford
Hem
el
Hem
pste
ad
Ipsw
ich
Leed
s
Leic
este
r
Live
rpoo
l
Luto
n
Man
ches
ter
Milt
on K
eyne
s
New
cast
le &
G
ates
head
Notti
ngha
m
Oxfo
rd
Plym
outh
Port
smou
th
Read
ing
Sout
ham
pton
Wat
ford
Welw
yn &
Hat
field
Win
dsor
&
Mai
denh
ead
TOTALOverall Market
£324,596,936 per year
TOTALSecondary Office
£273,134,952 per year
10
20
30
0
40
10
50
20
30
60
MIL
LIO
NS
£M
ILLI
ON
S £
Rent loss and holding costsRent landlords are missing out on per year
Holding cost per year1+1+3+6+3+9+1+12+3+2+1+25+2+15+2+26+5+11+5+3+1+1+6+5+3+2+41+1+3+5+2+9+1+10+2+2+1+18+2+14+2+22+5+10+5+3+1+1+4+4+2+2+3Whole Market
KEY
Secondary Market
Prime Market
KEY
Secondary Market

Aber
deen
Bath
& N
orth
E
ast S
omer
set
Cam
brid
ge
Card
iff
Chel
msf
ord
Croy
don
Exet
er
Glas
gow
Guild
ford
Hem
el
Hem
pste
ad
Ipsw
ich
Leed
s
Leic
este
r
Live
rpoo
l
Luto
n
Man
ches
ter
Milt
on K
eyne
s
New
cast
le &
G
ates
head
Notti
ngha
m
Oxfo
rd
Plym
outh
Port
smou
th
Read
ing
Sout
ham
pton
Wat
ford
Welw
yn &
Hat
field
Win
dsor
&
Mai
denh
ead
Compound Loss
The £4.8bn office timebomb
Compound Loss Per Year (Whole market)
Compound Loss Per Year (Secondary market)
Aberdeen £4,512,949 £4,000,836
Bath & North East Somerset
£2,127,690 £2,001,413
Cambridge £8,775,355 £8,775,355
Cardiff £19,158,303 £16,469,499
Chelmsford £7,762,595 £7,295,852
Croydon £28,103,002 £28,103,002
Exeter £2,704,164 £2,525,811
Glasgow £37,221,280 £29,074,407
Guildford £7,738,890 £6,930,565
Hemel Hempstead £7,439,382 £6,127,804
Ipswich £3,935,112 £3,905,163
Leeds £77,532,746 £54,690,972
Leicester £6,020,673 £5,239,242
Liverpool £45,369,509 £41,396,908
Luton £4,675,516 £4,584,477
Manchester £78,513,844 £66,873,621
Milton Keynes £16,542,792 £14,353,833
Newcastle & Gateshead £34,600,475 £29,456,548
Nottingham £14,852,760 £14,042,945
Oxford £9,869,469 £9,815,606
Plymouth £4,400,074 £3,536,955
Portsmouth £3,054,031 £2,035,914
Reading £17,926,831 £13,107,873
Southampton £15,228,590 £13,910,312
Watford £7,641,204 £5,868,142
Welwyn & Hatfield £7,016,708 £5,067,043
Windsor & Maidenhead £10,822,073 £7,780,983
TOTAL £483,546,016 £406,971,078
Our research has revealed that taking the 27 towns and cities in the study, landlords could miss out on an astonishing £4.8bn in potential earnings and savings over a 10 year period.
In the secondary market alone this figure is an eye-watering £4.1bn.
£4.8bn landlord loss over 10 years
for the whole market
£4.1bn landlord loss over 10 years for the secondary market
Compound loss is an estimation of the total cost of vacancy based upon combined rental loss and holding cost payments.

Secondary office property has the potential to challenge its Cinderella status in a variety of ways. The following regional segmentation demonstrates these opportunities. This segmentation is broad and the authors recognise that there will be considerable inter and intra regional variation due to the relative conditions in each location.
Furthermore, it is highly likely, especially outside of Central London, that each location will contain a variety of all three scenarios. However, regardless of the variable characteristics of location, the message is out: occupiers want flexibility and secondary office property is waiting to be exploited in all three types of location.
Redundant locations: Typically redundant locations do not have the rental levels to support capital expenditure or the presence of economic demand to justify a conventional commercial building strategy. Nevertheless, these locations have a rapidly degrading commercial office stock which demands attention. These locations are attractive to business start-ups and those looking for low rental levels and flexibility and therefore demand office building solutions which account for these business trajectories.
Stranded locations: These locations (like Cardiff or secondary areas of regional cores like Leeds) do not have rental levels sufficient to justify the development of prime office supply or the refurbishment of secondary property into contemporary specification in the conventional sense (they may also not have the available space to construct new property).
However, these areas still have demonstrable economic potential (these locations are also suffering the impact of conversion into alternative use) and must make the most of their existing property assets which mostly fall into the secondary asset category through creative re-use measures and disruptive innovation.
Premium locations: Central London and elements of the regional cores: Such areas have buoyant rental markets and are even beginning to see the benefit of secondary property as an investment class, even creating speculative ‘shabby chic’ and so called ‘foundspace’. These areas report very low supplies of prime office supply and a lot of secondary has been lost to other uses through conversion.
Our findings indicate that some of these areas still have significant quantities of underutilised secondary properties which could be brought forward/repurposed to fill the deficit in property supply. For example the top three cities for secondary vacancy in our survey – Manchester, Liverpool and Leeds – alone had over 9.8m sq ft of empty secondary office space.
Building types: opportunities and challenges 34% of these properties were built before
the war and offer an enticing opportunity
for the agile businesses of the future. These
properties are often located in prominent
locations with buoyant rental levels and a
transferable identity based on rich cultural
history. Often these opportunities exist in
close proximity to transport infrastructure
and public transport networks and have great
walkability to a host of nearby amenities.
Towns and cities in the UK are crying out
for new office property to accommodate the
resurgent economy. Encouragingly, with
narrow floor plates, good access to light and
accessible servicing arrangements, these
buildings can be turned around for the new
economy with relative ease.
37% of properties were built during the
1960’s and 1970’s. Although these properties
can suffer from aggressive exteriors and
a degree of aesthetic stigma, they share
many of the same positive characteristics as
those built in the post war period in terms
of buoyant rental levels, accessibility and
proximity to amenities. Although suffering
from a certain degree of ‘Ugly Betty’
syndrome, many of these buildings have the
capacity to be reinvigorated through creative
transformation.
Building era:
PREMIUM
STRANDED
REDUNDANT

KEY 2000+ 1990s 1980s 1960/70 Post War Pre WarA new lease of life for secondary office properties
Bath & North East Somerset Cambridge Cardiff Chelmsford Croydon Exeter
Guildford Hemel Hempstead Ipswich Leeds Leicester Liverpool
Luton Manchester Milton Keynes Newcastle & Gateshead Nottingham Oxford Plymouth
Portsmouth Reading Southampton Watford Windsor & Maidenhead
Aberdeen
Glasgow
Welwyn & Hatfield

Conducted by:
About Citibase
Citibase offers fully serviced business centres for cost–conscious SMEs in over 40 locations nationwide.
Their unique disruptive business model brings together both clients and customers. Over the last 21 years they have been commissioned by some of the largest and smallest names in the UK property market to help execute a plan for their under-utilised office space.
They provide solutions to property owners, by taking over the management of the building, allowing building owners to generate a cash income from secondary office space with minimum stress whilst providing SME customers with cost–effective office solutions.
Citibase also offers building owners who have short-term voids a smart way of enjoying the hassle-free cash which only Citibase can generate by launching one of their unique pop–up business centres. It’s easy–in and easy–out, and Citibase will manage the entire process.
Citibase concentrates on town and city centre locations and offers their customers over 1 million sq. ft. under management. Founded in 1993, the business has at its heart the ‘Freedom at Work’ philosophy; a deep-routed commitment to support and nurture cost-conscious SMEs whether they are setting out for the first time or taking bigger steps on the path to growth. Being in a Citibase centre gives SMEs the independence to be freed from expensive rents and rates, inflexible terms, service charges, hidden costs and corporate restrictions. By taking the stress of running a building off business’s hands, Citibase allows SMEs to focus on growing a successful business.
Want to know more? Request an exploratory conversation with Steve Jude, Chief Executive Officer, email [email protected]
For more information on Citibase visit www.citibase.com
About R3Intelligence, Northumbria University
R3Intelligence is dedicated to supplying high quality impartial commercial real estate research and advice. Our multi–disciplinary team offers services and expertise for investors, landlords, businesses and organisations who want to understand how commercial real estate can work more efficiently for them. We are a team of industry specialists and academics based at a UK university offering commercial consultancy and contract research.
We offer clients commercial real estate exploitation strategies, commercial property market intelligence and spatial analysis and modelling services. In other words we have the advice and the evidence to back it up. Our expertise is in the following areas:
• Physical appraisal and value engineering in relation to the refurbishment, repositioning and conversion into alternative use of commercial real estate assets
• Commercial real estate asset stock picking
• Surplus commercial floor space planning
• Empty property rates strategies
• Employment land and premises assessments
• Land and property use planning
• Economic development and inward investment strategies
• Monitoring and simulation of contemporary methods of urban finance such as Business Rates Retention, Tax Increment Financing, Enterprise Zones, Accelerated Development Zones and Business Improvement Districts
Interested in getting your commercial property working better for you? Request an exploratory meeting with either Dr Paul Greenhagh or Kevin Muldoon-Smith
Dr Paul Greenhalgh, R3Intelligence Lead, Tel: 0191 227 4593, [email protected]
Kevin Muldoon-Smith, R3Intelligence Consultant, Tel: 07739 321643 [email protected]
www.R3Intelligence.co.uk
Supported by:


![GOVERNMENT OF PUDUCHERRY€¦ · Bachelor of Physiotherapy [B.P.T.)] one of the subject courses must have passed H.Sc. (Academic) examination conducted by the Board of Higher Secondary](https://static.fdocuments.net/doc/165x107/60185143c93cce14a3726c62/government-of-puducherry-bachelor-of-physiotherapy-bpt-one-of-the-subject.jpg)


