Taking into account sustainable development for MENA ... · Taking into account sustainable...
20
Topics in Middle Eastern and African Economies Vol. 17, Issue No. 2, May 2015 29 Taking into account sustainable development for MENA countries: The calculation of a modified HDI index Nathalie HILMI (Centre scientifique de Monaco) Alain SAFA (Université de Nice-Sophia-Antipolis) Nicolas PERIDY (Université de Toulon) Messaoud ZEMOURI (Université de Batna) Keywords: Modified HDI Index, Sustainable Development, MENA JEL Codes: O1, O4, O5 Abstract: GDP, a measure of economic welfare, may be supplemented with other measures of economic welfare and environmental sustainability. This article discusses alternative measures which have been proposed in the literature concerning pollution, which can be used to augment GDP as a measure of welfare to produce a better index. Introduction: The Gross Domestic Product (GDP) level and rate of economic growth remain the main symbols of success and progress, despite the importance of other major indicators for decision making such as unemployment, inflation or the major indices. GDP is a measure of economic growth. We can assume that developing countries seek growth while developed countries seek post-growth and intellectual development tools for thinking about sustainable development (economically efficient, socially equitable and ecologically sustainable). However, the countries of the MENA region should find measuring instruments that could show their comparative advantages in terms of well-being (tourism) or for potential foreign investors (FDI). Growth is not synonymous with development or progress, or even well-being (whether economic or social). So, GDP must be supplemented by other macroeconomic indicators. We consider that the concept of « sustainable development » captures the complexity of the reality in which we currently operate and helps to understand the challenges facing our society. Indeed, sustainable development seeks to establish conditions conducive to a healthy living environment (environmental dimension), a way of life that is physically, intellectually and morally satisfying (social dimension) and an adequate standard of living (economic dimension). Historically, sustainability concepts date back to Nordhaus and Tobin (1972), Zolotas (1981), and Osberg (1985). The "Compendium of Sustainable Development Indicator Initiatives" document more than 500 attempts to build a sustainable development indicator (Parris and Kates, 2003).
Transcript of Taking into account sustainable development for MENA ... · Taking into account sustainable...

Topics in Middle Eastern and African Economies Vol. 17, Issue No. 2, May 2015
29
Taking into account sustainable development for MENA countries:
The calculation of a modified HDI index
Nathalie HILMI (Centre scientifique de Monaco)
Alain SAFA (Université de Nice-Sophia-Antipolis)
Nicolas PERIDY (Université de Toulon)
Messaoud ZEMOURI (Université de Batna)
Keywords: Modified HDI Index, Sustainable Development, MENA
JEL Codes: O1, O4, O5
Abstract: GDP, a measure of economic welfare, may be supplemented with other measures
of economic welfare and environmental sustainability. This article discusses alternative
measures which have been proposed in the literature concerning pollution, which can be used
to augment GDP as a measure of welfare to produce a better index.
Introduction:
The Gross Domestic Product (GDP) level and rate of economic growth remain the main symbols of
success and progress, despite the importance of other major indicators for decision making such as
unemployment, inflation or the major indices.
GDP is a measure of economic growth. We can assume that developing countries seek growth while
developed countries seek post-growth and intellectual development tools for thinking about
sustainable development (economically efficient, socially equitable and ecologically sustainable).
However, the countries of the MENA region should find measuring instruments that could show their
comparative advantages in terms of well-being (tourism) or for potential foreign investors (FDI).
Growth is not synonymous with development or progress, or even well-being (whether economic or
social). So, GDP must be supplemented by other macroeconomic indicators. We consider that the
concept of « sustainable development » captures the complexity of the reality in which we currently
operate and helps to understand the challenges facing our society. Indeed, sustainable development
seeks to establish conditions conducive to a healthy living environment (environmental dimension), a
way of life that is physically, intellectually and morally satisfying (social dimension) and an adequate
standard of living (economic dimension). Historically, sustainability concepts date back to Nordhaus
and Tobin (1972), Zolotas (1981), and Osberg (1985). The "Compendium of Sustainable Development
Indicator Initiatives" document more than 500 attempts to build a sustainable development indicator
(Parris and Kates, 2003).

Topics in Middle Eastern and African Economies Vol. 17, Issue No. 2, May 2015
30
Following the Brundtland Report (1987), the central role of sustainable development indicators was
highlighted by the UNCED (United Nations Conference on Environment and Development) in Rio de
Janeiro in 1992 in Agenda 21, Chapter 40: "Develop and identify indicators of sustainable
development to improve the information available to decision-making at all levels". A new measure of
economic progress and social well-being would show that different factors contribute to the well-
being of a society and the achievement of sustainable development.
Because of the challenges due to globalization, the first objective was, as stated by the Secretary
General of the OECD Angel Gurria, "to measure how the world has become better." To implement
and generalize this statement signed by the UN and UNDP, the European Commission organized on
19 and 20 November 2007 in Brussels an international conference called "Beyond the GDP, during
which President José Manuel Durão Barroso defended the introduction of new indices to measure
current issues. These institutional meetings brought together many alternative indicators developed
worldwide to assess social and environmental well-being. Among these alternative synthetic
indicators, some consider social problems, other study inequality and poverty, economic and social
security or the ecological heritage of a country.
In a two-part plan, we will select in the first part the main alternative indicators to GDP. To do this, we
will see in the first step the synthetic and composite indicators of sustainable development, then in a
second step overall sustainable development indicators and finally, we will record the interactions
between the economy and the environment in economically and environmentally integrated
accounting. In the second part, we use the database of the United Nations (Statistical Yearbook),
World Bank and OECD to conduct an empirical study to include pollution in one important MENA
indicator, Human Development Index (HDI).
Part I: Selection of sustainable development indicators
I- Composite synthetic indicators of sustainable development
These are unique indicators obtained by aggregation of heterogeneous basic indicators representing the
different dimensions of sustainable development, such as GDP per capita, total greenhouse gas
emissions, renewable energy share in gross inland consumption, transport energy consumption and
GDP, resource productivity, index of abundance of common bird population, fish catches outside safe
biological limits, life expectancy in good health, risk of poverty rate after social transfers, employment
rate of older workers, and official development assistance.
A) UNDP Indicators
The HDI is a composite statistical index, created by the United Nations Program for Development
(UNDP) in 1990 to assess the level of human development in the world. The index was developed in
1990 by the Indian economist Amartya Sen and Pakistani economist Mahbub ul Haq. It aims to
evaluate the progress of developing countries. The HDI is based on three major criteria: life
expectancy at birth, level of education, and standard of living.
Used since the 1990s, the HDI combines three factors to assess the "capacity" of the residents in these
countries (their "capabilities" according to economist Amartya Sen):
Health and Longevity: life expectancy at birth

Topics in Middle Eastern and African Economies Vol. 17, Issue No. 2, May 2015
31
Knowledge: access to education, measured from the average years of schooling of adults (in
years) and the expected enrollment of children in school age (years) duration.
A decent standard of living: the real standard of living per capita calculated from the logarithm
of gross national income per capita in purchasing power parity (PPP).
The HDI ranks countries by averaging these three major indexes "normalized" (that is to say, reduced
to a scale of 0-1).
UNDP also publishes three other synthetic indicators:
First, from 1995, Gender (or sexual) Human Development Index (GDI), which corrects the
HDI.
Then, since 1995 the Indicator of Women Participation (IWP) in economic and political life,
which complements the previous index by averaging the rates of participation of women in
political or economic positions.
• The Human Poverty Index (HPI) is introduced since 1997. It is built on a principle other than the
"capabilities" of Amartya Sen. It reported shortages, deprivation or exclusion of a fundamental part of
the population, taking into account four factors: longevity, education, employment and living
standards. Two variants of calculations are distinguished:
• Variant 1 (HPI- 1) for economically developing countries
• Variant 2 (HPI- 2) for the economically developed countries.
B) EPI « Environmental Performance Index »and ESI « Environmental sustainability
Index » (Yale e and Columbia Universities)
The EPI and ESI, developed at the universities of Yale and Columbia, have mainly environmental
purposes and are designed with the objective to support decision making. EPI seeks to assess the
effectiveness of environmental policies of a country towards a given international or national
objective established by experts. Rather, the Environmental Sustainability Index (ESI) is a
barometer of long-term trajectory of the environment of a country. Built around the concept of
"sustainability", it reflects the past, present and future of a countries’ environment. It includes
values related to natural resources, pollution control and the degree of degradation of the
ecosystem. It also reports on current environmental policies and capacity of a society to curb
negative trends. The ESI is calculated from a list of 76 variables integrated in 21 intermediate
indicators. The 21 indicators include the quality of air and water, biodiversity, artificial territory,
stresses on ecosystems, waste, management of natural resources, environmental policy and so on.
However, for these two indices, the result is very dependent on the choice of basic indicators and
weightings applied to them. Other choices may lead to very different results. The principle of
aggregation is also a problem. Rank must also be interpreted with caution: many differences of
ranks between countries are low compared to imprecise data.
Topics in Middle Eastern and African Economies Vol. 17, Issue No. 2, May 2015
32
C) Social Health Index (Fordham Institute for Innovation in Social Policy)
The Index of Social Health (ISH) was developed in the United States by two researchers, Marc and
Marque-Luisa Miringoff. The ISH is a synthetic social index to complement GDP to assess the
economic and social progress. It is a kind of summary of the major social problems present in the
public debate in the United States in the 1990s. It is composed of sixteen social indicators which it
averages. This index includes criteria of health, education, unemployment, poverty and inequality,
accidents and various risks. ISH earned an international reputation in 1996, with the publication of a
major article in the Economic Review « Challenge » showing differences between curves of GDP and
the ISH in the United States, the first continuing to increase while the second plunged permanently
after years 1973 to 1975.
ISH provides an example of confrontation, often illustrated with graphics, between traditional
economic indicators from the national accounts (GDP, consumption ...) and various synthetic
indicators supposed to better approximate the development of "social health ", well- being or quality
of life.
D) Measurement of Economic Well-being (Nordhaus and Tobin, 1973)
In 1972, Yale economists William Nordhaus and James Tobin (1972) presented their measure of
economic welfare (MEW) as an alternative to gross GDP. MEW adjust the domestic production,
including an assessment of the value of leisure time and the amount of unpaid work in the economy,
which increases the value of the welfare compared to GDP. They also included the value of the
environmental damage caused by industrial production and consumption, which reduces the value of
the welfare compared to GDP. MEW can be considered as the precursor of subsequent attempts to
create a sophisticated index of sustainable development.
E) Index of Economic Well-being (Osberg and Sharpe)
Lars Osberg’s work (1985) on the "economic well-being" in Canada was done in the mid-80s, but it
was only in 1998 that a series for Canada was built in collaboration with Andrew Sharpe (1998), and
in 1999, a series for the United States (including a comparison with Canada). In 2000, Osberg and
Sharpe have international statistics for six OECD countries comparing, on the same graph, GDP
growth and their own synthetic index. This work has quickly become a global benchmark, and it was
cited in an OECD report published in 2008.
Osberg and Sharpe consider four components characterizing the well-being for the construction of an
indicator of economic well-being (IEW):
1. Consumption: Actual flow of per capita consumption, which includes consumption of market goods
and services, actual per capita flows of non-market goods and changes in the practice of leisure
services.
2. Wealth: Net accumulation in the company of productive resources stocks, including the net
accumulation of tangible property and housing stock, the net accumulation of human capital and
investment in Research & Development (R & D), environmental costs and the net change in the level
of external debt;

Topics in Middle Eastern and African Economies Vol. 17, Issue No. 2, May 2015
33
3. Gender: Income distribution, according to the Gini index of inequality, and the extent and impact of
poverty.
4. Economic Security: Economic security against unemployment, disease, insecurity of single parent
families and the elderly people.
Thanks to their indicator, we can compare trends in economic well-being in six OECD countries:
USA, UK, Canada, Australia, Norway and Sweden.
F) ISEW and Friends of Earth with the New Economic Foundation
1. The Index of Sustainable Economic Welfare
The Index of Sustainable Economic Welfare (ISEW) develops the MEW by better adjusting GDP by
taking into account a wider range of adverse effects of economic growth, and excluding the value of
public expenditures in defense.
This index is monetized and is primarily focused on environmental sustainability. The first
internationally cited version of the ISEW is in the book by Herman Daly and John Cobb (1989). But
the book published in 1994 by Clifford Cobb and John Cobb is a major landmark. The Daly-Cobb
Index of Sustainable Economic Welfare is a more comprehensive indicator of well- being, taking into
account not only the average consumer, but also the distribution and degradation of the environment.
After adjusting the consumption component in the index of the distributional inequality, the authors
incorporate several environmental measures, such as the depletion of non-renewable resources, loss of
agricultural land against soil erosion and urbanization, loss of wetlands, and the cost of air pollution
and water. They also include what they call "environmental damage in the long term", a figure that
tries to take into account these large-scale changes such as the effects of global warming and the
depletion of the ozone layer.
The main weakness of the ISEW is its reliance on only the information that is available in few
countries. For example, few developing countries have comprehensive data on the extent of pollution
in air and water.
2. Sustainable Well-being Index (Friends of the Earth)
A second example is provided by the index of sustainable welfare of Friends of the Earth. This
international NGO proposes since 2001, in cooperation with the New Economics Foundation (a "think
tank" that specializes in social reporting) and the Centre for Environmental Strategy at the University
of Sussex, his own ISEW index for the United Kingdom, including an online tool allowing everyone
to "create their own ISEW" in valuing other variables and so initiators can calculate an alternative
outcome of this "online survey". Methodologically, among the innovations that this index offers
compared to its predecessors, there are three revisions, relating to the treatment of income inequality,
damage assessment related to global warming, and the cost of the destruction of the ozone layer. By
his calculation, it is very close to the Genuine Progress Indicator.
G) Genuine Progress Indicator
It is an alternative indicator to GDP or HDI to attempt to measure the evolution of the real well-being
of a country.

Topics in Middle Eastern and African Economies Vol. 17, Issue No. 2, May 2015
34
While GDP measures only monetary economic activity, IPV:
• adds to GDP the estimated non-monetary economic activities, such as domestic work or volunteer
activities value;
• subtracts from the GDP the estimated value of lost natural resources (environmental damage,
destruction of non-renewable resources, and so on) and the value of social damages (unemployment,
crime, crime, delinquency, accidents, disease, inequality, etc.).
The Genuine Progress Indicator (GPI) is an extension of ISEW, which highlights the true and actual
progress of society and seeks primarily to monitor the well-being and sustainability of the economy.
The ISEW and GPI summarize the economic well-being thanks to a single digit with the same logic
that GDP summarizes economic output in a single figure. In addition to economic issues, social and
environmental considerations are included in monetary terms.
H) Non-monetary Variables Indicator: « dashboard of sustainable development »
There are few synthetic and known indicators with environmental component that do not use the
monetization of variables. That is why a recent and promising initiative should be mentioned: the
« dashboard of sustainable development » which is both a free software and an international database
for flexible use. This is not strictly speaking an indicator, but it is a tool allowing everyone to see lots
of data, to build dashboards, and eventually build national composite indicators by the variables.
This "dashboard" contains 46 indicators in three areas (environment, economy, and society) and one
hundred countries. There are for example the following indicators:
- Environment (13 indicators): water quality, air and soil, levels of toxic waste...
- Economy (15 indicators): GDP, investment, productivity, competitiveness, inflation, energy
consumption...
- Company (18 indicators): offenses, health, poverty, unemployment, education, governance, military
spending and cooperation....
The data for each indicator are available on a scale from 0 to 1000. The country with the highest
absolute value is assigned 1000 points and the country with the lowest absolute value is assigned 0
points. Between these extremes, a simple linear interpolation can compare the results by country.
Example 1- Sustainable Development Indicator (INSEE)
Indicators of sustainable development aim to inform all stakeholders (government, elected
officials, local authorities, businesses, NGOs, citizens ...) of developments in the economy of
society, pressures on the environment and to convince and encourage behavior change.
15 headline indicators, 35 additional indicators (second level) and four indicators of economic and
social context were selected to support the national strategy for sustainable development. These
indicators were selected by a committee according to the governance of the Grenelle of
environment.

Topics in Middle Eastern and African Economies Vol. 17, Issue No. 2, May 2015
35
Example 2- Sustainable Development Indicator (Eurostat)
The sustainable development indicators are used to monitor the European sustainable development
strategy in a report published by Eurostat every two years.
Key indicators: Among more than 100 indicators, eleven were identified as key indicators. They
are supposed to give an overall indication of the level of progress achieved by the EU towards
sustainable development in terms of objectives and targets defined in their strategy.
I) Better Life Index (OECD)
Since its creation in 1961, the GDP was the main indicator which the OECD has used to measure
and analyze economic and social progress. But it failed to capture many factors that affect people's
lives, such as security, leisure, income distribution and a clean environment. Is life really better?
How can we tell? What are the key ingredients to improving life? Is it a better education,
environment, health, housing, or working hours? Does progress mean the same thing to all persons
or in all countries and for all companies? Pioneering this emerging field of research, the OECD
has been working for nearly ten years to determine the best way to measure the progress of
societies - Beyond GDP - and to explore areas that impact people's lives. Today, the fruit of this
work is evident in the "Better Life Initiative" of the OECD (BLI).
In May 2011, the OECD released a new interactive index that will allow everyone to measure and
compare their own quality of life beyond the conventional statistics framework of Gross Domestic
Product. This tool is part of the "Better Life Initiative" of the OECD to measure well-being and
progress. The index allows citizens to compare their well-being in 34 countries based on 11
dimensions: housing, income, work, community, education, environment, governance, health,
subjective well-being, security, and balancing work and private life. This gives them the
possibility of granting a variable weight to each of these dimensions.
Ratios of social inequalities show the socio-economic gaps of the welfare acquired for all 11
subjects of the BLI. For each indicator, when the socio-economic distribution is available, the
ratios are calculated by dividing the greatest achievement between high and low socio-economic
statuses by the lowest performance between high and low socio-economic statuses.
In summary, though, this type of indicator has limitations as follows: It has simplified assumptions, a
limited number of basic indicators and subjective weighting, including investigations.
Also, the method used to make the data comparable (Method for Standardization) assumes a common
scale for indicators of different dimensions, resulting in a final indicator bounded with minimum and
maximum values. The method also has aggregation problems
Global indicators presented in Part II can overcome the problem of heterogeneity of the indicators and
their aggregation.

Topics in Middle Eastern and African Economies Vol. 17, Issue No. 2, May 2015
36
II- The global sustainable development indicators
A) Adjusted net savings (World Bank)
It measures the surplus of economic, human and natural resources available for the economy to offset
the depreciation of physical, human and natural capital.
Adjusted net savings ("genuine savings") is an indicator of the World Bank that seeks to highlight the
extra resources available to the economy after an annual cycle of production and consumption, once
the depreciation of economic, human and natural capital has been offset. Adjusted net savings is
calculated as gross savings (production minus consumption), taken from the national accounts, minus
the consumption of fixed capital (depreciation of economic capital), plus education expenditure
(consumption reclassified as investment in human capital), minus damages to natural assets
(depreciation of natural capital). In national accounts, gross saving includes household savings (not
consumed disposable income in the current period and which can be accumulated in the form of
financial or non-financial assets), corporate savings (retained profits) and government saving. The
concept of « adjusted net savings » goes beyond the accounting framework that is only interested in
productive capital; in this approach, human capital and natural capital are considered as heritage.
Environmental damage is assessed as the reduction of energy stocks, minerals and forests, which are
added to the damage caused by CO2 emissions. They are calculated with reference to a theoretical
model based on the pricing of exhaustible resources. Adjusted net savings is expressed as a percentage
of gross national income. The higher the index, the higher the country's ability to increase its assets
(broadly defined) is important. In this approach, we consider that the decrease of exhaustible natural
resources may be offset by increased investment in economic or human capital (through efforts
including training).
This indicator has the merit of coupling economic, human, and environmental issues. From a
theoretical point of view, we show that under certain assumptions the « adjusted net savings » is an
indicator of sustainability understood as "the ability to conserve wealth, or the possibilities for creating
well-being to future generations". « Adjusted net savings » also has the advantage of relying on the
concepts and figures derived from national accounts to calculate gross savings. In addition, the
opening of economies is not taken into account. Finally, being reduced to a simple measure of
spending on education, the approach of human and social capital remains very fragmented; so we
might wonder whether it would not be better to focus solely on the interactions between the economic
activity and the changing environment.
B) GDP per capita
First, the GDP records everything that has a monetary value and nothing else, without prejudging the
positive or negative contribution of this activity to well-being. Second, GDP, identifying the goods
and services produced and consumed, can only be a proxy for the well-being. Finally, the well-being
provided by non-monetized activities (typically free time) or work outside the commercial sphere
(domestic work) are, by definition, not taken into account. GDP was not designed to measure well-
being, but to describe the functioning of an economy with a consistent accounting model. However,
GDP per capita may retain some legitimacy as a synthetic indicator of well-being.GDP per capita is
the GDP divided by the population at midyear and GDP is calculated without deductions for
degradation of natural resources.

Topics in Middle Eastern and African Economies Vol. 17, Issue No. 2, May 2015
37
C) Green GDP
During the summit of Rio +20 in June 2012, the UN introduced a new indicator of wealth: the
Inclusive Wealth Index (IWI). The Green GDP is expected to integrate to the wealth of a country, in
addition to the classic GDP, its "natural capital", that is to say its ecological heritage, to measure the
sustainability of growth. The economist Jean Gadrey criticizes that IWI adds production flows (annual
GDP) and stocks of wealth (natural capital). These ecological capitals are considered as substitutable
but we can not measure them.
D) The ecological footprint, "carbon" footprint or CO2 budget
The ecological footprint is purely environmental. It is an indicator which measures the economic
pressures on the environment. It does not require an economic aggregate but uses equivalency
factors to measure the biological surface necessary for the survival of a given population. The
ecological footprint represents the surface of soil and oceans needed to provide the resources
consumed by a given population and to eliminate the waste and residues of this population.
Resource consumption can come from productive areas outside the territory occupied by this
population. The ecological deficit or credit of a country is the ratio between its ecological footprint
and biocapacity, defined as the productive area available in a country. This type of calculation used
to estimate whether the country is living beyond its means and needs to import resources from
abroad. This indicator was developed by Mathis Wackernagel (University of Vancouver, under the
responsibility of William Rees), who created the organization Global Footprint Network responsible
for its development.
It is a synthetic indicator. We can calculate the footprint of a population from one individual to that
of the planet.
Many reports have been produced, including the World Wide Fund for Nature or WWF. But their
effects are limited due to poor visibility of the problem in the public sphere; its negative impact on
daily life is not really affecting the dominant economic, political and media actors and the most
favored nations, even if their ecological footprint is yet by far the most important. Therefore, they may
still believe in the benefits of physical and indefinite growth. In addition, the ecological footprint is a
synthetic indicator, which reflects a small part of the consequences of climate change and ecosystem
degradation. The ecological footprint is limited because it illustrates very indirectly the importance of
the following consequences of global warming:
• The acceleration of global warming in recent years is directly related to anthropogenic greenhouse
gas emissions.
• The size of the global human catastrophes predictable beyond two degrees of warming: droughts,
floods and storms, rising sea levels, etc.
III- An integrated environmental and economic accounting: interaction between
economy and environment.
An ambitious accounting conceptual framework was established in the mid-1990s by the UN, the
European Commission, the IMF, the OECD and the World Bank. It resulted in the publication of a
Topics in Middle Eastern and African Economies Vol. 17, Issue No. 2, May 2015
38
joint book: the System of Integrated Environmental and Economic Accounting (SEEA), whose current
version dates from 2003. This system is annexed to the System of National Accounts and it brings
together economic and environmental information to better assess the contribution of the environment
to the economy and the impact of the economy on the environment. The SEEA includes four major
categories of accounts: material flows, spending for Environmental Protection, Natural Heritage
accounts and evaluation of non-market flows.
Natural capital accounting:
Rio +20 is an opportunity for countries and the private sector to affirm their commitment to an
accounting of global wealth and integrated reporting. Several financial institutions have already signed
a Declaration on natural capital, and many companies are listed on integrated reporting initiatives that
allow them to incorporate biodiversity and take environmental consideration when making decisions
of management.
In sum, three major reports have recently been written by expert groups on measures of sustainable
development. The first one, by a working group of the OECD/UNECE/Eurostat in 2008, recommends
using a table of variables of flows and stocks to capture all the components of sustainability, and
distinguishes the « economic well-being » from the « fundamental welfare » that considers
environmental indicators (global warming, air pollution, water quality, biodiversity). The second one,
by the French Economic, Social and Environmental Council in 2009, assesses the ecological footprint,
but has also sought to quantify sustainability. Thus, it concludes that the carbon footprint is more
relevant and suggests using indicators of international boards. The third one, by a working group
headed by Stiglitz, Sen and Fitoussi 2009, recommended improving existing measures of economic
performance. First, it suggested improving the measurement of GDP by taking into account the
services and non-market production. These services can be public or private and for the public
services, they can be collective (security) or individual (health, education). It should include the point
of view of the households and their living standards in the measurement of GDP (consumption,
income, wealth). Second, it proposed to measure well-being in the context of sustainability because it
considers that the two measures are different but complementary: to establish a system for measuring
welfare with different indicators. These indicators should be sufficiently numerous to take into account
all relevant dimensions (the material conditions of life, health, education, personal activities including
work, participation in the life policy and governance, social connections and relationships, the
environment, economic and physical insecurity). Then, these indicators of quality of life should be
properly aggregated. Third, it proposes a definition of sustainability: at least maintain the current level
of well-being for future generations. "Economic sustainability" is to assess whether or not countries
consume an excessive proportion of their wealth, whether they live above their means. "Environmental
sustainability" is to say if we reach dangerous levels of consumption for the environment but it is
difficult to monetize it.
However, none of these reports have advocated the exclusive use of an indicator of sustainable
development. Finally, if we want to challenge the supremacy of GDP, we should not replace it with
another hegemonic indicator. There should be several management tools, each pointing out an
important element for the specific policy makers.
For the case of MENA countries, what indicators would be most appropriate to capture the
peculiarities of this economy? What are the available data that would allow their calculations? Should
we change the composition of an indicator to make it compatible with existing data or should we

Topics in Middle Eastern and African Economies Vol. 17, Issue No. 2, May 2015
39
establish new channels of collection of the information for this purpose? What would be their purpose
and for whom?
Part 2: Empirical study
I- General characteristics of the MENA region
In this region, the economic characteristics of oil exporting and oil importing countries are very
different. The Gulf countries and Algeria are very rich in natural resources, while Egypt, Morocco and
Yemen are poor compared to the needs of their population. With the Arab Spring, some of these
countries are in political transition and therefore are experiencing social instability. The region
remains in a state of stagnation with high levels of unemployment and is unattractive for investors.
Growth has always been a major objective for any economy needing progress and development. It is
primarily based on the development of production factors due to the increased use of available
resources and technical progress.
The persistence of economic growth through a cumulative movement over the long term has a positive
effect on the standards of living and therefore, may permit poverty reduction. However, economic
growth does not have only positive effects; it also has negative aspects that can be identified by the
harmful consequences of the intensification of resource exploitation. These consequences are
essentially environmental pollution, overexploitation of resources, increased spatial disparities and
increasing social inequalities.
As a condition sine qua non for economic development, the assessment of growth should not be
limited to quantifiable aspects. Other aspects also play an important role in economic and social life
and, therefore, must be taken into account to actually account for the economic growth in all of its
dimensions. This is what we strive to do in the case of the countries of MENA region (Middle East
and north Africa) where we’ll try to identify and to determine the most relevant elements to build up
an indicator that would really reflect growth, through sustainable development.
The progress realized in the field of statistical analysis through the development and the multiplication
of statistical tools, the greater availability and reliability of statistical data (databases) and the ease of
access to data through NITC (new information technology and communication), are important
elements that contribute to decipher the phenomenon of growth and to determine the contribution of
each of the elements involved in the process.
The MENA region includes 19 countries from Morocco in Northwest Africa to Iran in Southwest
Asia, and a broader definition would include nine additional countries in Europe, Central Asia and
Africa. The MENA region is very heterogeneous in terms of wealth, population size and level of
economic development:
• With 381 million inhabitants, the MENA region accounts for 6 % of the world population.

Topics in Middle Eastern and African Economies Vol. 17, Issue No. 2, May 2015
40
• It owns 60 % of global oil reserves and 45% of natural gas and so appears as a strategic source of
supply of energy resources worldwide. Eight of the twelve OPEC countries are MENA countries.
• The MENA region is characterized by the very low level of economic integration between its
different countries. Trade across MENA countries accounts for about 10% to 12 % of total trade in the
region against 60 % for Europe and 36.8% for Asia.
• Economic diversification is very low in the MENA region. This is the case of oil-producing countries
which don’t succeed in emancipating from the mastery of hydrocarbons in the economy. This is also
the case for non-oil producing countries, but in the latter case, the low level of diversification of the
economy finds its origin mainly in the low level of productive investment, in inefficient training
structures in place, and in the lack of investment in intangible capital (as the main source of
innovation).
• Capital transactions in the MENA region have experienced significant quantitative progress, and this
is a result of different oil shocks. However, they remain relatively limited if we refer to the mass and
the invested capital generated in the region. Indeed, it is estimated that the oil producing countries of
the Gulf have generated 2,000 billion dollars, but the major part of this amount was an outflow to the
U.S. A (Treasury bills mainly), Switzerland and Great Britain.
• Excluding the circle of oil producing countries of the Gulf, the economic performance of MENA
countries remains limited and is even declining since the advent of the global crisis of 2008. This is a
direct consequence of inadequate production systems, the low level of development of productive
forces involved in the production process, the low productive investment which is the guarantee of
sustainable growth, and the shortcomings in institutional and organizational business environments.
Figure II.1: Average GDP growth in MENA countries 2000-2010
Source: OECD calculations based on data staff from IMF 2011d.

Topics in Middle Eastern and African Economies Vol. 17, Issue No. 2, May 2015
41
• The large inflow of income resulting from the different oil shocks has made it possible for oil
exporting countries to initiate major projects (infrastructure, equipment ... ) giving rise to migration
flows within the MENA region. However, these flows have failed to reduce unemployment in the
MENA region which is characterized by the highest unemployment rates in the world. Indeed, more
than half of the population of working age is unemployed and unschooled, and the inactivity rate of
women and youth is one of the highest in the world.
According to the World Bank, the MENA region must create in the next seven years, 28 million jobs
and that, only to contain the rise of unemployment.
• The informal sector plays an important role in most countries of the MENA region, and it tends to
gain ground in the context of crisis as well as the inability of the state to reduce unemployment that
affects young people. In addition, the wave of protests (Arab Spring) which affects all MENA
countries since 2011 has resulted in a lax state in repressing informal activities, and has so created a
favorable environment to the development of the informal sector.
Figure II-2: Informal employment 2000-2007 (Yearly average, in thousand people)
Source: Heintz and Chang 2007.
• All MENA countries face (even if with varying degrees) the problem of governance. This problem is
first the result of the incompetence of policy makers resulting in gaps in management and, secondly,
illegal patronage practices which destroy any attempt of implementation of any project of society.
Thus, the report entitled “Middle East and North Africa: Harnessing the Global Recovery, a Tough
Road Ahead" presents the problems that MENA countries face and the opportunities available to them.
According to the report, corruption remains endemic in most countries of the region and is a common
practice in recruitment to the public service in particular.
• As highlighted by the FAO report for 2013, the MENA region is characterized by a high dependence
on food import, and that, despite some progress in several countries of the region. Conflicts,

Topics in Middle Eastern and African Economies Vol. 17, Issue No. 2, May 2015
42
population growth, rapid urbanization, and low agricultural productivity are the main reasons of that
food situation. At the regional level, the number of undernourished people remains high affecting
nearly 43.7 million people (more than 10 % of the population), while 24.5% of children less than five
years of age suffer from stunted growth due to chronic malnourishment.
With the exception of fruit and vegetables, all other major food groups saw the gap widen between
consumption and domestic production. The region has become increasingly dependent on the world
market to meet its basic food needs. Thus, during the period 2006-2010, the region imported 47% of
its cereals, 72% of vegetable oil, and 60% of its sugar.
The above list of the elements that characterize the MENA region is not exhaustive, but it seems
relevant and representative of the factors that really reflect the evolution of the economy in the MENA
region. More generally, variables related to development (GDP per capita), education, health and
environment are crucial to characterizing MENA countries.
The following section intends to integrate some economic, social and environmental factors in an
original single indicator for MENA countries with international comparisons.
II- A modified HDI indicator which takes environment into account: An application to
MENA countries.
The previous sections show that there is no single indicator to measure sustainable development.
Moreover, the lack of data availability for some indicators for MENA countries, such as certain
components of the EPI makes it difficult to apply sustainability indices in these countries. A third
difficulty is related to the existence of numerous measures of sustainable development, which
makes difficult the selection of appropriate indicators and their relative importance.
This section is intended, from the available data on MENA, to propose a modified human
development index taking into account the environment, measured by pollution. Pollution is
indeed the environmental factor most frequently cited as an obstacle to sustainable development.
In addition, data for this variable are available for virtually all countries. The HDI will therefore be
modified to take into account four factors related to sustainable development: life expectancy (as a
measure of health), education, GDP per capita and the air pollution that we measure as CO2
emissions per capita as well as the concentration of pollution in large cities. We see that the
corrected HDI can lead to a rather different ranking of countries linked to the traditional
classification of HDI.
Leaving the HDI uncorrected, Table II-1 gives us the values for 2012 for MENA in comparison
with selected reference countries (some OECD countries and other emerging countries in Latin
America and Asia). It appears that except Israel, that is placed 16th in the world, most MENA
countries are ranked in the second half of world classification (ranking after the 90th position).
Moreover, even if Lebanon, Turkey, Algeria and Tunisia remain below the hundredth place, it
does not hold true for Egypt, Syria and Morocco. These countries rank at levels similar to those of
India or China levels. Brazil and Argentina are in turn generally better placed than the MENA
countries. Unsurprisingly, the countries at the top of the world ranking are countries of Western
Europe and North America, as well as Australia and Japan.

Topics in Middle Eastern and African Economies Vol. 17, Issue No. 2, May 2015
43
Table II-1: Human development Index 2012 and rank for 186 countries
Source: United Nations Development Program (https://data.undp.org/dataset/Table-1-Human-Development-
Index-and-its-components/wxub-qc5k)
The question that arises is whether the consideration of environmental factors leads to a significant
change in the ranking. In this regard, we propose to amend the HDI by adding a composite
indicator of pollution that takes into account both the level of CO2 emissions as well as their
concentration in large cities. Table II-2 shows that on this point, MENA countries, because of their
lower economic development, generally emit far less CO2 per capita than the industrialized
reference countries. Turkey and Lebanon are close to the world average and Israel and Libya are
two exceptions which have CO2 emission levels comparable to those of the developed countries.
Thus, if we consider only the level of CO2 emissions, the MENA countries appear as relatively
good performers.
Country IDH Rang
Australia 0,938 2
United States 0,937 3
Germany 0,920 5
Sweden 0,916 7
Japan 0,912 10
Canada 0,911 11
Israel 0,900 16
France 0,893 20
Spain 0,885 23
Italy 0,881 25
United Kingdom 0,875 26
Argentina 0,811 45
Lebanon 0,745 72
Brazil 0,730 85
Turkey 0,722 90
Algeria 0,713 93
Tunisia 0,712 94
Jordan 0,700 100
China 0,699 101
Egypt 0,662 112
Syrian Arab Republic 0,648 116
Morocco 0,591 130
India 0,554 136

Topics in Middle Eastern and African Economies Vol. 17, Issue No. 2, May 2015
44
Table II-2: Emissions of CO2 per capita and rank of the countries (out of 205 total)
Source: World Bank (http://data.worldbank.org/indicator/EN.ATM.CO2E.PC )
However, these observations mask a more complex reality than can be measured by the
concentration of air pollution in large cities. Thus, Figure II-3 shows that a measure of pollution in
cities of over 100,000 inhabitants gives us a different picture than the previous table. Indeed, the
least polluted cities are rather the cities of the North, while MENA countries are almost all in the
second half of the table, with the exception of Morocco which has less pollution because of its
urban structure and the location of Rabat and Casablanca near the Atlantic ocean breezes which
assists with dispersing pollutants. In contrast, countries such as Syria, Egypt, Jordan and Algeria
are among the countries with the most polluted cities in the world (rank greater than 130).
Country CO2 Rank
Morocco 1,60 78
India 1,67 82
Brazil 2,15 92
Tunisia 2,45 96
Egypt, Arab Rep. 2,62 99
Syrian Arab Republic2,87 103
Algeria 3,33 108
Jordan 3,44 110
Turkey 4,13 116
Argentina 4,47 122
Lebanon 4,70 125
World 4,88
France 5,56 140
Sweden 5,60 141
Spain 5,79 142
China 6,19 146
Italy 6,72 153
United Kingdom 7,86 166
Germany 9,11 173
Japan 9,19 174
Israel 9,27 175
Libya 9,77 176
Australia 16,93 194
Canada 14,68 191
United States 17,56 196
Topics in Middle Eastern and African Economies Vol. 17, Issue No. 2, May 2015
45
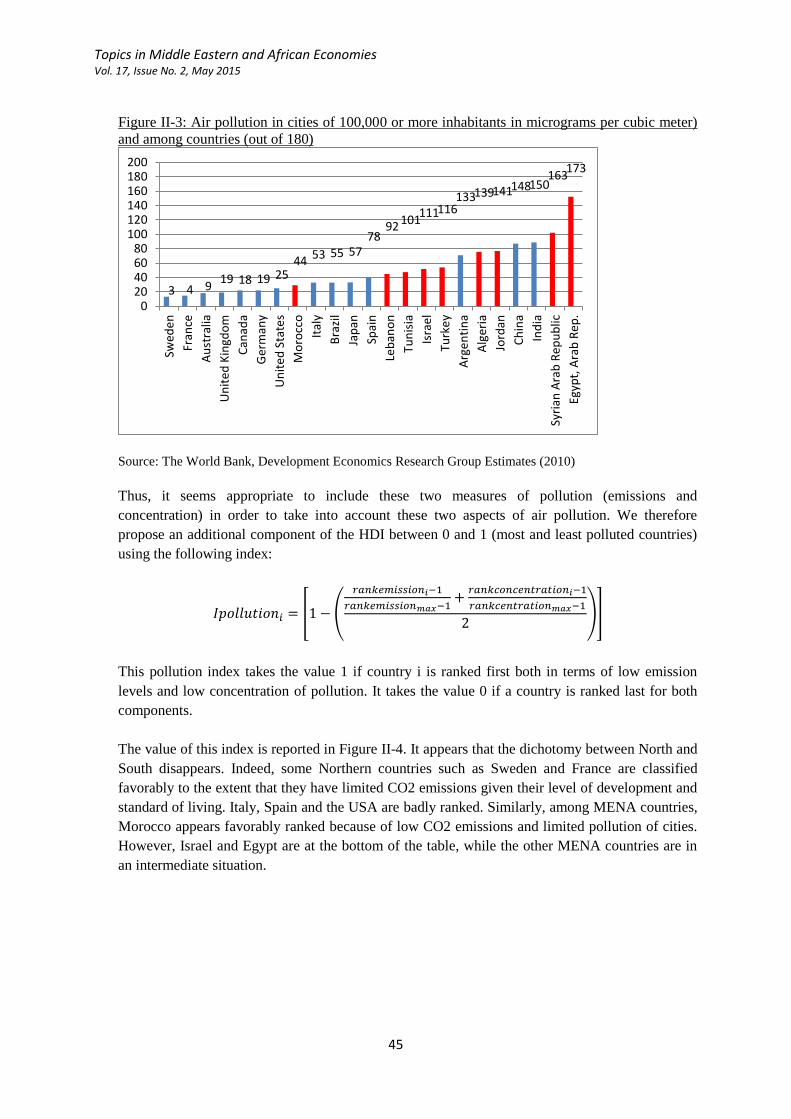
Figure II-3: Air pollution in cities of 100,000 or more inhabitants in micrograms per cubic meter)
and among countries (out of 180)
Source: The World Bank, Development Economics Research Group Estimates (2010)
Thus, it seems appropriate to include these two measures of pollution (emissions and
concentration) in order to take into account these two aspects of air pollution. We therefore
propose an additional component of the HDI between 0 and 1 (most and least polluted countries)
using the following index:
[ (
)]
This pollution index takes the value 1 if country i is ranked first both in terms of low emission
levels and low concentration of pollution. It takes the value 0 if a country is ranked last for both
components.
The value of this index is reported in Figure II-4. It appears that the dichotomy between North and
South disappears. Indeed, some Northern countries such as Sweden and France are classified
favorably to the extent that they have limited CO2 emissions given their level of development and
standard of living. Italy, Spain and the USA are badly ranked. Similarly, among MENA countries,
Morocco appears favorably ranked because of low CO2 emissions and limited pollution of cities.
However, Israel and Egypt are at the bottom of the table, while the other MENA countries are in
an intermediate situation.
3 4 919 18 19 25
44 53 55 5778
92 101111116
133139141148150163
173
020406080
100120140160180200
Swed
en
Fran
ce
Au
stra
lia
Un
ite
d K
ingd
om
Can
ada
Ger
man
y
Un
ite
d S
tate
s
Mo
rocc
o
Ital
y
Bra
zil
Jap
an
Spai
n
Leb
ano
n
Tun
isia
Isra
el
Turk
ey
Arg
en
tin
a
Alg
eria
Jord
an
Ch
ina
Ind
ia
Syri
an A
rab
Rep
ub
lic
Egyp
t, A
rab
Rep
.

Topics in Middle Eastern and African Economies Vol. 17, Issue No. 2, May 2015
46
Figure II-4: Composite indicator of pollution
Source: Authors’ calculations
The final step is to correct the HDI of this indicator of pollution. Whereas the HDI consists of
three components (life expectancy, education and GDP), the inclusion of a fourth component
provides the following adjusted HDI:
[( ) ( )]
The results are presented in Table II-3. This table shows that for almost all countries, their HDI
deteriorate if we take into account the pollution component. Morocco is an exception in so far as
its correct performance in terms of pollution is increasing HDI which is among the lowest in the
region. Other countries perform rather well as their HDI decreases only slightly taking pollution
into account. This is the case of Sweden, France, Brazil, India and Tunisia. The reasons are
various. In Sweden and France, it is explained by contained pollution given their high economic
development. For other countries, it is largely explained by per capita emissions which are still
limited because of their low level of development.
Conversely, Egypt, Jordan, Algeria and Syria lose nearly 0.1 point of their HDI due to their poor
performance in terms of pollution. This pushes their HDI down to very low levels (between 0.5
and 0.6). Among the countries that lose the most in HDI, one has to include Israel (-0.15 points),
but also the USA, Japan, Argentina and China have very poor performance in terms of pollution.
0,00
0,10
0,20
0,30
0,40
0,50
0,60
0,70
0,80M
oro
cco
Swed
en
Fran
ce
Bra
zil
Un
ite
d K
ingd
om
Ger
man
y
Au
stra
lia
Tun
isia
Can
ada
Ital
y
Un
ite
d S
tate
s
Leb
ano
n
Spai
n
Jap
an
Turk
ey
Ind
ia
Alg
eria
Jord
an
Arg
en
tin
a
Syri
an A
rab
Rep
ub
lic
Egyp
t
Isra
el
Ch
ina

Topics in Middle Eastern and African Economies Vol. 17, Issue No. 2, May 2015
47
Table II-3: Adjusted HDI by emissions pollution and its concentration
Source: authors' calculations
In conclusion, we observe that the inclusion of pollution in the HDI leads to greater heterogeneity
in the ranking of the North (with a strong downgrade for the U.S., Israel and Japan while Sweden
and France improve their ranking relatively). This is also true for the South (downgrade of China
and Argentina while Morocco and Tunisia realize good results too). Brazil and India are not
performing too badly, but results for India are mainly linked to low emissions due to its low
economic development.
Thus, these results demonstrate the high sensitivity of the HDI to environmental factors. The
exercise carried out above partly raises the question concerning the ranking made by the United
Nations Development Program. It clearly appears that some countries are heavily overrated
without taking into account their poor environmental performance (USA, Japan, and Israel). Even
Australia and Canada are among the countries upgraded. In contrast, countries in Northern Europe,
including France seem relatively underrated due to better performance in terms of air pollution.
Among MENA countries, Morocco and Tunisia appear underrated while Egypt, Syria, Algeria and
Jordan seem significantly overrated.
This analysis has to be refined by taking into account alternative measures of pollution (sensitivity
analysis) and environment. Maybe, we could use a composite indicator that does not take into
account only the air pollution but also other environmental factors, according to the available data.
(1) (2) (3) (4)
Country HDI Ipollution HDI corrected Gap (3) - (1)
Morocco 0,591 0,688 0,615 0,024
Sweden 0,916 0,648 0,849 -0,067
France 0,893 0,647 0,832 -0,061
Brazil 0,730 0,623 0,703 -0,027
United Kingdom 0,875 0,542 0,792 -0,083
Germany 0,920 0,525 0,821 -0,099
Australia 0,938 0,502 0,829 -0,109
Tunisia 0,712 0,485 0,655 -0,057
Canada 0,911 0,484 0,804 -0,107
Italy 0,881 0,480 0,781 -0,100
United States 0,937 0,453 0,816 -0,121
Lebanon 0,745 0,440 0,669 -0,076
Spain 0,885 0,437 0,773 -0,112
Japan 0,912 0,417 0,788 -0,124
Turkey 0,722 0,395 0,640 -0,082
India 0,554 0,383 0,511 -0,043
Algeria 0,713 0,350 0,622 -0,091
Jordan 0,700 0,340 0,610 -0,090
Argentina 0,811 0,333 0,691 -0,120
Syrian Arab Republic 0,648 0,296 0,560 -0,088
Egypt 0,662 0,278 0,566 -0,096
Israel 0,900 0,265 0,741 -0,159
China 0,699 0,233 0,582 -0,117

Topics in Middle Eastern and African Economies Vol. 17, Issue No. 2, May 2015
48
Finally, it is appropriate to propose an econometric model to identify the determinants of this
indicator (beyond its components).
Conclusion:
GDP of a nation, which is a universally accepted indicator of economic welfare, would not reflect
the whole picture during times of financial turmoil and crisis. An alternative indicator that takes
into account the economic, social and environmental well-being can be seen as a new instrument
to promote governance based on sustainable development, where the long term is as important as
the short term and the future of the humanity becomes a priority.
References:
Brundtland, G. H. (1987). Report of the World Commission on environment and development:" our common future.". United Nations
Daly, H. E., & Cobb, J. B. Jnr (1989): For the Common Good: Redirecting the Economy Toward Community, the Environment and a Sustainable Future.
Duraiappah, A. K., & Muñoz, P. (2012). Inclusive wealth: a tool for the United Nations. Environment and Development Economics, 17(03), 362-367.
Heintz, E., & Chang, G. B. (2007). Report of Informal Employment for the ILO.ILO Geneva.
Miringoff, M. L. (1995). Index of social health. Institute for Innovation in Social Policy, Fordham University, Tarrytown, New York.
Nordhaus, WD and Tobin, J (1972) Is Growth Obsolete? Economic Growth, National Bureau of
Economic Research, no 96, New York.
Osberg, L. (1985). The Measurement of Economic Weil-Being. Approaches to economic well-being, 26, 49.
Osberg, L., & Sharpe, A. (1998). An index of economic well-being for Canada. Applied Research Branch, Strategic Policy, Human Resources Development Canada.
Osberg, L., & Sharpe, A. (2000, March). Comparisons of trends in GDP and economic well-being–the impact of social capital. In International Symposium on the Contribution of Human and Social Capital to Sustained Economic Growth and Well-Being. Quebec: OECD. http://www. oecd. org/els/papers/papers. htm.
Parris, T. M., & Kates, R. W. (2003). Characterizing and measuring sustainable development. Annual Review of environment and resources, 28(1), 559-586.
United Nations Development Program. https://data.undp.org/dataset/Table-1-Human-Development-Index-
and-its-components/wxub-qc5k
World Bank. CO2 emissions (metric tons per capita). http://data.worldbank.org/indicator/EN.ATM.CO2E.PC
Zolōtas, X. E. (1981). Economic growth and declining social welfare. New York: New York University Press.