Summary developing the leader within you – part 2 – actionable books
WILLIAM E. MCGRATH
Correlating the Subjects of Books
Taken Out Of and Books Used Within an Open-Stack Library
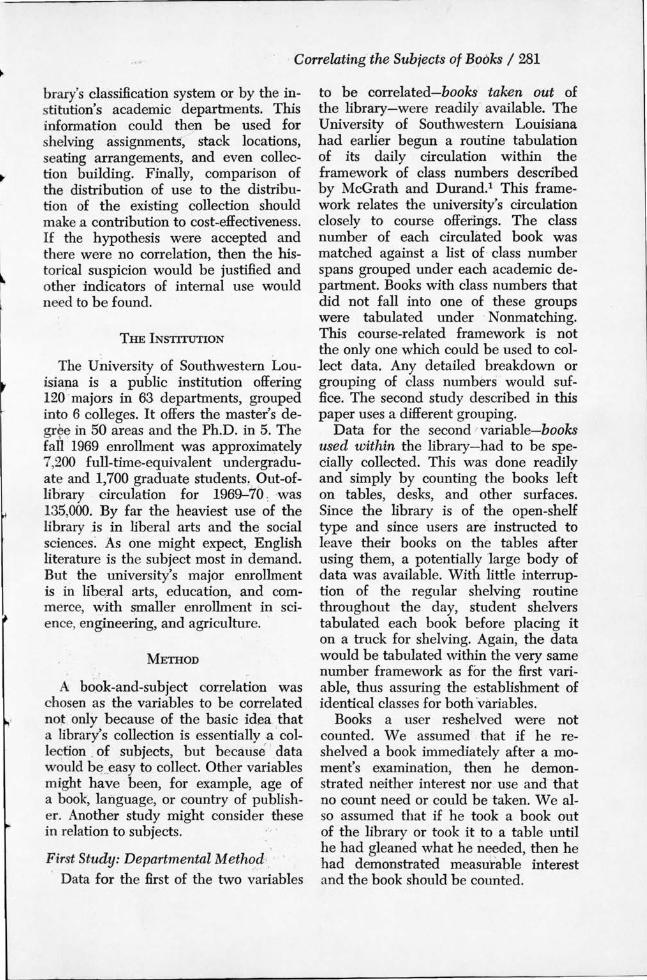
The traditional over-the-counter circulation count is not always considered a reliable indicator of total library use. To test this assumption the author hypothesized that no correlation exists between the subjects of books taken out of the library and those used within the library. Counts were made of books left on tables, chairs, desks, and other surfaces and correlated to books charged out. Two studies were made. In the first, books were counted within finely delineated LC and Dew·ey class spans relating to academic departments. In the second, books were counted within the broad LC first and second letters and the Dewey tens. In the first case, the overall correlation was .86; in the second, with less data, .84. The author concludes that out-oflibrary circulation totals can be reliable indicators of in-library use. For predicting in-library use (and thus total use) two methods are cited-simple ratio of out to in, and the regression equation.
MANY LIBRARIANS HAVE LONG FELT that circulation counts reveal little about total library use, regarding them as no more than rough indicators of dips and climbs in library use. The daily, monthly, and annual totals are often treated suspiciously and more often indifferent-
Mr. McGrath is director of libraries and professor of library science at th~ U niversity of Southwestern Louisiana, Lafayette, Louisiana.
Note: The author gives specUJl thanks to Dr. Peter Dickinson, Assistant Professor of Mathematics, University of Southwestern Louisiana, for statistical advice and assistance. He also acknowledges the assistance of Glenda Garst, Humanities Librarian; F. Landon Greaves, formerly Social Sciences Librarian; and Barbara Green, Social Sciences Librarian, U. S. L,., in collecting and organizing the data.
280 I
ly. Over-the-counter circulation, the claim has been, gives no indication of the true magnitude of library use since it takes no account of use within the library.
The purpose of this study was to determine whether the suspicion (or indifference) was justified or whether librarians could rely upon the traditional count as a broader indicator. Accordingly, we hypothesized that no correlation exists between the subjects of books taken out of the library and the subjects of books used in the library. If the hypothesis were rejected and if there were a high correlation, then the daily, monthly, and annual count would be more meaningful. This info. -nation could then be used to predict, within confidence limits; not only total usage, but usage within categories of the li-
"~
~ -
· Correlating· the Subjects of B_t;)(Jks I 281
brary's classification system or by the institution's academic departments. This information could then be used for shelving assignments·, stack locations, seating arrangements, and even collection building. Finally, comparison of the distribution of use to the distribution of the existing collection should make .a contribution to cost-effectiveness. If the hypothesis were accepted and there were no correlation, then the historical suspicion would be justified and other indicators of internal use would need to be found.
THE INSTITUTION
The University of Southwestern Louisia!la is a public institution offering 120 ·majors in 63 departments, grouped into 6 colleges. It offers the master, s degr~e in 50 areas and the Ph.D. in 5. The fall · 1969 enrollment was approximately 7,200 full-time-equivalent undergraduate and 1, 700 graduate students~ Out-oflibrary circulation for 1969--70 : ·was 135,000. By far the heaviest use of the library is in liberal arts and the social sciences: As one might expect, English literature is the subject most in demand. But the university's major enrollment is in liberal arts, education, and commerce, w.ith smaller enrollment in science, engineering, and agriculture. ·
METHOD
A book-and-subject correlation was chosen as the variables to be correlated no~ ·only because of the basic idea that a library's collection is essentially a · collection , of _subjects, but because' · data would b~ __ easy to collect. Other variables might have ·been, for example, age of a book~ language, or country . of publisher. Another study might consider these in relation to subjects.
First Study: Departmental Meth~d-i. · Data for the first of the two variables
to be correlated-books· taken out of the library-were readily' available. The University of Southwestern Louisiana had earlier begun a routine tabulation of its daily circulation within the framework of class numbers described by McGrath and Durand.1 This framework relates the university's circulation closely to course offerings. The class number of each circulated book was matched against a list of · class number spans grouped under each academic department. Books with class numbers that did not fall into one of these groups were tabulated under · N onmatching. This course-related framework is not the only one which could be used to collect data. Any detailed breakdown or grouping of class numbers would suffice. The second study described in this paper uses a different grouping.
Data for the second ' variable-books used within the library-had to be specially collected. This was done readily and simply by counting the books left on tables, desks, and other surfaces. Since the library is of ·the open-shelf type and since users are instructed to leave their books on the tables after using them, a potentially 'large body of data was available. With little interruption of the regular shelving routine throughout the day, student shelvers tabulated each book before placing it on a truck for shelving. Again, the data would be tabulated within the very same number framework as Jar the first variable, thus assuring the establishment of identical classes for both "variables.
Books a user reshelved were not counted. We assumed . that if he reshelved a book immediately after a moment's examination, then he demonstrated neither interest nor. use and ·that no count need or could be taken. Wealso assumed that if he took a book out of the library or took it to a table until he had gleaned what he needed, then he had demonstrated measui-.able interest and the book should be counted.

282 I College & Research Libraries • July 1971
Periodicals, bound and unbound, were excluded from the study. A count of periodicals used in the library could not be correlated with those going out since periodicals do not go out. Furthermore, they are invariably classified in a general and thus usually a Nonmatching number. Also excluded were reserve books and special collections in and outside of the main library.
Data for the two variables were collected during four weeks in February and March within 4692 LC and DC spans, then regrouped according to sixty academic departments with a sixty-first category for Nonmatching. The data represented a bout 7 percent of one year's use.
The so-called N onmatching category simply includes all books whose classification numbers fell between (i.e., outside of) those which describe departmental offerings. Thus, these Nonmatching classification numbers did not coincide with any of the sixty departmental categories.
Table 1 gives the totals of out-of-library and in-library use. It can be seen from the data that out-of-library generally exceeds in-library use, with a ratio ranging from 1: 1 to 4.1: 1 for individual departments, and a ratio of 2:1 for the total, immediately suggesting a definite relationship between the two variables. The major exception is Nonmatching, with nearly .a 1: 1 relaf j .~.;hip. For this reason Nonmatching proves to be a very useful category.2
The two variables were correlated according to the Pearson product-moment correlation formula, where
r = ~(X- X) • (Y- Y) v l (X- X) 2 •l (Y- Y) 2
using all departments in an overall calculation both with and without Nonmatching, and then regrouped within five university colleges (Table 2).
The coefficients measuring the degree of relationship between books taken out and books used in the library speak for themselves. For departments the correla-
TABLE 1
BooKs TAKEN OuT AND BooKs USED IN THE LIBRARY, BY AcADEMic DEPARTMENT,
pARTIAL LIST
Ratio Taken Used of Out
Department Out In Total to In
1. Applied Artl 110 63 173 1.7 2. Architecture! 86 78 164 1.1 3. Art and Arch.l 83 20 103 4.1 4. Biology! 222 109 331 2.0 5. Chern. Engin.2 46 12 58 3.8 6. Chemistry! 51 35 86 1.5 7. Civil Engin.2 49 40 89 1.2 8. Computer Sci.l 51 35 86 1.5 9. Economics! 169 59 228 2.9
10. Education3 266 142 408 1.9 11. Elec. Engin.2 72 21 93 3.4 12. English! 2,032 665 2,697 3.0 13. Fine Artsl 45 45 90 1.0 14. Frenchl 180 51 231 3.5 15. General Bus.4 50 14 64 3.5 16. Geography! 44 34 78 1.3 17. Geology2 41 34 75 1.2 18. Germani 13 11 24 1.2 19. Health & P. E.3 234 76 310 3.0 20. History! 705 263 968 2.7 21. Home Ec.5 157 62 219 2.5 22. Horticulture5 28 19 47 1.5 23. Industrial Arts3 55 13 68 4.2 24. Library Sci.3 15 10 25 1.5 25. Marketing4 58 27 85 2.1 26. Mathematics! 172 79 251 2.2 27. Mech. Engin.2 77 41 118 1.9 28. Microbiology! 34 38 ·72 .9 29. Musicl 219 66 285 3.3 30. Nursing6 95 57 152 1.6 31. Philosophy! 279 69 348 4.0 32. Physics! 107 52 159 2.1 33. Pol. Sci.l 230 64 294 3.6 34. Pyschologyl 331 209 · 540 1.6 35. Sociology! 300 139 439 2.1 36. Spanish! 137 42 179 3.3 37. Speechl 259 87 346 3.0 38. Remaining
Departments7 284 133 417 2.1 39. Nonmatching 1,568 1,518 3,086 1.0
-----TOTAL 8,954 4,532 13,486 2.0
1 College of Liberal Arts 2 College of Engineering 3 College of Education 4 College of Commerce 6 College of Agriculture 6 College of Nursing 7 23 departments with counts less than 10 in both
categories

Correlating the Subjects of Books I 283
tions are high and the relationship firm. The correlation coefficients were tested for significance, and in all but one (i.e., for all departments and for all the subsamples of colleges except Engineering ) we reject the null hypothesis (that no correlation exists) at the .01 level of significance, meaning that there is one chance in a hundred that we could be wrong. With the Engineering departments, rejection occurs at the .05 level. The coefficients for five of the six subgroups of departments though fairly high, should be regarded with much less confidence and are therefore not too meaningful since the sample sizes (four to eight) are so small. This means that high departmental correlations do not hold as well when they are regrouped within their respective colleges. This is revealed in the rather large range for these groups in the coefficients of theoretical population and the high critical coefficients.
When the Nonmatching category is included in the calculation (which it needn't be, since the books in the two sets of Nonmatching numbers cannot be meaningfully compared unless further broken down by LC letters or DC tens as they are in the second study) the correlation is still high and still signifi-
cant, even though it accounts for 23 percent of the data.
English, another highly influential category, must, on the other hand, be included in the calculations. Unlike the correlation when N onmatching is included, the correlation goes up when English is included. As with N onmatching, the correlation remains significant.
Finally, we can say with .a confidence of 95 percent, that if we could correlate use of the entire collection as we did for the sample, then the coefficients would fall within the limits indicated in the last column in Table 2.
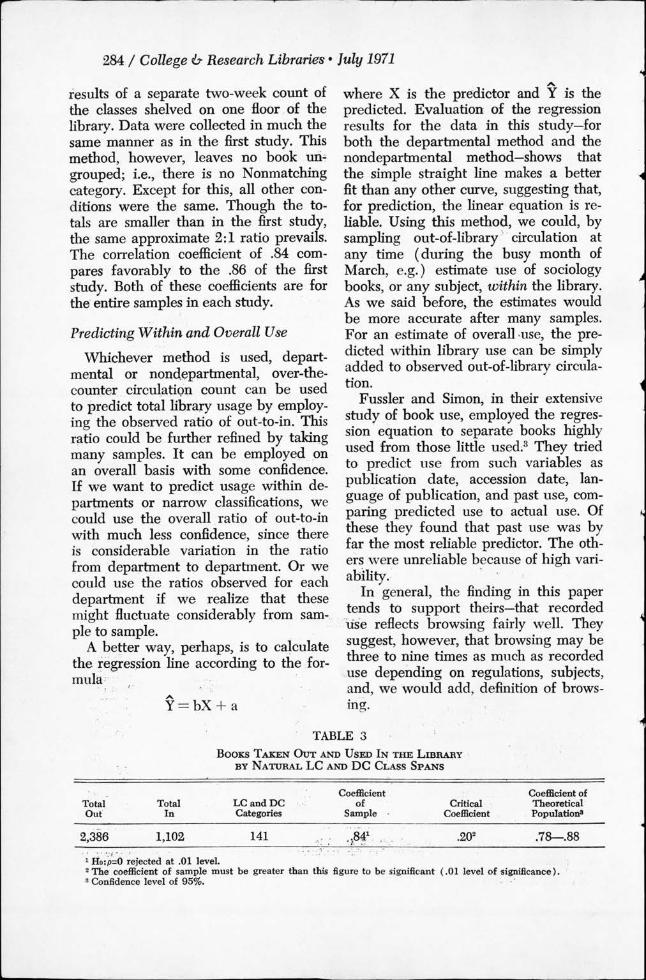
Second Study: Nondepartmental Method
An institution wanting to examine its own in- and out-of-library use may not feel it necessary to construct a class number framework based on courses, nor to relate the groups necessarily to anything. With much less preparation, a correlation study can be made within the framework most libraries use for their daily counts: the first and second letters of LC and the tens of DC. To test the simplicity of this method and to gather .additional evidence of association between in and out use, the author made a second study. Table 3 shows the
TABLE 2
CoRRELATION CoEFFICmNTs
Number Coefficient1 Coefficient of of of Critical Theoretical
Groups of Departments Depts. Sample Coefficient2 Population•
All departments with N onmatching 61 .86 .30 .77-.92 All departments without Nonmatching 60 .98 .30 .96-.98 All departments without English 60 .94 .30 .90-.96 Subgroups by college:
College of Liberal Arts 28 .98 .44 .93-.98 College of Education 6 .95 .88 .58-.98 College of Agriculture 8 .99 .80 .90-.99 College of Engineering 7 .738 .673 .-o5-.94 College of Commerce 7 .84 .83 .22-.94 Nursing and unaffiliated 4
1 In each case except Engineering, Ho:p=O rejected at .01 level. 2 The coefficient of sample must be greater than this coefficient to be significant ( .01 ]evel of significance ex
cept Engineering). 3 Level of significance .05. ' At a confidence level of 95%.
284 I College & Research Libraries • July 1971
results of a separate two-week count of the classes shelved on one floor . of the library. Data were collected in much the same manner as in the first study. This method, however, leaves no book uri.;; grouped; i.e., there is no N onmatching category. Except for this, all other conditions were the same. Though the totals are smaller than in the first study, the same approximate 2:1 ratio prevails. The correlation coefficient of .84 compares favorably to the .86 of the first study. B.oth of these coefficients are for the entire samples in each study.
..
Predicting Within and Overall Use
Whichever method is used, departmental or nondepartmental, over-thecounter _circulatiQn count can be used to predict total library usage by employing the observed ratio of out-to-in. This ratio could be further refined by taking many samples. It can be employed on an overall basis with some confidence. If we want to predict usage within departments or narrow classifications, we could use the overall ratio of out~to-in with much less confidence, since there is considerable variation in the ratio from department to department. Or we could use the ratios observed for e~ch department if we realize that these might fluctuate considerably from sample to sample.
A better way, perhaps, is to ca~culate the regression line according to the Jarmula ·
A
Y=bX +a
. A
where X is the predictor and Y is the predicted. Evaluation of the regression results for the data in this study-for both the departmental method and the nondepartmental method-shows that the simple straight line makes a better fit than any other curve, suggesting that, for prediction, the linear equation is reliable. Using this method, we could, by sampling out-of-library .-, circulation at any time (during the busy month of March, e.g.) estimate use of sociology books, or any subject, within the library. As we said before, the estimates would be more accurate after many samples . For an estimate of overall .use, the predicted within library use can be simply added to observed out-of-library circulation.
Fussier and Simon; in their extensive study of book use, employed the regression equation to separate books highly used from those little used;3 They tried to predict use from such variables as publication date, accession date, language of publication, and past use, comparing predicted use to actual use. Of these they found that past use was by far the most reliable predictor. The others were unreliable because of high vari-ability. -
In general, the finding in this paper tends to support theirs-that recorded lise reflects browsing fairly well. They suggest, however, that browsing may be three to nine times as much as recorded use depending on regulations, subjects, and, we would add, definition of browsing.
r. TABLE 3
Total Total Out In
2,386 1,102
BooKs TAKEN OuT AND UsED IN THE LIBRARY · BY NATURAL LC AND DC CLASS SPANS .
Coefficient LCandDC of Critical Categories Sample Coefficient
. . . .. 141 •1841 · , .· . . .202
1 Ho:p=O rejected at .01 level.
Coefficient of Theoretical Populations
.78-.88
2 The coefficient of sample must be greater than this figure to be significant ( .01 level of significance). · s Confidence level of 95%.

Correlating the Subfects of Books I 285
Morse also discussed the problem of. _ _lation, -may be examined for de-emphain-library use.4 He cited studies at sis and storage. M.I.T. which found that books in the If the foregoing seems too obvious, Science Library . were used on the aver- recall how many times you have heard age four times as . often as they were a . colleague-faculty me~ber as well as borrowed. He also mentioned the need librarian-disclaim circulation, especialfor data on the in-library use of specific ly if the totals in his area are small, as books as well as classes of books. an indicator of true use and therefore
CONCLUSIONS
On the basis of the high correlations revealed in this study ·we can conclude that circulation totals, when grouped into self-delineating spans, can be reliable indicators of the subfects being used toithin as well as out of the library.
This being so, the administrator can be assured that over-the-counter circulation represents real demand and that the subjects of books circulated are those which require attention in collection building. In areas of heavy . use, decisions may also be made in regard to expansion space, placement of tables, chairs, carrels, and lighting. Conversely, areas of little use, . as indicated by circu-
the true value of books in his area. In the hard realities of library economy (an old-fashioned phrase?), demand tells much. ·
.· ·It can be argued, of course, that the ·findings in this study would not necess~rily hold true for other university li
. braries. Variations in the findings m1ght
. be caused by local policy differences, the size · and number of department li-braries, and the size of noncirculating
. collections. But certainly the. correla-tions ·of the samples and the theoretical ·population are so high in, thls study that if ·the method described here is used, one must hypothesize that they would also be high in libraries where similar conditions prevail.
RE!"ERENCES
1. William E. McGrath and Norma Durand, "Classifying Courses in the University Caj:alog," CRL 30:533-39 (Nov. 1969).
2. A chi-square test of independence showed that books fu the Nonmatching categorythat is, books whose classification numbers did not match those of academic departments-were much less likely to be taken out of the library or otherwise be used, thus providing some theoretical justification for
constructing the framework. This finding will be discussed in a later paper.
3. · Herman H. Fussier and J. L. Simon, Pat.. .terns in the Use of Books in Large Research
Libraries (Chicago and Londori: University · of Chicago, 1969), p.142-43.
:4. Philip M. Morse, Library Effectiveness: A Systems Approach (Cambridge and London: M.I.T. Press, 1968), p.84-85, 176 . .