Take Back the Tap - Kane County, Illinois · Americans are drinking a lot of bottled water: 8.3...
20
Why Choosing Tap Water Over Bottled Water is Better for Your Health, Your Pocketbook, and the Environment Take Back the Tap
Transcript of Take Back the Tap - Kane County, Illinois · Americans are drinking a lot of bottled water: 8.3...
Why Choosing Tap Water Over Bottled Water is Better for Your Health, Your Pocketbook, and the Environment
Take Back the Tap

About Food & Water WatchFood & Water Watch is a nonprofit consumer rights organization, based in Washington, DC, that challenges the corporate control and abuse of our food supply and water resources.
Food & Water Watch1616 P St. NW, Suite 300Washington, DC 20036tel: (202) 683-2500fax: (202) [email protected]
Copyright © June 2007 by Food & Water Watch. All rights reserved. This report can be viewed or downloaded at www.foodandwaterwatch.org.
Cover photo: detail of Plastic Bottles, 2007 which depicts two million plastic beverage bottles, the number used in the United States every five minutes. Photo copyright Chris Jordan. More work at www.chrisjordan.com

Take Back the Tap
Why Choosing Tap Water Over Bottled Water is Better for Your Health, Your
Pocketbook, and the Environment
Table of Contents iv Executive Summary
1 Introduction
1 Purity Myth Bags Billions for Bottlers
3 Melting the Myth of Purity: The Scoop on Bottled Water
4 A Light Regulatory Path for Bottled Water
5 Reality Check: Tap Water is Healthy, Safe, and Monitored
5 The Inequity: Removing, Bottling, and Selling Water that Communities Need
7 Environmental Implications: Producing Plastic, Transporting Billions of Bottles, and Changing the Climate
8 Giving Up Bottled Water is Not Enough
10 Conclusion
11 Guide to Home Tap Water Filtration
13 More on EPA Drinking Water Standards
14 Endnotes
Executive SummaryAmerican consumers drink more bottled water every year, in part because they think it is somehow safer or better than tap water. They collectively spend hundreds or thousands of dollars more per gallon for water in a plastic bottle than they would for the H20 flowing from their taps.
Rather than buying into this myth of purity in a bottle, consumers should drink from the tap. Bottled water generally is no cleaner, or safer, or healthier than tap water. In fact, the federal government requires far more rigorous and frequent safety testing and monitoring of municipal drinking water.
In some cases, beverage companies use misleading labels, including marketing bottled tap water as spring water. In fact, as much as 40 percent of bottled water is bottled tap water.
Furthermore, the production of bottled water causes many equity, public health, and environmental problems. The big beverage companies often take water from municipal or underground sources that local people depend on for drinking wa-ter. Producing the plastic bottles uses energy and emits toxic chemicals. Transporting the bottled water across hundreds or thousands of miles spews carbon dioxide into the air, complicating our efforts to combat global climate change. And in the end, empty bottles are piling up in landfills.
But just kicking the bottle in favor of the tap is not enough. Our nation’s public water and sewer infrastructure is old and in the coming years will need billions of dollars of investment to maintain and further improve treatment, storage, and distribution. Unfortunately, most states and communities are strapped for cash. Each year we fall more than $20 billion short of what is needed to maintain our public water and sewage systems. This is why Congress should establish a clean water trust fund that would give communities the financial help they need to invest in healthy and safe drinking water for every American and for future generations.
This report, Take Back the Tap: Why Choosing Tap Water over Bottled Water is Better for Your Health, Your Pocket-book, and the Environment, will educate consumers about the various problems with bottled water and why they should switch to tap water. It also will illustrate the importance of supporting local water utilities through increased federal fund-ing.
iv
Introduction
Consumers are wasting hundreds and thousands of dollars on bottled water because they think it is healthier or safer than its counterpart from the tap. It is not. Tap water is safe and highly regulated and monitored.
In addition to being no purer than tap water and a big waste of money, the production and distribution of bottled water causes a host of equity and environmental problems.
Along with consumers cutting back on, or, better yet, giv-ing up bottled water, Congress should create a clean water trust fund that will give communities across America the resources they need to invest in pure, clean, and healthy drinking water and sewage systems.
Purity Myth Bags Billions for Bottlers
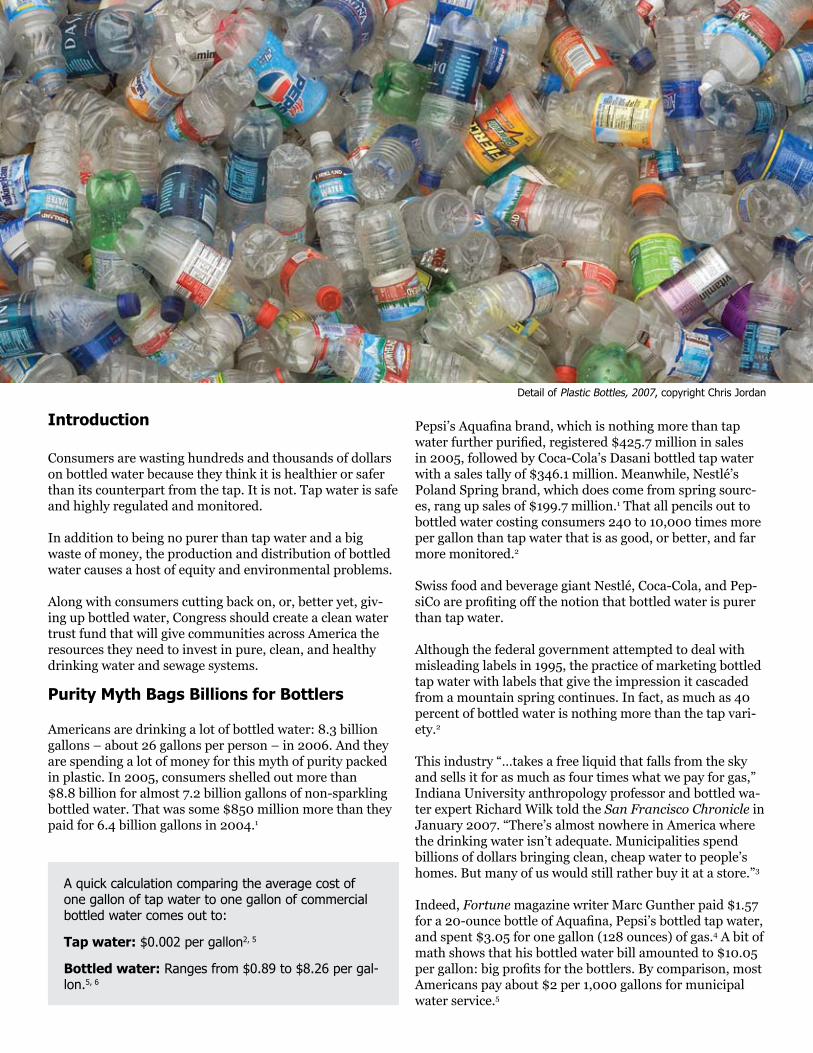
Americans are drinking a lot of bottled water: 8.3 billion gallons – about 26 gallons per person – in 2006. And they are spending a lot of money for this myth of purity packed in plastic. In 2005, consumers shelled out more than $8.8 billion for almost 7.2 billion gallons of non-sparkling bottled water. That was some $850 million more than they paid for 6.4 billion gallons in 2004.1
Pepsi’s Aquafina brand, which is nothing more than tap water further purified, registered $425.7 million in sales in 2005, followed by Coca-Cola’s Dasani bottled tap water with a sales tally of $346.1 million. Meanwhile, Nestlé’s Poland Spring brand, which does come from spring sourc-es, rang up sales of $199.7 million.1 That all pencils out to bottled water costing consumers 240 to 10,000 times more per gallon than tap water that is as good, or better, and far more monitored.2
Swiss food and beverage giant Nestlé, Coca-Cola, and Pep-siCo are profiting off the notion that bottled water is purer than tap water.
Although the federal government attempted to deal with misleading labels in 1995, the practice of marketing bottled tap water with labels that give the impression it cascaded from a mountain spring continues. In fact, as much as 40 percent of bottled water is nothing more than the tap vari-ety.2
This industry “…takes a free liquid that falls from the sky and sells it for as much as four times what we pay for gas,” Indiana University anthropology professor and bottled wa-ter expert Richard Wilk told the San Francisco Chronicle in January 2007. “There’s almost nowhere in America where the drinking water isn’t adequate. Municipalities spend billions of dollars bringing clean, cheap water to people’s homes. But many of us would still rather buy it at a store.”3
Indeed, Fortune magazine writer Marc Gunther paid $1.57 for a 20-ounce bottle of Aquafina, Pepsi’s bottled tap water, and spent $3.05 for one gallon (128 ounces) of gas.4 A bit of math shows that his bottled water bill amounted to $10.05 per gallon: big profits for the bottlers. By comparison, most Americans pay about $2 per 1,000 gallons for municipal water service.5
A quick calculation comparing the average cost of one gallon of tap water to one gallon of commercial bottled water comes out to:
Tap water: $0.002 per gallon2, 5
Bottled water: Ranges from $0.89 to $8.26 per gal-lon.5, 6
Detail of Plastic Bottles, 2007, copyright Chris Jordan

Take Back the Tap
2
According to the Natural Resources Defense Council’s groundbreaking 1999 report, Bottled Water: Pure Drink or Pure Hype?, a $1.50 bottle of water generates a profit of about $0.50. Leaving out the cost of the water, this means
that bottling, packaging, shipping, marketing, retailing, and other expenses account for the lion’s share of the company’s costs.2 One should note that those are internal costs – what the company bears. They do not include the external economic, social, and environmental costs that society must pay, such as loss of groundwater, toxic emis-sions from plastic production and destruction, air pollution from transporting the products, and the disposal of loads of empty bottles.
In many cases, consumers are spending all that extra mon-ey on those billions of gallons of bottled water because they have bought into the beverage industry’s marketing magic that water in a plastic bottle is safer and healthier than tap water. A 2003 Gallup survey commissioned by the Envi-ronmental Protection Agency, the federal agency respon-sible for overseeing the safety, testing, and regulation of
“This is an industry that takes a free liquid that falls from the sky and sells it for as much as four times what we pay for gas.” – Richard Wilk, University of Indiana
Common Questions and Answers About Tap WaterQ: Why should I drink tap water instead of bottled wa-ter?
A: Over the course of a year, tap water costs hundreds or thousands less than bottled water and is just as clean and healthy as bottled water.
Q: How do I find out whether my tap water is safe?
A: Contact your local utility to request a copy of the Annual Water Quality Report, also referred to as the Consumer Confidence Report. This report is required by law to provide information about contaminant violations in the water system. EPA posts many of these results on its website at http://www.epa.gov/safewater/dwinfo/in-dex.html.
Local health departments often provide testing services or have lists of accredited laboratories that do the test-ing.
Q: What can I do if my water is contaminated?
A: Select a filter that removes the particular contami-nants that are present.
Q: Can a filter remove chlorine and fluoride?
A: When it comes to chlorine, the answer is “yes.” Most water filters remove or reduce this chemical disinfectant. On the other hand, fluoride is more of a challenge. Typi-cally, only reverse osmosis filters and distillation units reduce or remove it.
Q: My water tastes funny. What can I do about it?
A: Odd tasting water does not necessarily mean that it is unhealthy or contaminated. The taste could be due to chlorination or to the mineral content in the water, depending on the region of the state or country. A home filtration system is the best solution to this problem.
Q: What kind of re-usable bottle should I use to carry tap water?
A: Many people have concerns about plastic food con-tainers and beverage bottles because some chemicals in the plastic can leach into the contents. For this reason, Food & Water Watch recommends either stainless steel or lined aluminum bottles.
Q: Should I reuse disposable plastic bottles?
A: The disposable PET #1 plastic bottles in which bever-ages are sold cannot be properly cleaned and, over time, may leach plastic components into the water. Therefore, they should not be reused.
Q: What is a contaminant?
A: Water is very rarely pure H2O. It tends to grab par-ticles from things it passes and brings them along for the ride. Whether flowing in a mountain stream or pouring out of your faucet, water usually contains more than just oxygen and two hydrogen atoms. Some of these piggy-backers are harmless, but many are not.
The U.S. Environmental Protection Agency, which oversees the safety of tap water, currently regulates 87 different contaminants. The agency recognizes but does not regulate an additional 51 contaminants.

Food & Water Watch
3
U.S. drinking water and sewage systems, found that about 74 percent of the 1,000 survey respondents reported that they purchased and drank bottled water; 20 percent drank bottled water exclusively. When asked why they treated (includes boiling and filtering) their tap water or purchased bottled water, 33 percent of respondents cited health and safety concerns. The survey also found that people in their 30s and 40s, and those with higher education levels, were more likely than people in other age groups to drink bottled water than other segments of the population.6
In a separate poll, 86 percent of Americans expressed concern about their tap water. Forty-one percent of respon-dents reported using a water filter, bottled water, or both. About 56 percent of the bottled water drinkers cited safety and health as the primary reason they sought out alterna-tives to straight tap water.7
A third survey, this one a part of NRDC’s report, found that 47 percent of the respondents said they drank bottled water because of what they saw as health and safety problems with tap water.2
Melting the Myth of Purity: The Scoop on Bottled Water
All these statistics and perceptions might lead one to con-clude that all bottled water is clean and pure. It is not. The idea comes from the beverage industry spending millions of dollars a year to advertise and market bottled water as the quintessence of purity.
The Natural Resources Defense Council’s study tested 1,000 bottles of 103 bottled water brands for a range of pol-lutants, including arsenic, microbiological contaminants, and toxic chemicals.2
About one-quarter of the brands tested contained bacterial or chemical contamination in some samples at levels that violated “enforceable state standards or warning levels,” and nearly one-fifth of the tested brands “exceeded state bottled water microbial guidelines in at least some sam-ples.”2
In one of the report’s highlights, various bottled water companies had been buying water from a Massachusetts commercial spring near a hazardous waste site. Samples taken from the spring contained chemicals that likely cause cancer in humans.2 (The water is now used to fill swimming pools.8)
The study also found man-made chemicals, usually at levels below applicable state and federal standards, in about one-fifth of the brands. However, one sample contained a chemical commonly known as DEHP at higher levels than the federal government allows in tap water. DEHP is part of a chemical group called phthalate, which is used to pro-duce plastic, including the ubiquitous disposable 20-ounce plastic water bottles made with polyethylene terephthalate (PET, also readily identified with the numeral 1 on the bot-tom of the bottle). These chemicals are potential human cancer agents9 that can leach from the plastic into the wa-ter, even under normal conditions. Nonetheless, the federal government’s Food and Drug Administration, charged with overseeing the health and safety of bottled water, has no standard for phthalates, and in fact does not test for them. This is in part because of pressure from the bottled water industry.2
Key FactsBottled water costs hundreds or thousands of times • more than tap water.
Most tap water is just as clean and safe as bottled • water.
The idea that all bottled water is pure is a market-• ing myth.
Plastic bottles can leach chemicals into the water.•
The Food and Drug Administration regulates only • the 30 to 40 percent of bottled water sold across state lines.
U.S. plastic bottle production requires more than • 17 million barrels of oil, enough to fuel one million cars.26
About 86 percent of the empty plastic water bottles • in the United States land in the garbage instead of being recycled.27
Take Back the Tap
4
But microbes, synthetic chemicals, and other substances are not the only sources of bottled water contamina-tion. Sometimes the purification process itself produces problems. For example, ozonation is increasingly used to disinfect bottled water. However, the interaction of ozone with bromide, which is harmless, can form bromate, a pos-sible human carcinogen after long-term exposure. In 2006, FDA ordered a recall of several brands of bottled water with bromate levels that exceeded the standard of 10 parts per billion. The agency was only alerted after an independent laboratory discovered bromate levels of 27 parts per billion in the water.11 And in 2004, food safety authorities in the United Kingdom forced Coca-Cola to recall nearly 500,000 bottles of its Dasani brand bottled tap water because of excessive bromate.12
A Light Regulatory Path for Bottled Water
Federal bottled water testing and monitoring regulations are far weaker than those for tap, in part because the Food and Drug Administration regulates bottled water as a food under the Federal Food, Drug, and Cosmetic Act. In con-trast, the Environmental Protection Agency monitors tap water under the Safe Drinking Water Act.2
Perpetually under-funded and short-staffed, FDA has a woeful record of protecting consumer health and safety. Examples include the Spring 2007 melamine contamina-tion of pet food, pork and poultry feed, and fishmeal used in aquaculture. And as Food & Water Watch has reported, FDA is physically inspecting less and less imported seafood – less than two percent of shipments in 2006 – more and more of which is raised in crowded, filthy industrial fish farms in Asia.13 The regulatory reality with bottled water is similar, for the agency has less than one full-time employee devoted to bottled water oversight. The rules apply only to bottled water packaged and sold across state lines, which leaves out the 60 to 70 percent of water bottled and sold within a single state. FDA regulations also exempt carbon-ated bottled water.2
For the 30 to 40 percent of bottled water that FDA does regulate, it requires that companies test four empty bottles once every three months for bacterial contamination. They must test a sample of water after filtration and before bot-tling for bacteria once a week. When it comes to chemical, physical, and radiological contaminants, a sample of water must be checked only once a year. The companies do not have to test the water after bottling or storage.14
And just because contamination shows up in bottled water that falls under its jurisdiction does not mean FDA will take action. The agency has stated that it may do nothing as long as the bottler clearly states on the label that the product is substandard or contains excessive chemical substances. FDA could take action if the substandard water injured hu-man health, but this is unlikely unless someone reports it.2
Nearly 40 states say they have bottled water laws and regu-lations, meaning one out of five do not. Some of the state regulations mirror FDA standards, some are more strin-gent, and some fall far short of ensuring consumer safety.2
PhthalatesPhthalates – chemicals used to soften plastics, including plastic water bottles – can disrupt human endocrine function. The endocrine glands produce and regulate hormones that manage our vital func-tions, such as reproduction, breathing, and thinking. Disrupting these bodily processes can lead to birth defects, cancer, or developmental problems in babies and children.10
Researchers, public health officials, policymakers, plastics industry representatives, and citizen organi-zations have long been debating whether and how much phthalates and other synthetic chemicals harm human health. Scientists have confirmed that phthal-ates can disrupt the endocrine system in rodents and are “ubiquitous in our world – in plastics, nail pol-ish, perfumes, toothbrushes, pesticides, paint, and the coating on time-release pills.” But, ethical issues aside, proving this in humans is more difficult. For ex-ample, when studying chemical exposure in the womb (or before birth), “determining the effect of any par-ticular chemical on an individual is nearly impossible because it is so difficult to figure out which chemicals the individual’s mother was exposed to during preg-nancy.” However, a researcher at the University of Rochester School of Medicine published the first study to link women’s prenatal phthalate exposure to mea-surable effects on the genital development of their male offspring. She favors further study “because the mothers of babies with the physical traits she ob-served had been exposed to levels of phthalates that, according to estimates from the Centers for Disease Control and Prevention, are present in the bodies of one-quarter of all American women.”10
The bottling companies do not have to test the water after bottling or storage.
Food & Water Watch
5
Reality Check: Tap Water is Healthy, Safe, and Monitored
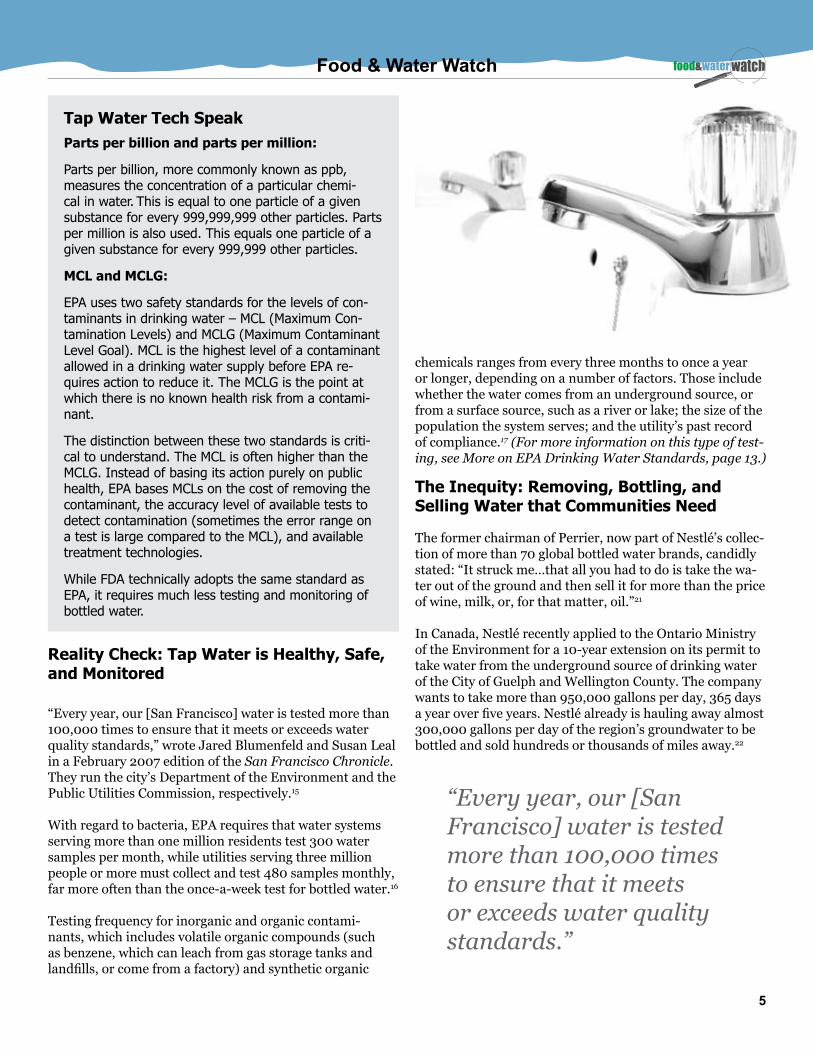
“Every year, our [San Francisco] water is tested more than 100,000 times to ensure that it meets or exceeds water quality standards,” wrote Jared Blumenfeld and Susan Leal in a February 2007 edition of the San Francisco Chronicle. They run the city’s Department of the Environment and the Public Utilities Commission, respectively.15
With regard to bacteria, EPA requires that water systems serving more than one million residents test 300 water samples per month, while utilities serving three million people or more must collect and test 480 samples monthly, far more often than the once-a-week test for bottled water.16
Testing frequency for inorganic and organic contami-nants, which includes volatile organic compounds (such as benzene, which can leach from gas storage tanks and landfills, or come from a factory) and synthetic organic
chemicals ranges from every three months to once a year or longer, depending on a number of factors. Those include whether the water comes from an underground source, or from a surface source, such as a river or lake; the size of the population the system serves; and the utility’s past record of compliance.17 (For more information on this type of test-ing, see More on EPA Drinking Water Standards, page 13.)
The Inequity: Removing, Bottling, and Selling Water that Communities Need
The former chairman of Perrier, now part of Nestlé’s collec-tion of more than 70 global bottled water brands, candidly stated: “It struck me…that all you had to do is take the wa-ter out of the ground and then sell it for more than the price of wine, milk, or, for that matter, oil.”21
In Canada, Nestlé recently applied to the Ontario Ministry of the Environment for a 10-year extension on its permit to take water from the underground source of drinking water of the City of Guelph and Wellington County. The company wants to take more than 950,000 gallons per day, 365 days a year over five years. Nestlé already is hauling away almost 300,000 gallons per day of the region’s groundwater to be bottled and sold hundreds or thousands of miles away.22
“Every year, our [San Francisco] water is tested more than 100,000 times to ensure that it meets or exceeds water quality standards.”
Tap Water Tech SpeakParts per billion and parts per million:
Parts per billion, more commonly known as ppb, measures the concentration of a particular chemi-cal in water. This is equal to one particle of a given substance for every 999,999,999 other particles. Parts per million is also used. This equals one particle of a given substance for every 999,999 other particles.
MCL and MCLG:
EPA uses two safety standards for the levels of con-taminants in drinking water – MCL (Maximum Con-tamination Levels) and MCLG (Maximum Contaminant Level Goal). MCL is the highest level of a contaminant allowed in a drinking water supply before EPA re-quires action to reduce it. The MCLG is the point at which there is no known health risk from a contami-nant.
The distinction between these two standards is criti-cal to understand. The MCL is often higher than the MCLG. Instead of basing its action purely on public health, EPA bases MCLs on the cost of removing the contaminant, the accuracy level of available tests to detect contamination (sometimes the error range on a test is large compared to the MCL), and available treatment technologies.
While FDA technically adopts the same standard as EPA, it requires much less testing and monitoring of bottled water.

Take Back the Tap
6
Nestlé’s water removal projects in Michigan and Califor-nia have drawn criticism and protests, as well. Opponents charge that the company, whose brand names include Deer Park, Poland Springs, Arrowhead, and Ice Mountain, is harming both the environment by depleting aquifers and other groundwater sources and the local economy by pay-ing too little for the water it takes.
The company extracts some of the water for its Pure Life and Ice Mountain spring water brands from underground sources in Mecosta County, Michigan. In 2002, a state court judge ruled that the removal of the water had harmed community residents and the environment. Three years later, however, the state appeals court reversed the earlier decision and said that Nestlé had a legitimate right to take the water.23
Nestlé’s thirst also has roiled the waters in northern Cali-fornia. In 2003, it entered into an agreement with the Mc-Cloud Community Service District to extract water from the slopes of Mount Shasta. Under the 50-year contract, Nestlé will build a one million-square-foot facility to bottle more than 500 million gallons of local water annually.3
McCloud residents fought the plan, contending that the company paying only $300,000 a year for access to the water would leave the town with only a penny for every 17 gallons. They also emphasized the environmental problems that taking so much water would create. This resonated with a Siskiyou County Superior Court judge who nixed the contract in 2005. However, a state appeals court reinstated the deal in early 2007. That means that unless the deal is challenged before California’s Supreme Court, Nestlé could begin building the plant in 2007.3
The McCloud Watershed Council contends that the contract gives Nestlé preference over the town’s ratepayers because the company could draw the maximum amount of water it wants, regardless of drought or water shortage, and that the local water district bears all the responsibility for the wellbeing of the springs and the water infrastructure.24
FluorideFluoride, which many communities have decided to add to drinking water to prevent tooth decay, is very controversial, and many people do not want to be exposed to it.
The Environmental Protection Agency has set an enforceable drinking water standard for fluoride of 4 milligrams per liter (some people who drink water containing fluoride in excess of this level over many years could get bone disease, including pain and ten-derness of the bones). EPA has also set a secondary fluoride standard of 2 mg/L to protect against dental fluorosis, which in moderate or severe forms, could lead to brown staining and pitting of the permanent teeth. This problem occurs only in developing teeth, before they erupt from the gums. Children under 9 years old should not drink water that has more than 2 mg/L of fluoride.18
In March 2006, the National Academy of Science re-leased a report stating that fluoride levels in municipal water were not benefiting human health and should be lowered.19
Decisions about whether to add fluoride to a commu-nity’s drinking water are made at the state and local level. Contact your town council, state legislature, or state water regulatory agency if you are concerned about your local fluoride standard. Fluoride levels can be reduced by some filtration systems.
“Shouldn’t a multibillion dollar international corporation pay for the water it uses, just like McCloud’s less wealthy residents?”

Food & Water Watch
7
“In the contract, Nestlé’s bill for water use is 200 House-hold Equivalents per month. The average American family uses approximately 400 gallons of water per day. Nestlé will use 1,800 gallons of spring water per day, with ac-cess to unlimited groundwater and 8,500 acre-feet annu-ally of water from the McCloud river pipe at Lakin Dam…To appropriately bill Nestlé just for its spring water use, Nestlé would need to pay 4,490 Household Equivalents per month. Shouldn’t a multibillion dollar international cor-poration pay for the water it uses, just like McCloud’s less wealthy residents?”25
Environmental Implications: Producing Plastic, Transporting Billions of Bottles, and Changing the Climate
Making the plastic for all those bottles and transporting the finished product over hundreds or thousands of miles con-sumes energy, pollutes the environment, and contributes to global warming.
Annual production of the plastic (PET or polyethylene) bottles to meet U.S. consumer demand for bottled water takes the equivalent of about 17.6 million barrels of oil, not including the cost of transporting the bottled water to con-sumers. That more or less equals the amount of oil required to fuel more than one million vehicles on U.S. roads each year. Worldwide bottling of water uses about 2.7 million tons of plastic each year.26
A 2006 Earth Policy Institute study found that the British bottled water industry annually generates about 30,000
tons of carbon dioxide, which equals the energy consump-tion of 6,000 homes a year. The institute’s research director said: “Tap water is delivered through an energy-efficient infrastructure. On the other hand, nearly a quarter of all bottled water crosses national boundaries to reach consum-ers.”27
And after the production of billions of plastic bottles and the national and international travel of bottled water, billions of empty bottles remain. About 86 percent of the empty plastic water bottles in the United States land in the garbage instead of being recycled.26 That amounts to about two million tons of PET plastic bottles piling up in U.S. landfills each year. Single serve water bottles and other beverage containers, often used on the go, are recycled at a lower rate than containers typically used at home. The national recycling rate for all PET type #1 plastic fell from 39.7 percent in 1995 to 23.1 percent in 2005.28
Ultimately, many plastic bottles of all types and sizes will be incinerated, which releases toxic byproducts such as chlorine gas and ash laden with heavy metals.26
ChlorineMany utilities add chlorine to their source water to kill bacteria or parasites and to prevent bacterial growth in the distribution system. However, when chlorine combines with organic matter, such as farm runoff, it creates dangerous byproducts. To stay below EPA standards for such byproducts, some water suppliers use related chemical disinfectants called chloramines (a combination of chlorine and ammonia). However, these also create different byproducts and are poten-tially toxic to some sensitive populations.18
Instead of treating drinking water with large amounts of chlorine, we should clean up rivers and lakes that serve as our drinking water sources, invest in filtra-tion and alternative first-stage treatment disinfection technologies, and maintain appropriate levels of chlo-rination in the distribution system to protect public health.20 Alternative disinfection technologies include ultraviolet light, ozonation, and reverse osmosis.
Take Back the Tap
8
The production and transport of bottled water prod-ucts causes pollution and contributes to global warming. However, this resulting climate change in turn could affect underground and surface water (e.g., lakes and rivers) sources in various parts of the world. In 2005, the journal Nature published a study showing how climate change could diminish water sources dependent on melting snow. With warmer periods, earlier snowmelt could mean that “much of the winter runoff will immediately be lost to the oceans” unless we have adequate water storage systems.29 But this, like protecting our water sources from pollution, requires money. It also means halting or severely curbing Nestlé, Coca-Cola, Pepsi, and other commercial bottlers from taking spring water and municipal water to be bottled into easy profits.
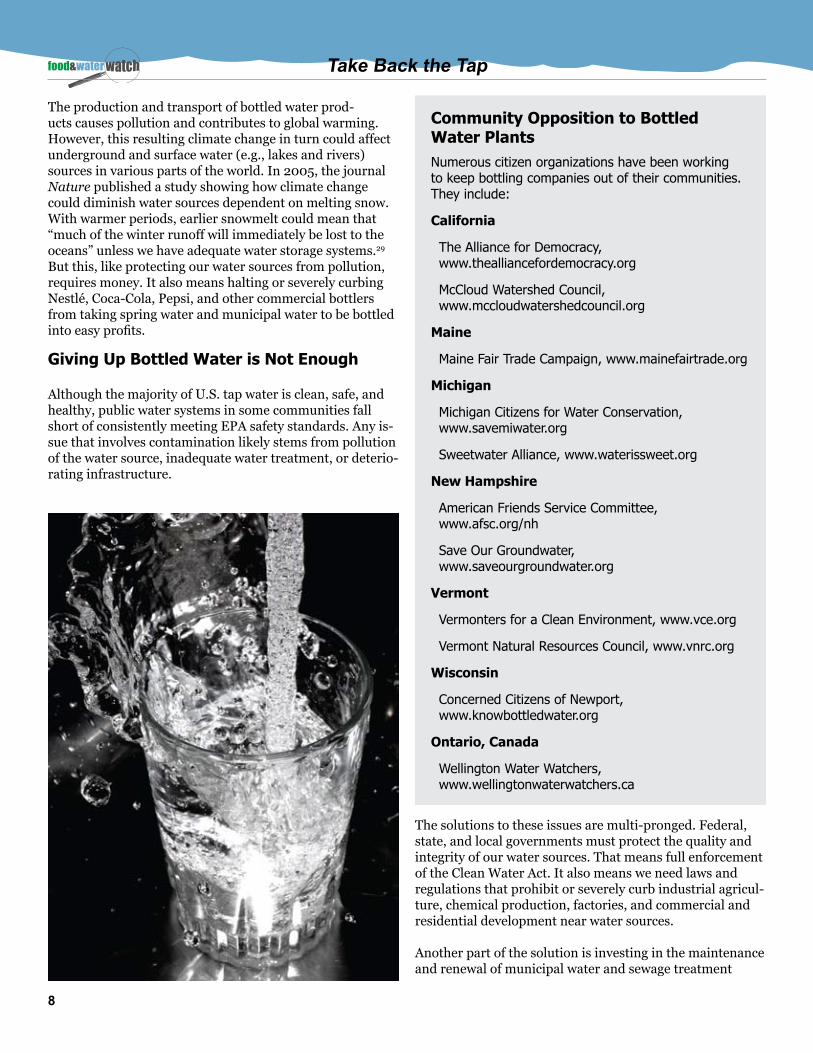
Giving Up Bottled Water is Not Enough
Although the majority of U.S. tap water is clean, safe, and healthy, public water systems in some communities fall short of consistently meeting EPA safety standards. Any is-sue that involves contamination likely stems from pollution of the water source, inadequate water treatment, or deterio-rating infrastructure.
The solutions to these issues are multi-pronged. Federal, state, and local governments must protect the quality and integrity of our water sources. That means full enforcement of the Clean Water Act. It also means we need laws and regulations that prohibit or severely curb industrial agricul-ture, chemical production, factories, and commercial and residential development near water sources.
Another part of the solution is investing in the maintenance and renewal of municipal water and sewage treatment
Community Opposition to Bottled Water PlantsNumerous citizen organizations have been working to keep bottling companies out of their communities. They include:
California
The Alliance for Democracy, www.thealliancefordemocracy.org
McCloud Watershed Council, www.mccloudwatershedcouncil.org
Maine
Maine Fair Trade Campaign, www.mainefairtrade.org
Michigan
Michigan Citizens for Water Conservation, www.savemiwater.org
Sweetwater Alliance, www.waterissweet.org
New Hampshire
American Friends Service Committee, www.afsc.org/nh
Save Our Groundwater, www.saveourgroundwater.org
Vermont
Vermonters for a Clean Environment, www.vce.org
Vermont Natural Resources Council, www.vnrc.org
Wisconsin
Concerned Citizens of Newport, www.knowbottledwater.org
Ontario, Canada
Wellington Water Watchers, www.wellingtonwaterwatchers.ca
Food & Water Watch
9
plants, storage, and distribution. Most of the primary water pipes and sewer lines under our streets – out of sight, out of mind – were built during the late 1800s, the 1920s, and in the years immediately following World War II.30 They are wearing out under the weight of age and a growing popula-tion. Old, corroded water lines can break, not only wasting water but also opening avenues for contamination. Worn out or overburdened sewage systems can overflow into our streams, rivers, lakes, and oceans, creating serious health concerns.
Sewage overflows are one of the leading causes of beach closures, hurting local wildlife and robbing communities of
tourism dollars. In 2005, public health agencies issued more than 20,000 warnings against swimming on U.S. coastal beaches.31
The National Research Council re-cently warned of more water-borne disease outbreaks unless we make “substantial investments” in improv-ing our drinking water and sewage storage and distribution systems.32
Every year Congress debates propos-als for funding clean drinking water. A 2007 bill would provide $14 billion in federal loan guarantees over four years for water and sewer improve-ments. Unfortunately, even if the legislation were to pass, it would be insufficient.33
The fact is, our communities fall about $22 billion short annually of what they need to maintain and improve pub-lic drinking water and sewage systems. Federal dollars are the only way to address this clean water infrastructure funding gap estimated by the U.S. Environ-mental Protection Agency, Government Accountability Office, and the non-profit Water Infrastructure Network at between $300 and $500 billion33 over 20 years. Much of the funding gap stems from government cuts for clean wa-ter. While it is true that 2007 legislation potentially would increase funding, successive presidents have requested less money for clean water.
A federal clean water trust fund would provide billions of dollars, year after year, decade after decade, to invest in clean and safe drinking water for every community and every person in the United States. The fairest way to finance such a fund would be for polluters to pay. This might include fees on flushable consumer items, such as toilet paper, increased permitting fees for dumping, and fees on toxics manufacturers, including plastic producers.
FiltrationFor those consumers who live in communities with tap water that fails to consistently meet federal clean wa-ter standards or simply tastes funny, the answer is not to drink bottled water. First, they should contact their local utility to request a copy of the Annual Water Quality Report, also called the Consumer Confidence Report. Consumers can have their water tested for contaminants and then purchase a filtration system that removes the specific contaminants in their water. Local health departments often provide testing ser-vices or have lists of accredited laboratories that do.
Filtration is much cheaper than buying bottled water. Most Americans pay about $2 per 1,000 gallons for municipal water service, according to the American Water Works Association. That translates to two thou-sandths of a penny ($0.002) per gallon. Filtering tap water with a unit under the sink increases the cost to about $0.10 per gallon, while a counter top unit increases the cost to $0.25 per gallon. In comparison, bottled water typically costs more than $1 for eight to 12 ounces.5 This is on top of the monthly water bills to cook, wash clothes and dishes, bathe, and flush the toilet. (For more information on filtration, please see Guide to Home Tap Water Filtration, page 11.)

Take Back the Tap
10
Conclusion
American consumers drink more bottled water every year and spend more money doing it because they think it is safer than tap water.
But this idea of bottled water being pure is a myth. In real-ity, such water generally is no cleaner, or safer, or healthier than tap water. In fact, the federal government requires far more rigorous safety monitoring of municipal tap water.
The production of bottled water causes significant equity, public health, and environmental problems. These include taking water from communities that depend on it, polluting the environment during the production of plastic, contrib-uting to global warming by transporting bottled water over great distances, and irresponsibly disposing of billions of empty bottles.
But switching from bottled to tap water must also go along with the federal government creating a clean water trust fund to generate the billions of dollars necessary to main-tain and improve drinking water and sewage systems.
Recommendations to Consumers:
Choose tap water over bottled water whenever possible.•
Sign the Take Back the Tap pledge at: • www.foodandwaterwatch.org/water/bottled
Support increased funding for public drinking water by • signing our petition urging Congress to create a clean water trust fund. Available at: www.foodandwaterwatch.org/water/americaswater
Recommendations to Congress
Pass a clean water trust fund to help communities • invest in improving our drinking water and sewage systems.
Increase Environmental Protection Agency funding • for drinking water oversight and for fully enforcing the Clean Water Act to protect against pollution of drinking water sources.
Restaurants Using Filtered Tap WaterA number of high-end restaurants have chosen to go with filtered tap water and give up bottled water. One of those is the famous Chez Panisse Restau-rant, founded by Alice Waters in Berkeley, California in 1971. Mike Kossa-Rienzi, the long-time general manager of the restaurant, switched from bottled still water to filtered tap water about a year ago.
In the summer of 2006, he was working in the restaurant’s storage area and thought about all the boxes of bottled water. He said to himself, “This is just too much water. We are paying for water trucked from somewhere in Italy to a port, put on a ship, sent here and then trucked to our restaurant from a port. And we have to deal with all the empty bottles.” So, he called the distributor to cancel any more bottled water and then “quietly took it off the menu.” He remembers Alice Waters asking, “Ok, so when are we going to stop the (bottled) carbonated water?”
That process began first in the downstairs restaurant in February 2007 with the installation of an in-house carbonator. He envisions the carbonator for the café upstairs will be fully functional within the next three to four months.34
The New York Times recently highlighted other res-taurants, cafes, and establishments that are no longer serving bottled water. In the San Francisco Bay area, they include Incanto, Poggio, Nopa, and the ice cream shop Ici. Incanto’s website states: “Serving our local water in reusable carafes makes more sense for the environment than manufacturing thousands of single-use glass bottles for someone to use once and throw away.”35
But this is not just a California cause, for the move-ment has spread eastward. In New York City, Joseph Bastianich and Mario Batali soon will have their famous upscale Del Posto restaurant offering only filtered tap water. The Birdbath Neighborhood Green Bakery has banned bottled water at its two locations, one in the East Village and the other in Greenwich Village. In Quechee, Vermont, the Farmers Diner does not offer bottled water.35

Food & Water Watch
11
Filtering water at home is cheaper and safer than depend-ing on bottled water. Indeed, as much as 40 percent of bottled water is purified tap water.2
Choosing a water filter can seem like a daunting process, but it does not have to be.
1. The first step is to find out what is in your water. For this, contact your local utility and request a copy of the Annual Water Quality Report, also called the Con-sumer Confidence Report. Every utility is required by law to provide this and usually includes it with a monthly bill. This report will give you information about any con-taminant violations in your water system and to help you figure out what type of filtration system is best for your home. EPA posts many of these results on its website at www.epa.gov/safewater/dwinfo/index.html36, 37
In addition to, or instead of, obtaining the water quality report, you can call your local health department and ask if they can test your water or provide a list of certified laboratories that can.
2. Once you know whether your water has contami-nants, the next step is to find the proper filtra-tion product to remove or reduce them.
Do you want to filter all of the water in the house or just your drinking water? Some people do elect to filter all their water, and so choose a point-of-entry filter, or POE, which typically is installed on your water service pipe just after the meter. However, the majority of consum-ers select a point-of-use filter, or POU, to treat just their
drinking water. Often times these units rest on or under the countertop, and the consumer presses a lever or knob to divert water through the unit for purification. However, many such filtration units come in the form of a pitcher that consumers fill with water and then refrig-erate.36, 37
3. Assuming that you have elected to filter just your drink-ing water, the next key step is to decide what kind of filtration technology you need in that counter-top unit or pitcher. Before buying, though, make sure your product choice is independently certified for design, material safety, and effectiveness for the contaminants you want removed. The most notable and well-regarded organizations (all non-profit) that test and verify water treatment and filtration products are:
• National Sanitation Foundation International (www.nsf.org)
• Water Quality Association (www.wqa.org)
• Underwriters Laboratories Inc. (www.ul.com)
Important to consider in the water filtration product you buy is the type of filter and how it works.
Adsorption filters are the most common. They usually employ activated carbon or granular activated charcoal to remove or reduce chlorine, particulate matter, and organic
A quick calculation comparing the average cost of one gallon of tap water to one gallon of commercial bottled water comes out to:
Tap water: $0.002 per gallon2, 5
Bottled water: Ranges from $0.89 to $8.26 per gal-lon.5, 6
Before talking about how to get rid of contaminants, we should first talk about what they are. Water is very rarely pure H2O. Being one of the greatest solvents in existence, water tends to grab particles from things it passes and brings them along for the ride. Whether flowing in a mountain stream or pouring out of your faucet, water almost invariably contains more than its one oxygen and two hydrogen atoms. Some of these piggy-backers are harmless, but unfortunately many of them are quite bad for us. These unwanted chemi-cals in our water are called contaminants.
The Environmental Protection Agency, which oversees the safety of tap water, currently regulates 87 differ-ent contaminants. The agency recognizes but does not regulate an additional 51 contaminants.
Guide to Home Tap Water Filtration
Take Back the Tap
12
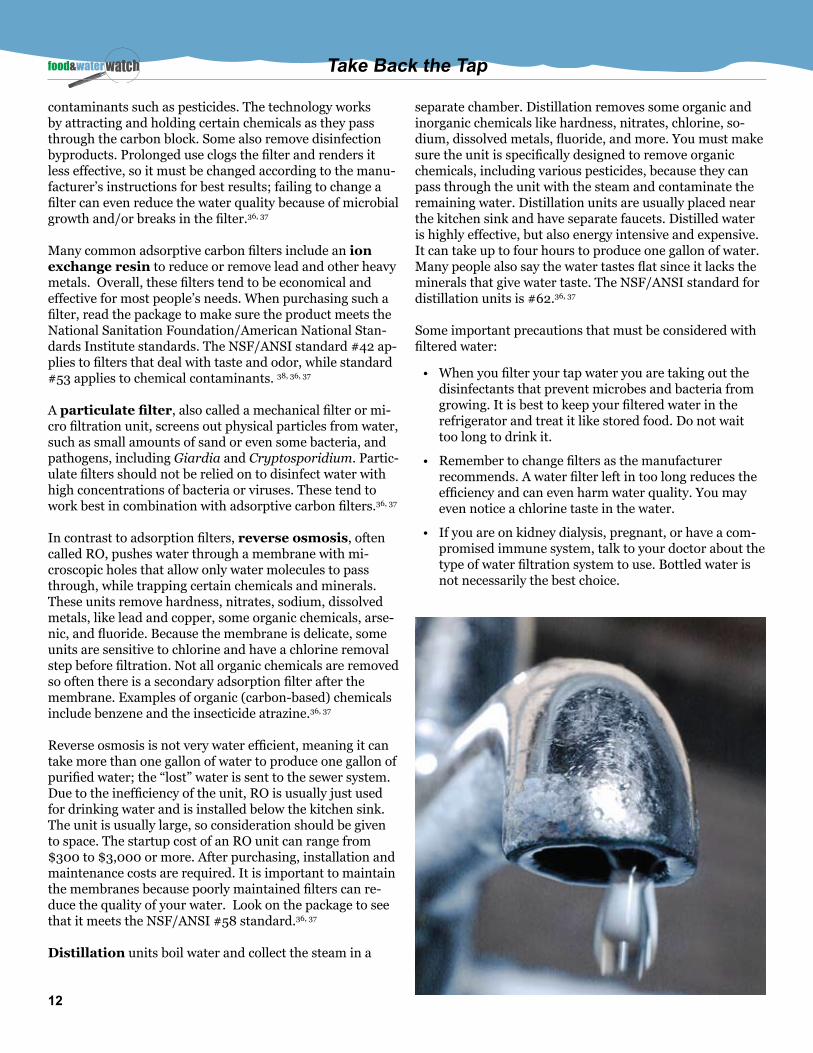
contaminants such as pesticides. The technology works by attracting and holding certain chemicals as they pass through the carbon block. Some also remove disinfection byproducts. Prolonged use clogs the filter and renders it less effective, so it must be changed according to the manu-facturer’s instructions for best results; failing to change a filter can even reduce the water quality because of microbial growth and/or breaks in the filter.36, 37
Many common adsorptive carbon filters include an ion exchange resin to reduce or remove lead and other heavy metals. Overall, these filters tend to be economical and effective for most people’s needs. When purchasing such a filter, read the package to make sure the product meets the National Sanitation Foundation/American National Stan-dards Institute standards. The NSF/ANSI standard #42 ap-plies to filters that deal with taste and odor, while standard #53 applies to chemical contaminants. 38, 36, 37
A particulate filter, also called a mechanical filter or mi-cro filtration unit, screens out physical particles from water, such as small amounts of sand or even some bacteria, and pathogens, including Giardia and Cryptosporidium. Partic-ulate filters should not be relied on to disinfect water with high concentrations of bacteria or viruses. These tend to work best in combination with adsorptive carbon filters.36, 37
In contrast to adsorption filters, reverse osmosis, often called RO, pushes water through a membrane with mi-croscopic holes that allow only water molecules to pass through, while trapping certain chemicals and minerals. These units remove hardness, nitrates, sodium, dissolved metals, like lead and copper, some organic chemicals, arse-nic, and fluoride. Because the membrane is delicate, some units are sensitive to chlorine and have a chlorine removal step before filtration. Not all organic chemicals are removed so often there is a secondary adsorption filter after the membrane. Examples of organic (carbon-based) chemicals include benzene and the insecticide atrazine.36, 37
Reverse osmosis is not very water efficient, meaning it can take more than one gallon of water to produce one gallon of purified water; the “lost” water is sent to the sewer system. Due to the inefficiency of the unit, RO is usually just used for drinking water and is installed below the kitchen sink. The unit is usually large, so consideration should be given to space. The startup cost of an RO unit can range from $300 to $3,000 or more. After purchasing, installation and maintenance costs are required. It is important to maintain the membranes because poorly maintained filters can re-duce the quality of your water. Look on the package to see that it meets the NSF/ANSI #58 standard.36, 37
Distillation units boil water and collect the steam in a
separate chamber. Distillation removes some organic and inorganic chemicals like hardness, nitrates, chlorine, so-dium, dissolved metals, fluoride, and more. You must make sure the unit is specifically designed to remove organic chemicals, including various pesticides, because they can pass through the unit with the steam and contaminate the remaining water. Distillation units are usually placed near the kitchen sink and have separate faucets. Distilled water is highly effective, but also energy intensive and expensive. It can take up to four hours to produce one gallon of water. Many people also say the water tastes flat since it lacks the minerals that give water taste. The NSF/ANSI standard for distillation units is #62.36, 37
Some important precautions that must be considered with filtered water:
When you filter your tap water you are taking out the • disinfectants that prevent microbes and bacteria from growing. It is best to keep your filtered water in the refrigerator and treat it like stored food. Do not wait too long to drink it.
Remember to change filters as the manufacturer • recommends. A water filter left in too long reduces the efficiency and can even harm water quality. You may even notice a chlorine taste in the water.
If you are on kidney dialysis, pregnant, or have a com-• promised immune system, talk to your doctor about the type of water filtration system to use. Bottled water is not necessarily the best choice.

Food & Water Watch
13
The Environmental Protection Agency regulates U.S. drink-ing water under the Safe Drinking Water Act. With regard to bacteria, EPA requires that water systems serving more than one million residents test 300 water samples per month, while utilities serving three million people or more must collect and test 480 samples monthly, far more often than the once-a-week test for bottled water.16
EPA began phasing in new regulations for various inorganic and organic pollutants, including pesticides, in the early 1980s through the early 1990s. For the first year of each new rule or the first operating year of any facility built after the rule was implemented, EPA requires monitoring every three months. If the contaminant readings consistently fall below allowable limits during that first year, then the facil-ity may be allowed to test less frequently.
Inorganic contaminants (includes asbestos and heavy metals, such as lead)
If the water source is underground (groundwater), then the water supplier must initially monitor and test for these compounds every three months for the first year.
If the results consistently fall below the maximum contami-nant level, then the water utility can reduce monitoring to once every 3 years. However, if at any time the contaminant levels exceed the MCL, the utility must revert to quarterly monitoring. After an extended period of time with readings well below the MCL, the utility can apply to the state for a waiver. After considering a number of criteria, the state can grant the waiver, allowing for monitoring every 9 years.
If the drinking water comes from a lake or river, referred to in drinking water speak as surface water, then the util-ity must initially monitor and test for contaminants every three months during the first year. Then, if the results are below the maximum contaminant level, it can shift to yearly monitoring. After an extended period of time with read-ings below the MCL, the utility can apply to the state for a waiver that allows it to be monitored every 9 years.
Synthetic contaminants, including some pesticides
EPA’s criterion here is the size of the population served. If serving more than 3,300 people, a water provider must initially test every three months. If the contaminants are not detected, the utility can decrease its testing frequency to twice every three years. If at any time monitoring results exceed the MCL, the utility must return to testing every three months. An extended period of time with readings below detection allows the utility to apply to the state for a waiver allowing it to test once every three years.
Volatile Organic Compounds (VOCs), such as benzene
If the supplier gets its water from underground (ground-water source):
It must initially test samples of the water once each quarter. If the utility consistently turns in readings at below detec-tion level, it can move to annual testing. With consistent results below detection limit, it can apply to the state for a waiver that would allow it to monitor every six years.
If the water comes from a surface source:
It must initially be tested each quarter for a year. If the re-sults are consistently below the detection limit, it may go to annual testing. If the state grants a waiver, the supplier can test once every three years.
Nitrates
These are treated much more stringently than other con-taminants because they can cause acute sickness or death in babies.
All water suppliers, regardless of their water source and the size of the population they serve, must test for nitrates at least once a year. If the results are greater than or equal to half of the maximum contaminant level, then the supplier must monitor once every three months.
Private wells are not regulated or monitored by EPA. The agency suggests that they be tested once a year.
Links to EPA’s National Water Program Plan (and mea-sures): www.epa.gov/water/waterplan/
Program activity measures supporting national program guidance: www.epa.gov/water/waterplan/documents/FY06NPGappendix-a.pdf
2006 End-of-Year Performance (water safe to drink): www.epa.gov/water/waterplan/documents/ fy06_eoy_narrative.pdf
Source: Christ, Lisa. Personal interview. Environmental Protection Agency, Office of Ground Water Drinking Water; Environmental Protection Agency contaminants website: www.epa.gov/safewater/contaminants/index.html
More on EPA Drinking Water Standards

Take Back the Tap
14
Endnotes1 “State of the Industry.” Beverage World, April 2006.
2 “Bottled Water: Pure Drink or Pure Hype?” Natural Resources Defense Council, March 1999. Available at: www.nrdc.org/water/drinking/bw/bwinx.asp
3 Lazarus, David. “Spin the (water) bottle: With $11 billion in U.S. sales, the beverage’s marketers have become the clear winners.” San Francisco Chronicle, Jan. 17, 2007. Available at: www.sfgate.com/cgi-bin/article.cgi?file=/c/a/2007/01/17/BUG35NIVFK70.DTL
4 Gunther, Marc. “Bottled water: No longer cool?” Fortune, April 25, 2007.
5 Franklin, Pat, “Down the drain: Plastic water bottles should no lon-ger be a wasted resource” Waste Management World, May-June 2006. Available at: “http://container-recycling.org/mediafold/newsarticles/plastic/2006/5-WMW-DownDrain.htm”
6 “Analysis and Findings of The Gallup Organization’s Drinking Water Customer Satisfaction Survey.” Environmental Protection Agency, August 6, 2003. Available at www.epa.gov/safewater/ccr/tools.html
7 “Consumer Perceptions of Tap Water, Bottled Water, and Filtration Devices.” Awwa Research Foundation, 2003.
8 Massachusetts State Senate Hearing # 2135, 2000, Money Down the Drain? A Review of Bottled Water in Massachusetts, electronic document, accessed 04/23/07. Available at: www.mass.gov/legis/bottledwater.htm
9 Environmental Protection Agency. Drinking Water Contaminants web-site: www.epa.gov/safewater/contaminants/
10 Daly, Gay. “Bad Chemistry” OnEarth (published by the Natural Resources Defense Council), Winter 2006. Available at www.nrdc.org/onearth/06win/chem1.asp?r=n
11 Mercer, Chris. “FDA to recall more bottled water in bromate scare.” Food Quality News, August 24, 2006. Available at: www.foodqualitynews.com/news/ng.asp?n=70089-bromate-bottled-water-fda
12 “Coke recalls controversial water.” BBC News, March 19, 2004. Available at http://news.bbc.co.uk/1/hi/business/3550063.stm
13 “Import Alert: Government Fails Consumers, Falls Short on Seafood Inspection.” Food & Water Watch, May 2007. Available at: www.foodandwaterwatch.org/fish/pubs/reports/import-alert
14 21 CFR § 129.80 (e) (2007).
15 Blumenfeld, Jared and Leal, Susan. “The real cost of bottled water.” San Francisco Chronicle, Feb. 18, 2007.
16 Environmental Protection Agency. Total Coliform Rule: A Quick Refer-ence Guide, November 2001. Available at: www.epa.gov/safewater
17 Christ, Lisa. Personal interview. Environmental Protection Agency, Of-fice of Ground Water Drinking Water; Environmental Protection Agency contaminants website: www.epa.gov/safewater/contaminants/index.html
18 Environmental Protection Agency, Office of Ground Water & Drinking Water. Available at: www.epa.gov/safewater/hfacts.html
19 “Fluoride in Drinking Water: A Scientific Review of EPA’s Standards.” The National Academy of Science, March 2006. Available at: http://books.nap.edu/catalog.php?record_id=11571
20 “Consider the source.” Environnmental Working Group, January 2001. Available at: www.ewg.org/reports/considerthesource/es.html
21 Ferrier, Catherine. “Bottled Water: Understanding a Social Phenom-enon.” Report commissioned by the World Wildlife Fund, April 2001, page 19.
22 Wellington Water Watchers, www.wellingtonwaterwatchers.ca/
23 “A brief history of Nestle’s water battles in Michigan.” Notes from pre-sentation by Tom Clarke, Polaris Institute, Canada, December 20, 2006. Available at: http://waterwars.wordpress.com/2006/12/20/a-brief-histo-ry-of-nestles-water-battles-in-michigan/
24 The Nestlé Project. McCloud Watershed Council. Available at: www.mccloudwatershedcouncil.org/nestle/index.html
25 The Nestlé Project: The Bad Deal. Available at: www.mccloudwatershedcouncil.org/nestle/baddeal.html
26 Arnold, Emily and Janet Larsen. “Bottled water: Pouring resources down the drain.” Earth Policy Institute, Feb. 2, 2006. Available at www.earth-policy.org/Updates/2006/Update51.htm
27 “Disaster in a bottle.” Sydney Morning Herald, April 24, 2007. Available at www.energizewater.com/index_files/bottwater.htm
28 “Bottled Water Pricey in More Ways than One.” Worldwatch Institute, May 2007. Available at: www.worldwatch.org/node/5063
29 Barnett, T.P, Adam, J.C., Lettenmaier, D.P. “Potential impacts of a warming climate on water availability in snow-dominated regions.” Na-ture. Vol. 438, 303-309. November 17, 2005.
30 Water Infrastructure Network. Available at www.win-water.org/legisla-tivecenter/ingham3_28_01.shtml
31 “Testing the Waters: A Guide to Water Quality at Vacation Beaches.” Natural Resources Defense Council, 2006. Available at: www.nrdc.org/water/oceans/ttw/titinx.asp
32 “Drinking Water Distribution Systems: Assessing and Reducing Risks.” National Research Council, 2006.
33 “House passes clean water bill.” Water Infrastructure Network news release, March 8, 2007. Available at www.win-water.org/news/030807article.shtml
34 Personal Interview. Mike Kossa-Rienzi, June 1, 2007.
35 Burros, Marian. “Fighting the tide, a few restaurants tilt to tap water.” The New York Times, May 30, 2007.
36 “Clear choices for clean drinking water.” Consumer Reports, January 2003.
37 Sustainability of Semi-Arid Hydrology and Riparian Area (SAHRA). University of Arizona. Available at: www.sahra.arizona.edu/programs/akyw/options.html
38 The Brita Products Company, “FAQ” section of its website at www.brita.com/index_us.html


Food & Water Watch1616 P St. NW, Suite 300Washington, DC 20036tel: (202) 683-2500fax: (202) [email protected]