Programs in Human Resources, Labor, Employment Relations ...
Upload
united-nations-development-programmeCategory
view
222download
4description

EmploymEnt in the context of human development
NatioNal HumaN DevelopmeNt RepoRt2008-2009
T a j i k i s t a n


T a j i k i s t a n
Employment in the context of human
development
NatioNal HumaN DevelopmeNt RepoRt 2008-2009
DuSHaNBe – 2010

uNiFem is the women's fund at the united Nations, dedicated to advancing women’s rights and achieving gender equality. it provides financial and technical assistance to innovative programmes and strategies that foster women's empowerment. uNiFem works on the premise that it is the fundamental right of every woman to live a life free from discrimination and violence, and that gender equality is essential to achieving development and to building just societies. uNiFem focuses its activities on one overarching goal: to support the implementation at the national level of existing international commitments to advance gender equality. in support of this goal, uNiFem works in the following thematic areas:
• enhancing women’s economic security and rights, • ending violence against women, • reducing the prevalence of Hiv and aiDS among women and girls, and • advancing gender justice in democratic governance in stable and fragile states.
the views and opinions expressed herein are those of the authors and do not necessarily represent the official position of uNDp and uNiFem.

Dear Reader!after a long break, with the support of uNDp in tajikistan, the republic has resumed work on the preparation and publication of the National Human Development Report.
You hold in your hands not just a Report on various problems of the transition stage of development of our country, namely, the fundamental problem - the employment of the population of our republic in the context of human development, solution of which depends largely on the successful implementation of goals set for our country and implementation of strategic objectives set for the Government and president of our country emomali Rahmon.
the wealth of the country is determined not only by natural resources, but also by people living in it. in a country where for its citizens there are broad employment opportunities created, welfare and prosperity are ensured. this is especially important for tajikistan - one of the young countries in the world, where the average age amongst overall population is 24 years. today at the initiative of the Government of tajikistan, measures are implemented aimed at jobs creation and employment situation over the last decade remains relevant.
therefore, the topic for the National Report has been chosen in such a direction in which the most basic issues of economic and social development of our country are intertwined. it is significant that, the Report presents the main problems in the field of employment, such as: a) unsolved problem of mismatch of quantity and quality of labor forces available and jobs created, b) development of the methodology for assessing the real tracking of all employed by all kinds of activities and identification of the level of real unemployment rate, c) a high level of unreported informal employment, d) the issues of internal and external migration, child labor and gender equality. also, a fairly full coverage of the main reasons for the existence of these problems is provided, and concrete ways are justified on how to mitigate them and move gradually towards solution.
it is evident that each of the above-mentioned problems can and should become a subject for special studies, including the format of future National Human Development Reports in our country.
to ensure broad public access to the process of preparation and discussion of this Report, as a result of open competition a group of scientists professionals was selected, that are well known not only in the our country but also abroad. Status of preparation of the Report was closely monitored by the editorial and advisory commissions, with the support of our partners - international consultants, uNDp and with the involvement of public and scientific organizations in the country. While preliminary and final versions of the Report were shared with the ministries and departments, civil society organizations and international organizations, whose comments and suggestions provided substantive assistance in finalizing the Report presented to you, for this input we express our gratitude!
it is gratifying to note that an analytical capacity is established in the republic, which based on the broad-based partnerships with government agencies, civil society organizations and international organizations - not only prepared this Report, but is able to solve other problems in the implementation of the ideas and postulates of Human Development in tajikistan.
it is noteworthy that the present National Report has been prepared at the very time when the entire country, all the people of tajikistan, united by a common idea of solving the country`s economic, energy, transportation and food security issues - and are mobilizing all internal resources for its successful implementation.
the Report is completed and submitted for your consideration, dear reader.
Work to provide employment in the Republic of tajikistan in the context of human development – continues!
Farrukh Khamralievministry of Economic Development and trade of Republic of tajikistanDushanbe, April 2010

Dear reader!it gives me a great pleasure to inform you that after a short break we have resumed the development and publication of the National Human Development Report. over the past 20 years, National Human Development Reports have become part of a complex process through which the citizens of tajikistan are trying to develop their own development strategies suited to local realities. these statements involve people, representatives of institutions, civil society, business and academia, as well as the general public and decision makers at government level in the construction of a new vision for the future of the country.
only in a country where for its citizens created opportunities of decent employment, welfare and prosperity prevail, and there is a real human development. therefore, in this Report a red thread is observed about employment being one of the fields where three political components aimed at people – human development, human security and human rights – are brought together. at the same time, in the context of current conditions prevailing in the country, employment in this report examines a wide range of traditional and modern-day challenges faced by tajikistan, including unemployment, informal employment, internal and external migration, energy, and, of course, the world financial crisis.
Despite some undoubted successes, the overall employment picture in tajikistan is alarming. the global financial crisis 2008-2009, significantly influenced the state of poverty in tajikistan, the level of which is currently estimated at between 58-60%, which is returning the country to the level of poverty in 2003. therefore, as shown in the Report, the social policy of the government in such transitional societies, such as tajikistan, the limited budgetary possibilities should be targeted primarily at creating conditions for a dignified and stable employment.
today, tajikistan has a relatively high level of informal employment, which is a clear signal of poor labor market performance. in the process of transition to a market economy, the scale, structure and nature of informal employment, as well as its role in the economy have changed significantly. in recent years it has reached significant proportions and has become virtually
independent segment of the labor market, which has a significant impact on employment and socio-economic and environmental situation in general.
in emerging in recent years, the growth rate of human potential, tajikistan could by 2015 achieve a level of the HDi it had in1990. However, the negative impact of the global financial crisis was manifested in the reduction of GDp growth and consequently reduced the rate of human development in the country, which imposes additional obligations on the government to preserve social development indicators.
it is for the first time within the series of National Reports a calculation of the regional HDi was initiated to reflect the analysis over the human development levels by regions in tajikistan. the comparative analysis showed that tajikistan has a relative non-uniformity in the development level of human potential in the regions of the country. as in the whole country, the most significant differences between the regions are observed in the income level. therefore, in the National Report a conclusion is made that today, tajikistan needs to formulate a comprehensive national program, customized at the regional level, which should be focused on reviewing the policy of income and wages for the long term.
uNDp would like to thank the national authors, editors and advisory group members for their diligence in preparing this important report. We would like to express special thanks to international consultants, mr. andrey ivanov and mrs. elena mezentceva for their intellectual input and advice.
Report on employment includes a series of important recommendations. it is very important that the Government, employers' organizations and trade unions, as well as other interested parties were still committed to continue to develop and implement policies and programs aimed at achieving the millennium Development Goals. to this end, uNDp in tajikistan is ready to provide continued support in this direction.
i very much hope that the Report «employment in the context of human development» will help to fulfill all the intentions aimed at the accelerated and sustainable development in tajikistan.
Rastislav Vrbensky UnDp, Country Director Dushanbe, April 2010
employmeNt iN tHe coNtext oF HumaN DevelopmeNt 7
REpoRt’s AUthoRs:
REpoRt’s AUthoRs:Babajanov Rustam, public Sector Reform project under the executive apparatus of the president of the Rt Babadjanova Malika, Central asian Regional ecologic Center, tajik Branch Jonmamadov Shermamad, institute of economy of the RtMuminova Farida, Center of Strategic Research under the president of the Rt Ulmasov Rakhmon, tajik-Russian Slavonic university Usmanova Tufa, technological university of tajikistan Khasanov Munim, institute of improvement of Qualification of State employees of the State Service Department under the president of the Rt Khegai Margarita, tajik-Russian Slavonic university
preparation of this Report could hardly be possible without assistance and valuable comments and suggestions from a large number of persons and organization.
pARtnERs: ministry of Foreign affairs ministry of educationministry of internal affairs ministry of labour and Social protection of population ministry of Healthcare ministry of Finance ministry of Reclamation and Water Resources Committee on emergency SituationsState Committee on StatisticsScientific-Research institute of labour and Social protection of population of the ministry of labour and Social protection of population State Committee on environmental Control academy of Sciences institute of oriental Studies and manuscipt Heritage of the academy of Sciences of the Rt
nGos AnD IntERnAtIonAl oRGAnIzAtIons: international organization on migration: Gajiev Z.Head of mission «Sotsservis», Kuddusov J.«iSD Consulting», Khakulov R.
WE ExpREss DEEp GRAtItUDE to thosE Who REnDERED AssIstAnCE In thE pREpARAtIon oF thIs REpoRt:
Ashurov Subkhon, ministry of labour and Social protection of population Azizov Rakhmatjon, tajik National university Buzurgkhonov Yunus, media group “asia-plus”Jobirova Saeeda, Mukhamadkul Karimov, ministry of Healthcare Latipov Rustam, ministry of Reclamation and Water Resources Mirboboev Rakhmatullo, tajik National university Olimov Farrukhullo, apparatus of the president of the Republic of tajikistanPrivaznova Valentina, “economy of tajikistan: Development Strategy” Saidov Ibragim, Nazarov Timur, State Committee on environmental Control Turaev Barot, State Committee on Statistics Dranikova Irina, translator Faromuz Nigina, project assistant
EDItoRIAl CommIttEEIlolov M., academy of Sciences of the RtIslamov S., institute of Demography, academy of Sciences of the RtKodyrov Sh., Sie “pulse”Saidov F., Center of Research Strategic under the president of the Rt
IntERnAtIonAl ConsUltAntsIvanov Andrei, uNDp Mezentseva Elena, uNiFemPeleah Mihail, uNDp
ExECUtIVE EDItoR Saidmuradov Lutfullo
nAtIonAl CooRDInAtoRKhuseinov Muzafar
UnDp CoUntRy DIRECtoR Vrbensky Rastislav
pRoGRAmmE AnAlyst UnDpJumaeva Kibriyo
pRoGRAmmE CooRDInAtoR UnDpKhoshmukhamedov Sukhrob
GEnDER AnD GoVERnAnCE ADVIsoR UnIFEmAzizova Nargis
the NHDR is prepared in collaboration with a team of national consultants.
there is no copyright attached to this publication. it may be reproduced in whole or in part without prior permission from the united Nations Development programme or the Republic of tajikistan. However, acknowledgement of the source is appreciated.

8 NatioNal HumaN DevelopmeNt RepoRt 2008 -2009
ABBREVIAtIons
ale average life expectancyapll adult population literacy level CDm Clean Development mechanismCiS Commomwealth of independent StateseBe ecosystems and Biodiversity economy Study programmeel education leveleR enrollment Rate euraseC eurasian economic CommunityGBao Gorno-Badakhshan autonomous oblastGDi Gender-related Development indexGDp Gross Domestic productGle General life expectancyGRp Gross Regional productGei Gender equality indexGem Gender empowerment measureHCS Housing and Communal ServicesHDi Human Development indexHe High educationHepS Hydro-electric power StationiiQSe institute of improvement of Qualification of State employeesilo international labour organizationimF international monetary Fundioe international organization employersiom international organization for migrationipp per Capita income on purchasing power parityituC international trade union ConfederationlFS labour Force SurveylFSt labour Force Survey in tajikistanlSmS living Standard measurement SurveylSSt living Standard Survey in tajikistanmDG millennium Development GoalsmFo microfinance organizationsNDS National Development StrategyoaCS organization of agreement for Collective SecurityoeCD organization of economic Cooperation and DevelopmentoSCe organization for Security and Cooperation in europepF peasant FarmspG power GridpCi per Capita incomeppp purchasing power paritypRS poverty Reduction StrategypSp personal Subsidiary plotsRF Russian FederationRt Republic of tajikistanSB State BudgetSDe Sustainable Development educationSe Standard of educationSip State investment programmeSaF South african RepublictepS thermo-electric power StationtRRS towns & Regions of the Republican SubordinationuN united NationsuNDp united Nations Development programmeuNep united Nations environmental programmeuNeSCo united Nations educational, Scientific and Cultural organizationuNiCeF united Nations international Children’s FunduNiFem united Nations Female FunduSa united States of americauSSR union of Soviet Socialist RepublicsWB World Bank

employmeNt iN tHe coNtext oF HumaN DevelopmeNt 9
BAsIC DAtA on thE CoUntRy
Form of Government: presidential RepublicHead of the state: emomali Rakhmon
Capital: Dushanbeindependence Day: 9th September total area: 143,100 sq.kmpopulation: 7,373,800 people (1.01.2009)Religion: islam National composition: tajiks, uzbeks, Russians, tatars, Kyrgyzs, etc.National currency: Somoni
HDi (Human Development index): 0.688 (2007)GDi (Gender Related Development index): 0.686 (2007)life expectancy at birth: 66.4 years (2007)enrollment for education: 70.9%literacy of adult population: 99.6%
GDp per capita (with ppp): uS $1,753 (2007)GDp per capita (without ppp): 2,427.4 Somonis (uS $707.9) (2008)inflation: 5.0% (2009)average monthly payment: 231.53 Somonis (2008)Consumer prices index : 105.0% (2009)export: uS $1,408.7 million (2008) economic growth: 7.9% (2008)average income: 153.16 Somonis (2008)Birth rate: 27.9 people per 1,000 (2008)access to clean water: 55.5% (2009) minimal pension: 60 Somonis (uS $13.8)

10 NatioNal HumaN DevelopmeNt RepoRt 2008 -2009
IntRoDUCtIon .......................................................................................................................................................... 20
ChAptER 1. EmploymEnt In tAJIKIstAn: tRADItIonAl AnD nEW ChAllEnGEs ............................................. 24
1.1 Labour resources and employment: internal problem persists .................................................................................. 26the 1st challenge: population growth rate ................................................................................................................................................................ 26the 2nd challenge: problem of jobs ............................................................................................................................................................................... 27the 3rd challenge: internal migration ........................................................................................................................................................................... 28the 4th challenge: external migration .......................................................................................................................................................................... 28the 5th challenge: informal employment .................................................................................................................................................................. 30the 6th challenge: ecology and employment ......................................................................................................................................................... 30the 7th challenge: education and labour force quality .................................................................................................................................... 32
1.2 The economy of Tajikistan: stability to external shocks and new challenges to the country ................................ 34the 8th challenge: tajikistan: small open or dependent economy? .......................................................................................................... 34the 9th challenge: energy crisis ........................................................................................................................................................................................ 35the 10th challenge: impact of the world financial crisis on the country economy ......................................................................... 36the 11th challenge: reduction of migrants’ remittances ................................................................................................................................... 36the aftermath of the crisis: employment and unemployment statistics ............................................................................................... 37
1.3 Human development index (HDI) ...................................................................................................................................... 39international rating of HDi of tajikistan ....................................................................................................................................................................... 39National and regional HDi ................................................................................................................................................................................................... 40
ChAptER 2. lABoUR mARKEt AnD EmploymEnt ................................................................................................. 44
2.1 Demographic trends and potential of education system ............................................................................................. 46Demographic situation ......................................................................................................................................................................................................... 46Financing of education ......................................................................................................................................................................................................... 49education levels and employment ................................................................................................................................................................................ 57
2.2 Levels and specificity of employment .............................................................................................................................. 63Formal employment ............................................................................................................................................................................................................... 63
Problem of jobs ...................................................................................................................................................................... 63Payment and income ........................................................................................................................................................... 64
employment sectoral structure ....................................................................................................................................................................................... 66missed translation ..................................................................................................................................................................................................................... 67ecology and employment ................................................................................................................................................................................................... 68
2.3 Employment in informal sector ......................................................................................................................................... 72Definitions and problem of evaluation ....................................................................................................................................................................... 72Forms of informal employment ....................................................................................................................................................................................... 75
Self-employment .................................................................................................................................................................. 75Shuttle trade migration ....................................................................................................................................................... 76Mardikor-markets ................................................................................................................................................................. 76Child labour ............................................................................................................................................................................ 78
ChAptER 3. UnEmploymEnt AnD EmploymEnt................................................................................................... 80
3.1 Unemployment and its types ............................................................................................................................................. 82problems of evaluation ......................................................................................................................................................................................................... 82types of unemployment ...................................................................................................................................................................................................... 82age, gender and territorial composition of unemployed ............................................................................................................................... 84
3.2 Education and unemployment ......................................................................................................................................... 88education standard of unemployed ............................................................................................................................................................................. 88Regional education standard of unemployed ........................................................................................................................................................ 90
tABlE oF ContEnts

employmeNt iN tHe coNtext oF HumaN DevelopmeNt 11
ChAptER 4. lABoUR mIGRAtIon pRoFIlE .............................................................................................................. 92
4.1 Migration of population (relocation) ................................................................................................................................ 95internal and external migration of population ...................................................................................................................................................... 95intra-republican migration flows .................................................................................................................................................................................... 96migration typology of the regions of the republic .............................................................................................................................................. 98“Regional disbalances” as migration factor ............................................................................................................................................................ 100internal labour migration .................................................................................................................................................................................................. 102
4.2 External migration of population .................................................................................................................................... 103problem of statistics of external labour migration ............................................................................................................................................ 103Character of labour migration ........................................................................................................................................................................................ 105effects of external migration ........................................................................................................................................................................................... 106
Positive effects ..................................................................................................................................................................... 106Negative effects .................................................................................................................................................................. 107
ChAptER 5. Is thE GEnDER InEQUAlIty DEEpEnInG? ........................................................................................ 110
5.1 Male and female gender roles in modern Tajikistan ................................................................................................... 112increased domestic burden as an obstacle to improving women's economic activity ........................................................... 112Gender stereotypes limit girls’ choice in education ......................................................................................................................................... 113Gender stereotypes limit possibilities of female labour and territorial mobility ............................................................................ 114
5.2 Influence of gender inequality on employment and income .................................................................................... 116age and gender characteristics of employment ............................................................................................................................................... 116Gender segregation on labour market .................................................................................................................................................................... 119Gender differentiation of pay ......................................................................................................................................................................................... 123
5.3 Measurement of gender inequality ................................................................................................................................ 125Gender-related development index (GDi) .............................................................................................................................................................. 125Gender-empowerment measure (Gem) ................................................................................................................................................................. 126index of gender equality (Gei) ....................................................................................................................................................................................... 127
ChAptER 6. ConClUsIon: possIBlE REACtIon to ChAllEnGEs ...................................................................... 130
6.1 Revision of policy on labour market ............................................................................................................................... 132policy at enterprise level .................................................................................................................................................................................................... 132Regional policy ........................................................................................................................................................................................................................ 133National policy ......................................................................................................................................................................................................................... 134
6.2 Policy in education ............................................................................................................................................................. 136Disproportion in involvement and education standard ............................................................................................................................... 136access to vocational education .................................................................................................................................................................................... 136meeting market demands ................................................................................................................................................................................................ 137
6.3 Migration policy ................................................................................................................................................................. 138internal migration ................................................................................................................................................................................................................. 138external migration ................................................................................................................................................................................................................. 139Five political approaches ................................................................................................................................................................................................... 140
6.4 Possible scenarios of human development ................................................................................................................... 141Scenario 1 (pessimistic): HDi decrease ...................................................................................................................................................................... 141Scenario 2 (optimistic): HDi increase ......................................................................................................................................................................... 141Scenario 3: the gender penalty reduction ............................................................................................................................................................. 142
6.5 “Green employment”: awareness and possible achievements .................................................................................. 143

12 NatioNal HumaN DevelopmeNt RepoRt 2008 -2009
InsERtIon 1. the world food crisis affected two thirds of families in tajikistan ................................................................................................................ 21
InsERtIon 2. tajikistan Global HDi Ranking ............................................................................................................................................................................................. 23
InsERtIon 3. From the theme of conference of the Secretariats of oaCS and euraseC.............................................................................................. 29
InsERtIon 4. access to clean drinking water .......................................................................................................................................................................................... 32
InsERtIon 5. Reference: the National Development Strategy until 2015 ............................................................................................................................. 34
InsERtIon 6. macroeconomic scenarios of the country’s development .............................................................................................................................. 41
InsERtIon 7. there are following levels of education in the Republic of tajikistan ........................................................................................................ 52
InsERtIon 8. “mardikor-market” in Dushanbe ........................................................................................................................................................................................ 77
InsERtIon 9. Social and demographic portraits of working children ..................................................................................................................................... 78
InsERtIon 10. the number of unemployed is reducing? .................................................................................................................................................................. 83
InsERtIon 11. unemployment and the problem of initial employment (graduates of educational institutions) ........................................ 88
InsERtIon 12. Consequences of migration from rural areas to cities ........................................................................................................................................ 97
InsERtIon 13. example of regional survey (Khatlon region, 2007 data) ................................................................................................................................... 99
InsERtIon14. more than 400,000 citizens of the Republic of tajikistan were registered by the Russian migration services during half-a-year period ................................................................................................................................................................................ 104
InsERtIon 15. the portrait of a tajik migrant .......................................................................................................................................................................................... 106
InsERtIon 16. labour migrants will receive pensions ...................................................................................................................................................................... 108
InsERtIon 17. according to survey “Girls’ access to education”, oSCe in tajikistan, 2008 ........................................................................................... 114
InsERtIon 18. the millennium development Goals on gender equality in the sphere of employment ......................................................... 116
InsERtIon 19. measurement of gender segregation ........................................................................................................................................................................ 120
InsERtIon 20. Women-leaders live in the shadow in tajikistan .................................................................................................................................................. 122
InsERtIon 21. “Green” jobs ................................................................................................................................................................................................................................. 145
tItlEs oF InsERtIons

employmeNt iN tHe coNtext oF HumaN DevelopmeNt 13
DIAGRAm 1.1 .............................. р.27Forecasted number of population of the able-bodied age (year end, thousand people)
DIAGRAm 1.2 .............................. р.37migrants’ remittances (thousand uS$)
DIAGRAm 1.3 .............................. р.39HDi tajikistan
DIAGRAm 1.4 .............................. р.40HDi and its constituents, tajikistan, 2007
DIAGRAm 1.5 .............................. р.42HDi tajikistan by regions
DIAGRAm 1.6 .............................. р.42life expectancy in regions of tajikistan, years
DIAGRAm 1.7 .............................. р.42per capita income, uS$
DIAGRAm 1.8 .............................. р.42literacy level of adult population, %
DIAGRAm 1.9 .............................. р.43enrollment for education, %
DIAGRAm 2.1 .............................. р.47age-group pyramid, 1 January, 2009 (thousand people)
DIAGRAm 2.2 .............................. р.48the structure and dynamics of population of tajikistan younger than the able-bodied age, in the able-bodied age, and older than the able-bodied age, 1999-2009
DIAGRAm 2.3 .............................. р.49the process of des-urbanization preserves in tajikistan
DIAGRAm 2.4 .............................. р.50Capacity and sources of financing of education system of the Republic of tajikistan (million Somonis)
DIAGRAm 2.5 .............................. р.50Budget allocations to education, % to GDp
DIAGRAm 2.6 .............................. р.51Structure of financing of education system on levels of budget system
DIAGRAm 2.7 .............................. р.52Comparison of the number of students from 1st to 9th classes, and the number of children in the corresponding age group
DIAGRAm 2.8 .............................. р.53enrollment for secondary education of children and adolescents of the Republic of tajikistan
DIAGRAm 2.9 .............................. р.54enrollment for institutions of vocational education of the country (2003 = 100%)
DIAGRAm 2.10 ............................ р.55Growth rate of enrolled for institutions of secondary vocational education of the republic (2003 = 100%)
DIAGRAm 2.11 ............................ р.57education standard of economically active and employed population of the Republic of tajikistan
DIAGRAm 2.12 ............................ р.58Distribution of economically active population by the education standard
DIAGRAm 2.13 ............................ р.58Share of economically active population in the total number of population of the able-bodied age, 2007
DIAGRAm 2.14 ............................ р.59education standard of economically active male population
DIAGRAm 2.15 ............................ р.59education standard of economically active female population
DIAGRAm 2.16 ............................ р.59Distribution of economically active population according to education standard (gender-based), %
DIAGRAm 2.17 ............................ р.60employed population according to education standard in rural areas of the republic
DIAGRAm 2.18 ............................ р.61employed population in industrial economic sector according to education standard
DIAGRAm 2.19 ............................ р.61employed population in non-productive sectors according to education standard, %
DIAGRAm 2.20 ............................ р.62education migration from rural to urban areas of the republic, (thousand people)
DIAGRAm 2.21 ............................ р.66employment sectoral structure (missed translation)
DIAGRAm 2.22 ............................ р.66employment sectoral structure of the economy of tajikistan in 2008
DIAGRAm 2.23 ............................ р.67Demand and supply for specialists (agriculture)
DIAGRAm 2.24 ............................ р.67Demand and supply for specialists in some industrial sectors of economy
DIAGRAm 2.25 ............................ р.67Demand and supply for specialists in education
DIAGRAm 2.26 ............................ р.70emergency situations’ damages in 2000-2008 (thousand Somonis)
DIAGRAm 3.1 .............................. р.85age groups and gender unemployment structure
DIAGRAm 3.2 .............................. р.90Distribution of unemployed according to education standard (thousand people)
DIAGRAm 4.1 .............................. р.96migration turnover of the population of the Republic of tajikistan (people)
DIAGRAm 4.2 .............................. р.96internal migration balance
DIAGRAm 4.3 .............................. р.97parameters of internal migration in the Republic of tajikistan (thousand people)
DIAGRAm 4.4 ............................ р.100per capita GDp and the salary variation coefficient for 2000-2007
DIAGRAm 4.5 ............................ р.101interrelation between tax revenues and population’s place of residence (58 regions of the republic in 2008)
DIAGRAm 4.6 ............................ р.101interrelation between subventions and population’s place of residence (58 regions of the republic, 2007)
DIAGRAm 4.7 ............................ р.102pendulous migration from the regions of the Republic of tajikistan (lRS-2004, % of total employed)
DIAGRAm 4.8 ............................ р.104Number of citizens of the Republic of tajikistan departed to the Russian Federation in 2009
DIAGRAm 4.9 ............................ р.105Different evaluations of labour migration from tajikistan
DIAGRAm 5.1 ............................ р.116proportion of economically active men and women in the total number of men and women, 2001-2007
DIAGRAm 5.2 ............................ р.117education standard of economically active population (missed translation)
DIAGRAm 5.3 ............................ р.124Ratio of female to male payments in sectors of economy, 2006
DIAGRAm 5.4 ............................ р.124Regional structure of male and female payments in December 2006, Somonis
DIAGRAm 5.5 ............................ р.127Gender inequality index for tajikistan in 2008
tItlEs oF DIAGRAms

14 NatioNal HumaN DevelopmeNt RepoRt 2008 -2009
tABlE 1.1 ........................................................................ р.26Dynamics of population and labour resources of the country (year end, thousand people) (forecast presented in the Concept of Creation and preservation of Jobs in the Republic of tajikistan)
tABlE 1.2 ........................................................................ р.27Dynamics of demographic and labour development resources of the country (beginning of year, thousand people)
tABlE 1.3 ........................................................................ р.39Rating of tajikistan and HDi rank and its constituents in 2007
tABlE 1.4 ........................................................................ р.40HDi and its constituents of tajikistan in 2007
tABlE 2.1 ....................................................................... р.46Regional dynamics of population of the Republic of tajikistan from 2000 to 2009 (beginning of year, thousand people)
tABlE 2.2 ....................................................................... р.47Density of population of tajikistan (beginning of year, people per 1sq.km)
tABlE 2.3 ........................................................................ р.51Cost of per capita financing on 2009 budget year, and indicative cost parameters on 2010 and 2011
tABlE 2.4 ........................................................................ р.54enrollment for vocational education of the country (2003 = 100%)
tABlE 2.5 ........................................................................ р.56Regional structure of vacancies on the labour market of the Republic of tajikistan
tABlE 2.6 ........................................................................ р.57educational standard of economically active population of the regions of the Republic of tajikistan
tABlE 2.7 ........................................................................ р.60education standard of employed population in the regions of the Republic of tajikistan
tABlE 2.8 ........................................................................ р.63Regional distribution of employed population of the Republic of tajikistan
tABlE 2.9 ........................................................................ р.65average monthly payments of hired labourers in the regions of the Republic of tajikistan in 2008
tABlE 2.10 ...................................................................... р.66labour force demand and supply on the labour market (thousand people)
tABlE 2.11 ...................................................................... р.68tendencies in education and health sectors
tABlE 2.12 ...................................................................... р.74Share of employed in informal sector to total population, able-bodied population and economically active population (thousand people)
tABlE 2.13 ...................................................................... р.75Number of non-hired employed (self-employed) (thousand people)
tABlE 3.1 ........................................................................ р.83level of unemployment according to official statistics
tABlE 3.2 ........................................................................ р.85Gender and age unemployment structure
tABlE 3.3 ........................................................................ р.86Gender and age regional unemployment structure (people)
tABlE 3.4 ........................................................................ р.87unemployed by age and method of search of a job (people)
tABlE 3.5 ........................................................................ р.87unemployed by age and duration of a job (people)
tABlE 3.6 ........................................................................ р.88Distribution of registered unemployed according to the education standard in the Republic of tajikistan (on 1 January of respective year, thousand people)
tABlE 3.7 ........................................................................ р.89Dynamics of the share of youth under 30 in total unemployed registered in employment services of some CiS countries (1992-2002)
tABlE 3.8 ........................................................................ р.90unemployed according to duration of search of a job and education standard ( missed translation)
tABlE 3.9 ........................................................................ р.91Structure of registered unemployed according to education standard (beginning of year)
tABlE 4.1 ........................................................................ р.95General, natural and migration population growth rates of the Republic of tajikistan, 1991-2008 (thousand people)
tABlE 4.2 ...................................................................... р.100Quantitative distribution of the regions and the cities of the Republic of tajikistan in accordance with the average monthly payments, % to the average republican level
tABlE 4.3 ...................................................................... р.103Distribution of labour migrants from CiS countries
tABlE 5.1 ...................................................................... р.121Gender structure of senior positions in ministries and departments of the Republic of tajikistan in 2003 and 2009 (%)
tABlE 5.2 ...................................................................... р.121Representation of men and women in local authorities of the Republic of tajikistan in 2003 and 2009 (%)
tABlE 5.3 ...................................................................... р.125HDi and Gei indicators of tajikistan in 2000-2007
tABlE 5.4 ...................................................................... р.126Gem components in 2004
tItlEs oF tABlEs

employmeNt iN tHe coNtext oF HumaN DevelopmeNt 15
tItlEs oF mAps
AnnExEs
mAp 1.1 Dislocation of external migrants from tajikistan ..................................................................................................................................................... 29
mAp 4.1 the largest migration flows during 2000-2007 ....................................................................................................................................................... 98
mAp 4.2 migration typology of cities and the regions of the republic based on relocation in 2007 ........................................................ 99
AnnEx 1 Calculation of corrected Gross Regional product ( GRp) per capita by regions in Rt, 2006-2007 ......................................... 148
AnnEx 2 HDi dynamics and constituent ...................................................................................................................................................................................... 150
AnnEx 3 ` Characterization of targeted clasters .......................................................................................................................................................................... 152
AnnEx 4 matrix on correlation between development indices of Khatlon region districts (based on data 2007) ....................... 153
AnnEx 5 Gender equality index for tajikistan in 2008 ........................................................................................................................................................... 154

16 NatioNal HumaN DevelopmeNt RepoRt 2008 -2009
ChAptER 1. Employment in tajikistan: traditional and new challenges
this chapter reviews traditional and new human
development challenges in employment in the
Republic of tajikistan.
one of the traditional challenges is a stable
discrepancy between the high natural
population growth rate and the creation
of decent jobs under the circumstances of
transition to market economy. this discrepancy
aggravated other challenges related to internal
and external labour migration, and promoted
wide spread of informal employment that
became an independent segment of the
country’s labour market.
limited possibilities of employment make
the population dependent on natural factors,
aggravating environmental sustainability. the
National Report makes an attempt to show that
jobs’ creation has a close link to environment.
the current situation on the tajikistan’s labour
market exacerbated the issue of training
labour force. From the early stage of market
establishment, training of labour force weakly
relates to the labour market demand. there is an
inadequacy between the demand and the supply
for specific labour force qualifications.
after gaining independence, tajikistan faced a
new challenge: a high level of open economy.
the undeveloped diversification of the country’s
export and import structure vividly manifested
itself during the current financial crisis. it revealed
a high level of dependency of the small open
economy on the state of labour demand on the
markets of foreign countries and the CiS.
energy crisis caused by the isolation of the Southern
and the Northern energy sub-systems of the
country became a serious challenge to tajikistan.
today, the energy security issue is an important pre-
condition of the country’s human development.
tajikistan is 8th in the world on the reserve of
power resources, and, provided constructing a wide
network of hydro-electric power stations has a
good chance to significantly increase the country’s
Human Development index (HDi).
From 1995, a stable tendency of HDi growth in
tajikistan took shape. By 2015, the country could
reach the HDi rank of 1990. today, tajikistan is
in the group of countries with an average level
of human development equal to 0.688 (2007),
occupying 127th place out of 182 countries. By
the education and health standards, tajikistan
belongs to a group of countries characteristic
of high value of human development. However,
by the GDp per capita value, it belongs to the
category of countries with low value of human
development.
sUmmARy

employmeNt iN tHe coNtext oF HumaN DevelopmeNt 17
ChAptER 2. labour market and employment
this chapter reviews the demographic situation
in the country in the context of changes in the
education potential of the country’s population.
there is a correlation between the current level
of education standard and employment of
the population from gender, age, sectoral and
territorial aspects. it has been revealed that some
migration processes promote education. Special
attention has been given to the analysis of levels
and specificity of employment, such as formal
employment (with its issue of jobs’ compliance
with labour potential, and the issue of payments
and income); sectoral employment (with its age
and gender characteristics); and the ecological
aspect of employment. the chapter gives special
attention to employment in informal sector, its
definition and the issue of evaluation, as well as
to such specific forms of employment as self-
employment, pendulous migration, “mardikor-
markets” and child labour.
ChAptER 3. Unemployment and employment
this chapter considers the problems, role and
types of unemployment in the republic with
a high level of able-bodied population. there
is an analysis of the current unemployment
evaluation through the practical statistical reports’
criteria versus the real situation. Some types
of unemployment are analyzed according to
age, gender and territorial composition of the
unemployed. it shows relation and interrelation
between education and unemployment based
on distribution of the unemployed according to
their education standard in sectoral and regional
aspects.
ChAptER 4. labour migration profile
this chapter shows that migration flows make
significant changes in the country’s labour
potential and influence the labour market. the
aim of this chapter is to highlight the state of the
development processes of internal and external
migrations.
the task is to consider the scale, directions,
reasons and consequences of the growing
migration processes, and also to substantiate
the mechanisms of their regulation. the
beginning of the chapter focuses on migration
related to the change of the place of residence
that prevailed at the beginning of the 1990s
within internal and external migrations. Further,
external labour migration is underlined as a
significant process of the current stage of the
republic’s development.
18 NatioNal HumaN DevelopmeNt RepoRt 2008 -2009
the migration typology of the country’s regions
has been carried out to explain the specific
participation of their population in migration
processes and their motivation. this typology
is based on cluster analysis of five indicators
characterizing migration movements, and
evaluations related to regional differentiation of
payments and budget opportunities. this analysis
helped to prove the ways of mitigating differences
in the levels of development of the republic’s
regions.
taking into consideration a significant scale of
external seasonal migration the chapter accents
characteristic peculiarities of the process,
evaluation of positive and negative consequences,
and perspectives. the dynamics and directions of
external labour migration have been analyzed to
determine factors and mechanisms influencing
the process. this allowed substantiate the ways of
migration processes’ regulation.
ChAptER 5. Does the gender inequality deepen?
this chapter tries to prove that the gender
inequality in tajikistan’s employment is in a weak
participation of women in the labour market. Weak
system of social protection increases the women’s
household burden and spreads patriarchal gender
stereotypes on “a woman – is a home keeper”;
and “a man - is a bread-winner”. Spreading of such
stereotypes diminishes households’ motivation
to invest in girls’ education. in general, females’
educational and professional levels are lower
than males’. they are less competitive on the
labour market, and have little opportunities to
find a decent job. the number of households
headed by women is increasing, and they are
forced to engage themselves in heavy low-paid
jobs. Such families risk to remain in poverty; they
are unable to invest their low income in human
development.
ChAptER 6. Conclusion: possible reaction to challenges
there is an attempt to show that assistance to
employment, preservation and creation of new
jobs in enterprises, in the country’s regions, and in
the republic, should become the most important
direction of the governmental anti-crisis policy.
employment is inseparable from economy
and is, currently, rather complex and tense.
tajikistan is able to create new jobs and diminish
unemployment to its natural level. For that, the
country’s investment policy should be aimed
at attracting investments to labour-intensive
and science-intensive industry. entrepreneurs
establishing such labour-intensive industry need
efficient stimulus.
sUmmARy

employmeNt iN tHe coNtext oF HumaN DevelopmeNt 19
today, the Government takes serious steps to
widely enroll the population for education,
though, the issue of the graduates’ quality is still
open, and the conceptual issue of vocational
education – weak direction toward the labour
market – is still on the agenda. providing equal
access to vocational education is important;
since differentiation of income of population,
and a material status of a student’s family is the
primary growing factor of education inequality.
So, assistance to vulnerable categories of students
should follow elaboration of a complex strategy of
constitutional changes.
the current inequality of economic development
and income between regions requires
improvement of migration policy combined
with the policy of complex development of rural
areas. economic growth is rarely balanced, and
attempts of unjustified balancing could harm the
progress. today, the regional employment policy
aimed at the territorial balancing of basic human
development indicators is the most efficient.
From this aspect, pendulous migration (as one of
the types of internal migrations), could mitigate
disbalances on the local labour markets.
international experience of migration processes’
management needs a deep study and spreading
in tajikistan in the context of the national
management model of external migration.
protection of human rights of external labour
migrants should be an important control factor of
the external migration.
under the current conditions, it is important
to understand how the world financial and
economic crises influence tajikistan’s labour
market, and how these crises could influence the
human development and opportunities of decent
employment. there are several development
scenarios: from pessimistic to optimistic, though
the gender-sensitive scenario should not be
neglected.
taking into consideration the current world
tendencies in creation and development of
“green” jobs, tajikistan should join the process of
“green innovations” and speed up this process
in the country to create decent employment
conditions along with control of climate changes.
Furthermore, tajikistan pays serious attention
to environment control and has extended
possibilities in creating “green” jobs.

20 NatioNal HumaN DevelopmeNt RepoRt 2008 -2009
iNtRoDuCtioN
employment is one of the fields where three political components aimed at people – human development, human security and human rights – are brought together.

employmeNt iN tHe coNtext oF HumaN DevelopmeNt 21
iNtRoDuCtioN
today the issue of employment refers to one of the general conditions of social order in tajikistan that defines the attitude to the participation of the population in labour. effective and fair employment is not only an income source, but also an important condition of human development and necessary for economic growth.
employment level is a significant determinant of the poverty level in tajikistan. in 2007 the abject poverty reached 17%, while 53.5%1 of the population remained under the poverty line. this, principally, influences the state of formal and informal employment which, in their turn, influence the scale and level of poverty in the country determining thereby the tendencies of human development.
the world financial crisis of 2008-2009 had a significant effect on poverty in tajikistan. presently, the level of poverty is estimated at 58-60% nearly returning the country to the level of poverty of 2003 – (64%).2 Government social policy should aim to solve the full spectrum of social problems to meet the populations’ need for decent and stable employment.
availability or absence of decent work is becoming the main factor through which the global economy influences the population of different countries. and the tendencies become precarious. anti-crisis measures in many countries revealed that the most effective measures on stimulating economy have been those, where the main attention had been paid to the creation of jobs and social protection of population, including support of small and medium enterprises as an effective way of increasing available jobs and helping to alleviate the risk of social unrest.
it is important to consider the population’s situation through the wide spectrum of traditional challenges this country faces, including unemployment, informal employment, forced labour, internal and external labour migration.
presently, these challenges have been more pronounced as a result of the world financial, economic, food and humanitarian crises; undoubtedly, these “external shocks” make tajikistan’s economy, and as a result, its labour market more vulnerable to fluctuation. the world crisis has posed a significant danger towards recent progress towards the realization of the poverty Reduction Strategy 2007-2009. Despite some areas of indisputable success, tajikistan’s unemployment rate is alarming.
tajikistan’s available labour market is limited by such factors as a complex demographic situation, the social and economic impacts of the country’s civil war, significant labour migration rates of qualified workers and specialists to other countries, shortage of jobs with access to appropriate labour resources.
presently, there is a high level of informal employment, which signals that labour markets are not functioning appropriately. informal employment is quickly spreading and, unfortunately, is not being registered by the State Committee on Statistics. taking into consideration the complex financial and economic conditions of the country, as well as the visibly high level of employment in the informal sector, it is becoming more necessary to support and stimulate development of the business environment.
InsERtIon 1thE WoRlD FooD CRIsIs AFFECtED tWo thIRDs oF FAmIlIEs In tAJIKIstAn
Dushanbe. 28 January. “Asia-plus” - /Victoria naumova/
- in tajikistan the world food crisis affected two thirds of families, declared the ambassador of Rt to the united Nations Sirodjiddin aslov, in his statement in New-york and expressed hope that the world community would take necessary political, financial and economic steps to prevent aggravation of food crisis. “During the last several years the world faced several correlated crises. post-effect of new challenges acutely told on social well-being of millions of people in developing countries and states with transitional economics, my country including”, - declared the ambassador. He underlined that along with the increase of food prices tajikistan had to survive abnormal cold, shortage of water and droughts in 2007-2008, which led to energy and food crises and as a result – to significant decrease of level of social and economic situation of the population of the country.

22 NatioNal HumaN DevelopmeNt RepoRt 2008 -2009
Demographics are a significant influence on employment and labour market in tajikistan. For the last 14 years the number of able-bodied individuals in the country (males aged 15-62 and females aged 15-57) increased by more than 1.62 million people. However, the official level of economic activity of the population during this period decreased by 18% and only reached 52% of the total number of able-bodied individuals.3
For the last five years the official (registered) level of unemployment did not change significantly (more than 2%). according to the labour Force Survey 2004, the real level of latent unemployment reached 10.6 % of the economically active population (male: 10.2 %, female: 11.3%. the level of latent unemployment reached 20.5% and 7.2%4 in urban and rural areas, respectively. Some categories of the population do not have any stated profession or specialty at all, which is a significant reason of unemployment in the country. in general, a considerable portion of the able-bodied population of the country is not suitable to work in different sectors of the national economy.
there are several key issues that help describe the challenges of tajikistan’s labour market, namely: a) discrepancy between the high rate of growth of able-bodied population and the low rate of job creation, b) growth in the number of graduates with higher education; however shortage of specialists with vocational and secondary special education, c) high rates of employment in the informal sector and a low level of payment in the formal sector, d) gender inequality in employment and the increase of child labour.
limited employment possibilities and low payment along with undesirable work conditions force impact more than 130,000 people in the country. according to different sources, between 420,000 individuals to1.5 million migrate from the country in search of work.
in the context of human development gender equality is an important factor of economic growth and a necessary pre-condition of high social and economic development. this report pays specific attention to gender inequality in employment, payment and education, as well as to the influence gender inequality has on the society, in general.
the issue of training a competent and educated population that possesses necessary professional qualification is also outlined in this report. the human development perspectives of the country are linked to the level and quality of general, secondary and special, vocational and higher education.
the Human Development index (HDi), as outlined in this report, attempts to evaluate a country’s achievements in providing the population with the possibility to live long and healthy lives, necessary education and the ability to ensure a decent level of income for oneself and his/her family.
For the first time the National Human Development index has been analyzed at the regional level. the authors of this report believe this will be a positive precedent for future regional research of the decent standard of living and human development in the country.
traditionally, National Reports estimate indices at the national level, which are used primarily to compare against international indices. these indices use HDi constituents (education, income and life expectancy) as a proxy for the human development situations in the country, but not at the regional level, where many of these problems should be resolved. Des-aggregation of the combined Human Development index will reveal complex and veiled social problems to be prioritized and solved by tajikistan at the regional level.
the republic’s reality is existence of a “three-piece” labour market, which, in practice, in equal parts, forms official employment, employment in the informal sector of economy and labour migration, which, to a considerable degree, is not registered at job placement. as a result, problems of social protection of people entering into labour relations in the informal sector of economy and labour migrants emerge.
From the National Development Strategy until 2015

employmeNt iN tHe coNtext oF HumaN DevelopmeNt 23
iNtRoDuCtioN
the National Development Strategy (NDS) until 2015 aims to accelerate the rate of economic growth, to increase the populations’ standard of living and reduce poverty. as a result, a significant emphasis is given on the role of the social block, including a complex set of measures aimed to provide full employment of the working resources, decrease of the level of unemployment and increase of material and spiritual well-being of the population.
at the same time, this report represents a more detailed analysis of the problems of employment and labour market at the national and regional levels identified by National Development Strategy, the programme of Rendering assistance in employment to the population of the Republic of tajikistan for 2008-2009, the Concept of labour migration of the Citizens of the Republic of tajikistan abroad, the Concept of Development of Business enterprises for the period until 2015, and proffers several alternatives to resolve these issues.
the National Report on Human Development is a unique instrument to be used to promote public dialogue on the policy of employment in tajikistan. it is a base instrument that can facilitate a wide spectrum of discussions designed to elaborate measures of economic and social policy.
InsERtIon 2tAJIKIstAn GloBAl hDI RAnKInG
today tajikistan is 127th in the international HDi rating. vanuatu is 126th and Namibia is 128th. tajikistan is within the group of countries with an average HDi estimation. tajikistan has reached this position due to still preserving high standard of education and relatively long life span. However, the index of per capita income in tajikistan significantly lowers the rating of the country. thus, in vanuatu per capita income (as per ppS) is around 4,000 uS Dollars, in Namibia more than 5,000 uS Dollars. in tajikistan this index is a bit higher than 1,700 uS Dollars.
Human Development Report 2009. Overcoming barriers: Human mobility and development

24 NatioNal HumaN DevelopmeNt RepoRt 2008 -2009
CHapteR 1
CHapteR 1
emploYmeNt iN taJiKiStaN:
tRaDitioNal aND
NeW CHalleNGeS

employmeNt iN tHe coNtext oF HumaN DevelopmeNt 25
emploYmeNt iN taJiKiStaN: tRaDitioNal aND NeW CHalleNGeS
1

26 NatioNal HumaN DevelopmeNt RepoRt 2008 -2009
CHapteR 1
thE 1st ChAllEnGE: popUlAtIon GRoWth RAtE
under the former Soviet union the high population growth rate in tajikistan did not cause any problems, because by virtue of economic, as well as political interests, the level of population was one of the main estimations in the competition of the two confronting systems. Furthermore, costs of the high population growth rate had been incurred by the united union budget.
the ratio of the population growth rate to the able-bodied population, as well as employed, generally determines possibilities of economic growth and labour potential of a country. the more individuals employed out of the total number of the able-bodied population, the less the work load per employee and the higher the labour productivity.
the average annual population growth rate in tajikistan during 1981-1990 was the highest among the republics of the former Soviet union and reached more than 3%, drastic worsening of social and economic situation started in 1990th influenced the population growth rate and lowered it to 2% every year. Nevertheless, the absolute number of population increased from 5,505,600 in 1991 to 7,345,100 in 2008 (representing a growth rate of 31.5%). the growth rate of the able-bodied population exceeded the rate of employed by 3,5 %. the actual annual growth rate of the employed reached 0.9%, eight times less the necessary index of equilibrium. During the last 17 years, while tajikistan’s population grew by almost one third (31.5%) and its labour resources – by more than a half (54%), the level of employment grew by only 7%. as a result, the growth rate of employment falls significantly behind the growth rate of the able-bodied population by 47%.5
the Concept of Creation and preservation of Jobs in the Republic of tajikistan in 2008-2015, approved by the Government Regulation of the Republic of tajikistan № 74 dated 5 march 2008, gives the following forecast of the dynamics of the population and labour resources of the country.
expert forecasts (based on the factual data for 2000-2009 and on the method of age movements) show a different situation. the total number of the able-bodied population in 2010 will reach 4501,200 people, which is by 650,500 more than that determined in the Concept of Creation and preservation of Working places in tajikistan in 2008-2015. thus, the rate of creation of jobs and preparation of specialists in the country should be increased.
1.1 lABoUR REsoURCEs AnD EmploymEnt: IntERnAl pRoBlEm pERsIsts
tABlE 1.1DynAmICs oF popUlAtIon AnD lABoUR REsoURCEs oF thE CoUntRy (yEAR EnD, thoUsAnD pEoplE)(the forecast presented in the Concept of Creation and Preservation of Jobs in the Republic of Tajikistan in 2008-2015)
number of permanent population
labour resources
1995 5701 2811
2000 6250 3186
2001 6376 3301
2002 6507 3463
2003 6640 3644
2004 6780 3777
2005 6920 3893
2006 7064 4047
2010 (forecast) 7694 3970
2015 (forecast) 8662 4490

employmeNt iN tHe coNtext oF HumaN DevelopmeNt 27
emploYmeNt iN taJiKiStaN: tRaDitioNal aND NeW CHalleNGeS
“it should be mentioned that the world economic crisis is already telling on the labour market… the Government of tajikistan and the heads of the local executive bodies of the state power are charged with creation of not less than 180,000 this year and in future not less than 100,000 new jobs annually. to mitigate, as far as possible, the influence of the world economic crisis on the labour market, the ministry of labour and Social protection should properly create, in the shortest possible time, the real database on jobs, and through mass-media and organization of vacancies’ fairs provide regularly necessary information to the persons looking for job.” emomali Rakhmon – president of the Republic of tajikistan.
From the text of the Message to the Parliament of the country on 15 April, 2009
DIAGRAm 1.1FoRECAstED nUmBER oF popUlAtIon oF thE ABlE-BoDIED AGE (yEAR EnD, thoUsAnD pEoplE)
0.0
2015 y.
1000.0 2000.0 3000.0 4000.0 5000.0 6000.0
2010 y.
labour resources – expert evaluation
labour resources – the concept of creation and preservation of Working places
5143.9
4490
4620.5
3970
number of permanent population
labour resources
2000 6126,7 3126,7
2002 6373,5 3376,8
2006 6920,3 3984,5
2007 7063,8 4121,3
2008 7215,7 4254,0
2009 7373,8 4336,1
2010 7524,2 4501,2
2011 7677,7 4620,5
2012 7834,3 4728,6
2013 7994,2 4838,2
2014 8157,2 4951,1
2015 8323,6 5057,1
tABlE 1.2DynAmICs oF DEmoGRAphIC AnD lABoUR DEVElopmEnt REsoURCEs oF thE CoUntRy (BEGInnInG oF yEAR, thoUsAnD pEoplE)(Experts’ evaluation)
thE 2nD ChAllEnGE: pRoBlEm oF JoBs in the transition to market economy conditions the following has emerged: new processes in the employment of population; a decrease in the number of employed in the state sector and wide spread of informal employment; an altered sectoral structure of employment; growth of unemployment (especially latent); development of incomplete employment; a decrease in the demand for labour force; growth of unregistered labour migration outside the country and a differentiation of regional labour markets.
From 1998-2007, in spite of a high population growth rate, particularly in the able-bodied population, the increase of jobs in the country was only 354,000 people.

28 NatioNal HumaN DevelopmeNt RepoRt 2008 -2009
CHapteR 1
today the country preserves the traditional disproportion in the rate and volume of growth of the able-bodied population and the number and quality of jobs being created. large-scale enterprises are not able to create technologically new jobs, and the possibilities of small enterprises are limited.
the policy pursued by the country that deems the privatization of state property as a necessary pre-condition to market economy conditions, has biased the process of growth in the number of released employees; the state has not been able to guarantee released employees new job placements.
the sizeable scale of latent unemployment and secondary employment in industry is caused by disconnect between the labour market and the educational services market. the professional standard of many job seekers does not meet the technical and qualification requirements of the available jobs.
Job placements created annually, with the of new job placements created in power engineering, road-building and mining industry, are primarily legalized vacancies in functioning enterprises and in “revived” jobs (i.e. enterprises that were privatized many years ago, but were not functioning).
THE 3RD cHALLENGE: INTERNAL MIGRATION
internal labour migration flows are a direct result of the developing labour market, level of employment and the living conditions of the rural population. internal migration is characterized by two types – resettlement and temporary labour migration.
internal migration in tajikistan is a circular issue, as it is both the cause and effect of many problems related to employment. under the circumstances of undeveloped market institutions, migration is an indicator of the inherent problems between employment and income.
migration linked to alteration of the place of residence or resettlement due to work or study took place in tajikistan before and has been regulated by administrative measures. today migration is also very important. But the process has changed qualitatively, as well as motivation for migration.
migration occurs largely as a result of limited access to resources. often, labour migration occurs even when there is limited reliable information about life and working conditions in the new area. as a result, it does not stimulate development of the formal employment sector and, instead, leads to an increase in informal sector employment.
the world financial crisis has been a significant influence on internal migration. Firstly, it has resulted in an intensified tension on the labour market, as many external migrants have returned; also it poses pressure on the remaining labour force, which cannot pursue external labour migration. Secondly, as there is less opportunity for external labour migration, this has resulted in a reduction of subventional support due to the decrease in tax revenues from labour remittances.
When the majority of the country’s regional areas receive financial support as subventions from the republican budget, issues related to untimely salary payments, and reduced pensions and cash benefits becomes another factor leading to internal migration. as a result, the load on labour markets in urban areas intensifies.
THE 4TH cHALLENGE: ExTERNAL MIGRATION
external migration is one of the main characteristics of social, economic and political developments in modern tajikistan.
From the early to mid 90s ethnic Russians, ukrainians, Belorussians, armenians and other ethnicities were the majority of residents leaving tajikistan; lately, however, it is been the majority of the tajik population who are migrating in search of a job.

employmeNt iN tHe coNtext oF HumaN DevelopmeNt 29
emploYmeNt iN taJiKiStaN: tRaDitioNal aND NeW CHalleNGeS
mAp 1.1 thE mAp oF DIsloCAtIon oF ExtERnAl mIGRAnts FRom tAJIKIstAn
external labour migration is spontaneous and fluctuating. according to various expert estimations, the current number of external labour migrants fluctuates between 0.5 and 1.0 million people. the overwhelming majority of these people works illegally and is deprived of basic human rights.
the issue of external migration will determine whether a suitable and significant middle class will form in tajikistan. according to expert estimations, the demand for foreign labour force in the countries where tajik migrants typically work, namely, Russia and Kazakhstan, will continue for the nearest 50 years.6 Finally, it is evident that external migration requires wide state regulation aimed to control the negative effects associated with the fluctuations and spontaneity of labour migration patterns.
For tajikistan external migration is a topical problem of the present, but also one that will continue in the foreseeable future. the escalating population growth rate of population and land deficit (from 0.21 hectares of land per capita in 1965 to 0.08 hectares today, and less forecasted in 2030: 0.05 hectares) have create food security threats and promote deficit of dwellings and high population density. However, to a great extent many of these issues have been compensated by the external labour migration.
InsERtIon 3FRom thE thEmE oF ConFEREnCE oF thE sECREtARIAtEs oF oACs AnD EURoAsEC
“on objectives of competent bodies of the member-states of oacS and euroasec on counteraction to illegal migration under the circumstances of the world economic crisis and guarantee of social and working rights to migrants.” “under Globalization of the 21st century illegal migration became one of the main challenges to the modern world. at the same time illegal migration is not only the threat in itself. it has tight links with such forms of trans-border criminality like terrorism, arms traffic, illegal drugs traffic and human traffic. taking into consideration the forecasted economic recession and respective reduction of jobs, experts in migration presume that the greater part of legal labour migration may turn to illegal migration after losing job. they ,objectively, would not like to return to their countries of origin.

30 NatioNal HumaN DevelopmeNt RepoRt 2008 -2009
CHapteR 1
thE 5th ChAllEnGE: InFoRmAl EmploymEnt
informal employment is a new phenomenon for the country’s labour market, although separate forms of unregistered employment existed during the pre-reform Soviet period. (missed translation)
in the process of transition to market relations the scale, structure and character of informal employment has changed as well as its role in the economy. lately, informal employment has reached considerable scale, so much so that it has factually become an independent segment of the labour market. it noticeably influences the state of employment, as well as the social and economic situation.
the total employed in tajikistan’s informal sector in 2008 reached 1,029,200 people (approximately 47.4% of the total number employed).
informal employment in tajikistan is becoming more dominant in the younger population, since this age group is particularly ready to sacrifice some of their rights (e.g. pension rights, other social services of the state, etc.) in exchange for a more stable, and, in many cases, much higher compensation ensured offered by informal employment.
informal employment is a function of the demand for labour. Selected research carried out in the country has shown that informal employment was primarily concentrated in private micro-enterprises in the areas of trade, service and construction. these industries experience demand fluctuations and require a flexible workforce.
Despite many of its negative impacts, informal employment does reduce real unemployment rates and lessen tensions on the labour market. the social role of informal employment has been a reason of its continued vitality and development.
informal employment is internally heterogeneous. For example, informal employment of students and pensioners, who comprise approximately one-sixths of total informal employment, can be seen as an inevitable and positive phenomenon. informal employment in the form of business undertaking or self-employment has more positives than negatives.
However, there is a greater risk of labour violations and there are almost no possibilities for professional self-fulfillment and human development.
expansion in informal employment leads to less social and tax revenues, which, as a result, lead to limited social investment. most importantly, it does not stimulate pursuance of effective policy of income and payments in the country.
THE 6TH cHALLENGE: EcOLOGY AND EMPLOYMENT
environment, economic development and poverty are tightly interrelated in tajikistan. the greater part of the country’s population is exposed to adverse factors of environment, particularly, desertification, water pollution and natural disasters, particularly, droughts and floods. However, natural relief and climate are not the only causes: other causes include the negative practices associated with land tenure: cultivation on steep slopes, cutting of vegetation, excessive pasturing, inappropriate watering technologies, insufficient mitigating measures of development of transport and other infrastructure, mining, etc.; these all endanger preservation, operations, and further development of agriculture.
insufficient financing of measures outlined in strategic documents, plans and programmes in the field of environmental control is a traditional challenge of human development for the country; this has led to loss of land resources, which have the potential to promote employment.
although tajikistan has relatively well-developed legislative frames of the main laws on environmental control and respective problems, execution of this legislation is slow. activity falls behind recommendations of international conventions or agreements.
the State ecological programme for 1998-2008 acknowledges the importance of a healthy and clean environment for successful economic development, and notes the dependence of humanity’s survival on the vitality of the
informal employment is an officially unregistered but legally authorized working activity which assumes lack of legal enrolment or independent self provision with job. the concepts of informal economy and informal employment are accepted as basic specifications of economic activity which act out of the bound of the active legal norms without registration and fiscal record.

employmeNt iN tHe coNtext oF HumaN DevelopmeNt 31
emploYmeNt iN taJiKiStaN: tRaDitioNal aND NeW CHalleNGeS
biosphere. as such, it appeals to reach a balance between economic and environmental interests.
During monitoring a review of poverty reduction in tajikistan, an opinion poll showed that water supply, food security and energy supply are tightly linked to environmental sustainability and are still survival priorities. even such priorities as “creation of jobs” has a much closer link to environment than first glance would suggest. lack of employment possibilities is the main reason people are dependent on natural resources, particularly, on land resources, for receiving means of subsistence. these priorities are the main reason of population migration.
Forced migration is a reaction on alteration of factors and the deterioration of environment. according to international research, climate change can lead to new category of refugees – those forced to emigrate from their native places due to dangerous climatic processes.( missed translation)
irregular and chaotic migration promotes excessive population density in some natural geographic regions of the country, which are unable to provide resources for life support. this is particularly relevant to the upland parts of tajikistan. these resources include land and grazing land, hayfields, deposits of minerals, natural forests, fauna, perennial plants, etc.
according to the World Bank every year the country’s upland is exposed to around 50,000 landslides, 5,000 tremors and earthquakes and hundreds of avalanches and mud flows. Currently, around 1,200 families are subject to obligatory resettlement due to aftermaths of natural disasters of water factor. in the next five years, the growth of migrants as a result of ecologic distress will increase by more than 10,000 families.
Worsening of energy supply, gas, coal and other mineral resources used as sources of power leads to multiple expansion of forest cutting on mountain slopes and extermination of perennial plants in settlements. the total area of the state forest fund is 1.8 million hectares, including the areas covered by forest (410,000 hectares). lately, cutting of forests reached 10,000-10,500 hectares per year. according to the review of ecologic activity in tajikistan (2004) between 5,000 to 10,000 cubic meters of forests vanish annually due to illegal cutting, pasturing and natural disasters, which exceeds the natural increment and reforestation by 150-300% in some regions of tajikistan .
one of the main reasons of rural population migration results from the unsatisfactory state of agricultural land which also results in the constant deterioration of crop-producing power. Due to: shortage of workers; untimely agro-technical measures; insufficient ecologic knowledge of owners of established farms; and other organizational and economic measures, destruction of the fertile stratum of soil takes place. every year between 20,000 hectares to 70,000 hectares of irrigated land are not used fully due to brushing.
Rural populations are not able to provide jobs and food for themselves, largely as a result of the following: a high growth rate and density of rural population; limited irrigated lands per capita; limited access to clean drinking water and sanitation; exploitation and sub-optimal land development (erosion of soil, decrease of forest areas, salinization of soil, etc.); shortages in management of waste products and monitoring of the state of environmental components. Furthermore, the mechanisms of implementation of environmental legislation remain a challenge for ensuring effective employment in the country.
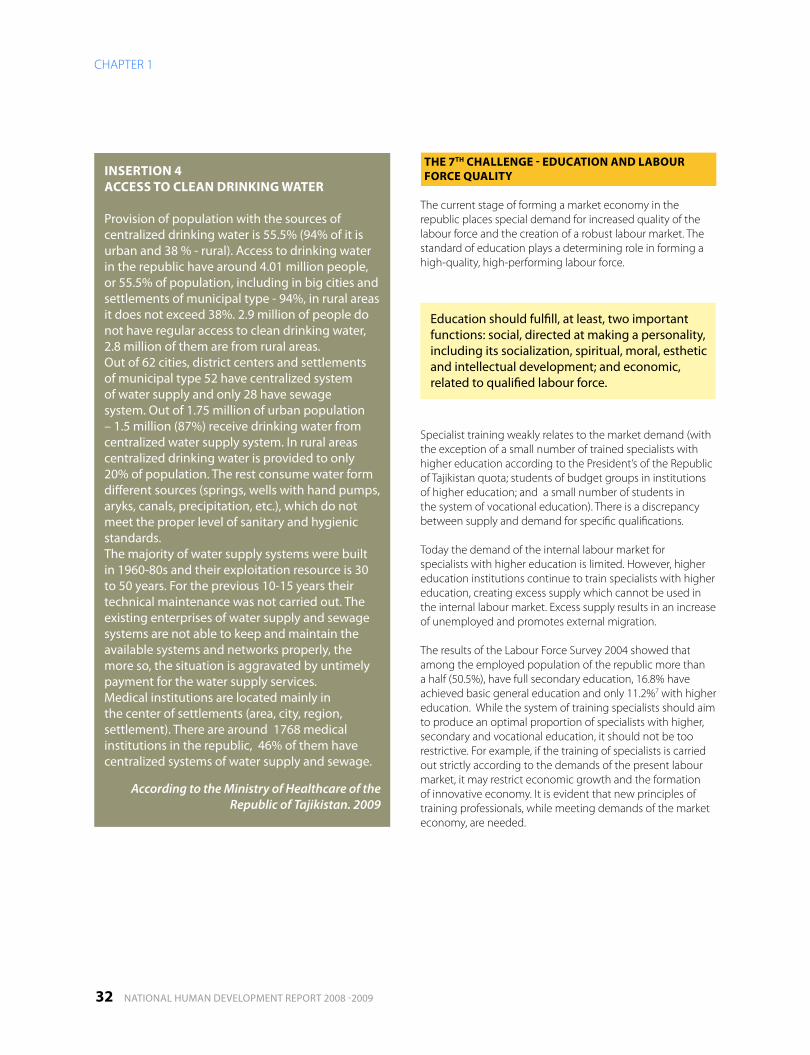
32 NatioNal HumaN DevelopmeNt RepoRt 2008 -2009
CHapteR 1
thE 7th ChAllEnGE - EDUCAtIon AnD lABoUR FoRCE QUAlIty
the current stage of forming a market economy in the republic places special demand for increased quality of the labour force and the creation of a robust labour market. the standard of education plays a determining role in forming a high-quality, high-performing labour force.
Specialist training weakly relates to the market demand (with the exception of a small number of trained specialists with higher education according to the president’s of the Republic of tajikistan quota; students of budget groups in institutions of higher education; and a small number of students in the system of vocational education). there is a discrepancy between supply and demand for specific qualifications.
today the demand of the internal labour market for specialists with higher education is limited. However, higher education institutions continue to train specialists with higher education, creating excess supply which cannot be used in the internal labour market. excess supply results in an increase of unemployed and promotes external migration.
the results of the labour Force Survey 2004 showed that among the employed population of the republic more than a half (50.5%), have full secondary education, 16.8% have achieved basic general education and only 11.2%7 with higher education. While the system of training specialists should aim to produce an optimal proportion of specialists with higher, secondary and vocational education, it should not be too restrictive. For example, if the training of specialists is carried out strictly according to the demands of the present labour market, it may restrict economic growth and the formation of innovative economy. it is evident that new principles of training professionals, while meeting demands of the market economy, are needed.
InsERtIon 4ACCEss to ClEAn DRInKInG WAtER
provision of population with the sources of centralized drinking water is 55.5% (94% of it is urban and 38 % - rural). access to drinking water in the republic have around 4.01 million people, or 55.5% of population, including in big cities and settlements of municipal type - 94%, in rural areas it does not exceed 38%. 2.9 million of people do not have regular access to clean drinking water, 2.8 million of them are from rural areas. out of 62 cities, district centers and settlements of municipal type 52 have centralized system of water supply and only 28 have sewage system. out of 1.75 million of urban population – 1.5 million (87%) receive drinking water from centralized water supply system. in rural areas centralized drinking water is provided to only 20% of population. the rest consume water form different sources (springs, wells with hand pumps, aryks, canals, precipitation, etc.), which do not meet the proper level of sanitary and hygienic standards. the majority of water supply systems were built in 1960-80s and their exploitation resource is 30 to 50 years. For the previous 10-15 years their technical maintenance was not carried out. the existing enterprises of water supply and sewage systems are not able to keep and maintain the available systems and networks properly, the more so, the situation is aggravated by untimely payment for the water supply services. medical institutions are located mainly in the center of settlements (area, city, region, settlement). there are around 1768 medical institutions in the republic, 46% of them have centralized systems of water supply and sewage.
According to the Ministry of Healthcare of the Republic of Tajikistan. 2009
education should fulfill, at least, two important functions: social, directed at making a personality, including its socialization, spiritual, moral, esthetic and intellectual development; and economic, related to qualified labour force.

employmeNt iN tHe coNtext oF HumaN DevelopmeNt 33
emploYmeNt iN taJiKiStaN: tRaDitioNal aND NeW CHalleNGeS
today education standard and labour force quality directly depend on each other. the share of teachers with higher education diminished from 76.6% in 1991 to 61.1% in 2008. the share of teachers with secondary pedagogical education increased from 14.1% to 23.8%8 during the same period. these developments are alarming. Young specialists with higher education are not filling vacancies, and are not entering the education industry (due to low payment or other factors), even though there is sharp shortage of around 10,000 teachers in the republic and this trend continues.
the category “labour force quality” is widely used in the modern world economy. at the same time one should take into consideration that the labour force is not a simple combination of skills, knowledge, abilities that a person possesses. Firstly, it is a reserve of skills, knowledge, abilities. Secondly, it is a reserve of skills, knowledge, abilities a person uses to promote growth of productivity of labour and industry. thirdly, it is the use of this reserve in the form of highly productive activity, which leads to growth of payment of the employee. and, fourthly, increase of income stimulates investments in education and health, acquisition of a new reserve of skills, knowledge and motivations in order to use this reserve efficiently in the future.
european education Fund recommends index of training Quality (itQ) for evaluation quality of education process. the recent estimation showed that the education standard in the republic, according to itQ, is 0.629. However, the education standard can be discussed, if the index will exceed 1.

34 NatioNal HumaN DevelopmeNt RepoRt 2008 -2009
CHapteR 1
thE 8th ChAllEnGE: tAJIKIstAn: smAll opEn oR DEpEnDEnt EConomy?
Following the disintegration of the uSSR, Central asian states in general and tajikistan, in particular, the problems of a lack of regional integration and remoteness from maritime communications have become more pronounced. today, tajikistan is in complex economic and geographic predicament, due to its mountainous terrain, its transport routes (the most effective terrestrial transport communications goes through the closed uzbekistan) and distance to sea transportation (distance to the closest sea port is 3100 km).
Remoteness of the country from the world transport arteries, high transportation costs (according to separate experts transportation costs from economically and geographically closed countries is 50% higher than that from seaside countries), lack of proper roads to such perspective trade partners and neighbors in the region like China, pakistan, india and iran, interfere with the establishment of proper economic links.
alteration of the geopolitical situation of the Republic of tajikistan following the disintegration of the uSSR increased significantly the role of external economic factors in its development. external economic links conditioned by political and economic crises of the transition period played a special role (for example, in 1995 the external economic quota reached 210%). During the period of independent development the dependence of the country’s economy on external price shocks increased.
the Republic of tajikistan occupies an insignificant place on the world cotton markets (less than 4%) and aluminum (less than 5%) being two export products generating the country’s GDp. the share of the republic in the international process of attracting direct foreign investments does not exceed 0.02%.
though expert estimations on tajikistan show that a 1% growth of aluminium and cotton prices can improve the trade balance of the country by 0.2% and 0.12%, respectively, this does not represent a complete employment solution. the key issue is that the national economy does not focus on increasing exports and reducing imports; in doing so, this will be creating additional jobs and overcoming the dualism of the labour force of the country.
expert estimations show that export of ready-made products from aluminium instead of primary aluminium can increase currency receipts multifold and create additional jobs for employment of the unoccupied labour force. one ton of primary aluminium forwarded for rolling increases added value by $ 600.
1.2 thE EConomy oF tAJIKIstAn: stABIlIty to ExtERnAl shoCKs AnD nEW ChAllEnGEs to thE CoUntRy
InsERtIon 5nAtIonAl DEVElopmEnt stRAtEGy UntIl 2015
economic development of the country is under the influence of several objective negative factors which are as follows: (1) lack of access to seas; (2) remoteness from the world developed economic centers; (3) shortage of own accessible oil and gas deposits; (4) natural and geographic fragmentation of the country into regions; (5) low capacity of the internal market; (6) exposure to political instability in the surrounding region; (7) high transaction expenses due to liquidation of aftermaths of natural disasters, drugs traffic and terrorism control.
according to the official statistics a bit more than 2.0 million people were employed on the internal market of the Republic of tajikistan in 2008 and more than 0.4 million on the external market.

employmeNt iN tHe coNtext oF HumaN DevelopmeNt 35
emploYmeNt iN taJiKiStaN: tRaDitioNal aND NeW CHalleNGeS
organization of processing of cotton in the country can add gross value equal to uS dollars 1.5 billlion. Calculations show that the price difference between cotton fiber and cotton fabric (as per 1 kg of cotton fiber) is 10-12 times. if 40% of the produced cotton fiber will be processed into cotton yarn and cotton fabric, the gross value can increase by 2.1 times and the revenues of the state budget by 2.3 times.
THE 9TH cHALLENGE: ENERGY cRISIS
tajikistan is 8th in the world on the reserve of water power resources and has approximately 4% of economically effective water power potential.
today, the total potential resources of water power in the country exceed 527 billion kWh. the predicted deposits of coal, oil and gas are, respectively, 4,452 million tons, 117.6 million tons and 8,517 billion cubic meters, but production reaches, respectively, 97,000 tons, 21,000 tons and 30 million cubic meters, which meets demand for coal in the country to 16%, oil – 4.7%, gas – 5.4%.
availability of big reserves of water power resources determines the priority in construction of hydroelectric power stations to enable export of electric power to the deficit countries in Central asia.
the power system in tajikistan consists of two isolated sub-systems – southern and northern. the southern is redundant, the northern experiences shortage. During the Soviet period tajikistan and the neighboring Central asian countries exchanged excessive summer power to the winter within the power Grid (pG) to cover the shortages; however, following the disintegration of the uSSR, this scheme has been liquidated. until the fall of 2009 part of the needs of the northern power grid was covered by supplies from uzbekistan. in turn, tajikistan passed on to uzbekistan the same amount of electricity in the south in the summer time. this flow of electricity was not a market and in many respects formed a producer surplus in the summer and consumer deficit in winter period. Due to the efforts of the Government, this problem was partly solved through the construction of transmission lines (South-North) with a capacity of 500 kilowatt-hours, which reduced the influence of the energy crisis in the north. However, the shortage of electricity in the country in the autumn-winter period still remains.
as a result, the republic introduces a regime of limited power supply. as a result, there are negative implications on economic development; employment; access to education, medical services and clean drinking water; and environment, due to the illegal cuttings of trees and increased risk of natural disasters.
today, the country is looking to move existing thermoelectric power stations (tepS) to coal on the basis of new firing ecologic technologies. this will help resolve the question of energy security. as a result, the coal-mining industry will be further developed, population of urban areas will be better supplied with hot water and heating; it is expected that these activities will create additional jobs and rehabilitate the national economy.
Regional integration and participation in a joint regional power market is the main direction of utilization of the unique water power resources of tajikistan and withdrawal from energy crisis. this step can ensure an additional effect from this scale.
to ensure provision of power security to the distant regions of the country with power at low price, without negative effect on ecology, the Government of the Republic of tajikistan accepted a long-term programme on construction of small hydroelectric power stations during 2009-2020 (Government Regulation №73 dated 02.02.09). the long-term programme on construction of small hydroelectric power stations consists of the three following development stages:- short-term, to be implemented from 2009 to
2011, total of 66 stations with total capacity – 43,530 kW;
- medium-term, to be implemented during 2012-2015, total of 70 stations with total capacity – 32,850 kW;
- long-term, to be implemented during 2016–2020, total of 53 stations with total capacity – 26,801 kW.
By 2020, 189 small hydroelectric power stations will be constructed with total capacity 103,181 kW, and annual power production 641,645,900 kWh.

36 NatioNal HumaN DevelopmeNt RepoRt 2008 -2009
CHapteR 1
thE 10th ChAllEnGE: ImpACt oF thE WoRlD FInAnCIAl CRIsIs on thE CoUntRy EConomy
the impact of the world financial crisis on the Republic of tajikistan is obvious, given the following four following outcomes:• Reductionofinfluxofprivatedomesticandforeign
investments, • Decreaseofrateofeconomicdevelopment,• Reductionofincomeofprivateandjuridicalpersons,• Decreaseofreceiptsfromexportasaresultoftheworld
price-cutting on raw material by 50%.
the small open economy of the Republic of tajikistan is strongly influenced by cycles of the world economy. thus, the non-industrial export structure will constantly react at such cycles. export receipts of the republic change to a greater extent due to fluctuation of the world prices on cotton fiber and primary aluminium like two basic export products of the country. the drop of the world prices on aluminium and cotton fiber under the influence of the world crisis caused trade deficit in the country which recently reached 35% of GDp.
For the small open economy of the Republic of tajikistan the problem of external price shocks in respect of export of raw material will be pressing for many years.
During the world crisis further overdrawing of GDp by domestic expenditures by 27.1% in the first half of 2009 occurred (Note: in 2008 the overdrawing of GDp by domestic expenditures of the country reached 26.6%; in 2007 – 18.4%; in 2006 – 4.6%; in 2005 – 13.8%; in 2004 – 11.9%). the degree of covering expenses on import from export dropped from 102% in 2002 to 43% in 2008. in the first half of 2009, this figure lowered to 35.4%.
thE 11th ChAllEnGE: REDUCtIon oF mIGRAnts’ REmIttAnCEs
Remittances from abroad positively influence the social structure of tajikistan, increasing the middle class and, reducing the numbers of the population being categorized as ‘poor’ and ‘very poor’. many families currently keep up the living standard due to remittances from migrants – children, brothers, and parents. the financial position of households, whose members are involved in labour migration, is more favourable. they have more possibilities to avoid risks in the period of social transformations.
in 2008 the total amount of remittances to tajikistan reached uS$ 2.6 billion, which is equal to 52% of GDp of tajikistan for the same year. each resident had uS$ 370.6 of remittance per year, or uS$30.8 per month. For comparison, according to the present statistics, per capita income for the same period reached uS$ 376 and uS$ 535.8 per household.
ten countries which receive most remittances from migration in 2006 include: Romania (uS$6.8 billion), poland (uS$5 billion), Serbia and montenegro (uS$4.9 billion), Russia (uS$4 billion), Bosnia and Herzegovina (uS$1.9 billion), Bulgaria (uS$1.9 billion), croatia (uS$1.8 billion), albania (uS$1.5 billion), armenia (uS$1.3 billion), tajikistan (uS$ 2.6 billion).
World Bank, Global Economic Prospects 2006
the total profit of the aluminium company talKo in 2008 was uS$ 200 to 300 million, according to different calculations, which is 10 times less than the total amount of remittances from migrants, while the total amount of export of cotton fiber totaled to only uS$127 million, which is 20 times less than the total amount of remittances.

employmeNt iN tHe coNtext oF HumaN DevelopmeNt 37
emploYmeNt iN taJiKiStaN: tRaDitioNal aND NeW CHalleNGeS
During the first half of 2009 the total amount of remittances to the country was uS$ 696.6 million, which is 34% less compared to the same period of 2008.
Remittances have become the most stable source of financial receipts to tajikistan. unlike foreign assistance, the influx of remittances is not burdened by hard terms, stipulated by international credit institutions. However, until now, remittances did not influence significantly the country’s economy, nor did it result in an increase of employment and new jobs. an effective mechanism to invest remittances by the economy has not been established in tajikistan, even though there is sufficient experience available in the world market. В тоже время необходимо отметить , что денежные переводы в настоящее время создают ряд проблем социально-экономического характера, которые проявляются прежде всего в ослаблении заинтересованности в обучении и заполнении имеющихся рабочих мест.
thE AFtERmAth oF thE CRIsIs: EmploymEnt AnD UnEmploymEnt stAtIstICs
Crisis phenomena in the economy of the republic of the beginning of 90s of the last century, aggravated by the civil war, became especially acute under the influence of the world financial crisis. if highly developed countries today are passing the main peaks of the crisis, the developing countries, including tajikistan, will face their aftermaths for an extended period.
at the end of 2008 and beginning of 2009, a large number of industrial enterprises (especially during the winter months) were closed in all the regions stimulating growth of real unemployment.
the return of external migrants to the republic is one of the heaviest burdens of the crisis on tajikistan.
DIAGRAm 1.2mIGRAnts’ REmIttAnCEs (thoUsAnD Us$)
2003 2004 2005 2006 2007 2008 2009
500 000 000
1 000 000 000
1 500 000 000
2 000 000 000
2 500 000 000
3 000 000 000
0

38 NatioNal HumaN DevelopmeNt RepoRt 2008 -2009
CHapteR 1
the crisis has aggravated the transition to the labour market, where an employer has the power: the number of applications has grown while the number of vacancies has reduced. Social and political aftermaths are obvious: growth of criminality, degradation of human capital, social instability, resulting in a grave post-effect on future generations.
the growth of unemployment can turn into a long-term structural regression of the country’s economy. the economy will show inability to generate an adequate number of qualified jobs for the available labour potential of the country.
the raw material sector of the economy is more capital, rather than labour intensive, increasing production does not result in significant job creation. the situation in large and medium enterprises also aggravates due to reduction of jobs.
in crises, enterprises have very limited opportunities for adaptation, both from the point of view of employment, and from the point of view of payment and regulation of working hours – two general mechanisms of adaptation of labour market. in such situations, employers only have two options – gradual extrusion of people through stimulation of voluntary separation and hiring freezes.
the crisis provides an opportunity to diversify the national economy and create new jobs, but should not to place emphasis only on available vacancies in traditional enterprises and industries. During crises it is not advisable to place emphasis in employment policy on creating low-paying, subsistence jobs, as this undermines the ability of nations to social reproduction.
practical steps to establish conditions for long-term business development are needed in order to create qualitative and high-quality jobs. they can be created, to a great extent, by the private sector under a supportive environment. However, small and medium businesses develop extremely slowly in the country, despite supportive measures taken by the government.
the total number of unemployed able-bodied citizens in tajikistan may exceed 751,000 people: in addition to returning labour migrants, the total number of unemployed will be increased with secondary school graduates as well as higher and vocational institutions, and ex-servicemen. according to the migration Service of the ministry of interior of the
Republic of tajikistan more than 371,400 people returned to the country in 2009. Government statistics do not seem to fully capture the situation. according to the State agency on labour, Social protection of population and migration of the ministry of labour and Social protection of population of the Republic of tajikistan the number of registered unemployed was 44,383 people, while there were 13,668 vacancies in 2009. in theory, it shows more than 3 unemployed to one vacancy, which does not appear to be an accurate reflection of the reality.
During crises people need assistance in finding jobs. the country should establish a state bank of the labour market data accessible for every person looking for job, rather than periodically organizing vacancy fairs. the lack of a joint database on vacancies makes it difficult for a job seeker, especially outside his/her place of residence in another region of the country (for example, construction of a HepS or road-building). unemployment requires appropriate registration; however, official statistics use data on the number of persons officially registered in centers of employment who obtained the status of unemployed. this figure is used as an index of absolute unemployment. During independence, this figure fluctuated within 2-3.5% of the total number of active population; this stated level is much lower than that in highly developed countries.
the world financial and economic crisis revealed the problem of the real registration of the number of unemployed. according to the living Standard Survey in tajikistan in 2007 (and its 2008 update), the registration of unemployment carried out based on the Wto method has shown that its absolute level reached 9.5%. at the same time, national expert estimations show that present external labour migration decreases the level of unemployment by nearly 3 times and increases the level of employment of the able-bodied population by 15%.10 Given the different methods of calculating the level of real unemployment in the country could make 24-27%. there is no doubt that, the real level of unemployment can be estimated on the basis of specially conducted continuous research on labor force and the working age population. However, the above figure is more accurate and consistent with the estimates given by experts in tajikistan back in 2005, when the unemployment rate was estimated to be within 35%11.

employmeNt iN tHe coNtext oF HumaN DevelopmeNt 39
emploYmeNt iN taJiKiStaN: tRaDitioNal aND NeW CHalleNGeS
1.3 hUmAn DEVElopmEnt InDEx (hDI)
DIAGRAm 1.3hDI tAJIKIstAn
1990 1995 2000 2003 2004 20062005 2007
0.65
0.7
0.75
0.6
0.709
0.642 0.6480.67 0.676 0.68 0.684 0.688
Index Rank Global rating
HDi 0,688 127
life expectancy, years 66,4 116
adult literacy rate, % 99,6 9
Combined gross enrolment ratio for primary, secondary and higher institutions, %
70,9 107
GDp per capita (ppp uS $) 1753 143
tABlE 1.3RAtInG oF tAJIKIstAn AnD hDI RAnK AnD Its ConstItUEnts In 200713
IntERnAtIonAl hDI RAtInG oF tAJIKIstAn
HDi rank of tajikistan is in the group of countries with an average level of human development equal to 0.688 (in 2007), occupying 127th place out of 182 countries.12
Restructuring of tajikistan’s economy, following the disintegration of the uSSR as well as the war conflict on the territory of the country from 1992 until 1997 led to
the economic recession which caused drastic decrease of human development from 1990 until 1995 (0.709 and 0.642, respectively). From 1995, a stable tendency of growth of human development took shape, though the rank of 1990 has not yet been reached. By 2015, it is estimated that tajikistan could reach the HDi rank of 1990, taking into consideration the recent growth rate of human development. However, there is a threat of the negative influence of the world economic crisis which can restrain existing tendencies of GDp growth and, correspondingly, decrease the growth rate of human development in the country for several years. the current world financial crisis is amending parameters of development of the country. according to international estimations GDp growth of tajikistan in 2009 will reach 3%, and in 2010, only 4%. this will impose additional obligations on the government of the country in order to preserve indices of social development
HDi is a summary estimation of average statistic achievements of the country in provision of long and healthy life as measured by life expectancy at birth;access to knowledge as measured by two indices – the adult literacy rate and the combined primary, secondary & higher institutions gross enrolment ratio;Decent living standard as measured by GDp per capita, converted to uS dollars in purchasing power parity (ppp).HDi ranks are characterized by limiting values:0,800 and higher – high;from 0,500 to 0,800 – medium;lower 0,500 – low level of human potential.

40 NatioNal HumaN DevelopmeNt RepoRt 2008 -2009
CHapteR 1
analysis of HDi constituents shows that tajikistan has relatively higher values at the education and health standards, than at per capita income level. thus, by the education and health standards tajikistan belongs to a group of countries characteristic of high value of human development (adult literacy and enrolment education exceed 80%, while life expectancy is within 65-70 years). However, by the GDp per capita value tajikistan belongs to the category of countries with low value of human development (less than uS$ 2,000 as per ppp).
Despite the fact that the growth rate of HDi values recently took place mainly due to higher rate of income growth compared to indices of health and education standards, still income keeps at a very low level due to the very low starting level related to the economic collapse which seized the country in the 1990s.
nAtIonAl AnD REGIonAl hDI
the concept of human development is based on the equality of opportunities for all social groups. the averaged index of income growth in the country does not reflect disproportions in access to education, health and income of rich and poor. one of the important aspects of disaggregation of HDi is the comparison of human development in the regions of the country. in order to show the level of human development of the regions in the present national report, evaluation of the national HDi of tajikistan on the basis of index of per capita income without purchasing power parity (ppp) has been done. Such evaluation is justified with a view to make comparative analysis of HDi at the country level in general and its regions in particular.
the results of evaluation of the national HDi of tajikistan and its constituents in 2007 are presented in table 1.4.
thus, in view of analytical presentation in the present national report the value of national HDi of tajikistan in 2007 is accepted as 0.582.
Statistic data on tajikistan show that the value of el index (education level) is relatively high, while the value of Gle index (General life expectancy) is higher than average. a relatively low value of per capita income index (pCi) substantially influences the reduction of HDi of the country. it is necessary to initiate elaboration of a complex national programme aimed at the revision of the income and payment policy for a long-term period in order to preserve high values of Gle and el indices and increase the value of pCi index.
AlE Es pCI hDI
average life expectancy index
education standard index
per capita income index
Human development index (without ppp)
0.726 0.911 0.108 0.582
Rt RtRtRt
tABlE 1.4hDI AnD Its ConstItUEnts oF tAJIKIstAn In 2007
DIAGRAm 1.4hDI AnD Its ConstItUEnts, tAJIKIstAn, 2007
ale
eS
pci
HDi
0 0.1 0.2 0.3 0.4 0.5 0.6 0.8 0.9 10.7
0.582
0.108
0.911
0.726

employmeNt iN tHe coNtext oF HumaN DevelopmeNt 41
emploYmeNt iN taJiKiStaN: tRaDitioNal aND NeW CHalleNGeS
For estimation of HDi at the regional level (to provide conditions for comparison), the value of per capita income on purchasing power parity has been replaced by expected per capita income (pCi) corrected to capacity of subventions which the regions receive from the State budget (SB) (annex 1).
pCi at the regional level has been calculated based on the fact that Gross Regional product (GRp) is a sum of gross added cost produced in the region. GRp characterizes potential of local economy and is a result of activity of all producers in the region, while pCi reflects not only the level of production and consumption, but also distribution in the region.
Regional HDis were calculated on the 2007 data on 5 administrative and territorial divisions – Dushanbe (capital), 2 regions (Sodg and Khatlon), Gorno-Badakhshan autonomous oblast and the group of towns and regions of the republican subordination (tRRS).
Dushanbe is the highest (with maximum value of 0.666). the lowest value of human development is in Khatlon region – at 0.552.
analysis of constituents of HDi shows that life expectancy is variable from 71,0 years in Khatlon region to 76.5 years in Dushanbe. in all regions, the health standard index is high and comparable to the category of countries with high level of human development. the level of adult literacy is also high in all regions and has an insignificant difference in values. High values of enrollment for secondary and higher education have 3 regions – Dushanbe, GBao and Sogd region. the lowest values are in tRRS and Khatlon region. the difference between Dushanbe and tRRS is almost 14% (annex 2).
InsERtIon 6mACRoEConomIC sCEnARIos oF thE CoUntRy’s DEVElopmEnt
there are three scenarios of development of national economy for a long-term perspective.Scenario #1 – “version of understated potentials”. average annual GDp growth rate as per this version decreases from 9.4% in 2001-2005 and 7% in 2006 to 5% during the whole predicted period. the real increment in 2006-2015 will reach 66.0%. effectiveness of this version will be moderate, since per capita GDp by 2015 in 2006 prices will be around 1,735 Somonis versus 1,311.3 in 2006. Scenario #2 foresees the economic growth rate by 7-7.5% during the whole predicted period. predicted increment in 2006-2015 will be 97.8%. according to this version per capita GDp by 2015 in 2006 prices will be 2,066 Somonis versus 1,311.3 Somonis in 2006.Scenario #3 foresees increase of GDp growth rate by no less than 9% annually. the real GDp increment will be 2.3 times in 2006-2015. per capita GDp by 2015 in 2006 prices will be 2,427 Somonis. all versions of social and economic development assume an increase in the quality of economic growth, which to a great extent is determined by the growth of investments and export items. Scenario #2 is the most probable scenario, according to which average annual rate of economic growth will be not less than 7% during the whole period until 2015. Within the frame of the pRS (a three-year section of the NDS) the indices of the basic scenario can change taking into account the current economic situation and the policy being pursued.
National Development Strategy of the Republic of Tajikistan until 2015

42 NatioNal HumaN DevelopmeNt RepoRt 2008 -2009
CHapteR 1
2007 year
2006 year
DIAGRAm 1.5hDI tAJIKIstAn By REGIons
Khatlon Region
Sogd Region
tRRS
GBao
Dushanbe
0 0.1 0.2 0.3 0.4 0.5 0.6 0.7
0.552
0.555
0.567
0.587
0.666
0.539
0.55
0.557
0.581
0.648
76 77
76.5
2007 year
2006 year
Khatlon Region
Sogd Region
tRRS
GBao
Dushanbe
DIAGRAm 1.6lIFE ExpECtAnCy In REGIons oF tAJIKIstAn, yEARs
67 68 69 70 71 72 73 74 75
71
71.4
71.4
74.4
70.6
70.9
71.3
74
75.5
2007 year
2006 year
Sogd Region
tRRS
Dushanbe
DIAGRAm 1.7pER CApItA InComE, Us DollARs
0 200 400 600 800 1 000 1 200
383.7
562.1
959.5
332.5
484.1
815.5
GBao319.6
268.9
Khatlon Region
399.1338
2007 year
2006 year
Sogd Region
Dushanbe
GBao
DIAGRAm 1.8lItERACy lEVEl oF ADUlt popUlAtIon, %
96 96.5 97 97.5 98 98.5 99 99.5
99.3
98.7
Khatlon Region
97.2
97.2
tRRS 97.3

employmeNt iN tHe coNtext oF HumaN DevelopmeNt 43
emploYmeNt iN taJiKiStaN: tRaDitioNal aND NeW CHalleNGeS
2007 year
2006 year
Khatlon Region
Dushanbe
GBao
DIAGRAm 1.9EnRollmEnt FoR EDUCAtIon, %
0 10 20 4030 6050 70 9080
77.4
75
tRRS 61.1
66.8
Sogd Region 72.8
as in general in the country, the most significant differentiation between the regions is visible at the income level. per capita income in Dushanbe exceeds the same index in GBao by more than 3 times, in Sogd and Khatlon regions – by 2.5 times and in tRRS – by 1.7 times.
So, the prospective complex national programme aimed at the revision of income and payment policy for a long-term period should be concretized at the regional level as well.

44 NatioNal HumaN DevelopmeNt RepoRt 2008 -2009
CHapteR 2
CHapteR 2
laBouR maRKet
aND emploYmeNt
employment represents social and economic relations of people on the occasion of their participation in socially useful work. it characterizes quantitative and qualitative levels of usage of able-bodied population as well as the established economic situation, business and financial activity, living standards and income of population and its solvent demand in the country.

employmeNt iN tHe coNtext oF HumaN DevelopmeNt 45
laBouR maRKet aND emploYmeNt
2

46 NatioNal HumaN DevelopmeNt RepoRt 2008 -2009
CHapteR 2
DEmoGRAphIC sItUAtIon
the current demographic situation is characterized by a sharp decline in birth rate and natural population growth, accelerating des-urbanization of society, deterioration of the whole complex of conditions related to human reproduction and the population as a whole, the increase in migration mobility of the population and changes in its structure, the surge of foreign labor migration.
in 2001 tajikistan adopted the population programme. its efficiency became obvious in 2-3 years, through a reduction of infantile and maternal mortality rates, as well as through regulation of birth rate and family planning. Further on, attention to this programme fell significantly. in 2002 Regulation № 501 of the Government of the Republic of tajikistan adopted “the programme of realization of the concept of demographic policy of the Republic of tajikistan for 2003-2015”. Currently similar programmes are being prepared for cities, rural settlements, etc.
alteration of number and composition of population of the country has a country, as well as a regional specificity, since every region of tajikistan has its way of economic development and different natural and climatic conditions.From 2000 to 2009 the population of the republic increased
on average by 2.04% per year. Statistic observations show incremental population in all the regions of the country, but this increment takes place against the background of a decreased natality rate.
Country research revealed that the dynamic of natality is influenced by the level of poverty of the population. Decreased natality rate is a result of a drastic drop of reproductive human fund which is expressed in undernourishment of children and adolescents, shortage of clothes, foot-wear, manuals, class-rooms, educated teachers and parents, qualified doctors, policlinics, maternity houses, medicines, etc.
alterations in the dynamic of population in separate regions of tajikistan have changed the structure of the territorial location and density of population. So, in 2000 there was the following number of population per 1 sq.km: in GBao – 3.2, in Sogd region – 74.8, in Khatlon region – 88.6, in RRS – 47.9. the further growth of population will promote the further growth of density of population, especially, in Khatlon and Sogd regions.
High birth rate and lack of significant sex and age disproportions ensure a high level of young people in the structure of the population in the country. During the period
2.1 DEmoGRAphIC tREnDs AnD EDUCAtIon systEm potEntIAl
tABlE 2.1REGIonAl DynAmICs oF popUlAtIon oF thE REpUBlIC oF tAJIKIstAn FRom 2000 to 2009 (beginning of the year, thousand people)14
year Republic of tajikistan
GBAo sogd Region
Khatlon Region
Dushanbe RRs
2000 6126.7 206.4 1871.2 2149.3 561.2 1338.6
2001 6250.0 208.5 1900.4 2196.6 575.9 1368.6
2002 6375.5 210.7 1930.2 2243.5 589.4 1401.7
2003 6506.5 213.2 1962.4 2293.0 604.0 1433.9
2004 6640.0 215.7 1992.6 2344.6 619.4 1467.7
2005 6780.4 217.9 2027.8 2404.1 631.7 1498.9
2006 6920.3 218.4 2060.9 2463.3 646.4 1531.3
2007 7063.8 220.4 2095.7 2519.6 660.9 1567.2
2008 7215.7 218.0 2132.1 2579.3 679.4 1606.9
2009 7373.8 219.1 2171.2 2642.3 695.2 1646.0

employmeNt iN tHe coNtext oF HumaN DevelopmeNt 47
laBouR maRKet aND emploYmeNt
of time between two censuses the number of people younger than able-bodied age changed insignificantly, from 42.9% to 42.7%. However, the absolute number of this age category of population during this period increased by 19.7%. the share of population in able-bodied age during this period increased from 49.5% to 51.0%. the absolute ratio of this category increased by 24.1%. this data justifies the formation of a favourable age structure of the population in the country, which under some definite circumstances can turn into an independent factor of economic growth and an increment of production of social labour.
the population of the republic on 1 January 2009 reached 7,373,800 people, including female – 3,674,900 people (49.8%), male – 3,698,900 people (50.2%).
DIAGRAm 2.1AGE-GRoUp pyRAmID, 1 JAnUARy, 2009 (thousand people)
tABlE 2.2 DEnsIty oF popUlAtIon oF tAJIKIstAn (beginning of year, people per 1 sq.km) 15
year 2001 2002 2003 2004 2009
Republic of tajikistan 43.7 44.5 45.5 46.4 51.5
towns and regions of the republican subordination 47.9 49.0 50.1 51.3 57.6
sodg region 74.8 76.0 77.3 78.4 85.5
Khatlon region 88.6 90.5 92.5 94.5 106.5
GBAo 3.2 3.3 3.3 3.4 3.4
1000000 100000080000 8000060000 6000040000 4000020000 200000 00 0
4 4
8 8
12 12
16 16
20 20
24 24
28 28
32 32
36 36
40 40
44 44
48 48
52 52
56 56
60 60
64 64
68 68
72 7276 76
80 80
84 84
88 88
92 92
96 96
100 100male female
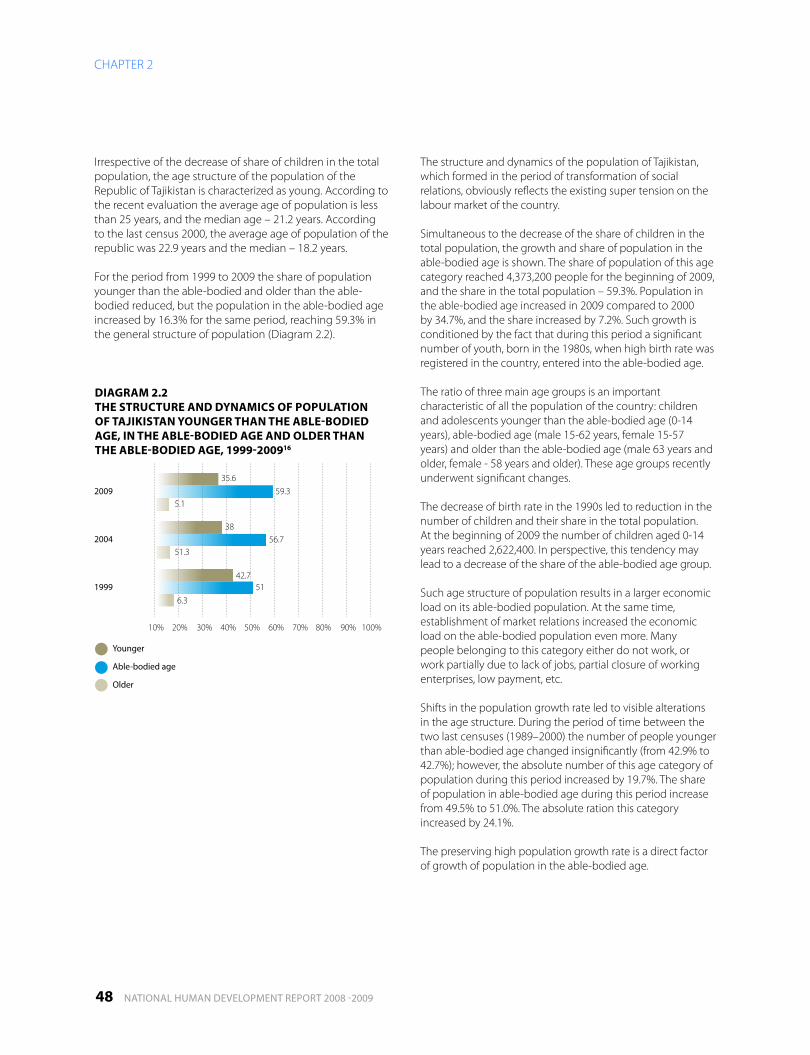
48 NatioNal HumaN DevelopmeNt RepoRt 2008 -2009
CHapteR 2
irrespective of the decrease of share of children in the total population, the age structure of the population of the Republic of tajikistan is characterized as young. according to the recent evaluation the average age of population is less than 25 years, and the median age – 21.2 years. according to the last census 2000, the average age of population of the republic was 22.9 years and the median – 18.2 years.
For the period from 1999 to 2009 the share of population younger than the able-bodied and older than the able-bodied reduced, but the population in the able-bodied age increased by 16.3% for the same period, reaching 59.3% in the general structure of population (Diagram 2.2).
the structure and dynamics of the population of tajikistan, which formed in the period of transformation of social relations, obviously reflects the existing super tension on the labour market of the country.
Simultaneous to the decrease of the share of children in the total population, the growth and share of population in the able-bodied age is shown. the share of population of this age category reached 4,373,200 people for the beginning of 2009, and the share in the total population – 59.3%. population in the able-bodied age increased in 2009 compared to 2000 by 34.7%, and the share increased by 7.2%. Such growth is conditioned by the fact that during this period a significant number of youth, born in the 1980s, when high birth rate was registered in the country, entered into the able-bodied age.
the ratio of three main age groups is an important characteristic of all the population of the country: children and adolescents younger than the able-bodied age (0-14 years), able-bodied age (male 15-62 years, female 15-57 years) and older than the able-bodied age (male 63 years and older, female - 58 years and older). these age groups recently underwent significant changes.
the decrease of birth rate in the 1990s led to reduction in the number of children and their share in the total population. at the beginning of 2009 the number of children aged 0-14 years reached 2,622,400. in perspective, this tendency may lead to a decrease of the share of the able-bodied age group.
Such age structure of population results in a larger economic load on its able-bodied population. at the same time, establishment of market relations increased the economic load on the able-bodied population even more. many people belonging to this category either do not work, or work partially due to lack of jobs, partial closure of working enterprises, low payment, etc.
Shifts in the population growth rate led to visible alterations in the age structure. During the period of time between the two last censuses (1989–2000) the number of people younger than able-bodied age changed insignificantly (from 42.9% to 42.7%); however, the absolute number of this age category of population during this period increased by 19.7%. the share of population in able-bodied age during this period increase from 49.5% to 51.0%. the absolute ration this category increased by 24.1%.
the preserving high population growth rate is a direct factor of growth of population in the able-bodied age.
2009
2004
1999
DIAGRAm 2.2thE stRUCtURE AnD DynAmICs oF popUlAtIon oF tAJIKIstAn yoUnGER thAn thE ABlE-BoDIED AGE, In thE ABlE-BoDIED AGE AnD olDER thAn thE ABlE-BoDIED AGE, 1999-200916
10% 20% 30% 40% 50% 60% 70% 80% 90% 100%
35.6
3856.7
51.3
42.7
59.35.1
516.3
younger
able-bodied age
older

employmeNt iN tHe coNtext oF HumaN DevelopmeNt 49
laBouR maRKet aND emploYmeNt
the data justifies the establishment of a more favourable age structure of the population, which under some circumstances, can turn into an independent factor of economic growth, and increment of labour production based of their involvement in labour activity.
the long-term crisis led to preservation of des-urbanization. the ratio of urban and rural population for the last 10 years ranges within 26.4% to 73.6%, respectively.
FInAnCInG oF EDUCAtIon
the state of the system of education and its standard are determined, to a great extent, by the financing potential. Starting from 2004 the State has made attempts to improve the situation with respect to material and technical basis of schools and with payment to employees at all levels of the education system.
For the period 2000-2008 the level of state expenditures on education as a percentage of GDp increased significantly from 2.3% in 2000 to 3.5% in 2008. the main growth has come from the previous 4 years due to reforms in the education system of the republic. in 2009, 1.2 billion Somonis was allocated to the education system, four times higher than the previous 5-year period and 33 times higher than in 1995.18
2007
2008
2006
2003
2000
1998
1991
DIAGRAm 2.3thE pRoCEss oF DEs-URBAnIzAtIon pREsERVEs In tAJIKIstAn17
0% 20% 40% 60% 80% 100%
Rural population
urban population
able-bodied age is determined in the Republic of tajikistan based on legislation. Before 2003 the able-bodied age was determined: for male 15-59 years, for female – 15-54 years; age younger than able-bodied - 0-14 years; age older than the able-bodied: male - 60 years and older, female – 55 years and older. From 2003 the able-bodied age was determined: for male 15-60 years, for female 15-55 years, age younger than able-bodied – 0-14 years; age older than the able-bodied – for male 61 years and older, for female 56 years and older. From 2004 the able-bodied age was determined: for male 15-61 years, female 15-56 years, age younger than the able-bodied – 0-14 years; age older than the able-bodied: for male 62 years and older, for female 57 years and older. From 2005 the able-bodied age is determined: for male 15-62 years, for female 15-57 years, age younger than the able-bodied – 0-14 years; age older than the able-bodied – for male 63 years and older, for female 58 years and older. Growth of share of able-bodied population for the period from 2003 to 2005 at a higher rate took place due to the increase of range of the able-bodied age in legislation.

50 NatioNal HumaN DevelopmeNt RepoRt 2008 -2009
CHapteR 2
2009
2008
2007
DIAGRAm 2.4CApACIty AnD soURCEs oF FInAnCInG oF EDUCAtIon systEm oF thE REpUBlIC oF tAJIKIstAn (million somonis)
2000 400 600 800 1000
957.5
604.429.8
57
437.2
9092
46.240.9
Budget funds
the state investments programme
extra-budgetary funds
DIAGRAm 2.5BUDGEt AlloCAtIons to EDUCAtIon, % to GDp
1998 1999 2000 2001 20032002 20052004 2006 2007 2008
0,5
1,0
1,5
2,0
2,5
3,0
3,5
4,0
4,5
5,0
0
During the last several years significant financial resources under external loans, grants and programmes on technical assistance were allocated to the general education system. under the programme of State investments (Sip) in 2007-2009 the expenditure of the sub-sector reached around $166 million.19
in 2008, in comparison to 2007, budget allocations to the education system increased by 40.2%. However, despite funding increases, the allocated funds are not sufficient to solve the problem of the education standard.
it should be noted that financing of the education system is allocated to a great extent from the local budget. However, recently the share of the republican budget in the total state budget allocations to the sector has increased.
From 2000 to 2009, the structure of the state allocations to the education sector did not undergo significant changes. General education preserved the prevailing position in the structure of expenditures. the growth of expenditures has been re-distributed between the levels of education rather evenly; however, expenditures per student on different levels of education grew unevenly, mainly due to an uneven change in the number of students. the highest growth rate of expenditures is in primary and secondary vocational levels of education, while pre-schools is the lowest.

employmeNt iN tHe coNtext oF HumaN DevelopmeNt 51
laBouR maRKet aND emploYmeNt
local budget
republican budget
DIAGRAm 2.6stRUCtURE oF EDUCAtIon systEm FInAnCInG At thE BUDGEt systEm lEVEls, 2007
81%
19%
local budget
republican budget
stRUCtURE oF EDUCAtIon systEm FInAnCInG At thE BUDGEt systEm lEVEls, 2009
73,9%
26,1%
tABlE 2.3 Cost oF pER CApItA FInAnCInG on 2009 BUDGEt yEAR, AnD InDICAtIVE Cost pARAmEtERs on 2010 AnD 2011
type of school and standard 2009 2010 2011
General secondary schools (classes 1-11)
- per one student, somonis
- per one school, somonis
General basic schools (classes 1-9)
- per one student, somonis
- per one school, somonis
primary schools (classes 1-4)
- per one student, somonis
- per one school, somonis
268
268
428
51310
36335
7650
349
354
566
66903
48033
10112
435
447
447
83396
60692
12777
the structure of expenditures on economic categories underwent more essential changes. Growth of the state expenditures has been mainly allocated to payments, which improved the situation with payments on the sector, in general, and payments to teachers of general education institutions, in particular. at the same time, there were some positive changes in the direction of capital costs, which before 2004 were at a very low level – not more than 2% of the total costs of the sector. Beginning in 2004 capital costs were significantly increased and reached 7-8% of the total education expenditures.
the government intends to continue reforms in order to reach more equal and effective use of the state resources. in order to solve the problem the government intends to fully implement the system of per capita financing in the education system which will increase efficiency of the state costs, ensure a more even distribution of the costs, and increase predictability and discipline of the budget process.

52 NatioNal HumaN DevelopmeNt RepoRt 2008 -2009
CHapteR 2
introduction of per capita financing in the regions will be carried out gradually. in 2009, in Khatlon region only 4 regions participate in the experiment; in 2010, it is projected that 20 regions will participate; by 2011, all secondary institutions will turn to the per capita financing. in Sogd region in 2009 and 2010, only 4 regions will be included in the per capita financing of schools. the regions of the republican subordination will participate in the process more dynamically – by 2010, almost all the regions will be included in the system of per capita financing. in Gorno-Badakhshan autonomous Region only secondary schools will move to per capita financing by 2011. the potential of the education system in the context of relations with demographic process and focus on the labour market is characteristic of three aspects: а) quantitative and qualitative evaluation of graduates of general schools, b) quality of the vocational education system, c) demand for graduates of the vocational education system.
today, the number of children of school age (from 7 to 18 years) is 2,058,600 which is a bit more than 27.9% of total population of the republic (2008)20. the systems of general, secondary, primary and secondary vocational education enroll more than 92%21 of children and adolescents .
General education is the dominant sector of education. at this stage of education 1,506,100 children are trained and enrollment of children of this group for schools is growing.
InsERtIon 7thERE ARE FolloWInG lEVEls oF EDUCAtIon In thE REpUBlIC oF tAJIKIstAn:
pre-school education;
General secondary education – primary education (from 1 to 4 class, age from 7 to 11 years), general compulsory (from 5 to 9 class, age from 11 to 16 years), secondary general education (from 10 to 11 class, age 16 -17 years);
vocational education – primary, secondary special and higher professional, after-graduate and additional training.
according to the constitution of the Republic of tajikistan, basic general education is compulsory, and the State undertakes obligation on provision of free education to all citizens of the Republic of tajikistan.
DIAGRAm 2.7CompARIson oF thE nUmBER oF stUDEnts FRom 1st to 9th ClAssEs, AnD thE nUmBER oF ChIlDREn In thE CoRREsponDInG AGE GRoUp22
1440,0
1460,0
1480,0
1500,0
1520,0
1540,0
1560,0
1580,0
2004/5 2005/6 2006/7 2007/8 2008/9
number of students in 1-9 classes
number of students aged 7-15

employmeNt iN tHe coNtext oF HumaN DevelopmeNt 53
laBouR maRKet aND emploYmeNt
primary education enrolls almost all children; the level of enrollment is reducing as approaches 9th class. the lowest enrollment is for senior classes, which, to some extent, is related to the continuation of education in secondary special educational institutions and the transition to the system of vocational education.
Comparison of graduates in general education to the number of students of 10 classes and the number enrolled in institutions of primary and secondary vocational education shows that a minimum of 13% of youths and 20% of girls are lost in this educational chain annually. these parameters increase, if we take into consideration the fact that the institutions related to vocational education enroll those who completed general education as well as secondary general education.
DIAGRAm 2.8EnRollmEnt FoR sEConDARy EDUCAtIon oF ChIlDREn AnD ADolEsCEnts oF thE REpUBlIC oF tAJIKIstAn, %
99,1
99
99,6
101,1
102,5
95,3
95,6
96,5
96,6
98,1
45,8
46,4
46,9
51,3
54,3
0 20 40 60 80 100 120
2004/5
2005/6
2006/7
2007/8
2008/9
coefficient of enrollment for primary education (1-4 classes)
coefficient of enrollment for general education (1-9 classes)
coefficient of enrollment for secondary education (10-11 classes)
Enrollment for education – the process of training children and adolescents in educational institutions. this index characterizes the relationship of the number of students to the number of population of respective age. index of involvement higher than 100% is justified by the fact that children younger than 7 years old go to primary school (mainly boys). Statistic estimations of enrollment for education of girls and boys justify the availability of gender inequality in education, as well as other factors related to gender differences.
Empiric research proved that gender inequality:
• increases risk of infant and child mortality, lowers the education standard of children, supports high level of birth rate at low level of living standard (everything depends on education of a mother);
• leads to losses in payments;
• increases risk of Hiv infections (gender inequality in literacy level, increase of demand for sexual services).23
levels of attendance better reflect the availability of school system, rather than the level of enrollment for schools. Research of living standards in tajikistan in 2007 showed that the level of attendance in primary schools (1-4 classes) reaches 97.3%, and 76.1%24 in 5-11 classes. the goal (to achieve mDG) is to increase the level of attendance in primary, as well as in general secondary educational institutions, to 100% by 2015.
to support this, the president has made an offer to shift the schools of general education to the system of compulsory 10-year education starting September 2010.

54 NatioNal HumaN DevelopmeNt RepoRt 2008 -2009
CHapteR 2
DIAGRAm 2.9EnRollmEnt FoR InstItUtIons oF VoCAtIonAl EDUCAtIon oF thE CoUntRy (2003 =100%)27
Secondary vocational educationHigher vocational educationHigher professional education
80%
85%
90%
95%
100%
105%
110%
115%
120%
125%
2003 2004 2005 2006 2007 2008
tABlE 2.4GRoWth RAtE oF EnRollmEnt oF stUDEnts FoR thE systEm oF VoCAtIonAl EDUCAtIon oF thE CoUntRy (2003 =100%)
2004 2005 2006 2007 2008
primary vocational education
secondary vocational education
higher vocational education
GIRlsyoUths
99 113104 92 95 115100 92 55 57
93 123109 101 109 109116 121 114 116
98 132109 110 114 105118 135 139 125
GIRlsyoUths GIRlsyoUths GIRlsyoUths GIRlsyoUths
However, it should be mentioned that despite significant efforts of the Government and other respective bodies working to improve access of children to general basic education, the issue of enrollment of children still one of the most important; it demands immediate resolution. according to various estimations, the total number of children of school age (in need of education) will increase by approximately 850,000 people by 2015, this, in its turn, will increase demand for educational services by 1.5 times.26
During recent years, the number of students enrolled in institutions of primary and vocational character has decreased, whereas in secondary and higher vocational institutions the number of students had increased, mainly due to the introduction and expansion of chargeable services. From 2003 to 2008, the number of enrolled for primary vocational institutions reduced by 3%, but increased by 13% in secondary vocational institutions and by 10% in institutes of higher education.
With respect to gender, in comparison with other levels of vocational education, the number of girls striving for higher education is growing.

employmeNt iN tHe coNtext oF HumaN DevelopmeNt 55
laBouR maRKet aND emploYmeNt
agriculture
2004/05
2005/06
2006/07
2007/08
2007/08
industry and construction
DIAGRAm 2.10GRoWth RAtE oF EnRollED FoR InstItUtIons oF sEConDARy VoCAtIonAl EDUCAtIon oF thE REpUBlIC (2003 = 100%)28
0% 50% 150%100%
Healthcare, physical training and sport
2004/05
2005/06
2006/07
2007/08
2007/08
education
0% 50% 150%100%
the share of total enrolled girls is relatively high in secondary vocational educational institutions (54%). the percentage has reduced in institutions of primary vocational education - from 31% in 2003 to 18% in 2008. this shows that these institutions are not popular among the female population. the share of total enrolled girls for institutes of higher education is not large - 28%; however, it is growing and, including, at the expense of “the president’s quota”.
to overcome gender inequality and provide for gender parity in the education system the ministry of education adopted a resolution on 30 may 1997 «on the order of annual enrollment of the definite number of girls from remote districts of the country without entry exams”. according to this resolution at the president’s annual quota the higher educational institutions enroll girls from remote districts of rural areas on different specialties. in the 2006/07 academic year, the higher educational institutions enrolled 916 students (at the quota), including 480 girls (53%). in the 2007/08 academic year, 969 students were enrolled (at the quota), 528 girls out of them, (55%).
the main aim of the president’s quota is training young girls from remote districts to become professional specialists. this measure, undoubtedly, results in an increase of general education levels of the female population and ensures their employment. However, it should be mentioned, that often girls interrupt their study due to marriage and other family circumstances.
From the point of view of development of the economy, the structure of demand for professional education on different specialties has a special significance.
there are 52 secondary vocational educational institutions. Distribution of students specialties shows that more than 66% have chosen two specialties – education and Healthcare. the number of students choosing specialties related to computer techniques, production of consumer goods and construction sectors is growing.
training of specialists of non-productive specialties increases significantly. But for development of the industrial and agrarian economy, it is important to increase training of specialists on technical specialties, as this training is insufficient. there are 33 institutions in the system of higher education. in recent years, relatively more students are enrolled for economic, data-processing and construction specialties. estimations show that enrollment for naturalist and technical specialties, is increasing as well; while the increase is so small, even a tiny increase is reflected as a significant growth. more than half of students are trained on economic, humanitarian and social specialties. Currently, the labour market is full of these types of specialists, while there is shortage of technical specialists.

56 NatioNal HumaN DevelopmeNt RepoRt 2008 -2009
CHapteR 2
the potential of the education system is, to a great extent, determined by quantitative and qualitative staff composition. Staff problem preserves its acuteness in the education system and is reflected on the quality of training of specialists, on their correspondence to the labour market demand. the number of schools and students is increasing, though the number of teachers is reducing. Shortage of teachers is not the only problem; there is an issue in the educational standard as well. one third of teachers in the system of secondary general education do not have higher education, and in rural areas, this number is approximately 37%. Shortage of teachers in the system of vocational education is also a problem.
However, in general, the problem on the national level is disequilibrium between the education services market and the labour market. annual graduation from institutions of primary vocational education is more than 7,000; secondary vocational education almost 8,000; and higher education institutions, more than 19,000 students. the labour market receives 34,000 young specialists in the following ratio: 1 graduate of a working specialty corresponds to 1.14 graduates with secondary special education, and 2.7 graduates with higher education. therefore, there are 21% blue-collar, and 79.4% white-collar workers among graduates. But the ratio of vacancies on the labour market shows bigger demand for working specialties.
tABlE 2.5REGIonAl stRUCtURE oF VACAnCIEs on thE lABoUR mARKEt oF thE REpUBlIC oF tAJIKIstAn
september 2007 september 2009
Republic of tajikistan
Khatlon region
sogd region
Dushanbe
RRs
GBAo
totAl VACAnCIEs, UnIts
totAl VACAnCIEs, UnIts
shARE oF VACAnCIEs FoR WoRKInG spECIAltIEs In
totAl nUmBER oF VACAnCIEs, %
shARE oF VACAnCIEs FoR WoRKInG spECIAltIEs In
totAl nUmBER oF VACAnCIEs, %
15496
5695
4174
2507
2706
414
48,2%
42,1%
65,1%
63%
28,5%
0,9%
43,1%
18,6%
71,3%
35,9%
44,6%
41%
13668
3631
3640
2289
3270
838

employmeNt iN tHe coNtext oF HumaN DevelopmeNt 57
laBouR maRKet aND emploYmeNt
it is important to consider the demand for specialists from the point of view of the state and perspectives of economic development in separate regions of the republic. in particular, rural regions experience a shortage of specialists. as a result, it is very important to elaborate a mechanism of purposeful training of specialists with higher education as well as with working specialties. although formally training in institutions of vocational education at all levels (including primary vocational education) assumes a direct exit to the labour market upon graduation, in fact, many graduates are forced afterwards, to “complete” training or learn again, which testifies to the inadequate quality of education in the country.
AccOMPLISHED EDUcATION STANDARD AND EMPLOYMENT
the labour Force Survey (lFS) showed that the greater part of the economically active and employed population has secondary general education, a sign of insufficient demand for vocational education.
if the data of lFS 2004 and Census 2000 are compared, the results are rather similar; this shows that an accurate picture on the structure of the education standard in the national economy is being provided by the labour Force Survey.
in 2004, a little more than a quarter of all the economically active population had either higher (full and incomplete), or secondary special and primary vocational education. However, in the context of the regions, the situation is somewhat different: the economically active population in Dushanbe has a relatively high education standard while that in the RRS is relatively low.
Higher and incomplete higher
Secondary vocational
Secondary general
incomplete general
primary general
economically active population
employed population
DIAGRAm 2.11 EDUCAtIon stAnDARD oF EConomICAlly ACtIVE AnD EmployED popUlAtIon oF thE REpUBlIC oF tAJIKIstAn, %
0,00% 10,00%
12,4%
16,8%
7,9%
4,2%
50,5%
12,1%
16,9%
8%
4,3%
50,4%
50,00%40,00%30,00%20,00%
tABlE 2.6 EDUCAtIon stAnDARD oF EConomICAlly ACtIVE popUlAtIon oF thE REGIons oF thE REpUBlIC oF tAJIKIstAn
Rt Dushanbe sogd region
Khatlon region
RRs GBAo
higher & incomplete higher 12,1% 36,5% 12,3% 9,2% 7,6% 13,7%
secondary special 8,0% 9,8% 8,0% 7,8% 6,9% 11,4%
secondary genera 50,4% 35,4% 61,5% 43,1% 50,0% 57,5%
Incomplete secondary 16,9% 4,8% 9,0% 24,7% 21,7% 9,8%
primary general 4,3% 2,9% 2,5% 6,0% 5,6% 1,1%

58 NatioNal HumaN DevelopmeNt RepoRt 2008 -2009
CHapteR 2
For the economically active population of Dushanbe access to transportation to institutions of vocational education is high and this is an important contributing factor to enrollment for vocational education. Comparison of education standards of the economically active urban and rural population proves this point.
in rural regions, the share of the economically active population with secondary education compounds the greater part which increases potential of obtaining higher education. While demand for vocational labour force is growing, the current situation on the labour market requires training of specialists with secondary special education, especially in rural areas. as a result, vocational schools should be rehabilitation to expand access.
the economically active population of the country differs by gender and age. only 31.1% of women of the able-bodied age are economically active, while this parameter reaches 58.1% among men.
Higher and incomplete higher
Secondary vocational
Secondary general
incomplete general
primary general
Rural areas
urban areas
DIAGRAm 2.12 DIstRIBUtIon oF EConomICAlly ACtIVE popUlAtIon By thE EDUCAtIon stAnDARD, %29
0% 10% 50%40%30%20%
total women
total men
14 лет
15-24
25-34
35-44
45-54
55-64
Female
male
DIAGRAm 2.13shARE oF EConomICAlly ACtIVE popUlAtIon In thE totAl nUmBER oF popUlAtIon oF thE ABlE-BoDIED AGE, 200730
0% 10% 50% 60% 70% 80% 90% 100%40%30%
58,1%
3,0%
31,1%
31,8%
75,3%
82,4%
80,7%
47,8%
40,6%
69,0%21,7%
32,9%
22,8%
7,0%
20%

employmeNt iN tHe coNtext oF HumaN DevelopmeNt 59
laBouR maRKet aND emploYmeNt
men reach the peak of economic activity by 35-54 years of age. Four out of five in these age groups are economically active. Women reach their peak between 35 and 44, when half are economically active. Women are less active economically than men. there is gender inequity on all the levels of education. as a result, women have less access to vocational training. although the share of economically active women with higher education in the period between census 2000 and lFS 2004, increased, the absolute value decreased.
Due to this, the social policy of the state should focus on providing favourable conditions for the involvement of women in the labour market.
Higher
incomplete higher
Secondary vocational
Secondary general
incomplete secondary
primary general
lFS 2004
census 2000
DIAGRAm 2.14 EDUCAtIon stAnDARD oF EConomICAlly ACtIVE mAlE popUlAtIon
0,0% 10,0%
14,5%
46,3%
13,7%
3,2%
8,5%
10,8%
57,0%
1,8%
1,8%
16,6%
5,0%
7,7%
50,0% 60,0%40,0%30,0%20,0%
Higher
incomplete higher
Secondary vocational
Secondary general
incomplete secondary
primary general
lFS 2004
census 2000
DIAGRAm 2.15 EDUCAtIon stAnDARD oF EConomICAlly ACtIVE FEmAlE popUlAtIon
0,0% 10,0%
6,0%
56,2%
21,4%
5,9%
7,3%
4,5%
58,1%
0,7%
0,4%
21,7%
6,8%
5,4%
50,0% 60,0%40,0%30,0%20,0%
Higher
Secondary vocational
Secondary general
lower than secondary
Female
male
DIAGRAm 2.16DIstRIBUtIon oF EConomICAlly ACtIVE popUlAtIon ACCoRDInG to EDUCAtIon stAnDARD (GEnDER-BAsED), %
0,0% 10,0%
6,3%
46,3%
28,4%
9,0%
16,3%
56,2%
17,2%
20,2%
50,0% 60,0%40,0%30,0%20,0%

60 NatioNal HumaN DevelopmeNt RepoRt 2008 -2009
CHapteR 2
Higher
Secondary vocational
Secondary general
lower than secondary
Female
male
DIAGRAm 2.17EmployED popUlAtIon ACCoRDInG to EDUCAtIon stAnDARD In thE RURAl AREAs oF thE REpUBlIC, %
0% 10%
3,4%
48,5%
31,0%
6,4%
12,0%
59,2%
20,0%
19,5%
50% 60%40%30%20%
tABlE 2.7EmployED popUlAtIon ACCoRDInG to EDUCAtIon stAnDARD In thE RURAl AREAs oF thE REpUBlIC, %
Rt Dushanbe sogd region Khatlon region
RRs GBAo
higher & incomplete higher
secondary special
secondary general
Incomplete secondary
primary general
12,0% 43,0% 13,0% 9,0% 8,0% 13,0%
8,0% 10,0% 8,0% 8,0% 7,0% 11,0%
51,0% 33,0% 61,0% 43,0% 50,0% 58,0%
17,0% 3,0% 9,0% 25,0% 21,0% 11,0%
4,0% 1,0% 3,0% 6,0% 6,0% 1,0%
the high education standard of the population employed in the economy is the most important component of human development.
if we consider correlation of the total employed population to the education standard, the situation is as follows: employed population in Dushanbe has a higher education status than that in rural regions.
among the employed, men with higher education is 10% more than women, and with vocational – 12.3%. in rural areas this difference is less pronounced, as there are less employed than in urban regions.
employment is the highest in agriculture. this sector has the highest share of employed with secondary general education, and the least - with vocational education. Food security and industrial processing strongly depends on the potency of labour in this sector.
according to the labour Force Survey, the sectors education and Finance, Credit and insurance have a relatively higher education standard among non-productive industries. education standard of employed in non-productive and social sectors is important to provide a higher quality to economy.
thus, the system of vocational education should establish a flexible system of training, taking into account the specificity of settlement and forecasted development rate of the priority sectors of the economy of the republic.

employmeNt iN tHe coNtext oF HumaN DevelopmeNt 61
laBouR maRKet aND emploYmeNt
agriculture
industry
transportation & communication
construction
trade & communal Feeding
incomplete higher Secondary vocational Secondary general General basic primary generalHigher
DIAGRAm 2.18EmployED popUlAtIon In InDUstRIAl EConomIC sECtoR ACCoRDInG to EDUCAtIon stAnDARD, %
0% 10% 50% 60% 70% 80% 90% 100%40%30%20%
Healthcare & physical training
HcS & consumer Services
education
management
Finance, credits & insurance
incomplete higher Secondary vocational Secondary general General basic primary generalHigher
DIAGRAm 2.19EmployED popUlAtIon In non-pRoDUCtIVE sECtoRs ACCoRDInG to EDUCAtIon stAnDARD, %
0% 10% 50% 60% 70% 80% 90% 100%40%30%20%
training and rational use of qualified labour force occupy today a special place in the state education policy. it relates to essential alterations in the structure and quality of labour force. the trends outlined recently cause serious concern. Firstly, there is an outflow of qualified labour force from productive to the non-productive sphere. Secondly, there is a steady aging of the regular labour force. a great deal of youth prefers the sphere of services and trade. the perceived prestige of engineering and technical specialties has declined. thirdly, due to the growth of unemployment and a significant difference in the rates of payment inside and outside the country, the external migration of qualified, as well as unqualified labour force, is occurring. the lack of a training programme to create a highly qualified young labour force will negatively impact the economy for decades.

62 NatioNal HumaN DevelopmeNt RepoRt 2008 -2009
CHapteR 2
In sEARCh oF EDUCAtIon
Education migration
education institutions providing secondary special and higher education are mainly located in the urban areas forcing young people to migrate.
the centers of attraction are the big cities of the country – Dushanbe, Khujand, Kurgan-tube, Kulyab.
The President’s education quota in the higher educational institutions of the republic
annually more than a thousand entrants from distant regions of the Republic of tajikistan become students on the president’s quota. young people are released from entrance exams and pass by interview only. the state finances their study. after graduation they should return to their native areas as specialists. every entrant entering on preferential terms concludes a tripartite agreement. if the student will not return home after graduation and will not work according to his/her specialty, he/she should return the funds spent on his/her study to the budget of the country.
the entrants who enter higher educational institutions on the president’s quota usually choose those specialties which are in demand in their native regions. this president’s programme should promote training of specialists for work in the distant regions of the republic.
But despite of all the privileges, the statistic data shows that the “preferentials” are not in a hurry to return to their native regions to work according to their specialties. thus, shortage of specialists is still a drastic problem. in accordance with the recent data, the shortage of teachers in rural areas has reached more than 6,000.
Migration for improvement of one’s qualifications
the most massive migration in search of improvement of one’s qualifications is among state employees and employees of local bodies of executive power. every three years, this category of employees attends skills upgrading courses. the education process is organized at the institute of improvement of Qualification of State employees of the Department of public Service of the president of the Republic of tajikistan (iiQSe). During 2004–2009 the iiQSe trained 7,619 individuals, including 2,655 employees directly in the institute, 2,371 employees outside courses, and 2,230 – as part of project implementation.
every two years, employees of the ministry of Finance attend a skills upgrading course in the training center of the ministry located in Dushanbe. During 2008-2009, 225 employees attended the training center.
teachers of the system of general secondary education of the regions attend skills upgrading courses every five years at the institute of improvement of Qualification of the ministry of education of the Republic of tajikistan.
the system of improvement of qualification of teachers of higher education is seriously lacking in the country. this stagnates the current low education standard in higher educational institutions of the country.
migration aimed at improvement of qualification should promote the quality of management decisions in the regions of the country. However, the lessons of the world financial crisis demonstrated non-preparedness of representatives in state management to preventive measures, especially in prognosis of national economy development, elaboration of mechanisms of anti-crisis management in industry; and in the education system.
DIAGRAm 2.20 EDUCAtIon mIGRAtIon FRom RURAl to URBAn AREAs oF thE REpUBlIC (thousand people)
2002
2004
2006
2008
40 42
45,6
48,4
53
44,8
50 52 54484644

employmeNt iN tHe coNtext oF HumaN DevelopmeNt 63
laBouR maRKet aND emploYmeNt
FoRmAl EmploymEnt
Problem of jobs
With transit to market relations, it is possible to choose a place of work and application of employees’ skills – in state enterprises, individual labour activity, small business, as a hired labourer in non-state sector, on the one hand. on the other hand, intensive release of labour force and increased demand for employees complicates the search for a job.
influence of the aftermath of the civil war in tajikistan made employment disproportions grow. they were caused by two groups of factors:
the 1st group – on the part of labour force:• Enormousnumberofgraduatesofsecondarygeneral
schools do not acquire necessary skills and knowledge. • Educationprogrammesinsecondaryandhigher
education are not quite adequate to social and economic demands of the republic’s development.
• Manyindustriesexperienceurgentneedinemployeeswith special professional skills.
the 2nd group – technical characteristics of the available and newly created jobs which require a specialist with definite skills (vocational, secondary special or higher) appropriate to a particular working place.
tension on the regional labour markets of the Republic of tajikistan testifies to drastic disbalance caused by the increased supply of the labour force and the lack of
possibility for the unemployed to be employed. at the same time, disbalance may be based on inefficient use of fixed production assets as well as insufficient regulation and management on different industrial and territorial levels. analysis shows that today’s demand for labour force by enterprises is reducing along with growth of its supply on the labour market in tajikistan.
Re-creation of jobs. the importance of the problem is determined by several factors. Firstly, the economically active population will grow significantly in the coming years due to the increase of the able-bodied population. it is necessary to create additional jobs for all entering able-bodied age to avoid high youth unemployment. Secondly, due to very low investment activity of enterprises industrial devices are aging in the overwhelming majority of industrial branches for the last 10 years; in the nearest future, they will start to intensively withdraw, reducing jobs. it is necessary to recreate a system of functioning jobs within 5-7 years; this will require attraction of significant financial and material resources.
Re-creating the system of functioning jobs is pressing, first of all, for all big and medium businesses in traditional branches and industries where the overwhelming part requiring reconstruction is concentrated. under the conditions of growth of investment activity for the previous two years, there are prerequisites that with the active support of the state, big and, partially, medium businesses can solve the problem of re-creation of jobs. Concerning creation of additional jobs, this issue lies mainly with small and medium businesses, taking into consideration
2.2 lEVEls AnD spECIFICIty oF EmploymEnt
Republic of tajikistan
Dushanbe sogd region Khatlon region
RRs GBAo
higher 12,4% 42,6% 12,6% 9,3% 8,0% 13,4%
secondary special 15,4% 20,4% 14,1% 16,0% 14,7% 16,8%
secondary general 50,5% 32,9% 61,3% 43,2% 50,3% 57,5%
lower than secondary 21,7% 4,1% 12,0% 31,5% 27,0% 12,3%
tABlE 2.8REGIonAl DIstRIBUtIon oF EDUCAtIon stAnDARD oF EmployED popUlAtIon oF thE REpUBlIC oF tAJIKIstAn, %

64 NatioNal HumaN DevelopmeNt RepoRt 2008 -2009
CHapteR 2
the long-term tendency of reduced employment in these enterprises. State support and stimulation of small and medium businesses in creation of jobs is extremely important.
Creating additional jobs is an extremely complicated issue. the recession has released many from the labour force and has decrease demand for additional labour.
Currently the republic should annually create between 100,000 and 150,000 new jobs (under condition of preservation and development of available jobs). the declared demand for employees is 10-15% of the required level.
thus, macroeconomic policy and reformation of labour force institutions should include all economic, judicial, social and psychological factors directly influencing employment.
Payment and income
payment is an important aspect of employment. the level of payment in tajikistan both causes, and is an effect of, the deteriorating quality of the labour force. the share of pay-roll fund in GDp decreased from 58.2% in 1991 to 10.1% in 2002. there is a tendency of increment of the pay-roll funds share which reached 10.9%31 in 2008. Nevertheless, the cost of labour is very low.
Despite of significant annual increment of nominal pay-roll, the real payment growth is minor due to the high growth rate of consumer costs. thus, the nominal pay-roll index increased by 7.1 times from 2002 to 2008, while the real payment index increased by 3.2 times and consumer costs by 1.1. average payment in the country in 2008 was $67.5.32
in 2008, the minimal monthly payment remained in agriculture (71 Somonis) where half of the hired labourers work, and maximum is in the sphere of communication (849 Somonis) and crediting (1,068 Somonis) which include 0.8% and 1.2% of hired labourers, respectively.
the real minimal cost of consumer goods basket in tajikistan by the end of 2007 was more than 300 Somonis per one adult family member (calculated by the normative method). the average payment of 82.2% of total hired labourers did not exceed 300 Somonis and did not cover even minimal consumer goods basket of a working family member, not to mention his/her dependents.
the payment level of working women is far behind of that of working men almost by half. lately, a tendency of slight reduction of gender disbalance in payment is seen. the level of payment of women compared to that of men increased insignificantly from 52.5% to 61.3% during 2001-2008.
Significant differentiation in average monthly payment exists between regions. average monthly payment in Dushanbe exceeded this index as a whole in the country by more than 2 times in 2008, while in GBao and Khatlon region the average monthly payment constituted two-thirds of the average index in the country. Note: the population in these regions comprises 40% of the total population.
today regulation of balance is managed through the system of job placement, consisting of:
employment centers of all levels (with database on jobs);
programme of employment promotion of the Republic of tajikistan for 2008-2009 (approved by the Regulation of the Government of the Republic of tajikistan dated 30 December, 2007 №632);
concept on creation and preservation of working places in the Republic of tajikistan for 2008-2015 (approved by the Regulation of the Government of the Republic of tajikistan dated 5 march, 2008 № 74);
State concept of reforming of the system of primary vocational education (approved by the Regulation of the Government of the Republic of tajikistan dated 1 october, 2004 №387;
principal programmes of enterprises providing for retraining of employees.

employmeNt iN tHe coNtext oF HumaN DevelopmeNt 65
laBouR maRKet aND emploYmeNt
the state takes steps on phased increment of minimal payment, though it can not cover the cost of the minimal consumer goods basket. thus, the minimal payment of 60 Somonis established in July 2008 is 5 times less than the cost of the minimal consumer basket calculated by the normative method.
the law of the Republic of tajikistan “on the cost of living”33 was adopted in June 2009. the law establishes the level of the cost of living for determination of minimal levels of payment and other remunerations. However, the law does not stipulate the frequency of estimation of the level of the cost of living in order to bring different remunerations to conformity. thus, according to article 7 “the level of the cost of living, the rules of establishment and frequency of revision are determined by the Government of the Republic of tajikistan”, and article 8 reads that “approximation of the minimal social and labour guarantees in the Republic of tajikistan to the level of the cost of living is established in a phased manner in consideration of the economic situation in the Republic of tajikistan”. Such wording can leave the problem of inadequacy of payment and social guarantees on the cost of living without proper settlement for an indefinite period.
However, only 47% of total population is hired labourers; the rest are self-employed as individual entrepreneurs or farmers or without judicial registration (informal sector). the income of this group is unknown; individual entrepreneurs and farmers have fixed monthly payment for the patent while the informal incomes are evaluated only during random household surveys.
in conditions of excess labour, the tax policy of the government hampers the development of labour-intensive enterprises. employer pays 25% tax of the payment fund. thus, the labour force becomes an expensive resource for the employer.
EMPLOYMENT SEcTORAL STRUcTURE
Sectoral employment is also an important issue for tajikistan. the growth of agrarian populations and the establishment of an agrarian employment structure may promote decreased labour productivity in the national scale, restrict industrial innovation and suppress living standard.
tABlE 2.9 AVERAGE monthly pAymEnts oF hIRED lABoURERs In thE REGIons oF thE REpUBlIC oF tAJIKIstAn In 2008
Regions Average monthly payment, somonis Ratio to republican level, %
total in Rt 231,5 100,0
GBAo 167,7 72,4
sogd region 167,1 72,2
Khatlon region 152,3 65,8
Dushanbe 490,2 211,7
Regions of republican subordunation 224,1 96,8

66 NatioNal HumaN DevelopmeNt RepoRt 2008 -2009
CHapteR 2
more than half of tajikistan’s employed population is in the agrarian sector. Development of personal subsidiary plots (pSp), peasant farms (pF) and the state policy on distribution of 75,000 hectares of land for these plots and farms promotes the growth of the employed population in rural areas. the second significant employment sector is the service industry.
labour force employment is not only economic, but a social task which should maximally balance demand and supply on the labour market.
DIAGRAm 2.21EmploymEnt sECtoRAl stRUCtURE In 1991
industry
construction
agriculture
transport
trade
Healthcare
education
other sectors
0% 10%
44,7%
13%
4,7%
5,0%
5,0%
10,0%
9,0%
7,5%
50%40%30%20%
industry
construction
agriculture
transport & communication
trade & services
Healthcare
education
Housing & communal services
management authorities
DIAGRAm 2.2234
EmploymEnt sECtoRAl stRUCtURE oF thE EConomy oF tAJIKIstAn In 2008
0% 10%
55,0%
6,0%
3,0%
9,0%
3,0%
5,0%
3,0%
4,0%
12,0%
50% 60%40%30%20%
tABlE 2.10lABoUR FoRCE DEmAnD AnD sUpply on thE lABoUR mARKEt (thoUsAnD pEoplE)35
2002 2003 2004 2005 2006 2007 2008
Unemployed, people looking for job, registered in Employment Center 89,8 98,3 81,0 72,4 62,5 60,5 53,3
With unemployment status, total 46,7 42,9 38,8 43,6 46,6 51,7 43,6
Including: women 25,7 23,2 21,9 23,8 25,3 28,3 23,3
youth aged 15 – 29 29,2 28,8 24,9 25,5 22,7 26,9 23,1
Demand for employers declared by enterprises 10,7 16,3 21,8 15,7 16,3 15,5 14,0

employmeNt iN tHe coNtext oF HumaN DevelopmeNt 67
laBouR maRKet aND emploYmeNt
the ratio of demand and supply for specialists is influenced by different factors which cause significant fluctuations of demand and supply.
DEmAnD AnD sUpply FoR spECIAlIsts In DIFFEREnt sECtoRs oF EConomy
Agriculture is the main sector of employment of population in the republic where fluctuations of demand and supply are sometimes significant.
some industrial sectors. Dynamics of the ratio demand-supply for specialists shows that the education system does not meet the demand for employers in industrial sector of economy.
Education is one of the main sectors which establish the education standard of labour force in the republic.
DIAGRAm 2.23DEmAnD AnD sUpply FoR spECIAlIsts (agriculture)
2004
2005
2006
2008
Supply (graduates)
Demand (enterprises)
0 200
339
1916
833
554
1397
802
385
593
1000 18001200 2000800 1600600 1400400
DIAGRAm 2.24DEmAnD AnD sUpply FoR spECIAlIsts In somE InDUstRIAl sECtoRs oF EConomy
2004
2005
2006
2008
Supply for industry and transport
Demand for industry, transport and communications
0 1000
1208
1211
3650
2080
3925
5516
1656
3451
5000 6000400030002000
2004
2005
2006
2007
Supply (graduates)
Demand (institutions)
DIAGRAm 2.25DEmAnD AnD sUpply FoR spECIAlIsts In EDUCAtIon
0 1000
7418
8127
3690
9859
4906
6236
8953
4210
5000 90006000 100004000 80003000 70002000

68 NatioNal HumaN DevelopmeNt RepoRt 2008 -2009
CHapteR 2
Despite the fact that education system trains a significant number of qualified specialists, many do not find jobs on the real labour market, as demand is much less than the supply. the system of training pedagogical staff by the higher educational institutions should be noted as an example: while the annual increment of graduates with pedagogical background is growing, there is lack of qualified teachers in the regions. as a result, this deteriorates the quality of education.
to solve the problem of optimal ratio of demand and supply for specialists for the labour market, the state education policy should be redirected to training of specialists for the economy based on knowledge.
today, while the growth of workload for doctors and teachers is significant; the payment is the lowest in these sectors. these are the positions typically filled by women. today in tajikistan employment on technological specialties declined sharply. it is primarily reflected in the increasing share of employment in agriculture and reducing their share in industrial sectors. moreover, after tajikistan gained independence a sharp drop in employment took place in industrial sector in particular covering industries related to scientific and technological progress.
the total employed in agriculture is increasing, while those employed in industrial sector – is decreasing. moreover, after gaining independence, the industry experienced a drastic drop of employment in sectors related to scientific and technical progress.
EColoGy AnD EmploymEnt
tajikistan has a fragile ecosystem, a factor influencing employment in agrarian sector. Factors such as climate, water quantity and quality, availability of land, and natural disasters influence the sustainability of agriculture and employment. For the last 55 years, the forest area in tajikistan decreased by 5 times and more than 50000 hectares of irrigated land was lost for cultivation. Considering that the average labour-intensiveness of one hectare is 5 to 20 people, this resulted in a job loss estimated between 250,000 and one million.
Soil degradation has always been an issue in tajikistan. However, the importance of this issue revealed itself in the last decade. a significant part of agricultural land in tajikistan (70%) is at the altitudes of 800 to 2500 meters above sea level. of the total area, 14.6% is land with 10-20 degree slopes. Reverse
tABlE 2.11 tEnDEnCIEs In EDUCAtIon AnD hEAlth sECtoRs36
year 1991 1998 2001 2005 2006 2007
EDUCAtIonteachers in secondary schools, in thousands 99,1 94,9 100,2 98,9 99,9 99,4
total women in total number of teachers, in % 37 43 46 50 52 53
payment, somonis 295 6,44 17,25 75,41 102,11 140,79
number of secondary schools 3229 3560 3695 3804 3830 3810
students in secondary schools, thousands 1325,4 1451,3 1579,5 1682,0 1688,4 1692,1
teacher’s load, number of students per one teacher 13,4 15,29 15,8 17,0 16,9 17,0
hEAlthCARE
total doctors of all specializations, thousands 14,4 12,6 17,25 13,3 13,3 13,4
total female doctors, in % 46 37 38 38 39 39
payment, somonis 271 3,06 8,85 40,87 56,0 77,13
number of medical institutions, units 2749 3091 3196 3218 3223 3231
provision of population with doctors, per 10,000 people 25,5 20,6 21,0 19,2 18,8 18,6

employmeNt iN tHe coNtext oF HumaN DevelopmeNt 69
laBouR maRKet aND emploYmeNt
migration to mountain areas and cultivation of slopes with steepness exceeding 10 degrees promote active soil erosion. Currently, there is no integrated evaluation of land, especially from the point of view of erosion processes. Based on research carried out by the institute of edaphology of the tajik academy of agricultural Sciences, the area of agricultural lands exposed to desertification reached 3.03 million hectares in 1990 and those exposed to erosion – 2.65 million hectares. During the last decade the area of agricultural lands exposed to desertification grew to 4.33 million hectares or more than by 1.3 million hectares compared to 1990.
according to the National report of the Republic of tajikistan on desertification control, pasture occupies 3.52 million hectares of the territory and is one of the main components of agricultural activity of the country. pastures are exposed to excessive exploitation while the period of their natural rehabilitation is much longer than the period of their exploitation. While, according to statistical data, less of the population keep cattle now; nevertheless, even this quantity exceeds the level of potential of the used pastures.
Currently 89%, 97% and 87 % of pastures are exposed to erosion in summer, winter, and spring-autumn, respectively, or desertification. as a result, their productivity has reduced by almost 50% for the last 20 years. around 3 million hectares of pastures have been susceptible to degradation. Due to its extremely severe climate, the pamirs region, which occupies 45% of total area, is especially vulnerable. more than 95% of agricultural land on the pamirs is pastures (773,000 hectares). according to the National report of the Republic of tajikistan on desertification control, some territories lose to 4,300,000m2 of soil annually due to excessive pasturing and bush cutting.
presently, the most vulnerable populations unintentionally engage in the degradation of the environment. Due to lack of migration options, their unauthorized settlement results in water and land pollution (with domestic waste and sewage water); cutting of scarce forests resources for fuel; and eroding mountain slopes, thereby increasing mud flows and washing away fertile soil stratum. Bogging of land in the republic (especially in Sogd and Khatlon regions) due to elevation of underground water has led to the deterioration of soil and, ultimately, to population resettlement. Hundreds of farms in different localities are exposed to constant or periodic inundations.
one of the primary reasons of population migration from agricultural areas is the unsatisfactory state of agricultural land, leading to fertility deterioration. Due to lack of available labour, inadequate agro-technical measures, as well as other organizational and economic measure, the fertile soil layer is being destroyed and the content of humus is decreasing. annually, 20,000 to 70,000 hectares of irrigated land is not fully used as a result of intensification of bushing and weeding processes.
in tajikistan, like in other developing countries, people strongly depend on natural resources for provision of such basic needs like income, food, energy, water and dwelling.
environmental resources including fish, timber, forest and nature by-products are the direct source of income and other material property.
Gathering of medicinal herbs, including those registered in “the Red Book” of the republic, tourism and poaching on the protected territories of tajikistan, are sources of income for the local population involved in this specific sector of informal economy.
at the same time, the social and economic situation developed in the republic in the recent years and internal migration produced negative effect on the state of biodiversity. the accent of anthropogenic pressure biased from economically developed flat regions to mountain territories where nature became the only source of survival of population.
pollution of water and soil negatively reflects on people’s health, especially younger generation as future workers.
the results of surveys carried out from 2006 to 2007 in mountain regions of the republic – GBao and regions of Karategin zone - the population deliberately understates quantity of cattle (from 10 to 50% and more) in order to pay less for using pastures.

70 NatioNal HumaN DevelopmeNt RepoRt 2008 -2009
CHapteR 2
the prevalence of natural disasters is the most convincing proof of the consequences of biodiversity loss and land degradation. Due to its geological pattern, tajikistan is particularly susceptible to floods, land slides and erosion.
Natural disasters causing accidents among at-risk population has increased over the last years. Floods, mud flows, land slides and avalanches take place every year destroying roads, bridges, dams, constructions and equipment. in the uplands, there are many glacial lakes and lakes formed due to rock block-ups of small rivers; they threaten to breach and flood areas down stream.
Natural disasters lead to the loss of natural resources, subsequently, to the loss of income of the population.
migration related to environment and consequent problems of employment becomes the main concern of the Government. the Government of the Republic of tajikistan determined 700 families which require immediate resettlement due environment-related factors, 10,037 families are potential ecologic migrants that will be resettled during the next five years.36
2000
2001
2002
2003
2004
2005
2006
2007
2008
Floods Hard frosts epizooties
Droughts mud flows and avalanches
Heavy showers epidemics
land slides
DIAGRAm 2.26EmERGEnCy sItUAtIons’ DAmAGEs In 2000–2008 (thousand somonis)
0 50000,00 200000,00150000,00100000,00
intensive cutting of eurotia (ceratoides) in murgab region of tajikistan led to serious consequences both for biodiversity and for local population which migrates due to deterioration of ecological situation. this also influences negatively the stability of employment related to use of natural resources.
Deforestation, cultivation and excessive pasturing of slopes, open excavation of mineral resources and road-building aggravate instability of mountain territories, i.e. worsen conditions for agricultural employment and employment in informal economy. Slopes and valleys of Ghissar, Karategin, vakhsh, Darvaz, vanch, yazgulem and peter i, as well as murgab river basin near Sarez lake, are the regions most prone to land slides, mud flows and floods. anthropogenic influence is the sharpest in Ghissar-Zerafshan zone where pasturing, agriculture and industry (mining, in particular) took their tribute on the fragile slopes.
Asian Development Bank. Ecological profile of Tajikistan, 2002

employmeNt iN tHe coNtext oF HumaN DevelopmeNt 71
laBouR maRKet aND emploYmeNt
Such employment sources related to irrigated agriculture, especially for cotton, the use of outdated non-saving water technologies of irrigation also produced negative influence on the state of land and soil resources in the republic, their pollution and salinization, and an increase of number of natural disasters. in this connection, advanced methods of culture and retreat from cotton, as the main strategic culture of the country, transit to boghara agriculture, diversification of agriculture, development of proper marketing and increase of general potential of farmers and people involved in agriculture including state bodies and private sector can promote improvement of the land and water quality used in agriculture, and creation of new sources of employment.
often population settlement without consideration of ecological capacity has led to environmental degradation and depletion of resources needed for life activity.
the influence of old polluting enterprises (particularly 22 tail ponds and dumps) on the country’s ecology, the population’s living conditions, working capacity and employment, is alarming.
Burial places of excavation waste products requires urgent preventive measures to reduce their danger to populations and the environment, as well as to mitigate the issues associated with those living in the impacted communities. this will create conditions for ecological employment, as well as improving the ecological situation.
Due to inundation of territories under the Rogoon HepS storage reservoir population of 10 kishlaks from only one jamoat Sicharog Rogoon town total 229 families and more than 1600 people will be resettled. 121 family will be resettled to tursunzade region and the rest – to Rudaki regions and mountain kishlaks of their native region.

72 NatioNal HumaN DevelopmeNt RepoRt 2008 -2009
CHapteR 2
DEFInItIons AnD pRoBlEms oF EVAlUAtIon
the notions of “informal employment” and “employment in informal sector” are not identical. in informal employment the lack of legally registered working relations is the criterion for identification. the criterion of determination of units of the informal sector in tajikistan and, consequently, employment in this sphere, is the lack of state registration as a legal person.
informal employment is the form of employment which exists like a reserve. the better the situation on the labour market and the more vacancies, the less people revert to the informal sector and private enterprises. However, during crisis and a decrease in formal employment, there is an increase in the informal sector.
informal employment depresses living standards and grows unemployment. Development of the informal employment is one of the elements of market self-regulation. However, informal employment creates a set of social problems and conditions for criminalization of society. there are no social guarantees, no control over working conditions or quality of goods and services. Further, the state receives significantly less funds due to income hidden from taxation.
2.3. EmploymEnt In InFoRmAl sECtoR
informal employment is officially not registered but legally authorized working activity which supposes lack of legal registration of working relations or self-employment. Notions “informal economy” and “informal employment” are accepted as basic definitions of economic activity taking place beyond acting legal norms, i.e. non-registered and without fiscal accounting.
in 1993 on the 15th international conference of labour statisticians an international statistical determination of “employment in informal sector” was adopted. it was based on general characteristic of production units (or enterprises) where any type of activity is taking place. Standard determination “employment in informal sector” includes those people who were employed, at least, in one of enterprises of informal sector. enterprises of informal sector are enterprises owned by private persons or households which are not separate legal organizations independent of their owners and do not have full accounting which could let them establish financial separation of productive activity of the enterprise from other types of activities of their owners. From the point of view of employment sizes of such enterprises are small (for international accounting “not less than five persons” have been recommended) and they are not registered according to the national legislation.
Such enterprises are involved in non-agricultural activity, and street vendors and home labourers are examples of workers of the informal sector enterprises.
Measurement of informal employment. Part 1. 2007 The World Bank Group.UNECE

employmeNt iN tHe coNtext oF HumaN DevelopmeNt 73
laBouR maRKet aND emploYmeNt
according to the labour Force Survey (lFS) in 2004 the share of employed in informal sector of the country was 53.3% (1,308,300 people) of total employed.38
our expert evaluations show that in 2008 the share of those employed in the informal sector diminished and reached 47.4% (1,029,200 people) of total employed. Compared to 2004, the share employed in the informal sector diminished by 5.9% (279,100 people), which is seen to be related to the implementation of the state policy to create additional jobs (for the last five years 360,00039 jobs were created) and the growth of external migration.
in 2004, the share of those employed in the informal market out of the economically active population was 61.3%; in 2008, this ratio was 46.4%. Such a significant reduction is a result of the creation of additional jobs and involvement of economically active population in working relations. the share of those employed in the informal sector in relation to the economically non-active population in 2004 was 79%, in 2008 this figure reached 49.1%, however the reason of such drastic drop is the quantitative increase of the economically non-active population itself. Compared to 2004, the economically non-active population grew by 439,100 people in 2008.
the same situation is seen at comparison of the share of employed in informal sector to the able-bodied population (men aged 15-62 and women aged 15-57) which in 2004 was 34.9% and in 2008 reduced to 24.1%. the reason of reduction is the stable growth of population in able-bodied age. thus, for the period 2004-2008 able-bodied population increased by 514,500 people.
the composition of informal sector in tajikistan is the following:
• Personsinvolvedinentrepreneuractivitywithout legal registration or on private basis, irrespective of availability of state registration as private entrepreneur;
• Personsworkingindekhkan(peasant)farmswhich are not registered as legal persons;
• Personsworkingforawagefornaturalpersons and private entrepreneurs;
• Personsworkinginhouseholds(personalsubsidiary plot);
• Assistingfamilymembersworkingonleasedland producing agricultural productsa.
Кudusov D. Survey of labour market in Tajikistan.
Draft document. Dushanbe 2009, 86 p.
the structure of informal employment:
• Informalsector–stableorirregularpaidhired labour activity on an enterprise or in organization based on oral agreement;
• Ininformalsector–stableorirregularpaidnon-hired labour activity (self-employment, private entrepreneur) without patent, license or registration, as well as hired not at enterprises (organizations), hired by natural persons based on oral agreement;
• Inhouseholdsector–stableorirregularnon-payable labour activity on production of products for sale in a household.41

74 NatioNal HumaN DevelopmeNt RepoRt 2008 -2009
CHapteR 2
tABlE 2.12shARE oF EmployED In InFoRmAl sECtoR to totAl popUlAtIon, ABlE-BoDIED popUlAtIon AnD EConomICAlly ACtIVE popUlAtIon (thoUsAnD pEoplE)40
title 2004 2005 2006 2007 2008
total employed population 2089,5 2111,7 2137 2149,7 2168,0
Able-bodied population 3739,6 3842,2 3984,5 4121,3 4254,1
Economically active population 2132 2154 2185 2201 2216,7
Economically non-active population 1654 1739 1862 2009 2093,1
Quantity of hired labour 1056,3 1065,5 1082,9 1065,7 1053,9
Quantity of non-hired labour 1033,2 1046,2 1054,1 1084,0 1114,1
Unemployed 42 42 48 51 43,6
Employed in informal sector 1308,3 966,5 981,8 1013,3 1029,2
share of employed in informal sector of total employed 53,3% 45,7% 45,9% 47,1% 47,4%
today employment in the informal sector is the main source of basic or additional income, a mode of involvement in working relations, a possibility to avoid the risk of unemployment and poverty for a certain part of population. at this stage of social and economic development such working relations are inevitable.
Selective research of the national labour force and households gives the following picture of informal employment in tajikistan:
• Thelevelofinformalemploymentisveryhighandconsists mainly of “individual” workers involved in small agricultural production, persons involved on family farms and commercial enterprises who do not receive payment, as well as persons involved in private small business on non-agricultural family enterprises;
• Apartofable-agedpopulationemployedintheofficialsector of economy forced to work in the informal sector in order to receive additional income;
• Paymentinofficialemploymentcomprisesonlyonethird of total income of households. the rest comes from informal agrarian activity, money orders from labour migrants and some state subsidies;
• Highlevelofchildlabourduringagriculturalhighnegatively influences human development;
• Existinginequalityinreceivingproperqualificationbetween some particular categories of able-bodied population leads to discrimination in payment and inability of that part of population to adapt to labour market.
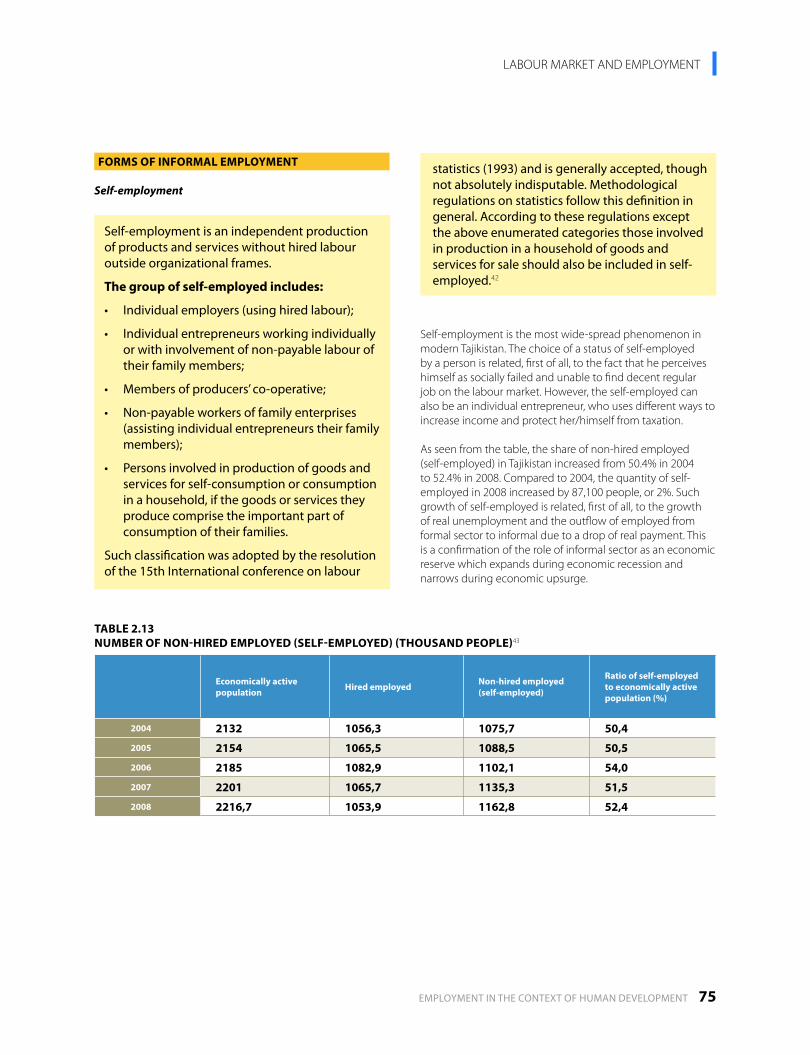
employmeNt iN tHe coNtext oF HumaN DevelopmeNt 75
laBouR maRKet aND emploYmeNt
FoRms oF InFoRmAl EmploymEnt
Self-employment
Self-employment is the most wide-spread phenomenon in modern tajikistan. the choice of a status of self-employed by a person is related, first of all, to the fact that he perceives himself as socially failed and unable to find decent regular job on the labour market. However, the self-employed can also be an individual entrepreneur, who uses different ways to increase income and protect her/himself from taxation.
as seen from the table, the share of non-hired employed (self-employed) in tajikistan increased from 50.4% in 2004 to 52.4% in 2008. Compared to 2004, the quantity of self-employed in 2008 increased by 87,100 people, or 2%. Such growth of self-employed is related, first of all, to the growth of real unemployment and the outflow of employed from formal sector to informal due to a drop of real payment. this is a confirmation of the role of informal sector as an economic reserve which expands during economic recession and narrows during economic upsurge.
Self-employment is an independent production of products and services without hired labour outside organizational frames.
the group of self-employed includes:
• Individualemployers(usinghiredlabour);
• Individualentrepreneursworkingindividuallyor with involvement of non-payable labour of their family members;
• Membersofproducers’co-operative;
• Non-payableworkersoffamilyenterprises(assisting individual entrepreneurs their family members);
• Personsinvolvedinproductionofgoodsandservices for self-consumption or consumption in a household, if the goods or services they produce comprise the important part of consumption of their families.
Such classification was adopted by the resolution of the 15th international conference on labour
tABlE 2.13nUmBER oF non-hIRED EmployED (sElF-EmployED) (thoUsAnD pEoplE)43
Economically active population hired employed non-hired employed
(self-employed)
Ratio of self-employed to economically active population (%)
2004 2132 1056,3 1075,7 50,4
2005 2154 1065,5 1088,5 50,5
2006 2185 1082,9 1102,1 54,0
2007 2201 1065,7 1135,3 51,5
2008 2216,7 1053,9 1162,8 52,4
statistics (1993) and is generally accepted, though not absolutely indisputable. methodological regulations on statistics follow this definition in general. according to these regulations except the above enumerated categories those involved in production in a household of goods and services for sale should also be included in self-employed.42

76 NatioNal HumaN DevelopmeNt RepoRt 2008 -2009
CHapteR 2
positive employment in the informal sector gives a chance to acquire necessary skills and experience in increasing income and access social benefits (education, health, provision of pensions, etc.) which are basic for human development.
the informal sector is an incubator of individual entrepreneurs ensuring access to the market and adaptability to existing barriers. When entry to small business is prohibited by burdensome administrative barriers, employment in the informal sector allows evasion at minimal cost. informal employment, as it opens access to new professions and allows the acquisition to acquire new skills relatively “cheaply”, is an important mechanism of social, labour and professional mobility.
Stimulation of individual entrepreneurship can be an alternative to reducing employment in informal sector. in 2007, the number of involved in individual entrepreneurship reached 117,000 people. out of them 69.4% were involved in trade and public catering, 18.9% in consumer services, and the rest (28.7%) in other types of activity. according to expert evaluation the number of involved in individual entrepreneurship in 2008 reached 125,000 people.
Shuttle trade migration
this type of migration as a form of informal employment allows implementation of labour activity avoiding expenditures on resettlement of the whole family.
Big regions as trade centers of the republic have proper infrastructure for organization of wholesale trade. For example, wholesale market “Korvon” is the biggest market in Dushanbe today, where goods are delivered from neighbouring countries. “Shuttlers” from different regions of the republic, mainly southern, arrive in “Korvon” to buy goods. this market is mainly orientated towards inner consumers. For the last several years the image of “shuttlers” changed. they order necessary goods, own micro-buses for delivery of goods to southern regions of the republic.
in the north of tajikistan functions one of the largest markets of Central asia – istarafshan. traders from the neighbouring regions of Ferghana valley orientate on this market. During winter this part of the country is cut from the south. only with the beginning of summer “shuttlers” from Dushanbe and Khatlon region go to istarafshan for purchasing. Full-scale
functioning of the arterial road, linking southern and northern regions of the republic will, undoubtedly, promote shuttle migration and increase delivery of goods to southern regions from Sogd, decreasing consumer goods prices. Big cities of the republic Dushanbe and Khujand are the biggest trade centers of the republic. these cities concentrate a great deal of population, potential consumers. Due to proximity to these centers rural population delivers agricultural products there. this ensures their employment and income, which, undoubtedly, promotes the living standard of rural population.
«Mardikor-markets»
internal labour migration flows form and the so-called informal labour market – “mardikor-markets” in the capital and regional centers of the republic. in farsi “mardikor” means “male job”. mardikors are usually called those who are hired for day-labour or piecework temporary job.
Such markets function mainly in big cities of the republic – Dushanbe and Khujand. Surveys showed that in search of temporary jobs, people come here mainly from neighbouring regions (e.g., in Dushanbe from nearby regions – varzob, Rudaki, vakhdat).
migrants find job, usually, in unqualified labour, therefore, their own professional skills are gradually lost. usually, a working day of a migrant on such market is unlimited and relates to the fulfillment of defined amount of the work. Despite the hardest working conditions, migrants prefer to avoid conclusion of official contracts of employment preferring to work illegally and risk being cheated (non-payment of promised amounts is very typical). Neither migrants, nor employers are interested in legalizing working relations.
primarily, it is the rural population at mardikor-markets. the main reason is the unfavourable labour markets (compared to cities). High growth of labour resources, rural overpopulation and insufficient development of labour market outside agriculture lead many to search for jobs outside their permanent places of residence. the predominance of rural population on mardikor-markets testifies to the acuteness of the problem of employment in rural settlements and small towns.

employmeNt iN tHe coNtext oF HumaN DevelopmeNt 77
laBouR maRKet aND emploYmeNt
according to the research data carried out by the institute of Demography of the academy of Sciences of the Republic of tajikistan in 2000-2008, there is a new segment of informal labour market in the country: the informal female labour market. the number of women in this labour market is around 1-2% of those total informally employed; this number will grow according to forecast of the institute of Demography. the phenomenon of informal female “mardikor-market” is higher in rural areas of the country. temporary jobs on “mardikor-markets” are a definite prerequisite for involvement of population in the flows of external labour migration. on internal markets people gain definite migrant experience and later undertake more distant trips. the present working practice on “mardikor-markets” cannot be considered a serious alternative to external migration. However, the tendency of returning of external migrants taking place during the last several years obviously increases the possibility of the growth in mardikors’.
Child labour
Child labour is one of the most acute problems in the republic. Despite measures on stimulation of state policy in the field of prevention of child labour, there has been limited success.
low living standard, unemployment among adult population and cheapness of child labour are the main reasons of extension of child labour in the country. Child labour generated by poverty inflicts irretrievable damage to younger generation.
InsERtIon 8“mARDIKoR-mARKEt” In DUshAnBE
one of the spontaneous “mardikor-markets” in Dushanbe is located in the outskirts of the city by the road to Giprozem market. every day, unskilled labourers (mardikors) gather here looking for job. every day, 50 to 100 people are collected there. they are of different ages, from young boys to men over 40. as a rule they have working clothes and necessary instruments with them. employers are different. they are rather well-off people and “ordinary” people in need of small repairs and construction job to be done. Well-off population is usually in need of assistance with monotonous physical labour tasks, while “ordinary” people to a larger extent are in need of small repairs of water and energy supply systems and maintenance of living quarters and buildings. as soon as a car approaches a group of mardikors, they run out into the road offering their services to a potential employer. mardikors are internally organized in groups of 2-5 people. “What do you need to do? Hire me! i’ll do everything cheaply!” these are the words one will hear everybody saying when approaching a crowd of unskilled labourers.

78 NatioNal HumaN DevelopmeNt RepoRt 2008 -2009
CHapteR 2
the research carried out in the country showed that children understand the significance of study in their life. approximately 95% believed that children should study, not work. 15% of the questioned children were illiterate and. could neither read, nor write. this phenomenon is a positive factor in reducing the use of child labour in the republic. However, 30% of these children do not study and 11% attend school only up to 4 days a week.
the overwhelming majority of children receive money, but a part of them work in a family business with their parents and do not receive payment; rather, they work for growth of the family income.
this research showed how working children managed their income. according to the poll, 65% of children provide their money for the family budget, which is primarily spent to purchase food; 20% is used to purchase clothes and school articles, 12% is used to for personal needs, 3% is used to purchase additional education services.
thE CURREnt FInAnCIAl AnD EConomIC shoCKs CAn lEAD to spREAD oF ChIlD lABoUR
the current financial and economic shocks can lead to spread of child labour, in particular, tin the growth of working girls , - reads the report of the international labour organization (ilo) devoted to the World day of control of child labour celebrated on 12 June.
the report informs that at present around 100 million girls are forced to work and around 53 million of them are engaged in dangerous types of work. “often girls are forcibly involved in prostitution, they are sold like slaves”, - marks the report. ilo experts underline that involvement of children in labour consolidates a vicious circle of hardships. it leads to extension of poverty. Working children can not attend school. moreover, they endanger their health. illiterate and with weak health they cannot escape poverty.
according to ilo, around 250 million children around the globe work. “they work on farms, plantations and mines, - says the document. many of them work with chemicals and pesticides; children also operate equipments of high danger. children are often involved in armed conflicts.” lately, says the report, the international community showed progress in the liquidation of child labour, though ilo fears that the current crisis can turn these achievements backwards. “Shortage of resources may lead to the situation when governments and poor families will refuse to allocate resources for education of children and in such situation girls will be the first to suffer, - underlines the report. they can become easy money for criminals engaged in child trafficking and for employers who use cheap labour force in “hard times”. it should be reminded that the convention of international labour organization measures on eradication of the worst forms of child labour № 182, prohibits involvement of children under 18 to work that harms their health and moral or psychological state. Such work includes activity on dangerous commercial enterprises, for example, in mining industry as well as compulsion to prostitution, pornography and drugs trade. Work at high or low temperatures and work which supposes usage of dangerous chemicals is also included in this list.
Digest №25 (756) 18.6.2009
InsERtIon 9soCIAl AnD DEmoGRAphIC poRtRAIts oF WoRKInG ChIlDREn44
in 2006 the Scientific and Research institute of labour and Social protection of population of the Republic of tajikistan carried out a field survey of child labour in the country. During this survey 250 children were polled, out of them 227 boys and 23 girls aged 8 to 16.
among the polled children 197 tajiks (79%) and 53 uzbeks (20%). 2 of them called themselves “arabs” (1%). they were mainly townsmen (56%) and villagers (44%). age-wise they distributed as follows: from 8 to 10 – 0.9%, from 11 to 13 - 35%, from 14 to 16 - 56%. the greater part represented families with many children consisting of: 11 people - 2%, 10 people - 6%, 9 people - 5%, 8 people - 12%, 7 people - 22%, 6 people - 23%, 5 people - 3%, 4 people - 10%, 3 people - 9%, 2 people - 4%. among the questioned children 64% were from complete families, and 36% were children from incomplete families. 85% of questioned children live in the parents’ houses, 42% in apartments, and 15% do not have dwellings and live on the market’s territory.

employmeNt iN tHe coNtext oF HumaN DevelopmeNt 79
laBouR maRKet aND emploYmeNt
almost half of the children, according to the poll, are involved in hard non-attractive labour. Children know nothing of their rights. the majority is subject to insult and need legal protection.
Child labour is most spread in Kurgan-tube (40%), while in Khorog child labour is not widely spread (8%). Children from incomplete families and/or families with many children typically work, as well as children whose parents are jobless, and they receive a very low payment. parent of the majority of the polled children (85%) do not reject children’s input into the family budget and prefer a daily flow of money over school attendance.
Children work knowing nothing about acting legislation on labour, the regulation of establishment of normal working hours, provision of rest breaks, safety measures of labour, norms of labour load, etc. the working children, even in the public catering sphere, do not undergo full medical examinations.
the research of child labour in the country showed that there is a need to conduct deeper research into this area, and elaboration on measures to limit and gradually eradicate child labour in the country.
accepting the importance of international cooperation in the field of child labour problems, the Republic of tajikistan ratified two Conventions of the international labour organization in the field of child labour: ilo Convention №182 “on eradication of the worst forms of child labour” (ratified on 8.06.2005) and ilo Convention №138 “on minimal age for employment” (ratified on 26.10.1993).
today, the Government has taken measures to resolve the child labour issue through making changes/additions in the existing legislation of the Republic of tajikistan, adopting new laws and identifying mechanisms for their realization.

80 NatioNal HumaN DevelopmeNt RepoRt 2008 -2009
CHapteR 3
CHapteR 3
uNemploYmeNt
aND emploYmeNt
employmeNt iN tHe coNtext oF HumaN DevelopmeNt 81
uNemploYmeNt aND emploYmeNt
3

82 NatioNal HumaN DevelopmeNt RepoRt 2008 -2009
CHapteR 3
pRoBlEms oF EVAlUAtIon
official evaluation of unemployment is based on an index of the economically active population taking into consideration the number of unemployed registered on the labour market. according to this methodology the level of unemployment in tajikistan has remained at 2.0% over a sustained period, the lowest in the CiS. it is lower than in Russia (2.6%),45 Kyrgyzstan (2.9%), ukraine (3.6%), armenia (9.0%) and total unemployment in the CiS (2.6%) .
it is even stated to be lower the level of unemployment in developed countries. on average, the level of unemployment in oeCD (organization of economic Cooperation and Development) countries is 6.5%. Concerning its particular members, the level of unemployment in uSa is 5.1%, France – 10.0%, Japan – 4.4%, Sweden – 5.9%, poland – 15.6%, Slovakia – 15.8%,46 etc.
Definite and unequivocal evaluation of real unemployment does not exist in the country. according to official statistics, only 2.8% of able-bodied population registered in employment services are considered to be unemployed. Calculations according to the ilo methodology provide the following picture: open unemployment: 4.3%; latent unemployment: 5.1%; temporary employment: 11.9%; disillusioned in search of work: 16.7%; incomplete employment: 19.5% and the rest: 21.3%. thus, the level of real unemployment is 35-40% of total able-bodied population (500,000-650,000).47
For analytical purposes, the data of official statistics on the real level of unemployment in tajikistan causes distrust. it is impossible to determine the number of unemployed based on the data on their registration on labour exchanges for the following reasons: а) labour exchanges in tajikistan are still at the initial stage of their development and still do not turn into the determining element of the national labour market;b) an extremely low level of payment is a serious obstacle for application to a labour exchange for registration;c) an extremely low level of unemployment benefits does not stimulate such registration.
While the population grew by 13.4% from 2002 to 2008 and the average annual growth of total employed grew by 16.7%, the level of unemployment did not change and reached only 2.2% (+/- 0.1%–0.2 % per year during this period). However, according to the result of the labour Force Survey in tajikistan carried out by the State Committee on Statistics of the Republic of tajikistan in 2004 (lRS-2004), the level of unemployment reached 7.4% of total economically active population and the total number of unemployed was 196,000.
typEs oF EmploymEnt
labour resources increased by 35.2% from 2000 to 2008, the number of economically active population by 23.5% and economically non-active population by 50.4%.48 For the last three years, the situation did not change.
in 2004 there were 196,000 unemployed in the republic, 7.4% of the total economically active population.49 at the same time, the number of officially registered unemployed in 2008 was 52,000 people. at this, the growth of the employed falls behind the growth of labour resources by more than 5 times. the level of employment in the formal sector of economy diminished by 2.5% and reached 52.8% against 55.3% of the same period in 2005. the structure of the unemployed according to education standard shows, that the part of the population without a professional background is more susceptible to unemployment. thus, among the total unemployed around 75% do not have professional education, 48.7% have complete secondary education, 18.4% have general basic and 7.4%50 - primary. So, the growth of number of jobs in formal economy will not cover the natural growth of able-bodied population. the research shows that not all unemployed apply to employment services.
the basic peculiarity of the labour market of tajikistan is the high level of latent unemployment, which, on the one hand, is a reserve of expansion of production, and, on the other hand, can become an essential factor of destabilization of social relations at deterioration of the current state of the market.
3.1. UnEmploymEnt AnD Its typEs

employmeNt iN tHe coNtext oF HumaN DevelopmeNt 83
uNemploYmeNt aND emploYmeNt
latent unemployment is a partial employment when due to the halt of production, a part of employed have to be on leave, or work part-time. according to lFS-2004, the level of latent unemployment reached 10.6% of total economically active population, out of them, men (10.2%), and women (11.3%). the level of latent unemployment in urban areas was 20.5%, while in rural areas, it was 7.2%.
in 2007, some groups that experienced difficulties in search of work and could not equally compete on the labour market received assistance from local executive bodies who located 1,331 jobs for them. the bodies of the agency on social protection, employment of population and migration provided 520 regular jobs for the unemployed
tABlE 3.1lEVEl oF UnEmploymEnt ACCoRDInG to oFFICIAl stAtIstICs
2002 2003 2004 2005 2006 2007 2008 2009
total population for beginning of year, thousand people 6375,5 6506,5 6640,0 6780,4 6920,3 7063,8 7215,7 7373,8
Average annual number of employed, thousand people 1829 1857 1885 2090 2112 2137 2150 -
total unemployed registered officially in employment services, end of year, thousand people
43 47 43 39 44 47 52 44
level of unemployment, % 2,3% 2,5% 2,4% 2,0% 2,0% 2,2% 2,3% 2,2%
InsERtIon 10Is thE nUmBER oF UnEmployED REDUCInG?
according to all available sources, more than 88,000 of new jobs were created during the first half of the year. this comprises 59% of the planned by “the programme of promotion to employment of population of Rt in 2008-2009”. according to the minister of labour and social protection of population Shukurjon Zukhurov this is 35,000 jobs more compared to the same period of 2008. During this period 385 of vacancy fairs were organized and 34,400 people were employed. “many people found job on these fairs, however not all liked conditions, payment, in particular, etc, - said the minister. and they returned to the ranks of unemployed.” During the reported period 44,600 unemployed have been registered in employment bodies, - said Sh.Zukhurov.
Mavjuda Khasanova, AsiaPlus № 30(497) dated 29 July, 2009.

84 NatioNal HumaN DevelopmeNt RepoRt 2008 -2009
CHapteR 3
Financial assistance of unemployed in the country is provided as follows:
• PaymentofunemploymentbenefitsfromSocialInsuranceFund;
• Paymentofadditionalbenefitsbylocalexecutivebodies;
• Financialassistanceonburialofanunemployedpersonwhohad unemployment status and received unemployment benefits;
the unemployment benefit margin is determined by the bodies of the state service on employment of population and depends on different factor:
• Unemployedreceiveunemploymentbenefitequalto50%of the average payment at the last working place. if they worked not less than 12 calendar days during the last 12 months;
• Unemployedwhoworkedlessthan12calendardaysduring the last 12 months and ex-servicemen receive unemployment benefit equal to the minimal payment;
• Ifunemployedhavedisableddependentsunder15,local majlises of people’s deputies can take a decision to provide additional payment - 10% per each dependent to unemployment benefits from the funds of the local budget;
• Citizenslookingforjobinitially,whodidnotworkforalong period (more than 1 year), finished their professional training, raised the level of his/her skills and re-training in educational institutions directed there by the bodies of the state services on employment of population, who took part in paid public job and dismissed due to violation of the labour legislation and working discipline, do not have right to unemployment benefit.51
During professional training, increasing qualifications and re-training of unemployed who had worked not less than 12 calendar weeks during the last 12 months (directed there by the bodies of the state services on employment of population), received stipend equal to the unemployment benefit due.
citizens looking for a job initially, who did not work for a long period (more than 1 year) and in need of professional training, increasing qualification and re-training, received the stipend equal to the minimal payment.52
AGE, GEnDER AnD tERRItoRIAl ComposItIon oF UnEmployED
age unemployment analysis shows that there are essential differences in separate age groups. the ratio of men to women among unemployed is 51.9% (101,600) and 48.1% (94,300), respectively. unemployment level is high among youth. 62.7% of unemployed do not have working experience.
unfortunately, the greater part of the unemployed are the population at the productive age (20-29 and 30-39), equally male and female.
these age categories graduated in the 1990s when possibilities of acquiring vocational education diminished sharply. thus, this and succeeding generations are characterized by low qualification competitiveness on the labour market compared with the older generations who were educated during the Soviet period.
With the current level of the youth’s professional education, the labour force qualification will lower in the coming 20 years. Generations who finished secondary school before the 1990s will be pensioned off and the higher growth rate of able-bodied population will outstrip professional training capacity.

employmeNt iN tHe coNtext oF HumaN DevelopmeNt 85
uNemploYmeNt aND emploYmeNt
tABlE 3.2GEnDER AnD AGE UnEmploymEnt stRUCtURE
total under 20 20-24 25-29 30-34 35-39 40-44 45-49 50-54 55-59 60-75
pEoplEtotal 195952 46303 37058 34373 19656 21565 13936 11652 8515 2294 602
men 101604 23030 23434 18004 8593 8608 6256 6638 4848 1591 602
Women 94349 23273 13624 16368 11063 12957 7680 5014 3667 703 -
pERCEntAGEtotal 100,0 23,6 18,9 17,5 10,0 11,0 7,1 5,9 4,3 1,2 0,3
men 100,0 22,7 23,1 17,7 8,5 8,5 6,2 6,5 4,8 1,6 0,6
Women 100,0 24,7 14,4 17,3 11,7 13,7 8,1 5,3 3,9 0,7 -
DIAGRAm 3.1AGE GRoUps AnD GEnDER UnEmploymEnt stRUCtURE53
0
5
10
15
20
25
3024,7
14,417,3
11,713,7
8,1
5,33,9
0,7 0
under 20 20-24 25-29 30-34
men Women
35-39 40-44 45-49 50-54 55-59 60-750,61,6
4,86,56,2
8,58,5
17,7
23,1
22,7
Female unemployment drastically diminishes after the age of 20 due to the increase of reproductive duties in the family (birth of children and their upbringing). as half of women are not involved in hired labour, they prefer to leave the labour market devoting themselves to their households or to the officially unregistered business.
it should also be pointed out that regionally registered unemployment varies by territory – it is higher in Dushanbe, Khatlon and Sogd regions (the survey results prove that the level of registered unemployed is higher in cities in particular), though the rural population (where the level of latent and seasonal unemployment is much higher) comprises more than 73% of the total population.
this could be justified by the distrust of rural population to official bodies of employment as well as the low level (compared to cities) of services of employment bodies.

86 NatioNal HumaN DevelopmeNt RepoRt 2008 -2009
CHapteR 3
tABlE 3.3GEnDER AnD AGE REGIonAl UnEmploymEnt stRUCtURE (people)
total Under 20
20-24 25-29 30-34 35-39 40-44 45-49 50-54 55-59 60-75
pEoplEtotal 195952 46303 37058 34373 19656 21565 13936 11652 8515 2294 602
Dushanbe 45876 6909 12576 6944 5094 5224 4121 2729 1688 319 271
sogd 38271 14682 6948 5936 2077 2367 1754 2289 1814 405
Khatlon 62747 14402 10236 12166 6419 8711 4228 3145 2603 535 302
RRs 31435 7317 4556 5208 3863 3065 2332 2277 1866 951
GBAo 17623 2993 2741 4118 2203 2198 1501 1213 543 83 29
pERCEntAGEtotal 100,0 23,6 18,9 17,5 10,0 11,0 7,1 5,9 4,3 1,2 0,3
Dushanbe 100,0 15,1 27,4 15,1 11,1 11,4 9,0 5,9 3,7 0,7 0,6
sogd 100,0 38,4 18,2 15,5 5,4 6,2 4,6 6,0 4,7 1,1
Khatlon 100,0 23,0 16,3 19,4 10,2 13,9 6,7 5,0 4,1 0,9 0,5
RRs 100,0 23,3 14,5 16,6 12,3 9,8 7,4 7,2 5,9 3,0
GBAo 100,0 17,0 15,6 23,4 12,5 12,5 8,5 6,9 3,1 0,5 0,2
at the same time, territorially unemployment prevails in ages groups from 15 to 39.
youth unemployment is a big problem for tajikistan. the share of youth aged 15-29 unemployment equals 27,200 people (51.9%). the share of youth aged 15-29 in the total and registered unemployment keeps at a relatively high level, reaching 60-65% and the level of unemployed economically active youth aged 15-29 is 9-11%. the average age of unemployed is 29.6.
the survey of social composition of youth aged 15-29 showed that youth under 18 who applied to the bodies of employment services generally did not have neither profession, nor specialty. Since there are no vacancies for this category of population, the problem of its employment grows into the problem of professional training.
the number of officially unemployed in GBao is 7,150, in Sogd region (17,059), in Khatlon region (17,274), in the Regions of the Republican Subordination (8,974) and
in Dushanbe (1,980). During this period 12,629 people (including 5,604 women) were provided with regular jobs out of 60,505 citizens who applied to the bodies of the agency. the status of ‘unemployed’ was granted to 20,155 individuals; unemployment benefit was granted to 1,654 people.
Job search methods vary by age group. in general, more than 68% apply to friends, relatives, acquaintances, and only 14% to the state employment services. these indices are proportional to job search methods in age groups 20-34.
the absolute majority of unemployed (134,898 people) in all age groups (except 60-75) have applied to friends, relatives and acquaintances as a main strategy to find a job. the second most popular method of application is to the state employment services – (27,418).
stagnant forms of unemployment exist, as a significant amount of the unemployed have been looking for a job for 12 months or longer.
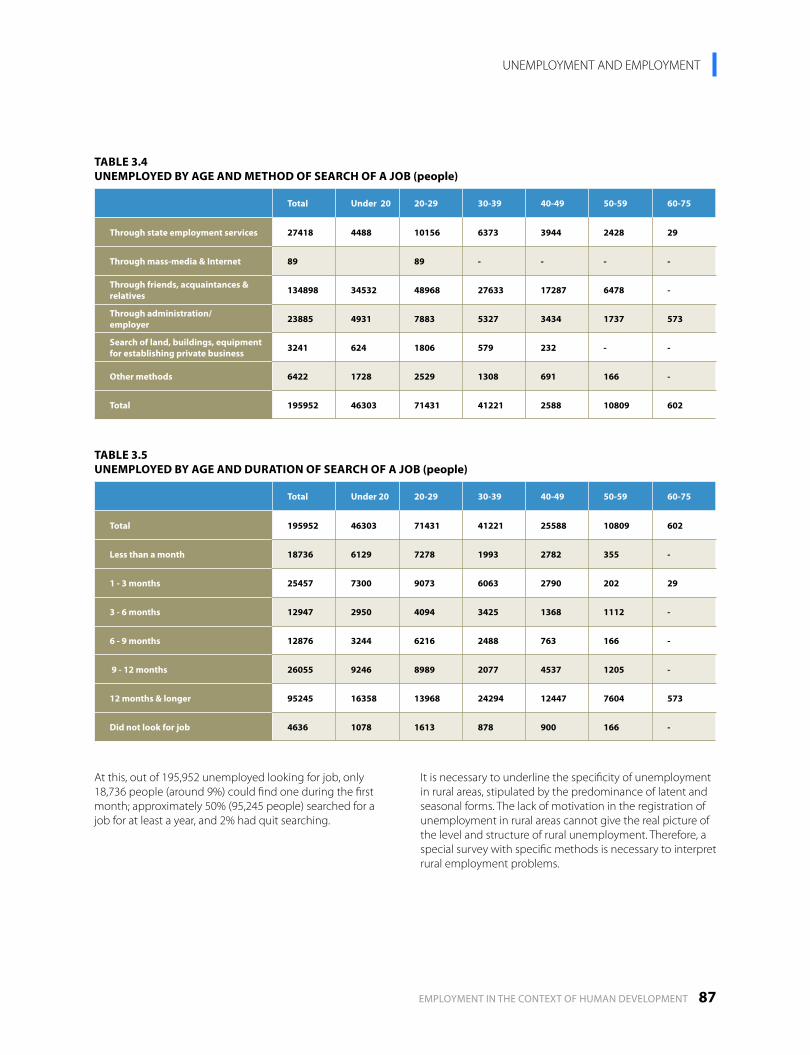
employmeNt iN tHe coNtext oF HumaN DevelopmeNt 87
uNemploYmeNt aND emploYmeNt
at this, out of 195,952 unemployed looking for job, only 18,736 people (around 9%) could find one during the first month; approximately 50% (95,245 people) searched for a job for at least a year, and 2% had quit searching.
it is necessary to underline the specificity of unemployment in rural areas, stipulated by the predominance of latent and seasonal forms. the lack of motivation in the registration of unemployment in rural areas cannot give the real picture of the level and structure of rural unemployment. therefore, a special survey with specific methods is necessary to interpret rural employment problems.
tABlE 3.4UnEmployED By AGE AnD mEthoD oF sEARCh oF A JoB (people)
total Under 20 20-29 30-39 40-49 50-59 60-75
through state employment services 27418 4488 10156 6373 3944 2428 29
through mass-media & Internet 89 89 - - - -
through friends, acquaintances & relatives 134898 34532 48968 27633 17287 6478 -
through administration/employer 23885 4931 7883 5327 3434 1737 573
search of land, buildings, equipment for establishing private business 3241 624 1806 579 232 - -
other methods 6422 1728 2529 1308 691 166 -
total 195952 46303 71431 41221 2588 10809 602
tABlE 3.5UnEmployED By AGE AnD DURAtIon oF sEARCh oF A JoB (people)
total Under 20 20-29 30-39 40-49 50-59 60-75
total 195952 46303 71431 41221 25588 10809 602
less than a month 18736 6129 7278 1993 2782 355 -
1 - 3 months 25457 7300 9073 6063 2790 202 29
3 - 6 months 12947 2950 4094 3425 1368 1112 -
6 - 9 months 12876 3244 6216 2488 763 166 -
9 - 12 months 26055 9246 8989 2077 4537 1205 -
12 months & longer 95245 16358 13968 24294 12447 7604 573
Did not look for job 4636 1078 1613 878 900 166 -

88 NatioNal HumaN DevelopmeNt RepoRt 2008 -2009
CHapteR 3
EDUCAtIon stAnDARD oF UnEmployED
3.2. EDUCAtIon AnD UnEmploymEnt
InsERtIon 11UnEmploymEnt AnD thE pRoBlEm oF InItIAl EmploymEnt (GRADUAtEs oF EDUCAtIonAl InstItUtIons)
in general unemployment registered by the national employment services in all ciS countries is not high: the share of registered unemployed in the total population of able-bodied age in 2004 fluctuated from 1% in azerbaijan and tajikistan to 5.3% in armenia. Statistics shows that youth comprises a large portion, if not the majority of the unemployed. in 2002, youth under 30 comprised 43% of such unemployed in azerbaijan, 28% in armenia, 26% in Kazakhstan, 37% in Kyrgyzstan, 31% in Russia, 62.6% in tajikistan (!). at this, the biggest share of unemployed among youth falls on the youngest age group. this is evidence of the greatest problems with job placement among the youngest participants of the labour market.
the structure of unemployed by education standard showed that the part of population without professional background is subject to unemployment to the greatest extent. So, out of the total unemployed 75% do not have vocational training, 48.7% of them have full secondary education, 18.4% general basic and 7.4% primary.54
the level of unemployment is one of the main factors determining the risk of getting into the ranks of unemployed. at this, the risk varies for different social and demographic groups. usually, the most vulnerable groups are those of women, youth, employees with insufficient education standard and low qualification, national minorities, disabled people. the existing situation can be followed on the national labour market.
tABlE 3.6DIstRIBUtIon oF REGIstERED UnEmployED ACCoRDInG to thE EDUCAtIon stAnDARD In thE REpUBlIC oF tAJIKIstAn (on 1 January of respective year, thousand people)55
year totalWith higher education
secondary special
secondary general
2001 43,2 1,9 5,9 28,4
2002 42,9 2,0 8,0 26,3
2003 46,7 2,1 6,5 29,3
2004 42,9 2,3 6,5 25,1
2005 38,8 2,2 4,9 11,7
2006 43,6 1,7 5,9 11,4
2007 46,5 2,1 5,9 10,9
2008 51,7 2,4 7,0 7,9
2009 43,6 2,4 7,0 6,1

employmeNt iN tHe coNtext oF HumaN DevelopmeNt 89
uNemploYmeNt aND emploYmeNt
the group of unemployed youth has its own risk. particularly, those who entered the labour market for the first time – graduates of educational institutions of different levels without professional working experience. Difficulties of job placement of such graduates are both in the education sphere and the labour one.
one of the main reasons of difficulties with job placement hide in discrepancy of speciality and qualification of graduates and the labour market needs (vacancies structure). it exhibits a discrepancy on professional specialities and a discrepancy on the level of qualification, i.e. structural unemployment.
the next reason is in the quality of educational services provided by the majority of professional institutions. Deterioration of quality of education leads to an inability of graduates to start working without preliminary additional training. employers distrust professional efficiency of young specialists but are not willing to invest funds in additional training. as a result, a peculiar ‘vicious circle’ establishes when job placement according to specialty of graduates of educational institutions (including professional) is often difficult due to lack of experience, but at the same time they can not acquire that experience because nobody does not recruit them due to lack of experience.
another reason is that there is no mechanism to assist with the job placement of graduates. the strictly regulated system of obligatory allocation of graduates that existed the soviet period has been discontinued; it has not been replaced by any other system promoting youth job placement. currently, some countries are making attempts to create such a mechanism (state orders on training specialists are introduced, training of specialists by the order of commercial structures and training of students at enterprises, etc.). in tajikistan, those graduates who studied at the expense of the state budget receive their diploma only after a three-year work-off at state enterprises or organizations.
spECIAl ConCERn CAUsEs UnEmployED yoUth UnDER 30
tABlE 3.7DynAmICs oF thE shARE oF yoUth UnDER 30 In totAl UnEmployED REGIstERED In EmploymEnt sERVICEs oF somE CIs CoUntRIEs (1992-2002)56
1992 1995 2000 2001 2002
Azerbaijan 24 50 43 43 43
Armenia - 45 30 22 28
Kazakhstan - 47 29 28 26
Kyrgyzstan - 40 40 37 37
Russia 38 36 32 32 31
tajikistan - 64 65 66 63
But as a rule, current graduates find jobs on their own or with assistance of their acquaintances and relatives. However, often these jobs do not correspond to the individual’s specialty; this essentially depreciates the received education.
Some data of the committee on statistics of ciS countries testifies to the acuteness of the problem of job placement of graduates of educational institutions. thus, according to them, in 2004 the number of unemployed registered in employment services graduates of secondary schools, vocational, secondary and higher educational institutions comprised 20% in azerbaijan, 21% in Kyrgyzstan, 10% in Russia and 2% in Kazakhstan. note: concerning the share of graduates among total unemployed (calculated on the ilo methodology), the data is available for Kazakhstan only. according to them in 2002 the reason for unemployment for 15.7% of total unemployed was “lack of work after graduation”. this reason was named by 47% of unemployed of 16-24 age group. talking about significant scale and level of unemployment in ciS countries it should be noted that the data in all the countries in the region could have higher values if not the growth of informal employment which “pulled out” employees who became unneeded on the formal labour market during economic reforms. this tendency is especially characteristic of youth employment.

90 NatioNal HumaN DevelopmeNt RepoRt 2008 -2009
CHapteR 3
less than 1 month
from 1 to3 months
from 3 to 6 months
from 6 to 9 months
from 9 to 12 months
12 months and longer
did not look for job
higher 12,5% 11,7% 7,2% 8,9% 4,1% 5,8% 15,9%
Incomplete higher 0,0% 4,9% 5,8% 0,0% 1,8% 0,4% 12,4%
secondary special 7,4% 6,4% 7,5% 9,4% 12,3% 8,4% 11,4%
primary professional 6,4% 5,2% 15,7% 8,8% 11,0% 6,5% 2,3%
secondary(complete) 50,3% 57,0% 34,9% 40,2% 44,8% 50,5% 43,4%
Basic general 5,0% 7,6% 23,2% 21,6% 20,7% 22,8% 7,0%
primary general 12,3% 4,3% 5,7% 11,1% 2,8% 5,4% 7,6%
Doesn’t have primary general 6,1% 3,0% 0,0% 0,0% 2,4% 0,2% 0,0%
total 100% 100% 100% 100% 100% 100% 100%
higher education spent less time in search of a job. it is important to point out that the search time frame is gradually growing from more to less educated groups. among the unemployed with higher education, 37% were looking for job for at least a year, while among unemployed with secondary education, 42-60% of job searchers lasted at least a year.
according to lRS 2004, out of the total unemployed youth, 70% are actively searching for a job and 30% attempted to organize a private business. only 5.5% apply to the state employment services and 7.2% applied to the labour exchange. it should be noted that every sixth unemployed individual (15.7%) actively searched for a job longer than 12 months, and every third individual (28.5%) searched for a job up to three months.58
REGIonAl EDUCAtIon stAnDARD oF UnEmployED
Statistical surveys show, that, from 2001 to 2008, there was a tendency of growth in the number of unemployed in the republic, including unemployed with higher and secondary special education. However, the system of secondary general education is an exception where the number of unemployed reduced from 26,300 people in 2002 to 6,100 people in 2009.
DIAGRAm 3.2DIstRIBUtIon oF UnEmployED ACCoRDInG to EDUCAtIon stAnDARD (thousand people)
0
10
30
40
20
2001 2002 2003 2004
Higher educationSecondary vocationalSecondary general
2005 2006 2007 2008
tABlE 3.8UnEmployED ACCoRDInG to DURAtIon oF sEARCh oF A JoB AnD EDUCAtIon stAnDARD (lFs- 2004)57
the data prove that the number of unemployed with higher and secondary special education is generally growing in the Republic of tajikistan. However, the system of secondary general education is an exception where the number of unemployed is diminishing (from 28,400 people in 2001 to 6,100 people in 2009). the situation is similar in all the regions of the republic.
the table depicts the temporal structure of unemployment in different educational groups. unemployed with incomplete

employmeNt iN tHe coNtext oF HumaN DevelopmeNt 91
uNemploYmeNt aND emploYmeNt
the same situation is in GBao. However, the GBao situation differs by the decrease in all the stages of education (with higher, secondary and secondary general). in GBao, the data shows a decrease in the number of unemployed in all the stages of education, which, compared to other regions of the republic, places it in a special position. the reduction in GBao can be explained by the fact that 10% of its total population is comprised of labour migrants. the same situation is in Khatlon and Sogd regions, and RRS: while number of unemployed with higher and secondary education is increasing, the number unemployed with secondary education is reducing. it can be assumed that labour migration is also an explanation. Dushanbe is an exception where the number of unemployed is growing on all educational levels over the entire period.
at the beginning of 2001 individuals with secondary general and incomplete secondary education comprised the majority of the unemployed, according to the education standard in the regions. However, starting from 2007, there have been drastic changes in the composition of the unemployed: there has been a significant reduction of the unemployed with general secondary education due to labour migration. However, there has been a significant increase in the share of unemployed with incomplete secondary education.
tABlE 3.9stRUCtURE oF REGIstERED UnEmployED ACCoRDInG to EDUCAtIon stAnDARD (beginning of year)
higher secondary special secondary general Incomplete secondary
Rt
GBAo
Khatlon region
sogd region
Dushanbe
RRs
2002 2002 2002 20022009 2009 2009 2009
18,6% 16,1%5,5%4,6%
9,9% 10,2%2,0%1,3%
17,7% 17,3%5,5%6,8%
23,2% 14,9%5,4%5,6%
8% 17,6%23,5%20%
32,9% 17,9%5,3%5,5%
64,4%15,4%14%61,3%
81,6%5,9%6,1%82,9%
68,5%20,3%8,7%55,4%
60,8%8,8%18,9%62,4%
47,1%40%11,8%40%
60,0%39,7%16,8%21,9%
the situation is related to deteriorating living standard, reducing households’ ability to cover children’s educational expenses. as a result, a portion of school-age children are absorbed into the spontaneous labour market.
Structural and frictional unemployment determine its natural level. these forms of unemployment can not be eliminated they are natural for a dynamically developing economy.
at this, all types of unemployment are under the influence of factors, such as territorial and sectoral employment, as well as its educational and gender aspects.
Further to this, as there is no methodology to accurately evaluate the real level of unemployment, it is difficult to efficiently implement measures on regulation of the labour market and the Strategies and Development programmes in the country.
92 NatioNal HumaN DevelopmeNt RepoRt 2008 -2009
CHapteR 4
CHapteR 4
laBouR miGRatioN
pRoFile

employmeNt iN tHe coNtext oF HumaN DevelopmeNt 93
laBouR miGRatioN pRoFile
4

94 NatioNal HumaN DevelopmeNt RepoRt 2008 -2009
CHapteR 4
migration of population (latin migratio) – means resettlement, movement. But movement and resettlement are not synonyms, though. For this reason, migration is interpreted in the narrow and broad senses of the word. in the narrow sense migration is a complete type of territorial movement concluded with the change of the place of the permanent residence, i.e. literally, the word means relocation.
territorial movement – is a broader interpretation of migration and includes other types of migration of population which either do not lead to a change of residence permit, or presume a temporary residence permit – occasional, pendulous, seasonal, educational, shuttle migrations.
migration of population – is a voluntary relocation, resettlement of population within the country from one region to another (internal migration), or resettlement from one state to another country (international migration).
labour force migration. labour force migration or migration of labour resources means migration of population for the purpose of job placement abroad or in another region of the country in personal interests.
soURCEs oF InFoRmAtIon
the Republic of tajikistan introduced registration of population “on the place of residence”. this group of movements includes migrants who changed the place of permanent residence. it is not possible at present to select the category of labour migrants from the total number of migrants. official statistics on labour migration almost lacks, especially in intra-republican movements. estimation of temporary movements usually presumes establishment of special registration that allows one to determine precisely the influence of labour migration on local labour markets.
though, undoubtedly, under the circumstances of undeveloped economy, low income of population, external and internal labour migration comprises a bigger flow compared to migration related to change of the place of residence.
it is important to evaluate the consequences both of resettlements and temporary relocations because in the end these processes change the composition and structure of labour force.

employmeNt iN tHe coNtext oF HumaN DevelopmeNt 95
laBouR miGRatioN pRoFile
IntERnAl AnD ExtERnAl mIGRAtIon oF popUlAtIon
migration related to change of the place of permanent residence and the reproduction of population, are the two components whose scale and interaction influence the dynamics of population and situation on the labout market. importance of these components in the dynamics of population of the Republic of tajikistan changed repeatedly (table 4.1).
However, during all the years at the end of the previous century and the beginning of the current century, natural growth of population was a positive value ensuring the total growth of the population of the republic. at this, migration processes related to relocation – (alteration of the place of permanent residence) – were broader in the first half of the 1990s due to disintegration of the Soviet union and political instability following the civil war.
presently, migration growth is negative and it has a tendency of further contraction. according to official statistics, the number of citizens changing their place of residence decreased from 3.2% (1991) to 0.8% (2008).60 labour motivation prevails as the main reason.
in general, the natural growth of the republic’s population exceeds the negative migration balance. the level of natural growth is particularly high in rural areas; however, during the last several years, the migration balance had a higher negative value in the rural areas, illustrating the significant levels of rural migration.
only in 1992 did external migration predominate over general migration flow. During the following years, the value of intra-republican relocations exceeded the value of external in- and outflows due to the alteration of the permanent place of residence (Diagram 4.1).61
4.1. mIGRAtIon oF popUlAtIon (REloCAtIon)
year General growth natural growth migration growth
total for the period 1991-1999
total for the period 2000- 2008
total for the period 1991-1999
total for the period 2000- 2008
total for the period 1991-1999
total for the period 2000- 2008
766,5
-50,6
817,1
1246,5
315,3
931,2
URBAn popUlAtIon
totAl popUlAtIon
RURAl popUlAtIon
-607,3
-342,2
-265,13
1373,8
291,6
1082,23
-111,4
-10,1
-101,3
1357,9
325,4
1032,5
tABlE 4.1GEnERAl, nAtURAl AnD mIGRAtIon popUlAtIon GRoWth RAtEs oF thE REpUBlIC oF tAJIKIstAn1991 - 2008 (thoUsAnD pEoplE)59

96 NatioNal HumaN DevelopmeNt RepoRt 2008 -2009
CHapteR 4
1991
1993
1995
1997
1999
2001
2003
2005
2007
2008
internal migration
external migration
DIAGRAm 4.1mIGRAtIon tURnoVER oF thE popUlAtIon oF thE REpUBlIC oF tAJIKIstAn (people)
0 20000 100000 120000800006000040000
2000
2001
2002
2003
2004
2006
2005
2007
2008
village
city
DIAGRAm 4.2IntERnAl mIGRAtIon BAlAnCE
0-8000
-4237
-5790
-5974
-4403
3925
3073
-6974
-5482
3531
4028
3213
3363
-5856
-7123
-5719
2619
1272
2241
2000 4000-2000 -1000-4000 6000-6000
IntRA-REpUBlICAn mIGRAtIon FloWs
«Village-city» migration. the main destination of internal migrants is still a city.
migration flow from village to city reflects the crisis state of the agricultural sector of the republic and the existence of disproportion between living standards in a city and a village. additional factors stipulating migration activity of rural population is traditionally a much higher growth of population compared to cities which sharpens the problem of quantitative inadequacy of labour resources to the demand.
Migration between administrative regions. there are two main directions of relocation – interregional and intraregional.
the ratio of interregional and intraregional relocations is the main characteristic of migration from the point of view of the composition of migrants, distance of their relocation, causes and consequences of migration including the influence of migration on labour markets. as a rule, relocations on relatively short distances are less sensitive to economic conditions compared to distant ones.
in general, interregional migration dominates the republic, reaching not less than 62% of the total relocations and the ratio changes slightly from year to year.62

employmeNt iN tHe coNtext oF HumaN DevelopmeNt 97
laBouR miGRatioN pRoFile
DIAGRAm 4.3pARAmEtERs oF IntERnAl mIGRAtIon In thE REpUBlIC oF tAJIKIstAn (thousand people)
Discrepancy of statistical data on the inflow in the region and the outflow from a particular region should be pointed out.
to a greater extent, it relates to the weak discipline of registration and stirring up the processes of external labour migration. Due to this, the available systems of migration data collection does not give the full objective information for the measurement of flows, description of their structure and, more so, the full analysis of cause-and-effect links. thus, there is a sharp current problem of improvement of information basis for the analysis of migration processes.
InsERtIon 12ConsEQUEnCEs oF mIGRAtIon FRom RURAl AREAs to CItIEs
the share of internal migration on arrival in cities comprises 0.7% of the total urban population of the republic (2007). in addition to the annual population inflow to cities there is significant proportion of the population in search of jobs. and the cities are not prepared to provide the entire labour force with jobs, neither they equipped to expand the system of education, health and housing and communal services. migration can aggravate the disbalance between city and village for the following two reasons:
- migrants’ services supply can aggravate the problem of city unemployment and result in the further development of the informal employment sector. Departure of educated labour force from rural areas can lead to competition on the labour market, but also a shortage of specialists in rural areas;
- creation of new jobs in a city is a more complex and expensive process.
in the total volume of internal migration, interregional dominates in all consolidated regions of the republic, namely, GBao, Khatlon region, and the RRS. only in Sogd region is interregional migration higher. Domination of interregional migration is a consequence of regional localization of movements and their implications, and the comparative closure of local labour markets.
Regions-recipients and regions-donors. the picture of internal migration is not static, volumes and directions of migration flows keep changing. But only in Dushanbe the aggregate migration balance was positive during 2000-2008.
0,00
10,00
30,00
40,00
50,00
20,00
1991 19991992 20001993 20011994 2002
left a villagearrived in a city
1995 20031996 20041997 20051998 2006 2007 2008

98 NatioNal HumaN DevelopmeNt RepoRt 2008 -2009
CHapteR 4
mAp 4.1 thE lARGEst mIGRAtIon FloWs DURInG 2000-2007
mIGRAtIon typoloGy oF thE REGIons oF thE REpUBlIC63
the regions of the Republic of tajikistan significantly differ in the character of participation in intra-republican migration. out of 65 cities and regions of the republic, only 8 regions (6 cities) obtain population during intra-republican migration process (results of 2007).
the present survey is an attempt to group the regions of the republic in order to determine “attracting” and “pushing out” population migration factors for the regions of different type, and to elaborate recommendations to regulate regional development (annex 3).
Comparing the results with such factors impacting migration processes, such as population density, the average nominal payment levels and the vicinity to relatively developed urban infrastructure showed that migration movements are based on long-term motivations related to the strive for relatively higher payments and the possibility of taking advantage of a city’s infrastructure.
the grouping showed that four out of seven regions of GBao are extremely troubled in respect to migration – cluster 5. the other three regions also require serious attention. this proves a high probability that there will be growth in tension on the future GBao local labour market.
the situation is also unfavourable in some regions of Rasht valley, Khatlon and Sogd regions. thus, the measures of the state policy in respect of theses regions should combine organized relocation of population from mountain regions with insufficient agricultural land to the regions with uncultivated agricultural land. active economic policy should include elaboration and implementation of investment programmes, provision of tax privileges and subsidies as well as development of regional social, transport and market infrastructure.

employmeNt iN tHe coNtext oF HumaN DevelopmeNt 99
laBouR miGRatioN pRoFile
InsERtIon 13ExAmplE oF REGIonAl sURVEy (KhAtlon REGIon, 2007 DAtA)64 (attachment 4)
For elaboration of complex policy for the regions of different types, establishment of interrelations between the indices of employment, migration and other social and economic ones is of big importance. calculation of correlation ratios between 11 indices characterizing the economy of the regions showed that migration balance has relatively strong links to changes in the quantity of hired workers; however, there is, though, a much weaker link of migration processes with tax revenues in the budget which may indirectly testify to the financial stability of tax payers allowing to realize the process of alteration of the place of residence. it is also necessary to take into consideration that mobility requires definite expenses: while a low level of income can push people to move to the regions with higher level of income, it can also limit migration. tax revenues depend on the total payments in the region, which relates to the level of industrial development. But, of course, it does not mean the industrial development provokes directly the alteration of the place of residence, since it is necessary to consider a set of other factors when taking a decision on relocation. Decision-making on relocation is a more complex process and assumes a more thorough weighing of economic benefits (income difference), as well as a probability of job placement, prospective income at the new place of residence, access to education, health and housing and communal services of higher quality.
mAp 4.2mIGRAtIon typoloGy oF CItIEs AnD REGIons oF thE REpUBlIC BAsED on REloCAtIons In 2007
tRRs1. varzob2. vakhdat3. Ghissar4. Djirgatol5. Noorobob6. Rasht7. Rogoon8. Rudaki9. tavildara10. tojikobod11. tursun-Zade12. Faizobod13. Shakhriinav
sogd region14. aini15. asht 16. Gafurov17. Gonchi18. Kukhistoni mastchokh19. Rasulov20. Zafarobod21. isfara22. Konibadam23. mastchokh24. pendjikent25. Spitamen26. istarafshan27. Shakhristan
Khatlon region28. Djomi29. Baldjuvon30. Bokhtar31. vakhsh32. vosse33. Dangara34. Djilikool35. Kolkhozabab36. Kubodien37. Kulob38. Kumsangir39. Khamadoni 40. muminobod41. Khisrav42. Noorek43. parkhar44. pyanj45. Sarband46. temoormalik47. Khovaling48. Khuroson49. Shaartuz50. Shuroobod51. yavan
- cluster 1
- cluster 5
- cluster 2
- cluster 6
- cluster 3
- cluster 7
- cluster 4
GBAo52. vanj53. Darvoz54. ishkashim55. murgab56. Roshtkala57. Rooshan 58. Shoognan

100 NatioNal HumaN DevelopmeNt RepoRt 2008 -2009
CHapteR 4
«REGIonAl DIsBAlAnCEs» As mIGRAtIon FACtoRs
internal migration is dependent on the income level and payment, unemployment and provision of state services.
Difference in the level of payment. as a rule, income and the level of payment are taken into consideration when someone takes a decision to change their place of residence. But, despite the GDp per capita growth rate the difference in payment levels between the regions of the republic remains at a rather high level (Diagram 4.4).66
Distribution of the regions and the cities of the republic according to the average monthly payment taken as percentage to the average republican level (table 4.2) showed that in the majority of the regions and cities (48 out of 65) the level of payment does not exceed 75% of the average republican level.
Growing cities, increasing mobility of population and promotion of specialization of industry are integral satellites of development.
the place of residence is important at all stages of development, but it is less important in a rich country, than in a poor one.
in other words, with the growth of the level of development of the country the place of residence means less for families and more for companies. it is supposed that development ensures economic benefits from the growing concentration of production and receipt of social advantages from equalizing of consumption.65
DIAGRAm 4.4pER CApItA GDp AnD thE sAlARy VARIAtIon CoEFFICIEnt FoR 2000-2007
0
0,1
0,3
0,4
0,5
0,6
0,2
0 100 200 300
per capita GDp (uS $ without ppc)
coeffi
cien
t of v
aria
tion
in
nom
inal
wag
es fr
om 5
8 di
stric
ts
of th
e re
publ
ic
400 500 600
tABlE 4.2QUAntItAtIVE DIstRIBUtIon oF thE REGIons AnD thE CItIEs oF thE REpUBlIC oF tAJIKIstAn In ACCoRDAnCE WIth thE AVERAGE monthly pAymEnts, % to thE AVERAGE REpUBlICAn lEVEl67
year
IntERVAl totAl REGIons
2001
2003
2005
2007
2008
3210
less than 50% 50-75% 76-100% more than 100%
9 6514
2910 10 6516
375 11 6512
34
34
13
14
10 65
10 65
8
7

employmeNt iN tHe coNtext oF HumaN DevelopmeNt 101
laBouR miGRatioN pRoFile
a relatively higher level of payment is in the regions with industrial enterprises and financial and credit organizations. thus, migration from rural areas to cities and, to the greater extent, to Dushanbe (the industrial and financial center), is expanding. low payment levels are not only a factor that encourages migration, but also inhibits it, as the population does not have the financial resources needed to relocate. it is essential for the regions to promote on site industrial development with higher added value and business activity for the local population.
Differences in the regional budget revenues. evaluation of correlation of internal migration parameters with the parameters of the labour market showed a relatively high interrelation between tax revenues and the type of locality.
Covering the difference between tax revenues and payments is, to a great extent, through the provision of financial support, and subventions to the regional budget from the republican budget. the rendered assistance covers, to a great extent, the current needs of the region.
DIAGRAm 4.5IntERRElAtIon BEtWEEn tAx REVEnUEs AnD popUlAtIons’ plACE oF REsIDEnCE (58 regions of the republic in 2008)68
0,4
0,5
0,7
0,8
0,9
1,0
1,1
0,6
0 20 40 60
per capita tax revenues in a region (Somonis)Correlation coefficient: r = -0,6258
Rura
l pop
ulat
ion
shar
e in
the
tota
l reg
ion’
s pop
ulat
ion
80 140100 160120 180
DIAGRAm 4.6IntERRElAtIon BEtWEEn sUBVEntIons AnD popUlAtIons’ plACE oF REsIDEnCE (58 regions of the republic, 2007)
0,4 0,5 0,6 0,7 0,8 0,9 1,0 -20
20
40
60
80 100 120 140
160 180
200 220
0
Rural population share in the total region’s populationCorrelation coefficient: r = 0,4680
per c
apita
subv
entio
ns to
a
regi
onal
bud
get (
Som
inis
)

102 NatioNal HumaN DevelopmeNt RepoRt 2008 -2009
CHapteR 4
provision of subventions from the republican budget is directed, first of all, at preventing regional budget deficit. However, as there is no methodology to objectively evaluate regional needs; therefore, distribution is not optimal, as minimal level of expenditures by region is unknown.
IntERnAl lABoUR mIGRAtIon
today there are problems with internal labour migration in the country related to the evaluation of statistics. But the process itself is taking place and exhibits in development of informal labour markets, shuttle69 and pendulous migration.
pendulous migration is related to regular (i.e. everyday) trips to the place of work. at this, pendulous migration includes more employed population than migration related to the place of residence. according to lRS-2004, pendulous migration in the part of regular trips to the place of work included 3.4% of the total employed whereas the share of internal migrants on arrival did not exceed 0.2% of the total population of the republic in 2004. pendulous migration is relatively broader expanded in Sogd and Khatlon regions of the republic. in the Sogd region, the majority of pendulous migrants travel within the territory of the region, and in the Khatlon region, migrants primarily travel outside its territory.
pendulous migration is very sensitive to transport availability to the place of work. With the growth of tariffs on transportation, violation of rhythm of work of transport system the benefits from such employment are reducing.
pendulous migration can improve employment, as the unemployed and non-active population on the labour market most likely will choose pendulous migration.
obviously, qualified workers can derive benefits from the possibility of finding a job in other regions, as an alternative to unemployment.
among the measures promoting pendulous migration, the most relevant are: decreased transportation costs, the development of road infrastructure, and improvement of efficiency of the market of transportation services which could be provided by private sector and be regulated by the state.
GBao
RRS
Sogd region
Khatlon region
Work outside their regional territory
Work on the regional territory
DIAGRAm 4.7pEnDUloUs mIGRAtIon FRom thE REGIons oF thE REpUBlIC oF tAJIKIstAn(lRs-2004, % of total employed)
0,0% 1,0%
0,8%
0,2%
1,3%
3,2%
2,2%
1,4%
3,1%
0,8%
4,0%3,0%2,0%
analysis of the scale and direction of intra-republican migration flows allows selection of the following key characteristics of the process:- essential problems with quantitative evaluation of
tendencies because the statistic data is incomplete, especially concerning internal labour migration;
- comparatively greater proportion of migrants relocate to cities. the main attraction for migrants is Dushanbe;
- interrelation of migration with the “supposedly” main factors of migration, like regional differences in the level of payment, ratio between vacancies and registered unemployed, are minor. consequently, migration decisions are linked not only with the objective to obtain higher payment or greater probability of job placement, but also with bigger possibilities of joining social and market infrastructure, which are relatively better developed in the big cities of the republic.
today, the country should mitigate the difference between urban and rural areas, between the administrative regions of the republic from the point of view of “habitat” concentrating attention at the problem of employment, and providing access to the basic social services.

employmeNt iN tHe coNtext oF HumaN DevelopmeNt 103
laBouR miGRatioN pRoFile
stAtIstIC pRoBlEm oF ExtERnAl lABoUR mIGRAtIon
understanding migration processes from the point of view of the economy, politics and labour resources is an exceptional task for tajikistan which did not face mass “relocation” in the past. the post-Soviet tajikistan provides an example of a country reliant on labour export and has the typical issues associated with this status. the civil war of 1992-93 and the following period of political instability until 1997 triggered a mass flow of involuntary migrations.
Russia was the first country to attract migrants. Despite the previous labour and education migration to Russia before (for example, job placements in Siberia’s oil industry; trade; movement of youth to the all-union construction works; study purposes, etc.), during the 1990s, migration exploded. the situation, particularly, with the tajik “gastarbeiters” became a serious catalyst of political and social tension. there is no precise registration of the quantity of external migrants from tajikistan. expert evaluations differ in the range between 0.5 to 1 million people. thus, according to a survey carried out in 2003,71 the evaluation showed that 18% of adult population of tajikistan left in search of a job during 2000-2003.
4.2. ExtERnAl mIGRAtIon oF popUlAtIon
tABlE 4.3 DIstRIBUtIon oF lABoUR mIGRAnts FRom CIs CoUntRIEs70
Country
totAl lABoUR mIGRAnts DIstRIBUtIon on CoUntRIEs oF DEpARtURE, %
Azerbaijan
Armenia
Georgia
Kazakhstan
Kyrgyzstan
tajikistan
turkmenistan
Uzbekistan
total on countries in the region
15,91365
thousands people
% of total population Russia other ciS
countriesukraine
other countries of
the world
8,8 7,970,6 12,6
27,1813 8,5 18,667,9 5,0
24,0
5,2
23,3
11,8
3710
260
1025
797
8,8
12,7
9,2
5,4
6,3
10,5
15,0
4,8
78,4
76,0
70,0
84,4
6,6
0,8
5,8
5,4
11,7
8,1
14,3
615
2186
10770
6,3
14,7
9,7
7,1
8,7
8,8
84,1
50,5
70,9
2,5
26,1
10,7
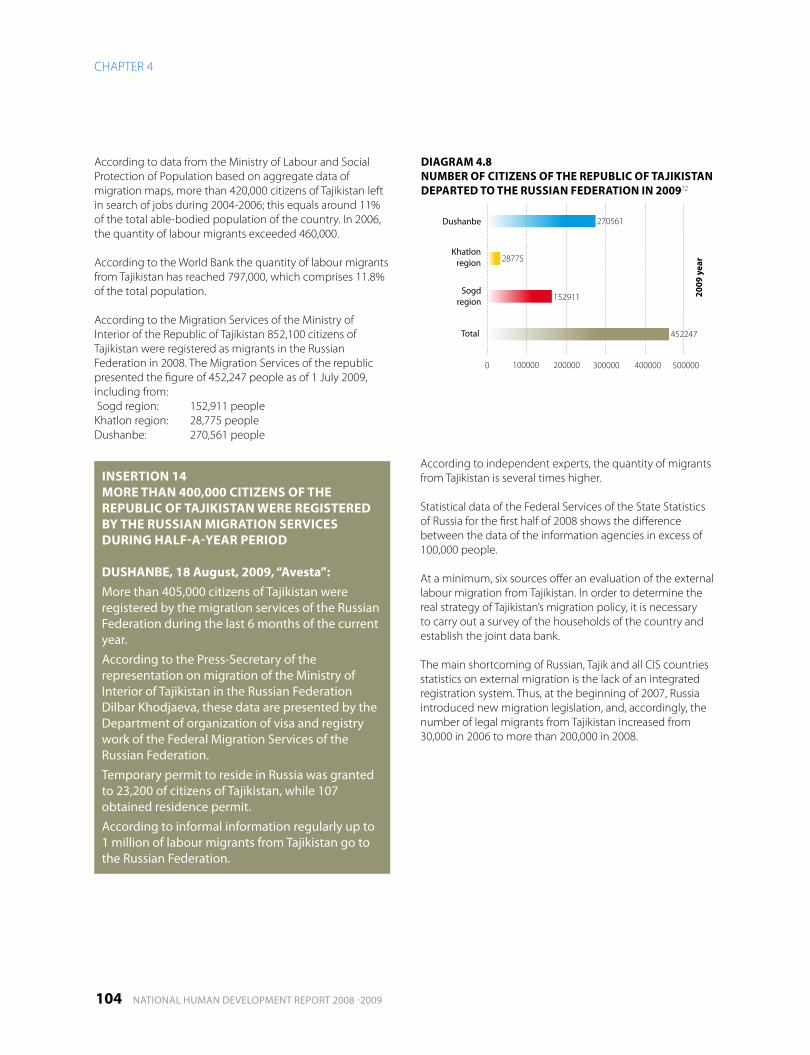
104 NatioNal HumaN DevelopmeNt RepoRt 2008 -2009
CHapteR 4
according to data from the ministry of labour and Social protection of population based on aggregate data of migration maps, more than 420,000 citizens of tajikistan left in search of jobs during 2004-2006; this equals around 11% of the total able-bodied population of the country. in 2006, the quantity of labour migrants exceeded 460,000. according to the World Bank the quantity of labour migrants from tajikistan has reached 797,000, which comprises 11.8% of the total population.
according to the migration Services of the ministry of interior of the Republic of tajikistan 852,100 citizens of tajikistan were registered as migrants in the Russian Federation in 2008. the migration Services of the republic presented the figure of 452,247 people as of 1 July 2009, including from: Sogd region: 152,911 peopleKhatlon region: 28,775 peopleDushanbe: 270,561 people
according to independent experts, the quantity of migrants from tajikistan is several times higher.
Statistical data of the Federal Services of the State Statistics of Russia for the first half of 2008 shows the difference between the data of the information agencies in excess of 100,000 people.
at a minimum, six sources offer an evaluation of the external labour migration from tajikistan. in order to determine the real strategy of tajikistan’s migration policy, it is necessary to carry out a survey of the households of the country and establish the joint data bank.
the main shortcoming of Russian, tajik and all CiS countries statistics on external migration is the lack of an integrated registration system. thus, at the beginning of 2007, Russia introduced new migration legislation, and, accordingly, the number of legal migrants from tajikistan increased from 30,000 in 2006 to more than 200,000 in 2008.
InsERtIon 14moRE thAn 400,000 CItIzEns oF thE REpUBlIC oF tAJIKIstAn WERE REGIstERED By thE RUssIAn mIGRAtIon sERVICEs DURInG hAlF-A-yEAR pERIoD
DUshAnBE, 18 August, 2009, “Avesta”: more than 405,000 citizens of tajikistan were registered by the migration services of the Russian Federation during the last 6 months of the current year. according to the press-Secretary of the representation on migration of the ministry of interior of tajikistan in the Russian Federation Dilbar Khodjaeva, these data are presented by the Department of organization of visa and registry work of the Federal migration Services of the Russian Federation. temporary permit to reside in Russia was granted to 23,200 of citizens of tajikistan, while 107 obtained residence permit. according to informal information regularly up to 1 million of labour migrants from tajikistan go to the Russian Federation.
total
2009
yea
r
Dushanbe
Sogd region
Khatlon region
DIAGRAm 4.8nUmBER oF CItIzEns oF thE REpUBlIC oF tAJIKIstAn DEpARtED to thE RUssIAn FEDERAtIon In 200972
0 100000 400000 500000300000200000
452247
152911
28775
270561

employmeNt iN tHe coNtext oF HumaN DevelopmeNt 105
laBouR miGRatioN pRoFile
Num
ber o
f lab
our
mig
rant
s
Results of S.olimov and i.Bosc survey, 2003
expert evaluation, 2005
the World Bank evaluation of the external labour migration from tajikistan, 2006
Data of the ministry of labour & Social protection of population, 2006
the author’s estimation of labour migrants in the Russian Federation, 2007
Data from the statistical collection “the countries of the eurasian economic community”, 2007
Based on the data from migration Service of Rt, 1 july 2009
DIAGRAm 4.9DIFFEREnt EVAlUAtIons oF lABoUR mIGRAtIon FRom tAJIKIstAn
0 200000 800000 1000000 1200000600000400000
according to the survey of the international organization on migration, the small open economy of the Republic of tajikistan is characterized by three types of external labour migrants:• Migrantsworkingunderofficialandunofficialcontracts
with the receiving enterprises (around 20% of the total labour migrants) during one year and longer;
• Migrantsworkinginprivateconstructionandagrariansector (around 50%). usually they work outside the country from march to November during active construction and seasonal works in the agrarian sector of Russia;
• Shuttletraders(around30%),whoarethemosteducatedamong the external labour migrants and work outside the country for a short period.
the following economic reasons are the basis of the external labour migration in the Republic of tajikistan: • Lackofsufficientquantityofjobs;• Lowlevelofincomeandpayment;• Weakprospectsinacquiringnecessaryqualification;• Weakeconomicenvironmentwhichisnotableto
adequately leverage the business potential of people, etc.
the external labour migration of the Republic of tajikistan is largely illegal, and, according to the imF, around 60% of migrants do not have professional qualifications, do not understand laws, customs and traditions of the receiving country and are not skilled in languages (particularly, Russian). as a result of their illegal status, they cannot rely on a basic set of rights.
ChARACtER oF lABoUR mIGRAtIon
the distinguishing character of the labour migration form tajikistan is its temporary, seasonal and recurring character; this has traditionally been attributed to the strong family links of tajiks.
the parameters of labour force are changing quantitatively and qualitatively. on the one hand, labourers without a specialty participate in external labour migration, entering the labour market for the first time; on the other hand, highly qualified specialists are forced to leave the country due to lack of jobs. Despite attempts to regulate migration flows, they remain uncontrollable. even the rigid migration legislation in Russia only partially leads to legalization of labour migrations.
at present, young men who just finished school, leave tajikistan for Russia in search of a job. the outflow of young men aged 17-20 is growing from year to year. this is an issue of concern.
this tendency intensified after the severe winter of 2007-2008 when, due to unusually cold weather, serious difficulties in municipal and energy economy emerged. the limited possibilities in employment and the difficult conditions of life deepened the “migration moods” of the population.

106 NatioNal HumaN DevelopmeNt RepoRt 2008 -2009
CHapteR 4
Youth aged 15-29 prevails in labour migration, its share in the total quantity of migrants reaches around 53%. middle-aged (30-49) people comprise 44.4% of the total quantity of migrants. the average age of labour migrants in 2007 was 30.6.73
ExtERnAl mIGRAtIon InFlUEnCE
Positive influence
Reduction of tension on the labour market. migration reduces tension on the labour market and is a stabilizing factor in the society. the labour market has shown a simultaneous reduction in the supply and demand, starting in 2003. the ratio demand and supply of the labour force was 1:6 in 2001; however, in 2007, it was 1:4. this shows the impact of external labour migration.
in conditions of extreme poverty, external migration provides means of survival and family financial support. migration creates possibilities for joining the culture of other countries, learning foreign languages, attaining industrial experience and new technologies, and establishing new human contacts.
preventive measures on organization of advance professional education of migrants has become pressing. provision of assistance to citizens including organization of their move for work within the republic and to other countries can become an important aspect of activity of the state structures. From mid-2008, the Government started purposeful attempts to protect the rights of the labour migrants outside the country, understanding that mass return of labour migrants could lead to unpredictable consequences. a large proportion of migrants in the Russian Federation are
employed in the construction market; however, the crisis drastically curtailed the construction boom in Russia and left many migrants jobless. the crisis showed important it is to adjust government policy to the labour markets of other countries to mitigate external shocks.
Training professional grounds. today, work on construction and industrial objects of Russia and Kazakhstan has become a “training professional ground” for the labour migrants. in a short period of time, young men acquire new professions, skills and, broaden their outlook. Worker professionalism is growing related to industrial modern technologies, and the appropriate technological and economic conditions of leading enterprises. it is very important to study the experience of the network interaction of activities of labour exchanges of different countries. Slogan “today for Russia, tomorrow for tajikistan” becomes realistic in the process of training skilled workers. Diversification of migration flows to countries where one can acquire professional skills in the sphere of human services is also becoming realistic.
expert national evaluations show that tajik migrants should start adjusting today to the labour markets not only in CiS countries, but other foreign countries. at this, the state should ensure assistance to its labour migrants.
Cash remittances. Cash remittance of labour migrants to the country of origin is the primary positive factor of external migration.
Cash remittances are becoming a very important element of economic development in countries with transit economy. Remittances of labour migrants are stable sources of hard currency inflow and have a direct influence on the economic situations of households. expert research showed that cash remittances help families survive in hard times, invest in property, get better access to education and health, as well as invest in small and medium-size businesses. Since cash remittances mainly finance consumption, their effect on poverty reduction is significant.
labour migrants’ remittances have serious institutional effect on the small open economy of the republic. they have strengthened competitiveness among banking institutions. National banks have to compete not only between themselves, but with other financial intermediaries for clients. Growing volumes of cash remittances have a beneficial effect on the development of the country’s banking system and its consolidation.
InsERtIon 15thE poRtRAIt oF A tAJIK mIGRAnt
Social and typological model of a temporary labour migrant can be characterized as follows: a man (a woman as well) aged 20 through 40 a peasant by origin with secondary education without sufficient professional qualification and ready, due to this, to accept any unqualified manual labour.

employmeNt iN tHe coNtext oF HumaN DevelopmeNt 107
laBouR miGRatioN pRoFile
expert research revealed that the main channels of cash remittances of labour migrants (85%) at present are banks. this is primarily as a result of the reduction in the bank rate from 10% to 1.5%. the results of the research showed that the banking system of tajikistan is the most reliable of transacting remittances by labour migrants.
Negative influence
The only alternative. Nowadays, external migration is the typically only alternative. the regulation of the process of external migration in the country becomes necessary, because it has an influence on the level of human development, an individual’s security and protection of one’s basic rights. the faster tajikistan moves in that direction, the quicker the society will join to the modern principles and democracy.
the preserving situation with low levels of payment and income plays a role of a stimulating migration not only for the highly qualified skilled workers who are predisposed to long-term or regular work, but also youth without any qualification. “migration fever” among youth becomes a factor of reduction of general educational standard and life span in the country.
Shortage of specialists. mass labour migration leads to the chronic shortage of specialists in the country. today, rural areas are short of watering men, shepherds, tractor drivers, etc. Construction and road-building sites have a shortage of specialists which leads to effect of replacement on the labour market when construction companies from China, india and Russia bring their specialists. in tajikistan as in other poor countries like uzbekistan, moldova, Kyrgyzstan, this phenomenon has a destructive character for labour resources, leading to total disqualification of personnel. this does not promote stable economic development and brings the problem of training of specialists to the forefront.
Alteration of a family model. labour migration promotes alteration of social and demographic situation in settlement of the country, especially in rural areas. there are settlements with very few men and women of able-bodied age. external migration promotes family development from a material point of view, but also risks destruction of the family unit. the number of children where one or both parents are labour migrants is increasing. this category of children becomes susceptible to neglect, family and non-family violence, and criminal activity.
in search for a job, and trying to earn as much money as possible, labour migrants often sacrifice on their health, food, conditions of life, and measures of safety. thus, there are cases of death of labour migrants abroad, industrial injuries, and growth and neglect of diseases. in general, external migration lowers the “health threshold” of tajik labour migrants.
Demotivation to business. the level of business initiative is still low with citizens who returned from abroad. migration, as was once expected, does not stimulate personal initiative, but demoralizes citizens to pursue individual businesses; the number of people involved in business after migration does not grow and, instead, creates a new wave of migration. this is largely due to unfavourable business conditions within the country, as well as the lack of jobs offering decent payment relevant to the ever-increasing cost of living.
Violation of rights of migrant workers. majour issues include: violation of rights of migrant workers due to poor working conditions and safety measures; no respect for basic rights and respect; a lack of integration into the receiving community. until now, these processes are not the objects of thorough research of domestic scientists and are not on the agenda for politicians and civil society institutes.
law-enforcement bodies of Russia are suspicious in respect of migrants, especially those who are tajik, illegal. according to the migration Service of tajikistan in 2007, 1,850 tajik citizens were deported from the Russian Federation. in 2008, 37,000 tajik citizens were called to administrative account for the violations of rules of staying on the territory of the Russian Federation. During the last several years 130,000 tajiks underwent administrative punishment for commission of different crimes.
While there is a stated tendency to legalize labour migrants in Russia, this has not substantively changed over the last ten years, according to the results of a survey. as a rule, illegal labour migrants live in unsanitary conditions on construction sites (for example, in basements that house entire working crews). Tajikistan should prepare for change. the period of spontaneous, chaotic migration will come to an end in the near future. Russia turns to priority selection of labour migrants: (1) – intraregional labour resources, (2) – regions of the Russian Federation, (3) – former Soviet union republics, and (4) – foreign countries. tajikistan should be ready to adjust to such changes. an analytical evaluation of future events’ variants is necessary.
108 NatioNal HumaN DevelopmeNt RepoRt 2008 -2009
CHapteR 4
Surveys carried out in the country showed, that under the influence of the world crisis, labour migrants are returning and their employment is decreasing in all the regions of tajikistan.
Surveys showed that more than 96% of migrants returned from Russia and only 1.9% from Kazakhstan. the majority of migrants returned home during the period of crisis from october 2008 to march 2009. more than 76% of migrants worked in the sphere of construction and they became the first victims of the crisis. the majority of the migrants employed in construction and lost job during crisis had the lowest qualification, including unskilled labourers (8.9%). among the returned migrants 5.8% worked in trade, 3.2% in transportation and 6% in other spheres. the same distribution is characteristic of all the regions of tajikistan. a bit more than a half of migrants (51%) worked abroad under contracts. about 70% of migrants mentioned the crisis as their reason for returning home. analytical evaluations show that return of a significant number of migrants will lead to reduction of inflow of hard currency into the country. However, when the crisis is over migrants, who returned home with a definite qualification, can become one of the main powers of future economic growth. today, the country needs to adopt special programmes and create conditions for returning labour migrants. the republic can become a leading example in solving migration issues, if the programmes of assistance to migrants are implemented purposefully.
InsERtIon 16lABoUR mIGRAnts WIll RECEIVE pEnsIons
labour migrants transferring their means through the banking system to the republic will receive pensions in the future.
“asia-plus” was informed by the chairman of the State committee on Statistics of Rt mirgand Shabozov. “the Government of the Republic of tajikistan gave a commission to the ministry of economy and trade to calculate remittances of migrants and grant pensions to them”, - he underlined. the Head of the State committee on Statistics highlighted that through working abroad and sending money home, migrants provide for their families, as well as support economic stability in the republic. “the time may come when a migrant will not be able to work, but the necessity to feed himself, and the family still exists; that is why the Government decided to grant pensions to migrants, since along with the citizens, who work inside the republic, they support our economy.”
Asia-Plus №43 (510). 28 October, 2009.

employmeNt iN tHe coNtext oF HumaN DevelopmeNt 109
laBouR miGRatioN pRoFile

110 NatioNal HumaN DevelopmeNt RepoRt 2008 -2009
CHapteR 5
CHapteR 5
iS tHe GeNDeR
iNeQualitY DeepeNiNG?
the Constitution of the Republic of tajikistan secures equality of men and women in all the spheres of life activity. according to article 17 of the Constitution “all are equal before the law and court. the State guarantees the rights and freedoms of each and every irrespective of nationality, race, sex, language, belief, political convictions, education, social and material status. men and women are equal.”
in march 2005 the law of the Republic of tajikistan “on the state guarantee of equality of men and women and equal possibilities on their realization” was adopted, which contains a direct prohibitions of discrimination of the rights of men and women 9 (art.3). the law guarantees “equal representation of men and women in legislative, executive and judicial authorities” (art.5). article 17 provides for continuous monitoring of securing equal possibilities to men and women in the social and economic spheres in order to analyze the current situation, forecasting possible changes, elaboration of measures for prevention and elimination of facts of discrimination.

employmeNt iN tHe coNtext oF HumaN DevelopmeNt 111
iS tHe GeNDeR iNeQualitY DeepeNiNG?
5

112 NatioNal HumaN DevelopmeNt RepoRt 2008 -2009
CHapteR 5
the level of economic activity of women is important, as it characterizes their preference of paid employment, on the one hand; and, on the other hand, the possibility to realize their preferences, which the labour market can provide.
Gender inequality in employment results in weak participation of women on the labour market of tajikistan. Basic income is typically provided by the man. as a result, women are in conditions of economic dependency, which increases the level of vulnerability of themselves, as well as their children.
the gender equality problem is particularly acute under the circumstances of mass labour migration of the male population. this phenomenon aggravates demographic asymmetry and increases the number of families headed by women, since labour migrants have higher divorce rates,
more often leaving their families without their economic support and establishing new families in other countries. more and more former wives of labour migrants are left with children without traditional sources of income (i.e. male earnings) which makes them go on the labour market without professional qualification, and thereby leads to growth in the level of child labour.
the consequences of such situations are fraught with additional limits for children to acquire education. they will likely be involved in unqualified labour with low payment in the future, and the cyclical nature of poverty will continue. limited possibility for household investments in human potential (education and health) is the main reason the quality of the labour force is deteriorating.
InCREAsED DomEstIC BURDEn As An oBstAClE to ImpRoVInG WomEn's EConomIC ACtIVIty
as a result of decreasing participation of the state in financing social benefits and social services (e.g. decrease of the number of state ‘free-of-charge’ child institutions, institutions for care of the aged, reduction of possibilities of the state to provide medical care at home, etc.) the burden on women is getting heavier.
this has led to the following: an increase of “double burden – work and family” placed on women; reduction of women’s spare time, and “fixation” of the role of housewives on women, thereby limiting their access to paid work.
the results of cross-sectional random study carried out by the State Statistical agency of the Republic of tajikistan in 1998 showed that women spend twice as much time on house work compared to men (44.24 and 22.17 hours per week, respectively).74 lSmS method includes in its system time spent on house work by women only. Comparison of the results in 2003 and 2007 showed that the load on women in a household is still high and comprises more than 32 hours per week. the structure of expenditure of time on house work by women changed for the last 4 years. Due to wear and tear and degradation of the housing and communal system women started spending more time on delivery of water for the family needs by 1.5 times and for cooking, cleaning and laundering by 2.5 times.
5.1 GEnDER RolEs oF mEn AnD WomEn In thE moDERn tAJIKIstAn

employmeNt iN tHe coNtext oF HumaN DevelopmeNt 113
iS tHe GeNDeR iNeQualitY DeepeNiNG?
the lSmS results show that, in general, considering paid and unpaid (house) work women work more than men. But the greater part of women’s work is unpaid. thus, men spend 56.4% of their working hours on paid activity and 43.6% on unpaid one. and women spend on paid activity 27.3% of their working time and 72.7% on unpaid one.
House chores limit women’s access to the labour market. as a result, they are unable to develop proper working record and guarantee for a decent pension; this increases their economic vulnerability and dependency on other family members.
this situation weakens women’s ability to invest in acquiring new working skills and human potential, which could be attained through education. the reduction in the percentage of girls attending school testifies to the availability of mechanism of gender inequality.
GEnDER stEREotypEs lImIt GIRls’ ChoICE In EDUCAtIon
many researchers point out that traditional gender stereotypes negatively influence girls’ access to higher education, and, to a less extent, to secondary education. Some surveys show that in the context of expansion of traditional gender stereotypes higher education is perceived as a “negative value”75 for girls. So, even in urban families, there exists a rather widespread opinion that it is more difficult for girls with higher education to get married, as there is a higher level of expectation related to family life, and they have higher level of self-worth, compared to girls with low education. this sometimes reduces parents’ motivation to invest in their daughters’ education.
many young women are inadequately prepared for employment and, as a result, they are dependent on parents or their husband’s family. this leads to low level of involvement of females in vocational education. as a result these girls are likely to remain in poverty, because as many men aged 20-45 engage in labour migration, and 30% of these marry in the country of employment. the divorce rate is very high among labour migrants. in a poll, 5,500 labour migrants, who returned in autumn 2008, 40.5%76 declared had divorced. Due to mass labour migration of men, there is a problem named the “bridegrooms’ deficit”. if married before, women have reduced their possibility to get married again. taking into consideration the current sex and age structure in the country, it is critically important to prioritize investments in girls’ education.
Continuation of children’s education is at the mercy of economic conditions. a poll of girls who recently left secondary school showed that poverty is one the most frequent reasons for not continuing education; many families cannot afford textbooks, clothes or footwear. However, when families consider cessation of a child’s education, they also consider social factors (e.g. widespread traditional stereotypes on the existential destiny of men and women). under the circumstances, direct and indirect expenditures related to education will have admittedly low efficiency, especially for those groups of girls who are perceived as workers of “the second grade”.
more than 70% of population in tajikistan lives in rural areas, where several generations live together in one complex family. in cities, it is a widely spread tradition for young families to live together with the parents of the husband. if to assume that a practice of separate residence of young families develops to a great extent, then the parents’ strategy in investment in children’s education will shift to a more gender symmetric variant like in big cities were in practice young families live separately more often. in this situation investments in daughters’ education will not be an investment in the well-being of the family of the future husband, but an investment in the well-being of the daughter’s family. Distribution of gender roles in a family is strictly fixed in public mentality on the level of local communities.

114 NatioNal HumaN DevelopmeNt RepoRt 2008 -2009
CHapteR 5
one more consequence (and, at the same time, indicator) of the expansion of traditional gender stereotypes is the practice of early marriages. according to lSSt-2007, the share of married women aged 18 was 15.5%. Cases of marriages under 18 are not rare. thus, the share of married women aged 17 comprised 4.7%, while at 16 – 0.8%. the tradition of early marriages promotes early departure of girls from the system of secondary education (not to mention the higher levels).
GEnDER stEREotypEs lImIt possIBIlItIEs oF lABoUR AnD tERRItoRIAl moBIlIty oF WomEn
under the circumstances of high birth rate and small capacity of the labour market, one of the alternatives for increasing employment is labour migration. However, the possibilities of territorial mobility are different for men and women.
a poll of 1,120 rural areas school children (both boys and girls) showed that they differently see the profits of education for women and men. For men, respondents saw economic benefits, possibility of career development and increased social status in society (e.g. good post, respect). For women, they saw benefits for the family related to improved quality of reproduction functions (e.g. children upbringing, care for sick and, secondly, economic benefits for the family. Not a single respondent mentioned benefits for women related to personal development or growth of social status.
According to survey “Girls access to education”, OSCE in Tajikistan, 2008
InsERtIon 17ACCoRDInG to sURVEy “GIRls’ ACCEss to EDUCAtIon”, osCE In tAJIKIstAn, 2008
in our kishlak, only 26% of girls and 35% of boys go to school. the parents complain that children are often sick, because it is cold at school due to lack of electricity and heating for the greater part of the school year. many children do not want to go to school themselves because several months every year they have to collect cotton instead of study.
traditions have negative influence on girls from senior classes. Nowadays, it is fashionable to marry at 14-15 years of age. Girls who have been proposed to attend school in national wedding dresses. their bridegrooms come to school and bring presents. the girls who were not asked in marriage are embarrassed to attend school. that is why girls’ attendance in senior classes has declined sharply.
the parents also believe that girls should get married as soon as possible. if she is married, she’ll stay home, therefore, there is no need to waste time on education, taking into consideration that there is plenty of house work in rural area.
Jamoat Leningrad, Khovaling, Khatlon region. Salomat Kholnazarova, teacher

employmeNt iN tHe coNtext oF HumaN DevelopmeNt 115
iS tHe GeNDeR iNeQualitY DeepeNiNG?
patriarchal stereotypes on the role of a woman as the guardian of the home create gender differences in respect of migration; migration is seen as a purely male job, not a female one. Gender difference in respect of migrants creates additional barriers for women in search of a decent payment. very often, women-migrants are exposed to condemnation from the direction of the community and family members. those around express their negative attitude to women-migrants, and also meddle with her family life, trying to “set against” her husband and members of his family (particularly, her mother-in-law). this particularly relates to women who have pursued their own job, without the knowledge or help of her husband or relatives.
Not many women allow themselves to challenge the community and pursue labour migration. the consequences of such decision are not limited by ruined relationship with their relatives and community members. in future, this action may have negative influences on their children. once they build a negative reputation in their local community, it will be difficult to find decent bridegrooms or brides for their children. thus, territorial and labour mobility of women in communities is limited by patriarchal social mechanisms that have established negative public opinion for these women who violate traditional gender roles.
WomEn-mIGRAnts tEll ABoUt mEthoDs oF thE CommUnIty on lImItAtIon oF tERRItoRIAl moBIlIty oF WomEn
“the attitude to men is better, to women – worse. most probably it relates to the opinion that a woman is the guardian of the home. But now the time has changed. people have many problems and a man alone can not solve all of them.” – woman-migrant, Shakhrinau.
“the attitude to labour migrants, men and women, is different in our makhalla. i just returned and many of my neighbours revealed their interest to what i did in Russia and with whom i went there. Did i get married there or not, why did i go there? they ask very many silly questions.” – woman-migrant, tursun-Zadeh.
“of course, there is difference. a man can do everything. He is free. a woman should safeguard the family, look after children and if she leaves, it means that she wanted freedom. they start condemning her. and if she changes her clothes, she has became bad, unfaithful to her husband, she did not go to work.” – woman-migrant, Dushanbe.
“i’m not married, i do not have children. But i’m short of money and i was forced to go to Russia. But many people condemn me. they say that it is not known what i’m doing there, etc. But this is my life and i will do with it whatever i want. and i do not feel any awkwardness. i feel fine. “ – woman-migrant, tursun-Zadeh.
According to the survey: On the status of observance of the rights of women-migrants. - ОS “Panorama”, UNIFEM, 2009

116 NatioNal HumaN DevelopmeNt RepoRt 2008 -2009
CHapteR 5
AGE AnD GEnDER ChARACtERIstICs oF EmploymEnt
Gender equality on the labour market supposes both equal access of men and women to all opportunities offered by this market and equal payment.
Gender inequality limits female opportunities for accumulation of human potential, narrows their access to resources necessary for life activity and development, and increases possibility of family violence. Society ultimately loses, due to decreases in labour productivity and potential income levels, and consumption and savings.
the gender equality policy should be directed at women’s employment, as they are more vulnerable on the labour market.
5.2. InFlUEnCE oF GEnDER InEQUAlIty on EmploymEnt AnD InComE
InsERtIon 18thE mIllEnnIUm DEVElopmEnt GoAls on GEnDER EQUAlIty In thE sphERE oF EmploymEnt
the mDG’s 3rd goal provides for incentive of men and women equality and expansion of rights and possibilities for women. one of the priority tasks aimed at reaching this goal in the Republic of tajikistan is the necessity of providing assistance to girls and women in employment though their vocational training. the principal group includes adolescent girls who quit school and unemployed women. Successful implementation of this task assumes that by 2015 the following results will be achieved:
- 30% of adolescent girls and 5% of women should be involved in these programmes;
- 20% of students of general secondary school should be provided with vocational training lacking nowadays;
- 1.5% of women should have access to micro-credits equal to $1,000.
the cost of this component of the programme on achieving gender equality presumably totals to $47.0 million.
Source: Investment in stable development: evaluation of demands for achievement of
Millennium Development Goals. Comprehensive report. – Dushanbe, 2005
DIAGRAm 5.1pRopoRtIon oF EConomICAlly ACtIVE mEn AnD WomEn In thE totAl nUmBER oF mEn AnD WomEn, 2001-200777
0,0%
5,0%
15,0%
20,0%
10,0%
2000 2001 2002 2003 2004 2005 2006 2007
men Women

employmeNt iN tHe coNtext oF HumaN DevelopmeNt 117
iS tHe GeNDeR iNeQualitY DeepeNiNG?
Significant input in the development of economic activity of women from the 1990s until 2004 contributed microfinance organizations (mFo).
the principal group of microcredit projects included women. though these projects did not involve many people, they still played a visible role in poverty reduction.
Due to the law of the Republic of tajikistan “on microfinance organizations” adopted in June 2004 the quantity of population who got access to microcredits, grew significantly.
in april 2009, the credit portfolio of the financial sector of the country reached $1,078 billion, out of which 86.7% belonged to commercial banks and 13.3% to microcredit organizations. at this, clients in the share of commercial banks comprised 69% and mFo 31%. one of the mFo tasks is assistance to vulnerable groups of population, especially women. However, the share of women among clients of these organizations is reducing.
in april 2009, 143,600 people were clients of mFo. Women comprised 34%, men - 66%. Without special obligations on gender parity women turn out to be less competitive.
Report of the Tajik Association of Microfinance Organizations (TAOMO), 2009
Without education
primary education
Secondary basic education
Secondary general education
Secondary vocational education
Higher education
DIAGRAm 5.2EDUCAtIon stAnDARD oF EConomICAlly ACtIVE popUlAtIon78
0,0% 30,0%10,0% 40,0%20,0% 50,0% 60,0%
0,7%
10,5%
24,9%
50,5%
6,4%
4,6%
0,5%
8,8%
16,9%
45,1%
15,0%
12,6%
men
Women
the level of professional education is 2.5 times less among women compared to men (11.0% versus 27.6%). the lower level of qualification makes women less competitive on the labour market.
as the labour Code of the Republic of tajikistan provides additional protection and social preferences to working women, women are perceived by employers to be a more costly labour force. as a result, employers prefer men.
as the growth rate of new jobs lags behind the growth rate of labour resources, women are pushed out of the labour market. overcoming gender stereotypes requires significant efforts from women participating in economic activity.
according to lSSt-2007, every fifth household in tajikistan is headed by a woman. Women are forced to overcome patriarchal stereotypes on gender roles in a family and society. thus, the tendency of labour migration from the point of view of gender shows that the absolute number of women involved in labour migration is growing, while the growth rate of the number of men-migrants is decreasing at a faster rate. Despite of obvious enhancement of necessity of women’s participation in economic employment, as well as the state’s efforts in involvement of girls in education process, the patriarchal public opinion keeps showing resistance to the process of promotion of education and economic status of girls and women.

118 NatioNal HumaN DevelopmeNt RepoRt 2008 -2009
CHapteR 5
population of our jamoat comprises people relocated from mountain regions (Khait and vakhje) who are strict adherents to religious ideas. a significant part of the male population is in labour migration in the cities and Russia. Strong influence of religion limits women’s possibilities in education and any initiatives in the spere of economy. Remittances from labour migrants are scarce and irregular. Food supplies come only from personal subsidiary plots. there are no other sources of income in the settlement except migrants’ remittances, because payments are very low in agriculture and it is paid with very long delays.
there is an incomplete secondary school (1-9 classes) on the territory of the settlement. During the civil war (1992-1997) girls did not go to school because it was a zone of war operations. Girls did not go to school until 2004. parents did not allow adolescent over-age girls attend school; they, who missed classes due to the war and were embarrassed to go to junior classes, because it became predominantly male. From the point of view of their religious outlook, it was unacceptable.
i was appointed director of this school in 2004. i carried out purposeful work with parents in order to attract children to school: i read lectures at the mosque where all men usually gather, and i spoke with parents. as a result, all children of school age, including girls, started attending school. i obliged all teachers to strictly follow pupils’ attendance.
teachers’ salary is very low. teachers, like all rural population, should spend a significant portion of their time on private plots to feed their families. many teachers do not like strict school discipline, because it limits their possibility to take care of their personal subsidiary plots. the school lacks teachers with diplomas. Some lessons are carried out by senior pupils
parents are also not very happy with new orders. they believe that their children spend too much time at school, and their help is needed at home and on the plot. they consider that girls should be prepared for marriage and that they do not need education. Hard work on the plot does not require education.
there is a full secondary school (1-11 classes) in the neighbouring kishlak. Some boys who finished our 9-year school continue their education there. yet, not a single girl continued her study in 10th-11th class in the neighbouring kishlak.
According to the survey “Girls’ education”, UNESCO, 2006
JAmoAt mARxIzm, BoKhtAR, KhAtlon REGIon. sADUllo RAJABoV, DIRECtoR oF thE sChool

employmeNt iN tHe coNtext oF HumaN DevelopmeNt 119
iS tHe GeNDeR iNeQualitY DeepeNiNG?
a survey among rural schoolchildren showed that one in five schoolgirls is psychologically ready to fulfill decisions of her future husband. if he will not allow her to work, there is no need to waste time and efforts on education. one out of ten schoolgirls could not answer why education is beneficial for women. among boys, one in seven considered that there was no need to waste efforts on girls’ education: anyway she will not be able to work because a husband will not allow to. and one in eight boys could not answer how girls would benefit from education. almost one in three schoolgirls feels doomed to the will of a future husband and does not see any sense in spending time, money and efforts on increasing her education status.
in the same rural settlements, young women (18-25) were asked about motivation to raising education level: 23% replied that they did not have a choice, and that her destiny is to take care of her husband and children; 27% unambiguously declared that they do not need any raise of education level; 12% would like to continue study, but the family does not allow; and 13% would like to acquire profession at some short-term vocational training course. thus, among young women with some life experience after finishing school, one in every second girl does not see sense in efforts directed at raising educational status.
According to survey “Girls’ access to education, OSCE in Tajikistan, 2008
on the other hand, the lack of visible examples of gender equality on the labour market appropriates patriarchal stereotypes on gender roles. existing gender segregation on the labour market – (majority of women work in low-paid branches and in lower positions) – makes households optimize their investment strategies in human capital; in households with limited budgets, preference is given to boys.
GEnDER sEGREGAtIon on thE lABoUR mARKEt
the legislation of the Republic of tajikistan prohibits gender discrimination. Nevertheless, the gender structure of employment testifies to the existence of gender segregation (i.e. disproportions in the distribution of men and women in branches, professions, positions, serves as indirect evidence that women face limitations at job placement on some specific jobs).
there are two types of gender segregation – horizontal and vertical. the vertical segregation takes place in the case of uneven distribution of representatives of different sexes in a positions’ hierarchy. Horizontal segregation is understood as professional and sectoral segregation (i.e. separation of men and women by professions or sectors in all spectra).
the dynamic of distribution of men and women in the sectors of economy shows that from 2000 to 2006, gender segregation increased. the share of women in agriculture, the lowest-paid sector, increased from 55.3% to 59.0%. While in such highly-paid sectors like industry and construction, the share of women decreased by more than1.5 times. a noticeable exception is the sector of state management and crediting. the number of employed increased by more than 35% during these years and the share of women in this sector of economy increased by a higher rate than the share of men. However, this sector of economy involves only 4% of total employed. the horizontal segregation index grew from 16.5% in 2000 to 18.3% in 2006. though the segregation index is relatively low, gender discrepancy increases due to the growth of employed women in low-paid sectors and growth of the share of men in highly-paid sectors of economy.

120 NatioNal HumaN DevelopmeNt RepoRt 2008 -2009
CHapteR 5
the concentration and growth of women in agriculture is a source of anxiety, as this sector has the lowest payment levels. the ability to generate stable income is tightly linked to the availability of the right to land. in reality, men own the majority of agricultural land.
the official statistic does not show the structure of employment according to sex. this makes it difficult to monitor the sate’s obligation to promote gender equality in employment. the data on the gender professional structure was collected during surveys on living standards in 1999 and 2003. the vertical segregation index in the country grew from 14.3% in 1999 to 15.7% in 2003.
the lack of regular statistical data on the professional structure of the employed does not allow monitoring patterns of changing gender inequality on the labour market. though this index is not a universal instrument for normative conclusions, regular monitoring of how this index changes will bring to the existence of the problem; further, it will allow possibility for a deeper analysis of the causes of gender inequality and may help introduce preventive measures.
more than half of working women are employed in the agricultural sector. However, only 13.4% women were the leaders of dekhkan farms. in comparison to 2004, this index has even decreased. Women are primarily hired as labourers in agriculture and undertake difficult low-paid positions.
Despite some growth in the share of women in legislative bodies of all levels, their representation is not significant enough to exert a significant influence on decision-making. according to the uN, advice representation of each sex in legislative bodies should comprise not less than 30%. By april 2005 (the last elections took place in February 2005), women comprised 11.8% deputies of majlisi milli, 17.5% deputies of majlisi namoyandagon and 15.4% deputies of oblastj, city and regional majlis of people’s deputies.
Deeper segregation is in executive authorities. Not a single woman is a minister or head of a department. Female representation as deputies is still low. During 2003-2009, the role of women on different levels of management in ministries and departments did not change, except on the level of the first deputy ministers.
there are no women among heads of regional administrations. Representation of women is also low on other levels of positional hierarchy. in 2003, women occupied one tenth high positions in urban and rural administrations; in 2009, their representation diminished to one twentieth. exceptional was the level of deputy chairmen of cities and regions where women comprised 38%. Gender inequality reduces on this level.
low or no women representation in legislative and executive authorities and other rural decision-making bodies creates additional obstacles for women’s access to resources for their involvement in employment (e.g. access to land, raw materials, equipment, and information, among other things).
InsERtIon 19mEAsUREmEnt oF GEnDER sEGREGAtIon
the most widely used measure of gender segregation on the labour market is Dunkan’s dissimilation index:D=1/2 Σ|Fi/F-mi/m|, Where Fi and mi is the number of women and men employed in the sector (profession) i, F and m is the total number of employed in economy. the index measures the degree of segregation from 0, when the labour market is characterized by the absolute lack of segregation, to 1 (or 100%), which reflects the absolutely segregated structure of employment.

employmeNt iN tHe coNtext oF HumaN DevelopmeNt 121
iS tHe GeNDeR iNeQualitY DeepeNiNG?
tABlE 5.1GEnDER stRUCtURE oF sEnIoR posItIons In mInIstRIEs AnD DEpARtmEnts oF thE REpUBlIC oF tAJIKIstAn In 2003 AnD 2009 (%)79
position
on 01.04.2003г. on 01.05.2009г.
heads
First deputies
Deputies
0100 0100
496 1288
1189 1189
men menWomen Women
position
on 01.04.2003г. on 01.05.2009г.
oblastj chairmen
oblastj deputy chairmen
Chairmen of cities and regions
First deputies chairman of cities and regions
Deputies chairman of cities and regions
0100 0100
18
9
82
91
18
5
82
95
9
34
91
66
6
38
94
62
men menWomen Women
tABlE 5.2 REpREsEntAtIon oF mEn AnD WomEn In loCAl AUthoRItIEs oF thE REpUBlIC oF tAJIKIstAn, In 2003 AnD 2009 (%)80

122 NatioNal HumaN DevelopmeNt RepoRt 2008 -2009
CHapteR 5
DUshAnBE, 17 August, 2009 – “Avesta”
“unfortunately, the education base is limping and training of staff, including women, is not at a proper level. there are no women at the level of a minister. there are women at the level of deputy ministers, some percentage is present in the parliament, but their activity is not seen. maybe the work of women members of parliament is not properly presented by the mass-media, or maybe they simply sit and do nothing. We do not have a data base on women professionalism. training of women-leaders is a secondary task.
Chairwoman of the Tajik association of women in science Mukhiba Yakubova.
“there are women among us who, according to their professionalism, are ready to head this or that ministry. the problem is that there will be a big responsibility on their shoulder, tasks which require competency. and they will need not only professionalism, but strong will, which any leader should possess. today in the republic, if a woman is entrusted a ministry, it is only in the social sector, not finance and economic, defense and law enforcement agencies. in 1999, the law of the president of the Republic of tajikistan “on promotion of the role of a woman in the society” was adopted after which there was a wave of
appointments of women at different levels. We had women ministers of education, health; however, no women led financial or economic sectors. the problem is that we do not have proper training of women in economy and finance. of course, one would like to see modern women at the level of the first persons of ministries and agencies, but in accordance with their professionalism and competency.
Head of association of women with university education Guljakhon Bobosadykova.
Some women, heads of public and non-government organizations, consider that women-leaders are available in tajikistan: however, many are in the shadow.
“among the representatives of “the weaker sex” there are personalities worthy of a minister’s portfolio. the question is whether we will be given such a chance. in the east, things have developed such that everything is managed by men. if a woman is appointed at some position, the society’s reaction is inadequate. of course, women are appointed, but at a low level. Key decisions are nevertheless made by men.Head of social association “Fund of civil initiatives”
Muazzama Burkhonova.
InsERtIon 20WomEn-lEADERs lIVE In thE shADoW In tAJIKIstAn
So, summarizing general tendencies related to gender segregation in employment, the following conclusions can be made:• Womenareconcentrationinagriculture,particularly,in
labour-intensive positions at a very low income level;• Womenwithqualificationsineducationandhealthare
impacted by low payment levels in relation to men with similar qualifications;
• Thereisaprevalenceofprofessionsrelatedtounqualifiedwork with low income among women;
• Highlevelofverticalgendersegregationinbusinessand politics, leaving limited opportunities for women in decision-making.
Developing professional capabilities limit opportunities for women to engage in economic activity.

employmeNt iN tHe coNtext oF HumaN DevelopmeNt 123
iS tHe GeNDeR iNeQualitY DeepeNiNG?
there is a need for a broader approach beyond just developing a network of state institutions to provide care for dependent family members. undoubtedly, it is necessary to invest in developing a network of kindergartens, old people’s homes, medical home-care, and the general improvement of communal services. However, significant effort is still required to overcome stereotypes with regard to gender roles, when a woman is responsible for house chores, while a man takes care of the family’s well-being. Special attention should be paid to increase women representation in decision-making bodies. this process will help change gender stereotypes on the role of a woman in society and, accordingly, counter negative reactions of local communities. Growth of female employment and payments will reduce demand for child labour and provide an opportunity for children to continue their education and acquire professional qualification.
pAymEnts GEnDER DIFFEREntIAtIon
payment equality is a necessary condition for stability, as it a woman’s opportunity to participate in the distribution of the household resources; and will protect her from contingency situations, such as the death of the main bread-winner (usually the husband), illness, job losses, long-term migration, and divorce, among other situations. the earnings of women are far behind those of men in tajikistan. in 2000, women made only 43.2% of that earned by men. By 2006, this changed slightly to 55.3%.
payment is subject to the influence of many factors of economic, social and institutional character. Current existing gaps in national gender statistics does not show to what extent payment differences are a result of differentials in human potential, hours worked, and type of job. Regardless, gender segregation in employment.
as shown below in Diagram 5.3, the highest quantity of women is in the agricultural sector of economy (52.5%), health (58.3%), education (49.3%) and culture, art and science (48.5%). in these four areas, payment is lower than the average payment in tajikistan. even in agriculture, where payment is the lowest, women still earn one-third less than men. in other sectors with low income but highly qualified staff (education, health and culture), women receive significantly less than men.
For example, in the health sector, female earnings are less than a half that earned by a male colleague. in education, science, culture and art women receive approximately three-fourths of men. in summary, given equal educational backgrounds, men obtain higher positions with higher wages.
other sector
transportation and communication
trade
construction
agriculture, forestry, fishery
industry
all sectors
HcS and consumer services
Healthcare
education
culture, science, art
State management
DIAGRAm 5.3 RAtIo oF FEmAlE to mAlE pAymEnts In sECtoRs oF EConomy, 200681
0,0% 150,0%50,0% 100,0%
17,9%
35,9%
58,3%
49,3%
48,5%
28,5%
106,9%
79,4%
49,7%
74,2%
75,4%
96,1%
46,3%
30,0%
52,5%
10,4%
34,4%
25,8%
55,3%
63,5%
68,4%
71,3%
66,3%
78,8%
Ratio of female to male payment
Women’s share

124 NatioNal HumaN DevelopmeNt RepoRt 2008 -2009
CHapteR 5
two sectors are exceptions, where the level of female earnings does not differ from that of men: the state management and crediting (96.1%) and other branches of industry (106.9%). However, these sectors involve 4.2% and 0.8% of the total employed, and the absolute quantity of women employed is very low: 28.5% and 17.9%, respectively. Significant gap between male and female payments is visible in other sectors, though female employment is minor.
Gender differentiation in earnings differs by region. as of December 2006, the average payment of men in Dushanbe was almost three times higher in Khatlon, 2,5 times higher than Sogd, nearly twice that in GBao and almost 1,5 times higher than the Regions of the Republican Subordination. and even such high levels of payment discrepancies between the capital city and the regions, the discrepancy between men and women payments in the regions is higher. Since agricultural activity does not exist in the capital city (the most labour-consuming area of employment), gender differentiation of payment is less pronounced there compared to other regions, because a significant part of economically active population is involved in agriculture. in Dushanbe, females earn 69.7% of what males earn; in Khatlon (59.9%); in Sogd (52.3%); in Gorno-Badakhshan autonomous oblastj (37.5%), and in the Regions of the Republican Subordination (51.5%).
the payment gender gap diminishes the drive for people to enter the labour market. in the age group 16-24, male payment is 2.5 times higher than females, creating higher barriers for young women to employment.83 in older age groups, the gender gap in payment diminishes, but remains at a sufficiently high level – 1.8-2.3 times.
GBao
Dushanbe
RRS
Sogd region
Khatlon region
Women
men
DIAGRAm 5.4REGIonAl stRUCtURE oF mAlE AnD FEmAlE pAymEnts In DECEmBER 2006, somonis82
0 50 250
130,41
352,77
68,49
134,62
72,86
182,6
253,03
245,85
70,46
121,6
200 400150 350100 300

employmeNt iN tHe coNtext oF HumaN DevelopmeNt 125
iS tHe GeNDeR iNeQualitY DeepeNiNG?
the measure of gender inequality by statistical indices was introduced in 1995 and coincided with the growing recognition that monitoring is an essential component of gender inequality. this was emphasized at the World Conference on Women Status in September 1995. the most well-known are the Gender-related Development index (GDi) and the Gender empowerment measure (Gem).improvement of methods of the gender equality measure is still taking place. one of the last indices of the gender equality measure (or its deficit) is the Gender Development Index (GDI).
thE GEnDER-RElAtED DEVElopmEnt InDEx (GDI)
the gender-related development index (GDi) reflects the inequalities between men and women in the following dimensions:• Alongandhealthylife,asmeasuredbylifeexpectancyat
birth;• Knowledge,asmeasuredbytheadultliteracyrateand
the combined primary, secondary and higher gross enrolment ratio;
• Adecentstandardofliving,asmeasuredbyestimatedearned income.
in other words, GDi reflects the deficit of human development caused by the gender inequality measures on which the gender-related development index (GDi) is calculated. However, GDi is not a precise measure of the gender inequality. For example, HDi and GDi for tajikistan in 2007 was 0.688 and 0.686, respectively. the gender differentiation was 0.002. the combined primary, secondary and higher gross enrollment ratio for males was 19.5% higher than females; however, females only earned 65.2% of the income earned by males. this gap in the gender measures is graded in GDi by life expectancy at birth; on average, females outlive males by more than 5.6 years.
GDi reflects penalties for gender inequality and its share related to the gender differentiation on three human development indices. as seen from the table 5.3, the gender penalty diminished by 10 times during seven years.
the dynamics of GDi indices (index of a long and healthy life, knowledge and earned income) shows that differentiation of a long and healthy life for female and male is insignificant. the gender discrepancy in the knowledge index is still most essential compared to other GDi indices; during the last several years, it grew by a modest amount (-0.039 in 2004 compared to -0.046 in 2006). the penalty for gender inequality reduced, as a result of the decrease in the gap of male and female earned indices.
tABlE 5.3hDI AnD GDI InDICAtoRs oF tAJIKIstAn In 2000-200784
year hDI GDI penalty for gender inequality
2000
2004
2006
2007
0,6280,648 - 0,020
0,6700,680 - 0,010
0,680
0,686
0,684
0,688
- 0,004
- 0,002
5.3. mEAsURE oF GEnDER InEQUAlIty

126 NatioNal HumaN DevelopmeNt RepoRt 2008 -2009
CHapteR 5
it should be noted that literacy indices of the population in calculating GDi have remained the same over the last 10 years, as they are based on the result of the census carried out in 2000. Renewal of the literacy index after the census in 2010 may significantly lower the measures of HDi and GDi. in the age group of women born between 1985 and 1992, the literacy level will be much lower, as their enrollment in primary school collapsed during the civil war (1992-1995) when in the regions of military operation, parents did not allow girls to attend school due to security reasons.
Despite the distorted picture of gender inequality, GDi is a universal instrument used for international comparison of gender equality achievements. By GDi (2007), tajikistan ranks 107th out of 157 countries, just behind Nicaragua (106th place) and just ahead of Namibia (108th place).
thE GEnDER EmpoWERmEnt mEAsURE (GEm)
Gem allows one to evaluate the level of female opportunities from the point of view of their political and economic participation. this index measures the gender equality from the political and economic viewpoints in relation to female participation. Gem gives proper weight to the ratio of women and men in political participation, distribution of professional and senior positions, as well as earned income.
Shortage of data on some Gem components makes its calculation difficult and inaccurate in many countries. the Global Human Development Report does not contain Gem calculation for tajikistan. the State Committee on Statistics of the Republic of tajikistan calculated this index based on the results of lFS-2004 on distribution of professional and senior positions between men and women. Gem was 0.492 in 2004.
tABlE 5.4GEm ComponEnts In 200485
GEm components Women men
share in total population, %
share of parliamentary seats, %
share of positions as legislators, senior officials and managers, %
share of professional and technical positions, %
Estimated earned income, ppp Us$
Income index
0,498
38,0
0,502
62,0
15,5
641
81,5
1619
35,4
0,014
64,6
0,038

employmeNt iN tHe coNtext oF HumaN DevelopmeNt 127
iS tHe GeNDeR iNeQualitY DeepeNiNG?
Gem is incommensurable with HDi due to differentiation of their components. it is impossible, so far, to evaluate Gem dynamics. the dynamics of this index will allow reveal the tendency of achievements in promotion of the gender equality through provision of political and economic participation. it is also difficult to evaluate the national index at the global level, because in 2006 the Global Human Development Report calculated Gem for 102 countries only, due to lack of data on other countries, including tajikistan. if we presume that for the period from 2004 to 2006, Gem in tajikistan could increase by several points due to the reduction of the gender payment discrepancy, tajikistan could conditionally occupy the 52nd place with Gem value 0.492, beside mexico at the 51st place (with Gem equal to 0.603) and oman who was at the 52nd place in the rating (with Gem value 0.434).
thE GEnDER EQUAlIty InDEx (GEI)
the World economic Forum proposed the quantitative measure of the gender inequality and, starting from 2005, it calculates the gender inequality index (Dei) for the majority of countries. Depending on the value of this index, country ratings are prepared according to achievements in overcoming the discrepancy between men and women in the provision of real rights in economic, political and social spheres.
unlike GDi, the new index comprises fundamentally new components for the measure of the gender inequality, namely participation of women and men in economic and political spheres. the gender discrepancy is captured in four critical areas of the inequalities between men and women:• Participationandopportunitiesineconomicactivity—
total data on payment, level of participation and access to high-quality employment;
• Educationopportunities—totaldataonaccessibilityofthe basic and higher education;
• Healthandlifeexpectancy—totaldataontheratioofthe life expectancy and the gender quantitative ratio;
• Participationinpoliticalprocess—totaldataonrepresentation in executive bodies.
Gei value fluctuates from 0 to 1: zero value means complete gender inequality and 1 means complete gender equality. Not a single country has scored a 1, meaning that gender equality has been reached.
Gei for tajikistan is calculated from 2007. the situation with the gender equality worsened from 0.658 in 2007 to 0.654 in 2008. as seen on the diagram, Gei is apportioned to four components (annex 5).
DIAGRAm 5.5GEnDER InEQUAlIty InDEx FoR tAJIKIstAn In 200886
political participation
economic activity
average world value
tajikistan
Health
education
0,868
0,979
0,8
0,6
0,4
0,2 0,689
0,0810
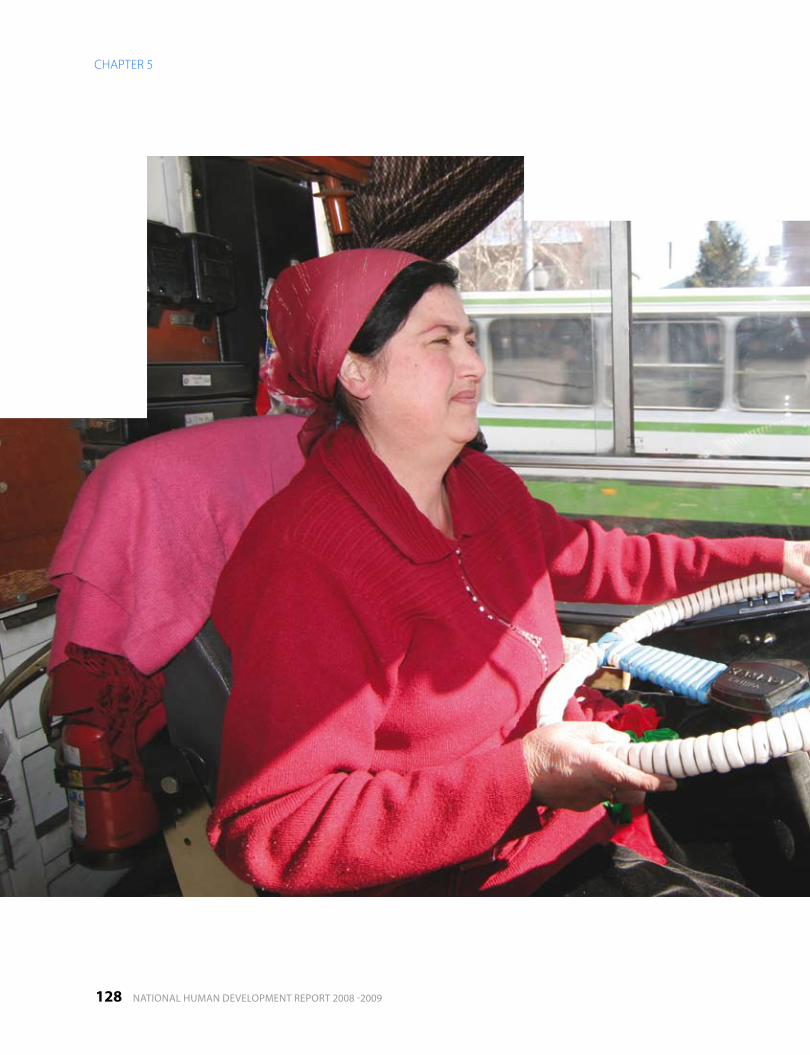
128 NatioNal HumaN DevelopmeNt RepoRt 2008 -2009
CHapteR 5

employmeNt iN tHe coNtext oF HumaN DevelopmeNt 129
iS tHe GeNDeR iNeQualitY DeepeNiNG?
From 2007 to 2008 the rating of the country moved from 79th to 89th place among 130 countries beside Kenya (88th place) and Bangladesh (90th place).
tajikistan has achieved a considerable success in reducing gender inequality in economic activity (44th place) and health (55th place) compared to the average world value, but it lags behind the average world values in education (112th place) and political participation (98th place).
as there are only two years of data, it is not relevant to try to analyze trends. Nonetheless, it should be noted that the situation of gender equality has deteriorated in the areas of health, education and economic participation.
the shortage of statistical data on gender problems makes it difficult to evaluate the progress of gender equality promotion efforts. analyzing health, education and income GDi indices show a reduction of the gender discrepancy. However, the qualitative analysis of the gender situation reveals a deepening of the gender inequality, as a consequence of strengthening patriarchal stereotypes on gender roles. the indices considering the gender discrepancy at the level of authorities (GDi and Gei), reflect the statistically outlined tendency. unfortunately, due to the lack of regular statistical basis for calculating these indices, it is difficult to adequately evaluate the rates and scales of this process.
130 NatioNal HumaN DevelopmeNt RepoRt 2008 -2009
CHapteR 6 CoNCluSioN
poSSiBle ReaCtioN
to CHalleNGeS
the policy aimed at preservation and creation of working places as well as cardinal increase fo income and the minimal level of payment should become a component of employment strategy in the country. Realization of the strategy can include both the short- and long-term measures.
CHapteR 6 CoNCluSioN

employmeNt iN tHe coNtext oF HumaN DevelopmeNt 131
poSSiBle ReaCtioN to CHalleNGeS
6

132 NatioNal HumaN DevelopmeNt RepoRt 2008 -2009
CHapteR 6 CoNCluSioN
thE polICy At thE lEVEl oF EntERpRIsEs
the employment policy at the level of enterprises did not form yet; the release of employees does not fit the frames of any available model of the labour market: american – release and re-distribution of the labour force between enterprises, and Japanese – intra-firm movement of employees. the most acceptable employment policy under the current circumstances is revival of production based on its diversification and establishment of allied enterprises with creation of new jobs.
the most difficult is its realization on the private enterprises which are beyond the sphere of the state regulation of employment. even if a collective agreement exists at some enterprises, they do not stipulate employment issues to the full scale. it is necessary to speed up the decision of issues to promote responsibility of enterprises for the use of labour force, and create of conditions for increasing the prestige and attractiveness of work in industry.
measures on assistance to farming and small businesses are the most effective from the point of view of employment. thus, the normative, financial and tax regulation behaviour of enterprises of the formal and informal sectors on the labour market should become the priority for the employment policy. the situation with employment in the country, in general, and with competitiveness of enterprises, in particular, depends on this.
measures on creation of new jobs should be oriented on “technological” jobs. in the context of promotion of the population’s employment these measures could be the following:
• Consultationandprofessionalorientationofunemployedyouth in order to determine their preferred spheres, training in basic business undertaking;
• Quotationofjobsforyouth;• Provisionofeconomicassistancetothepopulationin
establishing farms (dekhkan), provision of credits on favourable terms, and tax reliefs;
• Establishmentoftheintra-regionalbankofvacanciesandjobs in the regions in order to promote territorial and professional mobility of the labour force;
• Broadrecruitmentofunemployedtopublictemporarywork through raising prestige and interested motives;
• Assistanceinself-employmentofthepopulationintheinformal sector of economy through organizing work at home and individual activity based on flexible forms of employment;
• Assistanceinemploymentofcitizensthroughraisingtheir competitiveness on the labour market (education, re-training, improvement of information-sharing on the demand for the labour force);
• Encouragementofdevelopmentofsmallandmediumbusiness in rural areas of the country;
• Provisionofthepurposefulassistanceandprotectiontoall categories of the population, especially to the most vulnerable, on the labour market.
in the small and open economy of the country it is important to initiate establishment of the state short-term programme “limitation of the consumer import and promotion of the local producers” in order to decrease the negative balance of trade, substitute inefficient imports and create additional jobs.
a medium-term programme of assistance to small and medium businesses aimed at regulation of the system of double-taxation in leasing operations in such priority sectors of economy, including: a) agriculture, b) textile, food and processing industry, c) vocational training and d) innovation branches, can also be initiated. this can establish conditions for active involvement; in realization of such a programme, small and medium businesses create additional jobs.
During crisis it is important to preserve the established industrial links of domestic companies (mainly small and medium) with the foreign ones. one of the preventive measures on the support of the labour market can be active involvement of small and medium businesses in the process of the state purchases at the expense of the state budget and international organizations. this measure should envisage “the split-up” of tender lots of the state orders to such a level which will allow participation of small and medium business in the system of the state purchases.
6.1. REVIsIon oF polICy on thE lABoUR mARKEt
employmeNt iN tHe coNtext oF HumaN DevelopmeNt 133
poSSiBle ReaCtioN to CHalleNGeS
thE REGIonAl polICy
employment policy should be different by region. Based on the evaluation of unemployment levels, the regions facing the most severe situation should be identified and supported. each region should have detailed measures to promote employment.
preventive measures aimed at mitigation of tension are needed in the regions facing the most severe employment situation, could include:
• Toanalyzelabourmarketsofthecountry’sregions(basedon the 2008 labour market Survey of Rasht valley by ilo);
• Tocarryoutexpertiseofthefinancialstateofenterprisesand organizations which release big numbers of employees;
• Tostopthereleaseofemployeesorcarryitoutstage-by-stage and provide for additional financing to promote employment;
• Totoughensanctionsagainstheadsofenterprisesandemployers that conceal vacant jobs;
• Tofindpossibilitiesforpurposefulfinancingofrepublicanprogrammes which will promote mitigation of the critical situation of the labour market and regulate illegal labour migration;
• Toorganizemasspublicworkduringseasonalharvesting,road-building, construction industrial and social infrastructure, and human services.
• ToelaborateregionalProgramme“Labour”,includinglabour force balance by region.
purposeful actions done only by employment services with the support of the executive power will not solve the issue of overcoming of the investment recession; it is necessary to elaborate special regional anti-crisis programmes. the institutions of local governance play an essential role in the realization of such programmes, which are able to attract investments and implement activities.
in the economically developed regions, to use accumulated labour potential, the industry require further structural reconstruction and modernization through investments. Creation of new jobs should be placed in the dependent position versus structural transformations, development of industrial and social infrastructure, human services.
in the regions of agro-industrial development the policy of employment should be linked to the organization of small enterprises to process agricultural products.
active involvement of the population in public work on road-building, forestation and improvement of cities and settlements can become an efficient form of promoting employment. only under the radical circumstances of realization of radical measures of the active policy of employment according to local conditions, it seems possible to keep unemployment back, to enhance market reforms and preserve stability in the regions.
the policy of employment of the population in the regions should be an integral part of the Government’s regional policy. the regulation of employment and the labour market depends directly on the state support of vulnerable regions through grants and subsidies; the ability to attract private national and foreign capital oriented at preservation and creation of jobs; organization of public jobs; and re-education and re-training of release employees.
every region should have its own priorities based on its current labour market situation and its individual social, economic and demographic development; real opportunities for implementation of top-priority tasks require medium- and long-term perspectives.
the regional policy of employment should be redirected to active prevention measures, aimed to grow the involvement of the unemployed, especially youth, in education and re-training.
134 NatioNal HumaN DevelopmeNt RepoRt 2008 -2009
CHapteR 6 CoNCluSioN
thE nAtIonAl polICy
at the national level, the policy of income growth and employment should be the basic direction of the state regulation. the policy of employment in the country should not be considered only as part of social programmes. it should be followed by the investment and structural changes directed at the reform of the income and the minimal payment systems. the low level of the labour force cost becomes the factor hindering economic processes in the country.
today, the country needs an efficient employment. only such increase of employment which can promote growth of qualification of industrial workers, growth of their payment and income to the level providing for broader reproduction of the labour force, is in the interests of the country. the policy directed at the increase of employment of the population should promote development of creative personalities and should suspend the process of de-qualification of the gross labour force. it should be directed at the increase of the production efficiency and the decrease of inflation.
Creation of opportunities of productive employment and stable sources of income is the most difficult task under the circumstances of the economic crisis and the instable labour market.
there is absolutely no doubt that tajikistan will be able to establish many new jobs and decrease unemployment to its natural level. the investment policy of the country should be aimed at investments in the labour-intensive and science industry. it is important to urgently eliminate barriers for the domestic entrepreneur, such that he/she can efficiently establish new enterprises. it is necessary to establish efficient stimulus for those entrepreneurs who build labour-efficient enterprises requiring high qualification and providing at least a moderate level of payment.
the policy aimed at the growth of payment levels and income will create additional jobs; for example, it may enable one job to be divided between two or three employees; partial employment may be introduced (which will likely decrease the number of women in low efficiency employment). this policy can be an essential preventive measure aimed at decreasing the necessity to work for such categories of the population like women, students, people of pensionable age, disabled people who are dependent on the head of the family.
if the Government takes a leading role, resolution of these issues is possible.
Specifically, the state should take the following measures:а) inventory the potential quantity of jobs in all the sectors
and spheres of economy of the country;b) comprehensive stimulation of self-employment and the
small sector of economy;c) prompt reconstruction of large labour-intensive
enterprises with high level of innovations;d) increased role of specialists and qualified employees in all
the spheres of economy;e) development of the National programme «, Work in the
Republic of tajikistan»;f ) consistent implementation of the concept “economy
based on knowledge”.
taking into consideration the experience of other countries, the ministry of economic Development and trade may establish an analytical group to perform a special “protective investigation” and elaborate on well-grounded suggestions. For example, they may work to replace import goods by imposing customs duties on non-essential imported consumer goods in order to create labour-intensive enterprises.
the self-employed comprise the essential part of the informal employment. at the current stage of development of the country, the informal sector plays a positive role in the structure of employment of the population. experience of other countries with significant informal employment shows that self-employment does not disappear automatically with the creation of jobs in the formal sector. Reducing the informal sector through tougher state policy will lead to a drastic increase in unemployment, as a larger amount of those informally employed will be unable to find job in the formal sector. this will drastically deteriorate living standards of those employed in the informal sector. moreover, the prohibited informal sector will, inevitably, turn into a criminalized sector.
prohibitive measures are well-founded to resolve negative effects of the informal employment. it should be taken into consideration that the informal sector in tajikistan will exist well into future. However, taking a medium- and long-term perspective its shortcomings can have serious consequences: criminalization of society, impoverishment of the population, reproduction of poverty, and degradation of society’s labour potential. to avoid this, it is necessary to overcome negative tendencies of development of the informal sector, and direct its development to a more civilized path.

employmeNt iN tHe coNtext oF HumaN DevelopmeNt 135
poSSiBle ReaCtioN to CHalleNGeS
the question of stimulation of the small business development is a real alternative to the informal employment. Regulating measures should include simplification of registration of small enterprises, reduction of taxes up to tax exemption for the period of formation, purposeful state financial support. Stimulating measures for small business can simultaneously lead to legalization of a part of the informal sector and enhancement of the state control from the point of view of provision of the minimal social guarantees.
at the current stage of economic development, eradication of child labour is the most urgent task. Coordination of state activity state, international and non-governmental organizations on the eradication of child labour should focus on returning working children back to school, and promoting their physical and spiritual development. preventive short-term measures should be directed at eradicating the worst forms of child labour and on improving working conditions of children. tax and finance policy should aim at intensive involvement of able-bodied population in productive and legal employment. Changing tax policy could play a significant role in economic development, increasing legal employment and income, decreasing poverty and informal economy in tajikistan.
the micro-financing policy should be directed at the growth of employment and self-employment of women, especially the most vulnerable: women and girls from rural areas. there are other ways of solving this problem: promoting the search of profit-making activity, professional training, and providing financial and other governmental support for the entrepreneurial activity of women, particularly in the sphere of small businesses.
the principles of social partnership at solving problems of employment can play a positive role in the country. Within the frame of the social dialogue the state should work closer with employers who just started forming in the country. the social dialogue should become a part of ideology of the authority senior officials.

136 NatioNal HumaN DevelopmeNt RepoRt 2008 -2009
CHapteR 6 CoNCluSioN
DIspRopoRtIon In EDUCAtIon EnRolmEnt AnD QUAlIty
the system of general secondary education provides the basis for the acquisition of professional skills and knowledge. positive measures being taken by the Government of the country today are related to widening enrollment of youth in education and striving to improve the quality of education. However, if the country succeeded in resolving the problem of enrolment, the quality of graduates’ knowledge is still unresolved.
an increase in student enrollment in school education is not followed by the growth of knowledge, and the diploma on secondary education is not a guarantee of preparedness to acquire a profession. this leads to a decrease in the efficiency of use of resources and time at higher levels of education and impacts the quality of the “end” product - a specialist entering a labour market.
the conceptual problem of professional education is a weak orientation on a labour market. in the frames of the National Development Strategy of the country for the period until 2015 there is a list of actions aimed at the structural transformations and promotion of potential at all levels of education system. their realization will help to move in the direction of training more qualified specialists, but today it is necessary to consider the current situation on the labour market. it is advisable to:• Principallyimprovethequalityofthestateandregional
forecasts of demand for specialists on the short, medium- and long-term perspective. elaboration of methods of the compilation of the state and regional forecasts of demand for specialists on the short-, medium- and long-term perspective taking into consideration the demand of the real sector of economy is needed;
• Applyinpracticeofelaborationoftrainingandeducational programmes the process of continuity between general educational and professional programmes;
• Widelyusethepracticeofvacancyfairsforstudentsofsecondary special and higher educational institutions as one of the possible variants to meet the requirements of employers;
• Considerruralpopulationdemandsinacquisitionofaspecialty at compilation of educational programmes of the primary and secondary special education (craftsmanship, farm work, industrial activity, related to processing of agricultural raw material);
• Extendtrainingofspecialistsunder“thePresident’squota”according to the economic demand of a definite region. it is important to ensure transparency of this process and organization of constant public monitoring of the result of such purposeful training of specialists.
ACCEss to pRoFEssIonAl EDUCAtIon
the ability to provide equal access to professional education is pressing. as there is significant income disparity between families, this is typically the source of inequality in obtaining education; the solution of the problem of accessibility to higher education can not be reached only through reformation of the education system itself.
Socially vulnerable categories of students should be supported, and a comprehensive strategy of institutional change should be implemented.
it is advisable to:• Developeducationalcrediting;• Preserveandfurtherdevelopthesystemofstate
privileges on access to education and financial support during study of socially vulnerable students;
• Developprofiletrainingandearlyprofessionalorientation.
6.2. EDUCAtIon polICy

employmeNt iN tHe coNtext oF HumaN DevelopmeNt 137
poSSiBle ReaCtioN to CHalleNGeS
ConFoRmIty to thE mARKEt DEmAnD
professional education should correspond to the market demand. the quality of training young specialists is important along with the alignment of educational programmes to industry demands.
today the system of professional education weakly aligns to the labour market demand. this has put supply and demand out of balance.
under the current conditions, it is important to ensure the innovation character of education. the priority task of the innovative character of education should be to: (i) support higher education institutions in carrying out fundamental and applied research, and (ii) elaborate educational technologies and programmes to integrate project and research tasks in the education process. Higher educational institutions should not simply become base centers of qualified specialists, but the generator of ideas and innovation.
Correlation of financial and economic mechanisms in education is important to implement measures of education quality improvement.
it is advisable to:• Establishandsupportscientific,educationalandindustrial
centers in leading higher education institutions;• Attractyoungscientiststhroughincreasinggrantson
research activity and forming special programme to support youth research groups and research projects;
• Developandimprovethesystemofpost-graduateanddoctorate courses;
• Elaborateandapprove(atthegovernmentallevel)indicators of effectiveness of professional education and the rating of educational institutions;
• Expandthepracticeofnormativeandpercapitafinancingof the public accreditation system of professional education;
• Implementthepracticeofnormativeandpercapitafinancing to provide transparency in the distribution of the budget funds and trace financing directly to the consumer of the educational service;
• ElaboratetheNationalPlantoimplementStableDevelopment education (SDe) programmes in the Republic of tajikistan
.
138 NatioNal HumaN DevelopmeNt RepoRt 2008 -2009
CHapteR 6 CoNCluSioN
IntERnAl mIGRAtIon
migration serves as an indicator of differences in the social and economic development of the republic’s regions. today, migration is visible and shows how unbalanced the labour market is. the main migration flow is directed at Dushanbe and regional centers. this will likely continue to increase considering the disparity economic development and income between the regions.
the influence of migration on the labour market and social life in the Republic of tajikistan has not been studied sufficiently. For example, internal migration can increase the efficiency of regional resources and reduce in income and employment discrepancies.
analysis showed that if rural incomes are not increased, the city will attract more internal migrants and increase the level of employment in cities. as a result, these issues will be aggravated both in the city (through the growth of informal employment) and in the rural areas (through shortage of specialists and labourers). this signals the importance rural economic development.
Central to this is the importance of providing institutional support to dekhkan farms to stimulate growth in agricultural products and increase employment (assume relatively easy access to land and financial resources). Higher income levels are important not only for the farmers, but for the entire rural population; it can be obtained through development of value chains (e.g. agro-processing enterprises and craftsmanship). the system of education and training of specialists should be oriented to rural areas. to resolve the issue of technical equipment shortages, tax privileges should be extended on equipment imports and a market of for leasing services should be developed and promoted.
economic growth is rarely balanced; this is why arbitrary, unjustified redistribution efforts can harm natural progress. Regional differences in income and production levels are inevitable. Successful experience other countries show, that it is more efficient to pursue a regional policy that promotes the territorial balance of basic human development indices.
in rural areas, a reasonable land policy, as well as measures to provide basic social services to the population, can improve the indices of human development. if the leveling of income and payment programme lay as basis for the regional policy assuming migration mobility, it should be considered that leveling of living essentials consumptions by households is the quicker process compared to the access to the basic public services.87
Changing the mechanism that provides financial support to the regions (subventions to the regional budgets from the republican one) to align with the regional social development indicators could be accomplished through adopting laws such as “the law on the state Support of the problem territories” and “the law on the mountain Regions of the Republic”. it is important to substantiate the criteria and approaches to the country regions’ typology at the interregional as well as at intraregional levels.
pendulous migration as one of the forms of internal migration can mitigate the disbalances on the local labour markets. measures on support of pendulous migration, as a variant of solution of the unemployment problems are the most effective in the regions where the population mobility is traditionally low or the poverty level is high. measures aimed at the decreasing financial and temporal intraregional transportation costs may be the most efficient; this could be accomplished through the development of the infrastructure and the market of transportation services.
6.3. mIGRAtIon polICy
employmeNt iN tHe coNtext oF HumaN DevelopmeNt 139
poSSiBle ReaCtioN to CHalleNGeS
ExtERnAl mIGRAtIon
Prospective decisions
migration from tajikistan results in not only hundreds of thousands people working outside the territory, but also creates significant social fissure. each of these issues requires specific measures which have their own rules and methods of decision. the problems of external migration are so sharp that the summit of the leaders of oSCe member-states on migration ranks high on the social agenda. tajikistan must elaborate a new state ideology that addresses the issue of labour migrants.
the problems accumulated require coordinated efforts of governmental, international and non-governmental organizations. For tajikistan, who would like to raise the image of tajik labour migrants abroad, these problems must be addressed. international experience in managing migration processes requires thorough study and elaboration, especially in the context of the formation of a national model of external migration management. the more so, the country has a rather serious and world-wide acknowledged experience of initiating agreements at different levels, in particular, the national model of achieving peace agreement during the civil war.
establishment of a working group to elaborate Doctrine of the migration policy in tajikistan and compilation of the law of the Republic of tajikistan on migration can be the first step in this direction. the first step in this direction could be to create a working group to develop a doctrine of migration policy in tajikistan and the preparation of the law on migration. to take preventive measures in the field of external migration there is an evident need to prepare the annual national assessment reports “on the state of labor migration” for presidents, whose countries are involved in the processes of external migration.
multiple research and surveys of labour migrants show that many migrants’ problems disappear, if the governments signed comprehensive intergovernmental agreements. protection of human rights of labour migrants is the most important aspect of the process of external migration. Solving this problem will provide decent employment for a significant number of migrants. legalization is still the primary problem, and without a solution a whole spectra of other problems will continue.
the system of primary vocational training occupies an important piece in regulating migration processes. today, tajikistan should rehabilitate polytechnic training in secondary schools when acquisition of skills in a specific profession is an obligatory element of the educational process. the system of secondary vocational training in the country also needs reforming.
the state support of labour migrants can be efficient only in case of an increase of migrants’ economic interest in official cash remittances to the country of origin. the short-term measures in this field can be privileges for labour migrants remitting their income through official banking channels. Such measures can include:• Gratuitousreplacementofforeignpassportstakinginto
account urgency;• Duty-freeimportofpersonalbelongingsfortotal
amounts not exceeding uS $1,000;• Provisionofquotasforthelabourmigrants’children
entering educational institutions of the country;• Provisionofprivilegesforaccesstolandresourcesand
establishing personal subsidiary plots; • Provisionofproperpensions.

140 NatioNal HumaN DevelopmeNt RepoRt 2008 -2009
CHapteR 6 CoNCluSioN
FIVE polItICAl AppRoAChEs
under the current circumstances, employment of a large number of people through development of migration processes takes on a political and international character. the “wild” period of labour migration from tajikistan is in the past. a political approach to resolving employment problems is desperately needed.
Democratic management of migration process
General democratic values, human rights and freedoms, supremacy of the law, pluralism, tolerance, lack of discrimination and mutual respect should become fundamental principles in the internal and foreign policy, with respect to labour migrants. provision of just and proper treatment to labour migrants will mean recognition of external labour migration as a component of the employment strategy in the country.
Migrant’s rights
the economic market ideology is an opportunity for able-bodied individuals to be self-sufficient. During transit period a growth of migration activity is important, and is a form of responsibility of able-bodied individuals for self-sufficiency and survival. it is necessary to overcome existing parasitical stereotypes on the state, as the solitary guarantor of employment. therefore, provision of protection of labour migrants’ rights to freedom of labour activity could change the employment situation and the national labour market.
Equality of opportunities
equality of rights should be followed by resolute measures in social policy to protect the rights of every labour migrant. the Social Charter and the european Convention on the legal status of workers-migrants underline that the member-states of the migration process would take measures to ensure equal rights for workers-migrants and their families residing legally on the territories of these states.
Intra-cultural dialogue
it is very important to provide space for open dialogue. intra-cultural dialogue can promote tolerance, mutual understanding and respect between nationalities. insulting statements with respect to tajik labour migrants have appeared in mass periodicals of some countries; these statements have such unwarranted defamatory and discreditable character that they endanger the very culture of tolerance. incitement to hatred based on intolerance is incompatible with respect for basic rights and freedoms guaranteed by the international Convention and judicial practice.
The state support to migration and shaping favourable public opinion
the state bodies, international and public funds, religious communities and the mass-media can become pioneers in breaking stereotypes of labour migrants. in the epoch of globalization, it is impossible to stop migration. Rather, it is necessary to create a climate of public confidence to labour migrants both on the national and external labour markets.

employmeNt iN tHe coNtext oF HumaN DevelopmeNt 141
poSSiBle ReaCtioN to CHalleNGeS
World financial and economic crises have created powerful structural changes in tajikistan’s labour market over the last ten years. How will they influence the human development and decent employment in the country?
sCEnARIo 1 (pEssImIstIC): hDI DECREAsE
at the current population growth rate and low enrollment in professional education, the share of qualified specialists will diminish. this decrease is due to (i) natural withdrawal of the labour force retiring on a pension, and (ii) the departure of qualified employees from the country (labour migration) due to higher growth rate of the able-bodied population in comparison with growth rate of their professional training and employment. Simultaneously, despite the high level of unemployment, an inflow of foreign qualified workers will take place, creating another factor of increasing unemployment. Respectively, the outflow of young men to labour migration will grow and aggravate demographic asymmetries.
Surveys show that families of labour migrants are more vulnerable. one third of men that migrate does not return home and leave families without any support. therefore, the number of vulnerable families will continue grow and further exacerbate the cycle of poverty.
the necessity to increase expenditures for financial support of vulnerable populations increases. in this case, social support of these families by the state will be allocated for survival only, but not human development.
Hence, the level of qualification and, respectively, competitiveness of the labour force will decline, on both internal and external labour markets. as a result, by 2012, when the census 2010 results are presented, the HDi value will decrease due to education standard index (decrease of indices of adult literacy and enrollment in professional education). it is expected that the female education standard will be much less than their male counterparts, and the gender penalty in GDi and HDi values’ difference will grow.
Degradation of education standard will negatively influence the aggregate labour productivity and other macroeconomic indices. in this case, the increase of the minimal payment will increase inflation.
Deepening the gender inequality in education standard will be reflected by the gender segregation in the labour market, making more women and their children susceptible to poverty.
sCEnARIo 2 (optImIstIC): hDI InCREAsE
this scenario pre-supposes mobilization of the state’s resources for expansion of professional education among population and liberalization of individual, small and medium businesses. the population will increase its competitiveness relative to foreign labour force standard, legalize the shadow labour market, provide for self-employment and increase labour demand through creation of small and medium enterprises. However, an excess labour supply will still remain.
external labour migration will remain a necessity. However, the higher quality of labour force will provide opportunities for more decent jobs and higher payment abroad. Competition on the internal labour, credit, education and other markets will be high.
this scenario assumes that definite efforts will be taken to promote gender equality; without special conditions, women will not be able to compete with men and their role in society will be limited to reproductive functions (i.e. household work, care of the family members), which will not allow them receive income, social benefits and pensions.
HDi value will grow due to an increase in education standards, employment and income levels. However, the gender penalty, calculated as the difference between HDi and GDi, will increase, because women will still be less competitive on the labour market. in this case, the government’s expenses on different compensations, payments, and benefits will increase.
6.4 possIBlE sCEnARIos oF hUmAn DEVElopmEnt

142 NatioNal HumaN DevelopmeNt RepoRt 2008 -2009
CHapteR 6 CoNCluSioN
sCEnARIo 3: thE GEnDER pEnAlty REDUCtIon
this scenario along with expansion of access to professional education and liberalization of individual, small and medium businesses and stable preservation of external migration, assumes special attention is given to gender issues.
a whole complex of measures, which will flexibly combine economic activity with reproductive functions, relates to gender issues. in this case, measures such as the creation of private and public kindergartens and day nurseries with government support and without taxation, is needed. the possibility of sending children to kindergartens and day nurseries will allow women to engage in profitable activities, and will encourage more participation from senior school age girls.
Surveys show that girls-graduates of secondary schools are highly motivated to learn professional skills (computer literacy, cooking, embroidery, sewing, knitting, etc.), but they are not in a position to go to the city to study. after graduation rural women are primarily involved in hard agricultural labour with low incomes, if they do not have professional education. therefore, even primary professional education could generate results, since women could engage in more profitable activity under more comfortable conditions.
involvement of women in economic activity reduces household risks due to the temporary loss of income by one parent. Such families increase investments in human potential, particularly the health and education of their children. profitable activity guarantees women social payments and benefits, which non-working women are deprived of.
the state investments to promote involvement of women in economic activity will reduce support to poor households, because the strategies are aimed at human development of those women earning by qualified professional labour.
at the gender sensitive development of the scenario, HDi value will increase at much higher rate compared to the gender insensitive scenarios, because education standard and female income will grow proportionally and, perhaps, at even a faster rate. the gender penalty between HDi and GDi will diminish.

employmeNt iN tHe coNtext oF HumaN DevelopmeNt 143
poSSiBle ReaCtioN to CHalleNGeS
During the last several years, the world community has started to pay more attention to the development of so-called “green” jobs (i.e. jobs which positively influence the environment).Some researchers believe that the “green economy” will become a motivating power of economic development in the 21st century.
the Green economic initiative has three footholds:• evaluationandpromotionofthenaturalresources
significance to the front line ; • provisionofpopulationemploymentduetocreationof
“green” jobs and elaboration of the proper policy; • usageofappropriatemechanismsandthecharactersof
market conditions able to speed up the transition to the Green economy.
this strategy is based on the survey results carried out by eBe, ilo, the international Confederation of Free trade unions and the international organization of employers; the strategy links to the uNep initiative on creation of “green” jobs.
the report “Green” jobs: to decent work in the stable world with the low level of emissions”, devoted to the influence of the springing up “green” economy on the sphere of labour, points out that in the coming decades the efforts on counteraction to climate change can lead to creation of millions new “green” jobs.88 measures on the climate change control will lead to elaboration of a structure of employment and investment environment that will create new ‘green’ jobs. it is foreseen that millions of new jobs could be created in both developed and developing countries.
Climate change already negatively influences labourers and their families, particularly if their income relates to agriculture and tourism. this is why it is necessary to take drastic measures today to control climate change.
the “green” jobs mitigate the negative influences of enterprise and industry activity. the “green” jobs promoting preservation or rehabilitation of environment can, first of all, be created in such sectors like agriculture, industry, human services and management. these jobs should ensure “decent work” which promotes the reduction of poverty and preserves environmental sustainability.
6.5. “GREEn EmploymEnt”: AWAREnEss AnD possIBlE AChIEVEmEnts
«there are moments in history when comes the time of idea – this is just the case of the Green economic innovation. innovative approaches and measures are needed in the current complex situation, when the uncontrollable international financial crisis added to the fundamental ecological crisis. i express my approval of uNep for such a quick and timely reaction – especially of how uNep and the international labour organization (ilo) have demonstrated huge untapped potential in the field of the stable management of the natural capital and the natural assets».
Eric Solheim, Minister of environmental control, Norway

144 NatioNal HumaN DevelopmeNt RepoRt 2008 -2009
CHapteR 6 CoNCluSioN
according to forecasts, the global market of ecological products and services will increase from the current level of uS$ 1.37 billion to uS$ 2.74 billion annually by 2020. Half of this market will be services and products in the sphere of energy efficiency and stability of transport, water supply, sewage systems and processing of wastes. thus, it is forecasted that by 2030 the branch of ecological technologies in Germany will grow by 4 times and will comprise up to 16% of the total industrial production of the country, at this level, sector employment will be higher than in the heavy engineering and motor-car industries.
in the uSa, ecologically clean technologies will rank third (after information and nano-technologies) on the volume of venture investments. in china such venture investments during the last several years grew by more than 2 times and reached 19% of the total investments.
Recently 2.3 million new jobs were created in the sphere of renewable sources of power; the growth potential is in this sector is quite significant. By 2030, employment in the field of alternative energy sources can grow up to 2.1 million people in the use of the wind energy and up to 6.3 million in the use of solar energy. Renewable sources of energy provide for more jobs than the fossil types of fuel. as expected, by 2030 investments on the renewable sources of energy will comprise uS$ 630 billion and ensure creation of not less than 20 million additional jobs.
in agriculture in production of energy from bio-mass and in allied branches it is possible to create up to 12 million jobs. in countries such as venezuela, the addition of ethanol blend of 10 per cent in fuel will ensure 1 million jobs in the sugar cane industry by 2012.
transition to construction of energy efficient buildings all over the world will allow creation of millions of jobs and make more “green” already existing 111 million jobs in construction sector.
investment in construction of energy efficient buildings only in europe and the uSa can ensure creation of 2-3.5 million “green” jobs and in developing countries this potential is much higher.today the braches of recycling industry and processing of wastes provide for 10 million jobs in china and Brazil. against the background of the products prices growth this sector, as forecasted, will be dynamically developing in many countries.

employmeNt iN tHe coNtext oF HumaN DevelopmeNt 145
poSSiBle ReaCtioN to CHalleNGeS
“Green” markets develop more dynamically and are reformed in those countries where there is a powerful and stable political support at the highest level, with the well-defined aims and the system of sanctions and privileges, with properly elaborated laws and standards of effectiveness for buildings and equipment, where efficient research is carried out.
the “Green” Jobs initiative is a partnership established in 2007 by uNep, ilo and ituC. in 2008, ioe joined them. the initiative aims at promotion of broader opportunities, equality and fair conditions during reforms, attracting governments, employers and employees to the dialogue to elaborate efficient policy and programmes on the creation of “green” economy and decent labour for all.
unfortunately, tajikistan is not on the list of the “green economy” countries. “Green” innovations have barriers in the shape of insufficient information of the population, gaps in the legislation concerning application of these technologies in industry, lack of business stimulating mechanisms and shortage of financing. it is necessary to improve this situation and speed up this process in order to create decent employment conditions and contribute to climate change control.
in its strategic programmes tajikistan pays special attention to the problems of ecological security, disposes of the broadest possibilities for creation of “green” jobs. it is also possible in the frames of the mechanism of Clean Development projects89 in all the spheres of the national economy, since in 2008 tajikistan ratified the Kyoto protocol. the best prospects are in electrical energy, agriculture,90 reforestation, and ecotourism. implementation of these programmes will attract additional investments in the national economy, and develop pollution-free and energy-saving technologies.
moreover, such “green” employment in tajikistan is possible in protected natural territories, ecotourism, the utilization of bio-fuel industry, and disaster control, among other areas.
the ecological agenda of the 21st century has become an integral part of the economic and social development agenda. tajikistan should place itself on the agenda, as solving the problems associated with dangerous wastes, ecosystem degradation, climate change contribute to the issues of inequality and poverty. the country needs to overcome all of these issues in order to achieve its development goals, formulated by the millennium Declaration.
InsERtIon 21“GREEn” JoBs
in 2005 in the united States, more than 5.3 million jobs were created in the ecological sector, which is 10 times more than in the pharmaceutical industry of the country.
the programmes of use of the renewable sources of energy in such european countries like Spain are only ten years old, however, they have created several thousand jobs.
indian Delhi will use new buses working on compressed natural gas which does not pollute environment and lead to creation of additional 18,000 new jobs.
Brazil effects a programme of use of ethanol which lead to creation of a half-a-million jobs, and a programme of use of biodiesel fuel which is specially intended to hundreds of thousand the most poor small private farmers.
By 2020 Germany will create more jobs in the field of ecological technologies, than in all the motor-car industry.
in europe 20% growth of energy efficiency will lead to creation of almost half-a-million jobs. the same will take place in the countries with transitional economy and developing countries. china is the world leader in the field of use solar energy for heating.
at the total trade revenue in trade at the level of uS$ 2.5 billion in 2005 more than 1,000 chinese producers employed more than 150,000 people. employment in this sphere can grow significantly as showed the project capacity forecast.

146 NatioNal HumaN DevelopmeNt RepoRt 2008 -2009
REFEREnCE
1 tajikistan. living Standards measurement Survey 2007. Dushanbe 2009. 24 p. 2 tajikistan: living Standard Survey. Dushanbe, 2004 3 Social and economic situation of the Republic of tajikistan. 2008 4 labour Force Survey. Dushanbe. 2004. 5 the labour market of the Republic of tajikistan. the State committee on statistics of the Republic of tajikistan. 2009.6 Russia’s economic interest in tajikistan: risks and opportunities. Dushanbe. 2009.7 the labour market of the Republic of tajikistan. Statistic collection - Dushanbe, 2009, 162 p.8 DCi 0818 the labour market survey and migration profile. the labour market survey in tajikistan. Working document, June 2009, p.45.9 ibid.p.52.10 Kuddusov D. tajik labour migrants in the global financial crisis: the migrants’ opinion/ the working version of the document – pC “Sotsservis”, may 2009.11 “Business and politics” № 22 (611) 2 June 2005.12 Human Development index 2008. uNDp; Human Development Report 2009. overcoming barriers: Human mobility and development.13 Human Development Report 2009. overcoming barriers: Human mobility and development.14 the labour market in the Republic of tajikistan. the State committee on statistics of the Republic of tajikistan. 2009.15 the State committee on statistics of the Republic of tajikistan. 2009.16 the State committee on statistics of the Republic of tajikistan. 2009.17 the State committee on statistics of the Republic of tajikistan. 2009.18 the message of the president of the Republic of tajikistan to the majlisi oli (the parliament) of the Republic of tajikistan. 12 april 2009.19 the State Budget of the Republic of tajikistan for 2007-2009.20 the Demographic annual Review of the Republic of tajikistan. – Dushanbe, Goskomstat, 2008, p.21.21 education in the Republic of tajikistan. - Dushanbe, Goskomstat, 2008, p.13,30,32. 22 the Demographic annual Review of the Republic of tajikistan. – Dushanbe, Goskomstat, 2008, p.21; tajikistan: 15 year of the state independency. – Dushanbe,
Goskomstat, p. 49; education in the Republic of tajikistan. – Dushanbe, Goskomstat, 2008, p.13.23 the gender problems and development. the development stimulation through the gender equality in the rights, accessibility to resources and opportunity to
express one’s interests. the World Bank - 2002. 24 tajikistan. living Standards measurement Survey 2007, pp. 77, 80.25 the message of the president of the Republic of tajikistan to the majlisi oli (the parliament) of the Republic of tajikistan. 12 april 2009.26 the World Bank project on modernization of education system. -2003.27 education in the Republic of tajikistan. - Dushanbe, Goskomstat, 2009, p.32.28 education in the Republic of tajikistan. - Dushanbe, Goskomstat, 2009, p.36.29 the population of the Republic of tajikistan accordidng to the census 2000. Dushanbe, 2005. v. ii, part.1, pp. 268-269. the labour market in the Republic of tajikistan.
Statistic collection. Dushanbe, 2009, p.158.30 tajikistan: living Standard Survey. 2007.31 Calculated according to: the labour market in the Republic of tajikistan. 2009.32 Calculated according to: the labour market in the Republic of tajikistan. 2009.33 low of Rt «low on living Wage». #521, 19 may 2009.34 the State committee on statistics of the Republic of tajikistan. the labour market in the Republic of tajikistan. 2009.35 the labour market in the Republic of tajikistan. Statistic collection. Dushanbe 2009. p.83.36 according to the annual reports of official statistics.37 according to information on the official iom web-site.38 Kuddusov D. the survey of the labour market in tajikistan. Working version of the document. Dushanbe. 2009. p.86.39 the message of the president of the Republic of tajikistan to the majlisi oli (the parliament) of the Republic of tajikistan. 40 evaluations of the project group experts..41 Sinyavskaya o.v. the informal employment in Russia: measure, scale, dynamics. Scientific seminar. 2005.42 aistov v.o. Development of some employment forms in Russia in 1992-2004. HSe. 2005.p.186.43 the labour Force Survey 2004 and the data of the official statistics. 44 the Child labour Survey. SRi of labour and social protection of the population of the Republic of tajikistan. 2006.45 tajikistan and CiS countries. Statistics collection, Dushanbe, 2006, p.88.46 the Report on Human Development. publishing house ”vesj mir”, М., 2006, p.352.
employmeNt iN tHe coNtext oF HumaN DevelopmeNt 147
47 Cost of “non-living”. Business and politics № 22 (611) 2 June 2005.48 tajikistan: 15 years of the state independency.Statistic collection, Dushanbe. 2006. p.87.49 the labour market in tajikistan. Statistic collection 2009.50 the labour market in tajikistan. Statistic collection 2009.51 the labour market in tajikistan. Statistic collection 2009.52 the law of the Republic of tajikistan “on provision of the population’s employment” 1 august 2003, № 44. artilce 27.53 the law of the Republic of tajikistan “on provision of the population’s employment” 1 august 2003, № 44. article 29.54 the labour Force Survey. 2004.55 the labour market in the Republic of tajikistan. Statistic collection 2009. 56 the labour market in the Republic of tajikistan. Statistic collection, Dushanbe, 2009, p. 8757 the sources: the CiS intergovernmental committee on statistics.58 Calculated according to: the labour market in the Republic of tajikistan. Statistic collection, Dushanbe, 2009, p. 234.59 the international labour organization. transition from education to work survey, Dushanbe, 2007, p.91. project. 60 the Demographic Year-book - 2008, Dushanbe, Goskomstat, pp.14, 60-61.61 Compiled according to the Demographic Year-book of the Republic of tajikistan, Dushanbe, p.14 and 118.62 the Demographic Year-book of the Republci of tajikistan, Dushanbe, p.118.63 Compiled according to the Demographic Year-book of the Republic of tajikistan, Dushanbe, p.120.64 Comment – the typology is done in the context of reselltements on external and inrenal migrations. (annex 4.1.)65 the matrix of correlations of the development indices of Khatlon region in annex 4.3.66 the regions of the Republic of tajikistan. the Statistic Year-book - Dushanbe, Goskomstat, 2008, p.55.67 Compiled according to the data of statistical collections. – the Regions of tajikistan, Dushanbe, 2005-2008.68 Calculated according to the data of the \ministry of finance of the Republic of tajikistan.69 See the chapter on the informal employment of the present report.70 Russia and the CiS countries. moscow – 2008, p.30.71 olimova S,, Bask i. the labour migration from tajikistan/the internationl organization for migration. - Dushanbe, 2003. p.122.72 according to the operational data of the migration service of the ministry of interior of the Republic of tajikistan.73 Kuddusov D. the influence of the global financial crisis on the labour migrants from tajikistan: the migrants’ opinion. the working version of the document. pC
“Sotsservis”. may 2009.74 Women and men of the Republic of tajikistan./the State committee on statistics of the Republic of tajikistan. – Dushanbe, 2007.75 Nousheen Yavari de Helenkrt education of the girls in tajikistan: comprehensive analysis of reasons of screening of girls from schools. – uNiCeF, 2005; inna
maljtseva. the gender equality in employment. – uNiFem, 2007; elena mezentseva. the gender equality in education. – uNiFem, 2007; margarita Khegai. the girls’ access to education. – oSCe, 2008.
76 Kuddusov D. tajik labour migrants in the global financial crisis: the migrants’ opinion./pC “Sotsservis”, ilo. – Dushanbe, 200977 the labour market in tajikistan. the State committee on statistics of the Republic of tajikistan, 200978 lSmS – 2007, uNiCeF79 the national report “on implementation of the Convention on elimination of all forms of discrimination in relation to women”. 200580 the national report “on implementation of the Convention on elimination of all forms of discrimination in relation to women”. 200581 Women and men of the Republic of tajikistan. the State committee on statistics of the Republic of tajikistan. 2007.82 Women and men of the Republic of tajikistan. the State committee on statistics of the Republic of tajikistan. 2007.83 the survey of the gender issues in tajikistan. the World Bank, the Department of social development. the region of europe and Central asia. – 2005, p.33.84 Women and men of the Republic of tajikistan. the State committee on statistics of the Republic of tajikistan. 2007.; the human development indices 2008. – uNDp,
2008.85 Women and men of the Republic of tajikistan. the State committee on statistics of the Republic of tajikistan. 2007.86 the Global Gender Gap Report/ World economic Forum – Geneva, Switzerland, 2008.87 the World Development Report 2009. New look at the economic geography. Survey. the World Bank 2008.88 Green Jobs: towards Decent work in a Sustainable, low-Carbon World. 2009.89 the Kyoto protocol’s mechanism of Clean Development can invest up to uS $100 billions on implementation of the projects for transition to cleaner sources of
energy and re-forestation in developing countries. 90 one of the ways of provision of the rural population with working places and the consequent decrease of the unemployment rate and poverty is reclamation of
old idle and opening of new land. at present the country does not use 57 thousands hectares of land.

148 NatioNal HumaN DevelopmeNt RepoRt 2008 -2009
population per region, thousand people
Regional population structure
Regional RF
Region
year
2006 2007
GBAo 220,4 218,0
sogd region 2095,7 2132,1
Khatlon region 2519,6 2579,3
Dushanbe 660,9 679,4
tRRs 1567,2 1606,9
Region
year
2006 2007
GBAo 0,031201 0,030212
sogd region 0,296682 0,295481
Khatlon region 0,356692 0,357457
Dushanbe 0,093562 0,094156
tRRs 0,221864 0,222695
Region
year
2006 2007
GBAo -28,5148 -21,41150547
sogd region -178,47 -134,31,6629
Khatlon region -268,323 -167,8194285
Dushanbe 92,86221 143,7025652
tRRs -60,6209 23,14252948
AnnEx 1
CAlCUlAtIon oF CoRRECtED GRp pER CApItA on thE REGIons oF thE REpUBlIC oF tAJIKIstAn In 2006 – 2007
stEp1. CAlCUlAtIon oF GRp pER CApItA stEp 3. CAlCUlAtIon oF REDEploymEnt FUnD (RF) In REGIons
stEp 4. CAlCUlAtIon oF Cost oF REDEploymEnt FUnD
GRp, thousand somonis
GRp per capita
Difference between GRp and GDp
stEp 2. CAlCUlAtIon oF DIFFEREnCE BEtWEEn GRp pER CApItA AnD GDp pER CApItA In thE REpUBlIC oF tAJIKIstAn
Region
year
2006 2007
GBAo 172992,8 232342,0
sogd region 2299500,4 2814266,0
Khatlon region 2384919,4 3366033,2
Dushanbe 1778697,0 2242509,9
tRRs 2234145,6 3018433,6
Region
year
2006 2007
GBAo -28,51478241 -21,411505447
sogd region -178,4697698 -134,3106629
Khatlon region -268,3225856 -167,8194285
Dushanbe 9286221014 143,7025652
tRRs -60,62087828 23,1425948
totAl -443,0658059 -156,6965021
Region
year
2006 2007
GBAo 784,9038 1065,788991
sogd region 1097,247 1319,950284
Khatlon region 946,5468 1305,018106
Dushanbe 2691,325 3300,721077
tRRs 1425,565 1878,420312
Region
year
2006 2007
GBAo -913,8961887 -708,7110092
sogd region -601,5530658 -454,5497162
Khatlon region -752,2531672 -469,4818943
Dushanbe 992,5254653 1526,221077
tRRs -273,2349158 103,9203124
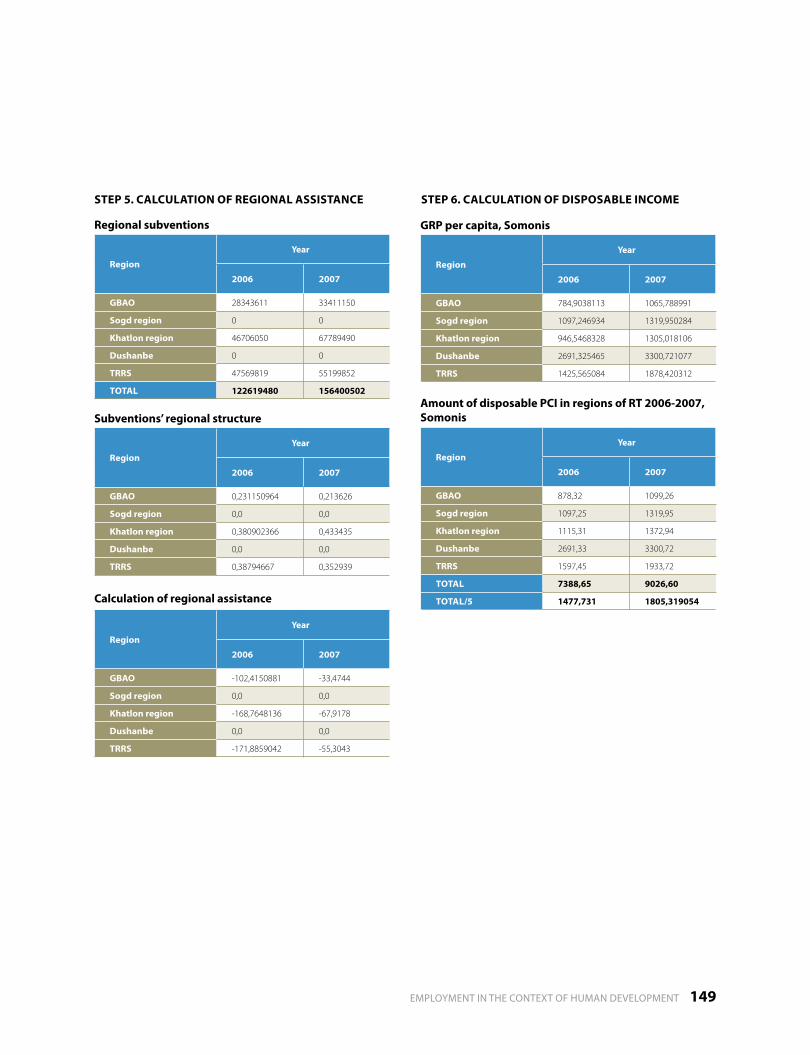
employmeNt iN tHe coNtext oF HumaN DevelopmeNt 149
subventions’ regional structure
Calculation of regional assistance
GRp per capita, somonis
Amount of disposable pCI in regions of Rt 2006-2007, somonis
Region
year
2006 2007
GBAo 0,231150964 0,213626
sogd region 0,0 0,0
Khatlon region 0,380902366 0,433435
Dushanbe 0,0 0,0
tRRs 0,38794667 0,352939
Region
year
2006 2007
GBAo 784,9038113 1065,788991
sogd region 1097,246934 1319,950284
Khatlon region 946,5468328 1305,018106
Dushanbe 2691,325465 3300,721077
tRRs 1425,565084 1878,420312
Region
year
2006 2007
GBAo 878,32 1099,26
sogd region 1097,25 1319,95
Khatlon region 1115,31 1372,94
Dushanbe 2691,33 3300,72
tRRs 1597,45 1933,72
totAl 7388,65 9026,60
totAl/5 1477,731 1805,319054
Region
year
2006 2007
GBAo -102,4150881 -33,4744
sogd region 0,0 0,0
Khatlon region -168,7648136 -67,9178
Dushanbe 0,0 0,0
tRRs -171,8859042 -55,3043
stEp 5. CAlCUlAtIon oF REGIonAl AssIstAnCE stEp 6. CAlCUlAtIon oF DIsposABlE InComE
Regional subventions
Region
year
2006 2007
GBAo 28343611 33411150
sogd region 0 0
Khatlon region 46706050 67789490
Dushanbe 0 0
tRRs 47569819 55199852
totAl 122619480 156400502

150 NatioNal HumaN DevelopmeNt RepoRt 2008 -2009
I Khatlon
AnnEx 2
hDI and its constituents’ dynamics in the regions of the Republic of tajikistan in 2006-2007
Calculation of hDI and its constituents in regions of the Republic of tajikistan 2006-2007 (I -Index)
2006 2007
2007
AlE El
Region
AlE, year Apll, % ER, % El, %Disposable income
per capita somoni/ Us $
hDI
Year Year Year Year Year Year
2007 2007 2007 2007 2006 2007 2006 2007
GBAo 74,4 99,3 77,4 92,0887,3 1099,3
0,581 0,587268,9 319,6
sogd region 71,4 97,2 72,8 89,11097,3 1314,0
0,550 0,555332,5 383,7
Khatlon region 71,0 97,2 66,8 87,11115,3 1372,9
0,539 0,552338,0 399,1
Dushanbe 76,5 98,7 75,0 90,82691,3 3300,7
0,648 0,666815,5 959,5
tRRs 71,4 97,3 61,1 75,31597,5 1933,7
0,557 0,567484,1 562,1
I GBAO 0,79674,0-41,282,4-41,2
= =ALE I GBAO 0,93992,0-25,896,3-25,8
= =ELEL GBAO 99,3 + 77,4 =2 13 3
= 92,0%*
EL TRRS 97,3 + 61,1 =2 13 3
= 85,3%
EL Sogd 97,2 + 72,8 =2 13 3
= 89,1%
EL Khatlon 97,2 + 66,8 =2 13 3
= 87,1%
EL Dushanbe 98,7 + 75,0 =2 13 3
= 90,8%
I Sogd 0,72170,9-41,282,4-41,2
= =ALE I Sogd 0,89889,1-25,896,3-25,8
= =EL
ALEI Khatlon 0,71470,6-41,282,4-41,2
= = EL 0,87087,1-25,896,3-25,8
= =
I TRRS 0,73171,5-41,282,4-41,2
= =ALE
I TRRS 0,84485,3-25,896,3-25,8
= =EL
I Dushanbe 0,83375,5-41,282,4-41,2
= =ALE
I Dushanbe 0,92290,8-25,896,3-25,8
= =EL
I GBAO 0,79974,4-41,282,4-41,2
= =ALE
1
I Sogd 0,73371,4-41,282,4-41,2
= =ALE
ALE
1
I Dushanbe 0,85776,5-41,282,4-41,2
= =ALE
1
I TRRS 0,73371,4-41,282,4-41,2
= =ALE
1
I Khatlon 0,72371,0-41,282,4-41,2
= =1
* eR was estimated on the base of: living Standard measurement Survey 2007

employmeNt iN tHe coNtext oF HumaN DevelopmeNt 151
2006 2006
2007 2007
pCI hDI
I GBAO 0,007log(268,9)-log(281,0)log(75611)-log(281,0)
= =PCI HDI GBAO 0,5810,796+0,939+0,0073
= =
HDI TRRS 0,5570,731+0,844+0,0973
= =
HDI Sogd 0,5500,721+0,898+0,0303
= =
HDI Khatlon 0,5390,714+0,870+0,0333
= =
HDI Dushanbe 0,6480,833+0,922+0,1903
= =
I TRRS 0,097log(484,1)-log(281,0)log(75611)-log(281,0)
= =PCI
I Sogd 0,030log(332,5)-log(281,0)log(75611)-log(281,0)
= =PCI
I Khatlon 0,033log(338,0)-log(281,0)log(75611)-log(281,0)
= =PCI
I Dushanbe 0,190log(815,5)-log(281,0)log(75611)-log(281,0)
= =PCI
I GBAO 0,023log(319,6)-log(281,0)log(75611)-log(281,0)
= =PCI
1HDI GBAO 0,5870,799+0,939+0,023
3= =
1
I Sogd 0,055log(383,7)-log(281,0)log(75611)-log(281,0)
= =PCI
1HDI Sogd 0,5550,733+0,898+0,034
3= =
1
I Khatlon 0,063log(399,1)-log(281,0)log(75611)-log(281,0)
= =PCI
1HDI Khatlon 0,5520,723+0,870+0,063
3= =
1
I Dushanbe 0,219log(959,5)-log(281,0)log(75611)-log(281,0)
= =PCI
1HDI Dushanbe 0,6660,857+0,922+0,219
3= =
1
I TRRS 0,124log(562,1)-log(281,0)log(75611)-log(281,0)
= =PCI
1HDI TRRS 0,5670,733+0,844+0,124
3= =
1

152 NatioNal HumaN DevelopmeNt RepoRt 2008 -2009
AnnEx 3
Clusters’ characteristic
number of regions
in a cluster
standard deviation Cluster composition
Indicators – migration factors (2007)
Density of population Average monthly salary payment
Distance to a relatively big city
cluster 1
5 103,6 tursun-Zade, Khudjand, Chkalovsk, Rudaki & Gafurov
Relatively high Relatively high Very close by
Higher than average in republic
Higher than average in republic, except for: Rudaki & Gafurov
From 11 km to 17 km
cluster 2
9 54,52 vakhdat, Kurgan-tyube, aini, isfara, Konibadam, pendjikent, Bokhtar, Khamadoni & parkhar
Relatively high Relatively low close by
Higher than average in republic, except for: aini
lower than average in republic, except for: Kurgan-tyube
except for: aini, Khamadoni & parkhar
cluster 3
10 17,7 Ghissar, asht, Rasulov, istarafshan., vakhsh, Dangara, Kubodien, Kulob, muminobod & Shaartuz
Relatively high Relatively low close by
Higher than average in republic, except for: asht
lower than average in republic
except for: asht, Dangara, Kubodien, muminobod & Shaartuz
cluster 4
4 24,55 Kairakkum, varzob, Zafarobod & Rumi
Relatively high Relatively low close by
Higher than average in republic, except for: varzob
lower than average in republic
except for: Zafarobod & Rumi
cluster 5
20 14, 56 taboshar, Djirgatol, Noorobob, Rasht, Faizobod, Shakhriinav, Gonchi, mastchokh, Spitamen, vosse, Kumsangir, pyanj, temoormalik, Djomi, Khovaling, Yavan, vanj, Darvoz, ishkashim & Shoognan
Relatively high Relatively low Relatively far
Higher than average in republic, except for: Garm & GBao
lower than average in republic
except for: Shakhrinav & vosse
cluster 6
10 16,65 Rogoon, Khorog, Shakhristan, Khuroson, Djilikool, Noorek, Sarband, Shuroobod, murgab & Rooshan
Relatively high Relatively low Relatively far
Higher than average in republic, except for: Shuroobod, murgab & Rooshan
lower than average in republic, except for: Noorek, Rogoon & Sarband
cluster 7
6 11,8 tavildara, tojikobod, Kukhistoni mastchokh, Baldjuvon, Khisrav & Roshtkala
Relatively low Relatively low Relatively far
lower than average in republic, except for: tojikobod
lower than average in republic
totAl 64
Cluster 1: includes attractive regions (tuzsun-Zade), and cities and regions with relatively high net-migration (-1.44) and gross-migration (22.7), as well as relatively favourable result in intra-republican migration processes’ activity (on average, 123 departures vs.100 arrivals).
Cluster 2: includes regions with a significant migration “flow”, but higher migration rate compared with the previous cluster (on average, 442 departures vs.100 arrivals).
Cluster 3: is intermediary to clusters with very unfavourable migration ratio (on average, 768 departures vs. 100 arrivals), i.e. migration “flow” has a significant influence on the population dynamics.
Cluster 4: includes regions with a moderate population outflow (four regions with similar social and economic indicators). on average, the net-migration coefficient is –0.496, and the gross-migration coefficient is 15.06 (on average, 121 departures vs.100 arrivals).
Cluster 5: includes regions with the most critical migration situation: high absolute and maximal relative migration losses (–3.4), and the gross-migration coefficient (– 6.07) (on average, 1216 departures vs. 100 arrivals).
Cluster 6: includes ten regions. Similar to Cluster 3, in respect of the net-migration indicator: on average, the net-migration indicator is –2.26, and similar to Cluster 5, in respect of the migration flows: on average, the gross-migration coefficient is 6.5 (on average, 390 departures vs.100 arrivals).
Cluster 7: similar to Cluster 1, in respect of the net-migration coefficient (-1.3), and to Cluster 3, in respect of the gross-migration coefficient (5.17) (on average, 517 departures vs. 100 arrivals).

employmeNt iN tHe coNtext oF HumaN DevelopmeNt 153
AnnEx 4m
atri
x of
cor
rela
tion
bet
wee
n de
velo
pmen
t ind
ices
of t
he K
hatl
on re
gion
s (2
007
data
)
mig
ratio
n ba
lanc
e pe
r 1,0
00
Regi
ster
ed
unem
ploy
ed &
va
canc
ies r
atio
Ratio
of a
vera
ge
mon
thly
pay
men
t to
aver
age
repu
blic
an
leve
l
agric
ultu
ral
prod
uctio
n ca
paci
ty p
er
capi
ta
Sow
ing
area
per
ca
pita
Dire
ct ta
x re
venu
es
of lo
cal b
udge
t per
ca
pita
indu
stria
l pr
oduc
tion
capa
city
per
ca
pita
Reta
il co
mm
odity
tu
rnov
er p
er
capi
ta
Chan
ge o
f nu
mbe
r of
hire
d em
ploy
ees
Den
sity
of
popu
latio
n pe
r 1
sq. k
m
Nat
ural
in
crem
ent o
f po
pula
tion
per1
,000
mig
ratio
n ba
lanc
e pe
r 1,0
001
0,22
0,38
-0,3
3-0
,30,
480,
360,
150,
560,
110,
09
Regi
ster
ed
unem
ploy
ed &
va
canc
ies
ratio
0,22
1-0
,21
0,15
-0,0
1-0
,16
-0,2
20,
560,
210,
010,
42
Ratio
of a
vera
ge
mon
thly
pa
ymen
t to
aver
age
repu
blic
an
leve
l
0,38
-0.2
11
-0,4
8-0
,43
0,85
0,92
-0,3
0,28
0,02
-0,3
6
agric
ultu
ral
prod
uctio
n ca
paci
ty p
er
capi
ta
-0,3
30,
15-0
,48
10,
85-0
,5-0
,5-0
,26
-0,0
6-0
,62
0,33
Sow
ing
area
per
ca
pita
-0,3
-0,0
1-0
,43
0,85
1-0
,57
-0,5
-0,3
6-0
,125
-0,6
30,
1
Dire
ct ta
x re
venu
es
of lo
cal b
udge
t pe
r cap
ita
0,48
-0,1
60,
85-0
,5-0
,57
10,
92-0
,07
0,4
0,11
-0,2
3
indu
stria
l pr
oduc
tion
capa
city
per
cap
ita0,
36-0
,22
0,92
-0,5
-0,5
0,92
1-0
,07
0,36
0,04
-0,3
5
Reta
il co
mm
odity
tu
rnov
er p
er
capi
ta
0,15
0,56
-0,3
-0,2
6-0
,36
-0,0
7-0
,25
10,
070,
550,
23
Chan
ge o
f num
ber
of h
ired
empl
oyee
s0,
560,
210,
28-0
,06
-0,1
250,
40,
360,
071
-0,1
1-0
,11
Dens
ity o
f pop
ulat
ion
per 1
sq.km
0,11
0,01
0,02
-0,6
2-0
,63
0,11
0,04
0,55
-0,1
11
0,11
Nat
ural
in
crem
ent o
f po
pula
tion
per
1,00
0
0,09
0,42
-0,3
60,
330,
1-0
,23
-0,3
50,
23-0
,05
0,11
1

154 NatioNal HumaN DevelopmeNt RepoRt 2008 -2009
GEI constituents Rating GEI valueAverage
world value
Women men % of women to men
Economic activity 44 0,689 0,587
men & women employment ratio 67 0,75 0,69 49 66 0,75
men & women payment for equal job ratio 53 0,73 0,64 0,73
male & female salary payment ratio 57 0,58 0,51 992 1725 0,58
men & women ratio among legislators, executives, managers
- - 0,28 - - -
men & women ratio among specialists - - 0,72 - - -
Education 112 0,867 0,929
men & women literacy level ratio 49 1,0 0,87 100 100 1,0
Ratio of men to women with primary education 113 0,96 0,97 95 99 0,96
Ratio of men to women with secondary education 117 0,84 0,92 74 87 0,84
Ratio of men to women with higher education 119 0,37 0,86 10 27 0,37
Health and Life expectancy 55 0,979 0,958
Gender ratio at birth 1 0,94 0,92 - - 0,95
men & women healthy life expectancy ratio
67 1,06 1,04 56 53 1,06
Male & female political activity 98 0,081 0,163
Gender ratio in the parliament 60 0,21 0,21 18 83 0,21
Gender ratio on minister’s positions 114 0,06 0,17 6 94 0,06
a woman at the head of the state, duration (the last 50 years)
40 0,00 0,13 0 50 0,00
AnnEx 5
Gender Equality Index (GEI) for tajikistan in 2008
GEI rating of Tajikistan in 2008 (out of 130 countries) – 89th place (0.654)GEI rating of Tajikistan in 2007 (out of 128 countries) – 79th place (0.658)
Reference: the Global Gender Gap Report/ World economic Forum – Geneva, Switzerland, 2008


tajikistan, Dushanbe, aini str. 39vSat tel.: (47) 241-36-929. inmarsat tel.: (873) 382-420-321
tel.: (992-372) 21-06-70, 21-06-80vSat fax: (47) 241-36-930. inmarsat fax: (873) 382-420-322
Fax: (992-372) 51-00-21.e-mail: [email protected]
www.undp.tj