Taipei TAIWAN December 2009 Newsletter … · MacKenzie, Lancaster University, UK) Lucy Carpenter...
40
A Note from the IGAC Co-chairs: Kathy Law and Tong Zhu The earth’s tropical regions are the chemical powerhouse of the atmosphere: the surface and lower atmosphere are tightly coupled through atmosphere-biosphere exchanges, and it is also in these regions where deep convection provides a pathway for near-surface emissions to reach the upper troposphere. In the article “Atmospheric Chemistry in the Tropics: Marine, Biosphere and Climate Connections”, Sturges and Reeves summarize the scientific findings and discussions on this topic from a meeting initiated by the United Kingdom IGBP National Committee, held at the Royal Society in London on 30 June 8th, 2009. Biosphere-atmosphere interactions are also highlighted by Kaiser et al., who outline the opportunity to integrate new space-based observations and modeling capabilities to better quantify the role of fire in the earth system. These findings result from discussions at a European Space Foundation (ESF) workshop on “Improved Quantitative Fire Description with Multi-Species Inversions of Observed Plumes”. Three further articles highlight aspects of atmospheric chemistry in and around the urban environment. With the fast economic and social development as well as urbanization in China, air pollution in Chinese cities has become a serious concern, especially in megacities like Beijing and in the Pearl River Delta region. In the last decade international collaborative research programs, such as CAREBeijing and PRIDE-PRD, have been conducted to systematically study air pollution formation processes in Chinese megacities. In this issue, three set of authors from Peking University summarize the some of the major findings from these campaigns. In the article “Particle pollution in Beijing: features, source and secondary formation”, Hu et al., report the change of mass concentration, chemical composition, and the sources of particulate mater in Beijing in the last ten years, and they present recent findings about new particle formation and optical closure. Ozone is an emerging pollutant in Chinese cities, and Zhang and Lu use an Observation Based Model and field campaign data to analyze “the dependence of ozone production rate on ozone precursors in the Beijing and Pearl River Delta regions”. In the article “Trends in summertime non-methane hydrocarbons in Beijing”, Shao et al. report on the decreasing trends in NMHCs, NOx, and Ox and an increase in O3 concentrations observed in the month of August from 2004-2009, and the source apportionment results. Finally, we’d like to close by reminding you that the next IGAC conference will be held joint with CACGP 11-16 July 2010 at Dalhousie University in beautiful Halifax, Nova Scotia, Canada. We hope you can join us there to share in the latest in atmospheric chemistry research. Announcements & Save the Date • Inside Back Cover Trends in summer- time non-methane hydrocarbons in Beijing city, 2004-2009 18 Particle pollution in Beijing: features, source and secondary formation 10 Understanding the processes involved in biomass burning 8 Atmospheric chemistry in the tropics: marine, biosphere and climate connections 2 The dependence of ozone production rate on ozone precursors in the Beijing and Pearl River Delta regions 26 Issue No. 42 December 2009 Newsletter Newsletter of the International Global Atmospheric Chemistry Project
Transcript of Taipei TAIWAN December 2009 Newsletter … · MacKenzie, Lancaster University, UK) Lucy Carpenter...
Printed on Recycled PaperPlease Recycle after Use!
Taipei TAIWAN
R.O.C.
POSTAGE PAID
LICENCE NO.N285
IGAC Core Project OfficeRESEARCH CENTER FOR ENVIRONMENTAL CHANGEACADEMIA SINICA128 Academia Rd. Sect. 2P.O. Box 1-55 NanKangTaipei, 11529 Taiwan
NEWSLETTERNewsletter
A Note from the IGAC Co-chairs: Kathy Law and Tong Zhu
The earth’s tropical regions are the chemical powerhouse of the atmosphere: the surface and lower atmosphere are tightly coupled through atmosphere-biosphere exchanges, and it is also in these regions where deep convection provides a pathway for near-surface emissions to reach the upper troposphere. In the article “Atmospheric Chemistry in the Tropics: Marine, Biosphere and Climate Connections”, Sturges and Reeves summarize the scientific findings and discussions on this topic from a meeting initiated by the United Kingdom IGBP National Committee, held at the Royal Society in London on 30 June 8th, 2009.
Biosphere-atmosphere interactions are also highlighted by Kaiser et al., who outline the opportunity to integrate new space-based observations and modeling capabilities to better quantify the role of fire in the earth system. These findings result from discussions at a European Space Foundation (ESF) workshop on “Improved Quantitative Fire Description with Multi-Species Inversions of Observed Plumes”.
Three further articles highlight aspects of atmospheric chemistry in and around the urban environment. With the fast economic and social development as well as urbanization in China, air pollution in Chinese cities has become a serious concern, especially in megacities like Beijing and in the Pearl River Delta region. In the last decade international collaborative research programs, such as CAREBeijing and PRIDE-PRD, have been conducted to systematically study air pollution formation processes in Chinese megacities. In this issue, three set of authors from Peking University summarize the some of the major findings from these campaigns. In the article “Particle pollution in Beijing: features, source and secondary formation”, Hu et al., report the change of mass concentration, chemical composition, and the sources of particulate mater in Beijing in the last ten years, and they present recent findings about new particle formation and optical closure. Ozone is an emerging pollutant in Chinese cities, and Zhang and Lu use an Observation Based Model and field campaign data to analyze “the dependence of ozone production rate on ozone precursors in the Beijing and Pearl River Delta regions”. In the article “Trends in summertime non-methane hydrocarbons in Beijing”, Shao et al. report on the decreasing trends in NMHCs, NOx, and Ox and an increase in O3 concentrations observed in the month of August from 2004-2009, and the source apportionment results.
Finally, we’d like to close by reminding you that the next IGAC conference will be held joint with CACGP 11-16 July 2010 at Dalhousie University in beautiful Halifax, Nova Scotia, Canada. We hope you can join us there to share in the latest in atmospheric chemistry research.
Announcements & Save the Date • Inside Back Cover
Trends in summer-time non-methane hydrocarbons in Beijing city, 2004-2009
18Particle pollution in Beijing: features, source and secondary formation
10Understanding the processes involved in biomass burning
8Atmospheric chemistryin the tropics: marine,biosphere and climateconnections
2 The dependence ofozone production rateon ozone precursors in the Beijing andPearl River Delta regions
26
Issue No. 42December 2009
NewsletterNewsletter of the International Global Atmospheric Chemistry Project

IntroductionThe tropical regions, which account for around half the surface of the globe, are the chemical powerhouse of the atmosphere, with important ramifications for both atmospheric composition and global climate. Tropical forests emit large quantities of biogenic hydrocarbons into the atmosphere, leading to photochemical production of radicals, ozone, and secondary organic aerosols; all of which have direct and indirect consequences for regional and global climate. Biomass burning likewise affects the chemistry of the tropical regions and beyond. Emission of gases from the sea surface plays an important role in the oxidation chemistry of the lower atmosphere, and also potentially in the supply of halogen source gases to the upper troposphere and lower stratosphere via deep tropical convection.Arid and semi-arid regions also play a significant role in climate-chemistry interactions. Changes in monsoon rainfall, desertification, and convection may have impacts on regional and long range chemical processing. Plumes of dust from arid regions reach far across the tropical oceans, where the resulting deposition of minerals and nutrients impacts marine biogenic production of atmospherically important gases.There is clearly a need to better understand this under-studied region of the atmosphere, and a number of recent international research activities have focussed on these issues, including the African Monsoon Multi-disciplinary Analyses (AMMA) in Western Africa; the Oxidant and Particle Photochemical Processes (OP3) project in Borneo; observations at Cape Verde as part of the Surface Ocean Lower Atmosphere Study (SOLAS); and the Stratospheric-Climate Links with Emphasis on the Upper Troposphere and Lower Stratosphere (SCOUT-O3) project in Northern Australia and Africa, to name but a few.An opportunity was presented to discuss the scientific findings from these and other studies at a meeting initiated by the UK IGBP National Committee and held at the Royal Society in London on June 8th, 2009. The meeting took the form of individual sessions comprising short presentations followed by wider-ranging discussions lead by the session Chair.
Speakers and delegates had been encouraged to consider four overarching themes:
1. The nature and significance of emissions from the marine and terrestrial biosphere in the tropics, and human-induced emissions from biomass burning and land use changes
2. The impact of such emissions on the oxidising capacity of the atmosphere, on ozone in the tropo-sphere/stratosphere, on aerosol formation and properties, and on radiative forcing of climate
3. The nature and influence of atmospheric transport processes, at various temporal and spatial scales, on the distribution, and subsequent delivery, of surface emissions and their reaction products
4. Consideration of possible feedbacks between a changing climate and changing emissions in the tropics
Atmospheric chemistry in the tropics: marine, biosphere and climate connectionsContributed by William T. Sturges ([email protected]), and Claire Reeves ([email protected]) School of Environmental Sciences, University of East Anglia, Norwich, UK
FeaturesFeaturesSCIENCE
Figure 1. The UK FAAM (Facility for Airborne Atmospheric Measurements) BAe146 research aircraft flying low over the rainforest near Danum Valley, Sabah, Borneo as viewed from the groundbased measurement site at Bukit Atur. Measurements of reactive gases, aerosols and hydrocarbons were made both on the aircraft and on ground. (Photograph courtesy of Martin Irwin, University of Manchester.)
IGACtivities 2

Many aspects of biogenic volatile organic compound (BVOC) emission patterns remain unexplained including diel and seasonal variations. Alex Guenther (National Center for Atmospheric Research, USA) reported, for instance, that diurnal cycles of isoprene are muted during the ‘wet’ season when leaf area index, solar irradiance and temperature are lower; yet monoterpene emissions show the reverse trend for reasons that are not immediately obvious. Satellite measurements of product gases (e.g. formaldehyde) are beginning to ‘fill in’ some gaps in spatial and temporal coverage, but an in situ eddy flux measurement network, with wide geographical coverage, is crucial to better quantify and speciate current estimates of tropical BVOC emissions in representative ‘ecoregions’. Modelling challenges include better and higher resolution mapping of vegetation cover, more accurate emission factors, and a deeper understanding of environmental controls on these emissions, such as temperature and light levels. Several ‘unknowns’ exist, including the extent of sesquiterpene emissions which could be important (or even dominant) precursors of secondary organic aerosol (SOA) formation.
Eric Achterberg (Southampton University, UK) considered the implications for marine primary productivity in the tropical and subtropical Atlantic from the deposition of wind blown dust to the ocean surface. About a third of global ocean-deposited dust is to this region. The solubility of iron and aluminium from these dusts varies depending on the origin of the dust, being larger for well-processed, long-range transported plumes. This dust deposition plainly enhances the availability of dissolved iron and aluminium in surface ocean waters, but there is little immediate effect on either chlorophyll production or bacterial activity, due to otherwise low nutrient levels. A more important consequence of this dust deposition is the resupply of dissolved nitrate to nitrate-depleted waters. Ratios of Fe/P, Fe/N and N/P are all much higher than the ‘biological’ (Redfield) ratio in surface waters around Cape Verde as a result, with important implications for marine diazotroph productivity and nitrogen fixation.
Figure 2. (a) The seasonal cycle of monthlymean formaldehyde (HCHO) columns retrieved from the GOME and SCIAMACHY satellites over the Amazon rainforest. The wet, transition, and dry seasons are denoted by dark blue, light blue, and yellow regions, respectively. The simulated HCHO background (for 2000), from the oxidation of nonisoprene species is shown in grey indicating that the two seasonal maxima in HCHO are due to isoprene emissions. This is reinforced by more limited groundbased measurements taken during (b) the AMazonian Aerosol characteriZation Experiment (AMAZE), and during (c) the TROpical Forest and Fire Emission Experiment (TROFFEE). Reproduced with permission from Barkley et al. (2009) and references therein.
Biogenic sources and impacts (Chaired by Peter Liss, University of East Anglia, UK)
IGACtivities3
dynamics, which was largely dictated by the nature of the underlying surface, e.g. descending air over cooler vegetated surfaces versus enhanced convective uplift and mixing over dry bare soil. This is an important consideration in modelling the transport of BVOC emissions out of the boundary layer, their lifetimes, and their subsequent transport.
Gas phase and aerosol processes in the tropical troposphere (Chaired by Rob MacKenzie, Lancaster University, UK)Lucy Carpenter (York University, UK) outlined the impacts that halogenated gases (primarily brominated and iodinated species) emitted by the sea surface can have on the chemistry of the overlying atmosphere in terms of ozone, radical chemistry, and new particle production. Studies on Cape Verde in the tropical North Atlantic show that apparent ozone loss rates are underestimated by a factor of two, but they are reconciled when bromine and iodine chemistry are included. The origins of these halogens are less clear. Measured BrO concentrations may largely originate from volatilisation of bromine from sea salt aerosol. In contrast, dihalomethanes (notably diiodomethane and chloroiodomethane) appear to dominate the production of atmospheric reactive iodine, yet still fall short of observed IO abundances, perhaps due to direct photochemical production of molecular iodine at the sea surface. The conclusion is that modelling of tropospheric ozone and oxidation cycles over remote tropical oceans requires halogen chemistry to be incorporated.The potential impact of converting rain forest to oil palm plantation on regional atmospheric composition was discussed by Nick Hewitt (Lancaster University, UK) in the context of the recent OP3 campaigns, based in and around Danum Valley in Sabah (Malaysian Borneo). The important BVOC isoprene, and some of its atmospheric oxidation products, were found to be considerably elevated on aircraft flights over the plantations when
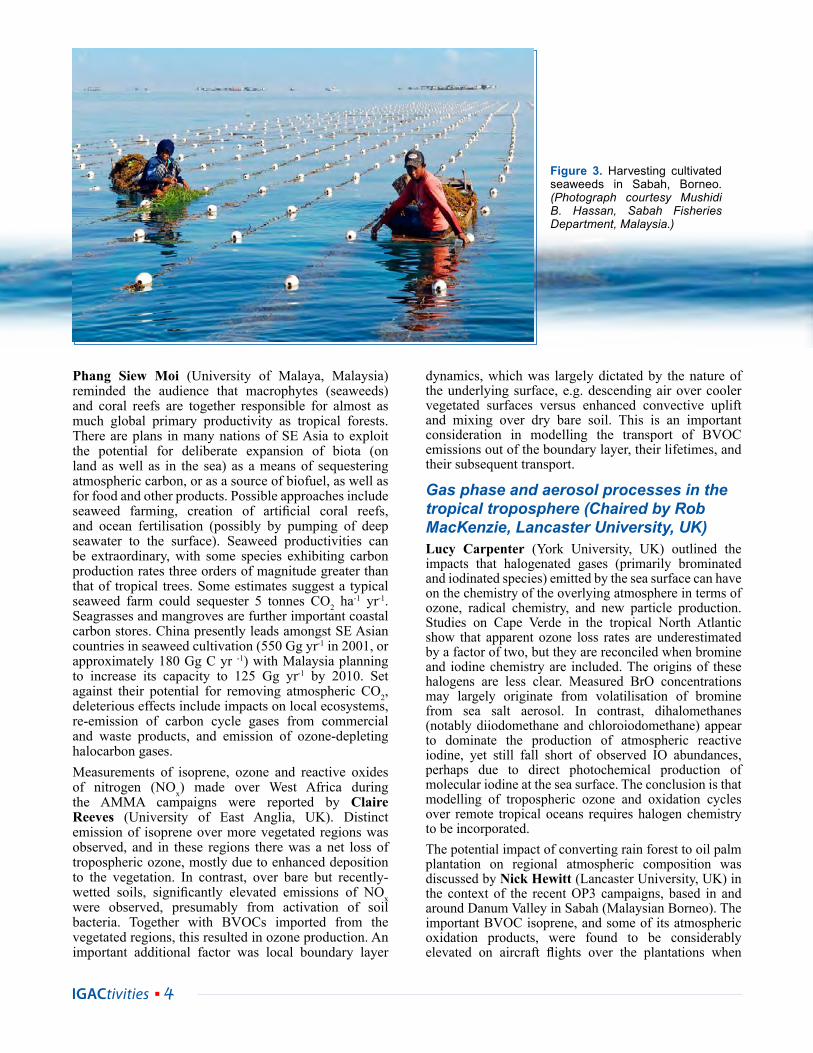
Phang Siew Moi (University of Malaya, Malaysia) reminded the audience that macrophytes (seaweeds) and coral reefs are together responsible for almost as much global primary productivity as tropical forests. There are plans in many nations of SE Asia to exploit the potential for deliberate expansion of biota (on land as well as in the sea) as a means of sequestering atmospheric carbon, or as a source of biofuel, as well as for food and other products. Possible approaches include seaweed farming, creation of artificial coral reefs, and ocean fertilisation (possibly by pumping of deep seawater to the surface). Seaweed productivities can be extraordinary, with some species exhibiting carbon production rates three orders of magnitude greater than that of tropical trees. Some estimates suggest a typical seaweed farm could sequester 5 tonnes CO2 ha-1 yr-1. Seagrasses and mangroves are further important coastal carbon stores. China presently leads amongst SE Asian countries in seaweed cultivation (550 Gg yr-1 in 2001, or approximately 180 Gg C yr -1) with Malaysia planning to increase its capacity to 125 Gg yr-1 by 2010. Set against their potential for removing atmospheric CO2, deleterious effects include impacts on local ecosystems, re-emission of carbon cycle gases from commercial and waste products, and emission of ozone-depleting halocarbon gases.Measurements of isoprene, ozone and reactive oxides of nitrogen (NOx) made over West Africa during the AMMA campaigns were reported by Claire Reeves (University of East Anglia, UK). Distinct emission of isoprene over more vegetated regions was observed, and in these regions there was a net loss of tropospheric ozone, mostly due to enhanced deposition to the vegetation. In contrast, over bare but recently-wetted soils, significantly elevated emissions of NOx were observed, presumably from activation of soil bacteria. Together with BVOCs imported from the vegetated regions, this resulted in ozone production. An important additional factor was local boundary layer
Figure 3. Harvesting cultivated seaweeds in Sabah, Borneo. (Photograph courtesy Mushidi B. Hassan, Sabah Fisheries Department, Malaysia.)
IGACtivities 4
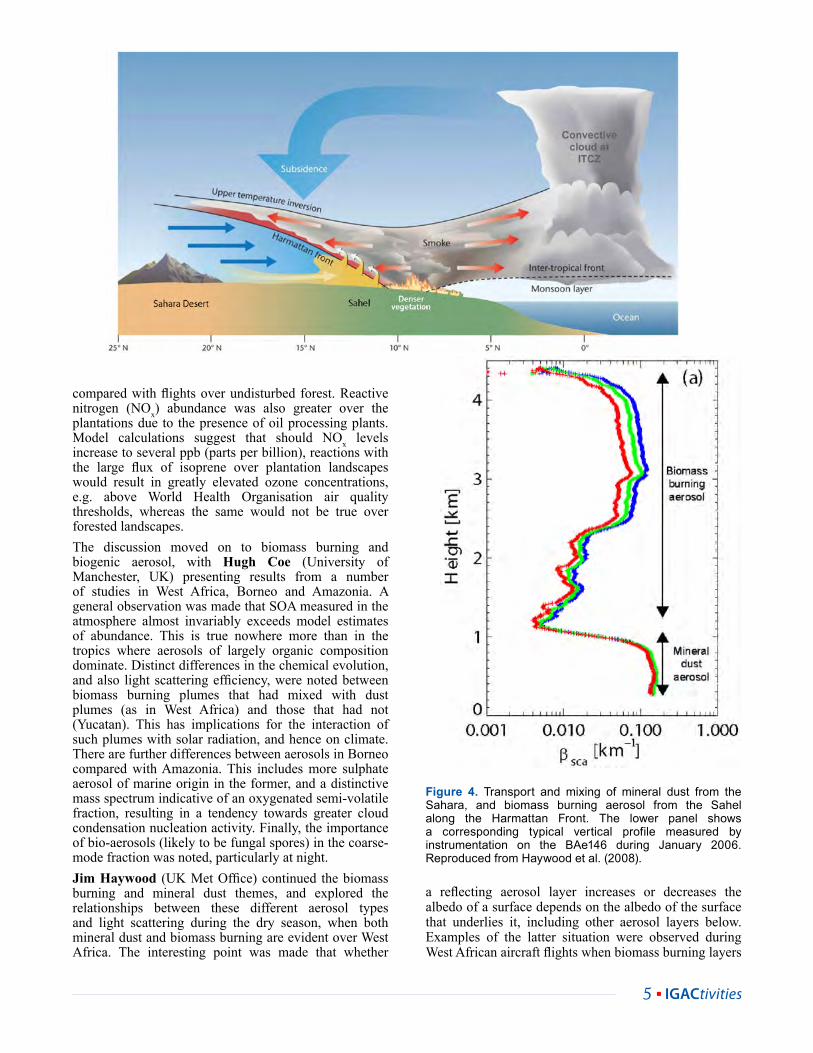
compared with flights over undisturbed forest. Reactive nitrogen (NOx) abundance was also greater over the plantations due to the presence of oil processing plants. Model calculations suggest that should NOx levels increase to several ppb (parts per billion), reactions with the large flux of isoprene over plantation landscapes would result in greatly elevated ozone concentrations, e.g. above World Health Organisation air quality thresholds, whereas the same would not be true over forested landscapes.The discussion moved on to biomass burning and biogenic aerosol, with Hugh Coe (University of Manchester, UK) presenting results from a number of studies in West Africa, Borneo and Amazonia. A general observation was made that SOA measured in the atmosphere almost invariably exceeds model estimates of abundance. This is true nowhere more than in the tropics where aerosols of largely organic composition dominate. Distinct differences in the chemical evolution, and also light scattering efficiency, were noted between biomass burning plumes that had mixed with dust plumes (as in West Africa) and those that had not (Yucatan). This has implications for the interaction of such plumes with solar radiation, and hence on climate. There are further differences between aerosols in Borneo compared with Amazonia. This includes more sulphate aerosol of marine origin in the former, and a distinctive mass spectrum indicative of an oxygenated semi-volatile fraction, resulting in a tendency towards greater cloud condensation nucleation activity. Finally, the importance of bio-aerosols (likely to be fungal spores) in the coarse-mode fraction was noted, particularly at night.Jim Haywood (UK Met Office) continued the biomass burning and mineral dust themes, and explored the relationships between these different aerosol types and light scattering during the dry season, when both mineral dust and biomass burning are evident over West Africa. The interesting point was made that whether
a reflecting aerosol layer increases or decreases the albedo of a surface depends on the albedo of the surface that underlies it, including other aerosol layers below. Examples of the latter situation were observed during West African aircraft flights when biomass burning layers
Figure 4. Transport and mixing of mineral dust from the Sahara, and biomass burning aerosol from the Sahel along the Harmattan Front. The lower panel shows a corresponding typical vertical profile measured by instrumentation on the BAe146 during January 2006. Reproduced from Haywood et al. (2008).
IGACtivities5

were observed at relatively high altitude, while mineral dust layers occurred closer to the ground. To a first order, global models such as the Met Office Unified Model simulate the relative vertical position of these aerosol layers adequately, and therefore the radiative impacts are relatively well modelled. Other issues, however, are less well-addressed. The formation of organic deposits on mineral dust might lead to very different scattering and absorption properties of the composite internally mixed aerosol. The question was then posed whether observed increases in above ground biomass (AGB) production in tropical forests is solely attributable to CO2 ‘fertilisation’, or whether there is a contribution to this effect from increased diffuse radiation as a result of the year-on-year increase in aerosol optical depth. Some studies have shown an optimum diffuse radiation fraction of about 40% for maximum gross primary productivity. Such relationships deserve further exploration.
Transport and chemical processes in the mid and upper troposphere and lower stratosphere (Chaired by Klaus Pfeilsticker, University of Heidelberg, Germany)John Pyle (University of Cambridge, UK) overviewed the present state of knowledge on the chemistry and dynamics of the tropical tropopause layer (TTL), this being the predominant region for chemical species to enter the stratosphere. Evidence suggests that tropical SE Asia is a potential ‘hot-spot’ for injection of short-lived source gas emissions in to the TTL. One current issue is the extent to which changes in circulation and abundance of source gases may influence future ozone concentrations. One model run, with a constant bromine flux from the surface, predicted an 8% loss of ozone in the upper troposphere/lower stratosphere (UTLS) region solely as a result of enhanced transport of the source gases. Models, however, differ in their ability to simulate transport of short-lived gases from the surface to the TTL. The high resolution UM model showed that only tracers released above 5 km made a significant contribution to concentrations at 15 km. In contrast a high resolution run of p-TOMCAT predicted bromoform concentrations of up to 2 ppt at 13 km altitude over Indonesia associated with high coastal concentrations in the same region. Further uncertainties exist regarding transport times and pathways out of the TTL. Transport can be by ascent in to the tropical stratosphere, or via quasi-isentropic exchange to the extratropical lowermost stratosphere. In all cases transport in not homogenous, but varies substantially both longitudinally and with season. Average TTL ascent times, for instance, may vary from one or two days to two weeks depending on location.The same issue of surface-to-TTL transport was considered by Geraint Vaughan (University of Manchester, UK) using distributions of ozone from ozonsonde and aircraft flights over Darwin, Australia in the Indo-Pacific warm pool. A recurring observation was large ozone variability within the TTL whilst profiles below 5 km remained entirely uniform and did not reach the lower abundances observed in the TTL, suggesting transport of ozone-depleted surface air to the TTL from
locations geographically remote from the point of measurement. In other studies high CO from biomass burning in Indonesia acted as a tracer of transport, with concentrations consistent with transport to the TTL from burning plumes in the mid-troposphere, and not from the immediately underlying surface. In conclusion the composition of the TTL in this particular region appeared to be determined by vertical mixing in certain hot spot regions, with advection from these regions dominating the composition elsewhere.Considering the issue of transport in a different tropical location, Celine Mari (Centre National de la Recherche Scientifique, France) discussed transport to the TTL over continental West Africa during the AMMA campaigns. A large seasonal cycle in ozone above 16 km was observed, with much higher concentrations during June to October, which correlated with a warmer, lower altitude tropopause. This is consistent with either larger zonal mean tropical upwelling, or increased deep convective outflow. The actual explanation appears to be complex and likely a mixture of the two. At 120 hPa, for example, there was evidence of Asian pollution transported to Africa by the tropical easterly jet, while at 220 hPa the CO signature originated in convective uplift of biomass burning plumes from southern hemispheric burning. Aircraft flights into the outflow regions of large mesoscale convective systems (MCSs), on the other hand, displayed clear evidence of rapid uplift of boundary layer air, and also ozone production over the course of about one to three days in the ageing air from this outflow. NOx from lightning would have been an important component of this ozone production. There was evidence of ‘convective overshooting’ from fast convective events, and this may help explain summer moistening of the summertime lower stratosphere through sublimation of ice crystals injected across the tropopause by these ‘ice geysers’. The implication of this mechanism for transport of other gases to the stratosphere is not clear.Neil Harris (University of Cambridge, UK) turned to the issue of how available short-lived brominated gases might be in the tropical boundary layer, and what evidence exists in actual measurements for their contribution to stratospheric bromine loading. Recent in situ measurements and modelling of organohalogens at coastal and inland sites in Borneo have been revealing. Concentrations of bromoform were episodically large (>40 ppt, parts per trillion) and highly variable at the coast but much lower and uniform at the inland forest site (Danum Valley), whereas dibromomethane was much less variable and more comparable at both locations. This suggests a strong coastal influence on the former, but an open ocean source for the latter. Aircraft and balloon measurements collectively indicate high concentrations of both gases in the marine boundary layer (up to 20 ppt of bromine), then a sharp drop-off above the marine boundary layer, to about 4 ppt Br at 12 km, and about 2 ppt Br in the TTL (with higher concentrations above the ‘Hector’ deep convective system over Darwin, Australia). There is, therefore, irrefutable evidence for injection of short-lived organohalogens in to the stratosphere.
IGACtivities 6
DiscussionDiscussion on the many topics presented during the day centred around three key areas of uncertainty.
• First, data on emissions rates of chemical substances in to the atmosphere are exceedingly sparse in this region of the globe. There is enormous diversity in terms of ecoregions and changing land uses patterns. Tropical regions have been considerably understudied in the past compared with mid-latitude regions, not least due to the difficulties of conducting measurements in remote and challenging conditions. Even more problematic is the near absence of continuous year-round measurements; recent studies have clearly demonstrated substantial seasonal variations in emission rates. Studies on individual plant species also present significant problems in upscaling to regional and hemispheric impacts. Complementary studies based on long term flux measurements, and long range aircraft campaigns, are required to characterise emissions from representative regions. Likewise, in the ocean there is immense variability in emission rates according to species and season, obscuring any simple relationships between, for example, remotely sensed ocean colour and air-sea fluxes. Understanding of emissions from coastal zones is evidently a key factor for some important gases, but such understanding is almost non-existent for the tropics.
• The second general area of uncertainty is how substances emitted to (or formed in) the atmosphere are subsequently transported. There have been a number of ‘surprises’, such as observations of biomass burning emissions and ozone-depleted marine boundary layer air which were transported thousands of kilometres to the upper troposphere and TTL. There are marked disagreements between models of such transport. Overall we are still far from quantifying the relative importance of advection versus deep convection, nor do we understand the relative importance of different mechanisms of transport out of the TTL and in to the stratosphere. Closer to the ground many uncertainties also persist regarding ventilation of the boundary layer in to the free troposphere, and how this may relate to more localised surface conditions.
• Third, there is a growing body of evidence on the importance of chemical and physical transformation processes within the atmosphere but many unanswered questions remain. For example, how to explain the ‘missing’ source of reactive iodine in the remote marine boundary layer and hence the implications for oxidation cycles there? What processes determine the interaction of biomass burning gases and aerosols to form complex mixtures on mineral dust aerosol, and what are the consequent effects on radiative forcing (with even the resulting sign of the forcing being uncertain)?
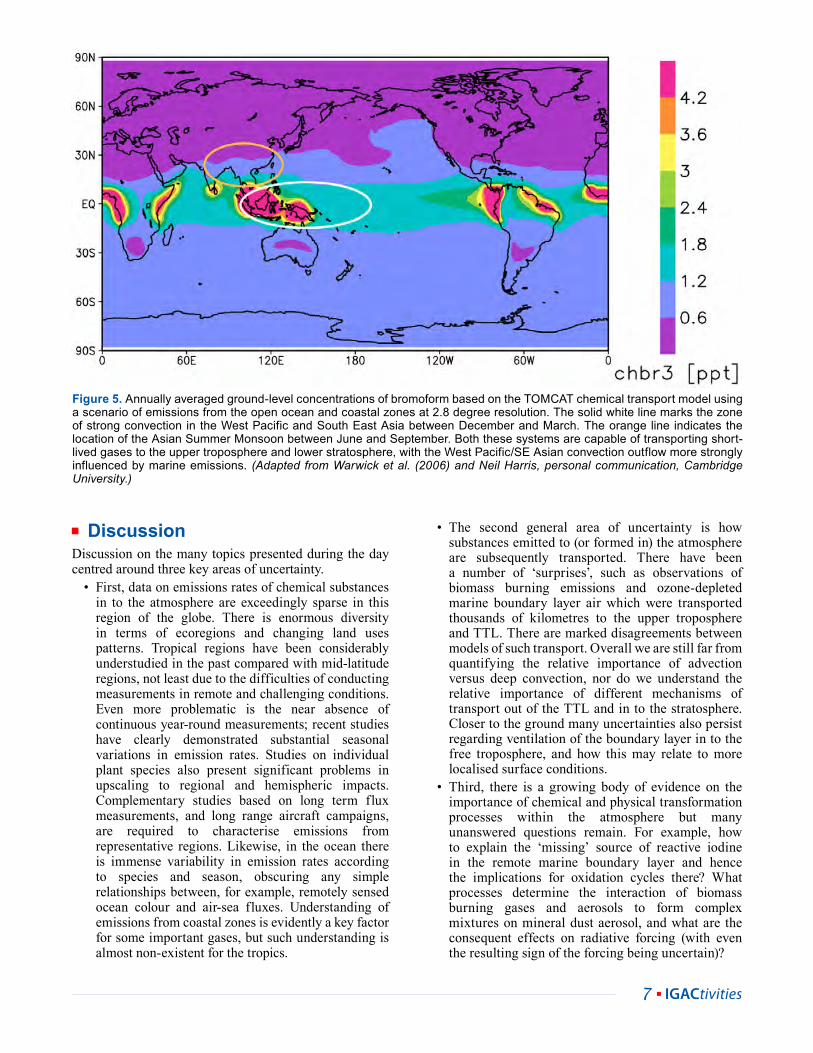
Figure 5. Annually averaged groundlevel concentrations of bromoform based on the TOMCAT chemical transport model using a scenario of emissions from the open ocean and coastal zones at 2.8 degree resolution. The solid white line marks the zone of strong convection in the West Pacific and South East Asia between December and March. The orange line indicates the location of the Asian Summer Monsoon between June and September. Both these systems are capable of transporting shortlived gases to the upper troposphere and lower stratosphere, with the West Pacific/SE Asian convection outflow more strongly influenced by marine emissions. (Adapted from Warwick et al. (2006) and Neil Harris, personal communication, Cambridge University.)
IGACtivities7

AcknowledgmentsThe meeting organisers are sincerely grateful to the Royal Society, and to the Natural Environment Research Council (International Office), for their generosity in financially supporting this meeting.
ReferencesBarkley, M. P., P.I. Palmer, I. De Smedt, T. Karl, A. Guenther, and
M. Van Roozendael, Regulated large-scale annual shutdown of Amazonian isoprene emissions?, J. Geophys. Res, 36, doi:10.1029/2008GL036843, 2009.
Haywood, J.M. et al, Overview of the African Multidisciplinary Monsoon Analysis Special Observational Period-0 and the Dust and Biomass burning Experiment, J. Geophys. Res, 113, doi:10.1029/2008JD01007, 2008.
Warwick, N.J., J.A. Pyle, G.D. Carver, X. Yang, N.H. Savage, F.M. O’Connor, and R.A. Cox, Global modeling of biogenic bromocarbons, J. Geophys. Res, 111, doi:10.1029/2006JD007264, 2006.
• Finally there are many unknowns regarding system responses to a warmer and higher CO2 world. Changing circulation alone could enhance the transport of substances within the atmosphere via convection, and via enhanced TTL transport, with implications for UTLS ozone. Changes in temperature, CO2, and diffuse solar radiation may lead to distinct, complex – and in some cases quite surprising – feedbacks, via changes in primary productivity and emission factors. In addition to uncertainties around the impacts of climate change, the impacts of future cultivation practices on land and in the ocean to emissions in the tropical regions are currently unknown.
It is inevitable that in the next few decades there will be a considerable increase in efforts to sequester carbon, and produce biofuel, both on land and in the sea, and notably in the tropics. Studies to date have shown the potential for such practices to have both positive and negative environmental consequences. The challenge now is to attempt to characterise and quantify these impacts, to better enable a sustainable development of these important economic and carbon offsetting activities.
Understanding the processes involved in biomass burningContributed by Johannes W. Kaiser ([email protected]) ECMWF, Shinfield Park, Reading RG2 9AX, United Kingdom, Martin G. Schultz ([email protected]) Forschungszentrum Jülich,52425 Jülich, Germany, and Martin J. Wooster ([email protected]) King’s College London, London WC2R 2LS, U.K.
Smoke from vegetation fires constitutes a major source of important trace gases and aerosol particles that greatly influence the composition and functioning of the atmosphere and impacts human health and security (cf. Bowmann et al. 2009, Science, 324, 481-484). Recent advances in the space-based observation of open vegetation fires provide the potential for great innovation in quantifying fire emissions and other effects. New sensors and retrieval techniques open novel opportunities to derive more accurate information on fire occurrence, behaviour, severity and impacts. At the same time, fire and atmospheric modelling capabilities have greatly improved on scales from chemical reactions to global long-range transport. The EU’s GEMS project and its successor MACC (Monitoring of the Atmospheric Composition and Climate), both coordinated by ECMWF, use fire radiative power observations to derive emission fluxes that constitute essential boundary conditions for the atmospheric composition model (see articles in ECMWF Newsletters No. 106, 17–20, No. 114, 15-17,
No. 116, 20-24 and No. 119, 9-15, available at http://www.ecmwf.int/publications/newsletters/). During the data assimilation step, the model is combined with satellite-based observations of several smoke constituents to refine and constrain the representation of the atmospheric fields, including the smoke plumes. The subsequent forecasts can thus provide quantitative information that is suitable for environmental and health services as guidance related to air quality. Other services generate guidance related to fire spread for emergency services. Furthermore, climate models now include more detailed vegetation models and their interactions with fire regimes.In order to improve the collaboration between the very diverse disciplines dealing with biomass burning, the European Science Foundation (ESF) funded the Exploratory Workshop ‘Improved Quantitative Fire Description with Multi-Species Inversions of Observed Plumes’ under its Standing Committee for Life, Earth and Environmental Sciences (LESC). The workshop was held in Farnham Castle, UK, on 14–16
IGACtivities 8

September 2009 and brought together 24 scientists from nine European countries plus Brazil and the United States. The discussions explored opportunities for a better quantitative understanding of the processes involved in biomass burning and searched new and innovative ways to exploit the recent developments in remote sensing, modelling and data assimilation. The most pertinent research questions during the discussions are outlined in the box.
It became clear that research on wildfires has become increasingly fragmented since the 1990s because of the diversity of scientifically productive approaches to the problem. All participants agreed that a closer inter-disciplinary collaboration now bears great potential for their individual research. There was a broad consensus that such collaboration would lead to improved quantitative air quality forecasts, assessments of global air pollution transport patterns, climate change observations, climate change predictions, and guidance for managing large-scale fire situations. Key contributions to these improvements would come from the following.
• The quantification of the rela-tionships between emission factors and physical parameters that are available from remote sensing or provided from oper ational systems with data assi m ilation (e.g. humidity, ac cumulated precipitation, wind, spec tral characteristics of fire ob servations, topography and veg-etation characteristics).
• The derivation of estimates for other fire parameters (fuel con sumption, fire spread, fire in tensity and change in veg etation on longer time scales) from remote sensing data and numerical weather prediction models.
• A better integration of bio geo-chemical fire science with soc io-economic research and in vestigation of the role of driving parameters such as population density, GDP, land ownership structures and the use of wildfires as a landscape management tool.
Some key research issues concerning biomass burning• There appears to be a major discrepancy between the pyrogenic
emissions estimated with bottom up models, which calculate emissions by simulating the combustion of vegetation, and top down approaches which use inversions based on retrievals of satellite observations of atmospheric components (mainly CO).
• There is a discrepancy between the emission factors (relating species emission and biomass combustion rates) derived in the laboratory or observed in-situ (e.g. air-borne measurements) and those inferred from satellite observations for several species (e.g. aerosols). Furthermore, the chemical and microphysical evolution of the smoke on the 15–30 minutes to 1 day scale has not been fully understood yet.
• There is a need to disentangle fire emissions from similar emissions from other sources, for example the observed seasonal cycle of smoke is additionally shaped by biofuel emissions.
• Combustion efficiency is a key uncertainty in emission estimates.
• Generally, a more systematic approach is needed to tie fire satellite observations, which generally miss small fires and cannot observe biomass combustion in closed systems, with emission inventory estimates, which often rely on incomplete statistical data and generally neglect fires of natural origin.
• Given that the accuracy of single-species flux inversions are still being characterised, the general view was that multi-species inversions are too challenging in the current situation. An additional complication in CO2 inversions is introduced by the large diurnal cycle of CO2 in the boundary layer.
“Understanding the processes involved in biomass burning” workshop participants were (left to right): Charles ICHOKU, Marta García VIVANCO, Solène TURQUETY, Johann G. GOLDAMMER, Albert SIMEONI, Martin SCHULTZ, Guido VAN DER WERF, Martin WOOSTER, Joana SOARES, Ronan PAUGAM, Veiko LEHSTEN, Ilaria PALUMBO, Jörg TRENTMANN, Meinrat O. ANDREAE, Jesús SANMIGUELAYANZ, Johannes KAISER, José Miguel PEREIRA, and Frederic CHEVALLIER. Missing from the photo are: Paavo PELKONEN, Patricia DE ROSNAY, Saulo FREITAS, Jim HAYWOOD, Edward HYER, and Adrian SIMMONS. Photo credit: Adrian Simmons.
IGACtivities9
Chinese national standard for Grade II) reached 46%. Obviously Beijing’s particle pollution has been gradually improving. Even so, the fine particles (PM2.5) dominate in PM10 with the ratio of PM2.5/PM10 between 30-70%. Therefore, fine particles have become a major focus of air quality control measures. Notably, the high ratios of PM2.5/PM10 are generally ascribed to secondary particulate formation of species such as nitrate, sulfate, ammonium, and organics.
Organic matter and secondary inorganic ions: major contributors to fine particlesParticulate chemical composition reflects its sources or origins and affects its environmental and health effects. Figure 1 summarizes the relative contributions to fine particle mass of major chemical components (OM, EC, SO4
2-, NO3-, and NH4
+) as well as how this partitioning has varied in the last 10 years. The sum of sulfate, nitrate and ammonium (“SNA”) accounts for a large percentage of PM2.5, especially in summer and autumn, due to strong secondary aerosol formation. High temperatures in summer cause NH4NO3 (s) to dissociate to HNO3 (g) and NH3 (g), resulting in low NO3
- concentrations relative to
Dominance of PM10, especially fine particles, in Beijing air pollutionAs the capital of China and a major mega city, Beijing has been experiencing great changes the last few years. Beijing (39°54′N, 116°23′E) lies in the Northern China Plain. There are mountains in the west, north and northeast. Beijing has a typical semi-humid, warm, temperate, continental monsoon climate. It is hot and rainy in summer and cold and dry in winter. In 1994 the resident population in Beijing was 11.3 million, increasing to 16.9 million by 2008. With this growth has come increasing concern about air quality in the Beijing region.Particulate pollution has been the major air pollutant in Beijing for about 85% of days in the last 5 years (Beijing Environmental Bulletin, 2004-2008), despite the fact that a total of 15 stages of new control measures for air pollution have been put in place since 1998, with further enhanced controls in place for the 2008 Olympic Games. In 2008, the percentage of heavily polluted days (daily average PM10 concentrations above 150 mg/m3; Chinese national standard for Grade III) decreased from 39.3% to 26%, and the number of days with PM10 concentrations less than 100 mg/m3 (daily average PM10 concentration,
Particle pollution in Beijing: features, source and secondary formationContributed by Min Hu ([email protected]) and Song Guo, State Key Joint Laboratory of Environmental Simulation and Pollution Control, College of Environmental Sciences and Engineering, Peking University, Beijing 100871, China
The participants agreed that a co ordinated and funded research net work is needed to establish the nec -essary inter-disciplinary col lab oration in Europe, and in creasingly beyond. Such a network could build on the previous achievements of field experiments during the 1990s, most of which were coordinated in the BIBEX programme, and more recent research in several European, international and national projects. Coordinated activities should lead to interdisciplinary laboratory measurements and field campaigns integrating ground-based and airborne observations as well as detailed analyses of satellite data and numerical modelling results. Opportunities exist in Europe and elsewhere to organize field campaigns around prescribed burns as well as exploiting situations with very high likelihood of wildfire occurrence. Different fire regimes will need to be sampled with small experiments and up-scaling to satellite-based remote sensing and the global scale will require additional large experiments. The ultimate goal would be to establish a worldwide collaboration with field
experiments on different continents. Coordination is also needed to integrate the results from the laboratory and field studies into numerical systems for forecasting and monitoring atmospheric composition and land surface properties and to further improve the parameterisations for fire emissions applied in these systems. The final Scientific Report and all presentations are publicly available at:http://www.ecmwf.int/newsevents/meetings/workshops/2009/ESF.The workshop proceedings will be published in the MACC project report series. Following the workshop, the participants and further colleagues have prepared and submitted a joint proposal for an ESF Research Network for the collaborative exploitation of fire experiments and model improvements as outlined above.This article was adapted from ECMWF Newsletter No. 122.
IGACtivities 10

results point to the fact that in order to reduce particle pollution it’s necessary to investigate the sources of primary organic aerosol and the precursor sources and formation processes for secondary organic aerosol.
The features of carbonaceous aerosolOC and EC concentrationsCarbonaceous aerosol constitutes a significant fraction of fine particle matter (PM2.5) in the atmosphere (Turpin et al., 1991; Lim and Turpin, 2002), and has been proven to have a large impact on visibility degradation (Malm et al., 1994), climate change (Hansen et al., 2005) and human health (Mauderly and Chow, 2008).Compared with other cities in the world, OC and EC concentrations in the PM2.5 aerosol of Beijing are still quite high (see Figure 2). For example during the period from winter 2006 to fall 2007, the OC concentrations for PM2.5 aerosol were 20±19 mgC/m3 (mean ± standard deviation) in winter, 12±7 mgC/m3 in spring, 10±5 mgC/m3 in summer, and 18±11 mgC/m3 in autumn, respectively. Correspondingly, EC concentrations
the SO42- concentration.
Secondary pollutants play a particularly large role on polluted days. Both the SNA/EC ratio and the percentage of SNA show a clear increase along with a rise in concentration. In contrast, the percentage of EC in PM2.5 is much lower on polluted days than on clean days. During one polluted episode in autumn 2007, with stagnant meteorological conditions (low wind speed and high humidity), the increase in SNA reached 80 mg/m3 per day, which accounts for more than 60% of the total observed increase in PM2.5 , and the percentage of PM2.5 accounted for by SNA increased from 20% to 60% (Yue et al., 2009).Organic matter (OM) is also an important component of PM2.5, accounting for an average of 40-50% of fine particles before 2006 and 30% after that. OM contributions were comparable to the sum of the three major secondary inorganic species (sulfate, nitrate, and ammonium). The seasonal average percentage of OM in PM2.5 varied from 18% to 33%, comprising the highest fraction in winter due to increased emissions from coal combustion for heating, low atmospheric temperatures, and the presence of atmospheric inversion layers. These
Figure 1. Percentage of major chemical constituents in PM2.5 in Beijing 19992008. Besides our data, data for 1999 are from He et al., 2001; data for 2002 are from Dan et al., 2004, Duan, F. K., 2005.
Figure 2. OC and EC concentrations and OC/EC ratios in Beijing and other cities in the world
IGACtivities11

were 6.6±6.4 mgC/m3 in winter, 5.2±4.4 mgC/m3 in spring, 5.4±3.4 mgC/m3 in summer, and 8.7±5.6 mgC/m3 in autumn. Both showed a seasonal variation in concentration, C, where Csummer<Cspring<Cautumn <Cwinter. The mean OC/EC ratios were 3.3 ± 0.8, 2.6 ± 1.1, 2.2 ± 1.1 and 2.2 ± 1.1 in winter, spring, summer, and autumn. The higher OC/EC ratio indicates the source properties are quite different from those of other cities. The highest OC concentrations and OC/EC ratios in winter were mainly due to the intense emission of OC from coal burning during the heating period (Lin et al., 2009).
Particulate organic compounds in the urban atmosphereBecause of the severe organic aerosol pollution in Beijing, it is important to conduct detailed and systematic organic speciation for the purpose of source identification and pollution control. Two entire years of continuous PM2.5 samples were collected in Beijing in 2001-2003 to investigate the seasonal variation in atmospheric organic compounds (He et al., 2006; Huang et al., 2006). Over 100 individual organic compounds were identified and quantified with n-alkanes, PAHs, fatty acids, dicarboxylic
acids, and hopanes comprising the major compound classes. The sum of the concentrations of all analyzed compounds ranged from 225 to 2100 ng/m3 during the whole year. Figure 3 shows the molecular distribution of n-alkanes and PAHs in PM2.5. All the alkanes showed strong seasonal variation (maximum in winter, with an avg. 477 ng/m3 and minimum in summer with an avg. 39 ng/m3). In summer, prominent n-alkanes with higher carbon numbers and a strong predominance of organics with odd carbon number indicated biogenic sources. The overwhelming contribution from n-alkanes with lower carbon numbers and no carbon number predominance in winter indicates a fossil fuel combustion source. The n-alkane constituents and PAHs were highly correlated with the fossil fuel combustion tracers, hopanes, (hopanes vs. alkane, R2=0.92; hopanes vs. PAHs, R2= 0.84), also indicated the source was also predominantly fossil fuel combustion. The compounds related to fossil fuel combustion exhibited more characteristics of vehicle emissions in summer, while high emissions from coal combustion for residential heating elevated the alkane and PAH concentrations in winter. Overall, coal combustion and cooking emissions in Beijing are unique.
Figure 3. Molecular distribution of nalkanes and PAHs in PM2.5
Figure 4. Scatter plot of OC and EC concentrations in the daytime and nighttime of summer. Color bars indicate the time in the day (023hr) when the data observed.
IGACtivities 12

estimation method used in this study.Using the method above, SOC concentrations were estimated to contribute 19%, 27%, 45%, and 23% of the total OC in winter, spring, summer and autumn, respectively. SOC contributions are the highest in summer, with concentrations comparable to that of primary organic carbon. SOC can also account for about one quarter of the total OC in spring and autumn, with the lowest contribution in winter due to low formation rates and an increase in primary emissions. However, this method underestimates SOC, and large uncertainties still exist in the estimation. More improvements are needed in the future work.
Source apportionment of PM2.5Receptor models are recommended by the U.S. EPA for source apportionment of ambient particles, primarily through use of a chemical mass balance model (CMB) and through positive matrix factorization model (PMF) (Schauer et al., 1996; Jeffrey et al., 2007). Both CMB (Zheng et al., 2005) and PMF (Song et al., 2006) were used to apportion the sources contributing to fine particles in Beijing. The outcome of both analyses, shown in Figure 6, highlight the fact that the sources of the PM2.5 particles in Beijing are complex, but the main sources are dust (e.g.
As well as vehicle emissions, these three sources are important components of particle pollution in China.
Estimation and characteristics of SOC in BeijingDue to the importance of SOA in the oxidative atmosphere, SOC concentrations were estimated based on long-term EC/OC observation data using the EC-tracer method (Lim and Turpin, 2002). With this method, it is important to establish the ratio of primary aerosol OC to EC (OC/EC)pri. This ratio changes from day to night, so (OC/EC)pri should be determined separately. The primary OC/EC ratio was determined from a sub-set of the data: the lowest 10% of the daytime and the lowest 20% of the nighttime ambient OC/EC ratios were selected respectively. Major axis regression was calculated using the data in the sub-dataset, and the regression slope is considered to be (OC/EC)pri. Figure 4 shows a specific example of how to derive (OC/EC)pri using the data of summer 2006. The correlation coefficients in the day and night were both higher than 0.95. Thus, The (OC/EC)pri were 1.5 in the summer daytime and 1.0 in the summer nighttime. An episode of SOC and SNA variation is displayed in Figure 5. The good correspondence between SOC and SNA indicates the soundness of the SOC
Figure 5. The time series of SOC and SNA in PM2.5 during the CAREBeijing Campaign in 2006.
Figure 6. (a) Source contribution of ambient PM2.5 in Beijing (Song, et al., 2006, by PMF), (b) Seasonal trend in PM2.5 source contributions in Beijing (Zheng et al., 2005, by CMB)
IGACtivities13

Figure 7. Seasonal variations of NPF parameters.
IGACtivities 14

soil dust, road dust, construction dust and dust storms), secondary aerosol (secondary sulfate and nitrate), coal combustion, and vehicle emissions. Biomass burning is also an important source of fine particles, and sometimes (autumn and winter) its contribution is greater than that of soil and vehicle emissions. The sum of secondary sulfate and nitrate is the largest contributor to PM2.5, and together with secondary organic aerosol (SOA), secondary compounds compose the major fraction of particles in Beijing. In terms of primary sources, vehicle emissions are the most consistent contributor, accounting for 6%-7% of PM2.5. However, soil and coal combustion also contribute a significant fraction of primary particles but with a distinct seasonal variation. Coal combustion becomes important in autumn and winter, accounting for 10.2% and 15.7%, respectively, in the CMB analysis of the PM2.5 aerosol mass. PMF results attribute an even higher contribution of 19%. Various types of dust including soil dust, road dust, construction dust, as well as desert dust storms have a very large impact on Beijing aerosols in the spring, accounting for 36% of fine (PM2.5) particle mass. The influence of dust storms was regional and independent of the site locations.The results of source apportionment provide the scientific basis for PM2.5 pollution control in Beijing, informing what would be useful mitigation measures by the government. The contribution of secondary sulfates and secondary nitrates to PM2.5 could be addressed by changing the energy structure in Beijing from coal to natural gas and other clean energy, enabling control not only of primary PM2.5 emissions but also atmospheric SO2, the precursor of sulfate aerosol. Improving the quality of gasoline could have profound effects on the concentrations of NOx and VOCs, which are also transformed into secondary particulate matter. Although the composition and formation of SOA are not understood clearly, a reduction of primary emissions can effectively control the formation of SOA, mainly due to the reduction of oxides (such as O3) formation, as well as reducing the emissions of the precursors of secondary aerosols. In addition, watering and road washing would prevent dust from re-suspending into the air.
New particle formation (NPF)New particle formation (NPF) events, a very important path for secondary aerosol formation, have attracted much attention worldwide in the past few years. The previous idea that NPF events only happen under very clean conditions has been repeatedly dispelled, and we now know that they can also occur in very polluted regions. Indeed, they were also observed and investigated in our Beijing measurements.
Seasonal variations in important aspects of NPF eventsThe important characteristics of the NPF events observed between March 2004 and September 2008 are illustrated in Figure 7. NPF events typically started between 6:00am and 10:00am and ended between 12:00 (noon) and 18:00pm. They occurred after sunrise and ended before sunset, indicating their dependence on the photochemical
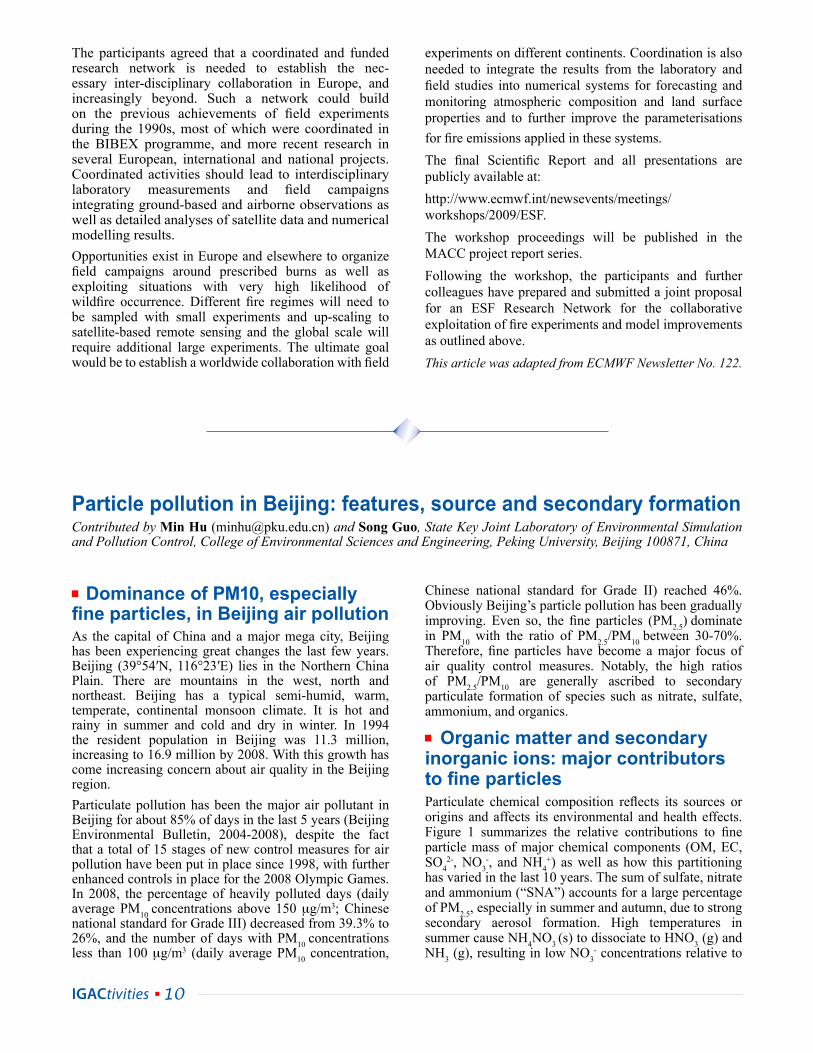
reactions in the atmosphere. On about 20% of the measurement days NPF events were observed. The NPF events occurred most frequently in spring, followed by winter and fall. The minimum number occurred in summer under frequent stagnant meteorological conditions with high temperature and high RH and slowly moving air masses coming from southern directions. During the other seasons the favorable conditions for NPF, such as sunny and dry days, were similar to those observed for other locations (Wu et al., 2007).The formation rates (FR) for NPF were observed to be high in spring and winter and low in summer. In contrast, the condensational sinks (CS) were high in summer but low in other seasons. This indicates that CS suppressed FR and is one of the key elements controlling whether NPF can occur. The ratio of coagulation loss rate to FR (FRcoag/FR) was as high as 60% on average, meaning that only 40% of the newly formed particles can survive in the atmosphere and coagulation plays an important role in NPF.Growth rates (GR) of NPF were observed to be higher in summer, similar to the condensable vapor concentration (C-vap) and vapor production rate (Q), as the condensable vapors are very important contributors to the growth of the freshly formed particles. The enhancement of photochemical and biological activities and the stagnant air masses preventing exchange with cleaner air lead to high Q, C-vap, and GR in summer in Beijing. Higher Q and CS during summertime were also observed by Dal Maso et al., (2005) based on eight years of data.
Growth of the freshly formed particles during NPF eventsOn twelve days between 6 July and 26 September 2008, NPF events and sulfuric acid were observed simultaneously. The GR and FR for these periods fall within the range observed for NPF events observed for the full summer data set from 2004 to 2008. The NPF events occurred with high sulfuric acid concentration, over 5×106 cm-3. The good correlation between sulfuric acid concentration and FR (R2=0.84) indicates that sulfuric acid plays an important role in the NPF events in Beijing. It was also reported that the mass size distributions of sulfate, ammonium, and oxalate shifted to smaller sizes on NPF event days compared with non-NPF event days, indicating the involvement of sulfuric acid, ammonia, and oxalic acid in NPF events (Yue et al., 2009).The observed growth rates during the NPF events and growth rates caused by condensation and neutralization of sulfuric (GRcond), intramodal coagulation (GRcoag,1), and extramodal coagulation (GRcoag,2) on different days during CAREBeijing 2008 are given in Figure 8. On the whole, GRcond, GRcoag,1, and GRcoag,2 account for 79±31% of the total observed growth rates, with GRcond/GR 45±18% and (GRcoag,1+GRcoag,2)/GR 34±17%. The contribution of intramodal and extramodal coagulation are comparable, with GRcoag,1/GR 19±12% and GRcoag,2/GR 15±7%. This means that not only are preexisting particles an important sink for the nucleation mode particles, i.e. by suppressing the existence of the freshly nucleated particles, but also
IGACtivities15
the high number concentration of the nucleation mode particles are a significant sink as well.
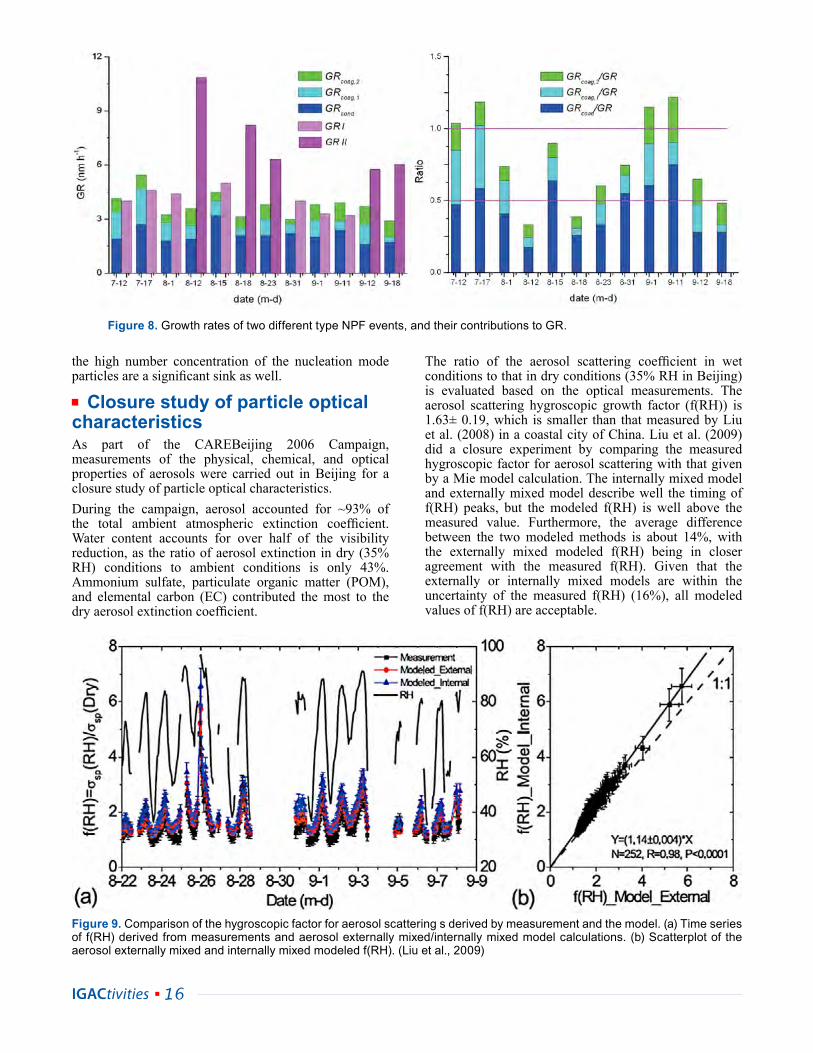
Closure study of particle optical characteristicsAs part of the CAREBeijing 2006 Campaign, measurements of the physical, chemical, and optical properties of aerosols were carried out in Beijing for a closure study of particle optical characteristics.During the campaign, aerosol accounted for ~93% of the total ambient atmospheric extinction coefficient. Water content accounts for over half of the visibility reduction, as the ratio of aerosol extinction in dry (35% RH) conditions to ambient conditions is only 43%. Ammonium sulfate, particulate organic matter (POM), and elemental carbon (EC) contributed the most to the dry aerosol extinction coefficient.
The ratio of the aerosol scattering coefficient in wet conditions to that in dry conditions (35% RH in Beijing) is evaluated based on the optical measurements. The aerosol scattering hygroscopic growth factor (f(RH)) is 1.63± 0.19, which is smaller than that measured by Liu et al. (2008) in a coastal city of China. Liu et al. (2009) did a closure experiment by comparing the measured hygroscopic factor for aerosol scattering with that given by a Mie model calculation. The internally mixed model and externally mixed model describe well the timing of f(RH) peaks, but the modeled f(RH) is well above the measured value. Furthermore, the average difference between the two modeled methods is about 14%, with the externally mixed modeled f(RH) being in closer agreement with the measured f(RH). Given that the externally or internally mixed models are within the uncertainty of the measured f(RH) (16%), all modeled values of f(RH) are acceptable.
Figure 8. Growth rates of two different type NPF events, and their contributions to GR.
Figure 9. Comparison of the hygroscopic factor for aer osol scattering s derived by measurement and the model. (a) Time series of f(RH) derived from measurements and aerosol externally mixed/internally mixed model cal culations. (b) Scatterplot of the aerosol externally mixed and internally mixed modeled f(RH). (Liu et al., 2009)
IGACtivities 16

Studies have indicated that aerosol light absorption can be enhanced if the aerosol particles are coated. According to Cheng et al. (2009), the process of a soot aerosol becoming coated can enhance its absorption and scattering coefficients by up to a factor of 8-10 within several hours owing to secondary processing during the daytime. The coating contributes to enhanced scattering and absorption not only by increasing the thickness of the coating shell but also by transitioning the soot from externally mixed to coated. Hence, assuming a constant soot mixing state in a regional climate model is not realistic and may lead to biases. Other complicating factors also need to be accounted for. For example, in the highly polluted region in northeastern China, the aerosol single scattering albedo may increase quickly owing to rapid secondary particle formation and condensation (up to 0.90-0.95). This increase took place even though the concurrent coating processing enhanced the light absorption capability of the soot.
ConclusionAlthough great effort has been made by Beijing’s government to mitigate atmospheric particulate pollution, PM10 levels are still over the target levels and have become the major air pollution problem in Beijing. Moreover, the presence of regional and secondary pollution has been recently recognized. Organic matter constitutes a major fraction of PM2.5 mass, and the difference in OC/EC ratios from other cities indicates a distinct source in Beijing. A two-year measurement of organic species and source apportionment by receptor models showed that coal combustion and cooking emissions are unique in Beijing. Coal combustion and vehicle emissions as well as various dusts are important sources for particle pollution in China. Secondary organic carbon comprises a major fraction of OC, with the highest contribution to total OC in summer (45%) and the lowest in winter (19%). However, because some uncertainties still exist, the contributions and formation mechanisms of secondary compounds will require intense investigation in the future. New particle formation events as a source of secondary aerosol are observed on about 20% of the days each year in Beijing, with the highest frequency in spring and lowest in summer. An optical closure study showed that a Mie model can acceptably reproduce the aerosol optical properties in Beijing. This study also highlights the importance of coatings on soot enhancing the aerosol absorption and scattering coefficients.
AcknowledgmentsThis work was supported by the National Basic Research Program (2002CB211605), from Ministry of Science & Technology, P. R. China, the National Natural Science Foundation of China (20420130348). The authors thank the science team of CAREBeijing field campaign, supported by Beijing Council of Science and Technology (HB200504-6, HB200504-2). Thanks to Prof. A. Wiedensohler’s group, Leibniz – Institut für Troposphärenforschung, Germany and Prof. Y. Kondo’s group, Research Center for Advanced Science and Technology, the University of Tokyo, Japan for their long
term cooperation. Thanks to Dingli Yue, Weiwei Hu, Jianfei Peng, Zhibin Wang, Qingfeng Guo’s contributions to this paper. Thanks to Prof. Tong Zhu, Min Shao, Yuanhang Zhang, and Xiaoyan Tang for constructive suggestions and comments.
ReferencesCheng, Y.F., M. Berghof, R.M. Garland, A. Wiedensohler, B.
Wehner, T. Mueller, H. Su, Y.H. Zhang, P. Achtert, A. Nowak, U. Poeschl, T. Zhu, M. Hu, L.M. Zeng, 2009, Influence of soot mixing state on aerosol light absorption and single scattering albedo during air mass aging at a polluted regional site in northeastern China, J. Geophys. Res., 114(D00).
Dal Maso, M., M. Kulmala, I. Riipinen, R. Wagner, T. Hussein, P.P. Aalto, K.E.J. Lehtinen, 2005, Formation and growth of fresh atmospheric aerosols: Eight years of aerosol size distribution data from SMEAR II, Hyytiala, Finland, Boreal Environ. Res., 10(5), 323– 336.
Dan, M., G. Zhuang, X. Li, H. Tao, Y. Zhuang, 2004, The characteristics of carbonaceous species and their sources in PM2.5 in Beijing, Atmos. Environ, 38, 3443-3452.
Duan, F.K., X.D. Liu, T. Yu, H. Cachier, 2004, Identification and estimate of biomass burning contribution to the urban aerosol organic carbon concentrations in Beijing, Atmos. Environ., 38(9), 1275-1282.
Hansen. J., M. Sato, R. Ruedy, L. Nazarenko, A. Lacis, G.A. Schmidt, G. Russell, I. Aleinov, M. Bauer, S. Bauer, N. Bell, B. Cairns, V. Canuto, M. Chandler, Y. Cheng, A. Del Genio, G. Faluvegi, E. Fleming, A. Friend, T. Hall, C. Jackman, M. Kelley, N. Kiang, D. Koch, J. Lean, J. Lerner, K. Lo, S. Menon, R. Miller, P. Minnis, T. Novakov, V. Oinas, Ja. Perlwitz, Ju. Perlwitz, D .Rind, A. Romanou, D. Shindell, P. Stone, S. Sun, N. Tausnev, D. Thresher, B. Wielicki, T. Wong, M. Yao, S. Zhang, 2005, Efficacy of climate forcings. J. Geophys. Res., 110, D18104.
He, K., F. Yang, Y. Ma, Q. Zhang, X.H. Yao, C.K. Chan, S. Cadle, T. Chan, P. Mulawa, 2001, The characteristics of PM2.5 in Beijing, China, Atmos. Environ., 35(29), 4959–4970.
He, L.Y., M. Hu, X.F. Huang, Y.H. Zhang, and X.Y. Tang, 2006, Seasonal pollution characteristics of organic compounds in atmospheric fine particles in Beijing, Sci. Total. Environ., 359, 167– 176.
Huang, X.F., L.Y. He, M. Hu, Y.H. Zhang, 2006, Annual variation of particulate organic compounds in PM2.5 in the urban atmosphere of Beijing, Atmos. Environ., 40, 2449–2458.
He, K., F. Yang, Y. Ma, Q. Zhang, X.H. Yao, C.K. Chan, S. Cadle, T. Chan, P. Mulawa, 2001, The characteristics of PM2.5 in Beijing, China, Atmos. Environ., 35(29), 4959–4970.
Jaeckels, J.M., M.-S. Bae, J.J. Schauer, 2007, Positive Matrix Factorization (PMF) Analysis of Molecular Marker Measurements to Quantify the Sources of Organic Aerosols, Environ. Sci. Technol., 41, 5763-5769.
Lim, H.-J. and B.J. Turpin, 2002, Origins of primary and secondary organic aerosol in Atlanta: Results of time-resolved measurements during the Atlanta supersite experiment, Environ. Sci. Technol., 36(21), 4489–4496.
Lin, P., M. Hu, Z. Deng, J. Slanina, S. Han, Y. Kondo, N. Takegawa, Y. Miyazaki, Y. Zhao, N. Sugimoto, 2009, Seasonal and diurnal variations of organic carbon in PM2.5
IGACtivities17

Beijing is located in an NMHCs-sensitive regime, and the observed O3 is formed locally through photochemical reactions. Reducing anthropogenic NMHCs will reduce the average and the maximum concentrations of ozone (Wang et al., 2002). In contrast, abatement of NOx emissions would not be effective towards reducing ozone concentrations (Chou et al., 2009). From 1998 to 2009, the Beijing municipal government implemented 15 rounds of air pollution control countermeasures (http://govfile.beijing.gov.cn), including both long-term and short-term measures. In fact, these measures are not solely for air quality improvement, but also oriented to increase energy efficiency and provide cleaner energy for upgrading city development. One of the core elements of these measures is vehicle emission control. Long-term policy plans are to adopt more stringent vehicle emission standards: the National Standards I, II, III, and IV (equivalent to Euro-I, II, III, IV) were adopted in 2000, 2002, 2005, and 2008, respectively. Short-term policies refer to brief temporal restrictions during specific time periods, e.g. traffic controls during the Sino-African Summit in 2006 and the Olympic and Paralympic Games in 2008.
in Beijing and the estimation of secondary organic carbon, J. Geophys. Res., 114, D00G11.
Liu, X., Y. Cheng, Y. Zhan, J. Jung, N. Sugimoto, S.-Y. Chang, Y.J. Kim, S. Fan, L. Zeng, 2008, Influences of relative humidity and particle chemical composition on aerosol scattering properties during the 2006 PRD campaign, Atmos. Environ., 42(7), 1525-1536.
Liu, X., Y. Zhang, J. Jung, J. Gu, Y. Li, S. Guo, S.-Y. Chang, D. Yue, P. Lin, Y.J. Kim, M. Hu, L. Zeng, T. Zhu, 2009, Research on the hygroscopic properties of aerosols by measurement and modeling during CAREBeijing-2006, J. Geophys. Res., 114(D00).
Malm, W.C., J.F. Sisler, D. Huffman, R.A. Eldred, T.A. Cahill, 1994, Spatial and seasonal trends in particle concentration and optical extinction in the United States, J. Geophys. Res., 99,1347–1370.
Mauderly, J.L. and J.C. Chow, Health effects of organic aerosols, 2008, Inhal. Toxicol., 20, 257– 288.
Schauer, J.J., W.F. Rogge, L.M. Hildemann, M.A. Mazurek, G.R. Cass, 1996, Source apportionment of airborne particulate matter using organic compounds as tracers, Atmos. Environ., 30, 3837–3855.
Song, Y., Y.H. Zhang, S.D. Xie, L.M. Zeng, M. Zheng, L.G. Salmon, M. Shao, S. Slanina, 2006, Source apportionment of PM2.5 in Beijing by positive matrix factorization, Atmos. Environ., 40, 1526-1537.
Turpin, B.J., J.J. Huntzicker, S.M. Larson, G.R. Cass, 1991, Los-Angeles summer mid-day particulate carbon: Primary and secondary aerosol, Environ. Sci. Technol., 25(10), 1788–1793.
Wu, Z., M. Hu, S. Liu, B. Wehner, S. Bauer, A. Ma ßling, A. Wiedensohler, T. Petaja, M. Dal Maso, M. Kulmala, 2007, New particle formation in Beijing, China: Statistical analysis of a 1-year data set, J. Geophys. Res., 112, D09209.
Yue, D., M. Hu, Z. Wu, Z. Wang, S. Guo, B. Wehner, A. Nowak, P. Achtert, A. Wiedensohler, J. Jung, Y.J. Kim, S. Liu, 2009, Characteristics of aerosol size distributions and new particle formation in the summer in Beijing, J. Geophys. Res., 114, D00G12.
Zheng, M., L.G. Salmon, J.J. Schauer, L. Zeng, C.S. Kiang, Y. Zhang, G.R. Cass, 2005, Seasonal trends in PM2.5 source contributions in Beijing, China, Atmos. Environ., 39(22), 3967.
IntroductionBeijing is the capital of China and was the host city for the 2008 Olympic Games. The municipal GDP increased at a rate of 14.4%/year from 2000 to 2008 (National Bureau of Statistics of China, http://www.stats.gov.cn). Beijing had more than 3 million vehicles in early 2008 with an annual growth rate of more than 10%/year in the last decade (Beijing Traffic Management Bureau, http://www.bjjtgl.gov.cn). As a consequence of this rapid development, the air quality of Beijing has long been a serious concern. The Grade-II National Ambient Air Quality Standard (NAAQS) for hourly average ozone concentration is often exceeded in Beijing city, with non-attainment reached on ~10% of the days in each year from 1998 to 2006 (Beijing EPB Environmental quality Communique, 1998-2006). Though the levels of ambient SO2, NO2 and PM10 have recently been stable or even dropping for the city as a whole, ground-level ozone concentrations increased 1982 to 2003 at one site in the city (Shao et al., 2006) and air quality continues to be a major concern. Non-methane hydrocarbons (NMHCs) and NOx are directly linked to O3 formation in urban areas. According to Zhang and Keding (2009; IGACtivities, this issue),
Trends in summertime non-methane hydrocarbons in Beijing city, 2004-2009Contributed by Shao Min ([email protected]), Wang Bin ([email protected]) and Lu Sihua, The State Joint Key Laboratory of Environmental Simulation and Pollution Control, College of Environmental Sciences and Engineering, Peking University, Beijing 100871, China, Liu Shaw Chen and Chang Chih-Chung, Research Center for Environmental Changes, Academia Sinica, No. 128, Sec. 2, Academia Road, Taipei 115, Taiwan
IGACtivities 18

The effects of the short-term measures on air quality have been reported in several studies. Cheng et al. (2008) studied the four-day traffic restrictions in Beijing during the Sino-African Summit in early November 2006, Wang et al. (2009) reported the measurements of O3, CO, NOy, and SO2 during 2008 Olympics at Miyun (100km from the centre of Beijing), and Wang et al. (in preparation) report NMHCs measurements at four sites in Beijing in the summer of 2008. All demonstrate positive effects from the aggressive short-term air quality control measures. The mean daytime O3 was reduced by 15 ppbv in August 2008, 80% of which was attributed to the effects of the restrictions (Wang et al.,2009). However, long-term trends have not been well investigated for Beijing city.In August of 2004-2009, we conducted a series of field studies on the campus of Peking University (PKU), including three intensive field campaigns: CAREBeijing 2006, 2007, and 2008. The ambient concentrations of NMHCs, NOx, O3, particles, SO2, CO, CO2, NOy, PANs (peroxy acetyl nitrates), as well as meteorology parameters, were measured.The focus of this article is evaluation of the long-term trends in NMHCs, NOx, and consequently O3. NMHCs and NOx are primary pollutants. Changes in their ambient mixing ratios may reflect changes in emissions. The photochemical production of O3 by NMHCs and NOx is more complex. The trends of ambient NMHCs, NOx, and O3 in August from 2004 to 2009 are presented, and the changes of major sources contributing to ambient NMHCs are discussed.
Data setsThe data sets considered in this paper are from measurements made every August from 2004 through 2009. The measurement techniques include both on-line and off-line methods. These methods are from three labs, namely CESE of PKU, Aeronomy Laboratory (now ESRL) of NOAA, and the Research Center of Environmental Changes (RCEC) of Academia Sinica, Taiwan. All these measurements were performed on the 6th floor a building on the PKU campus. PKU is 40km northwest of the center of Beijing. This site is representative of Beijing’s urban environment (Wehner et al., 2008; Cheng et al., 2008), with vehicle exhaust as the largest emission source of NMHCs (Lu et al., 2007; Song et al., 2007; Wang et al., in preparation).The 2004 NMHCs were measured using an off-line method at Peking University: two SUMMA canisters were sampled at 07:30 and 15:00 from 11 to 18 August and were analyzed by GC/FID/MSD (GC: HP6890, MSD: 5973; Liu et al., 2005, 2008a). The 2005 data were measured by an on-line GC-FID/MSD system developed by the Aeronomy Lab of NOAA (Goldan et al., 2004). Ambient air was sampled for the first 5 minutes of every half hour from 11:30 on 1 August to 15:00 on 27 August (Song et al., 2007). The data in 2006 were measured by an on-line GC-FID system of RCEC (Wang et al., 2008). Ambient air samples were measured at 1 hour intervals from August 15 to September 10. All the analytical
details were summarized by Shao et al. (2009). The data in 2007 are from an off-line GC-FID/MSD system at RCEC (Varian 3800 and Saturn 2200). A PLOT column connected to an FID was responsible for separation and detection of C2-C4 compounds, and the DB-1 column was connected to the MS for separation and detection of MTBE and C4-C10 compounds (Chang et al., 2003). Two SUMMA canisters were sampled at 0:800 and 13:00 from August 3 to August 30. The data in 2008 were measured by an on-line GC-FID/MSD system developed by RCEC. Ambient air samples were analyzed every 1 hour. The data in 2009 were measured by an on-line GC-FID/PID system of PKU purchased from Syntech Spectras Company. Ambient samples were analyzed every 30 minutes. For details of the instrumental setup refer to Xie et al. (2008).Given the differences between these measurement methods, the NMHC species measured differed from year to year. To evaluate the variation of the NMHCs in Beijing, only species commonly measured in all years are listed in Table 1, and the sum of the mixing ratios of these species referred to NMHCs in this work. The sum of the OH loss rate due to the 19 species accounted for 70.1%, 76.3%, 77.3%, 79.3%, 70.0%, and 73.5% of the total OH reactivity of all measured hydrocarbons (HCs) in 2004, 2005, 2006, 2007, 2008, and 2009, respectively. Therefore, the selected species are considered to be representative of the measured HCs and it is therefore reasonable to used these as the basis of discussion herein.
Meteorological conditionsSince the measurements were conducted over six years, meteorological condition should be considered when interpreting the inter-annual variation in the mixing ratios of NMHCs. The meteorological data (e.g. wind speed, wind direction, atmospheric pressure (P), air temperature (T), and relative humidity (RH)) were continuously recorded by a weather station (LASTEM M7115, LSI- LASTEM, Italy). Table 2 shows the statistics of the meteorological data during our NMHC measurement period of time. The upper and lower limits were set as the 90% and 10% percentiles of the parameters. In general, the meteorological parameters are very consistent from year to year. The temperature varied between 20 and 34oC, with Aug 2004 slightly cooler and
Alkanes (6) Alkenes (8) Aromatics (5)Propane Propylene Benzene
iso-Butane trans-2-Butene Toluenen-Butane 1-Butene Ethylbenzene
iso-Pentane cis-2-Butene m,p-Xylenen-Pentane trans-2-Pentene o-Xylenen-Hexane 1-Pentene
cis-2-PenteneIsoprene
Table 1. Commonly measured species of nonmethane hydrocarbons in August, 20042009.
IGACtivities19

Aug 2007 slightly hotter. The pressure was between 992 and 1010 hPa, and RH was higher than 37%. It is important to notice that the 10-90% percentiles of precipitation (Prec.) are all zero, indicating that the cleaning effect by the showers was negligible on 80% of the days measured. Wind speeds (WS) and wind directions (WD) are also summarized in the table. Most WDs were from south in 2004 and 2005, while northwestern WDs were more prevalent in 2006-2009. However, since 2-3 m/s are the most frequent wind speeds, we think that local emissions could be the major factor influencing the ambient mixing ratios of the air pollutants.
Trends in ambient NMHCs, NOx, and ozoneThe average levels of NMHCs, NOx, NO2, NO, O3, and Ox (O3 + NO2) in August, 2004-2009, are displayed in Figure 1. The trend lines are derived from the slopes of the linear least-square fit lines. In order to show the effects of the longer term strategies, the data measured in August 2008 are excluded from the calculation since additional stringent short-term restrictions were implemented during this period.Figures 1a and 1b show the variations of the averaged NMHCs and NOx in August, 2004-2009. Obvious decreasing trends are observed for both pollutants. The slopes of the linear least-square fit line of NMHCs and NOx are -0.69 and -3.38 ppbv/year, indicating that NOx is decreasing 3 times faster than NMHCs. Given the fact that the total vehicle number in Beijing is growing at a rate of more than 10%/year, the decrease in both NOx and NMHCs indicate clearly that the control measures, aimed toward the reduction of NMHCs and NOx by implementing more stringent emissions standards of vehicles, have been successful. However, it is noteworthy that the ambient NO levels were actually more or less stable from August 2004 to 2009, with the
decrease in NOx generally due to the decline of NO2 (Fig. 2b). A detailed evaluation of changes in emissions and the role of chemistry for the variation above could be of interest.The lowest average mixing ratios of NMHCs were obtained in August 2008, during the air quality control periods of the Olympic Games. The values of NMHCs and NOx are 13.1 and 34.6 ppbv, which are 15.9 and 27.6 ppbv lower than the linear least-square fit line, respectively. Therefore, from a very rough estimate, the air quality control measures during the 2008 Olympics resulted in 41.8% and 44.3% decrease in
NOx and NMHCs, respectively. It’s very interesting to note that in 2009, both NMHCs and NOx levels bounded back quite noticeably as shown by our measurements.Ground-level O3 is one of the major photochemical products of the reactions between NMHCs and NOx. Figure 1c shows the variations of averaged O3 concentrations. Since the PKU site is located in an urban area surrounded by heavy traffic, to eliminate the titration effect Ox is also plotted in Figure 1c. In contrast to the NMHCs and NOx, an increase of 1.88 ppbv/year is observed in O3 concentrations, probably due to the increase in the ratios of NMHCs/NOx, as described by Tang et al (2009). Meanwhile, the concentration of Ox is decreasing at a rate of -1.18 ppbv/year. Compared with the rates of NOx and O3, it should be noted that the decrease in Ox can be attributed largely to the decreases in NOx. Surprisingly,
although the NMHCs and NOx in August 2008 were much lower than in 2007 the averaged values of O3 and Ox were almost the same. As with NMHCs and NOx, O3 and Ox rose again in August, 2009 to the levels expected absent the short-term control measures.A number of NMHC species can be used as tracers for sources. Figures 2a-2d presents the trends of the typical NMHC species, namely propane, iso-pentane, propylene, 1-butene, benzene, toluene, and isoprene. Figure 2a displays the two alkanes. Propane is mainly from LPG (liquefied petroleum gas) use and leakage, while iso-pentane is largely from internal fuel combustion or gasoline evaporation. The two species show obviously different trends: propane is increasing by 0.24 ppbv per year, reflecting that LPG is an increasingly important fuel type in Beijing. Iso-pentane, however, is decreasing by 0.19 ppbv per year, with the lowest value measured in 2008. From the trends of the typical alkenes and aromatics shown in Figures 2b and 2c, which are mainly from vehicular exhaust, the slopes of the linear least-square fit line of propylene, 1-butene, benzene, and toluene are -0.25, -0.08, -0.09, and -0.11 ppbv/year, respectively. Though all these species had higher levels in 2009 than that in 2008, their ambient mixing ratios were 23.6%, 20.8%, 61.3%, 31.4%, 20.9% lower in 2009
year limits T (°C) P (hPa) RH
(%)Prec. (mm)
WS (m/s) WD (°)
200410% 20.53 999.40 39.00 0.00 0.80 32.00 90% 29.90 1009.60 85.00 0.00 3.30 282.00
200510% 21.10 996.10 52.00 0.00 0.80 33.00 90% 30.37 1010.00 91.00 0.00 3.10 254.00
200610% 22.68 996.40 45.30 0.00 0.19 81.50 90% 32.82 1004.40 92.40 0.00 2.56 325.50
200710% 22.86 992.60 -- 0.00 0.00 110.00 90% 34.48 1004.90 -- 0.00 2.77 360.00
200810% 21.79 995.10 44.20 0.00 0.02 88.00 90% 33.11 1001.60 90.40 0.00 2.19 328.00
200910% 22.35 995.30 37.70 0.00 0.02 49.10 90% 33.86 1005.90 90.00 0.00 2.69 355.00
Note: ‘--’ for data not measured.
Table 2. Statistical results of meteorological data of August, 20042009.
IGACtivities 20

Figure 1. Averaged ambient mixing ratios of (a) NMHCs, (b) NOx, NO2, and NO, and (c) O3 and Ox (Ox=O3+NO2). The values of NMHCs are averages of measured mixing ratios; the values of NOx, NO2, NO, O3, and Ox are the medians of the daily maximums of 1hour averages. The error bars are corresponding standard deviations. Trends were calculated excluding the 2008 data, since shortterm emissions mitigation strategies were implemented in this year.
Figure 2. As in Figure 1, but for averages of typical alkanes, alkenes, aromatics: (a) propane and isopentane, (b) propylene and 1butene, (c) benzene and toluene, and (d) isoprene. The averages of the 10% and 90% percentiles of the temperature are also plotted in Fig.2d.
IGACtivities21

Figure 3. Relationships are shown between the ambient mixing ratios of (a) nhexane and toluene, (b) benzene and acetylene, (c) ethylene and toluene, (d) trans2butene and cis2butene, and (e) trans2pentene and cis2pentene, as measured in August, for 20042009. The slopes (ratios of selected species) were generally derived from a linear leastsquare fit line with the yintercept set to zero, except for trans2pentene vs. cis2pentene of 2006 in 3d.
IGACtivities 22

compared to their mixing ratios in 2004. In Aug 2008, the averaged mixing ratios of iso-pentane, propylene, 1-butene, benzene, and toluene were generally lower than the averaged values measured in all the other years. These trends strongly indicate that the emissions from vehicles were well under control due to the long-term measures implemented in past years and the short-term aggressive restrictions during the 2008 Olympics.Figure 2d displays the trend of ambient isoprene mixing ratios. The averages of the 10% and 90% percentiles of the temperature are also plotted in the figure. Isoprene is a tracer for biogenic emissions, but it is also attributed to vehicular emissions (Barletta et al., 2002). However, similar trends as other vehicle-emitted pollutants are not observed in this study. As shown in the figure, positive correlation is found between isoprene and ambient temperature (with the exception of the 2004 data). Since biogenic emissions are strongly correlated with ambient temperature and solar irradiation, it is reasonable to conclude that isoprene is largely contributed by biogenic sources in Beijing.
NMHCs emission ratiosThe relationships between the concentrations of ambient NMHC species provide useful information for understanding sources (Parrish et al., 2008). The ratio of the ambient concentrations of two hydrocarbons of similar reactivity should equal that of their relative emission rates from sources (Goldan et al., 2000; Jobson et al., 2004). In this section, we will examine the correlations among the measured NMHCs, and compare them with the known emissions ratios from a tunnel study by Peking University in Beijing in May 2009. We will also discuss the variations in the ratios and explore changes in the primary source emissions. The selected pairs of hydrocarbons are: n-hexane vs. toluene, benzene vs. acetylene, ethylene vs. toluene, trans-2-butene vs. cis-2-butene, and trans-2-pentene vs. cis-2-pentene, as shown in Figure 3a-3e. The two species in the selected pairs have similar rate constants with the OH radical (KOH ) value, so the ratio of their ambient concentrations will be very similar to their molar emission ratios. The slopes (ratios of selected species) were generally derived from the slope of a linear least-square fit line. Figure 3a shows the relationship between ambient n-hexane and toluene in August, 2004-2009. Generally, the slopes are constant in 2004, 2005, 2007, 2008, and 2009. The range (0.21-0.25) is close to the ratio measured in the tunnel study, indicating the primary source is very probably vehicular emission. The range is also close to that measured in Tokyo and Mexico City, but it is about 50% lower than the ratios obtained in U.S. cities (Parrish et al., 2008). Since the measured ratios of 0.21-0.25 agree well with the ratios from the tunnel experiment, this range could be a characteristic ratio for vehicular emissions in Beijing. This finding is very different from that of Parrish et al. (2008), indicating that the emissions in Beijing are relatively richer in toluene than in the U.S. cities. However, the ratios in 2006 were
much higher and closer to those of U.S. cities. This ratio could be attributed to additional emissions from n-hexane sources, e.g. fossil fuel usage, production, storage, and distribution, most likely from the Yanshan Petrochemical Company in Fangshan district.Acetylene and ethylene data are only available for 2005, 2007, and 2008. Figures 3b-3c show the relationship between ambient mixing ratios of benzene vs. acetylene and ethylene vs. toluene measured in August. Generally, the ratios are very constant, with benzene:acetylene 0.27-0.31 and ethylene:toluene 1.48-1.58. These ratios of benzene/acetylene are generally lower than that measured in the tunnel, indicating additional acetylene source(s) influencing the ambient measurements. However, the ratios remained constant during the 2008 Olympics when vehicular emission was greatly reduced as stated above and in Wang et al. (in preparation). If acetylene was from another source, then the ratio should be even lower in 2008. Therefore, the additional acetylene was probably contributed by the regional background. The ratios of ethylene/toluene are in good agreement with that measured in the tunnel, indicating that they are primarily from vehicular emission. The ratios are very close to that measured in Mexico City and to the 1980’s U.S. emissions ratio; however, this range is almost 30% lower than the 2004 U.S. emission ratio (Parrish et al., 2008), again indicating vehicle emissions in Beijing are richer in toluene.C4-C5 alkenes are highly reactive species. Figures 3d and 3e show the ratios of trans-2-butene: cis-2-butene and trans-2-pentene:cis-2-pentene from the ambient measurements and the tunnel experiment. In general, the ambient ratios are in perfect agreement with those of the tunnel study, and the agreements are within 7% and 8%, respectively. The findings indicate that these species are primarily from vehicular emission. However, the 2006 trans-2-butene:cis-2-butene data are an exception. In 2006, the ratio is much higher than in previous years when the concentrations of cis-2-butene are lower than 0.3 ppbv, indicating the strong influence of a source characterized by a much higher ratio of trans-2-butene/cis-2-butene, probably the same source causing the higher ratios in n-hexane/toluene (Fig. 3a).
Source apportionment of NMHCsAs discussed above, the emissions ratios provide a qualitative evaluation on the variation of NMHC sources. Using these ratios and source profiles established for China (Liu et al, 2008b), we performed source apportionment to obtain the quantitative contribution of sources to ambient NMHCs mixing ratios. Table 3 summarizes the results of the source apportionments from the CMB model (Chemical Mass Balance Model) for the PKU site.In general, the relative contributions of the major sources were computed to be more or less stable. Vehicular emission (vehicle exhaust plus gasoline evaporation) is the largest source, contributing 78%, 67.7%, 60.7%, and 64.0% to the total measured species in July 2003, and in August of 2004, 2005, and 2008, respectively. These
IGACtivities23

ConclusionsDecreasing trends in NMHCs, NOx, and Ox and an increase in O3 concentrations were observed in the month of August from 2004-2009. Given that this period coincided with a rapid increase in vehicular population in Beijing city, these findings reveal that the long-term air quality controls implemented by the Beijing municipal government have been successful. Among the NMHC species, only propane shows an increasing trend, reflecting the increasing importance of LPG as a cleaner energy source in Beijing city. The primary pollutants, NMHCs and NOx, were significantly reduced by the stringent short-term restrictions during the 2008 Olympic Games. The constancy in the correlations of the NMHCs species during the 5 year study period reveal the consistency in hydrocarbon speciation, even with two upgrades in the national vehicle emissions standards and the strict air quality restrictions for the 2008 Olympic Games. Our source apportionment study, performed using a Chemical Mass Balance model, showed that the relative importance of vehicular emissions in the NMHC sources remained almost unchanged through the study period. The constant emissions ratios found in this work appear to be characteristic of vehicular emissions in Beijing and could be useful for establishing NMHCs emission inventories.Adopting more stringent emission standards for vehicles has proven successful in reducing the ambient abundance of NMHCs and NOx, and this will also have a significant influence in the formation of O3. Such measures will continue to be needed for air quality improvement as a longer term strategy, especially for a city like Beijing which is expected to maintain the vehicle growth rate of 10%/year for some time. Compared to U.S. cities, vehicle exhaust in Beijing is richer in benzene and toluene, both of which are toxic carcinogens. Reducing the ambient concentration of these species by controlling vehicle emissions is therefore expected to be beneficial for public health. Other sources, e.g. the Yanshan petrochemical company, also provide substantial contributions to ambient NMHCs, and should be considered when forming control strategies.
findings are consistent with the emission ratio analysis. It’s interesting to see from Table 3 that even under very stringent control of vehicular emissions in 2008, vehicle related sources still dominated the NMHC emissions, hinting that the reduction of emissions from vehicles will require a long term effort to improve air quality in Beijing city.
It should be noted that this source apportionment was done based on limited measurements of both the ambient variation in concentrations and of the sources of hydrocarbons in Beijing. We show in Table 3 that the contributions from LPG sources and from paint/solvents had quite large variations. Measurements of emissions from chemical industries, especially petrochemical processes, have not been adequately conducted yet. Further investigation, e.g., inter-comparison with a source inventory of hydrocarbons, will be performed to validate the source contributions.
Sources 2003a 2004b 2005c 2008d
Vehicle_EXH 56 59.7 46.6 43.4
Gasoline 22 8.0 14.1 20.6
LPG 3 2.0 26.4 7.3
Paint & Solvent 9 18.5 2.9 2.3
Biogenic -- -- 0.6 2.8
Chemical Industry 3 6.2 9.8 5.7
Notes: a: Liu et al., 2005; b: Lu et al., 2007; c: Song et al., 2008; d: Wang et al., in preparation; *: Vehicle_EXH = Gasoline exhaust + Diesel exhaust; ‘--’ for data not reported.
Table 3. Comparison of source contributions to ambient NMHCs at PKU site in Beijing city (Unit: %).
IGACtivities 24

Liu, Y., M. Shao, L.L. Fu, S.H. Lu, L.M. Zeng and D.G. Tang, 2008b, Source profiles of volatile organic compounds (VOCs) measured in China: Part I, Atmos. Environ., 42, 6247-6260.
Lu, S.H., Y. Liu, M. Shao and S. Huang, 2007, Chemical speciation and anthropogenic sources of ambient volatile organic compounds during summer in Beijing City, Frontiers in Ecology and the Environment, 1(2), 1-6.
Parrish, D., P. Goldan, J. de Gouw, M. Shao, Y. Kondo, T. Shirai, Y. Yokouchi, M. Koike, 2008, Comparison of Air Pollutant Emissions among Mega-cities. IGACtivities No. 38, 22-29, (http://www.igac.noaa.gov/newsletter/).
Shao, M., S. Lu, Y. Liu, X. Xie, C. Chang, S. Huang, Z. Chen, 2009, Volatile organic compounds measured in summer in Beijing and their role in ground-level ozone formation. J. Geophys. Res., 114, D00G06, doi:10.1029/2008JD010863.
Song, Y, M. Shao, Y. Liu, S.H. Lu, W. Kuster, P. Goldan, S.D. Xie, 2007, Source apportionment of ambient volatile organic compounds in Beijing, Environ. Sci. and Technol., 41(12), 4348-4353.
Song, Y., W. Dai, M. Shao, Y. Liu, S.H. Lu, W. Kuster, P. Goldan, 2008, Comparison of receptor models for source apportionment of volatile organic compounds in Beijing, China. Environ. Pollut., 156 (1), 174-183.
Tang, G., X. Li, Y. Wang, J. Xin, X. Ren, 2009, Surface ozone trend details and interpretations in Beijing, 2001-2006, Atmos. Chem. Phys. Discuss., 9, 8159-8185.
Wang, Y., J. Hao, M.B. McElroy, J.W. Munger, H. Ma, D. Chen, C.P. Nielsen, Ozone air quality during the 2008 Beijing Olympics – effectiveness of emission restrictions, Atmos. Chem. Phys. Discuss., 9, 9927–9959.
Wang, B., M. Shao, S.H. Lu, B. Yuan, M. Wang, Y. Zhao, In preparation, Variation and source apportionment of ambient Non-methane Hydrocarbons in Summer of 2008, Beijing, Atmos. Chem. Phys. Discuss.
Wang, J.L., C.H. Wang, C.H. Lai, C.C. Chang, Y. Liu, Y. Zhang, S. Liu, M. Shao, 2008, Characterization of ozone precursors in the Pearl River Delta by time series observation of non-methane hydrocarbons, Atmos. Environ., 42, 6233-6246.
Wehner, B., W. Birmili, F. Ditas, Z. Wu, M. Hu, X. Liu, J. Mao, N. Sugimoto, A. Wiedensohler, 2008, Relationships between submicrometer particulate air pollution and air mass history in Beijing, China, 2004-2006, Atmos. Chem. Phys., 8, 6155–6168.
Xie, X., M. Shao, Y. Liu, S. Lu, C.C. Chang, Z.M. Chen, 2008, Estimate of initial isoprene contributions to ozone formation potential in Beijing, China, Atmos. Environ., 42, 6000-6010, doi:10.1016/j.atmosenv. 2008.03.035.
Zhang, Y.H. and L. Keding, 2009, The dependence of ozone production rate on ozone precursors in Beijing and Pearl River Delta region, IGACtivities No. 42, (http://www.igac.noaa.gov/newsletter/)
AcknowledgmentsThis work was supported by the Beijing Council of Science and Technology project (HB200504-6, HB200504-2), the National High Technology Research and Development Program of China (863 Program, NO. 2006AA06A309). The Authors thank the science team of CAREBeijing field campaign. ReferencesBarletta, B., S. Meinardi, I.J. Simpson, H.A. Khwaja, D.R.
Blake, and F.S. Rowland, 2002, Mixing ratios of volatile organic compounds (VOCs) in the atmosphere of Karachi, Pakistan, Atmos. Environ., 36(21), 3429– 3443, doi:10.1016/S1352-2310(02)00302-3.
Chang, C.C., S.J. Lo, J.G. Lo, J.L. Wang, 2003. Analysis of Methyl tert-butyl ether (MTBE) in the atmosphere and implications as an exclusive indicator of automobile exhaust, Atmos. Environ., 37, 4747– 4755.
Cheng, Y.F., J. Heintzenberg, B. Wehner, Z.J. Wu, H. Su, M. Hu, and J.T. Mao, 2008, Traffic restrictions in Beijing during the Sino-African Summit 2006: aerosol size distribution and visibility compared to long-term in situ observations, Atmos. Chem. Phys., 8, 7583–7594.
Chou, C.C.K., C.Y. Tsai, C.J. Shiu, S.C. Liu, and T. Zhu, T, 2009, Measurement of NOy during Campaign of Air Quality Research in Beijing 2006 (CAREBeijing-2006): Implications for the ozone production efficiency of NOx, J. Geophys. Res.. 114, D00G01.
Goldan, P.D., D.D. Parrish, W.C. Kuster, M. Trainer, S.A. McKeen, J. Holloway, B.T. Jobson, D.T. Sueper, F.C. Fehsenfeld, 2000, Airborne measurements of isoprene, CO, and anthropogenic hydrocarbons and their implications, J. Geophys. Res., 105(D7), 9091–9105.
Goldan, P.D., W.C. Kuster, E. Williams, P.C. Murphy, F.C. Fehsenfeld and J. Meagher, 2004, Nonmethane hydrocarbon and oxy hydrocarbon measurements during the 2002 New England air quality study, J. Geophys. Res., 109,D21309, doi:10.1029/2003JD004455.
Jobson, B.T., C.M. Berkowitz, W.C. Kuster, P.D. Goldan, E.J. Williams, F.C. Fesenfeld, E.C. Apel, T. Karl, W.A. Lonneman and D. Riemer, 2004, Hydrocarbon source signatures in Houston, Texas: Influence of the petrochemical industry. J. Geophys. Res., 109(D24), D24305, doi:10.1029/2004JD004887.
Liu Y., M. Shao, J. Zhang, L.L. Fu and H. Lu, 2005, Distributions and source apportionment of ambient volatile organic compounds in Beijing city, China. J. Environ. Sci. Health. A, 40(10), 1843–1860.
Liu, Y., M. Shao, S.H. Lu, C.C. Chang, J.L. Wang and G. Chen, 2008a, Volatile Organic Compound (VOC) measurements in the Pearl River Delta (PRD) region, China, Atmos. Chem. Phys., 8(6),1531-1545.
IGACtivities25

have now been thoroughly processed and analyzed. In the following analysis we present summaries and brief comparisons of research results regarding ozone formation and its sensitivity to precursors based on datasets obtained from these three field campaigns.
Datasets and methodsDatasetsThe datasets analyzed herein include observations from field campaigns in Beijing in 2006 (Campaigns of Air Quality Research in Beijing and Surrounding Region, CAREBeijing2006) and in PRD in 2004 and 2006 (Program of Regional Integrated Experiments of Air Quality over Pearl River Delta; PRiDe2004, and PRiDe2006).
In these three field campaigns, comprehensive measure-ments of gas phase and aerosol phase constituents were collected at two supersites that were targeted to characterize the urban and suburban/rural conditions of Chinese mega-city regions (see Table 1). The resulting time series of gas phase parameters, including measurements of O3, CO, NO/NO2, NO/NOy, SO2, HONO, NMHCs, and photolysis frequencies, provide us a good opportunity to understand the dependence of ozone production rate on ozone precursors using an observational based model (OBM). In addition, in PRiDe2006 and CAREBeijing2006, direct HOx radical measurements were made using a Laser induced
IntroductionIn China, due to rapid urbanization and motorization, air quality has deteriorated especially in mega-cities and their surroundings where ozone and fine particle pollution are recognized as major problems (Zhang et al., 1998; Zhang et al., 2008a; Shao et al., 2006). Previous studies in Beijing and in the Yangtze and Pearl River Delta regions (Zhang et al., 2008b; Wang et al., 2009; Wang et al., 2006; Zhang et al., 2007; Xu et al., 2006; Wang et al., 2002; Tang et al., 2009; Hu et al., 2005; Zhao et al., 2004) have shown that fast photochemical ozone productions can occur in the near-surface layer. Research methods utilized ozone source apportionment, direct decoupling, empirical kinetics modeling, and the ratios of NMHCs/NOx and ozone production efficiency. These studies showed that photochemical ozone production was mainly sensitive to VOC chemistry in urban areas while ozone production was sensitive to NOx chemistry in suburban or rural areas. Among the available Chinese studies, analyses based on 3-D air quality models played a cen tral role in understanding local ozone-precursor relations. However, due to uncertainties in emission inventories and in the meteorological sim ulations, the diagnosed results of 3-D air quality models may produce large un certainties. Thus, model val idation is re quired to im prove their utility. Ob servational based models (OBMs) can be helpful for deriving the local sensitivity of ozone production to the primary emissions of NOx and VOCs (Kleinman, 2000). The OBM-diagnosed results show merit with relatively small uncertainties, however high quality measurements of a large set of trace gas compounds are required, and these are mostly available only from the “super sites” of intensive field campaigns. Starting in 2004, the College of Environmental Sciences and Engineering (CESE) of Peking University (PKU) took the lead in organizing several intensive field campaigns in the Beijing and Pearl River Delta regions. These were targeted at both improving the scientific understanding of atmospheric chemistry processes and at providing policy recommendations to local governments. Among those field studies, the data from field campaigns PRiDe2004, PRiDe2006, and CAREBeijing2006
The dependence of ozone production rate on ozone precursors in the Beijing and Pearl River Delta regionsContributed by Yuanhang Zhang ([email protected]) and Keding Lu ([email protected]), The State Joint Key Laboratory of Environmental Simulation and Pollution Control, College of Environmental Sciences and Engineering, Peking University, Beijing 100871, China
Field campaign Time Super
site Locations Reference
CAREBeijing 2006
August/September
2006
YUFA A school campus of Yufa village [39.51oN, 116.30oE]
(Garland et al., 2009)
PKU Campus of Peking University [39.99oN, 116.30oE] (Chou et al., 2009)
PRiDe2004 October, 2004
XKRural area of large farmland
near the Xinken village [22.61oN, 113.59oE] (Zhang et al.,
2008a)GZ Downtown area of Guangzhou
city [23.13oN, 113.26oE]
PRiDe2006 July, 2006BG
Rural area of large farmland near the Backgarden village
[23.50oN, 113.02oE]
(Hofzumahaus et al., 2009)
GZ Downtown area of Guangzhou city [23.13oN, 113.26oE]
Same as PRiDe2004
Table 1. Super sites information in field campaigns of CAREBeijing2006 and PRiDe2004/2006.
IGACtivities 26

populations. Specifically, at the suburban/rural supersites, the NO concentration in the afternoon hours dropped down to very low regimes (sub-ppbv level).As is well known, O3 is produced photochemically from sunlit reactions of NOx and VOCs. However, in contrast to the large variability in j(O1D), NO and kNMHCs, the O3 concentrations are very similar across both rural and urban supersites and across the campaigns, the exception being at XK (PRiDe2004 rural site), where the highest O3 concentrations appear. According to these observations, O3 pollution in Chinese mega-city regions is not as serious as that recorded in the Los Angeles basin of California in the 1970s. While in Los Angeles the peak values were several hundred ppbv, here the typical peak value is about 60-80ppb with only certain locations having peak values as high as 120ppb. These results are consistent with those extracted from the regional monitoring networks in PRD and Beijing (Zhang et al., 2008b). Nevertheless, even for the regional monitoring network, the number of sites is still relatively limited, and it is possible that the present monitoring sites might have missed high ozone events. Moreover, instantaneously produced O3 could have been strongly titrated by NO in mega-city regions, masking the high
fluorescence system (FZJ; Germany). These data can provide further insights in evaluating the functions of the OBM.
MethodsAn observational based model (OBM) developed by Cardelino and Chameides (1995) was used throughout the three field studies to investigate O3 formation and its sensitivity to precursors according to the concept of the relative incremental reactivity (RIR) of O3 precursors. The OBM is a zero dimensional photochemical box model constrained by observed NOx, NMHCs, HONO, O3, and photolysis frequencies. It is designed to perform two-phase simulations. The first phase simulation assimilates the concentrations of specified species to calculate unspecified species (i.e. radicals and OVOCs) and pseudo-emission terms, S(X), for the measured long-lived species. In the second phase, the calculated pseudo-emission terms are varied to derive the RIRs of the ozone precursors (RIR(X) = dln∫P(O3)/dlnS(X). The integral ∫P(O3) is the integrated daytime instantaneous net photochemical ozone production rate, P(O3).
General features of the photochemistryIn Figure 1, we show the diurnal variation patterns for sunny days of the photolysis frequency of ozone to O1D- j(O1D); ambient concentrations of ozone (O3) and nitric oxide (NO); and the pseudo first-order rate coefficient of the sum of the OH loss reactions from measured NMHCs- kNMHCs in the atmosphere, as observed at the supersites of PRiDe2004, PRiDe2006, and CAREBeijing2006. The parameter j(O1D) characterizes one of the most fundamental atmospheric photo-dissociation processes and varies as a function of geophysical location, aerosol optical depth, cloud coverage, solar zenith angle, etc. In each of these three field campaigns, only one supersite was equipped to measure j(O1D). The variability in j(O1D) across the different field campaigns is consistent with the corresponding variations in geophysical location and season (see Table 1). The ambient NO concentrations and kNMHCs are characteristic of the general features of the emission sources for the investigated areas. Observed variations across the super-sites in these two parameters could not be simply explained by their urban vs. suburban locations. At the GZ supersite (urban), the diurnal variation patterns of NO and kNMHCs differ in PRiDe2004 and PRiDe2006, with both values higher in the latter field campaign. This may indicate increased emissions in the PRD region. Moreover, the ambient level of these two parameters at the GZ super site is, surprisingly, higher than within Beijing. Could this difference infer a stronger emission of NOx and NMHCs at Guangzhou city? Or are there other reasons that have strongly influenced their ambient levels (i.e. the streets at Guangzhou are normally much narrower than in Beijing which may affect dilution conditions)? In the suburban/rural supersites, ambient levels of kNMHCs and NO are systematically lower than at the urban supersites, consistent with the differences in vehicle
Urban
0
1
2
3
4
jO1 D
[s−1
]
PRiDe2004PRiDe2006CareBeijing2006
(a)
Suburban/Rural
(b)
0
50
100
150
O3 [
ppbv
]
(c)
(d)
0
20
40
60
80
100120
NO
[ppb
v]
(e)
(f)
00:00 06:00 12:00 18:00 00:00
Local Time
0
10
20
30
k NM
HC
s [s−
1 ]
(g)
00:00 06:00 12:00 18:00 00:00
Local Time
(h)
Figure 1. Mean diurnal variation profiles of j(O1D), O3, NO, kNMHCs in urban and suburban/rural supersites of PRiDe2004, PRiDe2006, and CAREBeijing2006.
IGACtivities27
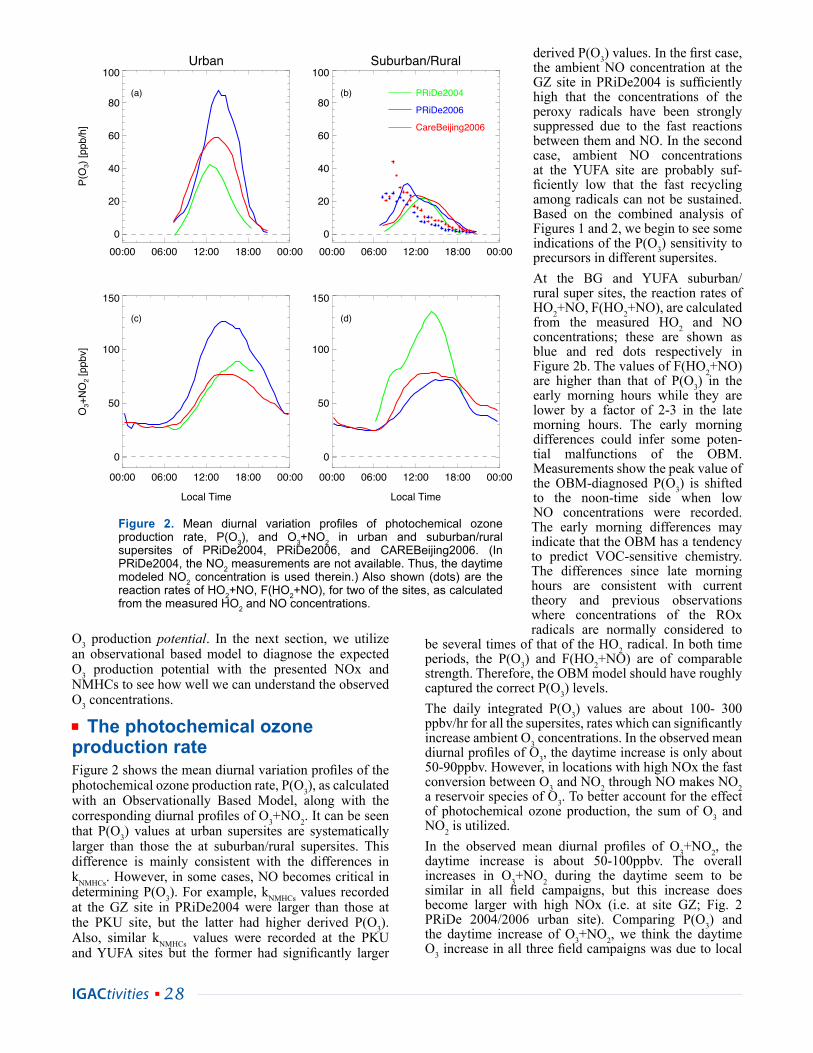
derived P(O3) values. In the first case, the ambient NO concentration at the GZ site in PRiDe2004 is sufficiently high that the concentrations of the peroxy radicals have been strongly suppressed due to the fast reactions between them and NO. In the second case, ambient NO concentrations at the YUFA site are probably suf-ficiently low that the fast recycling among radicals can not be sustained. Based on the combined analysis of Figures 1 and 2, we begin to see some indications of the P(O3) sensitivity to precursors in different supersites. At the BG and YUFA suburban/rural super sites, the reaction rates of HO2+NO, F(HO2+NO), are calculated from the measured HO2 and NO concentrations; these are shown as blue and red dots respectively in Figure 2b. The values of F(HO2+NO) are higher than that of P(O3) in the early morning hours while they are lower by a factor of 2-3 in the late morning hours. The early morning differences could infer some poten-tial malfunctions of the OBM. Measurements show the peak value of the OBM-diagnosed P(O3) is shifted to the noon-time side when low NO concentrations were recorded. The early morning differences may indicate that the OBM has a tendency to predict VOC-sensitive chemistry. The differences since late morning hours are consistent with current theory and previous observations where concentrations of the ROx radicals are normally considered to
be several times of that of the HO2 radical. In both time periods, the P(O3) and F(HO2+NO) are of comparable strength. Therefore, the OBM model should have roughly captured the correct P(O3) levels. The daily integrated P(O3) values are about 100- 300 ppbv/hr for all the supersites, rates which can significantly increase ambient O3 concentrations. In the observed mean diurnal profiles of O3, the daytime increase is only about 50-90ppbv. However, in locations with high NOx the fast conversion between O3 and NO2 through NO makes NO2 a reservoir species of O3. To better account for the effect of photochemical ozone production, the sum of O3 and NO2 is utilized. In the observed mean diurnal profiles of O3+NO2, the daytime increase is about 50-100ppbv. The overall increases in O3+NO2 during the daytime seem to be similar in all field campaigns, but this increase does become larger with high NOx (i.e. at site GZ; Fig. 2 PRiDe 2004/2006 urban site). Comparing P(O3) and the daytime increase of O3+NO2, we think the daytime O3 increase in all three field campaigns was due to local
O3 production potential. In the next section, we utilize an observational based model to diagnose the expected O3 production potential with the presented NOx and NMHCs to see how well we can understand the observed O3 concentrations.
The photochemical ozone production rateFigure 2 shows the mean diurnal variation profiles of the photochemical ozone production rate, P(O3), as calculated with an Observationally Based Model, along with the corresponding diurnal profiles of O3+NO2. It can be seen that P(O3) values at urban supersites are systematically larger than those the at suburban/rural supersites. This difference is mainly consistent with the differences in kNMHCs. However, in some cases, NO becomes critical in determining P(O3). For example, kNMHCs values recorded at the GZ site in PRiDe2004 were larger than those at the PKU site, but the latter had higher derived P(O3). Also, similar kNMHCs values were recorded at the PKU and YUFA sites but the former had significantly larger
Urban
00:00 06:00 12:00 18:00 00:00
0
20
40
60
80
100P(
O3)
[ppb
/h]
(a)
Suburban/Rural
00:00 06:00 12:00 18:00 00:00
0
20
40
60
80
100
(b) PRiDe2004
PRiDe2006
CareBeijing2006
00:00 06:00 12:00 18:00 00:00
Local Time
0
50
100
150
O3+
NO
2 [pp
bv]
(c)
00:00 06:00 12:00 18:00 00:00
Local Time
0
50
100
150
(d)
Figure 2. Mean diurnal variation pro files of photochemical ozone production rate, P(O3), and O3+NO2 in urban and sub urban/rural supersites of PRiDe2004, PRiDe2006, and CAREBeijing2006. (In PRiDe2004, the NO2 measurements are not available. Thus, the daytime modeled NO2 concentration is used therein.) Also shown (dots) are the reaction rates of HO2+NO, F(HO2+NO), for two of the sites, as calculated from the measured HO2 and NO concentrations.
IGACtivities 28

Relative incremental reactivity (RIR)Relative Incremental Reactivity (RIR; see Methods section above) is an important parameter for evaluating policy targeted at reducing eight-hour O3 concentrations, a common ambient air quality metric in many countries. In this study, for all the supersites we calculated the RIRs for AHCs (anthropogenic hydrocarbons, including measured alkanes, alkenes, and aromatics), NHCs (natural hydrocarbons, including only isoprene), CO, and NO. The kNMHCs/NO dependence on RIR(AHC), RIR(NHC), RIR(NO) and RIR(CO) at the supersites of PRiDe2004, PRiDe2006, and CAREBeijing2006 are shown as Figure 3. Since the RIRs refer to the daytime integrated results, the daytime averaged kNMHCs/NO values are used herein. Overall, it can be seen that RIR(AHC), RIR(NHC) and RIR(CO) decrease as kNMHCs/NO increases while RIR(NO) increases as kNMHCs/NO increases. The general behaviors of all the RIRs show consistency with
formation through photochemical reactions. In all the model calculations, when the model is constrained by the measured HONO concentrations, the HONO budget in the model system is imbalanced. In this case, an unknown source term is found to be necessary to balance the HONO budget. The role of the unknown HONO source in influencing P(O3) was investigated through comparsions of sensitivity model runs with and without constraints on the measured HONO concentrations. Overall, the variations in the P(O3) enhancement is consistent with the variations in HONO concentrations at the different supersites (see Table 2; the P(O3) enhancement is depicted by the ratio of the P(O3) derived from model runs with or without measured HONO as input values, P(O3|HONOmeas|)/P(O3|HONOcalc|)). Since the key factor that determines the P(O3) enhancement is the unknown HONO source term, the parameter P(O3|HONOmeas|)/P(O3|HONOcalc|) is not fully proportional to the ambient HONO concentrations.
XK GZ(PRiDe2004) BG GZ(PRiDe2006) YUFA PKU
P(O3|HONOmeas|)/P(O3|HONOcalc|)
2.4 5.9 1.3 2.1 2.0 2.3
HONO [ppbv] 1.1 3.3 0.48 1.1 0.6 1.2
Table 2 The daytime averaged ratio of P(O3|HONOmeas|)/P(O3|HONOcalc|) and the daytime averaged HONO concentrations at every supersites.
Figure 3. Shown is the dependence on kNMHCs/NO of RIR(AHC), RIR(NHC), RIR(NO), and RIR(CO) for the supersites during the PRiDe2004 (green circles), PRiDe2006 (blue circles), and CAREBeijing2006 (red circles) campaigns. Quadratic fitting results are plotted to give an indication of the relationship between these two parameters for each campaign.
−1.0
−0.5
0.0
0.5
1.0
RIR
(AH
C)
(a)
0.0
0.1
0.2
0.3
0.4
0.50.6
RIR
(NH
C)
(b)
1 10
kNMHCs/NO [s−1⋅ppb−1]
−1.0
−0.5
0.0
0.5
1.0
RIR
(NO
)
(c)
1 10
kNMHCs/NO [s−1⋅ppb−1]
0.0
0.1
0.2
0.3
0.4
0.50.6
RIR
(CO
)
(d)
IGACtivities29

and across measurement sites. In PRiDe2006 and CAREBeijng2006, the photochemical ozone productions are sensitive to both the VOC chemistry and NOx chemistry. Examination of the RIR(AHC) and RIR(NO) values allow us to determine where the transition occurs from VOC-sensitive chemistry to NOx-sensitive chemistry (or vice versa): This would happen when these two parameters are equal. This corresponds to a value on the kNMHCs/NO axis of ~2-5. In the field campaign PRiDe2004, only VOC-sensitive chemistry was observed. For most of the cases, a reduction in NOx is expected to produce an increase in ozone. In 2004, China faced an energy crisis which was especially serious in the PRD region. Many low-efficiency and high-emission energy sources were utilized to sustain industrial production. Additionally, the weather in Autumn 2004 in PRD was very dry compared to typical conditions. Thus, the results of PRiDe2004 may not be sufficiently representative to assist decisions for air pollution control policies.
In order to understand the RIR(NHC) and RIR(CO) variability in different field campaigns, the daytime averaged ratio of kISO/kNMHCs and the daytime averaged CO concentrations at all supersites is summarized in Table 3. In PRiDe2006, the kNMHCs/NO dynamics are dominated by the data from the BG supersite. The variations of RIR(NHC) between PRiDe2006 and CAREBeijing2006 are consistent with those of the kISO/kNMHCs (BG vs YUFA and PKU). The RIR(NHC) of PRiDe2004 is relatively high since the values kISO/kNMHCs are low in both the XK and GZ supersites. This can probably be attributed to the high sensitivity to VOC
theoretical expectations; in the low kNMHCs/NO regime, the value of P(O3) would most likely be sensitive to VOC (including AHC, NHC and CO) chemistry while in the high kNMHCs/NO regime, the value of P(O3) would most likely be sensitive to the NOx chemistry. However, the details of these relationships could, in reality, be much more complicated since the RIRs could be significantly influenced by other factors as well. Thus, there is a great deal of scatter in RIR about the quadratic fits to RIR vs. kNMHCs/NO shown in Figure 3. In principle, the other important factors besides kNMHCs/NO that could be affecting RIR are HONO concentrations, photolysis frequency, and concentrations of oxygenated volatile organic compounds (OVOCs). We have explored the possible influence of HONO and photolysis frequency on RIR using sensitivity model runs. The results show that variations in HONO and the photolysis frequency may indeed change the absolute values of RIRs; however, the relative values of the RIRs for the different species in Figure 3 are not significantly changed by accounting for these factors. The impact of OVOCs on the RIRs is dif ficult to determine since we have such limited measurements of these species that the OBM could not be con-strained by them. On the other hand, the possible role of OVOCs could be an important direction for future work since OVOCs participate in both the initiation and propagation processes of the atmospheric radical chain reactions. Additionally, the ozone-sensitive chemistry could be variable on short time scales, thus the individual diurnal variation patterns of kNMHCs/NO might have also played a role in affecting derived RIR values. The dependence of RIRs on kNMHCs/NO (solid lines in Figure 3) differs across these three field campaigns
XK GZ(PRiDe2004) BG GZ(PRiDe2006) YUFA PKU
kISO/kNMHCs 0.07 0.12 0.46 0.16 0.32 0.29
CO [ppbv] 1000 1100 580 1400 840 1200
Table 3 The daytime averaged ratio of kISO/kNMHCs and the daytime averaged CO concentrations at all supersites.
−1.5
−1.0
−0.5
0.0
0.5
1.0
1.5
RIR
[%/%
]
GZ04 XK GZ06 BG PKU YUFA
Pearl River Delta Beijing
AHC NHC CO NO
Figure 4. RIRs of AHC, NHC, CO and NO calculated by OBM model runs constrained by mean diurnal profiles in urban (GZ and PKU) and suburban/rural (XK, BG and YUFA) supersites of PRiDe2004, PRiDe2006, and CAREBeijing2006. GZ04 is the GZ site in PRiDe2004; GZ06 is the GZ site in PRiDe2006.
IGACtivities 30

rate of ROx radicals. This ratio is presented in Figure 5 for the NOx-sensitive and VOC-sensitive data sets respectively (as classified by the daily integrated RIRs, see Figure 3).The parameter LN/Q is a well tested parameter for the analysis of ozone formation regime (Kleinman et al., 2005; Kleinman, 2005; Kleinman et al., 1997). Based on the ROx budget analysis, it has been well proven that the P(O3)-precursor sensitivities (i.e. dlnP(O3)/dlnAHC, dlnP(O3)/dlnNO) could be expressed as functions of LN/Q. An LN/Q value larger than 0.5 indicates a hydrocaron sensitive regime; LN/Q less than 0.5 indicates an NOx-sensitive regime. At the urban GZ supersite in both the PRiDe2004 and PRiDe2006 field campaigns, the LN/Q values are larger than 0.8 for the entire daytime which indicates a strong instantaneous HC-sensitive chemistry. The smallest LN/Q values at the urban GZ supersite (Figure 5a) are reached around noon, since the radicals are their peak at this time and, simultaneously, NOx has been strongly removed by the OH radical. At the rural XK supersite (Figure 5b), for most of the daytime LN/Q is greater than 0.5 but in the late afternoon it drops to less than 0.5. This is mainly consistent with the diurnal trend in NO (see Figure 1f).
concentrations in PRiDe2004. The variations of RIR(CO) can be understood with similar logical deductions using the daytime averaged CO concentrations. Mean diurnal profiles of O3, HONO, NO, CO, NMHCs, and photolysis frequency could present statistically significant photochemical characterization for certain locations. With the OBM run constrained by the averaged diurnal profiles of the above parameters, the corresponding diagnosed RIRs are then recognized as a concise description of the ozone formation regimes. Following this method, the diagnosed RIRs based on the PRiDe2004, PRiDe2006, and CAREBeijing2006 dataset are shown in Figure 4. According to the calculated RIRs, it is found that P(O3) at Guangzhou city is strongly sensitive to AHC chemistry while P(O3) at Beijing city shows comparable sensitivity between AHC chemistry and NOx chemistry. Regarding the suburban and rural regions of Guangzhou and Beijing cities, P(O3) could be sensitive to NOx chemistry (BG) or AHC chemistry (XK) or both of them (YUFA). As to the absolute values, the RIRs at the Pearl River Delta urban sites (GZ04, and GZ06) and the rural site XK are much larger than those at the Pearl River Delta rural site BG or the two Beijing sites (PKU and YUFA). Since the absolute values of RIRs describes the reduction potential of P(O3) per unit reduction of X, the difference of RIRs simply tells us that the O3 pollution might be more easily controlled in most of the PRD region than in the Beijing region. Nevertheless, as indicated by Figure 3, the RIRs are not static variables. From that point of view, deriving the second order derivative of P(O3) toward S(X) would be useful in gaining enough insight into the possible impacts of the reduction strategy inferred from the RIRs.
Morning to afternoon photochemical developmentIn this study, significant diurnal changes in O3 precursors were observed at all supersites (i.e. see Figure 1) The averaged diurnal variations in the P(O3)-precursor sensitivities can be characterized by LN/Q, where LN is the radical termination rate through reactions between ROx radicals and NOx and Q is the primary production
Urban
−0.20.00.20.40.60.81.01.2
L N/Q
(a)
Suburban/Rural
(b)
−0.20.00.20.40.60.81.01.2
L N/Q
(c)
(d)
04:00 08:00 12:00 16:00 20:00
Local Time
−0.20.00.20.40.60.81.01.2
L N/Q
(e)
04:00 08:00 12:00 16:00 20:00
Local Time
(f)
Figure 5. Diurnal variation pattern of the OBMcalculated LN/Q (solid lines) in urban and suburban/rural supersites of PRiDe2004 (panels (a) and (b)), PRiDe2006 (panels (c) and (d)) and CAREBeijing2006 (panels (e) and (f)) for NOxsensitive (cyan) and VOCsensitive (red) days respectively. At BG and YUFA, the experimentally derived LN/Q values are shown as circles. The LN/Q ratio gives in indication of the sensitivity of P(O3) to precursors.
IGACtivities31
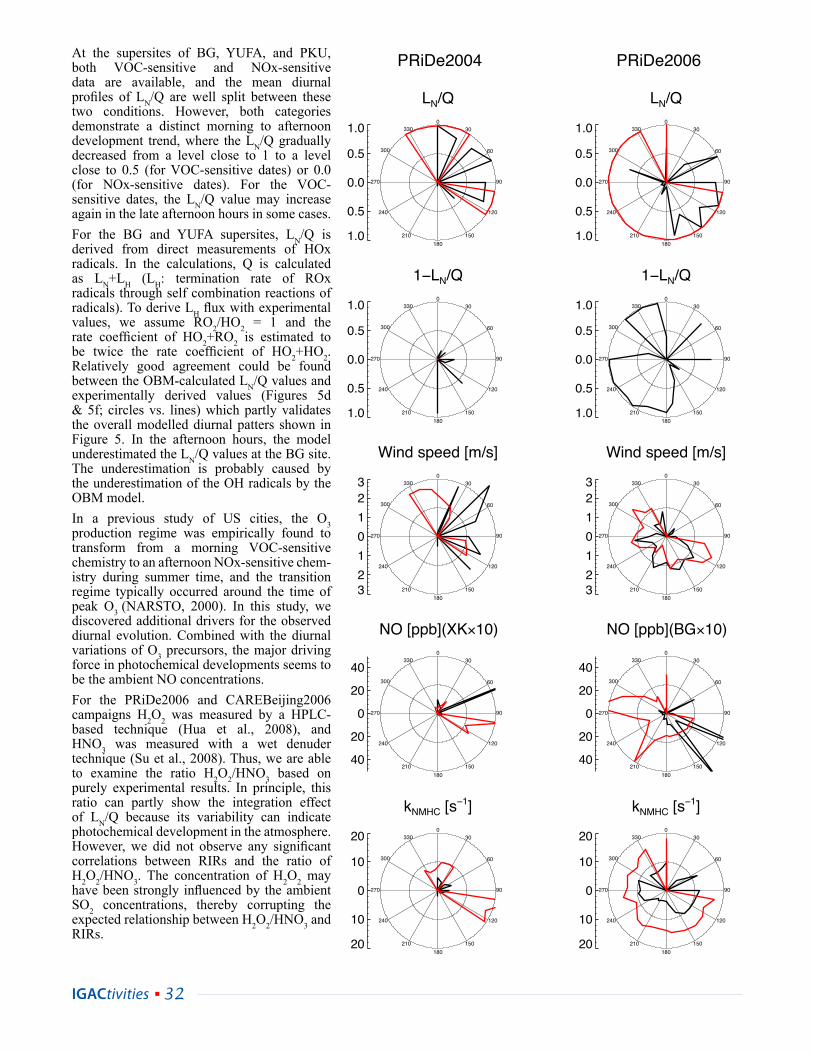
At the supersites of BG, YUFA, and PKU, both VOC-sensitive and NOx-sensitive data are available, and the mean diurnal profiles of LN/Q are well split between these two conditions. However, both categories demonstrate a distinct morning to afternoon development trend, where the LN/Q gradually decreased from a level close to 1 to a level close to 0.5 (for VOC-sensitive dates) or 0.0 (for NOx-sensitive dates). For the VOC-sensitive dates, the LN/Q value may increase again in the late afternoon hours in some cases. For the BG and YUFA supersites, LN/Q is derived from direct measurements of HOx radicals. In the calculations, Q is calculated as LN+LH (LH: termination rate of ROx radicals through self combination reactions of radicals). To derive LH flux with experimental values, we assume RO2/HO2 = 1 and the rate coefficient of HO2+RO2 is estimated to be twice the rate coefficient of HO2+HO2. Relatively good agreement could be found between the OBM-calculated LN/Q values and experimentally derived values (Figures 5d & 5f; circles vs. lines) which partly validates the overall modelled diurnal patters shown in Figure 5. In the afternoon hours, the model underestimated the LN/Q values at the BG site. The underestimation is probably caused by the underestimation of the OH radicals by the OBM model. In a previous study of US cities, the O3 production regime was empirically found to transform from a morning VOC-sensitive chem istry to an afternoon NOx-sensitive chem-istry during summer time, and the transition regime typically occurred around the time of peak O3 (NARSTO, 2000). In this study, we discovered additional drivers for the observed diurnal evolution. Combined with the diurnal variations of O3 precursors, the major driving force in photochemical developments seems to be the ambient NO concentrations. For the PRiDe2006 and CAREBeijing2006 campaigns H2O2 was measured by a HPLC-based technique (Hua et al., 2008), and HNO3 was measured with a wet denuder technique (Su et al., 2008). Thus, we are able to examine the ratio H2O2/HNO3 based on purely experimental results. In principle, this ratio can partly show the integration effect of LN/Q because its variability can indicate photochemical development in the atmosphere. However, we did not observe any significant correlations between RIRs and the ratio of H2O2/HNO3. The concentration of H2O2 may have been strongly influenced by the ambient SO2 concentrations, thereby corrupting the expected relationship between H2O2/HNO3 and RIRs.
LN/Q
1.0
0.5
0.0
0.5
1.0 0 30
60
90
120
150180
210
240
270
300
330
LN/Q
1.0
0.5
0.0
0.5
1.0 0 30
60
90
120
150180
210
240
270
300
330
LN/Q
1.0
0.5
0.0
0.5
1.0 0 30
60
90
120
150180
210
240
270
300
330
1−LN/Q
1.0
0.5
0.0
0.5
1.0 0 30
60
90
120
150180
210
240
270
300
330
1−LN/Q
1.0
0.5
0.0
0.5
1.0 0 30
60
90
120
150180
210
240
270
300
330
1−LN/Q
1.0
0.5
0.0
0.5
1.0 0 30
60
90
120
150180
210
240
270
300
330
Wind speed [m/s]
3210123 0
30
60
90
120
150180
210
240
270
300
330
Wind speed [m/s]
3210123 0
30
60
90
120
150180
210
240
270
300
330
Wind speed [m/s]
3210123 0
30
60
90
120
150180
210
240
270
300
330
NO [ppb](XK×10)
40
20
0
20
40 0
30
60
90
120
150180
210
240
270
300
330
NO [ppb](BG×10)
40
20
0
20
40 0
30
60
90
120
150180
210
240
270
300
330
NO [ppb](×2)
40
20
0
20
40 0
30
60
90
120
150180
210
240
270
300
330
kNMHC [s−1]
20
10
0
10
20 0 30
60
90
120
150180
210
240
270
300
330
kNMHC [s−1]
20
10
0
10
20 0 30
60
90
120
150180
210
240
270
300
330
kNMHC [s−1]
20
10
0
10
20 0 30
60
90
120
150180
210
240
270
300
330
PRiDe2004 PRiDe2006 CareBeijing2006
IGACtivities 32

Impact of surface windSurface winds can affect the concentration fields of trace gases in the atmosphere and can also impacts ozone formation. Within our Observationally Based Model, the observed concentration fields are utilized as model input so that the role of surface wind could not be investigated explicitly with the OBM. However, using the model-derived LN/Q values, wind speed, and the dependence of major O3 formation precursors on the prevailing wind direction (summarized in Figure 6), we investigated the impact of surface wind indirectly. In order to understand the dependence on wind direction, the spatial emission patterns of Beijing (personal communication with Wang X. S.) and PRD (Zheng et al., 2009) regions are shown in Figure 7.Previous studies of the Asian Monsoon and the synoptic systems influencing the Beijing and PRD regions have already shown that the dominant wind direction during the Beijing summer is southerly, while during the summer and autumn winds in the Pearl River Delta region would be southeasterly and northeasterly, respectively. General features of the regional wind fields have been captured by the observed wind speed roses in all of the super sites during these field campaigns as well. Combined with Figure 7, it can be noted that the values of NO and kNMHCs in all the suburban/rural supersites are significantly enhanced in the corresponding sectors where strong pollution sources are located. The YUFA supersite is a little deviated from the expectations, probably due to the transport of emissions from a nearby street (about 10m in the W sector). The roses of NO and kNMHCs are not that meaningful for the urban supersites since they are surrounded by local emissions sources. The variations therein most likely reflect the combined diurnal variations of the wind directions and the trace gas concentrations. The wind direction dependence of the P(O3)-precursor sensitivity are depicted as the roses of LN/Q and 1-LN/Q. Regarding the PRiDe2004 and PRiDe2006 datasets, it can be found that the GZ site is always controlled by the VOC-sensitive chemistry. In this case, only a red point appears in the rose plot of 1-LN/Q. The two suburban/rural supersites, XK and BG, both experienced varied controlling chemistry, with the cases of VOC-sensitive chemistry consistent with air sourced in the sectors of the Guangzhou-Shenzhen city cluster, while the cases of NOx-sensitive chemistry are associated with air masses originating in the southwestern or northwestern PRD regions. Results shown in Figures 5 and 6 demonstrate the variations of LN/Q with wind direction and solar zenith angle (or radiation). In such a case, an interesting question can be asked, ‘Is the variation of LN/Q mainly caused by the change in the wind field or by the diurnal change in solar radiation?’ Expressed another way, if we put the suburban/rural supersite in the upwind (referred to as the dominant wind direction) regions of Guangzhou-Shenzhen cities, what kind of dependences could then be expected? For the Beijing dataset, at the YUFA site, the northern inflows show VOC-sensitive conditions while the southern inflows show NOx-sensitive conditions, which means that the air from Beijing is VOC-sensitive. At the PKU site, most of the wind sectors exhibit VOC-sensitive conditions while for the south-western wind sectors some NOx-sensitive conditions appear. Again, the data do not clearly show that changes in the ozone formation regime in Beijing are driven by surface wind or by the diurnal photochemical evolution, as shown by the PRD data.
Figure 6. LN/Q, 1 LN/Q, wind speed, NO and kNMHCs roses at urban (red) and suburban/rural (black) super sites in the PRiDe2004, PRiDe2006, and CAREBeijing2006 field campaigns. Shown are median values for 15o sectors. The datasets are restricted to daytime observations on sunny days.
LN/Q
1.0
0.5
0.0
0.5
1.0 0 30
60
90
120
150180
210
240
270
300
330
LN/Q
1.0
0.5
0.0
0.5
1.0 0 30
60
90
120
150180
210
240
270
300
330
LN/Q
1.0
0.5
0.0
0.5
1.0 0 30
60
90
120
150180
210
240
270
300
330
1−LN/Q
1.0
0.5
0.0
0.5
1.0 0 30
60
90
120
150180
210
240
270
300
330
1−LN/Q
1.0
0.5
0.0
0.5
1.0 0 30
60
90
120
150180
210
240
270
300
330
1−LN/Q
1.0
0.5
0.0
0.5
1.0 0 30
60
90
120
150180
210
240
270
300
330
Wind speed [m/s]
3210123 0
30
60
90
120
150180
210
240
270
300
330
Wind speed [m/s]
3210123 0
30
60
90
120
150180
210
240
270
300
330
Wind speed [m/s]
3210123 0
30
60
90
120
150180
210
240
270
300
330
NO [ppb](XK×10)
40
20
0
20
40 0
30
60
90
120
150180
210
240
270
300
330
NO [ppb](BG×10)
40
20
0
20
40 0
30
60
90
120
150180
210
240
270
300
330
NO [ppb](×2)
40
20
0
20
40 0
30
60
90
120
150180
210
240
270
300
330
kNMHC [s−1]
20
10
0
10
20 0 30
60
90
120
150180
210
240
270
300
330
kNMHC [s−1]
20
10
0
10
20 0 30
60
90
120
150180
210
240
270
300
330
kNMHC [s−1]
20
10
0
10
20 0 30
60
90
120
150180
210
240
270
300
330
PRiDe2004 PRiDe2006 CareBeijing2006
IGACtivities33

by the NO titration effect since the corresponding NO concentrations are also low. Instead, this is a clear signal of nighttime NO2 transport. In the early morning hours, this NO2 is photolyzed to form O3, as indicated by the fast decrease of NO2 (Figure 8). Nighttime transport of NO2 is an indirect method of transporting urban ozone to suburban areas. This kind of behavior draws attention to the importance of utilizing Ox as a target parameter for regional O3 reduction strategies. In the time series of NO, kNMHCs/NO, and the air mass trajectories, note that the urban air mass is characterized by high NO concentrations and a low kNMHCs/NO ratio while the rural air mass is characterized by the reverse features. The development of instantaneous O3-NOx-VOC sensitivities denoted by the LN/Q values are strongly in phase with NO variations and out of phase with the evolution of kNMHCs/NO. The comparisons
Integrated picture of the links among O3, P(O3), trace gas com-pounds, radiation, and surface windTo depict the integrated picture of the links between O3, P(O3), trace gas compounds, and surface wind, we designed a composite plot which includes the temporal variability of O3 and Ox (=O3+NO2), precursors of O3, model-diagnosed instantaneous and integrated O3-NOx-VOC sensitivities, model-diagnosed P(O3), j(O1D), and air mass trajectories. A sample period (from 2006-07-11 to 2006-07-13) with variable air mass trajectories is shown in Figure 8.In such a context, the O3/Ox ratio is low in the urban air masses while it is high in the rural air masses. This result is consistent with the high ambient NO concentrations found in urban areas. In addition, the nighttime O3/Ox ratio is low. However, this phenomenon is not caused
Figure 7. NOx (a) and VOCs (b) emissions in the 4km grid at 18:00 LST on August 20, 2008 in Beijing and NOx (c) and VOCs (d) emissions in the 4km grid at 18:00 LST on July 06, 2006 in PRD. The locations of the supersites are labeled as green circles.
115.5 116.0 116.5 117.0 117.5LAT
39.0
39.5
40.0
40.5
41.0
LON
20080820 18:00:0020080820 18:00:00
115.5 116.0 116.5 117.0 117.5LAT
39.0
39.5
40.0
40.5
41.0
LON
0.00
0.05
0.30
0.40
1.00
2.00
3.00
4.00
5.00
9.89
SNOx [mole/s]
(a)
PKU
YUFA
115.5 116.0 116.5 117.0 117.5LAT
39.0
39.5
40.0
40.5
41.0
LON
20080820 18:00:0020080820 18:00:00
115.5 116.0 116.5 117.0 117.5LAT
39.0
39.5
40.0
40.5
41.0
LON
0.000.051.002.003.004.005.006.007.008.009.00
10.0011.0012.0013.0014.0015.0036.00
SVOC [mole/s]
(b)
PKU
YUFA
112.0 112.5 113.0 113.5 114.0 114.5 115.0LAT
21.5
22.0
22.5
23.0
23.5
24.0
LON
20060706 18:00:0020060706 18:00:00
112.0 112.5 113.0 113.5 114.0 114.5 115.0LAT
21.5
22.0
22.5
23.0
23.5
24.0
LON
0.000.010.030.040.050.060.070.090.100.110.130.140.150.160.170.190.200.210.230.240.34
SNOx [mole/s]
(c)
BG
GZ
XK
112.0 112.5 113.0 113.5 114.0 114.5 115.0LAT
21.5
22.0
22.5
23.0
23.5
24.0
LON
20060706 18:00:0020060706 18:00:00
112.0 112.5 113.0 113.5 114.0 114.5 115.0LAT
21.5
22.0
22.5
23.0
23.5
24.0
LON
0.000.051.002.003.004.005.006.007.008.009.00
10.0011.0012.0013.0014.0015.0036.00
102.30SVOC [mole/s]
(d)
BG
GZ
XK
IGACtivities 34

morning hours could be controlled by the NOx-sensitive chemistry (July 11th) and the afternoon hours could be controlled by the VOC-sensitive chemistry (July 12th). All of this could be determined by simultaneously measuring NO, the kNMHCs/NO ratio and the air mass trajectory. Overall, the daily integrated O3-NOx-VOC sensitivity seems to be mostly determined by the daily initial conditions, which depends on the regional atmospheric transport of chemical constituents. Moreover, com-parisons between Ox and P(O3) demonstrate that both their magnitudes and their relative day-to-day variations do not match. This discrepancy underlines the importance of retrieving the O3 vertical profiles and O3 vertical transport flux.
demonstrate that the critical NO level is around 1ppbv and the critical kNMHCs/NO ratio is around 5. Between them, the latter should be the determining factor, and the former could be deduced from the latter since the kNMHCs values are relatively stable around 5-10 in the suburban/rural regions. When surface winds are not variable, the evolution in O3 sensitivity to NOx vs VOC appears to be driven by the diurnal variations of the solar zenith angle and photolysis frequencies (i.e j(O1D)), since the OH and peroxy radical concentration grows with j(O1D), and in turn NOx is removed via OH. However, the scale of this development could be different from day to day; and in some cases, the
0
20
40
60
80
100
O3,
O3+
NO
2 [pp
b]
(a)
0.0010.010.101.0010.0100.1000
NO
[ppb
]k N
MH
Cs/N
O [p
pb−1
s−1 ] (b)
−1.0
−0.5
0.0
0.5
1.0
RIR
[%/%
], L N
/Q
(c)
00:0011.07.06
00:0012.07.06
00:0013.07.06
00:0014.07.06
0
10
20
30
40
50
P(O
3) [p
pb/h
]j(O
1 D)[1
06 s−1 ]
(d)
112 113 114 115LON
18
19
20
21
22
23
24
25
LAT
0:00
14:00
0:00
14:00
4:00
14:00
24:00
July 11
July 12
July 13
BG
GZ
Southern Chinese Sea
Main land
(e)
Figure 8. O3, O3+NO2, NO, kNMHCs/NO, RIRs, LN/Q, P(O3) and 24hr air mass trajectories July 11 13, 2006 (PRiDe2006 dataset). In Panel (a), O3 and O3+NO2 are shown as red and black lines respectively; in panel (b), NO and kNMHCs/NO are shown as green and blue lines; in panel (c), RIR(AHC) and RIR(NO) are shown as red and cyan pluses respectively, while LN/Q is shown as a solid black line (with another OBM model run with nighttime simulation included as a dotted black line to trace the conditions in nighttime); in panel (d), the modeled P(O3) and its proxies calculated by k[HO2(obs)][NO] are shown as a black line and circles respectively (j(O1D) is shown as red lines); in panel (e), the air mass trajectories are generated by the HYSPLIT transport and dispersion model from the NOAA ARL website. The nighttime periods in panels (a)(d) are shadowed with dense medium grey horizontal lines.
IGACtivities35

and extract a simpler predictor for which chemical constituents must be controlled at different times of the day to reduce ozone amounts. In the context of air quality standards to protect the human health, two parameters are used as metrics for allowable ozone amounts. One is the eight hour averaged concentrations and the other is the “instantaneous” sampled peak value. In our frequency analyses, three dif-ferent sample spaces are investigated: the whole dataset (I), a subset which includes data within the time periods preceding the daily peak ozone time every day (II), and a subset which includes the complement data to the second dataset, i.e. the period following the peak ozone time (III) (Figure 9).The analysis of sample space I data (solid lines in Figure 9) indicates that in urban areas O3 formation occurs within the VOC-sensitive regime, but in
the suburban/rural areas peaks in ozone can occur under either a VOC or NOx-sensitive regime. This is consistent with our analysis of the integrated RIRs derived from mean diurnal profiles of the observed trace gas concentrations (Figure 4). The analysis of sample space II (dotted lines in Figure 9) indicates that O3 formation preceding the daily maximum O3 values are controlled by VOC-sensitive chemistry or in the transition from VOC to NOx-sensitive chemistry. This implies that VOC reductions would be an appropriate means of reducing the maximum O3 values in most cases. Analysis of sample space III (dashed line in Figure 9) indicates that O3 formation following the daily peak in O3 is controlled by strongly NOx-sensitive chemistry in some suburban/rural areas. A short-term NOx reduction policy could
How should regional ozone pollution be controlled?Controlling regional ozone pollution, from a scientific point of view, requires clarification of the functional dependence of the photochemical ozone production rate on its precursors. However, as the above discussion demonstrates the functional dependence of ozone is complicated by a number of factors. In order to be of utility in decision-making for a regional ozone reduction policy, we have tried to reduce the analysis to a smaller set of controlling parameters. Recalling that the value LN/Q is an indicator of the photochemical sensitivity for ozone production (LN/Q>0.5 indicates a hydrocaron sensitive regime; LN/Q<0.5 indicates an NOx-sensitive regime), we decided to use a frequency analysis of LN/Q to try
Urban
0.00135
0.022750.050.10
0.15870.200.300.400.500.600.700.800.84140.90
0.97725
0.99865
Cum
ulat
ive
frequ
ency
(a) GZ
Suburban/rural
0.00135
0.022750.050.10
0.15870.200.300.400.500.600.700.800.84140.90
0.97725
0.99865
(b) XK
0.00135
0.022750.050.10
0.15870.200.300.400.500.600.700.800.84140.90
0.97725
0.99865
Cum
ulat
ive
frequ
ency
(c) GZ
0.00135
0.022750.050.10
0.15870.200.300.400.500.600.700.800.84140.90
0.97725
0.99865
(d) BG
0.0 0.2 0.4 0.6 0.8 1.0
LN/Q
0.00135
0.022750.050.10
0.15870.200.300.400.500.600.700.800.84140.90
0.97725
0.99865
Cum
ulat
ive
frequ
ency
(e) PKU
0.0 0.2 0.4 0.6 0.8 1.0
LN/Q
0.00135
0.022750.050.10
0.15870.200.300.400.500.600.700.800.84140.90
0.97725
0.99865
(f) YUFA
Figure 9. Cumulative frequencies of LN/Q at Urban and Suburban supersites in field campaigns PRiDe2004, PRiDe2006, and CAREBeijing2006. The cumulative frequencies for the whole period are shown as solid lines. For each day, the time period is further subdivided into two subgroups as before and after the time point when the maximum O3 concentrations appear. The cumulative frequencies of LN/Q in those two periods are shown as dotted and dashed lines respectively.
IGACtivities 36

scales. The temporal and spatial variability of RIRs and LN/Q clarify that the P(O3)-precursor sensitivity is an extensive property of the atmosphere whose description needs to be restricted to certain space locations and time intervals. Moreover, this integrated view highlights the fact that the O3-NOx-VOC sensitivity for the suburban/rural areas is determined more by transport of ozone precursors into the region than the local photochemical processes. As a summary for policy consideration, we conclude that VOC reductions would be beneficial for regional reductions of peak ozone concentrations while NOx reductions would be valuable for reducing ozone during specific time windows in suburban/rural areas.
AcknowledgmentsThis work was supported by the National Natural Science Foundation of China (No. 40675072), the National High Technology Research and Development Program of China (863 Program, NO. 2006AA06A306), and the Beijing Council of Science and Technology (No. HB200504-6 and No. HB200504-2). ReferencesCardelino, C.A. and W.L. Chameides, 1995, An observation-
based model for analyzing ozone precursor relationships in the urban atmosphere, J. Air & Waste Management Assn., 45, 161-180.
Chou, C.C.K., C.Y. Tsai, C.J. Shiu, S.C. Liu and T. Zhu, 2009, Measurement of NOy during campaign of air quality research in Beijing 2006 (carebeijing-2006): Implications for the ozone production efficiency of NOx, J. Geophys. Res., 114, doi:10.1029/2008jd010446.
Garland, R.M., O. Schmid, A. Nowak, P. Achtert, A. Wiedensohler, S.S. Gunthe, N. Takegawa, K. Kita, Y. Kondo, M. Hu, M. Shao, L.M. Zeng, T. Zhu T, M.O. Andreae and U. Pöschl, 2009, Aerosol optical properties observed during carebeijing-2006: Characteristic differences between the inflow and outflow of Beijing city air, J. Geophys. Res., doi:10.1029/2008JD010780.
Hofzumahaus, A., F. Rohrer, K.D. Lu, B. Bohn, T. Brauers, C.C. Chang, H. Fuchs, F. Holland, K. Kita, Y. Kondo, X. Li, S.R. Lou, M. Shao, L.M. Zeng, A. Wahner and Y.H. Zhang, 2009, Amplified trace gas removal in the troposphere, Science, 324, 1702-1704, doi:10.1126/science.1164566.
Hu, J.L. and Y.H. Zhang, 2005, Process Analysis of Ozone Formation in the Yangtze River Delta, Research of Environmental Sciences, 18(2), 13-18.
Hua, W., X.M. Chen, C.Y. Jie, Y. Kondo, A. Hofzumahaus, N. Takegawa, C.C. Chang, K.D. Lu, Y. Miyazaki, K. Kita, H.L. Wang, Y.H. Zhang and M. Hu M, 2008, Atmospheric hydrogen peroxide and organic hydroperoxides during pride-prd’06, China: Their concentration, formation mechanism and contribution to secondary aerosols, Atmos. Chem. Phys., 8, 6755-6773.
Kleinman, L.I., P.H. Daum, J.H. Lee, Y.N. Lee, L.J. Nunnermacker, S.R. Springston, L. Newman, J. Weinstein-Lloyd and S. Sillman, 1997, Dependence of ozone production on no and hydrocarbons in the troposphere, Geophys. Res. Let., 24, 2299-2302.
be developed for those regions for the corresponding time window as a way of reducing the total daily ozone exposure.
ConclusionsThree intensive field campaigns in the Beijing and Pearl River Delta (PRD) regions provided a good opportunity to capture air pollution features and explore the dependence of ozone production rate on precursors. In each of the field campaigns, regional conditions are recorded at two supersites set up in urban or suburban/rural areas. The diurnal-averaged O3 concentrations were moderately high and the hydrocarbon (HC) reactivity was relatively high at all the sites. While high NO concentrations were observed at the urban site in PRD, medium and low NO concentrations were observed at the urban site in Beijing and at all the suburban/rural sites. In order to explain the buildup of ambient O3 concentrations and the relation to its major precursors (i.e. HCs and NO) in all these locations, we ran an observational based model (OBM) to calculate the net photochemical ozone production rate, P(O3), and its sensitivity to primary emitted pollutants including AHC (anthropogenic HC), NHC (natural HC), CO, and NO. Fast P(O3) values were diagnosed using the OBM for both the Beijing and PRD regions. These showed consistency with the corresponding daytime buildup of the O3+NO2 concentrations.At the BG (rural Pearl River Delta) and YUFA (suburban Beijing) sites, the model calculations of P(O3) levels could be partly supported by the directly measured HO2 radicals. Thus, we think the observed O3 concentrations are locally produced through photochemical reactions which imply that non-local pollution influences are via the transport of ozone precursors into these regions, rather than via direct import of O3. We also calculated relative incremental reactivities (RIRs) and the parameter LN/Q in order to describe the P(O3)-precursor sensitivity at long and short time scales, respectively. Overall, we found that the variation of RIRAHC and RIRNO could basically be explained by the variation of kNMHCs/NO, while the variation of RIRNHC and RIRCO shows consistency with the variation of kNMHCs/NO, kISO/kNMHCs, or CO for certain kNMHCs/NO intervals. Further, we found that a currently unidentified HONO source can contribute substantially to the calculated P(O3) values for most of the investigated supersites, though it will not change the relative ratios among different RIRs. RIR values show that the urban regions most likely can be categorized as VOC-sensitive regimes, while the suburban/rural regions’ ozone production can be either strongly VOC-sensitive or strongly NOx-sensitive. The diurnal (morning-to-afternoon) photochemical development is described by the parameter LN/Q. Using this parameter, we can see that the P(O3)-precursor sensitivity can be variable on short time
IGACtivities37
Wang, X.S., J.L. Li, Y.J. Zhang, et al. 2009, Ozone source apportionment in Beijing areas, Sci. China Ser. B, 39(6), 548-599.
Xu, J., Y.H. Zhang, W. Wang, 2006, Numerical study on the impacts of heterogeneous reactions on ozone formation in the Beijing urban area, Adv. Atmos. Sci., 23(4), 605-614.
Zhang, J., T. Wang, W.L. Chameides, et al., 2007, Ozone production and hydrocarbon reactivity in Hong Kong, Southern China, Atmos. Chem. and Phys., 7.557-573.
Zhang, Y.H., K.S. Shao, X.Y. Tang, 1998. Photochemical pollution in Chinese cites, Acta Scientiarum Naturalium Universitatis Pekinensis, 34(2-3), 392-400.
Zhang, Y.H., M. Hu, L.J. Zhong, A. Wiedensohler, S.C. Liu, M.O. Andreae, W. Wang and S.J. Fan, 2008a. Regional integrated experiments on air quality over Pearl River Delta 2004 (pride-prd2004): Overview, Atmos. Environ., 42, 6157-6173.
Zhang, Y.H., H. Su, L.J. Zhong, Y.F. Cheng, L.M. Zeng, X.S. Wang, Y.R. Xiang, J.L. Wang, D.F. Gao, M. Shao, S.J. Fan and S.C. Liu SC, 2008b, Regional ozone pollution and observation-based approach for analyzing ozone-precursor relationship during the pride-prd2004 campaign, Atmos. Environ., 42, 6203-6218.
Zhao, C.S., L. Peng, A.D. Sun, et al., 2004, Numerical modeling of tropospheric ozone over Yangtze Delta region, Acta Scientiae Circumstance, 24(3), 525-564.
Zheng, J.Y., L.J. Zhang, W.W. Che, et al., 2009, A highly resolved temporal and spatial air pollutant emission inventory for the Pearl River Delta region, China and its uncertainty assessment, Atmos. Environ., 43, 5112-5122.
Kleinman, L.I., 2000, Ozone process insights from field experiments - part II: Observation-based analysis for ozone production, Atmos Environ., 34(12-14), 2023-2033.
Kleinman, L.I., 2005, The dependence of tropospheric ozone production rate on ozone precursors, Atmos. Environ., 39, 575-586, doi:10.1016/j.atmosenv.2004.08.047.
Kleinman, L.I., P.H. Daum, Y.N. Lee, L.J. Nunnermacker, S.R. Springston, J. Weinstein-Lloyd and J. Rudolph, 2005, A comparative study of ozone production in five U.S. Metropolitan areas. J. Geophys. Res, 110, D02301, doi:10.1029/2004jd005096.
NARSTO, 2000, An assessment of troposheric ozone pollution: A north american perspective.
Shao, M., X.Y. Tang, Y.H. Zhang, et al. 2006. City clusters in China: air and surface water pollution, Front. Ecol. Environ., 4, 353-361.
Su, H., Y.F. Cheng, M. Shao, D.F. Gao, Z.Y. Yu, L.M. Zeng, J. Slanina, Y.H. Zhang and A. Wiedensohler, 2008, Nitrous acid (hono) and its daytime sources at a rural site during the 2004 pride-prd experiment in China, J. Geophys. Res, 113.
Tang, W.Y., C.S. Zhao, F.H. Gen, et al., 2009. Research of weekend ozone effect in Shanghai areas, Sci. China Ser. D., 39(1), 99-105.
Wang, T., A.J. Ding, J. Gao J, et al., 2006, Strong ozone production in urban plumes from Beijing, China, Geophys. Res. Lett., 33(21), 806-811.
Wang, X.S. and J.L. Li, 2002, The contribution of anthropogenic hydrocarbons to ozone formation in Beijing areas, China Environ. Sci., 22(6), 501-505.
The ACCENT Synthesis has now been publishedas a special issue of Atmospheric Environment. This comprehensive review of the present knowledge in the field of atmospheric composition change follows a problem-oriented approach describing the effects of the changes on climate, regional air quality and ecosystems. Recent advances in instrumentation and methodologies for measuring atmospheric composition change from space, aircraft and the surface, as well as novel laboratory techniques are also reviewed with an emphasis on innovative technologies that will become operational in the near future.
In addition, two further contributions discuss the issues of training of young scientists and the learning tools on atmospheric composition change for different school levels, and the interaction between science and society within the general theme of atmospheric sciences.
Volume 43, Issue 33, Atmospheric Environment, pages 5135-5442 (October 2009) is available at: http://www.sciencedirect.com/science/issue/6055-2009-999569966-1528389
IGACtivities 38

Please help us keep our mailing list up to date by sending your
revised contact information:
IGAC Core Project OfficeJISAO, Univ. of Washington
3737 Brooklyn Ave NESeattle, WA USA 98105
email: [email protected]
Editor:Sarah Doherty
Production Manager:HoChing Lee
Newsletter Design:Beth Tully
IGAC logo:Linda Kubrick
Past issues of IGACtivities can be downloaded from
http://www.igac.noaa.gov/newsletter/
http://www.icacgpigac2010.ca/index.html
IGACtivities39

Printed on Recycled PaperPlease Recycle after Use!
Taipei TAIWAN
R.O.C.
POSTAGE PAID
LICENCE NO.N285
IGAC Core Project OfficeRESEARCH CENTER FOR ENVIRONMENTAL CHANGEACADEMIA SINICA128 Academia Rd. Sect. 2P.O. Box 1-55 NanKangTaipei, 11529 Taiwan
NEWSLETTERNewsletter
A Note from the IGAC Co-chairs: Kathy Law and Tong Zhu
The earth’s tropical regions are the chemical powerhouse of the atmosphere: the surface and lower atmosphere are tightly coupled through atmosphere-biosphere exchanges, and it is also in these regions where deep convection provides a pathway for near-surface emissions to reach the upper troposphere. In the article “Atmospheric Chemistry in the Tropics: Marine, Biosphere and Climate Connections”, Sturges and Reeves summarize the scientific findings and discussions on this topic from a meeting initiated by the United Kingdom IGBP National Committee, held at the Royal Society in London on 30 June 8th, 2009.
Biosphere-atmosphere interactions are also highlighted by Kaiser et al., who outline the opportunity to integrate new space-based observations and modeling capabilities to better quantify the role of fire in the earth system. These findings result from discussions at a European Space Foundation (ESF) workshop on “Improved Quantitative Fire Description with Multi-Species Inversions of Observed Plumes”.
Three further articles highlight aspects of atmospheric chemistry in and around the urban environment. With the fast economic and social development as well as urbanization in China, air pollution in Chinese cities has become a serious concern, especially in megacities like Beijing and in the Pearl River Delta region. In the last decade international collaborative research programs, such as CAREBeijing and PRIDE-PRD, have been conducted to systematically study air pollution formation processes in Chinese megacities. In this issue, three set of authors from Peking University summarize the some of the major findings from these campaigns. In the article “Particle pollution in Beijing: features, source and secondary formation”, Hu et al., report the change of mass concentration, chemical composition, and the sources of particulate mater in Beijing in the last ten years, and they present recent findings about new particle formation and optical closure. Ozone is an emerging pollutant in Chinese cities, and Zhang and Lu use an Observation Based Model and field campaign data to analyze “the dependence of ozone production rate on ozone precursors in the Beijing and Pearl River Delta regions”. In the article “Trends in summertime non-methane hydrocarbons in Beijing”, Shao et al. report on the decreasing trends in NMHCs, NOx, and Ox and an increase in O3 concentrations observed in the month of August from 2004-2009, and the source apportionment results.
Finally, we’d like to close by reminding you that the next IGAC conference will be held joint with CACGP 11-16 July 2010 at Dalhousie University in beautiful Halifax, Nova Scotia, Canada. We hope you can join us there to share in the latest in atmospheric chemistry research.
Announcements & Save the Date • Inside Back Cover
Trends in summer-time non-methane hydrocarbons in Beijing city, 2004-2009
18Particle pollution in Beijing: features, source and secondary formation
10Understanding the processes involved in biomass burning
8Atmospheric chemistryin the tropics: marine,biosphere and climateconnections
2 The dependence ofozone production rateon ozone precursors in the Beijing andPearl River Delta regions
26
Issue No. 42December 2009
NewsletterNewsletter of the International Global Atmospheric Chemistry Project