Tailwater Revealed: Uncovering how Agricultural Run … · Tailwater Revealed: Uncovering how...
13
Tailwater Revealed: Uncovering how Agricultural Run-off Impacts Water Quality in the Shasta Valley Lisa Unkefer, AquaTerra Consulting Dave LaPlante, Natural Resources Geospatial Shasta Valley Resource Conservation District
Transcript of Tailwater Revealed: Uncovering how Agricultural Run … · Tailwater Revealed: Uncovering how...
Tailwater Revealed: Uncovering how Agricultural Run-off Impacts Water Quality in the Shasta Valley
Lisa Unkefer, AquaTerra Consulting
Dave LaPlante, Natural Resources Geospatial
Shasta Valley Resource Conservation District

What is Tailwater?
• Surface water is diverted out of the Shasta River or it’s tributaries
• Sometimes travels miles in irrigation ditches or pipes to the “point of use”
• Turned out onto fields to run across the land being used by plants, evaporating, percolating or running off as TAILWATER

Tailwater Neighborhood
• Tailwater runs off either back to the river or onto another property
• Due to TMDL’s we needed to ask…
Who’s water is it? and
Who is responsible for it?
Grant Funding• Under Prop 40/50 Agricultural Water Quality money the
SVRCD received funding from State Water Resources Control Board
• Project Goal: Keep warm water out of river and cold water in the river
• Identify neighborhoods valley-wide• Prioritize the neighborhoods for impacts to WQ• Implement 4-7 high priority tailwater reduction
projects• Monitor pre and post for project success

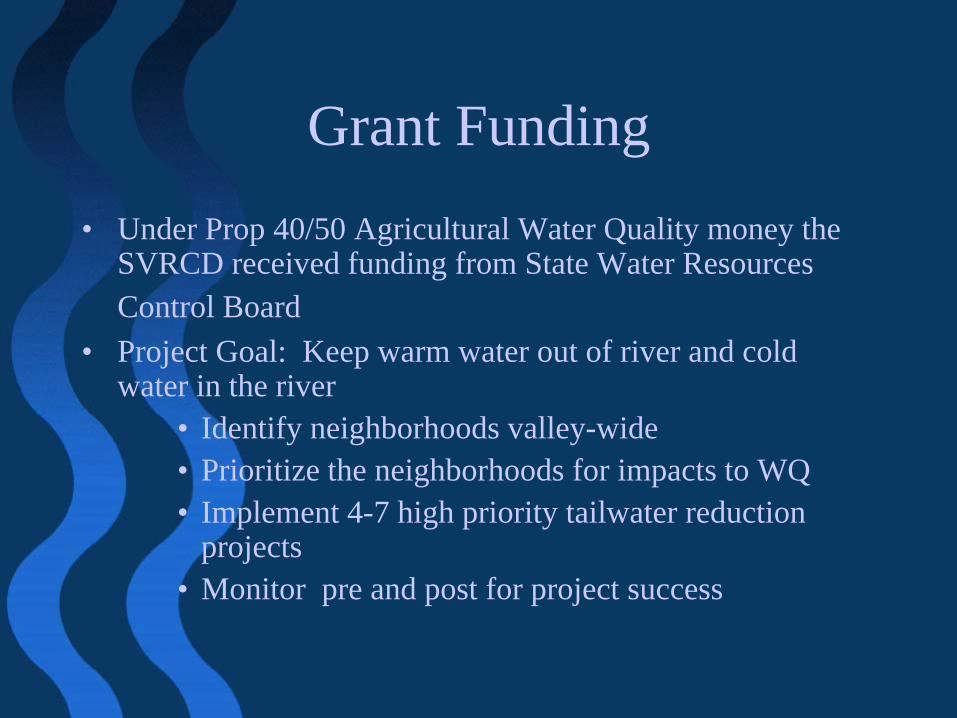
Neighborhood Identification
• LiDAR Flight • NRG utilized GIS to
perform flow accumulation model– Obtain Drainage lines– Pour points– Drainage areas
Tailwater Neighborhoods
Prioritizing Neighborhoods
• Tailwater Advisory Committee• Neighborhood Criteria
– Location of return related to identified salmon rearing areas
– Quantity of tailwater re-entering waterway– Degree tailwater affects river temperature– Tailwater monitoring data available

Tailwater QuantityFunded by California Department of Fish & Game (during bond
freeze)• Irrigation Water Applied
– Using standard NRCS application rates for crop need (Pasture or Crop)– Irrigation efficiency rates (Flood or Sprinkle)
• Run-off Coefficient– Calculate runoff class (Low – Very High) for each FIELD UNIT based
on slope, infiltration rates (Ksat), crop cover type
• Results calibrated against 16 monitoring locations– Short & long-term – Flow, Temperature (river & tailwater), nutrients

River Temperature Impacts
• To obtain river temperatures after tailwater returns the following estimates/data was used in the standard mixing equation for each pour point:– “Average Daily Flow” for the season before return– “Average Daily Temperature” for river before return– Modeled/monitored tailwater quantity for “Average
Daily Max”– Monitored tailwater temperature “Average Daily Max”

Model Conclusions
• Accumulated impacts: May need projects to reduce returns on many neighborhoods at once.
• Tailwater has greater impact on upper watershed• Big returns: Many returns are too big to attempt to
fix at the bottom end, must outreach to neighborhoods to increase efficiency first and capture/reuse/treat remainder

Neighborhood Prioritization

Next Steps• Outreach to landowners in high priority
neighborhoods for project implementation– Ideally increase efficiencies for entire neighborhoods
and implement projects at pour points to cool/treat whatever still returns
• RCD has received additional grant for Tailwater II– Will use LiDAR to refine hydrography and map key
agricultural conveyance – DWR Water Rights adjudication data will be integrated
into data model - will be used to more accurately model water use at field level
– Expand monitoring to upper watershed to refine model coefficients
– Explore time series computation model for determining where tailwater has greatest impacts when fish are present

Project Contributors:State Water Resources Control BoardCalifornia Department of Fish and GameThe Nature Conservancy
Contact Information:Shasta Valley RCD 530-842-6121
AquaTerra Consulting 530-938-4869Natural Resource Geospatial 530-842-2246