Tailoring the Acoustic Properties of Truss-Core Sandwich ...
95
Tailoring the Acoustic Properties of Truss-Core Sandwich Structure by Richard Lee A thesis submitted in conformity with the requirements for the degree of Master of Applied Science Graduate Department of Aerospace Science and Engineering University of Toronto © Copyright by Richard Lee 2012
Transcript of Tailoring the Acoustic Properties of Truss-Core Sandwich ...

Tailoring the Acoustic Properties of Truss-Core Sandwich Structure
by
Richard Lee
A thesis submitted in conformity with the requirements for the degree of Master of Applied Science
Graduate Department of Aerospace Science and Engineering University of Toronto
© Copyright by Richard Lee 2012

ii
Tailoring the Acoustic Properties of Truss-Core Sandwich
Structure
Richard Lee
Master of Applied Science
Graduate Department of Aerospace Science and Engineering
University of Toronto
2012
Abstract
Undesirable cabin noise has an adverse physiological effect on passengers and crews in an
aircraft. In order to reduce the noise level, a passive approach using a truss-core sandwich (TCS)
panel as a sound insulator is proposed. Design guidelines and analysis methodologies were
developed in order to explore the vibro-acoustic characteristics of TCS structure. Its sound
isolation properties can be thereby assessed. Theoretical analyses show that the transmission-
loss and sound radiation properties of a TCS structure can be represented by the root-mean-
square velocity of its surface, and a beam structure analysis is sufficient to reveal many of the
important aspects of TCS panel design. Using finite element analysis, a sensitivity study was
performed to create design guidelines for TCS structures. Transmission-loss experiments show
that the analytical and numerical analyses correctly predict the trend of TCS structure’s vibro-
acoustic performance.

iii
Acknowledgments
I would like to thank my adviser, Professor Craig Steeves, for all his support, guidance, insight,
and time. His knowledge and advices on my research were an invaluable part of the successful
and timely completion of this research. I owe him much gratitude. I would also like to thank the
members of the RAC committee members: Professor Alis Ekmekci, Professor Philippe Lavoie,
and Professor David Zingg, for reviewing my work and provided me with much helpful and
constructive criticism.
General Dynamics Land Systems of Canada (GDLS-C) has been kind to me for letting me to
take an educational leave of absence so that I can concentrate on learning and exploring new
ideas to solve complex engineering problems at UTIAS. I want to thank Dave Crocker, the
Director of Engineering Design and Development at GDLS-C, for making this opportunity
possible. I would also like to thank Bombardier Aerospace (BA) for collaborating with us on
this research through the NSERC Engage grant program. Special thanks to Andrew Wareing,
Stephen Colavincenzo, and Raymond Wong from BA for their support in this program and
conducting the acoustic chamber experiments.
The following people had provided me with much support and made this research experience
much more enjoyable: Eska Ko for her friendship, support, and proof-reading my thesis.
Professor Jean Zu for her support on solving vibration problems. Collins Ogundipe and John
Chu for their help at the Multifunctional Structure Lab. George Lau, Nasim Shahbazian, Jenmy
Zhang, and Rhea Liem for their lunch-time conversations. All the members of the Sporting
UTIAS soccer team for an exciting season of soccer, and Ludwik Sobiesiak for organizing it.
People who were involved in the UTIAS Ping Pong ladder and the tournament for making these
events successful.
And finally, I would like to thank Dr. Simona Monaco for her constant support throughout my
Master degree endeavor. This degree would not have been possible without her encouragement
to pursue my dreams, as well as the courage and strength that she has shown me over the years.

iv
Table of Contents
Contents
Acknowledgments .......................................................................................................................... iii
Table of Contents ........................................................................................................................... iv
List of Tables ................................................................................................................................. vi
List of Figures ............................................................................................................................... vii
1 Introduction ................................................................................................................................ 1
1.1 Background ......................................................................................................................... 1
1.1.1 Source of Cabin Noise ............................................................................................ 1
1.1.2 Current Approaches to Reducing Cabin Noise ....................................................... 2
1.2 Truss-Core Sandwich .......................................................................................................... 3
1.3 Literature Review ................................................................................................................ 5
1.3.1 Truss-Core Sandwich Structure Unit Cell Designs ................................................ 5
1.3.2 Vibro-Acoustics Properties of Various Sandwich Panel Designs .......................... 6
1.4 Scope and Thesis Outline .................................................................................................... 7
2 Approach and Analysis .............................................................................................................. 9
2.1 Transmission and Radiation of Acoustic Noise .................................................................. 9
2.1.1 Turbulent Boundary Layer Pressure Fluctuation Loading on Fuselage ............... 10
2.1.2 Sound Radiation from Fuselage Panels ................................................................ 14
2.1.3 Transmission and Radiation of Acoustic Noise into the Cabin ............................ 15
2.2 Forced Vibration Analysis of a TCS Beam ...................................................................... 17
2.2.1 Governing Equations of a Beam ........................................................................... 18
2.3 Finite Element Analysis .................................................................................................... 25
2.4 Acoustic Chamber Experiments ....................................................................................... 27

v
3 Results and Discussions ........................................................................................................... 29
3.1 Analytical Analysis ........................................................................................................... 29
3.1.1 Initial Frequency Response Analysis Using Theoretical Formulation ................. 30
3.1.2 Sensitivity and Parametric Studies of Uniform Beam Structure Using
Theoretical Formulations ...................................................................................... 34
3.2 Finite Element Analysis of a TCS Structure ..................................................................... 38
3.2.1 Finite Element Model for a TCS Structure ........................................................... 38
3.2.2 Static Finite Element Analysis .............................................................................. 40
3.2.3 Dynamic Finite Element Analysis and Frequency Response Analysis ................ 41
4 Experimentation ....................................................................................................................... 54
4.1 TCS Panel Fabrication ...................................................................................................... 55
4.1.1 Quality Control ..................................................................................................... 55
4.1.2 Fabrication Procedures .......................................................................................... 56
4.2 Acoustic Chamber Testing of TCS Panels ........................................................................ 63
4.2.1 Incident Sound Field ............................................................................................. 63
4.2.2 TCS Panel Installation .......................................................................................... 64
4.2.3 Data Acquisition and Processing .......................................................................... 65
4.3 Comparison to the Finite Element Analysis Results ......................................................... 66
4.4 Discussions ....................................................................................................................... 68
5 Discussion ................................................................................................................................ 71
6 Recommendations .................................................................................................................... 82
Bibliography ................................................................................................................................. 83

vi
List of Tables
Table 1. Structural parameters for initial uniform beam forced vibration analysis ...................... 31
Table 2. Natural frequencies of a uniform beam for the initial analysis ....................................... 32
Table 3. Mechanical properties for pultruded carbon rod and carbon composite face-sheet ....... 40
Table 4. TCS designs and their attributes ..................................................................................... 42
Table 5. Effective mechanical properties of various TCS designs from static FEA .................... 43
Table 6. Summary of TCS structure sensitivity analyses ............................................................. 53
Table 7. Average transmission loss values for various designs .................................................... 79

vii
List of Figures
Figure 1. Truss core sandwich (TCS) structure .............................................................................. 4
Figure 2. Various diameters round carbon pultruded rods ............................................................. 4
Figure 3. Various TCS core unit cell designs – (a) diagonal array, (b) tetrahedral lattice [20], (c)
pyramidal lattice [16], (d) Kagome lattice [20] .............................................................................. 5
Figure 4. Natural frequencies from four different beam theories – Euler-Bernoulli, rotary-inertia
only, shear deformation only, and Timoshenko beam theory ....................................................... 22
Figure 5. Root-mean-squared velocity response of a Timoshenko beam with simply supported
boundary condition ....................................................................................................................... 25
Figure 6. Typical finite element analysis of a TCS beam with a simply supported boundary
condition ....................................................................................................................................... 26
Figure 7. Typical TCS panel fabrication setup using UTIAS Multifunctional Structures Lab
fixture design ................................................................................................................................ 27
Figure 8. Time averaged RMS velocities for near-resonance excitation frequencies as a function
of the spatial location for a uniform beam .................................................................................... 32
Figure 9. Time averaged RMS velocities for off-resonance excitation frequencies as a function of
the spatial location for a uniform beam ........................................................................................ 33
Figure 10. Comparison between beam’s center response and 15-point average response ........... 33
Figure 11. Comparison between theoretical beam’s response and finite element analysis results
using beam elements ..................................................................................................................... 34
Figure 12. Parametric study for varying the Young’s modulus by for the first 10 modes 35
Figure 13. Parametric study for varying the shear modulus by for the first 10 modes ..... 36

viii
Figure 14. Parametric study for varying the density of the uniform beam by for the first
10 modes ....................................................................................................................................... 36
Figure 15. Parametric study for varying the length of the uniform beam by for the first 10
modes ............................................................................................................................................ 37
Figure 16. Various TCS beam structure designs – Kagome, pyramid, tetrahedral, and diagonal
array unit cell designs ................................................................................................................... 39
Figure 17. Typical multi-point response from forced vibration analysis in ABAQUS ................ 40
Figure 18. Frequency response analysis for four base TCS beam designs measured in RMS
velocity .......................................................................................................................................... 44
Figure 19. Frequency response analysis for four base TCS beam designs measured in decibel .. 45
Figure 20. Mode shape and deformation pattern for a typical TCS beam structure ..................... 45
Figure 21. Frequency response analysis for diagonal array unit cell design with different pin
angles ............................................................................................................................................ 46
Figure 22. Frequency response analysis for tetrahedral unit cell design TCS beam with two
different pin diameters .................................................................................................................. 47
Figure 23. Frequency response analysis for tetrahedral unit cell design TCS beam with heavy pin
design ............................................................................................................................................ 48
Figure 24. Tetrahedral unit cell designs with spatially varying unit cell distances ...................... 49
Figure 25. Frequency response analysis for tetrahedral unit cell design TCS beam with spatial
unit cell distribution ...................................................................................................................... 50
Figure 26. Frequency response analysis for tetrahedral unit cell design TCS beam with various
face-sheet thicknesses ................................................................................................................... 51
Figure 27. Frequency response analysis for tetrahedral unit cell design TCS beam with various
face-sheet thicknesses and densities ............................................................................................. 52

ix
Figure 28. Side view of acoustic chamber experiment setup for TCS panel testing .................... 54
Figure 29. Cross-section of the TCS panel fixture (not to scale) .................................................. 57
Figure 30. Pin-guide fixture .......................................................................................................... 57
Figure 31. Fabricator cutting carbon pultruded rod ...................................................................... 58
Figure 32. TCS panel fixture – showing the bottom carbon fibre sheet lay-up ............................ 59
Figure 33. TCS panel fixture – showing the bottom carbon fibre sheet lay-up ............................ 59
Figure 34. TCS panel fixture – showing bottom catcher polystyrene foam – after the pins are
inserted .......................................................................................................................................... 60
Figure 35. Carbon pultruded rod is trimmed to improve penetration performance ...................... 61
Figure 36. Pins being pushed further into the core to ensure smooth surface .............................. 61
Figure 37. Vacuum bagging of the TCS panel ............................................................................. 62
Figure 38. Complete TCS panel – tetrahedral unit cell TCS panel .............................................. 63
Figure 39. White noise incident sound field spectrum intensity ................................................... 64
Figure 40. Sound intensity probe scanning pattern ....................................................................... 65
Figure 41. Acoustic chamber test results for two TCS panel in terms of transmission loss ......... 66
Figure 42. Normalized finite element analysis result for two TCS panels’ responses under unit
pressure load in terms of transmission loss ................................................................................... 67
Figure 43. Comparison of experimental and normalized FEA results of two TCS structures’
transmission loss characteristics ................................................................................................... 69

1
Chapter 1
Introduction
Cabin acoustic noise is undesirable for passengers and crew on an aircraft. Noise affects the
comfort of people on board an aircraft, and also has a physiological effect on people’s health,
causing noise induced hearing loss (NIHL), sound annoyance, and elevated stress levels of the
passengers. After extended exposure to high noise, typically exceeding 60 to 80 decibels (dB) of
a weighted sound level, people will start to experience a temporary threshold shift, which is the
primary measure of hearing loss. For these reasons, a reduction in cabin noise level has a direct
impact on the health of the passengers and flight crew, the performance of an aircraft, and
customers’ procurement decisions. In order to reduce the acoustic noise level inside an aircraft
cabin, the primary and secondary structural elements inside an aircraft must have superior
acoustic transmission loss (TL) properties. In addition, these components also need to provide
high stiffness with minimum weight in order to maximize an aircraft’s performance and ensure
the safety of the passengers. One type of such multi-functional material that is capable providing
these properties for an aircraft structure is called the truss-core sandwich (TCS) structure, and the
main focus of this research is to explore the design methodologies of TCS structures for
producing favourable acoustic transmission loss properties in aerospace applications.
1.1 Background
1.1.1 Source of Cabin Noise
Engine noise and the external flow excitation are the two major sources of the acoustic noise
inside an aircraft cabin. These acoustic disturbance sources cause pressure fluctuations around
the aircraft exterior, creating a forcing field on the aircraft fuselage. This pressure fluctuation
then imparts energy on the fuselage skin causing it to vibrate, and the vibrating elastic fuselage
surfaces radiate noise into the aircraft interior. Much of the noise that is generated by modern

CHAPTER 1. INTRODUCTION 2
gas turbine jet engines is directly related to the engine exhaust, and for a high bypass-ratio turbo
fan jet engine or a turbo prop jet engine, additional noise is generated by its fan and its propeller
respectively. During takeoff, initial climb and landing, a significant amount of noise is generated
by the engine. However, during cruise, the dominating cabin acoustic disturbance is caused by
the flow-induced pressure fluctuation. As air flow passes the fuselage, a turbulent boundary
layer (TBL) is developed. When the aircraft reaches its cruise altitude, the pressure fluctuation
and the cabin noise that are associated with the TBL will be elevated because the flight Mach
number is increased, while the engine noise is reduced during the cruise condition. Since the
cruise condition represents the majority of the flight time, the TBL induced noise is regarded as
the most significant source of noise for jet engine aircraft. As an example, when an aircraft is
flying at Mach 0.75, at an altitude of about 30,000 ft, it will generate 130 dB of noise disturbance
outside of the fuselage [1]. The transmitted acoustic noise inside an aircraft cabin can vary from
70 dB to 110 dB depending on the type of engine, the flight Mach number, altitude, external flow
condition, and the measurement location inside an aircraft cabin. Similar results were found by
several other researchers in their studies, as shown in [2-5]. Ribner [6] developed an empirical
formula to predict the magnitude of sound pressure levels generated by a range of aircrafts, such
as the Boeing 727, Convair 880, and McDonnell-Douglas DC8. For more modern aircraft, such
as the Boeing 747, the average cabin noise level for a flight from New York to Heathrow is
about 79 dB [7]. As a comparison, the noise generated by city traffic is about 80 dB, which is
similar to the cabin noise level. These data suggest that the TBL-induced cabin noise is
significant in an aircraft, and it is important to reduce the cabin noise level due to health related
issues.
1.1.2 Current Approaches to Reducing Cabin Noise
There are two main methods for reducing the cabin noise level: passive methods and active
control methods. Passive methods include structural modifications, material selection, and
damping augmentation. In general, active methods use synchrophasing, and the control of
acoustic field or the structural vibration to attain active noise cancellation (ANC). The principle
of ANC is to create an equal-amplitude and opposite-phase acoustic wave using an array of
microphones and speakers or by creating electronically controlled vibrations on a panel. There
are number of technical issues related to such systems. First, the reference microphone may pick

CHAPTER 1. INTRODUCTION 3
up signal from both the primary source (noise) and the secondary source (“anti-noise”), creating
a feedback loop, which will amplify the input signal. Also, it may be difficult to achieve high
coherence between the reference microphone and the primary source, which is required for good
performance of the system. In addition, a large number of speakers and microphones are
required to achieve global noise cancellation in an aircraft cabin, which makes this method
challenging. On the other hand, using vibration waves on electronically controlled panels
requires that all the sensors and actuators function properly over a wide range of operating
conditions, and over an extended period of time. The robustness of the system may involve high
unit and operating cost of the system over its lifetime if reliability is to be realized. Passive
methods do not suffer from the drawbacks of these active systems, and they are the focus of this
research project. In particular, the acoustic performance of TCS panels will be analysed and
investigated in order to develop a set of methodologies to design this kind of multi-functional
sandwich structure for passive control of an aircraft cabin noise level.
1.2 Truss-Core Sandwich
The motivation for using TCS panels to control the cabin noise level stems from their superior
mechanical properties and their potential for structural-acoustic optimization. A TCS structure
comprises of a pair of strong and stiff face-sheets, laminated to a low-density, light weight core,
as shown in Figure 1. In general, the core of a TCS panel is made up of stiff rods arranged in
one or more types of lattice structures. In this research, the material used for the rods is a
continuous carbon fibre reinforced epoxy resin composite, known as carbon pultruded rods (See
Figure 2). Such rods are low in density and high in uniaxial specific stiffness and strength,
which is ideal for creating high stiffness sandwich panels with minimal weight penalty. The
typical diameters for these carbon rods in a TCS structure are between 0.5 mm to 1.5 mm.
Metallic truss members can also be used for TCS panels. However, it was found that the specific
stiffness and strength of the all-composite truss core sandwich structure are superior to those of
metallic lattice TCS structures [10].
For the same reasons, the material used for the face-sheet in this research is also carbon
fibre composite. Bi-directional, plain weaved carbon fibre composite cloth will be used to
fabricate the face-sheets for the TCS structure in this research by laminating several layers of
carbon fibre cloth together, bonded by a two component mixture of epoxy and hardener. The

CHAPTER 1. INTRODUCTION 4
resin saturated composite is then vacuum-bagged for curing. The detailed fabrication for a TCS
panel comprising carbon fibre face-sheets and a core that is made up of carbon pultruded rods
will be discussed in Chapter Four. The three-dimensional, periodic, open-cell lattice structure
core not only provides the TCS structure with superior specific bending stiffness and crushing
strength, but it may also provide multi-functional capabilities, such as heat insulation, energy
absorption, vibration control, and space for wire passage. A number of unit cell designs for the
lattice core have shown promising mechanical properties, potential for optimization, and
manufacturability.
Figure 1. Truss core sandwich (TCS) structure
Figure 2. Various diameters round carbon pultruded rods
These designs include diagonal array, tetrahedral, pyramidal, and Kagome lattice truss
structures. These designs are shown in Figure 3. The specific properties of TCS panels that are
under investigation are the acoustic transmission loss properties, mechanical properties, and the
vibration responses of these structures. In order to explore how the structural-acoustic

CHAPTER 1. INTRODUCTION 5
performance of TCS structure can be controlled and optimized, TCS structure design parameters
will be varied so that their effects can be determined. These design variations will be examined
in detail in this research.
Figure 3. Various TCS core unit cell designs – (a) diagonal array, (b) tetrahedral lattice [20], (c)
pyramidal lattice [16], (d) Kagome lattice [20]
1.3 Literature Review
1.3.1 Truss-Core Sandwich Structure Unit Cell Designs
The tetrahedral unit cell design for TCS structure was investigated by a number of researchers
[11-13]. Deshpande and Fleck [12] have investigated the elastic properties, yield surface of the
homogenized material, and the collapse mechanism of the sandwich panels with one layer of
tetrahedral unit cell core. Wicks and Hutchinson [14-15] have estimated the strength of
sandwich panels subject to competing failure mechanisms. In addition, they also addressed the
optimization of sandwich panels subjected to crushing stress, bending, and transverse shear
stress. For the pyramidal unit cell design, Bart-Smith et al [16] used an experimental and
analytical approach to examine the in-plane compressive response of pyramidal truss core
sandwich columns and identified the various failure mechanisms of such design. For Kagome
unit cell design, Hyun et al [17-18] have shown that the isotropy and stability associated with the
plastic deformation of Kagome truss core are superior to those of octet truss in terms of

CHAPTER 1. INTRODUCTION 6
compression and shear loading. Similar benefits were identified by Wang et al [19] through
experimental techniques for the Kagome unit cell design.
1.3.2 Vibro-Acoustics Properties of Various Sandwich Panel Designs
The vibration characteristics and the frequency response of TCS structures need to be
investigated and compared to provide a basis to design a TCS structure for reduction of cabin
noise level. As early as 1959, Kurtze and Watters [21] studied sandwich structures for
increasing the acoustic sound TL between adjoining spaces. By investigating the relationship of
bending and shear waves to the TL properties of the structure, they suggested that the
coincidence frequency can be increased by using a soft core. Lang and Dym [22] created a
methodology to design a sandwich panel using only the density and thickness of the core and the
face-sheets as design parameters. Their results indicated that there are two fundamental means
for improving the TL of sandwich panels. The first is by using the mass law, which states that
the more massive and less stiff the panel is, the higher the TL would be. The second is by
increasing the core stiffness in order to increase the symmetric coincidence frequency, while
maintaining the anti-symmetric coincidence at low frequencies. In terms of aerospace
applications of sandwich material, Barton and Mixson [23] and Grosveld and Mixson [24]
investigated the possibility of using honeycomb core panel to achieve high TL to attenuate the
propeller noise in an aircraft. Moore and Lyon [25] developed a number of analytical models to
predict the TL properties of sandwich structures with isotropic and orthotropic core. It was
found that coincidence occurs near the conventional double-wall resonance frequency, which can
be determined by the stiffness of the core and the mass of the face-sheets, for symmetric modes.
However, for a core structure that is orthotropic, the acoustic behaviour depended on the
direction of propagation over the surface of the panel. Thamburaj and Sun [26] demonstrated
that an anisotropic core can achieve higher TL and further improvement can be attained by
proper face-sheet design. El-Raheb [27] studied the frequency response of a two-dimensional
truss-like periodic panel using the transfer matrix method. In his research, the effects of panel
curvature, sag of cell diagonal member, adding mass to the cell by filling them with water, and
damping characteristics were studied. It was found that the structure’s vibration and acoustic
isolation capabilities strongly strongly depend on the core configuration. This characteristic was
also agreed by Ruzzene et al [28] in their study. In addition, El-Raheb and Wagner [29]
investigated the sound transmission across a panel structure in contact with an acoustic fluid on

CHAPTER 1. INTRODUCTION 7
both its surfaces. The TL properties of two different geometries were computed and compared
with measurements in his study. Spadoni and Ruzzene [30] found that efficient attenuation can
be obtained by confining the deformations to the core element. As a result, varying the design of
the unit cell at the core potentially allows tuning the core configuration in order to achieve a
specific level of sound attenuation over a specific range of frequency bands. One of the
advantages of TCS structure is its potential for optimization due to the variation in unit cell
designs and distribution of these designs. A number of researchers have shown that structural
acoustic optimization can efficiently mitigate cabin noise. The work of Crane et al. [31] and
Cunefare et al. [32] indicated that spatial variations of the design parameters would provide
improved TL properties compared to uniform properties. In addition, spatial orientation and
directionality must also be considered in order to produce optimal designs. Although there are
many papers that discuss the various aspects of different TCS structures, there are none on
analyzing a wide range of composite-base TCS designs and how the various design parameters
affect these structures in terms of their vibro-acoustic performance. The present research will fill
this gap.
1.4 Scope and Thesis Outline
The main goals of this research are to develop methodologies and provide guidelines for
designing a TCS structure for reduction of aircraft cabin noise. In order to achieve these
objectives, the fundamental nature of the acoustic disturbance must be identified, the process of
sound transmission and sound radiation through a partition must be recognized, the wave
propagation and vibration nature of the TCS panel must be studied, and the frequency response
of the panel upon excitation must be analyzed. Due to the complex nature of the problem and
the structure, a mixture of analytical, numerical, and experimental approaches will be used. In
Chapter Two, the theoretical background regarding acoustic wave propagation, transmission and
radiation will be presented. Understanding the basic mechanics of acoustic noise propagation, it
will be shown that the sound radiation performance of a panel structure is closely related to the
vibration behaviour of the panel, thus the vibration characteristics of a panel will also be
discussed in Chapter Two. Having developed the necessary theoretical analyses of the problem,
the detailed analysis of various TCS structures and their results will be presented in Chapter
Three. Although a theoretical approach was used to determine the response of beam structures

CHAPTER 1. INTRODUCTION 8
under force vibration, the TCS beam structures are too complicated to be accurately analyzed by
the analytical approach. For this reason, finite element analysis (FEA) will be used to determine
the frequency response of TCS beam structures having various core unit cell designs. Parametric
studies will be performed using the data obtained from the FEA, and thus design guidelines of
TCS structures can be quantitatively determined. The results of the FEA will be presented in
Chapter Three. The experimental approach used to determine the TL performance of TCS
panels will be described in Chapter Four. The fabrication methods of the TCS panel structure
specimen will be explained and illustrated. In addition, the results of the TL window testing of
the TCS panels at the Bombardier Aerospace’s acoustic chamber facility will also be presented.

9
Chapter 2
Approach and Analysis
The purpose of this research is to develop the necessary analytical tools, methodologies, and
guidelines to design a TCS panel for structural-acoustic performance to reduce cabin noise level.
The knowledge of how a fluid exerts forces on a vibrating structure, the vibro-acoustic behaviour
of the structure, and sound radiation by the vibrating structures is crucial in the analysis of a TCS
panel. For these reasons, the mechanisms that are related to sound transmission, radiation, and
response will be discussed in this chapter. Various approaches will be used in this research,
which include theoretical analysis, numerical modeling using finite element analysis (FEA), and
experimentation, in order to take advantage of the strengths and to overcome the shortfalls of
these analysis methods. These methods will be examined in this chapter. Although the
absolute sound intensity level and the transmission loss index can be determined, determining the
relative acoustic and vibrational performance of the TCS structure designs is sufficient to
achieve the objectives of this research. Idealization and simplification of the analysis will be
made in order to improve the efficiency of this research without sacrificing the validity of its
results; these will be discussed in this chapter.
2.1 Transmission and Radiation of Acoustic Noise
As discussed in the previous chapter, the acoustic noise inside a jet powered aircraft cabin is
mainly induced by the TBL pressure fluctuation. The TBL excites the exterior of the fuselage,
causing it to vibrate and radiate sound into the interior of an aircraft. The radiated sound from
the fuselage creates a second pressure field, which excites the structural panels that are enclosing
the passenger cabin and the cockpit. The vibration of these structural panels causes cabin air to
accelerate, which is in contact with the surface, changing the density of the fluid, and thus
producing noise. In order to analyse the acoustic performance of these structural panels, it is

CHAPTER 2. APPROACH AND ANALYSIS 10
beneficial to understand the mechanisms and mathematical models of these sound transmission
processes.
2.1.1 Turbulent Boundary Layer Pressure Fluctuation Loading on Fuselage
Due to the random nature of TBL excitation, the resultant pressure fluctuation on the fuselage
can be described by statistical analysis, which is usually known as the pressure power spectral
density (PPSD). Assuming a fully developed flow and zero mean pressure gradient, the flow can
be considered to be stationary and homogeneous in space. Let the flow be in the x-direction
along the fuselage, and the lateral direction is in the y-direction, which is perpendicular to the x-
axis and on the surface of the fuselage, then the PPSD over a surface at a location x and y can be
defined as:
where is the reference pressure at the reference location and , and P is the pressure
on a fuselage panel located at x and y. Using Corcos’ formulation [33, 34], the PPSD can be
approximated by:
where and are empirical parameters, which represent the loss of coherence in the
longitudinal and transverse directions, is the angular frequency, and is the convective speed
of the TBL. The reference PPSD, , can be estimated by Efimtsov model [35]:
with:
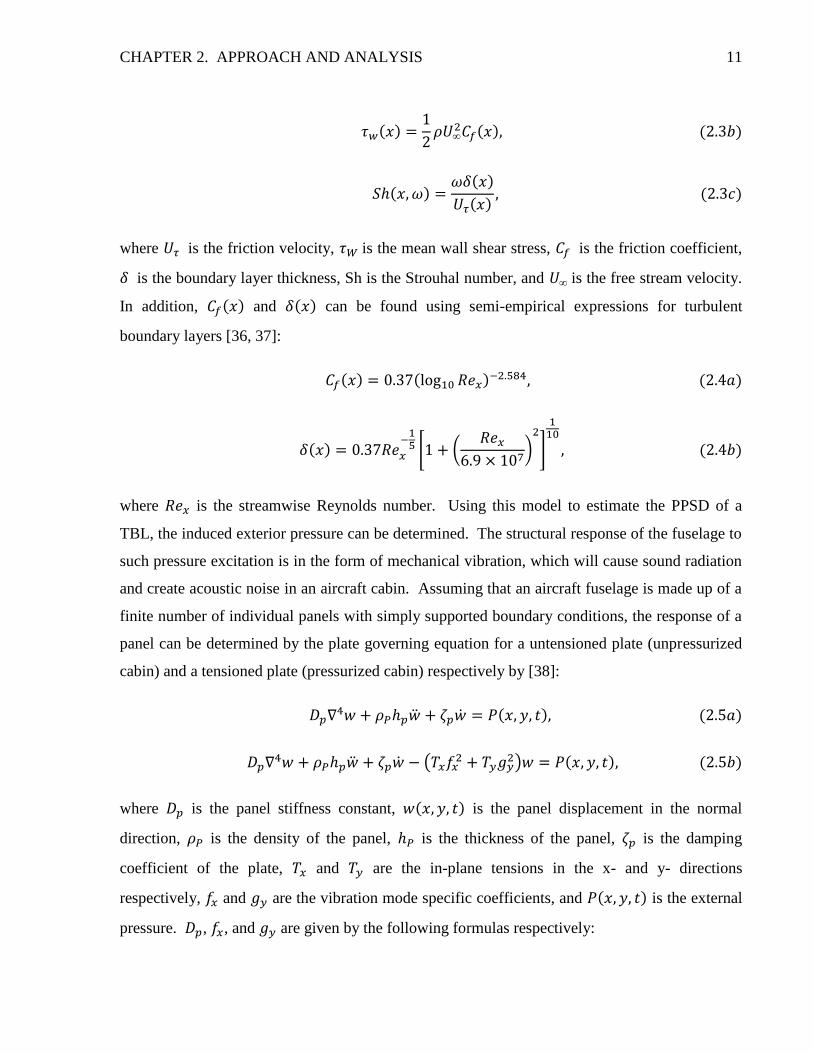
CHAPTER 2. APPROACH AND ANALYSIS 11
where is the friction velocity, is the mean wall shear stress, is the friction coefficient,
is the boundary layer thickness, Sh is the Strouhal number, and is the free stream velocity.
In addition, and can be found using semi-empirical expressions for turbulent
boundary layers [36, 37]:
where is the streamwise Reynolds number. Using this model to estimate the PPSD of a
TBL, the induced exterior pressure can be determined. The structural response of the fuselage to
such pressure excitation is in the form of mechanical vibration, which will cause sound radiation
and create acoustic noise in an aircraft cabin. Assuming that an aircraft fuselage is made up of a
finite number of individual panels with simply supported boundary conditions, the response of a
panel can be determined by the plate governing equation for a untensioned plate (unpressurized
cabin) and a tensioned plate (pressurized cabin) respectively by [38]:
where is the panel stiffness constant, is the panel displacement in the normal
direction, is the density of the panel, is the thickness of the panel, is the damping
coefficient of the plate, and are the in-plane tensions in the x- and y- directions
respectively, and are the vibration mode specific coefficients, and is the external
pressure. , , and are given by the following formulas respectively:

CHAPTER 2. APPROACH AND ANALYSIS 12
where is the elastic modulus of the plate, is the Poisson’s ratio, a and b are the length and
width of the plate respectively, and and are the plate modes number in the x- and y-
direction of the plate. It is assumed that the fuselage panel is thin compared to its other
dimensions, therefore shear deformation and rotary inertia can be neglected in the formulations
at this point. In order to determine the displacement of a plate, , the response of a
structure can be modelled in terms of a modal expansion such that at each excitation frequency,
the response is determined by a summation of modal terms [38]:
where and
are the normal modes of the plate, which define the spatial variation
of the deflection , is the temporal variation of , and and are the
number of plate modes in the x- and y- directions, respectively, therefore is the
total number of plates modes being considered in the analysis. The normal modes for a plate can
be represented by the following functions:
The corresponding natural frequencies with the aforementioned idealization and boundary
conditions for an unpressurized and pressurized cabin are respectively:

CHAPTER 2. APPROACH AND ANALYSIS 13
Idealizing the curved fuselage shells by flat plates can reduce the complexity of the problem
while providing a good estimate to the sound radiated by the panels. However, it should be
noted that there are a number of drawbacks associated with such assumptions. For example, the
effect on the flexural wave dispersion characteristics of a curved panel cannot be represented by
the above formulations due to the flat plate assumptions. The curvature associated with a curved
panel allows coupling of forces in the radial and tangential directions when the shell is stressed.
One of the implications of this effect is the increase of radiation efficiency of the curved panel
because the flexural wave phase velocities increases if the frequency is below the ring frequency.
This effect diminishes as the radius of a fuselage increases. Due to the large radius of an aircraft,
the flat plate assumption is valid and will reduce the complexity of the analysis. It is rather
difficult to solve for the vertical deflection , which is needed to determine the sound
radiation by the fuselage. However, the purpose of the current research is to determine the
acoustic performance of the interior TCS panel, which encloses the cabin, therefore certain
idealizations and simplifications can be made in order to perform the research more efficiently.
This will be explained in more detail later on in this chapter. In addition, the simply supported
boundary conditions are idealized and not representative a of practical aircraft structure.
However, Berry et al [39] show that clamping the edges of a panel makes insignificant difference
to the modal radiation efficiency, slightly decreasing that of the low order modes and increasing
that of higher order modes by a maximum factor of 2.5, which is equivalent to 4 dB. For these
reasons, a simply supported boundary condition is a good approximation to the panel’s
complicated boundary conditions, which are caused by the fact that the panels are dynamically
coupled to continuous structures.

CHAPTER 2. APPROACH AND ANALYSIS 14
2.1.2 Sound Radiation from Fuselage Panels
Assuming that the time and spatial variations of the fuselage panel displacement are known, the
next step is to determine the general vibration induced pressure field inside the fuselage, but
outside the cabin. The normal vibration velocity distribution of the fuselage panel is
or . Using the integral formulation derived by Lord Rayleigh:
and a modal representation of the velocity distribution (neglecting the temporal variation):
where is the density of the medium, is the position vector of the observation point from a
elemental surface having normal velocity amplitude , R is the magnitude of the position
vector , and is the magnitude of the modal specific velocity. The reason that a modal
specific quantity is used is because sound radiation from lightly damped panels can only radiate
efficiently at their natural frequency or at their discrete natural modes, which causes resonant
vibration. In contrast to the previous section, a complex exponential mathematical representation
was used to describe quantities that vary in time and space, which are fundamental to the nature
of wave motion in general. Using this kind of representation, simple harmonic variations in time
can be conveniently described. For example, a quantity that varies with time:
where G symbolises amplitude and is the phase. This quantity can also be represented by:
and
Using the modal specific velocity and Rayleigh integral formulation, the radiated pressure
variation at location [x,y,z] is [40]:

CHAPTER 2. APPROACH AND ANALYSIS 15
However, in order to solve analytically for the pressure field efficiently, a cylindrical coordinate
system is used, and the formulation becomes:
where
and k is the wavenumber. The analytical solution of the pressure field was determined by
Wallace [41]:
where c is the sound speed in the medium.
2.1.3 Transmission and Radiation of Acoustic Noise into the Cabin
Now that the radiated pressure field inside of a fuselage is determined, the fluid loading on the
cabin structures, such as the floor panels and the wall enclosures, can be resolved. Assuming
that the cabin is made up of array of individual panels, the resultant displacement or the vibration
characteristic is represented by . The fluid-structure interaction between the cabin
panels and the air between the fuselage and the cabin enclosures can be considered to be passive
in the sense that the small-amplitude motion of the vibration cabin panels does not significantly

CHAPTER 2. APPROACH AND ANALYSIS 16
alter the exciting force. Although fluid loading can be influenced by reflection of radiated sound
from the enclosure and fuselage interior boundaries, it will be assumed that its effect is
insignificant at this stage of the research. Under these conditions, the sound transmission
through the cabin enclosures can be idealized as a forced vibration problem on a plate with
simply supported boundary conditions on all sides. Using a forced vibration analysis, the
displacement, , as well as the surface panel velocity, , can be found, which
can be used to determine the acoustic noise level inside the cabin by using the methods shown in
the previous section. In addition, the sound intensity level is an important indicator for the
acoustic noise level in the cabin and it can be determined by the following relationship [40]:
It can be observed that both the radiated pressure field and sound intensity formulations have a
direct relationship with the modal velocity, which is directly related to the normal panel surface
velocity according to Equation [2.10]. For these reasons, the velocity data computed from a
forced vibration analysis on the cabin panels will be sufficient to determine which cabin panel
designs will provide a lower sound intensity in the cabin, as well as higher transmission loss
properties. Using a forced vibration analysis instead of a coupled structural-acoustic analysis to
determine which TCS structure design is more suitable for cabin panel sound insulation can
greatly improve the research efficiency, enabling a focus on determining how to control the
structural acoustic performance of TCS structure designs. It should be emphasised that the goal
of this research is not to determine the absolute acoustic performance of a TCS panel, but to
determine the relative performance between various TCS structure designs so that the proper
design selection and approach can be identified. For these reasons, there is an opportunity to
improve the research efficiency even further by performing a forced vibration analysis on a beam
structure instead of a plate structure so that the analysis can be computationally efficient and the
closed-form analytical solution can be obtained in a relatively straightforward approach. A beam
is a one dimensional elastic system with only one independent spatial variable, which is the
length along the member. However, a TCS panel or plate is a two dimensional elastic system

CHAPTER 2. APPROACH AND ANALYSIS 17
with two independent spatial variables, the length and the width. Although a beam has one fewer
independent spatial variable, the restoring forces in both systems arise from in-plane tensile or
stretching forces, and bending moment and transverse shear forces are active. For these reasons,
the basic kinematics of the classical theory of thin plates is the same as that of Euler-Bernoulli
beams. The governing equations for thin uniform beam and plate can be represented by the
following two inhomogeneous partial differential equations respectively:
where is the moment of inertia of the beam, which depends on the shape of the beam’s cross
section, A is the cross-sectional area of the beam, or is the applied forced, is
equal to , h is the thickness of the plate, and is the biharmonic operator. For
thicker beams, the effect of shear deformation and rotary inertia can be incorporated into the
formulations in the same manner as in a thick plate. In addition, for a plate which has simply
supported boundary condition, if the phase coincidence is satisfied independently in the two
orthogonal directions, x and y, then it is satisfied everywhere. The wavenumber vector
components in these directions at the natural frequencies correspond to those for a similar beam
of equal length. For these reasons and the purpose of the research, the analysis of forced
vibration of a beam can provide much insight into the structural-acoustic characteristics of a TCS
panel, and provide us the information to tailor the acoustic properties of TCS panels.
2.2 Forced Vibration Analysis of a TCS Beam
By theoretically evaluating the mechanical response of a beam with a simply supported boundary
condition under a normally incident, time-varying pressure load, the beam’s surface acoustic
pressure gradient can be determined using the normal surface velocity through the Rayleigh
integral as shown in Equation [2.11], which can be used to evaluate the induced pressure field
and the sound radiation intensity. Therefore by comparing the normal surface velocity of the
TCS beam structures with different core and face-sheet designs, the acoustic performance of the
TCS structure design can be evaluated and the response characteristics of the various structural

CHAPTER 2. APPROACH AND ANALYSIS 18
design parameters can be identified. In addition, at low frequency excitation, a TCS beam will
behave like a uniform beam and the response will only depend on the beam’s overall elastic
modulus, cross-sectional area, moment of inertia, density, and the shear modulus. At higher
frequency excitation, the transverse wave propagation is controlled by the core shear stiffness
and by the individual faceplate-bending stiffnesses [21]. Therefore a numerical approach, such
as finite element analysis, is required to provide sufficient detail in the analysis. However,
knowledge of a uniform beam’s vibration response will provide much insight for the design of
TCS structures since the most important frequency range for aircraft cabin design is below 2000
Hz. For these reasons, the goal of this section is to develop the formulations to determine the
normal surface velocity of a uniform beam under a normally incident pressure load with a simply
supported boundary condition.
2.2.1 Governing Equations of a Beam
The governing equation of a uniform beam developed by the classical beam theory is illustrated
in Equation [2.19]. Although the beam’s surface deflection and velocity can be evaluated using
this formulation, the effect of the shear modulus on the response of the beam is absent , which is
important for the analysis of sandwich structure and response of a structure at high frequency
excitation. In addition, classical Euler-Bernoulli beam theory assumes that the plane cross-
sections remain planar after deformation, which implies that shear deformation is neglected.
This assumption is valid for thin plates such as the fuselage panel, but for thicker plates such as
the TCS panel, this assumption will introduce error into the results of the response. In addition,
using the Euler-Bernoulli beam theory, the phase velocity of the propagating wave increases
without limit for increasing wavenumber [42]:
where k is the wavenumber and c is the phase velocity. This prediction of infinite phase velocity
is non-physical and it is due to neglect of rotary inertia and shear deformation. For these
reasons, the formulation required to model correctly the behaviour of TCS beam structure must
include shear deformation and rotary inertia. Using Timoshenko beam theory, both the shear
deformation and rotary inertia effect can be included, and it is illustrated here to provide insight

CHAPTER 2. APPROACH AND ANALYSIS 19
into the design of a TCS structure. Taking into account of both the bending, and the shear
effect, , the slope of the deformation is:
The relationship between bending moment and the curvature is:
For the shear component, Timoshenko showed that the shear force is related to the shear stress ,
shear strain , and shear strain at the centroidal axis according to the following formulae
respectively:
where is the Timoshenko shear coefficient, which depend on the shape of the cross-section of
the beam. Using the Equation [2.22] and [2.24], the shear stress can be expressed as:
By summing the forces in the vertical direction, the equation of motion can be obtained:
By summing the moment, another equation of motion is found:
Substituting the expression for bending moment and shear force into the two governing
equations [2.26] and [2.27] gives the following governing equations for the Timoshenko beam
theory:

CHAPTER 2. APPROACH AND ANALYSIS 20
In order to determine the normal surface velocity of a specific beam structure, one must solve
these coupled, inhomogeneous partial differential equations. In addition to determining the
normal surface velocity, another quantity is also important for evaluating the acoustic or
vibration characteristics of the beam structure, which is the natural frequency of the beam.
Natural frequency is a free vibration phenomenon, while resonance is associated with forced
vibration. When a structure vibrates at its natural frequencies or eigenvalues, large amplitude
response to the excitation is induced, and the structure can radiate sound at its maximum
efficiency. The knowledge of the natural frequencies can provide essential information
regarding the acoustic behaviour of the structure, and therefore the natural frequencies of a
general beam structure will be explored first. Using equation [2.28] to solve for ,
substituting the result into equation [2.29], and setting for this free vibration analysis,
the equation of motion for the free vibration of a uniform beam is:
Define and , and the previous equation becomes:
Assuming that the solution for has the form:
where n is the number of the natural mode, is the length of the beam, and is the natural
frequency of the system. Substituting equation [2.32] into [2.31], the frequency equation of the
beam structure is:

CHAPTER 2. APPROACH AND ANALYSIS 21
The solution of the frequency equation of a general beam can be found by using the quadratic
formula, and therefore the expression for the natural frequency is:
(2.34)
If the effect of rotary inertia alone is considered (Rayleigh beam theory), the shear coefficient
can be set to 0 in the equation of motion for the beam, and the frequency equation is reduced to:
If the effect of shear deformation alone is considered, the term can be set to 0 in
the equation of motion for the beam, and the frequency equation is reduced to:
If both the effect of rotary inertia and shear deformation are neglected in the formulation,
equation [2.31] becomes the classical Euler-Bernoulli beam theory, which gives the natural
frequency of:
By comparing the natural frequencies obtained by the four theories for a typical beam with a
simply supported boundary condition, the result is shown in Figure 4. It can be seen that the four
theories are in close agreement to each other at low natural frequencies or mode numbers, and

CHAPTER 2. APPROACH AND ANALYSIS 22
they diverge from each other as the natural frequencies are increased. At the 10th
mode, there is
a 7.5% difference between the natural frequency predicted by the Timoshenko beam theory and
the Euler-Bernoulli beam theory. Using the solution from the Timoshenko beam theory, one can
accurately predict the natural frequency of a uniform beam with a simply supported boundary
condition. In terms of forced vibration, if there is a coincidence between the excitation
frequency and the natural frequency, resonance occurs. Knowing the excitation frequency, one
can design a beam to avoid coincidence, thus high level of sound radiation can be avoided.
Figure 4. Natural frequencies from four different beam theories – Euler-Bernoulli, rotary-inertia
only, shear deformation only, and Timoshenko beam theory
In order to determine the response of a beam across a wide spectrum of frequencies, the
displacement and the velocity time history must be determined. The method of separation of
variables and normal mode expansion can be used to determine the beam’s response. It is
assumed that the beam’s response, , can be presented in the form of a product of a
function dependent on the spatial coordinate x and a function dependent on time t, therefore it
can be represented by:

CHAPTER 2. APPROACH AND ANALYSIS 23
where are the normal modes or the eigenfunctions of the system and represents the
temporal variation of . Substituting the assumed solution to (Eqn [2.38]) to
equation [2.31], and applying the boundary conditions to the system, the solution of the normal
mode for a simply support beam, , can be expressed in the following general form:
The next step is to determine the time function in order to determine the time variation
forced response of the system. Using the Duhamel integral, has the following general
expression:
where the first two terms on the right-hand side represent the transient response, and the third
term denotes the steady state response resulting from the forcing function. The variable is
given by:
and the generalized force corresponding to is:
Let the excitation force be a single-frequency harmonic load with a unit magnitude, therefore:
then becomes:
For the symmetric modes, where n is an odd number:

CHAPTER 2. APPROACH AND ANALYSIS 24
and for the antisymmetric modes, where n is an even number, is equal to zero. Substitute
the value of into the steady state part of equation [2.40] and ignore the transient part:
where the value was calculated to be:
Substitute the value of and into equation [2.38], the beam’s response can be found in
a modal summation format:
A typical response of a uniform beam with a simply supported boundary condition (translational
motions are fixed at both ends, while rotation is allowed) is shown in Figure 5. The response is
measured by the root mean squared (RMS) velocity of the beam, which can be obtained by
integrating the result given by equation [2.48]. The normal incident pressure load is applied on
the top surface and the RMS velocity is measured on the bottom surface. RMS velocity is an
indicator of the kinetic energy of the transverse motion of the beam and it is directly proportional
to the radiated sound intensity [43]. The definition for RMS velocity is:
where k represents the spatial location where the velocity is measured and m is the total number
of data points. Using this method of analyzing a TCS beam, the response of a beam is idealized
by an equivalent homogeneous beam whose properties can be determined through the application

CHAPTER 2. APPROACH AND ANALYSIS 25
Figure 5. Root-mean-squared velocity response of a Timoshenko beam with simply supported
boundary condition (measured at center point)
of basic structural mechanics at the low-frequency range. However, when the wavelengths of
vibration are similar to the length of the core trusses, homogenization fails, and a more detailed
analysis is required to depict accurately the characteristics of a beam under a harmonic pressure
load. Finite element analysis (FEA) is used for this purpose and it will be discussed in the
following section.
2.3 Finite Element Analysis
Due to the nature of the problem, an explicit non-linear FEA code, ABAQUS, is used for the
vibration analyses in this research. As discussed in Section 2.1.3, a TCS beam structure will be
analyzed using FEA instead of a plate structure. The reason for this is because the required
simulation run-time for a complete computational model of a TCS panel structure is excessive
for this developmental effort. A panel model will require at least 600,000 elements, and a typical
frequency response curve for a single TCS structure design will take 200 simulation runs. For
this reason, TCS beam structure models were used to determine the trend of their vibro-acoustic
behaviours, and to develop design guidelines for TCS panel structures. The face-sheets are
modeled by shell elements and the trusses are modeled by beam elements, both using reduced
integration in order to improve computational efficiency by reducing the numerical timestep and

CHAPTER 2. APPROACH AND ANALYSIS 26
avoiding non-physical high stiffness behaviour, such as shear locking. Since under integrated
elements may suffer from hourglassing, which is zero energy deformation mode, hourglass
modes will be suppressed using mesh refinement techniques and applying nodal hourglass
restoring forces. The hourglass energy will be monitored in order to reduce non-physical
behaviour. Adequate number of integration points through the thickness of an element is needed
in order to prevent plastic hinge behaviour. A study period should be chosen to accommodate
the lowest frequency vibration. The timestep will be determined by the smallest element in the
discretized model, and the sampling interval should be set to equal to the Nyquist distance times
a safety factor of 0.8 to avoid aliasing. The element size should be chosen to represent properly
the physical sound speed. Due to the nature of the problem, it is assumed that the deformation of
the beam is small, therefore a linear elastic material model is used in the analysis. For a simply
supported boundary condition, three principle axes translational degrees of freedom are fixed,
and the rotational freedoms in the three principle axes are not restrained. A typical FEA analysis
for a TCS beam structure is shown in Figure 6. The details of the various material properties, the
Figure 6. Typical finite element analysis of a TCS beam with a simply supported boundary
condition
geometrical attribute of the models, and the various FEA results will be presented in the Chapter
Three. Using the results obtained from the analytical approach, as described in Section 2.2, and
the results from the FEA, sensitivity studies and parametric studies can be performed. The

CHAPTER 2. APPROACH AND ANALYSIS 27
results of these studies will identify the characteristics of various design parameters of a TCS
structure, hence general design guidelines can be developed, and the methodologies for
designing a TCS structure for superior acoustic performance can be formulated.
2.4 Acoustic Chamber Experiments
Although the analytical efficiency was drastically improved by using a beam structure model
instead of a plate structure, the actual acoustic performance of an equivalent TCS panel structure
is yet to be determined. The TCS panels are fabricated at the Multifunctional Structures Lab at
UTIAS using a set of fixtures, which are developed specifically for this research project. An
example of a fabrication setup is shown in Figure 7. The designs of these experimental TCS
panels are based on the analytical and FEA results. In order to determine the actual performance
of a TCS panel, experiments will be carried out. The experimental component of this research ii………..ii
Figure 7. Typical TCS panel fabrication setup using UTIAS Multifunctional Structures Lab fixture design
project is partially funded by an Engage Grant, which provides funding from the Canadian
government as well as in-kind support from an industry partner. The industry partner for this
grant is Bombardier Aerospace (BA) who provided us with access to their acoustic chamber for
acoustic performance testing of the various TCS panel designs. The acoustic chamber is
designed to measure the transmission loss (TL) properties of a panel inserted in its TL window.

CHAPTER 2. APPROACH AND ANALYSIS 28
Random white noise is produced in the chamber and it is measured by three condenser
microphones inside the chamber. A sound intensity probe is used to measure the sound intensity
level just outside of the TL window, where a TCS panel is installed. The goal of the experiment
is to show the difference in acoustic performance by changing the truss core design. The details
of the fabrication process, experimental setup, and the testing results will be presented in Chapter
Four of this report.

29
Chapter 3
Results and Discussions
The analysis results obtained using the formulations and the methodologies described in the
previous chapters are presented in this section. In addition, the significance of these results
regarding their contribution to the objectives of this research project will also be discussed in
detail. The results of the theoretical and numerical analyses are presented in this chapter. The
results of the experimental part of this research project will be presented in the Chapter Four.
The most important vibro-acoustic characteristics of a TCS structure that affect the
radiated noise level inside a cabin include the radiated sound power, radiation efficiency, and
resonance frequencies. As discussed in Chapter Two, all these quantities are related to the root-
mean-square (RMS) velocity of the surface of an excited structure. By exciting a beam structure
using a spectrum of frequencies, and measuring the RMS velocities, a frequency response
analysis can be created and used to access the performance of a particular TCS structure design.
An example of a typical frequency response analysis is shown in Figure 5 in Chapter Two. A
frequency response analysis provides information regarding the magnitude of the response, as
well as the resonance frequency of the structure. The latter identifies the excitation frequencies
at which the structure radiates sound most efficiently. Using this information, engineers can
design the vibro-acoustic characteristic of a structure to avoid coincidence with any of the
predominant excitation frequencies and compare the vibro-acoustic performance of various TCS
panel designs.
3.1 Analytical Analysis
Using the analytical approach in Chapter Two, the response of a uniform Timoshenko beam
structure with simply supported boundaries under a single-frequency harmonic load with a
normal incident angle can be represented by Equation [2.48]. Although a TCS structure cannot

CHAPTER 3. RESULTS AND DISCUSSIONS 30
strictly be represented by a uniform beam due its inhomogeneous nature, by idealizing the
structure as a homogeneous system, one can estimate its low-frequency response as well as to
understand the general trend of the performance gradient as the structural parameters changed.
In addition, it is assumed that the structural surface density is much higher than the fluid density,
and therefore the effect of the medium on the frequency response analysis can be neglected. For
these reasons, a frequency response analysis on a uniform beam will be conducted first in this
research. Note that damping has been neglected in this idealized model.
3.1.1 Initial Frequency Response Analysis Using Theoretical Formulation
The range of frequency that human can perceive is approximately between 20 Hz to 20 kHz,
which has considerable variation between individuals. However, the most important frequencies
for cabin noise reduction analysis are from 20 Hz to 4000 Hz; therefore focus will be on
analyzing structures in this frequency range. The low-frequency range is between 20 Hz and
2,000 Hz, the mid-frequency range is between 2,000 Hz and 4,000 Hz, and the high-frequency
range is between 4,000 Hz and 8,000 Hz. These frequency ranges are chosen based on the
response of TCS structures to harmonic excitation, which will be shown later in this chapter. For
the purpose of a uniform beam vibration analysis, the frequency ranges that will be considered
are the low and mid frequency ranges, since the response at the high frequency range will only
be affected by the trusses in a TCS structure. The response of a structure to a time-harmonic
excitation can be modelled in terms of modal expansion such that the response at each frequency
is determined by a summation of all the modal terms as discussed in Chapter One. Theoretically,
an infinite number of modal responses are required to determine the exact structural response;
however, the higher frequency modal components have a small contribution to the frequency
response of a structure, and therefore only a limited number of modal terms are required to
approximate the correct response of a structure in practice. In this analysis, the first 15 modes
will be used to estimate the frequency response of a uniform beam under a time-varying load.
As a comparison, the typical ratio of time-dependent displacement of a point on a beam between
the 15th
mode and the 1st mode is in the order of , therefore 15 modes is sufficient to provide
the necessary accuracy in this part of the analysis. Note that due to the nature of the harmonic
loading and the boundary condition, only the symmetric modes, or the odd modes, are required
since the contribution of the anti-symmetric modes, or the even modes, are equal to zero. In
addition, a discrete number of data points will be used to determine the RMS velocity of a

CHAPTER 3. RESULTS AND DISCUSSIONS 31
specific beam structure design. If too few data points are used, the response may not be
representative. However, if too many data points are used, computational efficiency for the
thousands of FEA simulation runs may suffer. In order to explore this issue further, a beam with
the parameters listed in Table 1 is analysed:
E G l w h I
[GPa] [GPa] [m] [m] [m] N/A N/A
10 3.85 500 0.5 0.005 0.01 0.85 0.3 4.17
Table 1. Structural parameters for initial uniform beam forced vibration analysis
where E is the elastic modulus, G is the shear modulus, is the density of the beam, l is the
length of the beam, w is the width of the beam, h is the height, is the Timoshenko shear
coefficient, and I is the moment of inertia of the beam. The first 15 natural frequencies, which
are related to the resonant frequencies in this forced vibration analysis, are shown in Table 2.
Plotting the RMS velocity versus the spatial location at specific excitation frequency, the results
are shown in Figure 8 and 9. Due to the large difference in the response magnitudes between the
forcing frequency near and far away from the resonance frequency, the responses are plotted in
two separate graphs in order to show them more clearly. The near-resonance and off-resonance
forcing frequency responses are shown in Figure 8 and Figure 9 respectively. It can be observed
from Figure 8 that the center point along the length of the beam is a good indicator of the
magnitude of RMS velocity level. However, at off-resonance excitation frequencies, if data is
only taken at the center point, the results may not capture the overall RMS velocity level on the
beam; this is evident from the RMS velocity distribution curve for the 640 Hz and 1380 Hz
excitation frequency in Figure 9. For this reason, 15 data points with equal spatial intervals will
be used to determine the average RMS velocity values. The comparison for the results between
the single-point response, which is taken at the half-length point, and the 15-point average
response is shown in Figure 10. It can be observed that the two anti-resonant frequencies
predicted by the single-point response graph are in fact a local phenomenon and do not represent
the overall structural response.
Due to the large range of RMS velocity magnitude in a single analysis, a log scale with
the base of 10 is used for the response. The result clearly shows that high RMS velocity

CHAPTER 3. RESULTS AND DISCUSSIONS 32
magnitudes occur at the odd-mode natural frequencies, and it is at those frequencies that the
structure is capable of radiating noise most efficiently. For this reason, it will be advantageous if
the designer can control the natural frequencies of a TCS structure so that resonance does not
occur for the vibration frequencies to which an aircraft is exposed during operation. The
magnitude of the response is of secondary importance at this stage of the development because a
unit load was used as a representative forcing term, and the beam analysis serves only as a means
to determine general design guidelines for a TCS panel structure. For these reasons, the next
analysis will be focused on determining the relationships between the natural frequencies of the
beam, and the various structural parameters with simply supported boundary conditions and a
time- harmonic pressure load.
Mode 1 Mode 2 Mode 3 Mode 4 Mode 5 Mode 6 Mode 7 Mode 8
81 Hz 324 Hz 726 Hz 1285 Hz 1995 Hz 2853 Hz 3852 Hz 4986 Hz
Mode 9 Mode 10 Mode 11 Mode 12 Mode 13 Mode 14 Mode 15
6247 Hz 7629 Hz 9123 Hz 10723 Hz 12422 Hz 14211 Hz 16085 Hz
Table 2. Natural frequencies of a uniform beam for the initial analysis
Figure 8. Time averaged RMS velocities for near-resonance excitation frequencies as a function
of the spatial location for a uniform beam

CHAPTER 3. RESULTS AND DISCUSSIONS 33
Figure 9. Time averaged RMS velocities for off-resonance excitation frequencies as a function of
the spatial location for a uniform beam
Figure 10. Comparison between beam’s center response and 15-point average response

CHAPTER 3. RESULTS AND DISCUSSIONS 34
In order to increase the confidence level of the theoretical analysis, a finite element model is
created in order to determine the correspondence between theory and finite element simulation.
Since the response of the beam is one-dimensional in the transverse direction and the beam has
uniform properties, using beam elements to model the structure is sufficient to describe the
response of the beam. The parameters for the FEA have the same values as shown in Table 1,
and the result is shown in Figure 11. It can be observed that the FEA result and the theoretical
result match closely, and the errors are primarily caused by random numerical noise associated
with high frequency loads.
Figure 11. Comparison between theoretical beam’s response and finite element analysis results
using beam elements
3.1.2 Sensitivity and Parametric Studies of Uniform Beam Structure Using
Theoretical Formulations
Using the structural parameters shown in Table 1 as the basis for parametric studies, the elastic
modulus, shear modulus, density of the beam, and length of the beam are varied by from
their base values. The changes in the natural frequencies for the first ten modes are shown in
Figure 12 to Figure 15 in order to illustrate the sensitivity of the response upon a change in the
parameter. It should be noted that the minimum or maximum values of the natural frequencies
are normalized to provide a basis of comparison. It can be observed in Figure 12 that by

CHAPTER 3. RESULTS AND DISCUSSIONS 35
increasing the Young’s modulus of a simply supported uniform beam, the natural frequencies of
all the modes increase significantly at approximately the same rate, with the higher modes
increasing at a slightly slower rate at high Young’s modulus values. On the other hand, as the iiiiii….iiiiii
Figure 12. Parametric study for varying the Young’s modulus by for the first 10 modes
Young’s modulus decreases, the natural frequencies of all the modes decrease at the same rate.
Changes in the elastic modulus represent changes in the elastic stiffness of a beam structure,
which can be achieved by changing the face-sheet thickness and material properties, as well as
individual truss dimensions and material properties. The sensitivity of the latter will depend on
the particular design of the truss configurations and the orientations.
Figure 13 shows the effect of varying the shear modulus. The natural frequencies vary
linearly with the modes of vibration and non-linearly with the shear modulus. As the shear
modulus increases, there is an increase in the natural frequencies. However, the rate of change
of the natural frequencies diminishes, and this effect is more prominent at higher modes. The
fact that the rate of change of the natural frequencies is different for different modes is
advantageous because a designer can target a specific natural frequency and modify the shear
modulus of a TCS structure to change the natural frequency to a desired value. Figure 14 shows

CHAPTER 3. RESULTS AND DISCUSSIONS 36
Figure 13. Parametric study for varying the shear modulus by for the first 10 modes
Figure 14. Parametric study for varying the density of the uniform beam by for the first
10 modes

CHAPTER 3. RESULTS AND DISCUSSIONS 37
the result of changing the density of a uniform beam structure. The natural frequency of all
modes increased exponentially as the density decreases. This result illustrates another advantage
of TCS structures because TCS panels can achieve higher structural strength than structures with
uniform properties for the same amount of mass. Therefore the natural frequencies can
inherently be shifted higher, which is a common objective of acoustic panel design. Last, the
parametric study for the length of a beam, as shown in Figure 15, demonstrates that a decrease in
the length of the beam will cause an increase in the natural frequencies of the system, and an iiiiiiiiiiiiiiiiiiiiiiiiii
Figure 15. Parametric study for varying the length of the uniform beam by for the first 10
modes
increase in the length of the beam will cause a decrease in the natural frequencies. Changing the
length of a beam is equivalent to changing the boundary support of the panel on an aircraft.
Therefore this information gives the designer another tool to tailor the acoustic characteristics of
a TCS panel.

CHAPTER 3. RESULTS AND DISCUSSIONS 38
3.2 Finite Element Analysis of a TCS Structure
3.2.1 Finite Element Model for a TCS Structure
Although the results from the previous sections demonstrated a number of means to control the
vibro-acoustic characteristics of a beam structure, how these means can be applied to the design
of a TCS structure, and how the core unit cell design can change the overall structural acoustic
behaviour have not been addressed. One of the reasons for that is that the analysis tool that is
available is analytical, which neglects the inhomogeneity of a TCS structure. The complex
geometry of a TCS structure makes it difficult to develop a fully analytical solution; therefore a
numerical approach needs to be employed. Due to the nature of the problem, a finite element
approach will be used to analyze the TCS structural response. Various considerations regarding
the FEA were presented in the previous chapter. There are four base structures that are being
analyzed in this research; the difference between them are in the design of their unit cells, while
the material and dimensions for the pair of face-sheets are identical for all the base structures.
The four different unit cell designs are: the diagonal array, the tetrahedral, the pyramidal, and the
Kagome unit cell designs. The finite element models of these designs are shown in Figure 16.
Each of these TCS beam structure is composed of repeating unit cells with a dimension of 1 cm
width by 1 cm length by 1.5 cm height. The trusses are made of pultruded carbon rod with a
diameter of 1 mm. Each face-sheet is 2 mm thick and is assumed to be made up of 3 plies of
cross-woven carbon fibre fabric bonded together by an epoxy matrix. Since the carbon fibre
sheet is plain woven, and all the plies have the same orientations, orthotropic material properties
are used. It is assumed that the deflection of the beam is small during the loading process and
hence a homogeneous linear elastic model can be used to describe the material behaviours in the
FEA. The specific properties for the carbon rods and the face-sheets are listed in Table 3.
ABAQUS Explicit was used as the solver for these FEA models due to the nature of the required
simulation. The study period is set to 0.2 s in order to incorporate the lowest frequency case and
to provide sufficient data for the RMS velocity values. The time-step is set automatically by
ABAQUS, which is determined by the smallest element in the model and the time-scaling factor.
Linear quadrilateral thin shell elements are used to model the face-sheet, and linear beam
elements are used to model the truss core. Reduced integration elements are used in order to
reduce simulation run-time, and to prevent non-physical overly stiff response, such as shear
locking. Five integration points through the thickness of the shell are used in order to capture the

CHAPTER 3. RESULTS AND DISCUSSIONS 39
correct bending behaviour and the elastic rebound of the structure during its deformation. The
number of triangular elements is kept to a minimum in order to prevent non-physical stiff
behaviour. The two-noded beam element has an integration point at the center of the beam, and
the trusses are assumed to be rigidly bonded to the face-sheet at their ends. Damping is assumed
to be negligible, and for the purpose of this research, ignoring damping will not affect the
outcome. Simply supported boundary conditions are applied to the model by restraining the x, y,
and z translational freedom at the edge of the bottom face-sheet. The simulations are all run in a
quad-core desktop computer with a Gentoo Linux operating system in order to prevent cross-
platform inconsistency. In order to perform a frequency response analysis for each TCS design,
the time-harmonic unit pressure load is applied to the surface of the top face- sheet at the range
of frequency between 20 Hz to 4000 Hz with a 20 Hz increment.
Figure 16. Various TCS beam structure designs – Kagome, pyramid, tetrahedral, and diagonal
array unit cell designs
These loading profiles are generated by a C++ code, which lets the user specify the
frequency of the load, the magnitude of the load, and the number of data points to represent the
loading profiles. Another C++ program is developed to generate the Python scripts to initiate the

CHAPTER 3. RESULTS AND DISCUSSIONS 40
Density
Elastic Modulus
[GPa] Poisson Ratio
Pultruded Carbon Rod 350 140 0.1
Face-Sheet 1120 60 0.1
Table 3. Mechanical properties for pultruded carbon rod and carbon composite face-sheet
Figure 17. Typical multi-point response from forced vibration analysis in ABAQUS (each color
represents a response at a different location)
simulation runs in ABAQUS. The transverse or out-of-plane velocity responses on the bottom
surface are recorded for the 15 nodal points, which are evenly spaced along the length of the
beam. A typical simulation result from ABAQUS is shown in Figure 17. The results are then
imported into a C++ program for post-processing. The RMS velocity values are obtained from
this program and the results are plotted in a graph similar to the one presented in Figure 11.
3.2.2 Static Finite Element Analysis
Before any dynamic FEA is carried out for frequency response analysis, a static FEA can be
performed to determine the deflection of the beams under a quasi-static pressure. Knowing the
deflection, the effective structural properties of a beam can be determined, such as the apparent
elastic modulus, apparent density, and the apparent bending stiffness. A unit, ramp-up quasi-
static distributed pressure load was used in these static finite element analyses. The same finite

CHAPTER 3. RESULTS AND DISCUSSIONS 41
element meshes and boundary conditions are used in the model. The resultant deflection is
recorded, and using the classical bending theory, the deflection can also be represented by:
where is the maximum deflection at the center of the beam, q is the load per unit length of
the beam, l is the length of the beam, E is the elastic modulus, and I is the moment of inertia.
Using this equation, the approximated, effective bending stiffness of the beam, , can be
determined. Assuming that only the face-sheets contribute to the moment of inertia, the moment
of inertia, , can also be determined, and therefore the effective elastic modulus can be
calculated. The results of these analyses for all the models considered in this research are shown
in Table 5, and the corresponding TCS design attributes are listed in Table 4. Using the effective
elastic modulus obtained from these analyses, the effective shear modulus can be calculated
using elasticity theory, assuming a Poisson’s ratio of 0.3. Assuming an effective cross-sectional
area equals to a uniform beam (0.01 m x 0.015 m), and an effective density calculated using the
overall mass and a representative uniform beam volume, the first mode natural frequency for
each design configuration is calculated and presented in Table 5. It was found that these natural
frequency values are in close agreement to the first mode resonant frequencies determined from
the frequency response analyses, which will be presented in the next section.
3.2.3 Dynamic Finite Element Analysis and Frequency Response Analysis
The results of the frequency response analyses for the four base TCS beam designs are shown in
Figure 18. Figure 18 shows the response in terms of RMS velocities, and Figure 19 shows the
response in terms of decibel, which is obtained by [29]:
where is a normalizing reference velocity, which is equal to [29]. The
response will be measured in RMS velocity for the on-going analysis in order to be consistent
and to emphasize the relative nature of the results. It can be observed that most of the four

CHAPTER 3. RESULTS AND DISCUSSIONS 42
designs have a similar first resonance, which is around 400 Hz. This similarity is due to the
similarity in their effective elastic modulus, despite the difference in unit cell design. This is also
evident from their free vibration response. It is observed that the first mode is strongly
dependent upon the effective bending stiffness, which has a weak dependency on the core
design. This phenomenon can be clearly seen by comparing the baseline pyramid, Kagome, and
the tetrahedral unit cell designs. Figure 20 shows the mode shapes of a typical TCS beam
structure. It can be observed that the unit cell barely deforms in the low natural frequencies and
the deformations in the unit cell increase at higher modes. At the Low Frequency (LF) range, the
dynamic response may be estimated by homogenization techniques as illustrated previously.
TCS
Design
TCS Name
Face-Sheet
Thickness
[mm]
Pin
Diameter
[mm]
Attributes
1 Pyramid 2 1 Baseline unit Cell design
2 Kagome 2 1 Baseline unit Cell design
3 Tetrahedral 2 1 Baseline unit Cell design
4 Array 2 1 Baseline unit Cell design
5 Array 1.5 2 1 [4] design with pin angle
increase over [4]
6 Tetrahedral Packed
Edge 2 1
[3] design with 1.1 spatial
distribution factor for unit cell
7 Tetrahedral Packed
Center 2 1
[3] design with 0.9 spatial
distribution factor for unit cell
8 Tetrahedral Heavy
Pins 2 1
[3] design with increased pin density
to match [1]
9 Tetrahedral Heavy
Face-sheet 2 1
[3] design with double the face-
sheet density
10 Tetrahedral Thick
Face-sheet 4 1
[3] design with 4 mm thick face-
sheets
11 Tetrahedral Thin
Face-sheet 1 1
[3] design with 1 mm thick face-
sheets
12 Tetrahedral Thick
Pins 2 1.5
[3] design with 1.5 mm diameter
pins
Table 4. TCS designs and their attributes

CHAPTER 3. RESULTS AND DISCUSSIONS 43
In the Mid- Frequency (MF) range, intracell resonance begins to take place, causing the cell
members to deform, therefore there is a mixed deformation mode between the overall beam and
the unit cell in this frequency range. At High Frequency, most of the deformation occurs at the
cell level. Although most of the designs have a similar first resonant frequency, the array unit
cell first resonance occurs at only 160 Hz. The main reason for such a low first resonant
frequency for the array design is because of its low bending stiffness, as shown in Table 5. For
TCS
Design
Deflection
[nm]
Overall
Mass [g]
Overall
Density
Bending
Stiffness
EI
Shear
Modulus
Elastic
Modulus
1st Natural
Frequency
[Hz]
1 0.419 23.3117 310.823 194.385 241.588 85.897 405.704
2 0.409 23.2145 309.527 199.185 384.098 88.018 411.541
3 0.520 23.0518 307.357 156.628 45.425 69.213 366.225
4 2.910 22.8956 305.275 27.919 99.697 12.337 155.145
5 2.493 22.9831 306.441 32.633 487.630 14.420 167.413
6 0.536 23.0518 307.357 151.945 86.182 67.143 360.708
7 0.709 23.0518 307.357 114.770 75.874 50.716 313.492
8 0.552 23.3117 310.823 147.439 45.425 65.152 353.333
9 0.52 45.4518 606.024 156.628 45.425 69.213 260.810
10 0.308 45.4518 606.024 263.860 61.761 57.278 338.514
11 1.03 11.8518 158.024 78.745 27.537 69.892 362.146
12 0.444 23.8667 318.223 183.179 69.199 80.945 389.230
Table 5. Effective mechanical properties of various TCS designs from static FEA
this reason, it is important for a structure to have sufficient bending stiffness if one is to avoid
having a low first resonant value. Despite the similar first resonant frequency for the pyramid,
Kagome, and tetrahedral unit cell designs, their second resonance frequencies are significantly

CHAPTER 3. RESULTS AND DISCUSSIONS 44
different from each other, ranging from 1680 Hz for the tetrahedral unit cell design to 2340 Hz
for the Kagome design. The pyramid unit cell has a second resonant frequency at 2240 Hz. This
represents a 33% difference between the tetrahedral and the pyramid designs. Such significant
change in performance was achieved without modifying the material, the unit cell dimension, the
beam dimension, the diameter of the pins, or the thickness of the face-sheets. This demonstrates
the design flexibility provided by the TCS structure configurations. Due to this large
performance gradient, their proximity to the coincidence frequency, and the relative ease of
fabrication, it was decided that these two designs will be fabricated into two TCS panels for
experimentation in an acoustic chamber. The details of these experiments will be presented in
Chapter Four. Regarding the array design, it also has a high modal density even at the low
frequency excitation range, therefore it is not a good TCS structure design along with the other
short-comings mentioned previously. However, the pin angle in the array design can be easily
changed independently without affecting the other structural parameters, therefore it has some
advantages in terms of being a subject of parametric studies.
Figure 18. Frequency response analysis for four base TCS beam designs measured in RMS
velocity
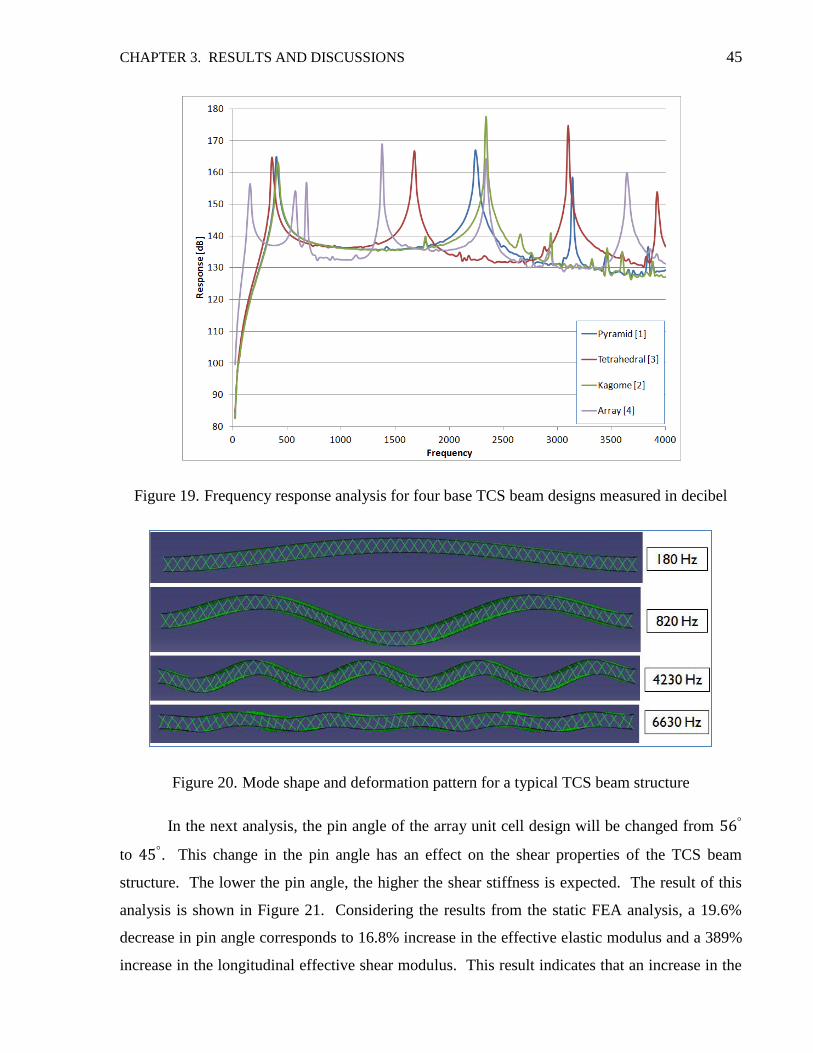
CHAPTER 3. RESULTS AND DISCUSSIONS 45
Figure 19. Frequency response analysis for four base TCS beam designs measured in decibel
Figure 20. Mode shape and deformation pattern for a typical TCS beam structure
In the next analysis, the pin angle of the array unit cell design will be changed from
to . This change in the pin angle has an effect on the shear properties of the TCS beam
structure. The lower the pin angle, the higher the shear stiffness is expected. The result of this
analysis is shown in Figure 21. Considering the results from the static FEA analysis, a 19.6%
decrease in pin angle corresponds to 16.8% increase in the effective elastic modulus and a 389%
increase in the longitudinal effective shear modulus. This result indicates that an increase in the

CHAPTER 3. RESULTS AND DISCUSSIONS 46
shear stiffness can be achieved by reducing the pin angles, which is a result of changing the
component of the load vector along the pins. In addition, the resonant frequencies starting from
the second resonant peak shifted to higher values, which is desirable in some applications.
Iiii…………………………iiiii
Figure 21. Frequency response analysis for diagonal array unit cell design with different
pin angles
However, there are other practical concerns regarding the design of the pin angles, such as
compression stability, compressive strength, and spatial limitations. Due to the low structural
stiffness, and the low first resonant frequency of the array unit cell design, it is not a practical
design for a TCS structure. One of the reasons that the array design performs poorly is the lack
of multi-dimensional stiffness. The pins are only oriented in the XZ-plane, and therefore it does
not provide sufficient bending stiffness for a beam or a panel structure during a vibration load.
The other three unit cell designs, pyramid, Kagome, and tetrahedral unit cells designs, do not
have this short-coming. Due to the structure of the unit cell design, and the nature of these
analyses, the various structural parameters of a tetrahedral unit cell design can be varied
independently and easily to explore their effects on the overall TCS structure’s vibro-acoustic
performance.

CHAPTER 3. RESULTS AND DISCUSSIONS 47
In the next analysis, the truss core properties of the tetrahedral unit cell design will be
changed by modifying the pin diameter. Two different pin diameters will be studied in these
analyses; 1 mm, which is the original diameter, and 1.5 mm. The frequency response analysis is
shown in Figure 22. The quasi-static analyses show that the bending stiffness of the 1.5 mm pin
tetrahedral is increased by 17% while the weight is only increased by 3.5%. As a result of this
structural performance improvement for a minimal weight increase, the first resonance mode
frequency only increased slightly, however the magnitude of the first peak also decreased. As
mentioned before, these peaks are responsible for high acoustic radiation, therefore the primary
design objective of TCS structure should be to avoid any coincidence. Even if the response
magnitude at these resonance peaks is lowered, the overall performance of the TCS panel will
suffer. For these reasons, the secondary objective of a good TCS design is not in lower peak
response magnitude, but in low modal density. The higher the modal density, the more iiiiiiiiiiiiiiiiiiiiiiiiiiiiiiiiiiiiiiiiiiiiiiiiiiiiiiiiiii
Figure 22. Frequency response analysis for tetrahedral unit cell design TCS beam with
two different pin diameters

CHAPTER 3. RESULTS AND DISCUSSIONS 48
resonance occurs in a given frequency range, and therefore there are more opportunities that the
external pressure frequency will coincide with the natural structural frequency, causing
resonance. The tetrahedral design with 1.5 mm diameter pins decreased its modal density by
approximately 19.5% in the low frequency range, which indicates a significant improvement
over the baseline Tetrahedral design.
The increase in pin diameter corresponds to an increase in the load carrying capacity of
the structure, as well as the mass of the core. In order to distinguish which parameters affected
the previously observed performance differences, only the density of the pin will be increased in
the next analysis. For this reason, the effect of the mass of the core or the pins will be
investigated next. In addition, the pyramid unit cell design shows a higher elastic modulus value
and first resonance frequency than the tetrahedral design; however it also has a higher core mass.
For these reasons, the pin density of the core of a tetrahedral baseline design will be increased to
match the core weight of the pyramid design. The comparison of the “heavy” pin design, the
baseline tetrahedral unit cell design, and the pyramid unit cell design is shown in Figure 23. It iiiiiiiiiiiiiiiiiiiiiiiiiii
Figure 23. Frequency response analysis for tetrahedral unit cell design TCS beam with heavy pin
design

CHAPTER 3. RESULTS AND DISCUSSIONS 49
can be seen that performance of the “heavy” pin design does not alter much from the original
tetrahedral unit cell design, and therefore it can be concluded that the improved performance of
the 1.5 mm diameter pin and the pyramid unit cell design is not due to the increase in mass.
Another parameter that can be changed in order to modify the structural-acoustic
performance of a TCS structure is the spatial distribution of the unit cells. In this analysis, two
different cases are considered and they will be compared to the tetrahedral baseline result. The
first case is a design with an expansion factor of 1.1 from the edge of the tetrahedral design, and
the second case is with a contraction factor of 0.9. These designs are shown in Figure 24, and
their performances are shown in Figure 25. The quasi-static analyses showed that, while the
expanding unit cell design has a similar bending stiffness as the baseline case, the contracting
unit cell case has a 26.7% drop in the elastic modulus value. Although the first resonance
frequencies for the three designs are similar, the spatially varying unit cell designs have
gradually lower resonant frequencies as well as higher modal densities. It is observed that both
the expanding and contracting spatially distributed unit cell designs have a lower effective
stiffness than the evenly spaced unit cell design, and it is shown that the two spatially distributed
unit cell designs have higher modal densities.
Although the previous analyses have been focused on the design of the core, the effect of
the face-sheets on the dynamic response of the structure cannot be ignored. In the following
analysis, the thicknesses of the face-sheets will be varied. In the first case, the face-sheets for a
baseline tetrahedral unit cell beam will be reduced from 2 mm to 1 mm, and in the second case,
the thicknesses will be increased to 4 mm. The results are shown in Figure 26. It can be iiiiiiiiiiiiiiiiiiiiiiiiiiiiiiiiiiiiiiiiiiiiiiiii
Figure 24. Tetrahedral unit cell designs with spatially varying unit cell distances

CHAPTER 3. RESULTS AND DISCUSSIONS 50
Figure 25. Frequency response analysis for tetrahedral unit cell design TCS beam with spatial
unit cell distribution
observed that the magnitude of the responses show a clear distinction between the three cases.
The thinner face-sheet design shows a higher RMS velocity than the baseline case, and the
thicker face-sheet design shows a lower RMS velocity value. This corresponds to the mass law
of vibrating structures, which states that the transmission loss or the RMS velocity is determined
primarily by the excitation frequency and the mass per unit area at an excitation frequency away
from the natural frequency. The thicker face-sheet design represent a 95.8% increase in mass
and a 68.5% increase in bending stiffness, and the thinner face-sheet design shows a 48.6%
decrease in mass and a 49.7% decrease in bending stiffness. The response of the “heavy” face-
sheet design is also plotted in Figure 26 for comparison. The “heavy” face-sheet design has the
same weight as the thick face-sheet design, which was obtained by doubling the face-sheet
density of the tetrahedral unit cell design. These results indicate that varying the thickness of the
face-sheets has a significant impact on the weight and static stiffness value of the system.
However, the changes in the modal density and the resonance frequency are not as large as those
caused by changing the core parameters, such as the pin diameter and the unit cell designs.

CHAPTER 3. RESULTS AND DISCUSSIONS 51
By increasing the density of the face-sheets without increasing their stiffness, the first
resonant frequency is lowered, this is shown in Figure 27. In addition, all the other subsequent
resonant frequencies are lowered and the modal density is decreased. This may be an
undesirable situation, therefore it may be important to increase the stiffness of the face-sheet
without significantly increasing the mass of the face-sheets to increase the first resonant
frequency if reduction of the modal density of the frequency spectrum is to be realized.
Figure 26. Frequency response analysis for tetrahedral unit cell design TCS beam with various
face-sheet thicknesses
The frequency response analyses that have been done for this research explored the
various interactions between the structural parameters and the vibro-acoustic performance of a
number of TCS structure designs. Table 6 summarizes the general findings of these analyses.
These findings only serve as a general guideline when designing a TCS panel structure. The
specific performance of the design needs to be analyzed by FEA, and possibly a fluid-structural
interaction (FSI) FEA, where the acoustic field is coupled with the structural response.
However, certain observations were made. In the unit cell level, the modal density seems to
decrease with the number of trusses. Each of the diagonal array, tetrahedral, pyramid, and

CHAPTER 3. RESULTS AND DISCUSSIONS 52
Kagome TCS structure design has two, three, four, and six rods in their unit cell design
respectively, and their modal density decreased accordingly. This may suggest higher rigidity in
the unit cell level will reduce the modal density, giving designer a favourable performance for
acoustic noise reduction. This phenomenon can also be seen in the results of the static FEA –
high modal density corresponds to designs that have high effective bending and shear stiffness.
This results shows that a static stiffness analysis will be able to reveal a number of characteristics
of a TCS structure design in terms of its vibro-acoustic behaviour. One of the variables in a TCS
structure that is not captured in the summary shown in Table 6 is the specific unit cell design.
This is due to the difficulties in representing the design in a parametric manner. Note that the
TCS unit cell designs investigated in this research only represents a small number of the possible
configurations. These designs were selected for the analyses due to their distinct difference in
structure and performance. It can be seen that the change in unit cell designs altered the first
resonant frequency the most, while changes in the unit cell level parameters change only the
modal density and the higher resonant frequencies. In order to properly assess the performance
of other TCS unit cell designs, similar analyses, as shown in this report, can be carried out, and iiiiiiiiiiiiiiiiiiiiiiiiiiiiiiiiiiiiiiii
Figure 27. Frequency response analysis for tetrahedral unit cell design TCS beam with various
face-sheet thicknesses and densities

CHAPTER 3. RESULTS AND DISCUSSIONS 53
Quantities to be Increased
Pin Angle Pin
Diameter
Pin
Mass
Spatial
Distributed
Face-sheet
thickness
First
Resonance Same
Slightly
Higher Similar Similar Similar
Second
Resonance Lower Higher Similar Lower Lower
Magnitude
of Noise Similar Similar Similar Similar Lower
Modal
Density Higher Lower Similar Higher Higher
Table 6. Summary of TCS structure sensitivity analyses
the results from this research can be used to determine the general trend in their vibro-acoustic
performance for the application of reduction of cabin noise. It should be emphasized that only
the TCS beam structures were analyzed numerically in this research, but not TCS panel
structures. It was assumed that a TCS beam structure can reveal important characteristics of its
equivalent panel structure at a much lower computational cost. This assumption will be assessed
in the next chapter – Experimentation.

54
Chapter 4
Experimentation
Acoustic experiments with TCS panels were conducted in order to compare the TCS beam
analyses with the performance of a corresponding TCS panel. These experiments were
performed in an acoustic chamber to determine the transmission loss of the panels. White noise
is produced inside the acoustic chamber with a TCS panel inserted in its opening, and a sound
intensity probe is used to determine the noise level spectrum on the outside surface of TCS
panel. A sketch of the experimental setup is shown in Figure 28. The industrial partner for this
research is Bombardier Aerospace and they provided access to their acoustic chamber at the
Downsview site to carry out these experiments.
Figure 28. Side view of acoustic chamber experiment setup for TCS panel testing

CHAPTER 4. EXPERIMENTATION 55
4.1 TCS Panel Fabrication
Due to the complicated structure of a TCS panel, a robotic fabrication technique was used to
create commercial TCS structures. However, because of the need to fabricate highly customised
panels, an in-house method of fabricating the panels was devised in order to create TCS panels in
a cost effective manner for testing purposes. For these reasons, a low-cost fabrication technique
was developed at the UTIAS’ Multifunctional Structural Lab for this research project. This
fabrication technique will be discussed in the following sections.
4.1.1 Quality Control
The quality of a fabricated TCS panel directly affects the accuracy of the test and the correlation
to the analytical results. Therefore it is of vital importance that the fabrication technique is
accurate and consistent. Various aspects of quality control must be addressed, including truss
orientation, truss connection to face-sheets, consistency of core configurations, face-sheet
strength, face-sheet weight, flatness of face-sheets, and dimensional control. In terms of truss
orientation, the truss or pins must be oriented at a certain angle to the face-sheets according to
the design. Depending on the particular TCS design, the pins may have a number of different
angles in the unit cell; therefore an alignment method must be capable of providing the
versatility to allow the change of the pin angles during fabrication easily. The pins need to be
bonded to the face-sheets as rigidly as possible in order to maximize the shear and bending
stiffness of the TCS panel. Critically, these properties must be consistent throughout the entire
panel.
The quality control issues of the face-sheets will be considered next. Face-sheets are
made up of four plies of cross-woven carbon fibre fabrics, which are bonded together by a two-
part resin system made up of epoxy and hardener. A wet lay-up procedure is used to fabricate
the carbon composite face-sheets. Generally, this involves wetting all the carbon fibre fabrics
with the resin, laying them one on top of the other, and a vacuum bagging to extract all the
excess resin during the curing process and consolidate the laminate. This process must be
carried out properly in order to ensure that the composite has a high strength to weight ratio. In
addition, it is important to ensure that the pins are not protruding through the face-sheets. The
face-sheets need to be parallel to each other in order to maintain the proper dimensions. Finally,
the dimensions of the TCS panel must be correct in order to fit into to the acoustic chamber

CHAPTER 4. EXPERIMENTATION 56
window. The thickness of the panel must be properly maintained during the fabrication process,
and the length and width of the panel must be at 20-7/8” by 20-3/16”. All these quality issues
need to be considered and dealt with during the design of the fabrication method.
4.1.2 Fabrication Procedures
In order to maintain the proper dimensions of the TCS panel during the fabrication process, a
fixture was built. A sketch of the fixture is shown in Figure 29. In order for the TCS structure to
have high shear strength, bending stiffness, and compression stability, the most efficient way to
connect the pins to the face-sheet is to insert the pins through the face-sheets. The pins should be
inserted through the face-sheets before cure, and due to the large quantity of pins to be inserted
into the panel and the relatively short curing time, the pins must be inserted before the carbon
fibre cloth is impregnated with resin, which means that the resin can only be applied after the
lay-up has been completed. This is not the ideal approach because complete saturation of the
carbon fibre cloth can only be ensured if each cloth is wetted individually, and complete
saturation will provide maximum strength to the composite. However, this approach is
necessary for a manual fabrication method of a large panel. Pressure is applied to the wetted
composite in order to ensure complete penetration of the resin.
During the curing process, the orientations of the pins must be maintained between the
pair of face-sheets; therefore a layer of polystyrene foam is inserted between the face-sheets
before the pins are inserted. The pins penetrate through the top face-sheet, then through the
polystyrene foam, and finally through the bottom face-sheet. The foam also has the function of
maintaining the proper thickness for the entire panel during the fabrication process, and to stop
the resin from leaking to the opposite side of the panel during the two-step curing process. The
foam core is removed after the entire panel is completed through chemical dissolution. A pin-
guide fixture is created in order to provide the consistency and the accuracy required for the pin
angle as a pin is inserted into the pre-cured panel. The pin-guide fixture is shown in Figure 30.
It is composed of two layers of perforated board designed to provide the versatility and precision
required for all kinds of TCS unit cell designs. Pins are inserted from the top layer of the pin-
guide fixture, and depending on the angle of the unit cell design, the pins pass through a specific
location on the bottom layer before insertion into the panel. There is an offset between the pin-
guide fixture and the surface of the panel so that a cutter can reach the pin and cut off the excess

CHAPTER 4. EXPERIMENTATION 57
carbon pultruded rod that is used for the pins. Figure 31 shows that the rods are being cut
manually.
Figure 29. Cross-section of the TCS panel fixture (not to scale)
Figure 30. Pin-guide fixture
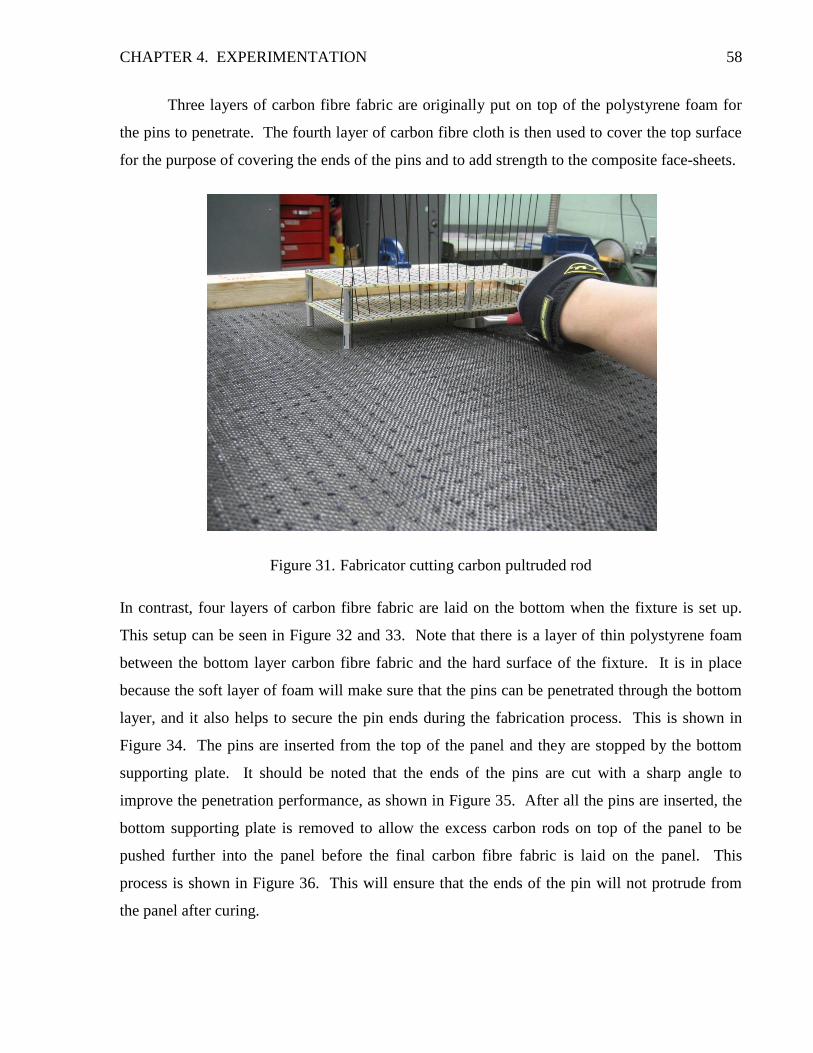
CHAPTER 4. EXPERIMENTATION 58
Three layers of carbon fibre fabric are originally put on top of the polystyrene foam for
the pins to penetrate. The fourth layer of carbon fibre cloth is then used to cover the top surface
for the purpose of covering the ends of the pins and to add strength to the composite face-sheets.
Figure 31. Fabricator cutting carbon pultruded rod
In contrast, four layers of carbon fibre fabric are laid on the bottom when the fixture is set up.
This setup can be seen in Figure 32 and 33. Note that there is a layer of thin polystyrene foam
between the bottom layer carbon fibre fabric and the hard surface of the fixture. It is in place
because the soft layer of foam will make sure that the pins can be penetrated through the bottom
layer, and it also helps to secure the pin ends during the fabrication process. This is shown in
Figure 34. The pins are inserted from the top of the panel and they are stopped by the bottom
supporting plate. It should be noted that the ends of the pins are cut with a sharp angle to
improve the penetration performance, as shown in Figure 35. After all the pins are inserted, the
bottom supporting plate is removed to allow the excess carbon rods on top of the panel to be
pushed further into the panel before the final carbon fibre fabric is laid on the panel. This
process is shown in Figure 36. This will ensure that the ends of the pin will not protrude from
the panel after curing.

CHAPTER 4. EXPERIMENTATION 59
Figure 32. TCS panel fixture – showing the bottom carbon fibre sheet lay-up
Figure 33. TCS panel fixture – showing the bottom carbon fibre sheet lay-up

CHAPTER 4. EXPERIMENTATION 60
A two-part curing process was used to cure the panel. The top side of the panel was
cured first, followed by the bottom side of the panel, which will be cured in a separate step.
Resin was applied to the sheets on the top side of the panel. The top side was then covered by a
layer of peel-ply, then a breather-ply, followed by a half-inch particle board, and finally a cover
sheet for vacuum bagging. The half-inch particle board provided a uniform flat surface to the
panel during the curing process. If it was not in place, the pressure of the vacuum bag pushed
the carbon fibre fabric into the supporting foam core, causing the pins to protrude out from the
face sheet. A vacuum pump removed the excess resin in the impregnated carbon fibre cloth.
Due to the large surface area of the panel, two access points are used by the vacuum pump, one
at each opposing corner of the panel, to remove the excess resin effectively. This process is
shown in Figure 37. It is advised that the package, which contains the TCS structure wrapped by
a vacuum bag, be turned upside-down in order to prevent excess resin from entering into the
foam core. After the top layer is properly cured in twenty- four hours time, the bottom layer can
be processed. The protruded pins on the bottom surface are cut using a rotary cutter. Care
should be taken when cutting the protruded ends since the carbon fibre fabric may be damaged iiiiiiiiiiiiiiiiiiiiiiiiiii
Figure 34. TCS panel fixture – showing bottom catcher polystyrene foam – after the pins are
inserted

CHAPTER 4. EXPERIMENTATION 61
Figure 35. Carbon pultruded rod is trimmed to improve penetration performance
Figure 36. Pins being pushed further into the core to ensure smooth surface
during the operation. Resin is then applied to the bottom surface of the panel to create the
carbon composite face sheet. Similar procedures as the top face-sheet are used in curing the
bottom face sheet. After both the top and the bottom surfaces of the TCS panel were cured, the

CHAPTER 4. EXPERIMENTATION 62
panel was cut into the dimensions for testing in the acoustic chamber. The next step was the
removal of the foam core using acetone. Previous experiments showed that acetone will not
reduce the strength of the carbon composite and the carbon pultruded rod when they are
submerged into the solution for less than one hour. A tub was built and the TCS panel was
submerged into the wooden tub, which was filled with acetone. The tub was lined by high-
strength plastic sheet before acetone was used to fill the tub. The final product is shown in
Figure 38.
Figure 37. Vacuum bagging of the TCS panel
Two TCS panels were constructed for testing at the Bombardier Aerospace’s acoustic
chamber. The first TCS panel has a tetrahedral unit cell design and the second panel has a
pyramidal unit cell design. The tetrahedral and pyramidal unit cell design TCS panel have the
average thicknesses of 1.6 cm and 1.8 cm respectively. The difference in thickness is caused by
the vacuum bagging process when one panel is being compressed more than the other. The
weight of the panels are 1.106 kg and 1.474 kg, the corresponding panel densities are 0.226
and 0.301 , and the areal densities are 0.361 and 0.542 for the
tetrahedral and the pyramid unit cell design TCS panel respectively. The difference in weight is
due to the difference in unit cell design and the mixture of residual foam and cured resin that is
left in the structure. The tetrahedral unit cell structure allows the foam to be removed more
easily than the pyramid unit cell design, and, consequently, the pyramidal unit cell design TCS

CHAPTER 4. EXPERIMENTATION 63
panel has more residual foam and hence the weight is increased. This is unavoidable using the
current manual fabrication techniques.
Figure 38. Complete TCS panel – tetrahedral unit cell TCS panel
4.2 Acoustic Chamber Testing of TCS Panels
The acoustic chamber experiments were carried out at the Bombardier Aerospace acoustic lab.
The stand-alone, mid-size acoustic chamber is used for these experiments. In the following
sections, the experimental setup and the experiment results will be discussed in details.
4.2.1 Incident Sound Field
The general acoustic chamber test set-up is shown in Figure 29. White noise is used as the sound
source, and it is created by the speaker inside the acoustic chamber. In order to ensure that a
diffused sound field is developed at the incident surface of the TCS panel, four microphones,
each located in different point in space, were used to measure and validate the incident sound
field inside the acoustic chamber. An example of the spectrums and intensities of the incident
sound field measured by the microphones are shown in Figure 39. The average standard
deviation of all the tests is approximately 1.66, which shows a high degree of diffusivity in the
incident sound field. Since white noise is used in the experiment, a means to discretize the
continuous sound spectrum is required to measure the spectrum intensity of the sound field. For

CHAPTER 4. EXPERIMENTATION 64
this reason, the continuous sound spectrum needs to be split into octave bands. One-third octave
band is used in this experiment in order to provide a more detailed description of the frequency
content of the white noise.
Figure 39. White noise incident sound field spectrum intensity
4.2.2 TCS Panel Installation
A TCS panel is installed at the acoustic chamber window using a silicone based polymer to
provide the required adhesion and damping properties at the boundaries. There is a 2 mm gap
between the acoustic chamber window and the TCS panel perimeter. The gap is in place in order
to reduce the acoustic chamber‘s structural vibration load on the TCS panel. Note that due to the
size of the acoustic chamber, the vibration of the panel is coupled with the acoustic chamber
under approximately 800 Hz. Thus, the data between 100 Hz to 800 Hz contains noise and
should not be used for the analysis.

CHAPTER 4. EXPERIMENTATION 65
4.2.3 Data Acquisition and Processing
A sound intensity probe is used to measure the response of the panel to the incident sound field.
The sound intensity probe measures the velocity of the particles in the medium, hence the
pressure fluctuation and the sound intensity spectrum in the medium can be determined. The
probe measures the sound intensity at approximately 2 inches from the transmitting side of a
TCS panel. The sound intensity probe has been calibrated by Bombardier Aerospace personnel
according to the probe manufacturer’s standard. Each of the two panels being tested was
scanned three times. The probe was moved by an operator in the horizontal pattern and the
vertical pattern, as shown in Figure 40, at a constant speed in order to determine the average
sound intensity level radiated by the TCS panel. The horizontal pattern was used two times, and
the vertical pattern was used one time in each experiment. The sound intensity level was
measured in decibel (dB) at each one-third octave frequency. During each test, the average of
the three scans was used to determine the performance of a TCS panel.
Figure 40. Sound intensity probe scanning pattern
The unit used for the sound intensity measurement results is in decibel with a reference
pressure of 2e-5 Pa. The Intensity or sound intensity level (SPL) can be calculated by:

CHAPTER 4. EXPERIMENTATION 66
where P is the sound pressure, and is the reference pressure. The transmission loss (TL) of a
panel describes the effectiveness of a panel to reduce noise being transmitted through a panel,
which is defined as:
where is the transmitted power, and is the incident power. The results of the acoustic
chamber tests of the two TCS panels in terms of TL are shown in Figure 41. The results clearly
showed that the pyramidal unit cell design is more efficient in reducing the noise transmitted
through the TCS panel than the tetrahedral unit cell design across the entire frequency range of
interest.
Figure 41. Acoustic chamber test results for two TCS panel in terms of transmission loss
4.3 Comparison to the Finite Element Analysis Results
In order to compare the FEA results with the experimental results, the results of the FEA were
converted into TL values using the formula developed in [27]:

CHAPTER 4. EXPERIMENTATION 67
where is the intensity in dB, is the root-mean-squared velocity of the panel, and is
the reference velocity, which is equal to 5e-8 m/s. The resulting TL values for the two TCS
beam structures in the frequency range of interest are shown in Figure 42. Note that the results
have been normalized using the experimental results in order to compare the performance in both
the experimental and FEA cases on the same graph. It should be emphasized that the FEA
model is a beam structure with a specific unit cell design, and the experiments are carried out
using a TCS panel structure. The beam structure has the same length and thickness as the panel
structure, but the width of the beam structure only represents the width of one row of unit cells in
a panel structure. Hence the boundary conditions of the beam structure only correspond to the
panel structure in the length-wise direction, but not in the width-wise direction.
Figure 42. Normalized finite element analysis result for two TCS panels’ responses under unit
pressure load in terms of transmission loss

CHAPTER 4. EXPERIMENTATION 68
4.4 Discussions
The results of the experiments clearly show that there are significant differences in the acoustic
performance between the pyramidal unit cell TCS panel and the tetrahedral unit cell TCS panel.
The average transmission loss difference between the two panel designs is approximately 12%.
Similar trends are also observed in the FEA models, however the difference is only around 9%
with the pyramid unit cell design structure having a higher TL. The difference between the FEA
and the experimental results may be caused by the difference in boundary conditions, mass, and
damping characteristics. Although a direct comparison cannot be made between a beam
structure and a panel structure, the difference in performance between the two TCS structures is
similar because the same mechanisms are involved in producing the transmission loss in both
structures. One major difference between the two structures is the difference in boundary
conditions. The beam structure only closely resembles what the center strip of a panel
experiences under an acoustic load; it is not representative of other parts of the panel. As a
result, the absolute TL predicted by the FEA results should not be used to correlate to the
experimental results. Another difference between the FEA and experimental results is the mass.
The actual pyramid unit cell design TCS panel weights 25% more than the tetrahedral unit cell
design, however the FEA model only shows a 1.1% difference in mass. As explained in section
4.1 of this chapter, the difference in mass is mainly caused by the mixture of residual foam and
cured resin left in the panel after the foam core is removed by chemical erosion. The normal
incidence mass law stated that the mass of a panel only has significant effect on the TL
properties when the excitation frequency is well above the natural frequency. This is shown in
the following relationship. For :
where is the excitation frequency, is the natural frequency of a panel, m is the mass of a
panel, and f is the excitation frequency in hertz. Therefore, the higher the mass, the higher the
TL will be at a frequency well above a natural frequency. This may be used to explain the larger
difference in TL between the pyramid and tetrahedral unit cell design panels in the experiment
than the FEA results. It should be noted that the tetrahedral unit cell design beam structure
reaches a resonance value at around 3000 Hz (See Figure 19a). This is observed in the FEA
results in Figure 43, where the TL of the tetrahedral beam drops significantly at 3150 Hz. In the

CHAPTER 4. EXPERIMENTATION 69
experiments, this drop in TL is not observed, and this may be due to damping. The FEA models
were idealized by only considering their undamped characteristics, therefore the resonant
responses are prominent. However, the TCS panels fabricated for the experiments have a
substantial amount of polystyrene foam deposited on the surfaces of the carbon pultruded rods,
and they act as a damping material, dissipating the energy associated with the structural
vibration. As the result, the experimental results are expected to be fairly uniform, with low
sensitivity to the resonant frequencies found in the idealized structures.
Figure 43. Comparison of experimental and normalized FEA results of two TCS structures’
transmission loss characteristics
Despite the various factors that cause the difference between the FEA and the experiment
results, the FEA correctly determined the trend of the performance between the two TCS unit
cell designs. Figure 44 shows the experimental and the normalized FEA results on a single
graph for comparison. This demonstrates that by properly designing the unit cell structure for a
TCS panel using the guidelines and the analytical methods outlined in this report, one can obtain
a TCS panel design with superior acoustic and other structural properties. The results from the
experiment also highlight an important characteristic of TCS structure, which is the influence of
the unit cell design to the overall acoustic performance. If all the foam at the core were removed,

CHAPTER 4. EXPERIMENTATION 70
the difference in weight between the two panels should approach the theoretical value, which is
around 1.1%. Thus, a design having only 1.1% difference in weights, can have as much as 9 %
difference in acoustic performance. Along with the other advantages offer by TCS structure, it is
concluded that TCS structure provides a plausible solution to control the noise inside an aircraft
cabin.

71
Chapter 5
Discussion
In order to develop a set of design guidelines and analysis methodologies for designing TCS
panels for reduction of cabin acoustic noise, several analysis techniques were used and
experiments were performed. This demonstrated the appropriateness of using these analyses for
design purposes. A review of the literature showed a lack of research into analyzing TCS
structures at the component level for noise reduction applications. Therefore, the current
research is intended to fill this gap. In order to achieve this research goal, theoretical analyses
were first carried out, followed by numerical simulations, and finally acoustic chamber
experiments were performed.
The dominant acoustic noise in an aircraft cabin is caused by the turbulent boundary layer
(TBL) induced pressure fluctuation, which causes vibration of the aircraft panels, radiating sound
into the cabin. Analyses showed that the radiated sound level and the transmission loss
properties of interior aircraft panels are related to the root-mean-squared (RMS) velocity of their
surfaces, as discussed in Section 2.1.2, and shown in Equation [2.10]. Therefore an evaluation of
the vibration characteristics of these structures will reveal their acoustic performance. In order to
reduce the computational cost of the analyses, a TCS beam structure was analyzed instead of a
panel structure. A normally incident time-harmonic pressure load was used as the forcing
condition, and the beam had a simply supported boundary conditions. The frequency range
under consideration in this research was between 20 Hz to 4000 Hz, which represents the most
important frequency range for the specific application of cabin noise reduction on a commercial
aircraft. It was found that 15 points, evenly distributed along the length of a beam, were
adequate to represent the frequency response of the beam under a harmonic pressure load.

CHAPTER 5. DISCUSSIONS 72
The results from the analytical frequency response analysis correlate well with the initial
FEA results. Analytical results showed that a beam will have higher natural frequencies
corresponding to higher Young’s modulus and shear modulus, as well as lower density and
shorter length. While the relationships between the excitation frequencies and most of these
parameters are similar at different modes, only the shear modulus has different relationships with
the excitation frequencies at different modes (See Figure 14). This characteristic allows the
natural frequencies of a specific vibration mode to be altered by modifying the shear modulus.
The Young’s modulus and the shear modulus are related through the following relationship in a
homogeneous material:
where G is the shear modulus, E is the Young’s modulus, and is the poisson’s ratio. Even for
an inhomogeneous material, the shear modulus is still strongly coupled with the Young’s
modulus. Therefore, it may be challenging to alter the shear modulus of a material without
affecting the Young’s modulus. However, it is advantageous for acoustic control purposes to be
able to manipulate the tensile stiffness and the shear stiffness of a sandwich structure separately
due to the relationships between bending waves, shear waves, and transmission loss (TL).
Bending waves are the main mechanism that drives out-of-plane motion in a panel when
it is excited, and they provide the adjacent air particles in the medium with sufficient velocity to
cause sound radiation from the panel. Due to the nature of the bending (flexural) wave
propagation in a solid, the governing equation for bending wave is a fourth order differential
equation, and the velocity of flexural wave is a function of the frequency of propagation. This
phase velocity is proportional to the square root of the frequency; hence bending waves in solid
are dispersive. Unlike bending waves, shear (transverse) waves show no dispersion, and
therefore the shear wave phase velocity is not a function of frequency. When the wave speed
exceeds the speed of sound in the medium, the interaction between the panel and the medium
becomes efficient, and transmission loss of the panel will decrease. Since the propagation
velocity of the bending wave is proportional to the square root of frequency, therefore it is a
monotonically increasing function of frequency, which indicates that there is always a frequency
above which the bending wave speed exceeds the speed of sound in the medium and hence sound

CHAPTER 5. DISCUSSIONS 73
radiation becomes efficient. If a panel is constructed in such a way that it favors the propagation
of shear waves rather than bending waves, such panels would have good transmission loss
properties if the designed shear wave speed is less than the speed of sound in the medium. It is
impossible to achieve this design criterion in a homogeneous panel due to the fact that bending
stiffness is directly proportional to shear stiffness in a solid. However, a sandwich panel may be
able to provide high bending stiffness for structural purposes, and low shear stiffness for acoustic
purposes. In practice, if the core of a sandwich structure is made of a soft but incompressible
core, such as rubber, and the face-sheets are made of high stiffness material, such as carbon fibre
composite, the aforementioned design objective can be achieved. Bending of such panels would
cause tensile and compressive stress on the top and bottom face-sheets respectively, whereas
shear deformation of the panel would require shear of the core material. Therefore, such panels
will be stiffer in bending than in shear, and shear waves may be the dominant propagation waves
in the panel due to the thickness and mass of the core. Since the bending stiffness of a TCS
panel is mainly controlled by the face-sheets and the distance between them, and the shear
stiffness depends on the configuration of the pins and their mechanical connections to the face-
sheets, bending and shear stiffness of a TCS panel may be individually controlled with reduced
coupling between.
On the other hand, Moore and Lyon [25] suggested another design approach may be
suitable for designing TCS panels. Their design acts as a band pass filter, which provides a high
transmission loss at the frequency band of interest. This can be achieved by moving the double
wall resonance frequency to occur below the frequency band of interest, and the core shear
stiffness is carefully controlled so that coincidence for antisymmetric motion is delayed and
occurs above the band of interest. A double wall resonance occurs when symmetrical mode
resonance takes place, which causes the face-sheets to move in the opposite directions, hence
resulting in a change in panel thickness. In contrast, anti-symmetric panel motions occur when
both face-sheets move in the same direction therefore no thickness change occurs in the panel.
Using a low compressional stiffness and a high shear stiffness core, the symmetric and
antisymmetric motions of the face sheets cancel out and produce a transmission loss higher than
the mass law.
Depending on the application and the operation environment, the designer needs to
determine which design approach to use. The two approaches take advantage of the fact that the

CHAPTER 5. DISCUSSIONS 74
compressional and the shear stiffness of a sandwich structure can be manipulated separately to
attain a certain sound insulation effect at a given frequency range. Therefore, it is important to
determine if TCS structures would allow this characteristic to occur, and the degree of uncoupled
behavior. This would allow designers to use various design schemes, such as wave propagation
characteristics, impedance control, vibration interference, etc, to tailor the acoustic properties of
a TCS structure to achieve a high level of transmission loss.
Finite element analyses were performed in order to achieve this goal by investigating the
interaction between various TCS designs and their responses to acoustic type loads. Four
different unit cell designs were used to investigate the various relationships between the design
parameters and the vibro-acoustic responses. These four unit cell designs are Kagome,
pyramidal, tetrahedral, and diagonal array unit cell designs. Note that it is beneficial for TCS
panel design to have low modal density, and low response magnitude, because lower modal
density allows the engineers to have more design room to avoid coincidence with the forcing
frequencies, and lower response magnitude means lower cabin noise level. The FEA results
indicated that different unit cells have significantly different response magnitudes and modal
densities. In addition to changing the unit cell designs, changing the core pin diameter can also
change the modal density. As well, changing the pin diameters can also slightly increase the first
resonant frequency, and significantly change the second resonant frequency. Increasing the face-
sheet thickness has the effect of lowering the response magnitude.
It was found that the Kagome unit cell design provides the highest effective bending and
shear stiffness compared to the other unit cell designs from the static FEA analyses. The
effective bending stiffness of a beam is the major parameter that controls the first resonant
frequency, and therefore the overall beam dimensions and the unit cell designs provides the best
tool to control it. The bending stiffness of a beam is related to its moment of inertia, which is
strongly related to the thickness of a beam. The thickness and the length of a beam vary by the
power of three and four respectively with the natural frequency of a beam, and therefore varying
the dimensions of a beam has a significant effect on its bending stiffness and the first resonance
frequency. This can be observed in Equations [2.34] to [2.37]. At higher modes, other details of
a beam, such as core design and damping, play an increase role in determining the natural
frequencies. After the Kagome unit cell design, the pyramid unit cell design provides the second
highest bending and shear stiffness. However, while the Young’s modulus, which is related to
CHAPTER 5. DISCUSSIONS 75
the bending stiffness of the TCS beam, of the Kagome unit cell design is approximately 2.5%
higher than the pyramid unit cell design, the shear modulus of the former is 59% higher than the
latter. As a result, the modal density of the pyramid unit cell design is higher than the Kagome
unit cell design in the mid frequency range. This can be seen in Figure 19a. This highlights the
importance of unit cell design on the structural as well as the acoustic characteristics of TCS
structure. On the other hand, when comparing the pyramidal and the array unit cell design, it
was found that the bending stiffness of the pyramidal unit cell design beam is approximately six
times higher than the array unit cell design TCS beam, however the shear stiffness of the former
is only 1.4 times higher than the latter. This unit cell design analysis indicates that by spatially
separating the connection points between the pins and the upper face-sheet, the shear stiffness
tend to increase more than the effective bending stiffness. In the pyramidal and tetrahedral unit
cell design, the pins are connected to the same point at the upper face-sheet, however for the
array and Kagome unit cell designs, the pins are connected to the upper face-sheet in different
locations. Note that the shear stiffness for these beam structures was measured in the
longitudinal direction only. Due to the orthotropic nature of the array unit cell design, it is
expected that the span-wise shear modulus is smaller than the reported length-wise value. It
should be emphasized that it is beam structures that are being analysed in the FEA, not a panel
structure. The behavior of a beam structure will provide important characteristic trends of a TCS
panel structure. This will be shown in the correlation between the FEA and the experimental
results in the last section of this chapter.
One of the design parameters that can change the bending and shear stiffness properties
of a TCS structure is the pin angle. In order to explore the effect of pin angle on the acoustic and
structural response, two TCS unit cell designs were analysed and compared. They were the
original array unit cell design, which has a pin angle of , and a modified array unit cell
design, which has a pin angle of from the bottom face-sheet. The static analyses showed that
while the bending stiffness was slightly increased in the modified array unit cell design TCS
beam, the shear stiffness was significantly improved when the pin angle was dropped by .
This large increase in shear stiffness shows that pin angle has a strong influence on a TCS
structure’s shear properties if the pin is oriented in the direction of the measurement. As
mentioned above, the shear stiffness is only measured in the length-wise direction. A panel with
similar unit cell design is not expected to have such a high shear stiffness due to the orthotropic

CHAPTER 5. DISCUSSIONS 76
nature of the unit cell design. Despite the large difference in the effective shear modulus of the
two designs, the natural frequency of the first mode is nearly identical. This shows that the low
frequency modes depend strongly on the effective bending stiffness of the structure but not on
the shear stiffness. The low bending stiffness of the array design cause the natural frequency to
be 1.6 times lower than the Kagome unit cell design. Although the bending and shear stiffness
characteristics of the whole panels were analyzed, the component level – face-sheets and core,
characteristics are not well defined. This is because in a TCS structure, the core is made up of
pins positioned and locked in place by the face-sheets, and therefore it is not a standalone
component in the structure. This connectivity between the core and the face-sheets introduces
difficulties in component level analysis. The modal frequency is similar in both cases, even
though the mid resonant frequencies are different between the two designs. In addition, the
modified array unit cell design, which has a lower pin angle, has a higher first resonance
frequency – approximately 7.9% higher than the original design. This represents a moderate
increase in the first mode characteristics. Comparing the array unit cell design to other unit cell
designs, the array unit cell design has a significant reduction in the first resonant frequency. The
pyramidal, Kagome, and tetrahedral unit cell design TCS beams’ first resonant frequencies are
161%, 165%, and 136% higher than the array unit cell design, while the areal densities of all
designs are similar. This again shows the significance of unit cell designs on the acoustic
behavior of a TCS beam. One of the reasons that the array unit cell design has a lower first
resonant frequency and bending stiffness is because the pins are only capable of carrying load in
two of the three principal directions. Introducing a pin that carries the acoustic vibration load on
the cross-section plane (yz-plane) may increase the unit cell first resonant frequency and bending
stiffness.
Another design parameter that can be tailored in order to control the acoustic properties
of a TCS structure is the spatial distribution of the unit cells. This design parameter can be easily
adjusted in practice for a TCS structure, and therefore it is one of the unique characteristics of
such structures. Three models were analyzed using FEA in order to determine the effect of unit
cell spatial distribution. The tetrahedral unit cell design was used as the baseline design for
comparison. Two alternative designs with one having an increased distance between the
adjacent unit cells (design [6]), and the other one having a decreased distance between the
adjacent unit cells (design [7]) were used in this study. The bending stiffness of design [6],
which has a high pin density at the boundary, is comparable to the original tetrahedral unit cell

CHAPTER 5. DISCUSSIONS 77
design TCS beam, however design [7] has a bending stiffness which is approximately 27% lower
than the original design. This shows that the bending stiffness of a TCS beam structure is
sensitive to the pin density at the support, and it tends to decrease as the local pin density is
decreased. The effective bending stiffness of design [6] is similar to the original tetrahedral unit
design, which resulted in a comparable first resonant frequency, however the resonant
frequencies in the mid frequency range is considerably lowered. Both alternative designs
showed lower resonant frequency across all frequency ranges than the original design. This
phenomenon is mainly due to the lowering of the local bending stiffness at either the ends or the
center of the beam. The FEA results indicated that the overall bending stiffness only has a
dominant effect on the first mode, and the stiffness distribution has more significant effects on
the resonant frequencies in the mid frequency range. From the static analysis, it was observed
that the overall effective bending stiffness of design [6] was decreased by 3% while the overall
effective shear stiffness were increased by 90% compared to the original tetrahedral unit cell
design TCS beam. Note that these values only represent average values of the entire beams,
while the local values along the length of the beams may be different. The significance of
altering the spatial distance between the unit cells, hence the stiffness distribution, is related to
shifting the resonant frequencies of a beam and the relative changes between the bending and
shear stiffness. This provides the designer another important tool to tailor the acoustic properties
of TCS structures.
Core mass is another important design parameter that may provide designers a means to
customize a TCS structure’s acoustic and structural properties. In order to investigate this
phenomenon, a model with a higher core mass was analyzed by FEA, and the result was
compared to other designs. By increasing the pin density, the core mass of a TCS structure was
increased. Using the tetrahedral unit cell design as the base structure, the core mass was
increased by approximately 40% so that it matched the core mass of the pyramid unit cell design.
This comparison provides another insight into the relationship between unit cell design, stiffness,
and mass of TCS structures. The modified tetrahedral unit cell design TCS beam with increased
core mass (design [8]) has a lower bending stiffness, lower frequency for the first mode, similar
transmission loss value, and the same shear stiffness as the original tetrahedral unit cell design.
The core mass is only a small percentage of the overall mass – 3.91% and 2.83% for the pyramid
and the original tetrahedral unit cell design respectively, therefore the effect of the pin density
does not have a large effect on the structural and acoustic properties of the TCS beams. By

CHAPTER 5. DISCUSSIONS 78
comparing the pyramid and the modified tetrahedral unit cell designs, it can be concluded that
unit cell design has a larger influence on the structural and acoustic properties of a TCS structure
than the core mass. This is shown in Figure 23.
The parameters associated with the face-sheets of a TCS structure can also be tailored in
order to control the structural and acoustic properties of the whole structure. By increasing the
density of the face-sheets, the mass of the face-sheet is modified in design [9], which uses the
tetrahedral unit cell design. The face-sheets of design [9] have twice the density of the baseline
tetrahedral unit cell design, while the density of the pins is unchanged. Both the bending and
shear stiffness are the same in both designs, namely design [3] and [9]. However, the frequency
of the first mode for design [9] is approximately 29% lower than the original design with lighter
face-sheets. In addition, all the subsequent modes occur at lower frequencies. This may or may
not be desirable for acoustic purposes, depending on the design scheme and the operation
conditions. The average transmission loss values for the various designs are shown in Table 7.
Note that the average values are for reference only because the actual acoustic performance is a
function of the excitation frequency, which is not evident in the average values. The
transmission loss of design [9] is 18.2% higher than the same unit cell design TCS beam with
lighter face-sheets, while the mass is 49.3% higher. This trend agrees with the normal incidence
mass law, which states that if the medium is air, for a homogeneous partition, the transmission
loss, mass, and frequency are related by:
where TL is the transmission loss of the partition, m is the mass per unit area, and f is the
excitation frequency. The mass law shows that the transmission loss increases with mass, which
correspond to the results observed from the FEA. The mass law predicts that the transmission
loss is increased by 5.9 dB, and the transmission loss predicted by FEA is 5.4 dB, which
represents only an 8% variation; therefore the mass law is a good prediction of the FEA results
despite the fact that the mass law is derived for homogeneous materials.
Another design parameter associated with the face-sheet design is its thickness. Two
additional finite element models were used to investigate the effect of face-sheet thickness.
Design [10] and Design [11] use the tetrahedral unit cell design as their core, and their face-sheet
thicknesses are 4mm and 1mm respectively. The bending stiffness of the TCS beam design with

CHAPTER 5. DISCUSSIONS 79
thicker face-sheets increased by 68.5%, whereas the one with thinner face-sheets was decreased
by 49.7%. Note that the mass of the thicker face-sheet model is the same as design [9], which
has double the mass of the original tetrahedral unit cell design. The shear stiffness of design [10]
also increased, by 40%, and the shear stiffness of design [11] decreased by 39.4%. Unlike the
changing only the density of the face-sheets, changing the thickness of the face-sheets changes
the stiffness and the mass of the system, hence both the structural and acoustic behavior of
design [10] and [11] are altered. The transmission loss of design [11] was decreased by 17.2%
and it is increased by 18.4% in design [10] when compared to the baseline design (design [3]).
Comparing the transmission loss values of design [9] and [10], one can observe that the effect of
Design Unit Cell Design
Young’s
Modulus E
[GPa]
Shear
Modulus Gx
[MPa]
Average TL
[dB]
1 Pyramid 85.89699 241.588 25.59699
2 Kagome 88.01811 384.098 25.70475
3 Tetrahedral 69.21273 45.425 24.01689
4 Array 12.33716 99.697 25.30839
5 Array 45 pin angle 14.42024 487.630 25.55513
6 Tetra packed edge 67.14329 86.182 22.20573
7 Tetra packed center 50.71594 75.874 24.7419
8 Tetra heavy pin 65.15213 45.425 24.12016
9 Tetra heavy face-sheet 69.21273 45.425 29.38775
10 Tetra thick face-sheet 57.27784 61.761 29.42664
11 Tetra thin face-sheet 69.89168 27.537 19.89169
12 Tetra thick pin 80.94521 69.199 24.96958
Table 7. Average transmission loss values for various designs
thickening the face-sheets is comparable to increasing the face-sheet density. This suggests that
the mass of the face-sheets has a more dominant effect on the transmission loss value than the
thickness of the face-sheets in this case. By inspecting the frequency response results of these
cases, it was found that the higher mode resonant frequencies varied by a greater amount as the
mass of the face-sheet is increased to a higher value, and the lighter face-sheet is less sensitive at
higher frequencies in terms of resonant frequency. These examples of how the attributes of the
face-sheet affect the acoustic and structural properties can be used to optimize required structural

CHAPTER 5. DISCUSSIONS 80
strength of a TCS panel, the allowable transmitted noise, and the resonance frequencies of the
structure. However, the change in face-sheet properties will affect the mass properties of a TCS
structure significantly, and therefore care should be taken when modifying the design parameters
associated with the face-sheet so that the weight is minimized for structural purposes.
The finite element analyses used beam structures to investigate the acoustic and structural
characteristics of TCS structures so that the various design parameters related to a TCS panel can
be tailored to provide adequate sound insulation needed for an aircraft cabin. Although the basic
characteristics of a TCS panel are similar to a TCS beam, the acoustic response and performance
can be different. Therefore, experiments were carried out in order to validate the assumptions
made regarding the relationships between TCS beam and panel, as well as to give a quantitative
measure of transmission loss that TCS structures are capable of providing. The FEA results
showed that the pyramid and the tetrahedral unit cell designs provided the highest difference in
terms of modal density within the frequency range of interest, while the fabrication of these two
designs is relatively manageable using the facilities at UTIAS. Therefore, it was decided that
two panels would be made using these designs. A low-volume, cost-effective fabrication
technique was developed in order to build TCS panels for acoustic chamber testing for
evaluating their transmission-loss properties. The panels were constructed using fixtures
designed to provide sufficient accuracy for fabricating multiple TCS panels that are
representative of the FEA models. The weights of the panels are 1.106 kg and 1.474 kg; the
corresponding panel densities are 0.226 and 0.301 , and the areal densities are
0.361 and 0.542 for the tetrahedral and the pyramidal unit cell design TCS panels
respectively. The pyramidal unit cell TCS panel has an average of 12% higher transmission loss
than the tetrahedral unit cell TCS panel. Part of the difference is due to the mass difference
between the two panels, which is mainly due to the mixture of the residual foam and cured resin.
FEA results showed a similar trend. The pyramid unit cell panel has an average of 9% higher
transmission loss than the tetrahedral unit cell design. In the FEA model, there is a prominent
drop in transmission loss for the tetrahedral unit cell design beam at 3150 Hz, which is due to the
resonant frequency observed in the spectrum analysis and the lack of damping.
Although the FEA showed the general trend of the transmission loss of two TCS beams,
the magnitude and the characteristics of the transmission loss is different from the acoustic
chamber experiments. This is due to the fundamental difference between a beam, which is used

CHAPTER 5. DISCUSSIONS 81
in the FEA, and a panel, which is used in the experiment. The boundary conditions between the
two cases were different, and the vibration response of a structure is strongly dependent on the
boundary conditions, therefore the response between the two cases should be different. In
addition, certain vibration modes on a panel do not have a counterpart on a beam, thus certain
natural frequencies that occur in a panel analysis do not appear in a beam analysis. Despite the
discrepancies between the TCS beam and panel analyses, the TCS beam analyses identified a
number important trends regarding the various design parameters associated with TCS structures.
The design parameters that were explored in this research include unit cell design, pin angle, pin
diameter, core density, face-sheet density, face-sheet thickness, and unit cell spatial distribution.
The acoustic performance trends of these parameters are similar in TCS beam and panel analyses
because the governing equations in elasticity and vibration for a beam and panel are similar.
Also, this is evident from the acoustic chamber experiment when the same unit cell designs were
used in both the beam models and the TCS panels. From these comparisons, it can be concluded
that the FEA models of TCS beam structures are capable of providing the performance trend of a
TCS panel structure, and the acoustic properties of a TCS panel can be significantly controlled
by the structure of its unit cell truss design.

CHAPTER 6. RECOMMENDATIONS 82
Chapter 6
Recommendations
The results obtained from this research provided a valuable tool to design TCS structure for
noise mitigation purposes. The FEA results revealed how the various design parameters can
affect the acoustic characteristics of a TCS structure. The acoustic chamber experiment results
confirmed the FEA findings, and showed that a beam model analysis can demonstrate a number
of important acoustic performance trends of TCS panel structures, such as transmission loss
(TL), modal densities, and spectrum intensities.
Testing showed that damping may be a beneficial characteristic for the panel by coating
damping material on the surface of the carbon pultruded rods. For this reason, the effect of
damping should be explored further using FEA models by incorporating energy dissipating
mechanisms in the models. In the present development, the mixture of polystyrene foam and the
cured resin provided the major source of damping. However, a more weight efficient and
cohesively stable material should be used to achieve the same effect as shown in the
experiments, which is the relatively steady increase or decrease of TL values across the entire
frequency range of interest.
Although the finite element beam model was capable of providing insights regarding the
design of a TCS panel, there are design parameters that a beam model is not capable to address.
Some of these design parameters include boundary conditions, various plate excitation modes,
the effect of fabrication errors, etc. The boundary conditions have a significant effect on the
panel’s response to acoustic load, and the result of such analysis can provide important
information on how to install these panels most efficiently in an aircraft structure. Also, there
are certain plate vibration modes that do not have a similar mode in a beam model, one such
example is twisting. Therefore a panel model is required to model these phenomena. It is
recommended that a panel model should be used in further investigation effort. In addition, the

CHAPTER 6. RECOMMENDATIONS 83
present FEA beam models did not include fabrication errors, such as incorrect pin angles,
localized joint failure at the pin, and localized damages on the face-sheet, therefore they are
incapable to provide insight regarding the manufacturing aspect of TCS panels. A more robust
model that includes possible fabrication errors can provide much insight into the requirement of
manufacturing tolerances and quality control issues.
The methods developed in this research to fabricate a TCS panel are extremely time-
consuming. A single panel requires around 250 hours of labour to complete, which seriously
limited the number of panels that can be tested in an acoustic chamber. It is recommended that a
more automated pin insertion process be developed in order to improve the fabrication time and
the consistence of the TCS unit cell structure in the panel. In addition, smaller scale TCS panel
should be fabricated in order to explore the various aspects of the manufacturing issues. Some of
these issues include excess resin in the foam core, maintaining the proper thickness of the panel,
and incomplete saturation of the composite fabric. These issues should be addressed before a
full size TCS panel is fabricated.

84
Bibliography
[1] W.R. Graham. Boundary layer noise and vibration, PhD Thesis, Cambridge University
Engineering Department, 1993
[2] W.V. Bhat. Flight test measurement of measurement of exterior turbulent boundary
layer pressure fluctuations on Boeing Model 737 airplane, Journal of Sound and
Vibration, 1971
[3] W.V. Bhat and J.F. Wilby. Interior noise radiated by an airplane fuselage subjected to
turbulent boundary layer excitation and evaluation of noise reduction treatments, Journal
of Sound and Vibration, 1971
[4] G.P. Gibbs, R.H. Cabell and J. Juang. Controller Complexity for Active Control of
Turbulent Boundary-Layer Noise from Panels, AIAA Journal, 2004
[5] Don E. Bray. Turbulent‐boundary‐layer noise in the interior of aircraft operating at
varying altitudes, Journal of Acoustical Society of America, 1976
[6] H.S. Ribner. Boundary-Layer-Induced Noise in the interior of Aircraft, Institute of
Aerophysics, Toronto, April 1956
[7] Dr Michael Bagshaw. An Investigation of Unilateral Hearing Loss amongst Professional
Flight Crew, Head of Occupational and Aviation Medicine, British Airways, April 2011
[8] C. H. Hansen. Active Control of Noise and Vibration, Department of Mechanical
Engineering, University of Adelaide, South Australia, 1991
[9] S. M. Kuo, and D. R. Morgan. Active Noise Control Systems – Algorithms and DSP
Implementations, Wiley, New York, 1996
[10] Li et al. Mechanical Response of All-composite Pyramidal Lattice Truss Core Sandwich
Structures, Journal of Material Science Technology, 2011
[11] J.C. Wallach and L.J. Gibson. Mechanical Behaviour of a Three-Dimensional Truss
Material, International Journal of Solid and Structures, 2001
[12] V.S. Desphande, N.A. Fleck. Collapse of Truss Core Sandwich Beams in 3-Point
Bending, International Journal of Solid and Structures, April 2001
[13] S. Chiras et al. The Structural Performance of Near-Optimized Truss Core Panels,
International Journal of Solid and Structures, 2002
[14] N. Wicks, J.W. Hutchinson. Optimal Truss Plates, International Journal of Solids and
Structure, 2001
[15] N. Wicks, J.W. Hutchinson. Performance of Sandwich Plates with Truss Cores, Journal
of Mechanics of Materials, 2004

BIBLIOGRAPHY 85
[16] H. Bart-Smith, F. Cote, R. Biagi, V.S. Deshpande. Structural response of pyramidal core
sandwich columns, International Journal of Solid and Structures, May 2007
[17] S. Hyun, S. Torquato. Optimal and Manufacturable two-dimensional, Kagome-like
Cellular Solids, Journal of Materials Research, 2002
[18] S. Hyun, A.M. Karlsson, S. Torquato, A.G. Evans. Simulated Properties of Kagome and
Tetrgonal Truss Core Panel”, 2003, International Journal of Solids and Structures, 40,
6989-6998
[19] J. Wang, A.G. Evans, K. Dharmasena, H.N.G. Wadley. On the Performance of Truss
Panels with Kagome Cores, International Journal of Solids and Structures, 2003
[20] J.H. Lim, K.J. Kang. Mechanical Behaviour of Sandwich Panels with Tetrahedral and
Kagome Truss Cores Fabricated from Wires, International Journal of Solids and
Structures, 2006
[21] G. Kurtze, B.G. Watters. New Wall Design for High Transmission Loss or High
Damping, Journal of Acoustical Society of America, 1959
[22] M.A. Lang, C.L. Dym. Optimal Acoustic Design of Sandwich Panels, Journal of
Acoustical Society of America, 1975
[23] C.K. Barton, J.S. Mixon. Noise Transmission and Control for Light Twin-Engine
Aircraft, Journal of Aircraft, 1981
[24] F.W. Grosveld, J.S. Mixson. Noise Transmission Though an Acoustically Treated and
Honeycomb-Stiffened Aircraft Sidewall, Journal of Aircraft, 1985,
[25] J.A. Moore, R.H. Lyon. Mode Canceling Panel for Greater Than Mass-Law
Transmission Loss in the Principal Speech Bands, U.S. Patent No. 4,106,588, 1978
[26] P. Thamburaj, Q. Sun. Optimization of Anisotropic Sandwich Beams for Higher Sound
Transmission Loss, Journal of Sound and Vibrations, 2002
[27] M. El-Raheb. Frequeny Response of a Two-Dimensional Trusslike Periodic Panel,
Journal of Acoustical Society of America, 1997
[28] M. Ruzzene, F. Scarpa, F. Soranna. Wave Beaming Effects in Two-Dimensional Cellular
Structures, Smart Material Structure, 2004
[29] M. El-Raheb, P. Wagner. Transmission of Sound Across a Trusslike Periodic Panel; 2-D
Analysis, Journal of Acoustical Society of America, 1997
[30] A. Spadoni, M. Ruzzene. Structural and Acoustic Behavior of Chiral Truss-Core Beams,
2006
[31] S.P. Crane, K.A. Cunefare, S.P. Engelstad, E.A. Powell. A Comparison of Optimization
Formulations for Design Minimization of Aircraft Interior Noise, Journal of Aircraft,
1997
[32] K.A. Cunefare, B. Dater. Structural Acoustic Optimization Using the Complex Method,
Journal of Computational Acoustics, 2003
[33] G. Corcos. Resolution of Pressure in Turbulence, Journal of the Acoustical Society of
America, 1963

BIBLIOGRAPHY 86
[34] G. Corcos. The Structure of the Turbulent Pressure Field in Boundary Layer Flows,
Journal of Fluid Mechanics – Cambridge Journal Online, 1964
[35] B.M. Efimtsov. Characteristics of the Field of Turbulent Wall Pressure Fluctuations at
Large Reynolds Numbers, Soviet Physics Acoustics, 1982
[36] D.A. Bies. A Review of Flight and Wind Tunnel Measurements of Boundary Layer
Pressure Fluctuations and Induced Structural Reponse, NASA CR-626, 1966
[37] R. Wahidi, W. Chakroun, S. Al-Fahed. The Behavior of the Skin Friction Coefficient of
a Turbulent Boundary Layer Flow over a Flat Plate with Differently Configured
Transverse Square Grooves, Experimental Thermal and Fluid Science, 2005
[38] J.D. Rocha, A. Suleman, F. Lau. An Accurate Coupled Structural-Acoustic Analytical
Framework for the Prediction of Random and Flow-Induced Noise in Transport Vehicles:
Its Validation, Journal of Vibrations and Acoustics, 2011
[39] A. Berry, J.L. Guyader, J. Nicolas. A General Formulation for the Sound Radiation from
Rectangular, Baffled Plates with Arbitrary Boundary Conditions, Journal of Acoustical
Society of America, 1990
[40] F. Fank, P. Gardonio. Sound and Structural Vibration – Radiation, Transmission and
Response, Elsevier, 2006
[41] C.E. Wallace. Radiation Resistance of a Rectangular Panel, Journal of Acoustical
Society of America, 1972
[42] K.F. Graff. Wave Motions in Elastic Solids, Dover Edition, 1991
[43] A. Spadoni, M. Ruzzene. Structural and Acoustic Behavior of Chiral Truss-Core
Beams”, ASME, 2006