Tailoring Particle Microstructures Via Supercritical CO2 ...eprints.whiterose.ac.uk/94952/1/Current...
47
This is a repository copy of Tailoring Particle Microstructures Via Supercritical CO2 Processes for Particular Drug Delivery. White Rose Research Online URL for this paper: http://eprints.whiterose.ac.uk/94952/ Version: Accepted Version Article: Liu, G, Jiang, Y and Wang, X (2015) Tailoring Particle Microstructures Via Supercritical CO2 Processes for Particular Drug Delivery. Current Pharmaceutical Design, 21 (19). pp. 2543-2562. ISSN 1873-4286 https://doi.org/10.2174/1381612821666150416101116#sthash.ghBUkP32.6hC84yHv.dpuf [email protected] https://eprints.whiterose.ac.uk/ Reuse Unless indicated otherwise, fulltext items are protected by copyright with all rights reserved. The copyright exception in section 29 of the Copyright, Designs and Patents Act 1988 allows the making of a single copy solely for the purpose of non-commercial research or private study within the limits of fair dealing. The publisher or other rights-holder may allow further reproduction and re-use of this version - refer to the White Rose Research Online record for this item. Where records identify the publisher as the copyright holder, users can verify any specific terms of use on the publisher’s website. Takedown If you consider content in White Rose Research Online to be in breach of UK law, please notify us by emailing [email protected] including the URL of the record and the reason for the withdrawal request.
Transcript of Tailoring Particle Microstructures Via Supercritical CO2 ...eprints.whiterose.ac.uk/94952/1/Current...

This is a repository copy of Tailoring Particle Microstructures Via Supercritical CO2 Processes for Particular Drug Delivery.
White Rose Research Online URL for this paper:http://eprints.whiterose.ac.uk/94952/
Version: Accepted Version
Article:
Liu, G, Jiang, Y and Wang, X (2015) Tailoring Particle Microstructures Via Supercritical CO2 Processes for Particular Drug Delivery. Current Pharmaceutical Design, 21 (19). pp. 2543-2562. ISSN 1873-4286
https://doi.org/10.2174/1381612821666150416101116#sthash.ghBUkP32.6hC84yHv.dpuf
[email protected]://eprints.whiterose.ac.uk/
Reuse
Unless indicated otherwise, fulltext items are protected by copyright with all rights reserved. The copyright exception in section 29 of the Copyright, Designs and Patents Act 1988 allows the making of a single copy solely for the purpose of non-commercial research or private study within the limits of fair dealing. The publisher or other rights-holder may allow further reproduction and re-use of this version - refer to the White Rose Research Online record for this item. Where records identify the publisher as the copyright holder, users can verify any specific terms of use on the publisher’s website.
Takedown
If you consider content in White Rose Research Online to be in breach of UK law, please notify us by emailing [email protected] including the URL of the record and the reason for the withdrawal request.

1
Review paper for Current Pharmaceutical Design
Tailoring Particle Microstructures via Supercritical CO2
Processes for Particular Drug Delivery
Guijin Liu1, Yanbin Jiang1*, X. Wang2
1 School of Chemistry and Chemical Engineering, South China University of
Technology, Guangzhou 510640, China
2 Institute of Particle Science and Engineering, School of Process, Environmental and
Materials Engineering, University of Leeds, Leeds LS2 9JT, UK
* Corresponding author:
Yanbin Jiang
Tel: +86-20-8711-2051
E-mail address: [email protected] (Y. Jiang)

2
Graphical abstract
Supercritical CO2 Processes
TailoringRelationship
Different requirements
Significant influence
• Particle size and its distribution• Morphology and crystal form• Drug loading and encapsulation efficiency
• Administration methods• Drug release behavior• Targeting
• Thermodynamics• Fluid dynamics• Operating parameters
Supercritical CO2 ProcessesSupercritical
CO2 Processes
TailoringRelationship
Different requirements
Significant influence
• Particle size and its distribution• Morphology and crystal form• Drug loading and encapsulation efficiency
• Administration methods• Drug release behavior• Targeting
• Thermodynamics• Fluid dynamics• Operating parameters
Abstract
Strategies for a particular drug delivery are always of great interest for the
pharmaceutical industry, and effi cient methods of preparing products with controlled
particle microstructures are fundamental for the development and application of drug
delivery. Supercritical fluid particle design (SCF PD) processes, as a green and
effective alternative to traditional methods, have been effectively employed to
produce particles with designated microstructures.
Combining with research experiences in our research group, this review aims to
provide a theoretical framework of SCF PD for particular drug delivery. For any drug
delivery formulations, macroscopic properties are directly influenced by the particle
microstructures, “Inverse” strategies are introduced at first to obtain the needed
particle microstructures for a particular drug delivery in this paper. Then, how to
produce particles with designated microstructures via SCF PD processes is discussed,
mainly focus on the screening and selection of operating parameters according to
thermodynamics and fluid dynamics study. Recent examples of SCF micronization
and co-precipitation/ encapsulation processes are also summarized with an emphasis
on how to tailor the particle microstructures by controlling the operating parameters.
Finally, challenges and issues needed further study are briefly suggested for SCD PD.
Keywords: Supercritical fluids, drug delivery, particle design, microstructures,
process, operating parameters, thermodynamics, fluid dynamics

3
1. INTRODUCTION
Strategies for effective drug delivery are always of great interest for the
pharmaceutical industry [1], especially the delivery of particular drugs with poor
solubility, tissue damage on extravasation, rapid breakdown of the drug in vivo,
unfavorable pharmacokinetics, poor biodistribution and lack of selectivity for target
tissues [2-4].
Drug delivery process includes the administration of the therapeutic product, the
release of the active ingredients by the product, and the subsequent transport of the
active ingredients across the biological membranes to the site of action [5, 6]. For a
particular drug delivery, macroscopic properties, such as the administration methods,
drug release and targeting are determined according to the drug properties and its
application. These macroscopic properties are directly influenced by the particle
microstructures, such as morphology, particle size (PS), particle size distribution
(PSD), crystal form, drug loading (DL) and encapsulation efficiency (EE) [7, 8]. Thus,
the efficient methods of preparing products with controlled particle microstructures
are fundamental for the development and application of any drug delivery
formulations.
York [9] indicated that an ideal particle formation process for the pharmaceutical
industry should be clean, environmentally responsible, single-step operation
producing particles with targeted properties. Supercritical fluid (SCF) processes, as an
alternative strategy of traditional technologies, provide an attractive platform to
achieve these aims and show great promise in particle design [10, 11]. As the most
popular SCF, supercritical CO2 (scCO2) is safe, inexpensive, readily available, and an
ideal substitute for many hazardous and toxic solvents. By controlling the level of
pressure (P), temperature (T), or modifier, scCO2 dissolves a broad range of
compounds, both polar and non-polar. At present, scCO2 process is one of the fastest
growing technologies being adopted by the pharmaceutical industry [12].
As noted by Elvassore and Kikic [13], the concepts of “clean or green chemistry” and “sustainable technology” are of great help to make pharmaceutical industrial applications of SCF processes closer than ever. SCF processes and their fundamentals
have been discussed in many reviews, these reviews mainly focus in the use of SCF
processes for different pharmaceuticals applications, and occasionally for modeling or
fundamentals of these processes [14-16]. Combining with research experiences in our
laboratory, this review aims to provide a theoretical framework of SCF particle design
(SCF PD) for particular drug delivery.

4
An overall view of SCF PD for particular drug delivery is shown in Fig.1.
“Inverse” strategies are introduced at first to establish the relationship between
particular drug delivery and particle microstructures. Then, tailoring particle
microstructures via a suitable SCF processes is discussed with an emphasis on the
screening and selection of operating parameters according to thermodynamics and
fluid dynamics study. Typical examples of SCF micronization and
co-precipitation/encapsulation processes for particular drug delivery are summarized.
2. BASIC REQUIREMENTS OF PARTICULAR DRUG DELIVERY
For all particular drug delivery, the administration methods of the therapeutic
product should be determined at first, drugs are introduced into the human body by
various routes [5, 17], where the selection of these administration methods depends on
the disease, the effect desired and the product available [18]. The most common
administration methods with their advantages and disadvantages are listed in Table 1.
Every administration method has certain requirements on particle microstructures,
especially on PS [19-23]. Generally, for oral administration, there is a wide PS range,
which tends to be within 0.1-100m, according to their gastrointestinal dissolution
and absorption characteristics. For injection, the particles in the intravenous solution
are distributed to various organs depending on PS. Particles larger than 7 m are
trapped in the lungs, and those smaller than 0.1 m accumulate in the bone marrow.
Those with diameter between 0.1 and 7 m are taken up by the liver and the spleen.
For transdermal administration, particles greater than 10 m remain on the skin
surface; particles between 3-10 m concentrate in the hair follicles; particles smaller
than 3 m may penetrate both the follicles and stratum corneum. PS also exerts a
significant influence on pulmonary drug delivery. Particles with mass median
aerodynamic diameter ranging from 1-5 m, are deposited in the bronchial and
alveolar regions predominantly by sedimentation, and have the best pulmonary
penetration.
For most particular drug delivery, the drug release behaviors should also be
considered. Although vesicles or drug macromolecule conjugates may prolong release,
optimal control is afforded if the drug is placed in a polymeric material [24].
Polymeric materials generally release drugs by the following mechanisms [25]: (i)
diffusion, (ii) chemical reaction, or (iii) solvent activation. There are two types of
diffusion-controlled systems: reservoirs (Fig. 2 A) and matrices (Fig. 2 B). Chemical
control is accomplished either by polymer degradation (Fig. 2 C) or chemical

5
cleavage of the drug from a polymer (Fig. 2 D). Solvent activation involves either
swelling of the polymer (Fig. 2 E) or osmotic effects (Fig. 2 F and G).
These drug release mechanisms depend on a number of parameters [26]. Some of
them are external, such as concentration of the active substance and carrier in the
surrounding medium, pH, and enzymatic action. However, most of them are particle
microstructures, such as PS, morphology, crystal form, DL, etc. The quantitative
interpretation of the values, which obtained in the dissolution assay, is facilitated by
the usage of a generic equation, where the equation mathematically translates the
dissolution curve in function of some parameters related with the particle
microstructures. There are number of kinetic models, which described the overall
release of drug from the dosage forms [27]. These methods are classified into three
categories: (a) statistical methods, e.g. exploratory data analysis method, repeated
measures design, multivariate approach and multivariate analysis of variance [28, 29];
(b) model dependent methods, e.g. zero order, first order, Higuchi, Korsmeyer-Peppas
model, Hixson Crowell, Baker-Lonsdale model and Weibull model [30, 31]; and (c)
model independent methods [32, 33].
Conventional forms of drugs normally medicate the whole body, reaching
healthy areas as well as diseased. Thus, for some particular drug delivery, the
transport of the active ingredients to the site of action should be taken into account.
Targeted drug delivery refers to predominant drug accumulation within a target zone,
which is independent of the method and route of drug administration [34]. The
following advantages of drug targeting are evident [35-37]: (a) drug administration
protocols may be simplified; (b) drug quantity required to achieve a therapeutic effect
may be greatly reduced as well as the cost of therapy; (c) drug concentration in the
required sites can be sharply increased without negative effects on non-target
compartments. There are a number of parameters that are important for the successful
development and manufacturing of targeted drug delivery. The targeting of drugs may
be viewed on two levels: (a) organ targeting and (b) cellular targeting. The organ
targeting is actually dependent on the size, shape and material properties of the carrier
employed, whereas the cellular targeting depends upon a more specific interaction at a
molecular level between the carrier and the cellular target. Thus, the targeted delivery
systems have significant requirements on particle microstructures. For example,
surface properties of nontargeted drug delivery vehicles affect the particle uptake,
where the size of the nanoparticles affects their movement in and out of the
vasculature, whereas the margination of particles to vessel wall is impacted by their

6
shape, as shown in Fig. 3 [38].
3. SUPERCRITICAL FLUID PARTICLE DESIGN
Generally, SCF PD processes are classified into three major methods [39], i.e.,
rapid expansion of supercritical solution (RESS), particles from gas-saturated solution
(PGSS) process, supercritical antisolvent (SAS) process. Table 2 lists their various
modifications, which depends on whether the scCO2 used as a solvent, a solute or an
antisolvent. As well known, knowledge about these processes is of great help to the
selection of a suitable SCF process for a particular drug delivery.
3.1 SCF PD Processes and Their Modifications
RESS was patented in 1986 [40], and exploits the ability of the scCO2 to
solubilize different compounds. The advantages of RESS include that it is a simple
process, and is relatively easy to implement on a small scale. However, the main
drawback that limits the scaling of this process is represented by great SCF/solution
rate requirement, since the poor solubility of most pharmaceutical products in scCO2.
Usually, the solubility value for obtaining a reasonable yield should be on the order of
10-4 mole fraction. Therefore, several modifications have been implemented for the
RESS process, including RESS into a liquid solvent (RESOLV) [41], RESS into an
aqueous solution (RESSAS) [42], RESS-non-solvent (RESS-N) process [43], RESS
with solid cosolvent (RESS-SC) [44-46], pre-filtration RESS (PF-RESS) [47], etc.
Recently, these RESS processes were specified by Türk [48].
PGSS process uses the property of CO2 can be solubilised in large quantities in a
liquid or a melted solid [49]. The advantages of the PGSS process are similar to those
of RESS. These processes perform the production of solvent-free material, as there is
no need of organic solvents. Further advantages of the PGSS process are low
consumption of CO2 and a wide range of potential applications, since the solubility of
compressed gases in liquids and solids is often high. Particularly, PGSS process is
potentially adaptable to protein and lipid processing, and is properly applied to
materials with low melting points. Nevertheless, the different physicochemical
properties of proteins and lipids may result in large and inhomogeneous particles.
Thus, Salmaso et al [50] developed a novel supercritical gas-assisted melting
atomization process (GAMA process) to produce the solid lipid submicron particles.
GAMA process improved the atomization of PGSS process by using a second gas in
the atomization and precipitation vessel. The PGSS process can also be used to

7
produce particles from aqueous solutions. PGSS-drying is the most used PGSS
variation, which was developed by Meterc et al [51] for drying of aqueous green tea
extracts. Compared with spray-drying, PGSS-drying provides an inert atmosphere
avoiding the possibility of the oxidation. Moreover, PGSS-drying allows drying the
solutions with a reduced thermal degradation or contamination of the product, because
PGSS-drying is carried out in a closed system, and only the static mixer section of the
process operates at high T.
SAS is devised to precipitate solid compounds that are not soluble in SCF. Many
variations of the SAS technique exist, including the gas antisolvent (GAS)
recrystallization, aerosol solvent extraction systems (ASES) and precipitation with
compressed antisolvent (PCA) process. GAS is a batch process and the earliest SAS
technology, which was proposed in 1989 by Gallagher et al [52]. ASES and PCA are
semi-continuous processes, which are devised based on the concept of the GAS. GAS
process is simple and particularly useful for the crystallization of sensitive materials,
e.g. pharmaceuticals, biological products, explosives, etc, since it operates at
moderate T [53]. However, a clear disadvantage of GAS process is the lack of
effective control on the particle formation. Problems also exist in GAS process, such
as exothermic impact during the addition of SCF into solvent or solution. Main
advantage of PCA and ASES over GAS is their suitability for continuous operation,
which is prerequisite for large scale mass production of particles. To some degree,
SAS processes usually means ASES or PCA in many researches. In PCA and ASES,
to minimize particle agglomeration frequently observed and to reduce or eliminate
drying times, increased mass-transfer rates are required. This has been successfully
achieved in the solution enhanced dispersion by SCF (SEDS) process [54], which
uses a coaxial nozzle design with a mixing chamber. In addition, to obtain ultrafine
particles with narrow size distribution, He et al [55, 56] used SEDS with prefilming
atomization (SEDS-PA) process. The principle involved in SEDS-PA is to drive the
liquid atomized along a surface as a film within the nozzle, and consequently reaching
at the atomizing edge. Besides, the SAS with enhanced mass transfer (SAS-EM)
technique, conceived by Chattopadhyay and Gupta [57], utilizes a deflecting surface
that vibrates at ultrasonic frequencies to enhance the atomization of the solution.
3.2 Screening and Selection of Operating Parameters
As mentioned above, RESS can be used with scCO2-soluble molecules, PGSS
can be used with CO2-dissolved molecules, while SAS can process nonsoluble

8
molecules. For a particular drug delivery, a suitable method is selected based on the
drug properties. However, there are many operating parameters for SCF PD processes
that have great influence on particle microstructures, as shown in Table 2. Study about
the complicated mechanism of particle formation and growth is essential to screening
and selection of the operating parameters for producing particles with designated
microstructures.
For modeling of SCF processes, a general dynamic equation for simultaneous
nucleation, condensation and coagulation is implemented, as described in Eq. (1) [58,
59].
ncoagulatio n coagulatio
, ,,, , ,2
1
ion consdensat nucleation
00
vdtvnvvtvnvdtvntvvnvvv
v
GnvvvJ
t
n
v
(1)
where n denotes the PSD function, t is the time, J is the nucleation rate, v is the
particle volume, v* is the critical volume, is the standard Dirac function, G is the
condensation growth rate,is the Brownian coagulation coefficient. Furthermore, it
is worthy to notice that the driving force of nucleation and crystal growth for all SCF
processes is the solution supersaturation (S), which is a measurement of the difference
of solute concentration between the composition of the fluid (y), and the saturation
composition (yeq), defined as Eq.(2) [60].
eqyy
S (2)
Based on the S value, the particle nucleation and growth kinetics can be established.
By means of the classical nucleation theory, the nucleation rate J, the critical nucleus
size r* and the number concentration of critical nuclei N* for homogeneous
nucleation are given by Eqs. (3-5), respectively [60].
Tk
rcnrnJ
B
2
s2
sc3
4
exp
(3)
STkv
rB
s
ln2
(4)
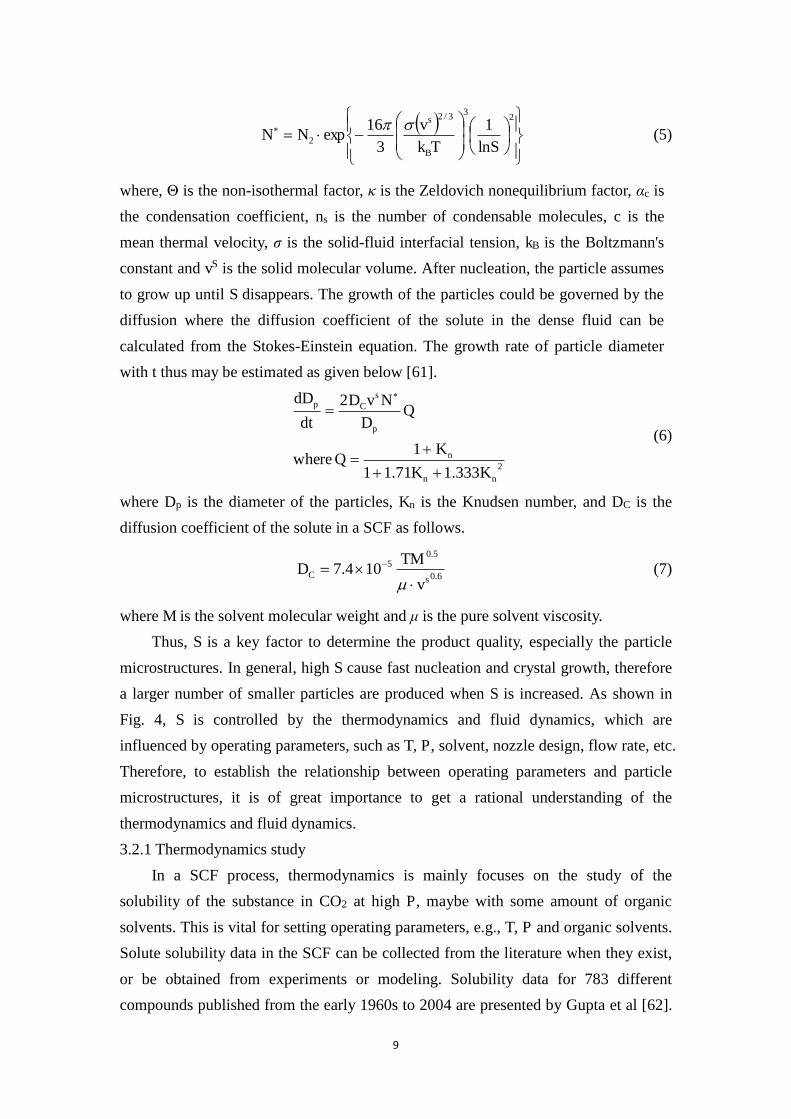
9
233/2
2 ln1
316
expSTk
vNN
B
s (5)
where, e is the non-isothermal factor, せ is the Zeldovich nonequilibrium factor, gc is
the condensation coefficient, ns is the number of condensable molecules, c is the
mean thermal velocity, j is the solid-fluid interfacial tension, kB is the Boltzmann's
constant and vS is the solid molecular volume. After nucleation, the particle assumes
to grow up until S disappears. The growth of the particles could be governed by the
diffusion where the diffusion coefficient of the solute in the dense fluid can be
calculated from the Stokes-Einstein equation. The growth rate of particle diameter
with t thus may be estimated as given below [61].
2
p
Cp
333.171.11
1 where
2
d
d
nn
n
s
KK
KQ
QD
NvD
t
D
(6)
where Dp is the diameter of the particles, Kn is the Knudsen number, and DC is the
diffusion coefficient of the solute in a SCF as follows.
6.0
5.05
C 104.7sv
TM D
(7)
where M is the solvent molecular weight and た is the pure solvent viscosity.
Thus, S is a key factor to determine the product quality, especially the particle
microstructures. In general, high S cause fast nucleation and crystal growth, therefore
a larger number of smaller particles are produced when S is increased. As shown in
Fig. 4, S is controlled by the thermodynamics and fluid dynamics, which are
influenced by operating parameters, such as T, P, solvent, nozzle design, flow rate, etc.
Therefore, to establish the relationship between operating parameters and particle
microstructures, it is of great importance to get a rational understanding of the
thermodynamics and fluid dynamics.
3.2.1 Thermodynamics study
In a SCF process, thermodynamics is mainly focuses on the study of the
solubility of the substance in CO2 at high P, maybe with some amount of organic
solvents. This is vital for setting operating parameters, e.g., T, P and organic solvents.
Solute solubility data in the SCF can be collected from the literature when they exist,
or be obtained from experiments or modeling. Solubility data for 783 different
compounds published from the early 1960s to 2004 are presented by Gupta et al [62].

10
Solubility data for solid compounds in sub- and supercritical fluids reported in the
literature between 2005 and 2010 are summarized by Sޣkerget et al [63]. However,
most of these data are for binary systems, solubility data for ternary and
multicomponent systems are still limited. Various methods to measure solubility in
SCF can be divided into two major categories, i.e. static and dynamic [62-64]. For
example, the supercritical phase behaviors of the poly(lactic acid)/poly(ethylene
glycol)/poly(lactic acid) (PLLA-PEG-PLLA) + CO2 + dichloromethane (DCM)
system and the PLLA-PEG-PLLA + CO2 + DCM + Ethanol (EtOH) system were
investigated using the static method [65]. The effects of T, the mass fraction of DCM
(or DCM + EtOH) (w), the PEG mass fraction (f) in PLLA-PEG-PLLA on cloud-point
P were shown in Fig. 5.
The solubility of a pure solid component in a SCF can be expressed as a function
of the operating P and T. However, the calculation of phase equilibrium at high P
presents several peculiarities: (a) many methods originally developed for low P
calculations, are not applicable at high P; (b) the behavior of the fluid can be strongly
affected by the presence of a component at near-critical conditions; and (c) the
mixtures of interest frequently include components with large differences in
molecular weight or polarity. Models for supercritical-phase equilibriums fall into
several categories. The most common method treats the SCF phase as a dense gas,
and uses an equation of state (EOS) to calculate the fugacity coefficient of the solute
in the fluid phase, e.g., the Peng-Robinson (PR) equation (Eq. (8)) [66, 67].
)-()-(-
- bvbbvv
a
bv
RTP
(8)
This type of equations establishes a relation between P, T and molar volume (v). In
order to take into account the non-ideal behaviour, energetic parameters (a) and
covolume (b) must be introduced. There are also a large number of semiempirical
correlations, such as the Chrastil’s equation (Eq. (9)) [68, 69].
)exp(1 BT
Ay c (9)
Eq. (9) is based on the solvate complex formed between solute and SCF at
equilibrium, proposing a relation between y and the density of the SCF (と1). It can be
seen that three parameters (e, A and B) must be determined for Eq. (9) by regressing
experimental against theoretical data.
Based on thermodynamic study, phase diagrams can be depicted to decide the
process paths of various SCF processes. The most applicable phase diagram for the
binary solid-scCO2 systems in RESS and PGSS is shown in Fig. 6 [70, 71]. The

11
solid-liquid-vapor (S-L-V) lines intersect with the critical lines (L=V) at two
distinguished point, i.e. the lower critical end point (LCEP) and the upper critical end
point (UCEP). For RESS, depending on the pre-expansion and expansion of P and T,
the expansion trajectory may cross the V-L line of CO2, thus leading to the formation
of liquid CO2 droplets. In some cases, the expansion path may even intersect the S-L
line of the diagram, so CO2 snow is produced, which causes severe safety problems of
clogging, especially if CO2 freezes inside the expansion nozzle. In RESS, therefore, it
is important to predict the behavior of the solubility in the SCF near the UCEP, in
order to choose P and T values which give the maximum amount of solute in scCO2
without appearance of a liquid phase. Investigation on the PGSS thermodynamics has
been performed by Elvassore et al [72] though calculating the enthalpy changes along
the process with the perturbed-hard-sphere-chain-theory EOS. Results indicated that
the melting point was found to decrease when increasing P, until a minimum in the
melting point was reached; afterwards, the melting point was increasing together with
P. In PGSS, the P−T trace of the S−L−V equilibrium gives information on P needed
to melt the solute and form a liquid phase at a given T, and to calculate its
composition.
A simple representative phase diagram of the ternary solid-solvent-SCF systems
at constant T and P is shown in Fig. 7, where dashed arrows represent the process
paths of various SCF processes. At P above the critical point of the binary organic
solvent-SCF mixture, the number of coexisting phases reduces from six to four [73].
About ternary mixtures, which are mostly related to SAS, a phase behavior study of
the system is extremely useful to address the feasibility of the process and to exploit
the effects of T and P [74]. Moreover, alternative polymeric particle topography and
shapes depended upon process paths followed in the phase diagram were reported.
For example, Reverchon et al [75] performed an experimental study on SAS
precipitation to gain insight into the role of phase behavior and atomization in
controlling morphology and dimension of precipitates. Results showed that operating
above the mixture critical point (MCP) of the ternary mixture yttrium
acetate/dimethyl sulfoxide (DMSO)/CO2, sub-micrometric particles were generated
nearly independently from the size of the injector and of the apparatus. The results
also show that it is possible to modify the particle dimension by simply changing the
operating P and/or T in the vicinity of the MCP. The use of a pseudo-binary diagram
P-molar fraction has been proposed as a base framework to explain the relationship
between the particle morphology and the phase behavior of processed mixtures.

12
Particularly, it is found that the single-phase region in the gas-rich side of the
P−composition diagram and below the MCP is usefully explored to modify the
particle dimensions of the precipitate.
3.2.2 Fluid dynamics
One of the main aspects of fluid dynamics is the study of jet hydrodynamic,
which contributes to the nozzle design and selection of other operating parameters.
Nozzle design includes geometry, size, distance and angle of impact against the
surface of the jet stream [76].
A schematic of the RESS expansion device is displayed in Fig. 8. From the
nozzle exit, the fluid expands as a supersonic free jet followed by another subsonic jet
where the jet interacts significantly with the background gas present in the expansion
region. These two jet regions are separated by the Mach disk [77]. Referring to Fig. 8,
the relation between the jet height 2r along the expansion pathway to the Mach disk,
with the distance x is expressed as Eq. 10.
2
2/ nozzlenozzle
M
Mnozzle DLx
L
DDr
(10)
where Lnozzle and LM are the length of the nozzle and the length of the supersonic free
jet region, respectively, DM denotes the diameter of the Mach disk. The LM and DM
can be calculated from the following Eqs. (11) and (12) based on the nozzle diameter
Dnozzle, pre-expansion pressure P0 and expansion pressure Ppost, respectively [78].
post
0nozzleM 67.0
P
PDL (11)
MM 5625.0 LD (12)
Weber et al [79] studied the influence of the capillary geometry by calculating
the PSD resulting from nozzles with different Lnozzle/Dnozzle ratios. As Lnozzle/Dnozzle
increases, the major part of the P drop is due to friction and is shifted closer to the exit
(in normalized distances). Thus, expansions in long capillaries are closer to
isenthalpic paths, in contrast to the virtually isentropic paths followed by expansions
in short devices. Size distribution of particles generated in long capillaries is generally
broader. In expansion devices with high Lnozzle/Dnozzle ratios, bimodal PSD may occur
because of the second burst of nucleation. Reverchon et al [80] also demonstrates that
for small Lnozzle/Dnozzle orifices a large part of the P drop, and almost all T decrease
associated with RESS take place in the post-expansion chamber. This observation
confirms the important role of the process parameters connected to the post-expansion

13
device. The nozzle needs to be maintained at a suitable pre-expansion T to prevent the
premature precipitation of the solute. Some researches use the nozzle T as an
additional parameter for the control of particle characteristics, although the influence
of this parameter is usually limited [81].
PGSS process has similar jet hydrodynamic with RESS process. The nozzle
hydrodynamics of the PGSS process is contained in the papers of Li et al [82, 83] for
the CO2 and hydrogenated palm oil (HPO) system. An annular mist flow at the exit of
the nozzle with an existing equilibrium between the CO2-rich gas phase and the mixed
CO2-HPO liquid phase was considered. The results indicated that at the exit of the
nozzle, PSD is narrower with a smaller PS because the particles are formed by melt
crystallization, but if the particle formation is due to an atomization process, PSD is
larger and wider. In many cases the number percentage of particles produced by the
melt crystallization process prevail over that produced by the atomization process.
Usually, only high pre-expansion T can produce particles mainly from atomization.
The Dnozzle has only a negligible effect on the produced PS, but has a more evident
effect on PSD. Large Dnozzle usually produce unimodal distribution particles.
To study the hydrodynamics of the SAS process, most authors assumed that the
jet of organic solvent behaves like a liquid jet injected into a gas. This supposition
allows applying the classic theory of jet break-up. The break-up length of the jet is
studied and correlated as a function of the Reynolds (Re) and Weber numbers (We),
defined as Eqs (13) and (14).
たuDと
Re nozzle= (13)
jDuと
We nozzle2
= (14)
where, u is the velocity.
However, three different phenomena can be observed when the solution is
injected into scCO2, i.e., (a) jet break-up into rather large droplets (drops), (b) jet
atomization into small droplets, and (c) “gas-plume” like mixing, when no droplets
are formed, as shown in Fig. 9 [84]. The classic theory of jet break-up is disabled
when the jet spreads forming a gas-plume.
To overcome this shortage, Martín et al [85] considered jet hydrodynamics as the
mixing of two completely miscible fluids forming a gas-plume, and is modeled with a
k-i turbulence model, which consists of two semi-empirical equations for the
turbulent kinetic energy k, and the turbulent kinetic energy dissipation rate i. Lengsfeld et al [86] developed a method for predicting dynamic surface tension and

14
combined this method with linear jet breakup equations to accurately predict jet
breakup lengths in immiscible to highly miscible systems. For highly miscible
systems, they proposed that microparticle formation results from gas-phase nucleation
and growth within the expanding plume, rather than by nucleation within discrete
liquid droplets.
Furthermore, Reverchon et al [87] proposed a possible formation mechanism of
nanoparticles and microparticles, which is based on the competition between two
characteristic times: (a) time of jet break-up (kjb), i.e., the time required to the liquid
jet to break at the exit of the nozzle; (b)time of surface tension vanishing (kstv), i.e.,
the time required to reduce to near zero the surface tension of the liquid in the SCF
mixture formed in the precipitator. The results indicated that if kstv < kjb, nanoparticles
formation by “gas to particle” precipitation is observed. Instead, if kstv < kjb,
microparticles formation by micrometric droplets drying is the prevailing process.
Further explanations of the occurrence of typically produced particle morphologies
have been suggested in other works of Reverchon et al [84, 88-90], where the elastic
or inelastic in situ light scattering techniques were used to gain direct information
about the mechanisms involved in the SAS process.
The formation mechanisms of amorphous nano-, micro-, or expanded micro
particles are well analyzed and well understood based on time scale approaches.
While, Rossmann et al [91] indicated that this time scale model is not applicable for
systems forming crystalline structures. The saturation solubility of the solute in
mixtures of solvents and antisolvents was proposed as the indirect classification
criterion to distinguish amorphous precipitating or crystallizing. Furthermore, Dowy
et al [92] developed an optical method to measure the supersaturation in situ for SAS
process. Firstly, saturation mole fractions of the solute were measured via elastic light
scattering. Secondly, the actual solute mole fraction was imaged in situ during the
injection of the solution into the antisolvent using a Raman based optical
measurement technique.
Another aspect of fluid dynamics is the study of mass transfer, especially in SAS
processes. Once the droplets have been formed inside the SCF, rapid transfer of CO2
into these droplets and the solvent out of these droplets causes the droplets to expand
rapidly. Werling et al [93] indicated that it is useful to define a droplet radius based on
the difference in density between the solvent-rich and the antisolvent-rich regions,
because the droplet radius is a key parameter for describing the extent of mass transfer
and for determining the effect of process conditions on diffusion. The present mass

15
transfer model is related to droplet turbulence studies, and a simplified continuity
equation for a chemical species is expressed as Eq. (15) [85].
rrjrrz
ur
u rzr
1 (15)
where is the mass fraction, r is the radial direction, z is the axial coordinate. And jr
is the diffusive flux calculated by simplifying the Maxwell-Stefan equations to the
well-known Fick law for binary mixtures, which calculated by Eq. (16).
rDjr
T (16)
where DT is the turbulent diffusivity.
Besides, it is worth to note that in the SAS-EM technique, major factors
responsible for size reduction are the droplet size reduction due to ultrasonic
atomization and the increased mixing due to ultrasonic streaming [94]. The droplet
diameter (D) is proportional to the wavelength on the liquid film surface and can be
determined as [95].
3/1
2
834.0
FD
(17)
where F is the vibration frequency.
4. SCF PD PROCESSES FOR PARTICULAR DRUG DELIVERY
Recently, numerous studies of SCF PD processes have been reported to enhance
the solubility of poorly water-soluble drugs, design the sustained release systems, and
develop the targeted systems. The typical SCF PD processes for a particular drug
delivery are micronization and co-precipitation/encapsulation, as shown in Fig.10.
Micronization processes tailor PS, PSD and morphology of particles to meet the
different drug administration methods, improve the bioavailability of pharmaceuticals
presented in a solid formulation. Furthermore, micronization processes modify the
physical structure of the crystal to obtain the polymorphic or amorphous forms, which
might exhibit higher solubility and bioavailability.
Co-precipitation/encapsulation processes produce drug delivery systems (DDS)
with anticipated particle microstructures, which effectively improve pharmacological
and therapeutic properties of a particular drug by controlling the rate, time and place
of release of drugs in the body.
4.1 SCF Micronization Processes

16
Micronization processes have been gaining increasing importance in particle
design to produce particles with suitable microstructures, since PS, PSD, morphology
and sometimes even the crystal form of particles produced in different industries are
usually not appropriate for the subsequent use. Conventional methods, such as jet and
ball milling, spray drying and recrystallization using solvent evaporation or liquid
anti-solvent, have the common disadvantage of poor control of PSD. The
conventional techniques also face some problems, e.g., thermal and chemical
degradation of products, large amounts of solvent use and residues. Different with the
conventional techniques, SCF PD offers a simpler and better control process for the
development and production of nano- or micro- particle drugs, which easy adapt to
the principles of green chemistry and green engineering, as well as the new regulatory
system of process analytical technology and quality by design.
4.1.1 Objectives of SCF micronization processes
SCF PD processes have been largely reported to micronize drugs for different
delivery purposes, which mainly include the following three objectives.
First, different PS can be produced by one kind of SCF PD processes for a
particular drug, which means SCF micronization processes meet the requirements of
different drug administration methods, especially the pulmonary drug delivery. For
example, Steckel et al [96] micronized 8 different steroids by ASES processes for
pulmonary delivery, the results showed that the median PS of the steroid particles was
in most cases lower than 5 たm and consequently within the respirable range. Todo et
al [97] improve insulin absorption from dry powder after administration in lung,
where the dry powders were prepared with or without an absorption enhancer (citric
acid) by SAS process. Bakhbakhi et al [98] micronized beclomethasone-17,
21-dipropionate using GAS process, the results showed that the GAS process has the
potential to produce steroid with powder properties suitable for inhalation therapy.
Second, SCF micronization processes effectively decrease PS or produce
amorphous particles, which enhance the dissolution rate and solubility of poorly
water-soluble drugs. For example, Keshavarz et al [99] micronized raloxifene by
RESS process, the results showed that raloxifene PS reduced from 45.28 たm to 18.93
nm, and a 7-fold increase in dissolution rate was obtained. Varshosaz et al [100]
produced amorphous cefuroxime axetil (CFA) nanoparticles with Z-average PS
between 158 and 513 nm by RESS process, the results indicated that more than 90%
of the nano-sized CFA formulations were dissolved in 3 min and complete dissolution
occurred within 20 min, while the commercial CFA did not achieve complete

17
dissolution during 60 min of the testing period. Kim et al [101] prepared amorphous
atorvastatin calcium nanoparticles with mean PS ranging between 152 and 863 nm
using SAS process, the results proved that the dissolution rates were highly increased
by the reduction of PS resulting in an increased specific surface area, and the
absorption after oral administration to rats was markedly increased.
Third, SCF micronization processes also modify the crystal form of the
polymorphic drugs, which might exhibit higher solubility and bioavailability. Bolten
et al [102] modified the crystal structure of carbamazepine particles by varying the
pre-expansion conditions of RESS, the results demonstrated that C-monoclinic
carbamazepine particles were produced at pre-expansion T higher than 363 K, while
triclinic carbamazepine particles were produced at 333 K and 300 bar. Rossmann [103]
crystallized paracetamol particles using SAS process, where the polymorph of
paracetamol crystals was adjusted between monoclinic and orthorhombic by varying
the content of ethanol in the solution. Using ethanol as the organic solvent, always the
monoclinic polymorphic form I of paracetamol was generated irrespectively of the P
and the concentration. It was also found that already 30% of acetone in the initial
mixture is sufficient to change the polymorphic form from monoclinic to
orthorhombic. Recrystallzation and micronization of 10-hydroxycamptothecin (HCPT)
was investigated using SAS process in our previous study [104], as shown in Fig.11,
two different polymorphs were found, the results also indicated that SAS process
modified the form of HCPT from monohydrate to anhydrous.
4.1.2 Tailoring particle microstructures via SCF micronization processes
The main objective of SCF micronization processes is to produce micro- and/or
nanoparticles with controlled PS, PSD, morphology and crystal form. Some recent
reports of SCF micronization processes are exampled in Table 3, which focus on how
to tailor the PS by manipulating the operating parameters.
Thermodynamics are considered at first in many studies to guide the formation
of drug fine particles. Huang et al [105] determined the solubility of progesterone and
correlated the solubility data with three empirical density-based models and the PR
EOS model before preparing progesterone fine particles with RESS. Solubility of
solute in the scCO2, which is mainly controlled by extraction T and P, is an important
factor for the particle formation in the RESS process, because it is directly related to S.
The results showed that increased with increasing extraction P. Besides, high
extraction T induces low progesterone concentration as constant extraction P is lower
than the crossover P of 210 bar, but induces high progesterone concentration as

18
extraction P is higher than 210 bar. And small progesterone particles were obtained at
high extraction P or T. Based on the progesterone solubility data, effect of extraction
T and P on the average PS of produced materials are predicted and explained
combined with the crystal nucleation rate and growth by coagulation or by
condensation after nuclei.
Chen et al [109] employed a modified PGSS process to prepare
PEG6000-ibuprofen composite particles after investigating the S-L-V phase
equilibrium behavior of the PEG6000-ibuprofen-CO2 system. Then the composite
powder was then dispersed into water to remove PEG6000 and obtain ibuprofen
nanoparticles. The results showed that increase of the P decreases the melting T of the
ibuprofen-PEG6000 mixture. According to the thermodynamics data, suitable
operating T and P at different PEG molecular weight were selected, and spherical
ibuprofen nanoparticles with diameter of 20-500 nm were prepared at different
conditions.
Theophylline microparticles were prepared by Franceschi et al [114] using SAS
process, where a mixture of EtOH and DCM was used as solvents. In order to help
selecting the appropriate operating conditions and understand the precipitation
mechanism, the fluid phase behavior of ternary (CO2-solvents) and quaternary
(CO2-solvents-theophylline) systems were investigated using a static synthetic method.
Phase diagram of the mixture revealed that the contact mechanism between solution
and antisolvent occurred in two different ways, which influenced the aggregation, PS
and PSD. The results verified that the addition of theophylline to the ternary system
consisting of the organic solvents and CO2 did not influence the transition P, which
allows the consideration of a ternary system to select the operating points in the phase
diagram. PR-EOS demonstrated to be suitable for representing multicomponent
systems. The precipitation T, flow rate of solution (Fs) and scCO2 (Fc), and Cd in the
solution were the most important variables that affected the precipitation results.
Ultra-fine particles of g-chymotrypsin were produced with SAS technique by
Chang et al [115], it was found that the phase behavior of the mixtures during
precipitation governed the product's morphology, as shown in Fig. 12. Uniform
networked nano-particles were obtained as the precipitation was implemented in the
supercritical region. The uniformity of the resulting products became worse when
the particles were precipitated around the critical region. Irregular micro-scale
aggregated particles were formed in the superheated region, while both dense cake
and spherical clusters were produced in the V-L coexistence region.

19
Fluid dynamics is essential to discuss the influence of flow rate and nozzle
design on particle microstructures. Micronization of gemfibrozil particles was carried
out using RESS process by Baseri et al [116], where effects of spray distance, nozzle
type and nozzle diameter on the characteristics of gemfibrozil particles were studied.
The results showed that two competition phenomena for spray distance, i.e.,
increasing effect (increase of growth time by increasing of spray distance) and
decreasing effect (decrease of flow velocity by increase of spray distance) lead to
make a maximum value of mean PS in the spray distance of 5.5 cm. Particles
produced by capillary nozzle have higher growth time and it results in larger particles
in comparison with the orifice nozzle. A larger diameter of nozzle provides only
higher total flow rates without bringing about a change of axial velocity, thus it has
insignificant effect on the crystallization process.
He et al [55] precipitate ephedrine from ethanol solution using SEDS-PA process,
where a prefilming atomizer was designed on the basis of the mechanisms of
atomization and applied to the SEDS process. It was found that PS decreases with
increasing Fc, because high Fc reinforced the impingement of dense gas on the liquid
film, which results in the formation of fine droplets and intense mixing of scCO2 and
droplets. With the increase of Fs, PS increased in the beginning, then decreased. When
Fs is low and Fc is relatively high, the impingement of the atomizing dense gas on
liquid sheet is the main factor of jet breakup in the spray process and the liquid sheet
is rapidly disintegrated into droplets as prompt atomization; drop sizes and PS
increase with Fs for constant Fc in this case. When Fs is high and Fc is relatively low,
the interaction between the liquid and the dense gas is weak and the liquid sheet is
disintegrated into drops according to the wavy-sheet mechanism; in this case, PS
decrease with Fs for constant Fc.
Micronization of camptothecin (CPT) has been performed using SAS process in
our previous study [117]. The results indicated that solvents with higher と/た ratio,
lower j and lower solvation power will form smaller CPT microparticles with lower
crystallinity. The possible reason is that higher と/た means the higher Re of solution at
the nozzle exit, and low j of the pure liquid shortens the elapsed time of the interface
between injected solution and bulk CO2. These are beneficial to the formation of
small droplets or “gas-plume”, which provide a larger mass transfer surface between
the liquid and the gaseous phase, resulting in a faster S of the solute occurring and less
time for the particle growth, then forming small particles. On the other hand, at same
CPT concentration, the saturation ratio is higher when using solvents with lower

20
solvation power, and this helps to produce smaller particles.
4.2 SCF Co-precipitation/Encapsulation Processes
The formulation of drugs together with a biocompatible or biodegradable carrier
material by co-precipitation/encapsulation processes has a great relevance for
pharmaceutical industry. Usually, co-precipitation/encapsulation techniques are
divided into three classes: (a) chemical processes like molecular inclusion or
interfacial polymerization; (b) physicochemical techniques like coacervation and
liposome encapsulation; (c) physical processes like spray drying, co-crystallization,
extrusion or fluidized bed coating. However, major advances in drug manufacture
have highlighted the limitations of conventional particle formation and pretreatment
processes in fine-tuning the characteristics required, since the harsh processing
conditions and poor properties of products. The application of SCF PD as an
alternative to the conventional processes has been an active field of research and
innovation during the past two decades.
4.2.1 Objectives of SCF co-precipitation/encapsulation processes
First, sustained release systems can be designed by SCF co-precipitation/
encapsulation processes. For example, Duarte et al [118] prepared Ethylcellulose/
methylcellulose blends by solvent-evaporation and SAS process. Then, SCF
impregnation was performed to prepare naproxen loaded microspheres. The results
indicated that microspheres prepared by SAS process have a higher loading capacity
and present a slower release profile. The systems studied present a release mechanism
controlled by drug diffusion, which complies Fick's law of diffusion.
Lee et al [119] employed a modified SAS-EM process to fabricate
controlled-release matrices for Paclitaxel. When ultrasonication was applied, more
uniform particles in the submicron size range were obtained. In vitro release studies
showed that, at DL of 3% or less, almost the entire drug is released during a 1 month
period. At higher DL (10%), approximately half the drug is released during a 1 month
period and subsequent release is very slow. A similar result is obtained at 5% DL. This
is very likely due to the formation of drug crystals dispersed within the polymer
matrix. Similar phenomenon was observed at our previous work [120], where the
micronized HCPT is dispersed into the PLLA matrix using SAS process. The result of
in vitro drug release test indicated that the crystallinity of HCPT in microparticles
affects the control release performance, and the good encapsulated microparticles with
higher DL and higher crystallinity are better.
10-Hydroxycamptothecin proliposomes (HCPT-PL) were also prepared using the
SAS process in our previous study [121], the results showed that spherical or clavate

21
HCPT-PL were obtained under different DL, as shown in Fig. 13. For the optimized
HCPT-PL, the residual DCM meets the ICH requirement, and part of the encapsulated
HCPT still maintains its crystalline state. The result of in vitro release rate study
showed that HCPT-PL sustained the HCPT release rate successfully, where the drug
release of the optimized HCPT-PL followed the first order kinetics, and the drug
diffusion mainly corresponded to a Fickian diffusion mechanism during the first 10 h.
SCF co-precipitation/encapsulation processes are also employed to produce
targeted DDS. One way for achieving targeting of specific cell types is suggested that
modifying the carrier materials with the targeting moieties, such as ligands, peptides
or aptamers. Among them, folate (FA) is one of the most common targeting moieties,
and has been covalently attached to a wide array of drug delivery carriers.
For example, Zu et al [122] prepared FA-dextran-CPT tumor-targeted
nanoparticles by SAS process. Under the optimum operation conditions,
FA-dextran-CPT nanoparticles with a mean PS of 182.21 nm were obtained, and the
EE and LD were 62.13% and 36.12%, respectively. Compared with other methods for
preparing tumor-targeted nanoparticles, the SAS process is uncomplicated to
implement. Moreover, Results suggest FA-dextran-CPT nanoparticles have excellent
potential in drug delivery systems for cancer chemotherapy.
Zhao et al [123] prepared HCPT-chitosan (HCPT-CS) nanoparticles by the
SAS-ionic crosslink combination method; the resulting HCPT-CS nanoparticles were
then conjugated with folate for specific targeting. Optimum conditions for preparing
desired HCPT-CS nanoparticles with a mean PS of 173.5 nm and entrapment
efficiency of 77.3% were obtained. The resulting FA-HCPT-CS nanoparticles reveal
that the amount of folate conjugation was 197.64 mg/g CS. FA-HCPT-CS
nanoparticles used in drug carrier systems could have potential value in
HCPT-sensitive tumors.
Another way for drug targeting is using polymer/magnetite particles, which is
based on the attractive forces between the applied magnetic field at the target site and
the magnetic material dispersed within the drug-loaded polymer particles. Vezzù et al
[124] produced lipid microparticles magnetically active by a modified PGSS process.
The EE of magnetite nanoparticles was about 30% and increased with the
concentration of magnetite in the initial mixture. The possibility to drive these
magnetically active particles by an external magnet was demonstrated in a simple
apparatus simulating a vessel of the circulatory system. The coating of magnetite
nanoparticles with lipids by the modified-PGSS process presently developed provides
materials which may be interesting for diagnostic and therapeutic applications.

22
Chattopadhyay et al [125] used SAS and SAS-EM processes to produce
magnetite-encapsulated PLGA, PMMA and Eudragit RS biodegradable polymer
particles via co-precipitation of the polymer with a suspension of magnetite particles
in mineral oil and a fatty acid surfactant, where DCM is solvent. Chen et al [126]
prepared Fe3O4-PLLA-PEG-PLLA magnetic microspheres (MMPs) in a process of
suspension-enhanced dispersion by supercritical CO2, a modified SEDS process by
employing the “injector”-like suspension delivery system. Methotrexate-loaded
Fe3O4-PLLA-PEG-PLLA MMPs were produced by co-precipitation and
microencapsulation processes. The resulting MMPs had a spherical shape, with a
good magnetic response, which would have potential as a sustained and targeted drug
delivery system when combined with the microencapsulation process.
4.2.2 Tailoring particle microstructures via SCF co-precipitation/encapsulation
processes
Besides PS, PSD, morphology and crystal form, particle microstructures like DL
and EE are essential to be tailored for SCF co-precipitation/encapsulation processes.
Table 4 lists recent SCF co-precipitation/encapsulation processes with an emphasis on
the effects of operating parameters on PS, DL and EE. Although a fairly general
experimental result of the effects of operating parameters on particle microstructures
is not available up to now, some correlations have been proposed and rationally
explained on the basis of the thermodynamics and fluid dynamics knowledge.
Typical examples for RESS co-precipitation/encapsulation processes are as
follow. Kim et al [134] investigated the effects of fluid phase interactions on particle
formation using RESS though combining the solubility data with morphology studies.
The solubility of PLLA and naproxen/ PLLA was measured by using a dynamic flow
apparatus, and correlated by the lattice fluid theory of Sanchez and Lacombe. The
results suggested that the value of having phase equilibrium data corresponding to
morphology studies was the ability to calculate S and accurately describe where
precipitation begins to take place in the nozzle. For the co-precipitation of PLLA and
naproxen, PLLA microspheres (10-90 たm) loaded with naproxen and some free naproxen microparticles (1-5 たm) were observed at a pre-expansion T of 114 °C and
an extraction P of 190 bar, and the composite particles consisted of a naproxen core
surrounded by a thin polymer coating.
Songtipya et al [127] produce catechin/PLLA nanoparticles using RESOLV. The
results showed that Cd, pre-expansion T and P had no significant effect on the shape
and size of composite nanoparticles, which indicated that rapid expansion into a
receiving solution effectively interrupted the collision and growth of particles in the

23
free jet. While, the DL and EE of catechin increased with increasing pre-expansion T,
and with decreasing pre-expansion P and Cd. The effect of pre-expansion T and P
could be explained by the degree of saturation (s) of catechin solutions, increasing
pre-expansion T and decreasing pre-expansion P resulted in increasing S and hence a
higher nucleation rate of catechin, as well as increased catechin precipitation and
entrapment in PLLA along the expansion path. In addition, during rapid expansion,
catechin tended to precipitate preferentially in the form of its own particles instead of
being entrapped in PLLA with increasing Cd. However, different results were found by
Sane et al [128], where asiatic acid/ PLLA nanoparticles were successfully produced
by RESOLV, the results indicated that the DL and EE increased with increasing Cd/Cc,
but decreased with increasing pre-expansion T.
Typical examples for PGSS co-precipitation/encapsulation processes are as
follow. Rodrigues et al [129] obtained theophylline/HPO microcomposites by PGSS,
the results showed that P had no significant effect on PS. However, particles shaped
like needles, threads or fibers were more abundant at low pre-expansion P.
Conversely, spheres were predominant at higher pre-expansion P. A reasonable
explanation was proposed that at higher pre-expansion P, higher fluid densities are
obtained and nucleation starts later in the expansion path. Dissolution studies showed
that the Brophy and Deasy model was more adequate to follow the long-time drug
dissolution kinetics for the HPO/theophylline system. However, a significant burst
effect was observed because considerable amounts of theophylline were located at the
particles surface.
de Paz E et al [130] encapsulated く-carotene in soybean lecithin using
PGSS-drying technique. The influence of process variables on PS was correlated with
the atomization process, which was enhanced by increasing the amount of CO2
dissolved in the solution and the volumetric expansion ratio in the nozzle. The results
also suggested that a basic requirement for a high EE was a good dispersion of the
material to be encapsulated within the carrier matrix in the static mixer. If the
pre-expansion T was increased, more water was extracted in the static mixer because
the solubility of water in CO2 increased with T, thus, the EE increased when the
pre-expansion T was increased. Besides, with a concentrated solution of lecithin
already formed in the static mixer, particles or oil droplets can more easily be
surrounded by a shell of carrier material that can be mantained upon drying in the
spray tower, leading to the prodution of microcapsules and an increase of the EE.
Typical examples for SAS co-precipitation/encapsulation processes are as follow.

24
Fraile et al [113] encapsulated quercetin in Pluronic F127 poloxamers by SAS process,
the results suggested that for low-melting-T polymer, the particles were formed not by
nucleation from the solution by the anti-solvent effect, but rather by solidification
from a polymer melt. Although operation near the melting region was
disadvantageous for the micronization of a pure polymer, it was a favorable condition
for co-precipitation experiments, because it can facilitate the encapsulation of the
active compound through the formation of a polymer film over active-component
particles, avoiding the crystallization of segregated particles of active compound and
polymer. The results also indicated that viable conditions for SAS co-precipitation of
quercetin with Pluronic F127 were limited to a narrow range of Cd/Cc, in which
quercetin particles can act as nucleation sites for the formation of polymer films.
Further, formulations exhibited faster dissolution and a higher final solubility in
simulated gastric and intestinal fluids, because of the morphological and structural
properties conferred by SAS process.
Montes et al [131] co-precipitated Naproxen with Eudragit or PLLA by SAS
process. For Naproxen-Eudragit systems, a larger PS was obtained with a lower P.
This result can be explained by considering that an increase in P at constant T
enhances the solvent power of scCO2 toward the solvent, meaning that the liquid
solvent molecules are more strongly captured by the CO2, thus reducing the possible
interaction between solvent, polymer and drug. The Cd /Cc had a negligible effect on
PS but the DL was higher when a higher Cd /Cc ratio was used. The in vitro release
profiles of the Naproxen-Eudragit and Naproxen-PLLA systems showed a slower and
more controlled release in comparison to the untreated Naproxen.
Chen et al [132] prepared morphine-loaded PLLA and PLLA-PEG-PLLA
microparticles by the SEDS process. Results showed that the actual DL increased with
the increase of theoretical dosage while the EE decreased. The precipitated morphine
particles might act as host particles, which lead to easy encapsulation of morphine by
the precipitation of PLLA-PEG-PLLA particles. The ‘soft’ segment PEG grafted on the PLLA-PEG-PLLA made a great impact on the precipitation of microparticles,
since the hydrophilicity of PEG and the increase of PEG content increased the
solubility of copolymer in organic solvent. The release behaviors of microparticles
varied greatly with the PEG content in the PLLA-PEG-PLLA copolymer, showing
short-term release with burst release followed by sustained release within days or
long-term release lasted for weeks.
Zabihi et al [133] successfully encapsulated nano-curcumin in poly(lactic-co-
glycolic acid) through SAS-EM process, where poly(lactic-co-glycolic acid) solution
was sprayed into scCO2 media, in which nano-curcumin particles were fluidized by

25
ultrasonic vibration. The size and yielding of products decreased with increasing Fs.
But the DL first decreases and then increases slightly. Ultrasonic power exhibited a
crucial influence on microcapsules characteristics. Products had higher DL and higher
yield with increasing ultrasonic power, which was owe to better mixing effects. In the
other hand, higher ultrasonic power caused higher fluidization potential by which
nano-curcumin was distributed more uniform in precipitation vessel, and resulted
more efficient loading. High Fc also improved the DL and PSD when the ultrasonic
power was high enough to prevent the particles being pulled out by net flow.
Besides, the effects of the various conditions on PS and PSD in SAS
encapsulation process have been discussed in detail by Kalani et al [135]. The main
factors for choosing the solvent and biodegradable polymer to produce fine particles
to ensure effective drug delivery were emphasized and the effect of polymer structure
on drug encapsulation was illustrated.
5. SUMMARY AND CHALLENGES
Major advances in drug delivery over recent years have highlighted the
requirements of efficient methods for producing particles with designated
microstructures. SCF processes, as a green and effective alternative to traditional
method, have many advantages in particle design and show great potential in drug
micronization and co-precipitation/encapsulation.
In this review, a theoretical framework of SCF PD is put forward for particular
drug delivery, where the relationships among SCF processes, particle microstructures
and performances are discussed in detail. Particle microstructures can be effectively
tailored by controlling the operating parameters of SCF processes, where knowledge
about the complicated mechanism of particle formation and growth is expected to
help the screening and selection of suitable SCF process and its corresponding
operating parameters. However, challenges and issues are still existed and need
further study for the commercialization of SCF PD, such as following.
(a) Many researches have proved that the macroscopic properties of a drug delivery
formulation are depend on the particle microstructures, however, it is still difficult
to gain clear and definite requirements of a particular drug delivery on particle
microstructures.
(b) Many different SCF processes have been developed and used for particle design,
but it is difficult to choose a suitable SCF process for a particular drug delivery,
because of the limited knowledge of complicated mechanism involved in SCF
processes and insufficient fundamental solubility data of many drugs and/or

26
carrier materials in SCF.
(c) Although many of the nucleation and crystal growth mechanism and models
involved in SCF processes have been proposed, it can only qualitatively predict
the microstructures of the produced particles under different operating parameters,
it is still difficult to get a quantitative prediction. Rational explanations and
influence mechanisms of operating parameter on particle microstructures have
been reported in most experimental studies. But in-depth thermodynamic and
fluid dynamic study is not enough to determine a precise process path, and to
screen and select the corresponding operating parameters.
(d) The industrialization of SCF PD processes have been considered and developed
in recent years, but valid models or experience based on the experimental data are
very limited to perform the scale-up of a pilot or industrial scale.
CONFLICT OF INTEREST
The authors confirm that this article content has no conflicts of interest.
ACKNOWLEDGEMENTS
Financial supports from the National Natural Science Foundation of China (Nos.
21276091, 21476086) and Ph.D. Programs Foundation of Ministry of Education of
China (No. 20120172110010) are greatly appreciated.
ABBREVIATIONS
a, b = parameters of Peng-Robinson equation
ASES = Aerosol solvent extraction systems
c = mean thermal velocity
Cc = Carrier material concentration Cd = Drug concentration
CFA = Cefuroxime axetil
CS = Chitosan
D = Droplet diameter
DCM = Dichloromethane
DC = Diffusion coefficient
DDS = Drug delivery systems
DL = Drug loading
DM = Diameter of the Mach disk

27
DMSO = Dimethyl sulfoxide
Dp = Diameter of the particles
Dnozzle = Nozzle diameter
DT = Turbulent diffusivity
EOS = Equation of state
EtOH = Ethanol
e, A and B = parameters of Chrastil’s equation
EE = Encapsulation efficiency
F = Vibration frequency
f = PEG mass fraction in PLLA-PEG-PLLA
FA = Folate
Fc = scCO2 flow rate
Fs = Solution flow rate
G = Condensation growth rate
GAMA = Gas-assisted melting atomization
GAS = Gas antisolvent
HCPT = 10-Hydroxycamptothecin
PL = Proliposomes
HPO = Hydrogenated palm oil
IPA = Isopropyl alcohol
J = Nucleation rate
jr = diffusive flux
k = turbulent kinetic energy
kB = Boltzmann's constant
Kn = Knudsen number
LCEP = Lower critical end point
LM = Length of the supersonic free jet region
Lnozzle = Length of the nozzle
M = Solvent molecular weight
MCP = Mixture critical point
MMPs = Magnetic microspheres
n = Particle size distribution function
N* = Critical nuclei number concentration
P = Pressure
P0 = Pre-expansion pressure

28
PCA = Precipitation with compressed antisolvent
PEG = Poly(ethylene glycol)
PF-RESS = Pre-filtration rapid expansion of supercritical solution
PLLA = Poly(lactic acid)
Ppost = Expansion pressure
PR = Peng-Robinson
PS = Particle size
PSD = Particle size distribution
r = radial direction.
r* = critical nucleus size
Re = Reynolds
RESOLV = Rapid expansion of supercritical solution into a liquid solvent
RESS = Rapid expansion of supercritical solution
RESS-N = Rapid expansion of supercritical solution with a non-solvent
RESS-SC = Rapid expansion of supercritical solution with solid cosolvent
S = Supersaturation
s = degree of saturation
S-L-V = Solid-Liquid-Vapor
SAS = Supercritical antisolvent
SAS-EM = Supercritical antisolvent with enhanced mass transfer
ScCO2 = Supercritical CO2
SCF = Supercritical fluids
SCF PD = Supercritical fluid particle design
SEDS = Solution enhanced dispersion by supercritical fluids
SEDS-PA = SEDS with prefilming atomization
T = Temperature
t = time
u = velocity
UCEP = Upper critical end point
v = volume
v* = critical volume
vS = solid molecular volume
w = mass fraction of DCM (or DCM + EtOH)
y = solute concentration
yeq = saturation solute concentration

29
z = axial coordinate
gc = condensation coefficient
Brownian coagulation coefficient
= standard Dirac function
i = dissipation rate
せ = Zeldovich nonequilibrium factor
た = viscosity
e = non-isothermal factor
と1 = density of supercritical fluids
j = interfacial tension
kjb = time of jet break-up
kstv = time of surface tension vanishing
mass fraction
REFERENCES [1] Allen TM, Cullis PR. Drug delivery systems: entering the mainstream. Science 2004; 303:
1818-1822.
[2] Fahr A, Liu X. Drug delivery strategies for poorly water-soluble drugs. Expert Opin Inv Drug
2007; 4: 403-416.
[3] Loira-Pastoriza C, Todoroff J, Vanbever R. Delivery strategies for sustained drug release in
the lungs. Adv Drug Deliver Rev 2014; 75: 81-91.
[4] Sun Y. Supercritical Fluid Particle Design for Poorly Water-soluble Drugs (Review). Curr
Pharm Design 2014; 20:349-368.
[5] Jain KK. Drug delivery systems-an overview. In Jain KK (Ed), Drug Delivery Systems,
Humana Press 2008: pp. 1-50.
[6] Rishikesh, Faruki MZ, Ghosh DR. Tailored Release Drug Delivery System (TRDDS), Int Res
J Pharm App Sci 2012; 2: 128-137.
[7] Jain A, Bollinger JA, Truskett TM. Inverse methods for material design. AIChE J 2014;
00:1-9
[8] Aguilera JM. Why food microstructure?. J Food Eng 2005; 67: 3-11.
[9] York P. Strategies for particle design using supercritical fluid technologies. Pharm Sci Tech
today 1999; 2: 430-440.
[10] Cansell F, Aymonier C. Design of functional nanostructured materials using supercritical
fluids. J Supercrit Fluid 2009; 47: 508-516.
[11] Ginty PJ, Whitaker MJ, Shakesheff KM, et al. Drug delivery goes supercritical. Mater today
2005; 8: 42-48.
[12] Fages J, Lochard H, Letourneau JJ, et al. Particle generation for pharmaceutical applications
using supercritical fluid technology. Powder Technol 2004; 141: 219-226.
[13] Elvassore N, Kikic I. Pharmaceutical processing with supercritical fluids. In: Bertucco A,
Vetter G, Eds. High Pressure Process Technology: Fundamentals and Applications.
Netherlands: Elsevier 2001; pp. 612-625

30
[14] Martín Á, Varona S, Navarrete A, et al. Encapsulation and co-precipitation processes with
supercritical fluids: applications with essential oils. Open Chem Eng J 2010; 4: 31-41.
[15] Sekhon BS. Supercritical fluid technology: an overview of pharmaceutical applications. Int J
Pharm Tech Res 2010; 2: 810-826.
[16] Tabernero A, Martín del Valle EM, Galán MA. Supercritical fluids for pharmaceutical
particle engineering: Methods, basic fundamentals and modelling. Chem Eng Process 2012;
60: 9-25.
[17] Üner M, Yener G. Importance of solid lipid nanoparticles (SLN) in various administration
routes and future perspectives. Int J Nanomed 2007; 2: 289.
[18] Rowland M. Influence of route of administration on drug availability. J Pharm Sci 1972; 61:
70-74.
[19] Shekunov BY, Chattopadhyay P, Tong HHY, Chow AHL. Particle size analysis in
pharmaceutics: principles, methods and applications. Pharm Res 2007; 24: 203-227.
[20] Gaumet M, Vargas A, Gurny R, et al. Nanoparticles for drug delivery: the need for precision
in reporting particle size parameters. Eur J Pharm Biopharm 2008; 69: 1-9.
[21] Desai MP, Labhasetwar V, Amidon GL, et al. Gastrointestinal uptake of biodegradable
microparticles: effect of particle size. Pharm Res 1996; 13: 1838-1845.
[22] Kohli AK, Alpar HO. Potential use of nanoparticles for transcutaneous vaccine delivery:
effect of particle size and charge. Int J Pharm 2004; 275: 13-17.
[23] Pilcer G, Amighi K. Formulation strategy and use of excipients in pulmonary drug delivery.
Int J Pharm 2010; 392: 1-19.
[24] Fu Y, Kao WJ. Drug release kinetics and transport mechanisms of non-degradable and
degradable polymeric delivery systems. Expert Opin Drug Del 2010; 7: 429-444.
[25] Langer R. New methods of drug delivery. Science 1990; 249: 1527-1533.
[26] Korsmeyer RW, Gurny R, Doelker EM, Buri P, Peppas NA. Mechanism of solute release
from porous hydrophilic polymers. Int J Pharm1983; 15: 25-35.
[27] Dash S, Murthy PN, Nath L, et al. Kinetic modeling on drug release from controlled drug
delivery systems. Acta Pol Pharm 2010; 67: 217-223.
[28] Mauger JW, Chilko D, Howard S. On the analysis of dissolution data. Drug Dev Ind
Pharm1986; 12: 969-992.
[29] Polli JE, Rekhi GS, Augsburger LL, et al. Methods to compare dissolution profiles and a
rationale for wide dissolution specifications for metoprolol tartrate tablets. J Pharm Sci 1997;
86: 690-700.
[30] Costa P, Lobo JMS. Modeling and comparison of dissolution profiles. Eur J Pharm Sci 2001;
13: 123-133.
[31] Papadopoulou V, Kosmidis K, Vlachou M, et al. On the use of the Weibull function for the
discernment of drug release mechanisms. Int J Pharm 2006; 309: 44-50.
[32] Costa P. An alternative method to the evaluation of similarity factor in dissolution testing. Int
J Pharm 2001; 220: 77-83.
[33] Shah VP, Tsong Y, Sathe P, et al. In vitro dissolution profile comparison-statistics and
analysis of the similarity factor, f2. Pharm Res 1998; 15: 889-896.
[34] Bae YH, Park K. Targeted drug delivery to tumors: myths, reality and possibility. J Control
Release 2011; 153: 198-205.
[35] Torchilin VP. Drug targeting. Europ Eur J Pharm Sci 2000; 11: S81-S91.

31
[36] Ruenraroengsak P, Cook JM, Florence AT. Nanosystem drug targeting: facing up to complex
realities. J Control Release 2010; 141: 265-276.
[37] Florence AT, Halbert GW. Drug delivery and targeting. Phys Tech 1985; 16: 164-170.
[38] Farokhzad OC, Langer R. Impact of nanotechnology on drug delivery. ACS nano 2009; 3:
16-20.
[39] Perrut M, Clavier JY. Supercritical fluid formulation: process choice and scale-up. Ind Eng
Chem Res 2003; 42: 6375-6383.
[40] Smith RD, inventor. Supercritical fluid molecular spray film deposition and powder
formation. US Patent 4582731. 1986.
[41] Sane A, Limtrakul J. Formation of retinyl palmitate-loaded poly (l-lactide) nanoparticles
using rapid expansion of supercritical solutions into liquid solvents (RESOLV). J Supercrit
Fluid 2009; 51: 230-237.
[42] Young TJ, Mawson S, Johnston KP, et al. Rapid Expansion from Supercritical to Aqueous
Solution to Produce Submicron Suspensions of Water-Insoluble Drugs. Biotechnol Progr
2000; 16: 402-407.
[43] Mishima K, Matsuyama K, Tanabe D, et al. Microencapsulation of proteins by rapid
expansion of supercritical solution with a nonsolvent. AIChE J 2000; 46: 857-865.
[44] Thakur R, Gupta RB. Formation of phenytoin nanoparticles using rapid expansion of
supercritical solution with solid cosolvent (RESS-SC) process. Int J Pharm 2006; 308:
190-199.
[45] Thakur R, Gupta RB. Rapid expansion of supercritical solution with solid cosolvent
(RESS-SC) process: formation of griseofulvin nanoparticles. Ind Eng Chem Res 2005; 44:
7380-7387.
[46] Thakur R, Gupta RB. Rapid expansion of supercritical solution with solid cosolvent
(RESS-SC) process: Formation of 2-aminobenzoic acid nanoparticle. J Supercrit Fluid 2006;
37: 307-315.
[47] Chiou AHJ, Yeh MK, Chen CY, et al. Micronization of meloxicam using a supercritical fluids
process. J Supercrit Fluid 2007; 42: 120-128.
[48] Türk M. Manufacture of submicron drug particles with enhanced dissolution behaviour by
rapid expansion processes. J Supercrit Fluid 2009; 47: 537-545.
[49] Weidner E, Knez Z, Novak Z, Inventors. A process and equipment for production and
fractionation of fine particles from gas saturated solutions, World Patent WO 95/21688. 1994.
[50] Salmaso S, Elvassore N, Bertucco A, et al. Production of solid lipid submicron particles for
protein delivery using a novel supercritical gas-assisted melting atomization process. J Pharm
Sci 2009; 98: 640-650.
[51] Meterc D, Petermann M, Weidner E. Drying of aqueous green tea extracts using a
supercritical fluid spray process. J Supercrit Fluid 2008; 45: 253-259.
[52] Gallagher PM, Coffey MP, Krukonis VJ, et al. Gas antisolvent recrystallization: new process
to recrystallize compounds insoluble in supercritical fluids. In: Gallagher PM, Coffey MP,
Krukonis VJ, Eds. Supercritical Fluid Science and Technology. Washington, DC: American
Chemical Society 1989; pp.334-354.
[53] De la Fuente Badilla JC, Peters CJ, de Swaan Arons J. Volume expansion in relation to the
gas-antisolvent process. J Supercrit Fluid 2000; 17: 13-23.
[54] Palakodaty S, York P, Pritchard J. Supercritical fluid processing of materials from aqueous

32
solutions: the application of SEDS to lactose as a model substance. Pharm Res1998; 15:
1835-1843.
[55] He W, Suo Q, Jiang Z H, et al. Precipitation of ephedrine by SEDS process using a specially
designed prefilming atomizer. J Supercrit Fluid 2004, 31: 101-110.
[56] He W, Suo Q, Hong H, et al. Production of natural carotene-dispersed polymer microparticles
by SEDS-PA co-precipitation. J Mater Sci 2007; 42: 3495-3501.
[57] Chattopadhyay P, Gupta RB. Production of griseofulvin nanoparticles using supercritical CO2
antisolvent with enhanced mass transfer. Int J Pharm 2001; 228: 19-31.
[58] Pratsinis S E. Simultaneous nucleation, condensation, and coagulation in aerosol reactors. J
Colloid Interf Sci 1988; 124: 416-427.
[59] Kalani A, Christofides P D. Simulation, estimation and control of size distribution in aerosol
processes with simultaneous reaction, nucleation, condensation and coagulation. Comput
Chem Eng 2002; 26: 1153-1169.
[60] Debenedetti PG. Homogeneous nucleation in supercritical fluids. AIChE J 1990; 36:
1289-1298.
[61] Friedlander S K, Ed. Smoke, Dust and Haze. New York:̳Oxford University Press, 2000.
[62] Gupta RB, Shim JJ. Solubility in supercritical carbon dioxide. USA: CRC Press 2006.
[63] Sޣkerget M, Knez Z, Knez-Hrncޣicޣ M. Solubility of solids in sub-and supercritical fluids: a
review. J Chem Eng Data 2011; 56: 694-719.
[64] Li J, Jin J, Zhang Z, et al. Equilibrium solubilities of a p-toluenesulfonamide and
sulfanilamide mixture in supercritical carbon dioxide with and without ethanol. J Supercrit
Fluid 2010; 52: 11-17.
[65] Jiang Y, Liu M, Sun W, et al. Phase Behavior of Poly (lactic acid)/Poly (ethylene glycol)/Poly
(lactic acid)(PLA-PEG-PLA) in Different Supercritical Systems of CO2+ Dichloromethane
and CO2+ C2H5OH+ Dichloromethane. J Chem Eng Data 2010; 55: 4844-4848.
[66] Ashour I, Almehaideb R, Fateen S E, et al. Representation of solid-supercritical fluid phase
equilibria using cubic equations of state. Fluid Phase Equilibr 2000; 167: 41-61.
[67] Luo N, Lu Y, Jiang Y. Solubility of paclitaxel in mixtures of dichloromethane and
supercritical carbon dioxide. Chinese J Chem Eng 2011; 19: 558-564.
[68] Li S, Varadarajan GS, Hartland S. Solubilities of theobromine and caffeine in supercritical
carbon dioxide: correlation with density-based models. Fluid Phase Equilibr 1991; 68:
263-280.
[69] Sparks DL, Hernandez R, Estévez LA. Evaluation of density-based models for the solubility
of solids in supercritical carbon dioxide and formulation of a new model. Chem Eng Sci 2008;
63: 4292-4301.
[70] Lucien FP, Foster NR. Solubilities of solid mixtures in supercritical carbon dioxide: a review.
J Supercrit Fluid 2000; 17: 111-134.
[71] Kirby CF, McHugh MA. Phase behavior of polymers in supercritical fluid solvents. Chem
Rev 1999; 99: 565-602.
[72] Elvassore N, Flaibani M, Bertucco A, et al. Thermodynamic analysis of micronization
processes from gas-saturated solution. Ind Eng Chem Res 2003; 42: 5924-5930.
[73] Palakodaty S, York P. Phase behavioral effects on particle formation processes using
supercritical fluids. Pharm Res 1999; 16: 976-985.
[74] Dixon DJ, Johnston KP, Bodmeier RA. Polymeric materials formed by precipitation with a

33
compressed fluid antisolvent. AIChE J 1993; 39: 127-139.
[75] Reverchon E, Caputo G, De Marco I. Role of phase behavior and atomization in the
supercritical antisolvent precipitation. Ind Eng Chem Res 2003; 42: 6406-6414.
[76] Kayrak D, Akman U, Hortaçsu Ö. Micronization of ibuprofen by RESS. J Supercrit Fluid
2003; 26: 17-31.
[77] Hirunsit P, Huang Z, Srinophakun T, et al. Particle formation of ibuprofen-supercritical CO2
system from rapid expansion of supercritical solutions (RESS): A mathematical model.
Powder Technol 2005; 154: 83-94.
[78] Helfgen B, Türk M, Schaber K. Theoretical and experimental investigations of the
micronization of organic solids by rapid expansion of supercritical solutions. Powder technol
2000; 110: 22-28.
[79] Weber M, Russell LM, Debenedetti PG. Mathematical modeling of nucleation and growth of
particles formed by the rapid expansion of a supercritical solution under subsonic conditions.
J Supercrit Fluid 2002; 23: 65-80.
[80] Reverchon E, Pallado P. Hydrodynamic modeling of the RESS process. J Supercrit Fluid
1996; 9: 216-221.
[81] Martín A, Cocero MJ. Micronization processes with supercritical fluids: fundamentals and
mechanisms. Adv Drug Deliver Rev 2008; 60: 339-350.
[82] Li J, Matos HA, Gomes de Azevedo E. Two-phase homogeneous model for particle
formation from gas-saturated solution processes. J Supercrit Fluid. 2004; 32: 275-286.
[83] Li J, Rodrigues M, Paiva A, et al. Modeling of the PGSS process by crystallization and
atomization. AIChE J 2005; 51: 2343-2357.
[84] Reverchon E, Torino E, Dowy S, et al. Interactions of phase equilibria, jet fluid dynamics and
mass transfer during supercritical antisolvent micronization. Chem Eng J 2010; 156:
446-458.
[85] Martı囲n A, Cocero M J. Numerical modeling of jet hydrodynamics, mass transfer, and crystallization kinetics in the supercritical antisolvent (SAS) process. J Supercrit Fluid 2004;
32: 203-219.
[86] Lengsfeld C S, Delplanque J P, Barocas V H, et al. Mechanism governing microparticle
morphology during precipitation by a compressed antisolvent: atomization vs nucleation and
growth. J Phys Chem B 2000; 104: 2725-2735.
[87] Reverchon E, Adami R, Caputo G, et al. Spherical microparticles production by supercritical
antisolvent precipitation: interpretation of results. J Supercrit Fluid 2008; 47: 70-84.
[88] Reverchon E, De Marco I. Mechanisms controlling supercritical antisolvent precipitate
morphology. Chem Eng J 2011; 169: 358-370.
[89] Reverchon E, De Marco I, Torino E. Nanoparticles production by supercritical antisolvent
precipitation: a general interpretation. J Supercrit Fluid 2007; 43: 126-138.
[90] Reverchon E, De Marco I, Adami R, et al. Expanded micro-particles by supercritical
antisolvent precipitation: interpretation of results. J Supercrit Fluid 2008; 44: 98-108.
[91] Rossmann M, Braeuer A, Dowy S, et al. Solute solubility as criterion for the appearance of
amorphous particle precipitation or crystallization in the supercritical antisolvent (SAS)
process. J Supercrit Fluid 2012; 66: 350-358.
[92] Dowy S, Torino E, Luther S K, et al. Imaging the supersaturation in high-pressure systems
for particle generation. Chem Eng J 2011; 168: 896-902.

34
[93] Werling J O, Debenedetti P G. Numerical modeling of mass transfer in the supercritical
antisolvent process. J Supercrit Fluid 1999; 16: 167-181.
[94] Chattopadhyay P, Gupta R B. Protein nanoparticles formation by supercritical antisolvent
with enhanced mass transfer. AIChE J 2002; 48: 235-244.
[95] Topp M N. Ultrasonic atomization-a photographic study of the mechanism of disintegration.
J Aerosol Sci 1973; 4: 17-25.
[96] Steckel H, Thies J, Müller B W. Micronizing of steroids for pulmonary delivery by
supercritical carbon dioxide. Int J Pharm 1997; 152: 99-110.
[97] Todo H, Iida K, Okamoto H, et al. Improvement of insulin absorption from intratracheally
administrated dry powder prepared by supercritical carbon dioxide process. J Pharm Sci 2003;
92: 2475-2486.
[98] Bakhbakhi Y, Charpentier P A, Rohani S. Experimental study of the GAS process for
producing microparticles of beclomethasone-17, 21-dipropionate suitable for pulmonary
delivery. Int J Pharm 2006; 309: 71-80.
[99] Keshavarz A, Karimi-Sabet J, Fattahi A, et al. Preparation and characterization of raloxifene
nanoparticles using rapid expansion of supercritical solution (RESS). J Supercrit Fluid 2012;
63: 169-179.
[100] Varshosaz J, Hassanzadeh F, Mahmoudzadeh M, et al. Preparation of cefuroxime axetil
nanoparticles by rapid expansion of supercritical fluid technology. Powder Technol 2009;
189: 97-102.
[101] Kim M S, Jin S J, Kim J S, et al. Preparation, characterization and in vivo evaluation of
amorphous atorvastatin calcium nanoparticles using supercritical antisolvent (SAS) process.
Eur J Pharm Biopharm 2008; 69: 454-465.
[102] Bolten D, Türk M. Micronisation of carbamazepine through rapid expansion of supercritical
solution (RESS). J Supercrit Fluid 2012; 62: 32-40.
[103] Rossmann M, Braeuer A, Leipertz A, et al. Manipulating the size, the morphology and the
polymorphism of acetaminophen using supercritical antisolvent (SAS) precipitation. J
Supercrit Fluid 2013; 82: 230-237.
[104] Jiang Y, Sun W, Wang W. Recrystallization and micronization of 10-hydroxycamptothecin
by supercritical antisolvent process. Ind Eng Chem Res 2012; 51: 2596-2602.
[105] Huang Z, Guo Y, Miao H, et al. Solubility of progesterone in supercritical carbon dioxide
and its micronization through RESS. Powder Technol 2014; 258: 66-77.
[106] Dalvi S V, Azad M A, Dave R. Precipitation and stabilization of ultrafine particles of
Fenofibrate in aqueous suspensions by RESOLV. Powder Technol 2013; 236: 75-84.
[107] Türk M, Bolten D. Formation of submicron poorly water-soluble drugs by rapid expansion
of supercritical solution (RESS): results for naproxen. J Supercrit Fluid 2010; 55: 778-785.
[108] Lin P C, Su C S, Tang M, et al. Micronization of tolbutamide using rapid expansion of
supercritical solution with solid co-solvent (RESS-SC) process. Res Chem Intermediat 2011;
37: 153-163.
[109] Chen W, Hu X, Hong Y, et al. Ibuprofen nanoparticles prepared by a PGSS™-based method.
Powder Technol 2013; 245: 241-250.
[110] Esfandiari N, Ghoreishi S M. Synthesis of 5-Fluorouracil nanoparticles via supercritical gas
antisolvent process. J Supercrit Fluid 2013; 84: 205-210.
[111] Xu J, Luo K Q. Enhancing the solubility and bioavailability of isoflavone by particle size

35
reduction using a supercritical carbon dioxide-based precipitation process. Chem Eng Res
Des 2014; In Press.
[112] Yim J H, Kim W S, Lim J S. Recrystallization of Adefovir Dipivoxil Particles Using the
Aerosol Solvent Extraction System Process. Ind Eng Chem Res 2014; 53: 1663-1671
[113] Fraile M, Buratto R, Gómez B, et al. Enhanced delivery of quercetin by encapsulation in
poloxamers by supercritical antisolvent process. Ind Eng Chem Res 2014; 53: 4318-4327.
[114] Franceschi E, Kunita M H, Tres M V, et al. Phase behavior and process parameters effects
on the characteristics of precipitated theophylline using carbon dioxide as antisolvent. J
Supercrit Fluid 2008; 44: 8-20.
[115] Chang SC, Lee MJ, Lin H. The influence of phase behavior on the morphology of protein
g-chymotrypsin prepared via a supercritical anti-solvent process. J. Supercrit Fluid 2008; 44:
219-229.
[116] Baseri H, Lotfollahi M N. Effects of expansion parameters on characteristics of gemfibrozil
powder produced by rapid expansion of supercritical solution process. Powder Technol
2014; 253: 744-750.
[117] Liu G, Wang H, Jiang Y. Recrystallization and Micronization of Camptothecin by the
Supercritical Antisolvent Process: Influence of Solvents. Ind Eng Chem Res 2013; 52:
15049-15056.
[118] Duarte A R C, Costa M S, Simplício A L, et al. Preparation of controlled release
microspheres using supercritical fluid technology for delivery of anti-inflammatory drugs.
Int J Pharm 2006; 308: 168-174.
[119] Lee L Y, Wang C H, Smith K A. Supercritical antisolvent production of biodegradable
micro-and nanoparticles for controlled delivery of paclitaxel. J Control Release 2008; 125:
96-106.
[120] Wang W, Liu G, Wu J, et al. Co-precipitation of 10-hydroxycamptothecin and poly (l-lactic
acid) by supercritical CO2 anti-solvent process using dichloromethane/ethanol co-solvent. J
Supercrit Fluid 2013; 74: 137-144.
[121] Liu G, Wang W, Wang H, et al. Preparation of 10-hydroxycamptothecin proliposomes by the
supercritical CO2 anti-solvent process. Chem Eng J 2014; 243: 289-296.
[122] Zu Y, Wang D, Zhao X, et al. A novel preparation method for camptothecin (CPT) loaded
folic acid conjugated dextran tumor-targeted nanoparticles. Int J Mol Sci 2011; 12:
4237-4249.
[123] Zhao X, Jiang R, Zu Y, et al. Process optimization studies of 10-Hydroxycamptothecin
(HCPT)-loaded folate-conjugated chitosan nanoparticles by SAS-ionic crosslink
combination using response surface methodology (RSM). Appl Surf Sci 2012; 258:
2000-2005.
[124] Vezzù K, Campolmi C, Bertucco A. Production of lipid microparticles magnetically active
by a supercritical fluid-based process. Int J Chem Eng 2009; 2009: 1-9.
[125] Chattopadhyay P, Gupta R B. Supercritical CO2 based production of magnetically
responsive micro-and nanoparticles for drug targeting. Ind Eng Chem Res 2002; 41:
6049-6058.
[126] Chen A Z, Li L, Wang S B, et al. Study of Fe3O4-PLLA-PEG-PLLA magnetic microspheres
based on supercritical CO2: Preparation, physicochemical characterization, and drug
loading investigation. J Supercrit Fluid 2012; 67: 139-148.

36
[127] Songtipya L, Sane A. Effect of concentration and degree of saturation on co-precipitation of
catechin and poly (l-lactide) by the RESOLV process. J Supercrit Fluid 2013; 75: 72-80.
[128] Sane A, Limtrakul J. Co-precipitation of asiatic acid and poly (l-lactide) using rapid
expansion of subcritical solutions into liquid solvents. J Nanopart Res 2011; 13: 4001-4013.
[129] Rodrigues M, Peiriço N, Matos H, et al. Microcomposites theophylline/hydrogenated palm
oil from a PGSS process for controlled drug delivery systems. J Supercrit Fluid 2004; 29:
175-184.
[130] de Paz E, Martín Á, Cocero M J. Formulation of く-carotene with soybean lecithin by PGSS
(Particles from Gas Saturated Solutions)-drying. J Supercrit Fluid 2012; 72: 125-133.
[131] Montes A, Kin N, Gordillo M D, et al. Polymer-naproxen precipitation by supercritical
antisolvent (SAS) process. J Supercrit Fluid 2014; 89: 58-67.
[132] Chen F, Yin G, Liao X, et al. Preparation, characterization and in vitro release properties of
morphine-loaded PLLA-PEG-PLLA microparticles via solution enhanced dispersion by
supercritical fluids. J Mater Sci 2013; 24: 1693-1705.
[133] Zabihi F, Xin N, Li S, et al. Polymeric coating of fluidizing nano-curcumin via anti-solvent
supercritical method for sustained release. J Supercrit Fluid 2014; 89: 99-105.
[134] Kim J H, Paxton T E, Tomasko D L. Microencapsulation of naproxen using rapid expansion
of supercritical solutions[J]. Biotechnol Progr 1996; 12: 650-661.
[135] Kalani M, Yunus R. Application of supercritical antisolvent method in drug encapsulation: a
review. Int J Nanomed 2011; 6: 1429-1442.

37
Tables
Table 1. The most common administration methods and their advantages and
disadvantages
Methods Advantage Disadvantage
Oral
administration
The preferred route
Easy administration
Widespread acceptance
Low bioavailability
Gastrointestinal tract problems
Not suitable for drugs targeted
Injection
Rapid onset of action
Predictable bioavailability
Avoidance gastrointestinal tract
Pain involved and patient compliance
Dangerous medical waste
Disease transmission by needle reuse
Transdermal
administration
Non-invasive
Long release periods
Improved patient compliance
Significant barrier properties of skin
Only a limited number of drugs are
amenable to administration
Pulmonary drug
delivery
Large absorption surface area
Avoidance of the first pass
hepatic metabolism
High therapeutic effects
Drug deposition
Deposited particles cleared by the
mucous toward the throat
High demands on the inhalation devices
Table 2. Summary of the SCF PD processes and their mainly operating parameters
Role of SCF Process Modifications Mainly operating parameters
Solvent RESS
RESSOLV
RESSAS
RESS-N
RESS-SC
PF-RESS
Extraction T and P
CO2 flow rate (Fc)
Solution flow rate (Fs)
Pre-expansion T and P
Expansion T
Nozzle design
Solute PGSS GAMA
PGSS-drying
Operating T and P
Fc and Fs
Nozzle design
CO2/solute ratio
Antisolvent SAS
GAS
PCA/ASES
SEDS
SEDS-PA
SAS-EM
Organic solvent
Drug concentration (Cd)
Carrier material concentration (Cc)
Nozzle design
Fc and Fs
T and P

38
Table 3. Examples of SCF micronization processes Drug/Method Operating parameters Results Ref.
Progesterone/
RESS
Extraction T: 40-60 oC
Extraction P:120-260 bar
Dnozzle: 60-350 たm
PS: 150 たm to 0.11-3.22 たm
PS decreases with Dnozzle increases, but
increases with extraction P or T.
[105]
Fenofibrate/
RESOLV
Pre-expansion P:100-200 bar
Dnozzle:127-762 たm
Lnozzle:3-6 cm
8 different stabilizers
PS: 0.5-5 たm
Stabilizers have a great effect on
particle properties
[106]
Naproxen/
RESS and
RESSAS
Extraction P: 200-300 bar
Pre-expansion T: 50-90 oC
Pre-expansion P: 200-300 bar
PS: 0.56-0.82 たm (RESS) and 0.3 たm
(RESSAS)
RESSAS can effectively minimize
particle growth
[107]
Tolbutamide/
RESS and
RESS-SC
Extraction T: 35-45 oC
Extraction P: 150-200 bar
Pre-expansion T: 120 oC
Solid co-solvent: Menthol
PS: 8.5-9.2 たm ( RESS) and 2.1- 2.9
たm (RESS-SC)
The polymorph conversion from form
I to form II
[108]
Ibuprofen/
PGSS
Operating P: 100-250 bar
Operating T: 50-80 oC
Fs :1.0 -3.2 ml/min
Dispersing matrices:
PEG2000 - PEG6000
PS: 20-500 nm
PS decreases with P and molecular
weight of PEG increases, but increases
with T or Fs.
[109]
5-Fluorouracil /
GAS
T: 34-46 oC
P: 90-150 bar
Cd: 20-100 mg/mL
Fs:1.6-2.4 mL/min
PS:260-600 nm
PS decreased with decreasing T and Cd
and with increasing P and Fs
[110]
Isoflavone/
PCA
P: 85-120 bar
Cd: 0.4-4 mg/mL
Solvent: Acetone, EtOH,
EtOH+ Acetone
PS: 10-50 たm to 254 nm at width
Reduction PS increased 2 fold water
solubility and improved 2.6 fold
plasma concentration after oral
administration in rat
[111]
Adefovir
Dipivoxil /
ASES
T: 28-50 oC, P: 70-200 bar
Fs: 0.2-1 mL/min
Cd: 0.5-2 wt%
Solvent: ethanol, methanol ,
and isopropyl alcohol (IPA)
PS decreases with decreased T, Cd and
Fs, and with increased P.
The order of solvents was methanol <
ethanol < IPA
[112]
Quercetin/
SEDS
T: 35-45 oC, P: 100-200 bar
Fs: 1-5 mL/min
Flow time: 4-20 min
Cd: 5-10 mg/mL
Ultrasonic power:100-300 W
PS: 47.4 たm to 0.12-0.45たm
PS decreases with increasing Fs and
ultrasonic power, decreasing drug Cd
and flow time
[113]
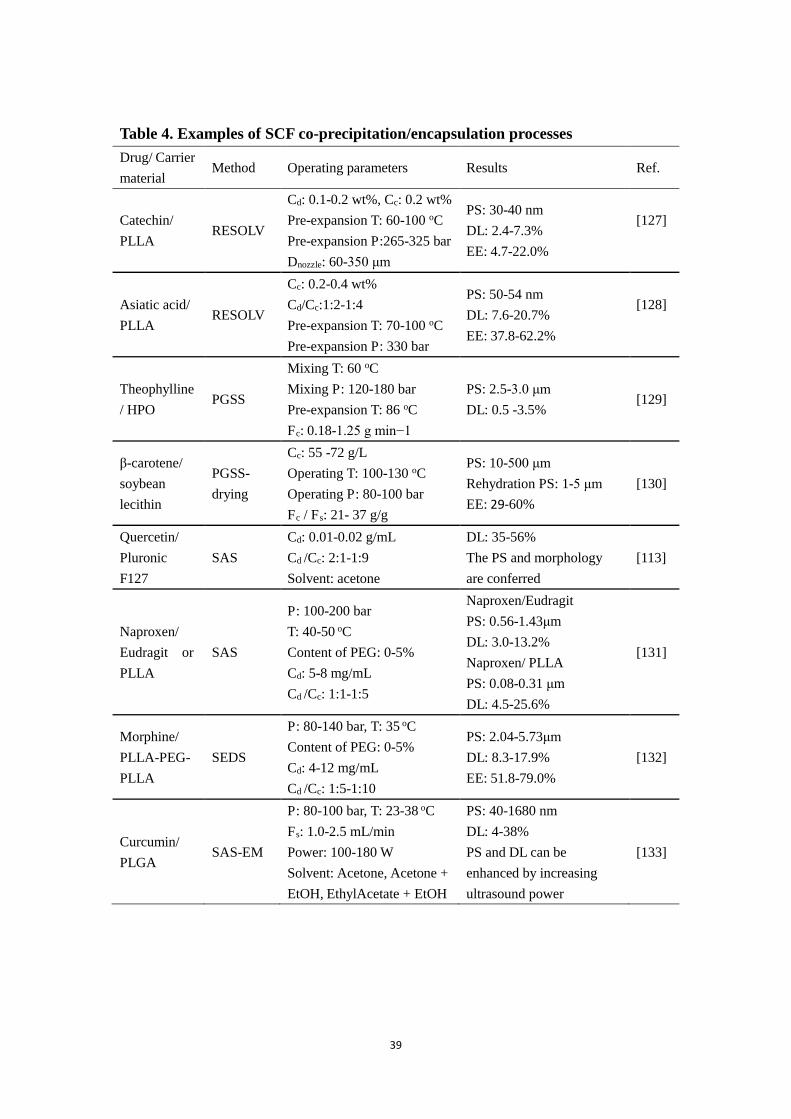
39
Table 4. Examples of SCF co-precipitation/encapsulation processes
Drug/ Carrier
material Method Operating parameters Results Ref.
Catechin/
PLLA RESOLV
Cd: 0.1-0.2 wt%, Cc: 0.2 wt%
Pre-expansion T: 60-100 oC
Pre-expansion P:265-325 bar
Dnozzle: 60-350 たm
PS: 30-40 nm
DL: 2.4-7.3%
EE: 4.7-22.0%
[127]
Asiatic acid/
PLLA RESOLV
Cc: 0.2-0.4 wt%
Cd/Cc:1:2-1:4
Pre-expansion T: 70-100 oC
Pre-expansion P: 330 bar
PS: 50-54 nm
DL: 7.6-20.7%
EE: 37.8-62.2%
[128]
Theophylline
/ HPO PGSS
Mixing T: 60 oC
Mixing P: 120-180 bar
Pre-expansion T: 86 oC
Fc: 0.18-1.25 g min−1
PS: 2.5-3.0 たm
DL: 0.5 -3.5% [129]
く-carotene/
soybean
lecithin
PGSS-
drying
Cc: 55 -72 g/L
Operating T: 100-130 oC
Operating P: 80-100 bar
Fc / Fs: 21- 37 g/g
PS: 10-500 たm
Rehydration PS: 1-5 たm EE: 29-60%
[130]
Quercetin/
Pluronic
F127
SAS
Cd: 0.01-0.02 g/mL
Cd /Cc: 2:1-1:9
Solvent: acetone
DL: 35-56%
The PS and morphology
are conferred
[113]
Naproxen/
Eudragit or
PLLA
SAS
P: 100-200 bar
T: 40-50 oC
Content of PEG: 0-5%
Cd: 5-8 mg/mL
Cd /Cc: 1:1-1:5
Naproxen/Eudragit
PS: 0.56-1.43たm
DL: 3.0-13.2%
Naproxen/ PLLA
PS: 0.08-0.31 たm
DL: 4.5-25.6%
[131]
Morphine/
PLLA-PEG-
PLLA
SEDS
P: 80-140 bar, T: 35 oC
Content of PEG: 0-5%
Cd: 4-12 mg/mL
Cd /Cc: 1:5-1:10
PS: 2.04-5.73たm
DL: 8.3-17.9%
EE: 51.8-79.0%
[132]
Curcumin/
PLGA SAS-EM
P: 80-100 bar, T: 23-38 oC
Fs: 1.0-2.5 mL/min
Power: 100-180 W
Solvent: Acetone, Acetone +
EtOH, EthylAcetate + EtOH
PS: 40-1680 nm
DL: 4-38%
PS and DL can be
enhanced by increasing
ultrasound power
[133]

40
Figures
Particular drug delivery
Administration methods
Drug release behavior Targeting
Thermo-dynamics
Operating parameters Fluid
dynamics
Particle microstructures: morphology, PS, PSD, crystal form, DL, EE, etc.
ScCO2 processes
Tai
lori
ng“Inverse ”
strategies
Particular drug deliveryParticular drug delivery
Administration methods
Administration methods
Drug release behavior
Drug release behavior TargetingTargeting
Thermo-dynamicsThermo-dynamics
Operating parametersOperating parameters Fluid
dynamics
Fluid
dynamics
Particle microstructures: morphology, PS, PSD, crystal form, DL, EE, etc.
ScCO2 processesScCO2 processes
Tai
lori
ng“Inverse ”
strategies
Fig. 1. An overall view of SCF PD for particular drug delivery.

41
Fig. 2. Drug release mechanisms from a polymeric material [25].
Fig. 3. Requirements of particle uptake on surface properties [38].

42
Particle microstructures
Pressure, TemperatureOrganic Solvent
Supersaturation: nucleation and crystal growth
Fluid dynamicsThermodynamics
Solute solubility Process paths
Fluid diffusion ability
Flow rateNozzle design
Jet hydro-dynamics
Fig. 4. Influencing mechanism of operating parameters on particle microstructures
A B
Fig. 5 P-T-w space diagram of PLA-PEG-PLA in (A) CO2 + DCM system and (B)
CO2 + DCM + C2H5OH system [65].

43
Fig. 6. Typical phase diagram for an asymmetric binary mixture consisting of a solid
(component 2) and CO2 (component 1) at high P [70].
Solid
Solvent ScCO2
SAS
RE
SS
/PG
SS
L+S
V+S
LV+L
V
V+L+S
Solid
Solvent ScCO2
SAS
RE
SS
/PG
SS
L+S
V+S
LV+L
V
V+L+S
Fig. 7. A simple representative phase diagram of the ternary solid-solvent-scCO2
systems at constant T and P.

44
Fig. 8. A schematic of the RESS expansion device [77].
31 2 31 2
Fig. 9. Scattering phenomena related to SAS jet mixing [84].

45
API Carrier material
Micronization
Nano/ microspheres
Nano/ microcrystal
SCF PD
Co-precipitation/ encapsulation
Matrix structure Encapsulated structure
Sustained release systems Targeted delivery systems
Magnetite particles
Targeting ligand
API Carrier material
Micronization
Nano/ microspheres
Nano/ microcrystal
SCF PD
Co-precipitation/ encapsulation
Matrix structure Encapsulated structure
Sustained release systems Targeted delivery systems
Magnetite particles
Targeting ligand
Fig. 10.The typical SCF PD processes for particular drug delivery
10 20 30 40 500
2000
4000
6000
8000
10000
Inte
nsity
2-Theta Scale
10 20 30 40 500
2000
4000
6000
8000
10000
Inte
nsity
2-Theta Scale
10 20 30 40 500
2000
4000
6000
8000
10000
Inte
nsity
2-Theta Scale10 20 30 40 50
0
2000
4000
6000
8000
10000
Inte
nsity
2-Theta Scale
10 20 30 40 500
2000
4000
6000
8000
2-Theta Scale
10000
Inte
nsity
10 20 30 40 500
2000
4000
6000
8000
2-Theta Scale
10000
Inte
nsity
Raw HCPT, FormI
SCF PD
FormII FormIII
10 20 30 40 500
2000
4000
6000
8000
10000
Inte
nsity
2-Theta Scale
10 20 30 40 500
2000
4000
6000
8000
10000
Inte
nsity
2-Theta Scale
10 20 30 40 500
2000
4000
6000
8000
10000
Inte
nsity
2-Theta Scale10 20 30 40 50
0
2000
4000
6000
8000
10000
Inte
nsity
2-Theta Scale
10 20 30 40 500
2000
4000
6000
8000
2-Theta Scale
10000
Inte
nsity
10 20 30 40 500
2000
4000
6000
8000
2-Theta Scale
10000
Inte
nsity
Raw HCPT, FormI
SCF PD
FormII FormIII
Fig. 11. SEM and XRD of unprocessed and SAS processed HCPT [104].

46
Fig. 12. SEM images of g-chymotryps in particulate samples prepared from different
phase regions [115].
Fig. 13. Schematic representation of obtained spherical or clavate HCPT-PL under
different drug loading.