Tailoring Native Defects in LiFePO : Insights from First...
11
Published: May 16, 2011 r2011 American Chemical Society 3003 dx.doi.org/10.1021/cm200725j | Chem. Mater. 2011, 23, 3003–3013 ARTICLE pubs.acs.org/cm Tailoring Native Defects in LiFePO 4 : Insights from First-Principles Calculations Khang Hoang †,‡ and Michelle Johannes* ,† † Center for Computational Materials Science, Naval Research Laboratory, Washington, DC 20375, United States ‡ School of Physics, Astronomy, and Computational Sciences, George Mason University, Fairfax, Virginia 22030, United States ’ INTRODUCTION Olivine-type LiFePO 4 is a promising candidate for recharge- able Li-ion battery electrodes. 1 The material is known for its structural and chemical stabilities, high intercalation voltage (about 3.5 V relative to lithium metal), high theoretical discharge capacity (170 mAh/g), environmental friendliness, and poten- tially low costs. 2,3 The major drawback of LiFePO 4 is poor ionic and electronic conduction (with an electrical conductivity of about 10 9 S/cm at 298 K) 4 that limits its applicability to devices. While the conduction can be improved by, for example, making LiFePO 4 nanoparticles and coating with conductive carbon, 5,6 the high processing cost associated with the manufacturing of carbon-coated LiFePO 4 nanoparticles may make it less compe- titive than other materials. Another approach is to dope LiFePO 4 with aliovalent impurities (Mg, Ti, Zr, Nb), which was reported to have enhanced the conductivity by 8 orders of magnitude. 7 The role of these dopants in the conductivity enhancement, however, remains controversial. 8,9 A better understanding of aliovalent doping, and also better solutions for improving the performance, first requires a deeper understanding of the funda- mental properties, especially those associated with native defects, which is currently not available. First-principles density-func- tional theory (DFT) studies of native point defects and defect complexes in LiFePO 4 can help address these issues. It is now generally accepted that LiFePO 4 is an insulating, large band gap material in which electronic conduction proceeds via hopping of small hole polarons. 1013 These polarons may be coupled to other defects such as lithium vacancies. 11,12 Iron antisites (Fe Li ) have also been reported to be present in LiFePO 4 samples. 1419 This native defect is believed to be responsible for the loss of electrochemical activity in LiFePO 4 due to the blockage of lithium channels caused by its low mobility. 18,19 Clearly, native defects have strong effects on the material’s performance. Experimental reports on the defects have, however, painted different pictures. Some authors reported evidence of some iron and lithium atoms exchanging sites and forming the antisite pair Fe Li Li Fe , 17,19 while others determined that Fe Li is formed in association with lithium vacancies (V Li ). 15,18 These conflicting reports suggest that the results may be sensitive to the actual synthesis conditions and indicate that a better under- standing of the formation of native defects in LiFePO 4 is needed to produce samples with controlled defect concentrations. Computational studies of native defects in LiFePO 4 and related compounds have been reported by several research groups. 11,2024 Notably, Maxisch et al. studied the migration of small hole polarons in LiFePO 4 using first-principles calculations where the polarons were created both in the absence and in the presence of lithium vacancies. 11 The first systematic study of native defects in LiFePO 4 was, however, carried out by Islam et al. using interatomic-potential simulations where they found the antisite pair Fe Li Li Fe to be energetically most favorable. 21,22 On the basis of results of first-principles calculations, Malik et al. recently came to a similar conclusion about the antisite pair. 24 Although these studies have provided valuable information on Received: March 11, 2011 Revised: April 21, 2011 ABSTRACT: We report first-principles density-functional theory studies of native point defects and defect complexes in olivine-type LiFePO 4 , a promising candidate for rechargeable Li-ion battery electrodes. The defects are characterized by their formation energies, which are calculated within the GGAþU framework. We find that native point defects are charged, and each defect is stable in one charge state only. Removing electrons from the stable defects always generates defect complexes containing small hole polarons. Defect formation energies, hence concentrations, and defect energy landscapes are all sensitive to the choice of atomic chemical potentials, which represent experimental conditions. One can, therefore, suppress or enhance certain native defects in LiFePO 4 via tuning the synthesis conditions. On the basis of our results, we provide insights on how to obtain samples in experiments with tailored defect concentrations for targeted applications. We also discuss the mechanisms for ionic and electronic conduction in LiFePO 4 and suggest strategies for enhancing the electrical conductivity. KEYWORDS: lithium iron phosphate, defects, first-principles, polaron, ionic conduction
Transcript of Tailoring Native Defects in LiFePO : Insights from First...

Published: May 16, 2011
r 2011 American Chemical Society 3003 dx.doi.org/10.1021/cm200725j |Chem. Mater. 2011, 23, 3003–3013
ARTICLE
pubs.acs.org/cm
Tailoring Native Defects in LiFePO4: Insights fromFirst-Principles CalculationsKhang Hoang†,‡ and Michelle Johannes*,†
†Center for Computational Materials Science, Naval Research Laboratory, Washington, DC 20375, United States‡School of Physics, Astronomy, and Computational Sciences, George Mason University, Fairfax, Virginia 22030, United States
’ INTRODUCTION
Olivine-type LiFePO4 is a promising candidate for recharge-able Li-ion battery electrodes.1 The material is known for itsstructural and chemical stabilities, high intercalation voltage(about 3.5 V relative to lithiummetal), high theoretical dischargecapacity (170 mAh/g), environmental friendliness, and poten-tially low costs.2,3 The major drawback of LiFePO4 is poor ionicand electronic conduction (with an electrical conductivity ofabout 10�9 S/cm at 298 K)4 that limits its applicability to devices.While the conduction can be improved by, for example, makingLiFePO4 nanoparticles and coating with conductive carbon,5,6
the high processing cost associated with the manufacturing ofcarbon-coated LiFePO4 nanoparticles may make it less compe-titive than other materials. Another approach is to dope LiFePO4
with aliovalent impurities (Mg, Ti, Zr, Nb), which was reportedto have enhanced the conductivity by 8 orders of magnitude.7
The role of these dopants in the conductivity enhancement,however, remains controversial.8,9 A better understanding ofaliovalent doping, and also better solutions for improving theperformance, first requires a deeper understanding of the funda-mental properties, especially those associated with native defects,which is currently not available. First-principles density-func-tional theory (DFT) studies of native point defects and defectcomplexes in LiFePO4 can help address these issues.
It is now generally accepted that LiFePO4 is an insulating,large band gap material in which electronic conduction proceedsvia hopping of small hole polarons.10�13 These polarons may becoupled to other defects such as lithium vacancies.11,12 Ironantisites (FeLi) have also been reported to be present in LiFePO4
samples.14�19 This native defect is believed to be responsible forthe loss of electrochemical activity in LiFePO4 due to theblockage of lithium channels caused by its low mobility.18,19
Clearly, native defects have strong effects on the material’sperformance. Experimental reports on the defects have, however,painted different pictures. Some authors reported evidence ofsome iron and lithium atoms exchanging sites and forming theantisite pair FeLi�LiFe,
17,19 while others determined that FeLi isformed in association with lithium vacancies (VLi).
15,18 Theseconflicting reports suggest that the results may be sensitive to theactual synthesis conditions and indicate that a better under-standing of the formation of native defects in LiFePO4 is neededto produce samples with controlled defect concentrations.
Computational studies of native defects in LiFePO4 andrelated compounds have been reported by several researchgroups.11,20�24 Notably, Maxisch et al. studied the migration ofsmall hole polarons in LiFePO4 using first-principles calculationswhere the polarons were created both in the absence and in thepresence of lithium vacancies.11 The first systematic study ofnative defects in LiFePO4 was, however, carried out by Islamet al. using interatomic-potential simulations where they foundthe antisite pair FeLi�LiFe to be energetically most favorable.21,22
On the basis of results of first-principles calculations, Malik et al.recently came to a similar conclusion about the antisite pair.24
Although these studies have provided valuable information on
Received: March 11, 2011Revised: April 21, 2011
ABSTRACT: We report first-principles density-functional theory studies of nativepoint defects and defect complexes in olivine-type LiFePO4, a promising candidate forrechargeable Li-ion battery electrodes. The defects are characterized by their formationenergies, which are calculated within the GGAþU framework. We find that nativepoint defects are charged, and each defect is stable in one charge state only. Removingelectrons from the stable defects always generates defect complexes containing smallhole polarons. Defect formation energies, hence concentrations, and defect energylandscapes are all sensitive to the choice of atomic chemical potentials, which representexperimental conditions. One can, therefore, suppress or enhance certain native defectsin LiFePO4 via tuning the synthesis conditions. On the basis of our results, we provideinsights on how to obtain samples in experiments with tailored defect concentrationsfor targeted applications. We also discuss the mechanisms for ionic and electronicconduction in LiFePO4 and suggest strategies for enhancing the electrical conductivity.
KEYWORDS: lithium iron phosphate, defects, first-principles, polaron, ionic conduction

3004 dx.doi.org/10.1021/cm200725j |Chem. Mater. 2011, 23, 3003–3013
Chemistry of Materials ARTICLE
the native defects in LiFePO4, they have three major limita-tions. First, studies that make use of interatomic potentialsmay not well describe all of the defects in LiFePO4. Second,these studies seem to have focused on neutral defect com-plexes and did not explicitly report the structure and ener-getics of native point defects as individuals. Third, and mostimportantly, none of these previous studies have thoroughlyinvestigated the dependence of defect formation energiesand hence defect concentrations on the atomic chemicalpotentials, which represent experimental conditions duringsynthesis.
We herein report our first-principles studies of the structure,energetics, and migration of native point defects and defectcomplexes in LiFePO4. We find that defect formation is sensitiveto the synthesis conditions. Native defects can occur in thematerial with high concentrations and therefore are expected tohave important implications for ionic and electronic conduction.We will show how conflicting experimental data on the nativedefects can be reconciled under our results and provide generalguidelines for producing samples with tailored defect concentra-tions. Comparison with previous theoretical works will be madewhere appropriate. In the following, we provide technical detailsof the calculations and present the theoretical approach. Next, wediscuss the structural and electronic properties of LiFePO4,which form the basis for our discussion of the formation ofnative defects in the material. We then present results of the first-principles calculations for native point defects and defect com-plexes, focusing on their formation energies and migration barriers,and discuss the dependence of defect formation energies on theatomic chemical potentials. On the basis of our results, we discussthe implications of native defects on ionic and electronic con-duction and suggest strategies for enhancing the electricalconductivity. Finally, we end this Article with some importantconclusions.
’METHODOLOGY
Computational Details. Our calculations were based on density-functional theory within the GGAþU framework,25�27 which is anextension of the generalized-gradient approximation (GGA),28 and theprojector augmented wave method,29,30 as implemented in the VASPcode.31�33 In this work, we used U = 5.30 eV and J = 1.00 eV for iron inall of the calculations (except otherwise noted), that is, the effectiveinteraction parameter U�J = 4.30 eV (hereafter U�J will be referred toasU for simplicity). This value ofU is the averaged value based on thoseZhou et al. calculated self-consistently for iron in LiFePO4 (i.e., Fe
2þ:U = 3.71 eV) and in FePO4 (i.e., Fe
3þ: U = 5.90 eV), which has beenshown to correctly reproduce the experimental intercalation potential ofLiFePO4.
34 It is known that the results obtained withinGGAþU dependon the value of U. However, we have checked the U dependence in ourcalculations and find that the physics of what we are presenting isinsensitive to the U value for 3.71 eV e U e 5.90 eV.
Calculations for bulk olivine-type LiFePO4 (orthorhombic Pnma; 28atoms/unit cell) were performed using a 4� 7� 9 Monkhorst-Pack k-point mesh.35 For defect calculations, we used a (1 � 2 � 2) supercell,which corresponds to 112 atoms/cell, and a 2 � 2 � 2 k-point mesh.The plane-wave basis-set cutoff was set to 400 eV. Convergence withrespect to self-consistent iterations was assumed when the total energydifference between cycles was less than 10�4 eV and the residual forceswere less than 0.01 eV/Å. In the defect calculations, the lattice param-eters were fixed to the calculated bulk values, but all of the internalcoordinates were fully relaxed. Themigration of selected defects in LiFePO4
was studied using the climbing-image nudged elastic-band method
(NEB).36 All calculations were performed with spin polarization, and,unless otherwise noted, the antiferromagnetic spin configuration ofLiFePO4 was used.
37
Defect Formation Energies. Throughout this Article, we employdefect formation energies to characterize different native point defectsand defect complexes in LiFePO4. The formation energy of a defect is acrucial factor in determining its concentration. In thermal equilibrium,the concentration of the defect X at temperature T can be obtained viathe relation:38,39
cðXÞ ¼ NsitesNconfig exp½ � Ef ðXÞ=kBT� ð1Þ
where Nsites is the number of high-symmetry sites in the lattice perunit volume on which the defect can be incorporated, and Nconfig isthe number of equivalent configurations (per site). Note that theenergy in eq 1 is, in principle, a free energy; however, the entropy andvolume terms are often neglected because they are negligible atrelevant experimental conditions.39 It emerges from eq 1 that defectswith low formation energies will easily form and occur in highconcentrations.
The formation energy of a defect X in charge state q is defined as38
Ef ðXqÞ ¼ EtotðXqÞ � EtotðbulkÞ � ∑iniμi þ qðEv þΔV þ εFÞ ð2Þ
where Etot(Xq) and Etot(bulk) are, respectively, the total energies of a
supercell containing the defect X and of a supercell of the perfect bulkmaterial; μi is the atomic chemical potential of species i (and isreferenced to the standard state), and ni denotes the number of atomsof species i that have been added (ni > 0) or removed (ni < 0) to form thedefect. εF is the electron chemical potential, that is, the Fermi level,referenced to the valence-band maximum in the bulk (Ev). ΔV is the“potential alignment” term, that is, the shift in the band positions due tothe presence of the charged defect and the neutralizing background,obtained by aligning the average electrostatic potential in regions faraway from the defect to the bulk value.38 Note that we denote defect X incharge state q as Xq. For example, FeLi
þ indicates that defect FeLi occurswith charge q = þ1, which is equivalent to FeLi
• in the Kr€oger�Vinknotation. For a brief discussion on the use of notations, see, for example,ref 40.Chemical Potentials. The atomic chemical potentials μi are
variables and can be chosen to represent experimental conditions. μican, in principle, be related to temperatures and pressures via standardthermodynamic expressions. The chemical potential for O2 in oxygengas, for example, is given by41
μO2ðT, pÞ ¼ μO2
ðT, poÞ þ kT lnppo
ð3Þ
where p and p� are, respectively, the partial pressure and reference partialpressure of oxygen; k is Boltzmann’s constant. This expression allowsus to calculate μO2
(T,p) if we know the temperature dependence ofμO2
(T,p�) at a particular pressure p�. In this work, we choose thereference state of μO2
(T,p) to be the total energy of an isolated O2
molecule (EO2
tot).42
The value of μi is subject to various thermodynamic limits. ForLiFePO4, the stability condition requires that
μLi þ μFe þ μP þ 2μO2¼ ΔHf ðLiFePO4Þ ð4Þ
where ΔHf is the formation enthalpy. This condition places a lowerbound on the value of μi. Additionally, one needs to avoid precipitatingbulk Li, Fe, and P, or forming O2 gas. This sets an upper bound on thechemical potentials: μi e 0.38 There are, however, further constraints

3005 dx.doi.org/10.1021/cm200725j |Chem. Mater. 2011, 23, 3003–3013
Chemistry of Materials ARTICLE
imposed by other competing Li�Fe�P�O2 phases, which usually placestronger bounds on μi. For example, to avoid the formation of Li3PO4:
3μLi þ μP þ 2μO2e ΔHf ðLi3PO4Þ ð5Þ
After taking into account the constraints imposed by all possiblecompeting phases, one can define the chemical-potential range of Li, Fe,and O2 that stabilizes LiFePO4, which is, in fact, bound in a polyhedronin the three-dimensional (μLi, μFe, μO2
) space. For a given point in thepolyhedron, one can determine the remaining variable μP via eq 4. In thiswork, the formation enthalpies of all different Li�Fe�P�O2 phases aretaken from Ong et al.41 who have computed the energies using amethodology similar to ours. For example, the calculated formationenthalpy of LiFePO4 at T = 0 K (with respect to its constituents)is �18.853 eV per formula unit (f.u.),41 almost identical to that(of �18.882 eV/f.u.) obtained in our calculations. Ong et al. have alsocalculated the phase diagrams of the quaternary Li�Fe�P�O2 systemat 0 K that involve all possible phases between Li, Fe, P, and O2. Thesephase diagrams show LiFePO4 is stable over a range of the oxygenchemical-potential values, from �11.52 eV (where the first Fe2þ-containing phase appears) to�8.25 eV (the last of the Fe2þ-containingphosphates being reduced).41 This corresponds to μO2
ranging from�3.03 to �8.25 eV with respect to our chosen reference (EO2
tot).Figure 1 shows the slice of the (μLi, μFe, μO2
) polyhedron in theμO2
= �4.59 eV plane, constructed with the calculated formationenthalpies (taken from ref 41) for different Li�Fe�P�O2 phases.The shaded area (marked by points A, B, C, D, and E) shows the rangeof μLi and μFe values where LiFePO4 is stable. Point A, for example,corresponds to equilibrium of LiFePO4 with Fe2O3 and Fe3(PO4)2. Atthis point in the chemical-potential diagram, the system is close toforming Fe-containing secondary phases (i.e., Fe2O3 and Fe3(PO4)2)and far from forming Li-containing secondary phases. This can beconsidered as representing a “Li-deficient” environment. Similarly, pointD can be considered as representing a “Li-excess” environment, wherethe system is close to forming Li-containing secondary phases (i.e.,Li4P2O7 and Li3PO4). Note that “Li-deficient” and “Li-excess” environ-ments in this sense do not necessarily mean that μLi in the latter is higherthan in the former, as seen in Figure 1. Reasonable choices of the atomicchemical potentials should be those that ensure the stability of the hostcompound. In the next sections, we will present our calculated formationenergies for various native defects in LiFePO4 and discuss how thesedefects are formed under different experimental conditions.
Defect Complexes. Native point defects in LiFePO4 may not stayisolated but could instead agglomerate and form defect complexes. For acomplex XY consisting of X and Y, its binding energy Eb can becalculated using the formation energy of the complex and those of itsconstituents:38
Eb ¼ Ef ðXÞ þ Ef ðYÞ � Ef ðXYÞ ð6Þ
where the relation is defined such that a positive binding energycorresponds to a stable, bound defect complex. Having a positivebinding energy, however, does not mean that the complex will readilyform. For example, under thermal equilibrium, the binding energy Ebneeds to be greater than the larger of Ef(X) and Ef(Y) for the complex tohave higher concentration than its constituents.38 For further discus-sions on the formation of defect complexes, see, for example, ref 38.
’BULK PROPERTIES
Before presenting our results for native defects in LiFePO4, letus discuss some basic properties of the pristine compound.Olivine-type LiFePO4 was reported to crystallize in the orthor-hombic space group Pnma with a = 10.3377(5), b = 6.0112(2),and c = 4.6950(2) Å.37 The compound can be regarded as anordered arrangement of Liþ, Fe2þ, and (PO4)
3� units. Liþ formsLi channels along the b-axis, whereas Fe2þ stays at the center of aslightly distorted FeO6 octahedron (interwoven with PO4 tetra-hedra). This simple bonding picture will be very useful wheninterpreting the structure and energetics of native defects inLiFePO4. The calculated lattice parameters are a = 10.461, b =6.061, and c = 4.752 Å, in satisfactory agreement with theexperimental values. The calculated values are slightly largerthan the experimental ones as expected because it is well-knownthat GGA tends to overestimate the lattice parameters. Thecalculatedmagnetic moment for iron (Fe2þ) in LiFePO4 is 3.76 μB,comparable to the experimental value of 4.19(5) μB at 2 K.
37
Figure 2 shows the total electronic density of states of LiFe-PO4 in antiferromagnetic (AFM) and ferromagnetic (FM) spinconfigurations. An analysis of the wave functions shows that, inboth configurations, the valence-band maximum (VBM) andconduction-band minimum (CBM) are Fe 3d states. Betweenthe highly localized Fe d states just below the Fermi level(at 0 eV) and the lower valence band (which consists predomi-nantly of O 2p and Fe 3d states), there is an energy gap of about0.40 eV (AFM). The Li 2s state is high up in the conductionband, suggesting that Li donates its electron to the lattice andbecomes Liþ. There is strong mixing between P 3p and O 2pstates, indicating covalent bonding within the (PO4)
3� unit. The
Figure 1. Chemical-potential diagram for LiFePO4 at μO2=�4.59 eV.
The μO2axis extends out of the page. Only phases that can be in
equilibrium with LiFePO4 are included, and the lines delineating thesephases define the stability region of LiFePO4, here shown as a shadedpolygon.
Figure 2. Electronic density of states (DOS) of LiFePO4 in (a)antiferromagnetic (AFM) and (b) ferromagnetic (FM) spin configura-tions. The zero of the energy is set to the highest occupied state.
3006 dx.doi.org/10.1021/cm200725j |Chem. Mater. 2011, 23, 3003–3013
Chemistry of Materials ARTICLE
calculated band gap is 3.62 and 3.58 eV for AFM and FM spinconfigurations, respectively, in agreement with the previouslyreported value (of 3.7 eV).10 Experimentally, LiFePO4 has beenreported to have a band gap of about 3.8�4.0 eV, obtained fromdiffuse reflectance measurements.10,13 The compound is there-fore an insulating, large band gap material.
In the GGAþU framework, the electronic structure candepend on the U value. Indeed, we find that the calculated bandgap of LiFePO4 is 3.20 and 4.00 eV in the AFM spin configura-tion for U = 3.71 and 5.90 eV, respectively, as compared to3.62 eV obtained in calculations using U = 4.30 eV mentionedearlier. The energy gap between the highest valence band (Fe 3dstates) and the lower valence band (predominantly O 2p and Fe3d states) is also larger for smaller U values: 0.58 and 0.20 eV forU = 3.71 and 5.90 eV, respectively. However, our GGAþUcalculations show that the electronic structure near the band gapregion is not sensitive to the choice of U value, forU lying withinthe range from 3.71 to 5.90 eV. As we illustrate in the nextsection, knowing the structural and electronic properties, espe-cially the nature of the electronic states near the VBM and CBM,is essential in understanding the formation of native defects inLiFePO4.
’FORMATION OF NATIVE DEFECTS
In insulating, large band gap materials such as LiFePO4, nativepoint defects are expected to exist in charged states other thanneutral, and charge neutrality requires that defects with oppositecharge states coexist in equal concentrations.43�45 We thereforeinvestigated various native defects in LiFePO4 in all possiblecharge states. These defects include hole polarons (hereafterdenoted as pþ), lithium vacancies (VLi) and interstitials (Lii),iron antisites (FeLi), lithium antisites (LiFe), iron vacancies (VFe),and PO4 vacancies (VPO4
). We also considered defect complexesthat consist of certain point defects such as FeLi�VLi (a complexof FeLi and VLi), FeLi�LiFe (a complex of FeLi and LiFe), and2FeLi�VFe (a complex of two FeLi and one VFe).
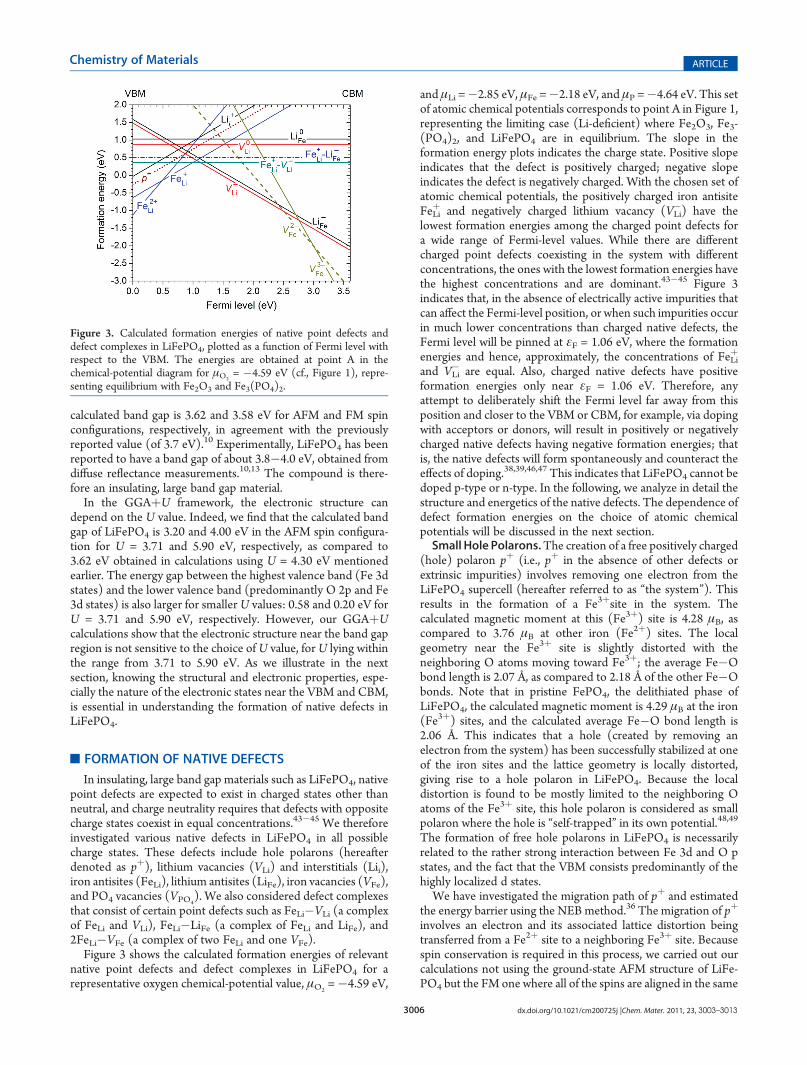
Figure 3 shows the calculated formation energies of relevantnative point defects and defect complexes in LiFePO4 for arepresentative oxygen chemical-potential value, μO2
=�4.59 eV,
and μLi =�2.85 eV, μFe =�2.18 eV, and μP =�4.64 eV. This setof atomic chemical potentials corresponds to point A in Figure 1,representing the limiting case (Li-deficient) where Fe2O3, Fe3-(PO4)2, and LiFePO4 are in equilibrium. The slope in theformation energy plots indicates the charge state. Positive slopeindicates that the defect is positively charged; negative slopeindicates the defect is negatively charged. With the chosen set ofatomic chemical potentials, the positively charged iron antisiteFeLi
þ and negatively charged lithium vacancy (VLi�) have the
lowest formation energies among the charged point defects fora wide range of Fermi-level values. While there are differentcharged point defects coexisting in the system with differentconcentrations, the ones with the lowest formation energies havethe highest concentrations and are dominant.43�45 Figure 3indicates that, in the absence of electrically active impurities thatcan affect the Fermi-level position, or when such impurities occurin much lower concentrations than charged native defects, theFermi level will be pinned at εF = 1.06 eV, where the formationenergies and hence, approximately, the concentrations of FeLi
þ
and VLi� are equal. Also, charged native defects have positive
formation energies only near εF = 1.06 eV. Therefore, anyattempt to deliberately shift the Fermi level far away from thisposition and closer to the VBM or CBM, for example, via dopingwith acceptors or donors, will result in positively or negativelycharged native defects having negative formation energies; thatis, the native defects will form spontaneously and counteract theeffects of doping.38,39,46,47 This indicates that LiFePO4 cannot bedoped p-type or n-type. In the following, we analyze in detail thestructure and energetics of the native defects. The dependence ofdefect formation energies on the choice of atomic chemicalpotentials will be discussed in the next section.Small Hole Polarons.The creation of a free positively charged
(hole) polaron pþ (i.e., pþ in the absence of other defects orextrinsic impurities) involves removing one electron from theLiFePO4 supercell (hereafter referred to as “the system”). Thisresults in the formation of a Fe3þsite in the system. Thecalculated magnetic moment at this (Fe3þ) site is 4.28 μB, ascompared to 3.76 μB at other iron (Fe2þ) sites. The localgeometry near the Fe3þ site is slightly distorted with theneighboring O atoms moving toward Fe3þ; the average Fe�Obond length is 2.07 Å, as compared to 2.18 Å of the other Fe�Obonds. Note that in pristine FePO4, the delithiated phase ofLiFePO4, the calculated magnetic moment is 4.29 μB at the iron(Fe3þ) sites, and the calculated average Fe�O bond length is2.06 Å. This indicates that a hole (created by removing anelectron from the system) has been successfully stabilized at oneof the iron sites and the lattice geometry is locally distorted,giving rise to a hole polaron in LiFePO4. Because the localdistortion is found to be mostly limited to the neighboring Oatoms of the Fe3þ site, this hole polaron is considered as smallpolaron where the hole is “self-trapped” in its own potential.48,49
The formation of free hole polarons in LiFePO4 is necessarilyrelated to the rather strong interaction between Fe 3d and O pstates, and the fact that the VBM consists predominantly of thehighly localized d states.We have investigated the migration path of pþ and estimated
the energy barrier using the NEBmethod.36 The migration of pþ
involves an electron and its associated lattice distortion beingtransferred from a Fe2þ site to a neighboring Fe3þ site. Becausespin conservation is required in this process, we carried out ourcalculations not using the ground-state AFM structure of LiFe-PO4 but the FM one where all of the spins are aligned in the same
Figure 3. Calculated formation energies of native point defects anddefect complexes in LiFePO4, plotted as a function of Fermi level withrespect to the VBM. The energies are obtained at point A in thechemical-potential diagram for μO2
= �4.59 eV (cf., Figure 1), repre-senting equilibrium with Fe2O3 and Fe3(PO4)2.
3007 dx.doi.org/10.1021/cm200725j |Chem. Mater. 2011, 23, 3003–3013
Chemistry of Materials ARTICLE
direction. We calculated the migration path by sampling theatomic positions between ground-state configurations. For thoseconfigurations other than ground-state ones, the atomic posi-tions were kept fixed, and only electron density was relaxed self-consistently, similar to the method presented in ref 11. Themigration barrier is the energy difference between the highest-energy configuration and the ground state. We find that themigration barrier of pþ is 0.25 eV between the two nearest Fesites approximately in the b�c plane, which is comparable to that(0.22 eV) reported in ref 11.Vacancies and Interstitials. Negatively charged lithium va-
cancies (VLi�) are created by removing a Liþ ion from the system.
Because, in LiFePO4, Li donates one electron to the lattice, oneexpects that the removal of Liþ causes only a small disturbance inthe system. Indeed, we see that lattice relaxations around the voidformed by the removed Liþ are negligible. The energy needed toform VLi
� should also be small, consistent with our results inFigure 3. VLi
0 , on the other hand, is created by removing a Li atom(i.e., Liþ and an electron) from the system. This leads to theformation of a void (at the site of the removed Liþ) and an Fe3þ
(formed by the removed electron) at the neighboring Fe site.Similar to the free hole polaron, the neighboring O atoms of theFe3þ site in VLi
0 also move toward Fe3þ, with the average Fe�Odistance being 2.07 Å. The calculated magnetic moment is 4.29μB at the Fe
3þ site, equal to that at the Fe3þ site in the case of afree polaron. VLi
0 , therefore, should be regarded as a complex ofVLi� and pþ, with the two defects being 3.26 Å apart. Figure 4a
shows the structure of VLi0 . The binding energy of VLi
0 is 0.34 eV(with respect toVLi
� and pþ). Note that this value is 0.42 eV in ourcalculations using (1� 3� 3) supercells, which have 252 atoms/cell. Our estimated binding energy is thus comparable to that of0.39 and about 0.50 eV reported by Fisher et al.22 and Maxischet al.,11 respectively. For lithium interstitials, the stable defect isLii
þ, created by adding Liþ into the system. Other charge states ofVLi and Lii are not included in Figure 3 because they either havetoo high energies to be relevant or are unstable.The migration path of VLi
� is calculated by moving a Liþ unitfrom a nearby lattice site into the vacancy. The energy barrier forVLi� is estimated to be 0.32 eV along the b-axis and 2.27 eV along
the c-axis. This suggests that, in the absence of other nativedefects and extrinsic impurities, lithium diffusion in LiFePO4 ishighly one-dimensional along the Li channels (b-axis) becausethe energy barrier to cross between the channels is too high. Themigration path of VLi
� is, however, not a straight line but a curvedpath along the b-axis. Our results are thus in general agreementwith previously reported theoretical studies20�23 and experimental
observation.50 The estimated energy barriers for the migration ofVLi� along the b and c axes are lower than those (0.55 and 2.89 eV,
respectively) reported by Islam et al.21 obtained from calcula-tions using interatomic potentials, but closer to those (0.27 andabout 2.50 eV) reported by Morgan et al.20 obtained in GGAcalculations with smaller supercells. For VLi
0 , a complex of pþ andVLi�, one can estimate the lower bound of the migration barrier by
taking the higher of the migration energies of the constituents,45
which is 0.32 eV (along the b-axis), the value for VLi�.
Other possible vacancies in LiFePO4 are those associated withFe2þ and (PO4)
3� units. The creation of VFe2� corresponds to
removing Fe2þ from the system. We find that this negativelycharged defect causes significant relaxations in the lattice geo-metry. The neighboring Liþ ions move toward the defect,resulting in the Li channels being bent near VFe
2� where Liþ ionsare displaced up to 0.27 Å from their original positions. VFe
� canbe considered as a complex of VFe
2� and pþ with the distancebetween the two defects being 3.81 Å. VFe
3�, on the other hand,corresponds to removing Fe2þ but leaving an electron in thesystem. This defect can be regarded as a complex of VFe
2� and anegatively charged (electron) polaron (hereafter denoted as p�).At the Fe site where the electron polaron resides, which is 7.68 Åfrom the vacancy, the calculatedmagnetic moment is 2.86 μB; theaverage Fe�O distance is 2.30 Å, which is larger than thatassociated with other Fe sites (2.18 Å). Finally, VPO4
is stable asVPO4
3þ as expected. This positively charged defect corresponds toremoving the whole (PO4)
3� unit from the system. With thechosen set of atomic chemical potentials, VFe
� and VPO4
3þ havevery high formation energies (2.33 and 3.56 eV, respectively, atεF = 1.06 eV) and are therefore not included in Figure 3.Antisite Defects. Lithium antisites LiFe are created by repla-
cing Fe at an Fe site with Li. LiFe� can be considered as replacing
Fe2þ with Liþ. Because of the Coulombic interaction, the twonearest Liþ ion neighbors of LiFe
� are pulled closer to thenegatively charged defect with the distance being 3.25 Å, ascompared to 3.32 Å of the equivalent bond in pristine LiFePO4.LiFe
0 , on the other hand, can be regarded as a complex of LiFe� and
pþ with the distance between the two defects being 3.98 Å. Thebinding energy of LiFe
0 (with respect to LiFe� and pþ) is
0.30 eV. Similarly, one can replace Li at an Li site with Fe, whichcreates an iron antisite FeLi. FeLi
þ corresponds to replacing LiþwithFe2þ, whereas FeLi
2þ can be regarded as a complex of FeLiþ and pþ.
For FeLi0 , which corresponds to replacing one Liþ with Fe2þ and
adding an extra electron to the system, the extra electron isstabilized at the substituting Fe atom, where the calculatedmagnetic moment is 2.95 μB. One might also regard FeLi
0 as a
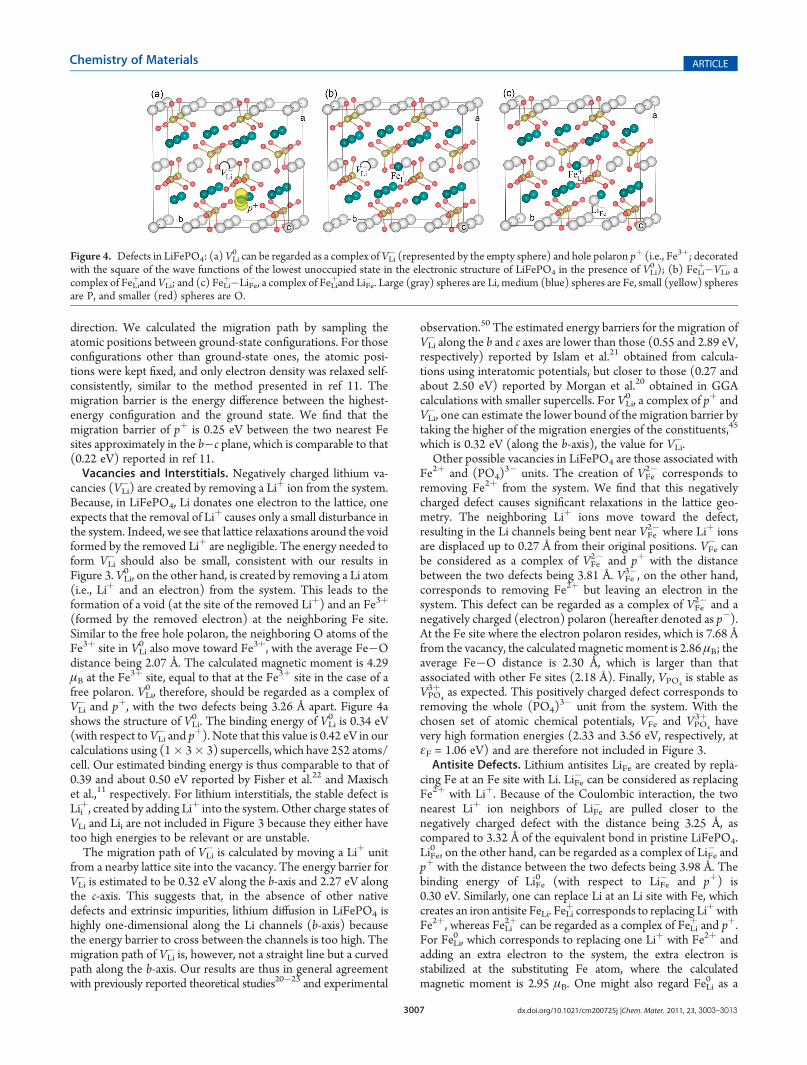
Figure 4. Defects in LiFePO4: (a)VLi0 can be regarded as a complex ofVLi
� (represented by the empty sphere) and hole polaron pþ (i.e., Fe3þ; decoratedwith the square of the wave functions of the lowest unoccupied state in the electronic structure of LiFePO4 in the presence of VLi
0 ); (b) FeLiþ�VLi
�, acomplex of FeLi
þandVLi�; and (c) FeLi
þ�LiFe� , a complex of FeLi
þand LiFe� . Large (gray) spheres are Li, medium (blue) spheres are Fe, small (yellow) spheres
are P, and smaller (red) spheres are O.

3008 dx.doi.org/10.1021/cm200725j |Chem. Mater. 2011, 23, 3003–3013
Chemistry of Materials ARTICLE
complex of FeLiþ and p�, but in this case the two defects stay at the
same lattice site. With the chosen set of chemical potentials, FeLi0
has a very high formation energy (2.04 eV) and is therefore notincluded in Figure 3. Again, other native defects that are notincluded here are unstable or have too high formation energies tobe relevant.Defect Complexes. From the above analyses, it is clear that
defects such as pþ(p�), VLi�, VFe
2�, FeLiþ, LiFe
� , and VPO4
3þ can beconsidered as elementary native defects in LiFePO4; that is,the structure and energetics of other native defects can beinterpreted in terms of these basic building blocks. This is similarto what has been observed in complex hydrides.45 All of theseelementary defects (except the free polarons) are, in fact, pointdefects that are formed by adding and/or removing only Liþ,Fe2þ, and (PO4)
3� units. They have low formation energies(cf., Figure 3) because the addition/removal of these units causesthe least disturbance to the system, which is consistent with thesimple bonding picture for LiFePO4 presented in the previoussection. The identification of the elementary native defects,therefore, not only helps us gain a deeper understanding of thestructure and energetics of the defects in LiFePO4 but also hasimportant implications. For example, one should treat themigration of defects such as VLi
0 as that of a VLi� and pþ complex
with a finite binding energy, rather than as a single point defect.In addition to the defect complexes that involve pþ and p�
such as VLi0 , VFe
� , VFe3�, LiFe
0 , FeLi0 , and FeLi
2þ described above, wealso considered those consisting of VLi
�, FeLiþ, LiFe
� , and VFe2� such
as FeLiþ�LiFe
� , FeLiþ�VLi
�, and 2FeLiþ�VFe
2�. Figure 4b shows thestructure of FeLi
þ�VLi�. The distance between FeLi
þ and VLi� is
2.96 Å (along the b-axis), as compared to 3.03 Å between the twoLi sites in pristine LiFePO4. We find that this complex has aformation energy of 0.36�0.56 eV for reasonable choices ofatomic chemical potentials and a binding energy of 0.49 eV.Withsuch a relatively high binding energy, even higher than theformation energy of isolated FeLi
þ and VLi� (0.42 eV at εF =
1.06 eV, cf., Figure 3), FeLiþ�VLi
� is expected to occur with aconcentration larger than either of its constituents under thermalequilibrium conditions during synthesis.38 In FeLi
þ�VLi�, the
energy barrier for migrating FeLiþ to VLi
� is about 0.74 eV,comparable to that (0.70 eV) reported by Fisher et al.22 Thisvalue is twice as high as the migration barrier of VLi
�, indicatingFeLi
þ has low mobility.Figure 4c shows the structure of FeLi
þ�LiFe� . This antisite pair
has a formation energy of 0.51 eV. This value is independent ofthe choice of chemical potentials because the chemical potentialterm in the formation energy formula cancels out, cf., eq 2.FeLi
þ�LiFe� has a binding energy of 0.44 eV; the distance between
FeLiþ and LiFe
� is 3.45 Å, as compared to 3.32 Å between thelithium and iron sites. Finally, we find that 2FeLi
þ�VFe2� has a
formation energy of 1.47�1.67 eV for reasonable choices of theatomic chemical potentials, and a binding energy of 1.25 eV.With this high formation energy, the complex is unlikely to formin LiFePO4 and is therefore not included in Figure 3. Note thatthe formation energies of FeLi
þ�VLi� and 2FeLi
þ�VFe2� have the
same dependence on the atomic chemical potentials (bothcontain the term 2μLi � μFe) and, hence, the same dependenceon μO2. For any given set of chemical potentials, the formationenergy of 2FeLi
þ�VFe2� is higher than that of FeLi
þ�VLi� by 1.11 eV.
We also considered possible lithium and iron Frenkel pairs (i.e.,interstitial�vacancy pairs), but these pairs are unstable towardrecombination, probably because there is no energy barrier ortoo small of a barrier between the vacancy and the interstitial.
The above-mentioned neutral defect complexes have also beenstudied by other research groups using either interatomic-potential simulations21,22 or first-principles DFT calculations.24
Islam et al. found that FeLiþ�LiFe
� has a formation energy of0.74 eV (or 1.13 eV if the two defects in the pair are considered asisolated defects) and a binding energy of 0.40 eV and isenergetically most favorable among possible native defects.21
The reported formation energy is, however, higher than ourcalculated value by 0.23 eV. This difference may be due to thedifferent methods used in the calculations. Fisher et al. reported aformation energy of 3.13 eV for FeLi
þ�VLi�,22 which is much
higher than our calculated value. Note, however, that Fisher et al.assumed the reaction FeO þ 2LiLi
0 f FeLiþ þ VLi
� þ Li2O for theformation of FeLi
þ�VLi�, which implies that LiFePO4 is in equi-
librium with FeO and Li2O. This scenario is unlikely to occur, asindicated in the Li�Fe�P�O2 phase diagrams calculated byOng et al.,41 where equilibrium between these phases has neverbeen observed. This may also be the reason that the formationenergy of VLi
0 reported by the same authors (4.41 eV)22 is muchhigher than our calculated values.On the basis of first-principles calculations, Malik et al.
reported a formation energy of 0.515�0.550 eV for the antisitepair FeLi
þ�LiFe� ,24which is very close to our calculated value (0.51 eV).
For 2FeLiþ�VFe
2�, the formation energy was reported to be about1.60�1.70 eV for μO2
ranging from �3.03 to �8.21 eV,24
which is also comparable to our results. Malik et al., however,obtained a much higher formation energy for FeLi
þ�VLi�, from
about 3.60 to 5.10 eV for the same range of μO2values.24 This
energy is much higher than that obtained in our calculations(0.36�0.56 eV). Although we have no explanation for thisdiscrepancy, we observe that the calculated formation energiesof 2FeLi
þ�VFe2� and FeLi
þ�VLi� in Malik et al.’s work have distinct
μO2-dependencies (see Figure S1 in the Supporting Information
of ref 24), instead of having the same dependence on μO2as we
discussed above, indicating their scheme of accounting for theatomic chemical potentials differs from the standard procedure.
’TAILORING DEFECT CONCENTRATIONS
It is important to note that the energy landscape presented inFigure 3 may change as one changes the atomic chemicalpotentials, that is, synthesis conditions. The calculated formationenergies are a function of four variables μLi, μFe, μP, and μO2,
which in turn depend on each other and vary within theestablished constraints. A change in one variable leads to changesin the other three. In the following discussions, we focus on two“knobs” that can be used to experimentally tailor the formationenergy and hence the concentration of different native defects inLiFePO4, and suppress or enhance certain defects for targetedapplications. One is μO2, which can be controlled by controllingtemperature and pressure and/or oxygen reducing agents. LowerμO2
values represent the so-called “more reducing environ-ments”, which are usually associated with higher temperaturesand/or lower oxygen partial pressures and/or the presence ofoxygen reducing agents, whereas higher μO2
values represent“less reducing environments”.41 The other is the degree oflithium off-stoichiometry with respect to LiFePO4 exhibitedthrough the tendency toward formation of Li-containing or Fe-containing secondary phases in the synthesis of LiFePO4. Asdiscussed previously, in the environments to which we refer as Li-excess (Li-deficient), the system is close to forming Li-containing(Fe-containing) secondary phases.

3009 dx.doi.org/10.1021/cm200725j |Chem. Mater. 2011, 23, 3003–3013
Chemistry of Materials ARTICLE
Varying the Atomic Chemical Potentials. Let us assume, forexample, Li-deficient environments and vary μO2
from �3.03(where LiFePO4 first starts to form) to�8.25 eV (where it ceasesto form).41 This amounts to choosing different cuts along the μO2
axis in Figure 1 to give different two-dimensional polygons ofLiFePO4 stability. Figure 5 shows the calculated formationenergies for μO2
= �3.03 eV, assuming equilibrium with Fe2O3
and Fe7(PO4)6 (i.e., Li-deficient), which gives rise to μLi =�3.41, μFe = �3.35, and μP = �6.03 eV. Figure 5 clearly showschanges in the energy landscape of the defects, as compared toFigure 3. The lowest energy point defects that determine theFermi-level position are now pþ andVLi
�. Near εF = 0.59 eVwherepþ and VLi
� have equal formation energies, VLi0 also has the
lowest energy. This indicates that, under high μO2and Li-
deficient environments, pþ and VLi� are the dominant native
point defects in LiFePO4 and are likely to exist in the form of theneutral complex VLi
0 . Note that, with the chosen set of atomicchemical potentials, LiFe
� also has a low formation energy, very
close to that of VLi�, indicating the presence of a relatively high
concentration of LiFe� . Similar to VLi
�, LiFe� can combine with pþ to
form LiFe0 . However, because LiFe
0 has a higher formation energyand a smaller binding energy than does VLi
0 , only a small portionof LiFe
� is expected to be stable in the form of LiFe0 under thermal
equilibrium conditions. Iron vacancies have the lowest energiesin a wide range of the Fermi-level values as expected, given thevery low iron chemical potential.Figure 6 shows the calculated formation energies for μO2
=�8.21 eV. The formation energies are obtained by assumingequilibrium with Fe2P and Fe3P (i.e., Li-deficient), which givesrise to μLi =�1.80, μFe =�0.24, and μP =�0.39 eV.We find thatFeLi
þ and LiFe� are now the dominant native point defects, pinning
the Fermi level at εF = 2.00 eV. The complex FeLiþ�LiFe
� has abinding energy of 0.44 eV, comparable to the formation energiesof FeLi
þ and LiFe� (which are both 0.48 eV at εF = 2.00 eV). This
suggests that FeLiþ and LiFe
� are likely to exist both in the form ofFeLi
þ�LiFe� , but also as isolated point defects. With this set of
atomic chemical potentials, we find that VPO4
3þ has the lowestformation energy near the VBM, and FeLi
0 has a formation energyof 1.15 eV that, while very high, is lower than VLi
0 (1.93 eV) andLiFe
0 (1.98 eV), which were found to have lower formationenergies under different conditions (cf., Figures 3 and 5).We also investigated the dependence of defect formation
energies on μLi (and μFe), that is, Li-deficiency versus Li-excess,for a givenμO2
value. For μO2=�4.59 eV; for example, the results
obtained at points B and C in Figure 1 show energy landscapesthat are similar to that at point A (Li-deficient), as FeLi
þ andVLi� are
the dominant native point defects in LiFePO4 and likely to existin the form of FeLi
þ�VLi�. At point D, where LiFePO4 is in
equilibrium with Li4P2O7 and Li3PO4 (Li-excess), we findinstead that FeLi
þ and LiFe� are energetically most favorable and
are likely to exist as FeLiþ�LiFe
� . The calculated formation energyof pþ is only slightly higher than that of FeLi
þ, indicating acoexisting high concentration of pþ. The hole polarons in thiscase are expected to exist as isolated defects under thermalequilibrium because LiFe
0 has a relatively high formation energy(0.66 eV) and a small binding energy (0.30 eV). Point E givesresults that are similar to those at point D. In contrast, when wechoose μO2
= �8.21 eV, we find that FeLiþ and LiFe
� are the mostenergetically favorable defects regardless of the choice of phase-equilibrium conditions.Identifying the General Trends. We list in Table 1 the
formation energies of the most relevant native point defectsand defect complexes in LiFePO4, migration barriers of selectedpoint defects, and binding energies of the defect complexes. Thechemical potentials are chosen with representative μO2
valuesand Li-deficient and Li-excess environments to reflect differentexperimental conditions. Specifically, these conditions representequilibrium of LiFePO4 with (1) Fe2O3 and Fe7(PO4)6 and (2)Li3Fe2(PO4)3 and Li3PO4, for μO2
= �3.03 eV; (3) Fe2O3 andFe3(PO4)2 and (4) Li4P2O7 and Li3PO4, for μO2
=�3.89 eV; (5)Fe2O3 and Fe3(PO4)2 (i.e., point A in Figure 1) and (6) Li4P2O7
and Li3PO4 (i.e., point D in Figure 1), for μO2= �4.59 eV; (7)
Fe3P and Fe2P and (8) Li3PO4 and Fe3P, for μO2= �8.21 eV.
Conditions (1), (3), (5), and (7) represent Li-deficient environ-ments, whereas (2), (4), and (6) represent Li-excess. Under eachcondition, the formation energies for charged defects are taken atthe Fermi-level position determined by relevant charged pointdefects: (1) εF = 0.59 eV (where pþ andVLi
� have equal formationenergies), (2) εF = 0.58 eV (pþ and LiFe
� ), (3) εF = 0.79 eV (FeLiþ
and VLi�), (4) εF = 0.66 eV (pþ and LiFe
� ), (5) εF = 1.06 eV (FeLiþ
Figure 5. Calculated formation energies of native point defects anddefect complexes in LiFePO4, plotted as a function of Fermi level withrespect to the VBM. The energies are obtained at μO2
= �3.03 eV, andequilibrium with Fe2O3 and Fe7(PO4)6 is assumed.
Figure 6. Calculated formation energies of native point defects anddefect complexes in LiFePO4, plotted as a function of Fermi level withrespect to the VBM. The energies are obtained at μO2
= �8.21 eV, andequilibrium with Fe2P and Fe3P is assumed.
3010 dx.doi.org/10.1021/cm200725j |Chem. Mater. 2011, 23, 3003–3013
Chemistry of Materials ARTICLE
and VLi�), (6) εF = 0.74 eV (FeLi
þ and LiFe� ), (7) εF = 2.00 eV
(FeLiþand LiFe
� ), and (8) εF = 1.98 eV (FeLiþ and LiFe
� ). The resultsfor other μO2
values are not included in Table 1 because they giveresults that are similar to those presented here. For example, theenergy landscapes for μO2
= �3.25 eV and μO2= �7.59 eV are
similar to those for μO2= �3.03 eV and μO2
= �4.59 eV,respectively.To help capture the most general trends in the energy land-
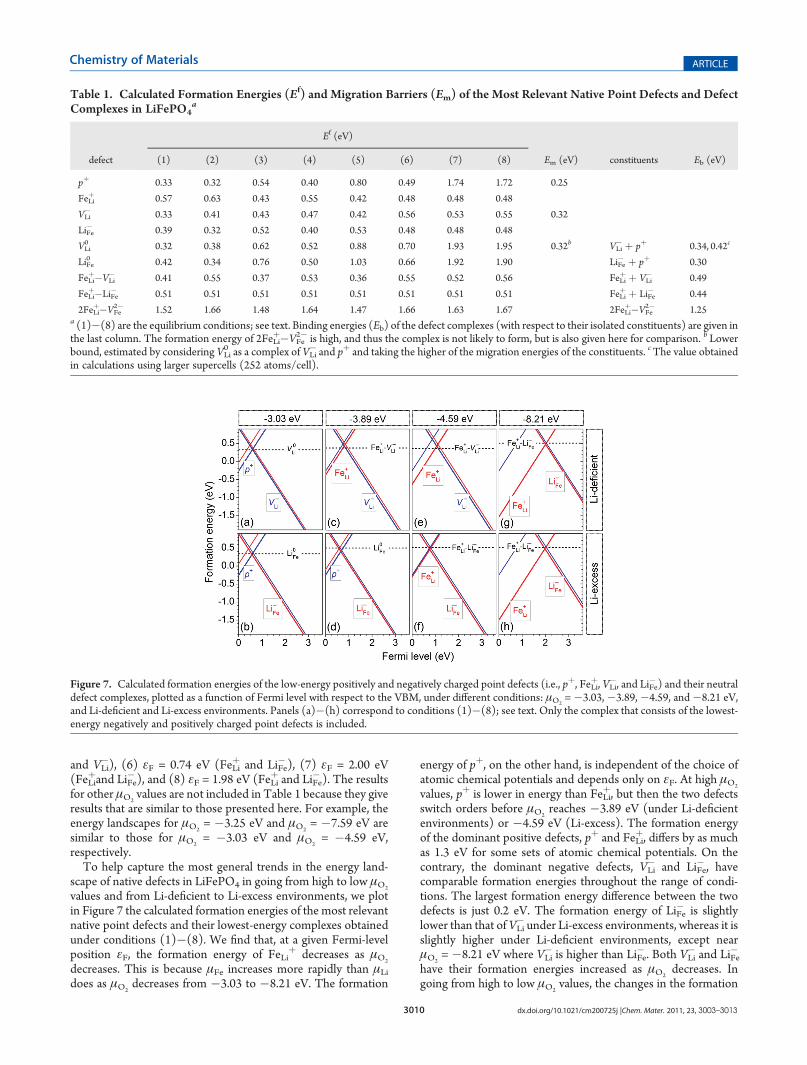
scape of native defects in LiFePO4 in going from high to low μO2
values and from Li-deficient to Li-excess environments, we plotin Figure 7 the calculated formation energies of the most relevantnative point defects and their lowest-energy complexes obtainedunder conditions (1)�(8). We find that, at a given Fermi-levelposition εF, the formation energy of FeLi
þ decreases as μO2
decreases. This is because μFe increases more rapidly than μLidoes as μO2
decreases from �3.03 to �8.21 eV. The formation
energy of pþ, on the other hand, is independent of the choice ofatomic chemical potentials and depends only on εF. At high μO2
values, pþ is lower in energy than FeLiþ, but then the two defects
switch orders before μO2reaches �3.89 eV (under Li-deficient
environments) or �4.59 eV (Li-excess). The formation energyof the dominant positive defects, pþ and FeLi
þ, differs by as muchas 1.3 eV for some sets of atomic chemical potentials. On thecontrary, the dominant negative defects, VLi
� and LiFe� , have
comparable formation energies throughout the range of condi-tions. The largest formation energy difference between the twodefects is just 0.2 eV. The formation energy of LiFe
� is slightlylower than that of VLi
� under Li-excess environments, whereas it isslightly higher under Li-deficient environments, except nearμO2
= �8.21 eV where VLi� is higher than LiFe
� . Both VLi� and LiFe
�
have their formation energies increased as μO2decreases. In
going from high to low μO2values, the changes in the formation
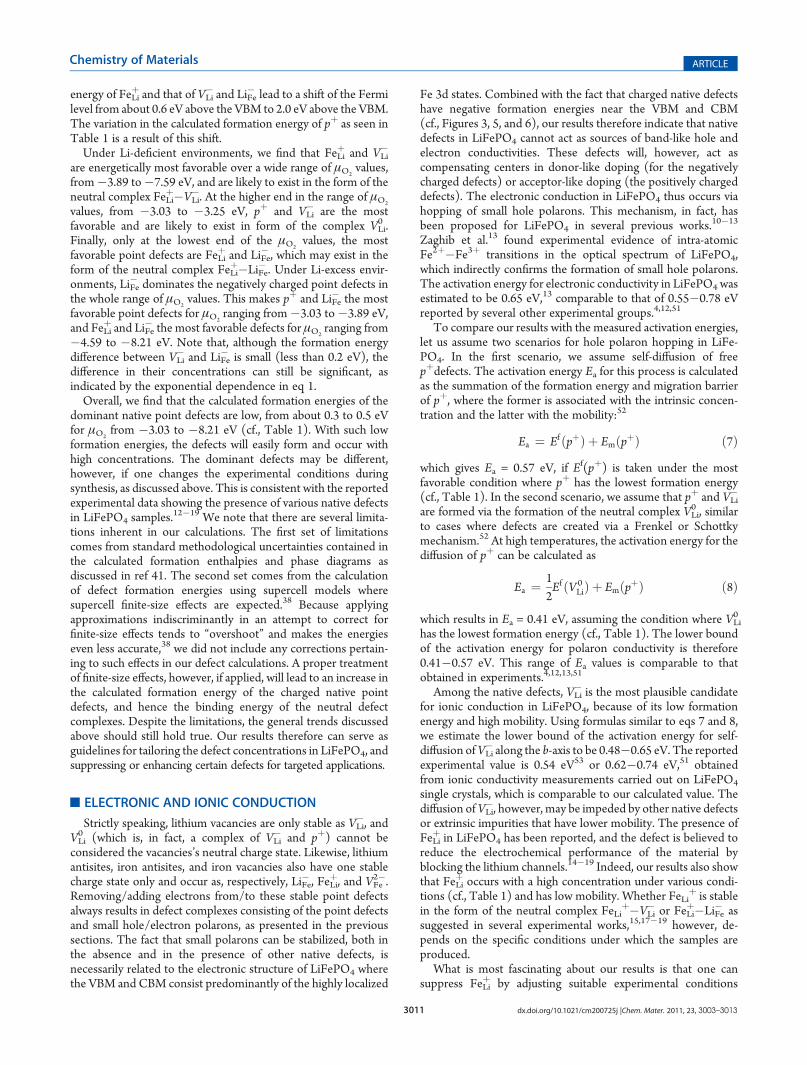
Table 1. Calculated Formation Energies (Ef) and Migration Barriers (Em) of the Most Relevant Native Point Defects and DefectComplexes in LiFePO4
a
Ef (eV)
defect (1) (2) (3) (4) (5) (6) (7) (8) Em (eV) constituents Eb (eV)
pþ 0.33 0.32 0.54 0.40 0.80 0.49 1.74 1.72 0.25
FeLiþ 0.57 0.63 0.43 0.55 0.42 0.48 0.48 0.48
VLi� 0.33 0.41 0.43 0.47 0.42 0.56 0.53 0.55 0.32
LiFe� 0.39 0.32 0.52 0.40 0.53 0.48 0.48 0.48
VLi0 0.32 0.38 0.62 0.52 0.88 0.70 1.93 1.95 0.32b VLi
� þ pþ 0.34, 0.42c
LiFe0 0.42 0.34 0.76 0.50 1.03 0.66 1.92 1.90 LiFe
� þ pþ 0.30
FeLiþ�VLi
� 0.41 0.55 0.37 0.53 0.36 0.55 0.52 0.56 FeLiþ þ VLi
� 0.49
FeLiþ�LiFe
� 0.51 0.51 0.51 0.51 0.51 0.51 0.51 0.51 FeLiþ þ LiFe
� 0.44
2FeLiþ�VFe
2� 1.52 1.66 1.48 1.64 1.47 1.66 1.63 1.67 2FeLiþ�VFe
2� 1.25a (1)�(8) are the equilibrium conditions; see text. Binding energies (Eb) of the defect complexes (with respect to their isolated constituents) are given inthe last column. The formation energy of 2FeLi
þ�VFe2� is high, and thus the complex is not likely to form, but is also given here for comparison. b Lower
bound, estimated by considering VLi0 as a complex of VLi
� and pþ and taking the higher of the migration energies of the constituents. cThe value obtainedin calculations using larger supercells (252 atoms/cell).
Figure 7. Calculated formation energies of the low-energy positively and negatively charged point defects (i.e., pþ, FeLiþ, VLi
�, and LiFe� ) and their neutral
defect complexes, plotted as a function of Fermi level with respect to the VBM, under different conditions: μO2=�3.03,�3.89,�4.59, and�8.21 eV,
and Li-deficient and Li-excess environments. Panels (a)�(h) correspond to conditions (1)�(8); see text. Only the complex that consists of the lowest-energy negatively and positively charged point defects is included.
3011 dx.doi.org/10.1021/cm200725j |Chem. Mater. 2011, 23, 3003–3013
Chemistry of Materials ARTICLE
energy of FeLiþ and that of VLi
� and LiFe� lead to a shift of the Fermi
level from about 0.6 eV above the VBM to 2.0 eV above the VBM.The variation in the calculated formation energy of pþ as seen inTable 1 is a result of this shift.Under Li-deficient environments, we find that FeLi
þ and VLi�
are energetically most favorable over a wide range of μO2values,
from�3.89 to�7.59 eV, and are likely to exist in the form of theneutral complex FeLi
þ�VLi�. At the higher end in the range of μO2
values, from �3.03 to �3.25 eV, pþ and VLi� are the most
favorable and are likely to exist in form of the complex VLi0 .
Finally, only at the lowest end of the μO2values, the most
favorable point defects are FeLiþ and LiFe
� , which may exist in theform of the neutral complex FeLi
þ�LiFe� . Under Li-excess envir-
onments, LiFe� dominates the negatively charged point defects in
the whole range of μO2values. This makes pþ and LiFe
� the mostfavorable point defects for μO2
ranging from�3.03 to�3.89 eV,and FeLi
þ and LiFe� the most favorable defects for μO2
ranging from�4.59 to �8.21 eV. Note that, although the formation energydifference between VLi
� and LiFe� is small (less than 0.2 eV), the
difference in their concentrations can still be significant, asindicated by the exponential dependence in eq 1.Overall, we find that the calculated formation energies of the
dominant native point defects are low, from about 0.3 to 0.5 eVfor μO2
from �3.03 to �8.21 eV (cf., Table 1). With such lowformation energies, the defects will easily form and occur withhigh concentrations. The dominant defects may be different,however, if one changes the experimental conditions duringsynthesis, as discussed above. This is consistent with the reportedexperimental data showing the presence of various native defectsin LiFePO4 samples.
12�19 We note that there are several limita-tions inherent in our calculations. The first set of limitationscomes from standard methodological uncertainties contained inthe calculated formation enthalpies and phase diagrams asdiscussed in ref 41. The second set comes from the calculationof defect formation energies using supercell models wheresupercell finite-size effects are expected.38 Because applyingapproximations indiscriminantly in an attempt to correct forfinite-size effects tends to “overshoot” and makes the energieseven less accurate,38 we did not include any corrections pertain-ing to such effects in our defect calculations. A proper treatmentof finite-size effects, however, if applied, will lead to an increase inthe calculated formation energy of the charged native pointdefects, and hence the binding energy of the neutral defectcomplexes. Despite the limitations, the general trends discussedabove should still hold true. Our results therefore can serve asguidelines for tailoring the defect concentrations in LiFePO4, andsuppressing or enhancing certain defects for targeted applications.
’ELECTRONIC AND IONIC CONDUCTION
Strictly speaking, lithium vacancies are only stable as VLi�, and
VLi0 (which is, in fact, a complex of VLi
� and pþ) cannot beconsidered the vacancies’s neutral charge state. Likewise, lithiumantisites, iron antisites, and iron vacancies also have one stablecharge state only and occur as, respectively, LiFe
� , FeLiþ, and VFe
2�.Removing/adding electrons from/to these stable point defectsalways results in defect complexes consisting of the point defectsand small hole/electron polarons, as presented in the previoussections. The fact that small polarons can be stabilized, both inthe absence and in the presence of other native defects, isnecessarily related to the electronic structure of LiFePO4 wherethe VBM and CBM consist predominantly of the highly localized
Fe 3d states. Combined with the fact that charged native defectshave negative formation energies near the VBM and CBM(cf., Figures 3, 5, and 6), our results therefore indicate that nativedefects in LiFePO4 cannot act as sources of band-like hole andelectron conductivities. These defects will, however, act ascompensating centers in donor-like doping (for the negativelycharged defects) or acceptor-like doping (the positively chargeddefects). The electronic conduction in LiFePO4 thus occurs viahopping of small hole polarons. This mechanism, in fact, hasbeen proposed for LiFePO4 in several previous works.10�13
Zaghib et al.13 found experimental evidence of intra-atomicFe2þ�Fe3þ transitions in the optical spectrum of LiFePO4,which indirectly confirms the formation of small hole polarons.The activation energy for electronic conductivity in LiFePO4 wasestimated to be 0.65 eV,13 comparable to that of 0.55�0.78 eVreported by several other experimental groups.4,12,51
To compare our results with the measured activation energies,let us assume two scenarios for hole polaron hopping in LiFe-PO4. In the first scenario, we assume self-diffusion of freepþdefects. The activation energy Ea for this process is calculatedas the summation of the formation energy and migration barrierof pþ, where the former is associated with the intrinsic concen-tration and the latter with the mobility:52
Ea ¼ Ef ðpþÞ þ EmðpþÞ ð7Þwhich gives Ea = 0.57 eV, if Ef(pþ) is taken under the mostfavorable condition where pþ has the lowest formation energy(cf., Table 1). In the second scenario, we assume that pþ and VLi
�
are formed via the formation of the neutral complex VLi0 , similar
to cases where defects are created via a Frenkel or Schottkymechanism.52 At high temperatures, the activation energy for thediffusion of pþ can be calculated as
Ea ¼ 12Ef ðV 0
LiÞ þ EmðpþÞ ð8Þ
which results in Ea = 0.41 eV, assuming the condition where VLi0
has the lowest formation energy (cf., Table 1). The lower boundof the activation energy for polaron conductivity is therefore0.41�0.57 eV. This range of Ea values is comparable to thatobtained in experiments.4,12,13,51
Among the native defects, VLi� is the most plausible candidate
for ionic conduction in LiFePO4, because of its low formationenergy and high mobility. Using formulas similar to eqs 7 and 8,we estimate the lower bound of the activation energy for self-diffusion ofVLi
� along the b-axis to be 0.48�0.65 eV. The reportedexperimental value is 0.54 eV53 or 0.62�0.74 eV,51 obtainedfrom ionic conductivity measurements carried out on LiFePO4
single crystals, which is comparable to our calculated value. Thediffusion ofVLi
�, however, may be impeded by other native defectsor extrinsic impurities that have lower mobility. The presence ofFeLi
þ in LiFePO4 has been reported, and the defect is believed toreduce the electrochemical performance of the material byblocking the lithium channels.14�19 Indeed, our results also showthat FeLi
þ occurs with a high concentration under various condi-tions (cf., Table 1) and has low mobility. Whether FeLi
þ is stablein the form of the neutral complex FeLi
þ�VLi� or FeLi
þ�LiFe� as
suggested in several experimental works,15,17�19 however, de-pends on the specific conditions under which the samples areproduced.
What is most fascinating about our results is that one cansuppress FeLi
þ by adjusting suitable experimental conditions
3012 dx.doi.org/10.1021/cm200725j |Chem. Mater. 2011, 23, 3003–3013
Chemistry of Materials ARTICLE
during synthesis. In fact, pþ-rich and FeLiþ-free LiFePO4 samples,
which are believed to be desirable for high intrinsic electronic andionic conductivities, can be produced if one maintains high μO2
values (cf., Figure 7). Of course, μO2should not be so high that
LiFePO4 becomes unstable toward forming secondary phases.Although LiFePO4 cannot be doped p-type or n-type as dis-cussed earlier, the incorporation of suitable electrically activeimpurities in the material can enhance the electronic (ionic)conductivity via increasing the concentration of pþ(VLi
�). Theseimpurities, if present in the samples with a concentration higherthan that of the charged native defects, can shift the Fermilevel,43�45 and hence lower the formation energy of either pþ or VLi
�.A decrease in the formation energy of pþ, however, may result inan increase in the formation energy of VLi
� and vice versa. Forexample, impurities with positive effective charges (i.e., donor-like doping) may shift the Fermi level to the right (cf., Figure 7),resulting in an increased (decreased) formation energy ofpþ(VLi
�). Impurities with negative effective charges (i.e., acceptor-like doping), on the other hand, may produce the oppositeeffects, decreasing (increasing) the formation energy of pþ(VLi
�).An enhancement in both electronic and ionic conductivitieswould, therefore, require a delicate combination of defect-controlled synthesis, doping with suitable electrically activeimpurities, and postsynthesis treatments. An example of thelatter would be thermal treatment, which, in fact, has beenreported to cause lithium loss in LiFePO4 and lower theactivation energy of the electrical conductivity.54
’CONCLUSION
In summary, we have carried out comprehensive first-princi-ples studies of native point defects and defect complexes inLiFePO4. We find that lithium vacancies, lithium antisites, ironantisites, and iron vacancies each have one stable charge stateonly and occur as, respectively, VLi
�, LiFe� , FeLi
þ, and VFe2�. The
removal/addition of electrons from/to these stable native pointdefects does not result in a transition to other charge states of thesame defects, but instead generates small hole/electron polarons.The fact that small polarons can be stabilized, both in thepresence and in the absence of other native defects, is necessarilyrelated to the electronic structure of LiFePO4. Our analysis thusindicates that native defects in the material cannot act as sourcesof band-like electron and hole conductivities, and the electronicconduction, in fact, proceeds via hopping of small hole polarons(pþ). The ionic conduction, on the other hand, occurs viadiffusion of lithium vacancies.
Among all possible native defects, pþ, VLi�, LiFe
� , and FeLiþ are
found to have low formation energies and are hence expected tooccur in LiFePO4 with high concentrations. The dominant pointdefects in the samples are likely to exist in forms of a neutraldefect complex such as VLi
0 , LiFe0 , FeLi
þ�VLi�, or FeLi
þ�LiFe� . The
energy landscape of these defects is, however, sensitive to thechoice of atomic chemical potentials, which represent experi-mental conditions during synthesis. This explains the conflictingexperimental data on defect formation in LiFePO4. Our resultsalso raise the necessity of having prior knowledge of the nativedefects in LiFePO4 samples before any useful interpretations ofthe measured transport data can be made. We suggest that onecan suppress or enhance certain native defects in LiFePO4 viatuning the experimental conditions during synthesis, and therebyproduce samples with tailored defect concentrations for optimalperformance. The electrical conductivity may be enhanced
through increase of hole polaron and lithium vacancy concentra-tions via a combination of defect-controlled synthesis, incorpora-tion of suitable electrically active impurities that can shift theFermi level, and postsynthesis treatments.
’AUTHOR INFORMATION
Corresponding Author*E-mail: [email protected].
’ACKNOWLEDGMENT
We acknowledge helpful discussions with S. C. Erwin and J.Allen, and the use of computing facilities at the DoD HPCCenters. K.H. was supported by the Naval Research Laboratorythrough Grant No. NRL-N00173-08-G001, and M.J. was sup-ported by the Office of Naval Research.
’REFERENCES
(1) Padhi, A. K.; Nanjundaswamy, K. S.; Goodenough, J. B.J. Electrochem. Soc. 1997, 144, 1188–1194.
(2) Ellis, B. L.; Lee, K. T.; Nazar, L. F. Chem. Mater. 2010,22, 691–714.
(3) Manthiram, A. J. Phys. Chem. Lett. 2011, 2, 176–184.(4) Delacourt, C.; Laffont, L.; Bouchet, R.; Wurm, C.; Leriche, J.-B.;
Morcrette, M.; Tarascon, J.-M.; Masquelier, C. J. Electrochem. Soc. 2005,152, A913–A921.
(5) Huang, H.; Yin, S.-C.; Nazar, L. F. Electrochem. Solid-State Lett.2001, 4, A170–A172.
(6) Ellis, B.; Kan, W. H.; Makahnouk, W. R. M.; Nazar, L. F. J. Mater.Chem. 2007, 17, 3248–3254.
(7) Chung, S.; Bloking, J.; Chiang, Y. Nat. Mater. 2002, 1, 123–128.(8) Ravet, N.; Abouimrane, A.; Armand,M.Nat. Mater. 2003, 2, 702.(9) Wagemaker, M.; Ellis, B. L.; L€utzenkirchen-Hecht, D.; Mulder,
F. M.; Nazar, L. F. Chem. Mater. 2008, 20, 6313–6315.(10) Zhou, F.; Kang, K.; Maxisch, T.; Ceder, G.; Morgan, D. Solid
State Commun. 2004, 132, 181–186.(11) Maxisch, T.; Zhou, F.; Ceder, G. Phys. Rev. B 2006, 73, 104301.(12) Ellis, B.; Perry, L. K.; Ryan, D. H.; Nazar, L. F. J. Am. Chem. Soc.
2006, 128, 11416–11422.(13) Zaghib, K.; Mauger, A.; Goodenough, J. B.; Gendron, F.; Julien,
C. M. Chem. Mater. 2007, 19, 3740–3747.(14) Yang, S. F.; Song, Y. N.; Zavalij, P. Y.; Whittingham, M. S.
Electrochem. Commun. 2002, 4, 239–244.(15) Maier, J.; Amin, R. J. Electrochem. Soc. 2008, 155, A339–A344.(16) Chen, J. J.; Vacchio, M. J.; Wang, S. J.; Chernova, N.; Zavalij,
P. Y.; Whittingham, M. S. Solid State Ionics 2008, 178, 1676–1693.(17) Chung, S.-Y.; Choi, S.-Y.; Yamamoto, T.; Ikuhara, Y. Phys. Rev.
Lett. 2008, 100, 125502.(18) Axmann, P.; Stinner, C.; Wohlfahrt-Mehrens, M.; Mauger, A.;
Gendron, F.; Julien, C. M. Chem. Mater. 2009, 21, 1636–1644.(19) Chung, S.-Y.; Kim, Y.-M.; Choi, S.-Y. Adv. Funct. Mater. 2010,
20, 4219–4232.(20) Morgan, D.; Van der Ven, A.; Ceder, G. Electrochem. Solid-State
Lett. 2004, 7, A30–A32.(21) Islam, M. S.; Driscoll, D. J.; Fisher, C. A. J.; Slater, P. R. Chem.
Mater. 2005, 17, 5085–5092.(22) Fisher, C. A. J.; Prieto, V.M.H.; Islam,M. S.Chem.Mater. 2008,
20, 5907–5915.(23) Adams, S. J. Solid State Electrochem. 2010, 14, 1787–1792.(24) Malik, R.; Burch, D.; Bazant, M.; Ceder, G. Nano Lett. 2010,
10, 4123–4127.(25) Anisimov, V. I.; Zaanen, J.; Andersen, O. K. Phys. Rev. B 1991,
44, 943–954.(26) Anisimov, V. I.; Solovyev, I. V.; Korotin, M. A.; Czy_zyk, M. T.;
Sawatzky, G. A. Phys. Rev. B 1993, 48, 16929–16934.

3013 dx.doi.org/10.1021/cm200725j |Chem. Mater. 2011, 23, 3003–3013
Chemistry of Materials ARTICLE
(27) Liechtenstein, A. I.; Anisimov, V. I.; Zaanen, J. Phys. Rev. B1995, 52, R5467–R5470.(28) Perdew, J. P.; Burke, K.; Ernzerhof, M. Phys. Rev. Lett. 1996,
77, 3865–3868.(29) Bl€ochl, P. E. Phys. Rev. B 1994, 50, 17953–17979.(30) Kresse, G.; Joubert, D. Phys. Rev. B 1999, 59, 1758–1775.(31) Kresse, G.; Hafner, J. Phys. Rev. B 1993, 47, 558–561.(32) Kresse, G.; Furthm€uller, J. Phys. Rev. B 1996, 54, 11169–11186.(33) Kresse, G.; Furthm€uller, J. Comput. Mater. Sci. 1996, 6, 15–50.(34) Zhou, F.; Cococcioni, M.; Marianetti, C.; Morgan, D.; Ceder, G.
Phys. Rev. B 2004, 70, 235121.(35) Monkhorst, H. J.; Pack, J. D. Phys. Rev. B 1976, 13, 5188–5192.(36) Henkelman, G.; Uberuaga, B. P.; J�onsson, H. J. Chem. Phys.
2000, 113, 9901–9904.(37) Rousse, G.; Rodriguez-Carvajal, J.; Patoux, S.; Masquelier, C.
Chem. Mater. 2003, 15, 4082–4090.(38) Van de Walle, C. G.; Neugebauer, J. J. Appl. Phys. 2004,
95, 3851–3879.(39) Janotti, A.; Van de Walle, C. G. Rep. Prog. Phys. 2009,
72, 126501.(40) Van de Walle, C. G.; Janotti, A. IOP Conf. Ser.: Mater. Sci. Eng.
2010, 15, 012001.(41) Ong, P. S.; Wang, L.; Kang, B.; Ceder, G. Chem. Mater. 2008,
20, 1798–1807.(42) Note that we have applied a shift of 1.36 eV per O2 molecule to
EO2
tot as suggested by Wang et al. [Wang, L.; Maxisch, T.; Ceder, G. Phys.Rev. B 2006, 73, 195107] and discussed in ref 41. This constant shift is tocorrect for the O2 binding energy error and the error in charge transfer(dfp) energy due to improper treatment of correlation.(43) Peles, A.; Van de Walle, C. G. Phys. Rev. B 2007, 76, 214101.(44) Hoang, K.; Van de Walle, C. G. Phys. Rev. B 2009, 80, 214109.(45) Wilson-Short, G. B.; Janotti, A.; Hoang, K.; Peles, A.; Van
deWalle, C. G. Phys. Rev. B 2009, 80, 224102.(46) Van deWalle, C. G.; Lyons, J. L.; Janotti, A. Phys. Status Solidi A
2010, 207, 1024–1036.(47) Catlow, C. R. A.; Sokol, A. A.; Walsh, A. Chem. Commun. 2011,
47, 3386–3388.(48) Shluger, A. L.; Stoneham, A. M. J. Phys.: Condens. Matter 1993,
5, 3049–3086.(49) Stoneham, A. M.; Gavartin, J.; Shluger, A. L.; Kimmel, A. V.;
Mu~noz Ramo, D.; Rønnow, H. M.; Aeppli, G.; Renner, C. J. Phys.:Condens. Matter 2007, 19, 255208.(50) Nishimura, S.-i.; Kobayashi, G.; Ohoyama, K.; Kanno, R.;
Yashima, M.; Yamada, A. Nat. Mater. 2008, 7, 707–711.(51) Amin, R.; Maier, J.; Balaya, P.; Chen, D. P.; Lin, C. T. Solid State
Ionics 2008, 179, 1683–1687.(52) Balluf, R. W.; Allen, S. M.; Carter, W. C.; Kemper, R. A. Kinetics
of Materials; John Wiley & Sons: NJ, 2005.(53) Li, J.; Yao, W.; Martin, S.; Vaknin, D. Solid State Ionics 2008,
179, 2016–2019.(54) Amin, R.; Maier, J. Solid State Ionics 2008, 178, 1831–1836.