Tahmoor Colliery - Longwall 28€¦ · Tahmoor Colliery - Longwall 28 ... The Management Plan...
37
REPORT: JEMENA SUBSIDENCE MANAGEMENT PLAN © MSEC APRIL 2014 | REPORT NUMBER: MSEC646-05 | REVISION C GLENCORE: Tahmoor Colliery - Longwall 28 Management Plan for Potential Impacts to Jemena Gas Infrastructure
Transcript of Tahmoor Colliery - Longwall 28€¦ · Tahmoor Colliery - Longwall 28 ... The Management Plan...
REPORT: JEMENA SUBSIDENCE MANAGEMENT PLAN
© MSEC APRIL 2014 | REPORT NUMBER: MSEC646-05 | REVISION C
GLENCORE:
Tahmoor Colliery - Longwall 28
Management Plan for Potential Impacts to Jemena Gas Infrastructure
isheppard
Typewritten Text
Ian Sheppard
isheppard
Typewritten Text
Manager Environment and Community
isheppard
Typewritten Text
4 April 2014

JEMENA MANAGEMENT PLAN FOR TAHMOOR LONGWALL 28
© MSEC APRIL 2014 | REPORT NUMBER MSEC646-05 | REVISION C
PAGE ii
CONTENTS
1.0 INTRODUCTION 1
1.1. Background 1
1.2. Objectives 1
1.3. Scope 2
1.4. Proposed Mining Schedule 2
1.5. Definition of Active Subsidence Zone 3
2.0 RISK MANAGEMENT METHOD 4
2.1. General 4
2.1.1. Consequence 4
2.1.2. Likelihood 4
2.1.3. Hazard 4
2.1.4. Risk 4
3.0 RISK ASSESSMENT 5
3.1. Maximum Predicted Systematic Parameters 5
3.2. Observed Subsidence during the mining of Longwalls 22 to 27 5
3.3. Predicted Strain 11
3.3.1. Analysis of Strains Measured in Survey Bays 11
3.3.2. Analysis of Strains Measured Along Whole Monitoring Lines 13
3.4. Predicted and Observed Valley Closure across creeks 14
3.5. Observations during Longwalls 22 to 27 17
3.6. Gas Infrastructure 17
3.7. Hazard Identification 18
3.7.1. Major Gas Pipeline along Remembrance Drive 18
3.7.2. Local Gas Pipeline 18
3.7.3. Gas Mains at Castlereagh Street Creek Crossing 20
3.7.4. Gas Mains at Remembrance Drive Creek Crossing 20
3.7.5. Summary of Risk Analysis for Gas Infrastructure 24
4.0 RISK CONTROL PROCEDURES 25
4.1. Gas Management Group (GMG) 25
4.2. Avoidance and Mitigation Measures 25
4.3. Monitoring Plan 25
4.3.1. Ground Monitoring Lines 25
4.4. Visual Inspections 25
4.5. Jemena Gas Patrols 25
4.6. Triggers and Responses 25
5.0 GMG MEETINGS 27
6.0 AUDIT AND REVIEW 27
7.0 RECORD KEEPING 27
8.0 CONTACT LIST 28
APPENDIX A. DRAWINGS 29

JEMENA MANAGEMENT PLAN FOR TAHMOOR LONGWALL 28
© MSEC APRIL 2014 | REPORT NUMBER MSEC646-05 | REVISION C
PAGE iii
LIST OF TABLES, FIGURES AND DRAWINGS
Tables
Tables are prefaced by the number of the chapter in which they are presented.
Table No. Description Page
Table 1.1 Longwall Dimensions ................................................................................................................. 1
Table 1.2 Schedule of Mining ..................................................................................................................... 2
Table 2.1 Qualitative Risk Analysis Matrix ................................................................................................. 4
Table 3.1 Maximum Predicted Incremental Systematic Subsidence Parameters due to the Extraction of Longwall 28 ................................................................................................................................ 5
Table 3.2 Maximum Predicted Total Systematic Subsidence Parameters after the Extraction of Longwall 28 ............................................................................................................................................... 5
Table 3.3 Predicted and Observed Incremental Valley Closure across Myrtle Creek and Skew Culvert at monitoring lines ........................................................................................................................ 16
Table 3.4 Predicted Subsidence Parameters at the Gas Pipe Crossing at the Remembrance Drive Road Bridge ....................................................................................................................................... 21
Table 3.5 Predicted Upsidence and Closure at the Gas Pipe Crossing and at the Remembrance Drive Road Bridge ............................................................................................................................. 21
Table 3.6 Risk Analysis Matrix for Gas Infrastructure .............................................................................. 24
Table 4.1 Control Measures and Response for Tahmoor Colliery Longwall 28 on Jemena AGN Gas Facilities ................................................................................................................................... 26
Figures
Figures are prefaced by the number of the chapter or the letter of the appendix in which they are presented.
Figure No. Description Page
Fig. 1.1 Diagrammatic Representation of Active Subsidence Zone ........................................................ 3
Fig. 3.1 Observed Subsidence along Centreline of Longwall 24A .......................................................... 6
Fig. 3.2 Observed Subsidence along Centreline of Longwall 25 ............................................................ 7
Fig. 3.3 Observed Subsidence along Centreline of Longwall 26 ............................................................ 8
Fig. 3.4 Observed Subsidence along Centreline of Longwall 27 ............................................................ 9
Fig. 3.5 Distributions of the Measured Maximum Tensile and Compressive Strains for Surveys Bays Located Above Goaf at Tahmoor, Appin and West Cliff Collieries ........................................... 12
Fig. 3.6 Distributions of the Measured Maximum Tensile and Compressive Strains for Survey Bays Located Above Solid Coal at Tahmoor, Appin and West Cliff Collieries .................................. 13
Fig. 3.7 Distributions of Measured Maximum Tensile and Compressive Strains Anywhere along the Monitoring Lines at Tahmoor, Appin and West Cliff Collieries ................................................. 14
Fig. 3.8 Monitoring lines across Myrtle Creek and Skew Culvert .......................................................... 15
Fig. 3.9 Development of closure across Myrtle Creek during the mining of Longwalls 24B to 27 ........ 15
Fig. 3.10 Development of closure across Skew Culvert during the mining of Longwalls 26 and 27 ....... 16
Fig. 3.11 Predicted Subsidence, Tilt and Curvature along Remembrance Drive due to the mining of Longwalls 22 to 30 ................................................................................................................... 19
Fig. 3.12 Remembrance Drive Road Bridge over Myrtle Creek .............................................................. 20
Fig. 3.13 Termination of steel gas pipe at end of Remembrance Drive Road Bridge ............................. 21
Fig. 3.14 Observed subsidence and changes in horizontal distances across the abutment of Remembrance Drive (Myrtle Creek) Road Bridge ................................................................... 22
Fig. 3.15 Survey marks on Remembrance Drive (Myrtle Creek) Road Bridge ....................................... 23

JEMENA MANAGEMENT PLAN FOR TAHMOOR LONGWALL 28
© MSEC APRIL 2014 | REPORT NUMBER MSEC646-05 | REVISION C
PAGE iv
Drawings
Drawings referred to in this report are included in Appendix A at the end of this report.
Drawing No. Description Revision
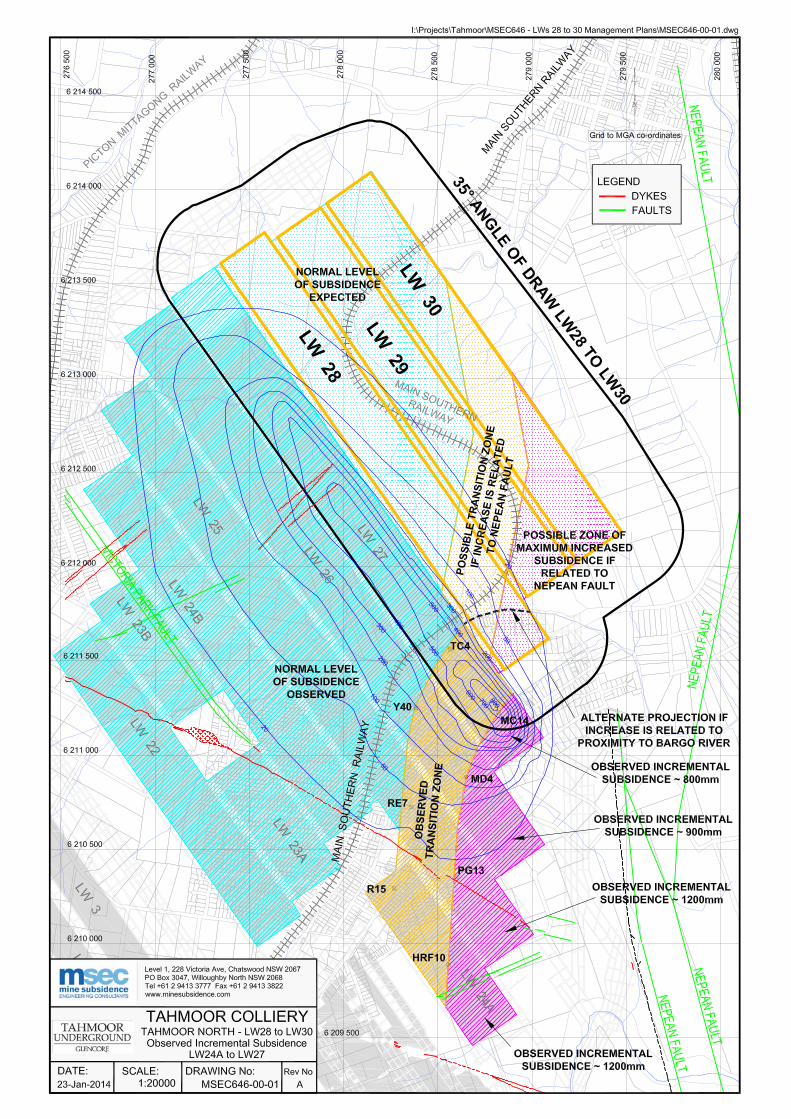
MSEC646-00-01 Observed Incremental Subsidence due to LW27 A
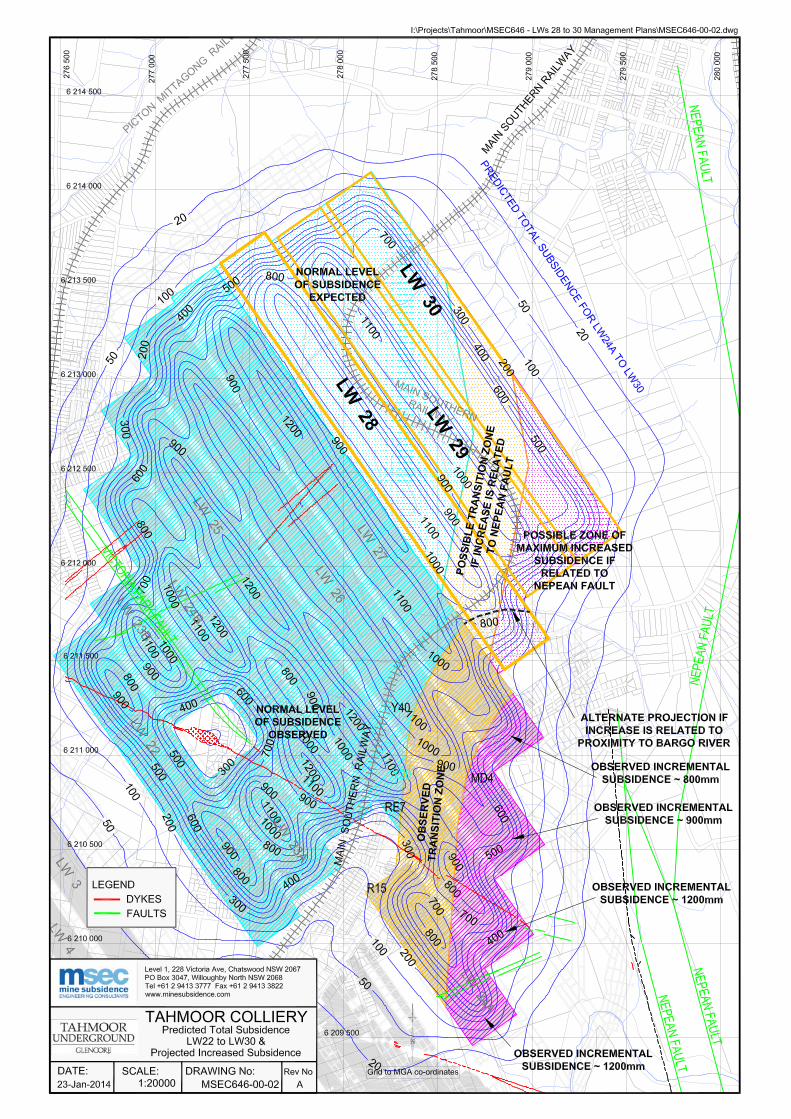
MSEC646-00-02 Predicted Total Subsidence due to LW22 to LW30 and Projected Increased Subsidence A
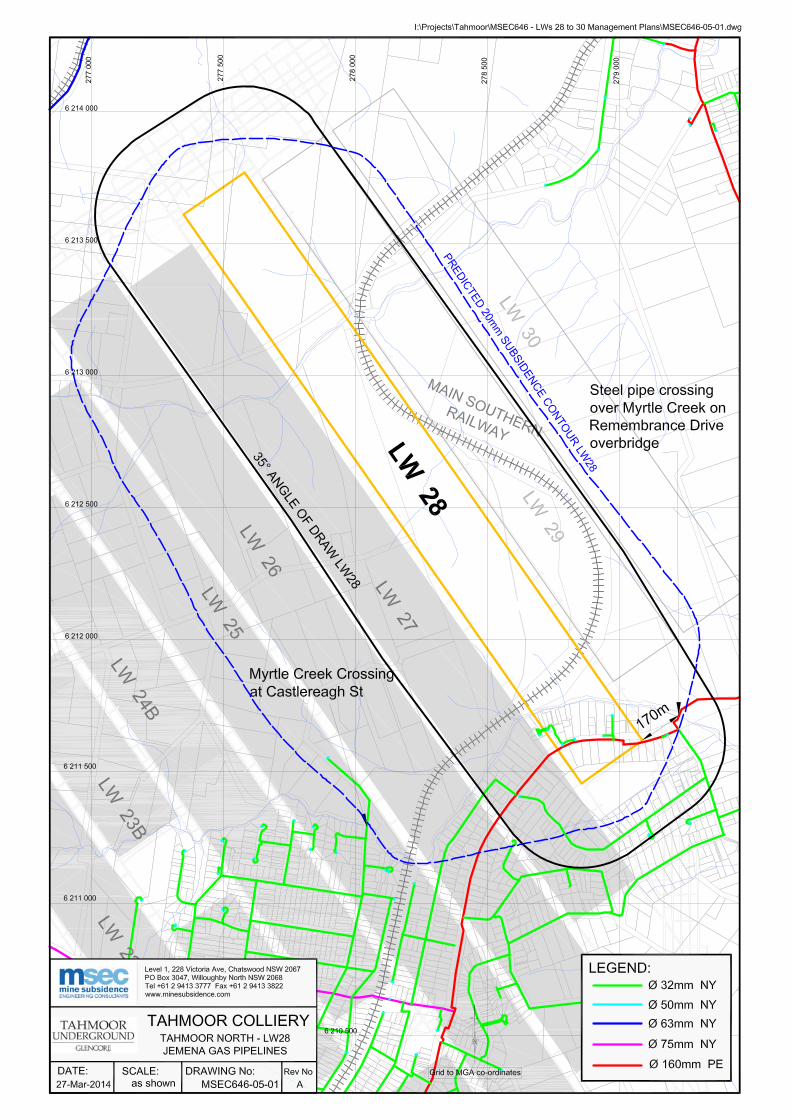
MSEC646-05-01 Jemena Infrastructure A
JEMENA MANAGEMENT PLAN FOR TAHMOOR LONGWALL 28
© MSEC APRIL 2014 | REPORT NUMBER MSEC646-05 | REVISION C
PAGE 1
1.0 INTRODUCTION
1.1. Background
Tahmoor Colliery is located approximately 80 kilometres south west of Sydney in the township of Tahmoor NSW. It is managed and operated by Glencore. Tahmoor Colliery has previously mined 26 longwalls to the north and west of the mine’s current location. It is currently mining Longwall 27.
Longwall 28 is a continuation of a series of longwalls that extend into the Tahmoor North Lease area, which began with Longwall 22. The longwall panels are located between the Bargo River in the south-east, the township of Thirlmere in the west and Picton in the north.
A portion of Longwall 28 is located beneath the urban area of Tahmoor. Infrastructure owned by Jemena is located directly above Longwall 28.
Whilst this Management Plan has been developed for Longwall 28 only, Tahmoor Colliery’s mine plan has changed since the Management Plan for Longwall 27 was prepared, in that Longwalls 29 and 30 have been shortened by approximately 250 metres. This represents a significant change because the potential for impacts on the steel gas pipe crossing over Myrtle Creek on the Remembrance Drive Road Bridge has been substantially reduced.
The location of Longwall 28 relative to Jemena assets is shown in Drawing No. MSEC646-05-01. A summary of the dimensions of this longwall is provided in Table 1.1.
Table 1.1 Longwall Dimensions
Longwall
Overall Void Length Including Installation
Heading (m)
Overall Void Width Including
First Workings (m)
Overall Tailgate Chain Pillar
Width (m)
Longwall 28 2630 283 39
This Management Plan provides detailed information about how the risks associated with mining beneath gas infrastructure will be managed by Tahmoor Colliery and Jemena.
The Management Plan is a live document that can be amended at any stage of mining, to meet the changing needs of Tahmoor Colliery and Jemena.
1.2. Objectives
The objectives of this Management Plan are to establish procedures to measure, control, mitigate and repair potential impacts that might occur on surface infrastructure owned by Jemena. The objectives of the Management Plan have been developed to:-
Ensure the safe and serviceable operation of all surface infrastructure. Public and workplace safety is paramount. Disruption and inconvenience should be kept to minimal levels.
Monitor ground movements and the condition of surface infrastructure during mining. Establish procedures to measure, monitor, control, mitigate and repair gas infrastructure. Initiate action to mitigate or remedy potential significant impacts that are expected to occur on the
surface. Provide a plan of action in the event that the impacts of mine subsidence are greater than those
that are predicted. Provide a forum to report, discuss and record impacts to the surface. This will involve Tahmoor
Colliery, Jemena, Mine Subsidence Board, and the NSW Department of Trade and Investment, Regional Infrastructure and Services, Division of Resources and Energy (DTIRIS), and consultants as required.
Establish lines of communication and emergency contacts.
JEMENA MANAGEMENT PLAN FOR TAHMOOR LONGWALL 28
© MSEC APRIL 2014 | REPORT NUMBER MSEC646-05 | REVISION C
PAGE 2
1.3. Scope
The Management Plan is to be used to protect and monitor the condition of the items of infrastructure identified to be at risk due to mine subsidence. The major items at risk are:-
The major natural gas pipeline The main gas pipeline The local gas pipeline Gas mains at creek crossings
The Management Plan describes measures that will be undertaken as a result of mining Longwall 28 only.
1.4. Proposed Mining Schedule
It is planned that each longwall will extract coal working northwest from the southeastern ends. This Management Plan covers longwall mining until completion of mining in Longwall 30 and for sufficient time thereafter to allow for completion of subsidence effects. The current schedule of mining is shown in Table 1.2.
Table 1.2 Schedule of Mining
Longwall Start Date Completion Date
Longwall 28 April 2014 August 2015
JEMENA MANAGEMENT PLAN FOR TAHMOOR LONGWALL 28
© MSEC APRIL 2014 | REPORT NUMBER MSEC646-05 | REVISION C
PAGE 3
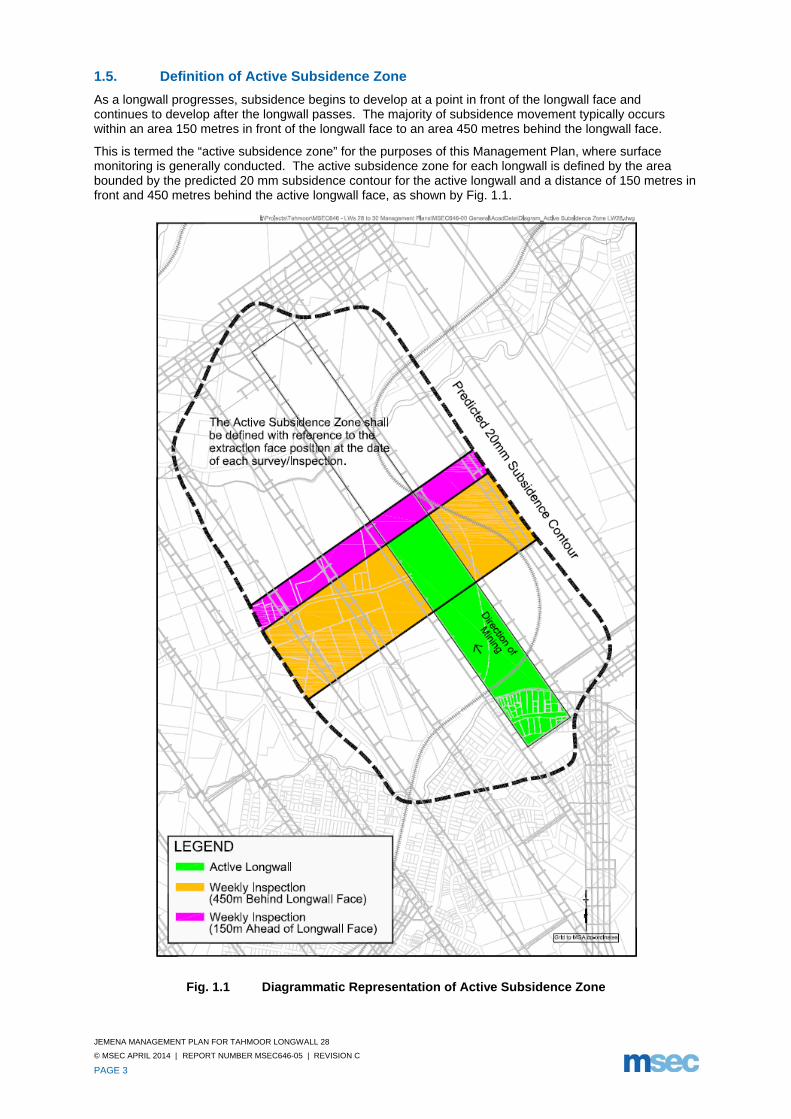
1.5. Definition of Active Subsidence Zone
As a longwall progresses, subsidence begins to develop at a point in front of the longwall face and continues to develop after the longwall passes. The majority of subsidence movement typically occurs within an area 150 metres in front of the longwall face to an area 450 metres behind the longwall face.
This is termed the “active subsidence zone” for the purposes of this Management Plan, where surface monitoring is generally conducted. The active subsidence zone for each longwall is defined by the area bounded by the predicted 20 mm subsidence contour for the active longwall and a distance of 150 metres in front and 450 metres behind the active longwall face, as shown by Fig. 1.1.
Fig. 1.1 Diagrammatic Representation of Active Subsidence Zone
JEMENA MANAGEMENT PLAN FOR TAHMOOR LONGWALL 28
© MSEC APRIL 2014 | REPORT NUMBER MSEC646-05 | REVISION C
PAGE 4
2.0 RISK MANAGEMENT METHOD
2.1. General
The Australian/New Zealand standard for Risk Management defines the terms used in the risk management process, which includes the identification, analysis, assessment, treatment and monitoring of risk. In this context:-
2.1.1. Consequence
‘The outcome of an event expressed qualitatively or quantitatively, being a loss, injury, disadvantage or gain. There may be a range of possible outcomes associated with an event.’1 The consequences of a hazard are rated from very slight to very severe.
2.1.2. Likelihood
‘Used as a qualitative description of probability or frequency.’2 The likelihood can range from very rare to almost certain.
2.1.3. Hazard
‘A source of potential harm or a situation with a potential to cause loss.’3
2.1.4. Risk
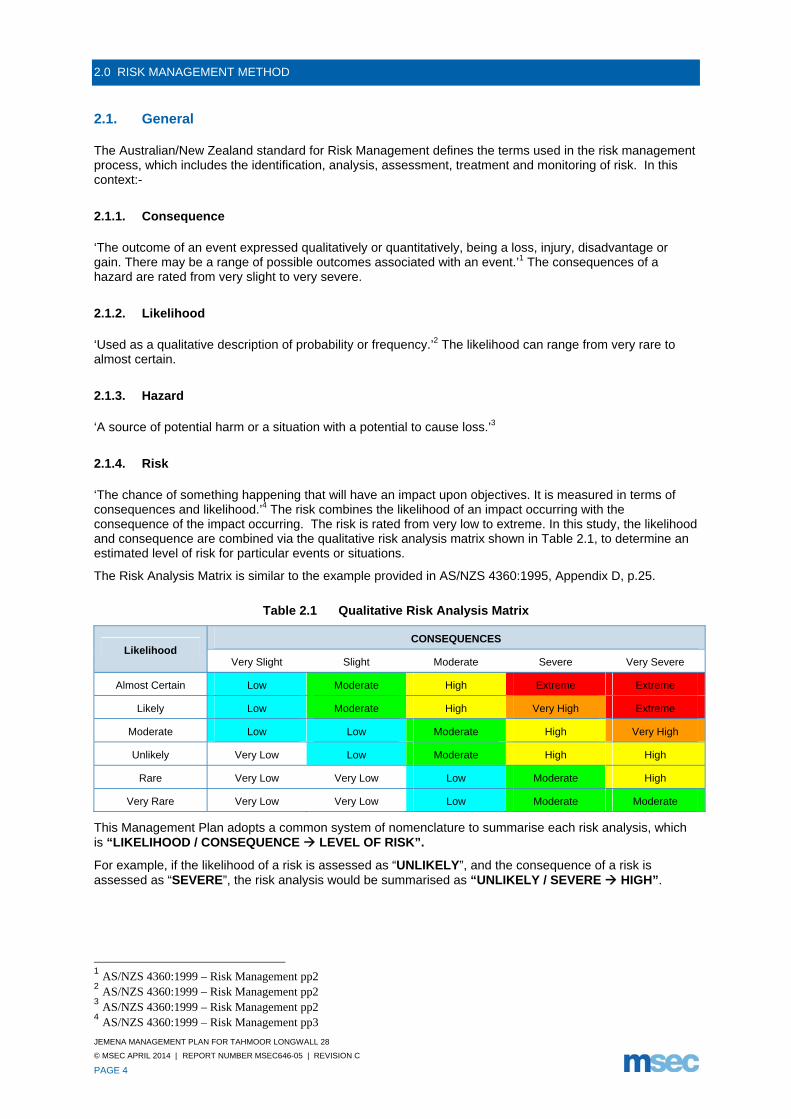
‘The chance of something happening that will have an impact upon objectives. It is measured in terms of consequences and likelihood.’4 The risk combines the likelihood of an impact occurring with the consequence of the impact occurring. The risk is rated from very low to extreme. In this study, the likelihood and consequence are combined via the qualitative risk analysis matrix shown in Table 2.1, to determine an estimated level of risk for particular events or situations.
The Risk Analysis Matrix is similar to the example provided in AS/NZS 4360:1995, Appendix D, p.25.
Table 2.1 Qualitative Risk Analysis Matrix
Likelihood CONSEQUENCES
Very Slight Slight Moderate Severe Very Severe
Almost Certain Low Moderate High Extreme Extreme
Likely Low Moderate High Very High Extreme
Moderate Low Low Moderate High Very High
Unlikely Very Low Low Moderate High High
Rare Very Low Very Low Low Moderate High
Very Rare Very Low Very Low Low Moderate Moderate
This Management Plan adopts a common system of nomenclature to summarise each risk analysis, which is “LIKELIHOOD / CONSEQUENCE LEVEL OF RISK”.
For example, if the likelihood of a risk is assessed as “UNLIKELY”, and the consequence of a risk is assessed as “SEVERE”, the risk analysis would be summarised as “UNLIKELY / SEVERE HIGH”.
1 AS/NZS 4360:1999 – Risk Management pp2 2 AS/NZS 4360:1999 – Risk Management pp2 3 AS/NZS 4360:1999 – Risk Management pp2 4 AS/NZS 4360:1999 – Risk Management pp3
JEMENA MANAGEMENT PLAN FOR TAHMOOR LONGWALL 28
© MSEC APRIL 2014 | REPORT NUMBER MSEC646-05 | REVISION C
PAGE 5
3.0 RISK ASSESSMENT
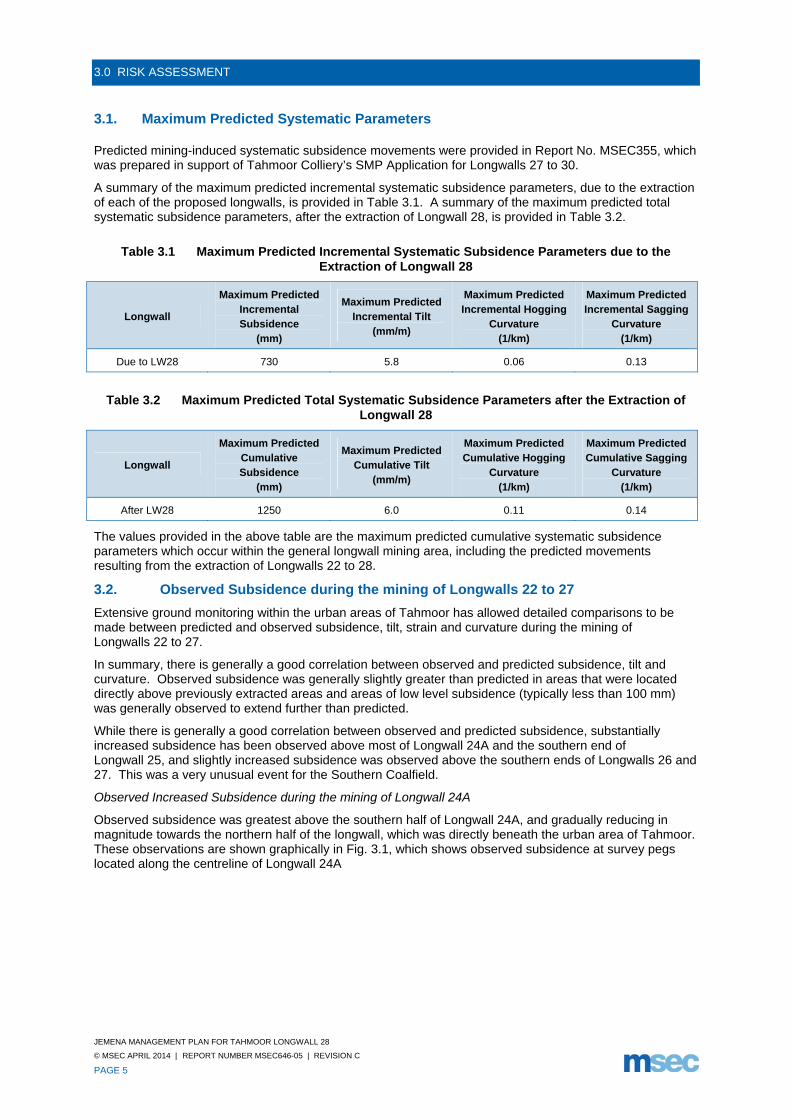
3.1. Maximum Predicted Systematic Parameters
Predicted mining-induced systematic subsidence movements were provided in Report No. MSEC355, which was prepared in support of Tahmoor Colliery’s SMP Application for Longwalls 27 to 30.
A summary of the maximum predicted incremental systematic subsidence parameters, due to the extraction of each of the proposed longwalls, is provided in Table 3.1. A summary of the maximum predicted total systematic subsidence parameters, after the extraction of Longwall 28, is provided in Table 3.2.
Table 3.1 Maximum Predicted Incremental Systematic Subsidence Parameters due to the Extraction of Longwall 28
Longwall
Maximum Predicted Incremental Subsidence
(mm)
Maximum Predicted Incremental Tilt
(mm/m)
Maximum Predicted Incremental Hogging
Curvature (1/km)
Maximum Predicted Incremental Sagging
Curvature (1/km)
Due to LW28 730 5.8 0.06 0.13
Table 3.2 Maximum Predicted Total Systematic Subsidence Parameters after the Extraction of Longwall 28
Longwall
Maximum Predicted Cumulative Subsidence
(mm)
Maximum Predicted Cumulative Tilt
(mm/m)
Maximum Predicted Cumulative Hogging
Curvature (1/km)
Maximum Predicted Cumulative Sagging
Curvature (1/km)
After LW28 1250 6.0 0.11 0.14
The values provided in the above table are the maximum predicted cumulative systematic subsidence parameters which occur within the general longwall mining area, including the predicted movements resulting from the extraction of Longwalls 22 to 28.
3.2. Observed Subsidence during the mining of Longwalls 22 to 27
Extensive ground monitoring within the urban areas of Tahmoor has allowed detailed comparisons to be made between predicted and observed subsidence, tilt, strain and curvature during the mining of Longwalls 22 to 27.
In summary, there is generally a good correlation between observed and predicted subsidence, tilt and curvature. Observed subsidence was generally slightly greater than predicted in areas that were located directly above previously extracted areas and areas of low level subsidence (typically less than 100 mm) was generally observed to extend further than predicted.
While there is generally a good correlation between observed and predicted subsidence, substantially increased subsidence has been observed above most of Longwall 24A and the southern end of Longwall 25, and slightly increased subsidence was observed above the southern ends of Longwalls 26 and 27. This was a very unusual event for the Southern Coalfield.
Observed Increased Subsidence during the mining of Longwall 24A
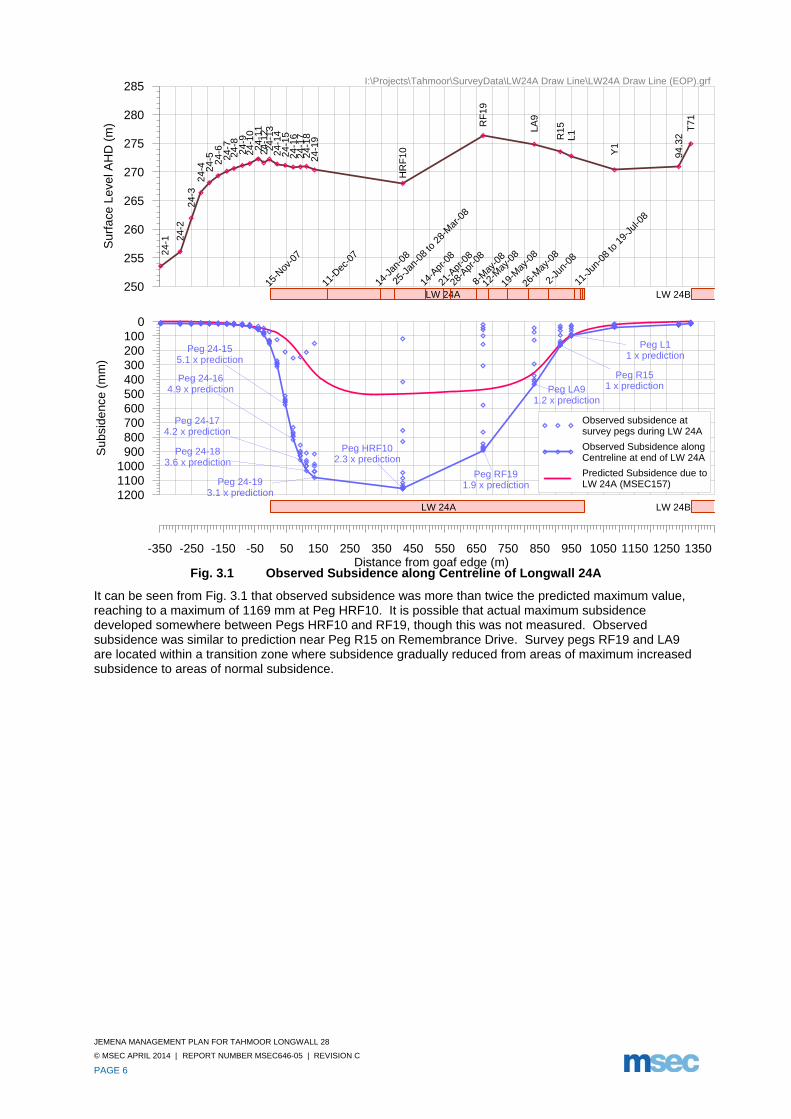
Observed subsidence was greatest above the southern half of Longwall 24A, and gradually reducing in magnitude towards the northern half of the longwall, which was directly beneath the urban area of Tahmoor. These observations are shown graphically in Fig. 3.1, which shows observed subsidence at survey pegs located along the centreline of Longwall 24A
JEMENA MANAGEMENT PLAN FOR TAHMOOR LONGWALL 28
© MSEC APRIL 2014 | REPORT NUMBER MSEC646-05 | REVISION C
PAGE 6
Fig. 3.1 Observed Subsidence along Centreline of Longwall 24A
It can be seen from Fig. 3.1 that observed subsidence was more than twice the predicted maximum value, reaching to a maximum of 1169 mm at Peg HRF10. It is possible that actual maximum subsidence developed somewhere between Pegs HRF10 and RF19, though this was not measured. Observed subsidence was similar to prediction near Peg R15 on Remembrance Drive. Survey pegs RF19 and LA9 are located within a transition zone where subsidence gradually reduced from areas of maximum increased subsidence to areas of normal subsidence.
-350 -250 -150 -50 50 150 250 350 450 550 650 750 850 950 1050 1150 1250 1350Distance from goaf edge (m)
LW 24A LW 24B120011001000
900800700600500400300200100
0
Sub
side
nce
(mm
)
Peg 24-155.1 x prediction
Peg 24-164.9 x prediction
Peg 24-174.2 x prediction
Peg 24-183.6 x prediction
Peg 24-193.1 x prediction
Peg HRF102.3 x prediction
Peg RF191.9 x prediction
Peg LA91.2 x prediction
Peg R151 x prediction
Peg L11 x prediction
Observed subsidence atsurvey pegs during LW 24A
Observed Subsidence alongCentreline at end of LW 24A
Predicted Subsidence due toLW 24A (MSEC157)
250
255
260
265
270
275
280
285
Sur
face
Lev
el A
HD
(m
)
LW 24A15
-Nov
-07
11-D
ec-0
7
14-J
an-0
8
25-J
an-0
8 to
28-
Mar
-08
14-A
pr-0
8
21-A
pr-0
8
28-A
pr-0
8
8-M
ay-0
8
12-M
ay-0
8
19-M
ay-0
8
26-M
ay-0
8
2-Ju
n-08
11-J
un-0
8 to
19-
Jul-0
8
24-
1 24-2
24-3
24-4 24
-5 24-6
24-
724
-824
-924
-10
24-
1124
-12
24-1
32
4-14
24-1
524
-16
24-1
724
-18
24-1
9
HR
F10
RF
19
LA9
R15
L1
Y1
94.3
2T
71
LW 24B
I:\Projects\Tahmoor\SurveyData\LW24A Draw Line\LW24A Draw Line (EOP).grf
JEMENA MANAGEMENT PLAN FOR TAHMOOR LONGWALL 28
© MSEC APRIL 2014 | REPORT NUMBER MSEC646-05 | REVISION C
PAGE 7
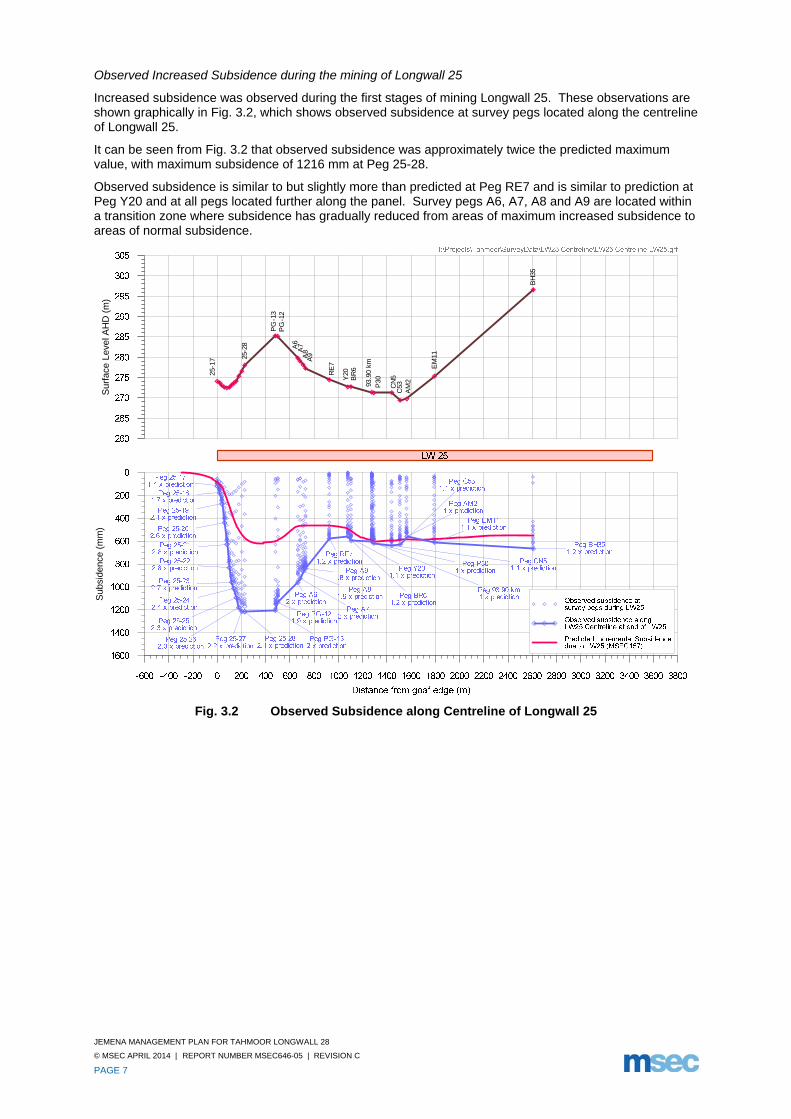
Observed Increased Subsidence during the mining of Longwall 25
Increased subsidence was observed during the first stages of mining Longwall 25. These observations are shown graphically in Fig. 3.2, which shows observed subsidence at survey pegs located along the centreline of Longwall 25.
It can be seen from Fig. 3.2 that observed subsidence was approximately twice the predicted maximum value, with maximum subsidence of 1216 mm at Peg 25-28.
Observed subsidence is similar to but slightly more than predicted at Peg RE7 and is similar to prediction at Peg Y20 and at all pegs located further along the panel. Survey pegs A6, A7, A8 and A9 are located within a transition zone where subsidence has gradually reduced from areas of maximum increased subsidence to areas of normal subsidence.
Sur
face
Leve
lAH
D(m
)
25-2
8
PG
-13
PG
-12
A6
A7
A8
A9
RE
7
Y20
BR
6
93.9
0km
P30
CN
5C
53A
M2
EM
11
BH
35
Sub
side
nce
(mm
)
25-1
7
Fig. 3.2 Observed Subsidence along Centreline of Longwall 25
JEMENA MANAGEMENT PLAN FOR TAHMOOR LONGWALL 28
© MSEC APRIL 2014 | REPORT NUMBER MSEC646-05 | REVISION C
PAGE 8
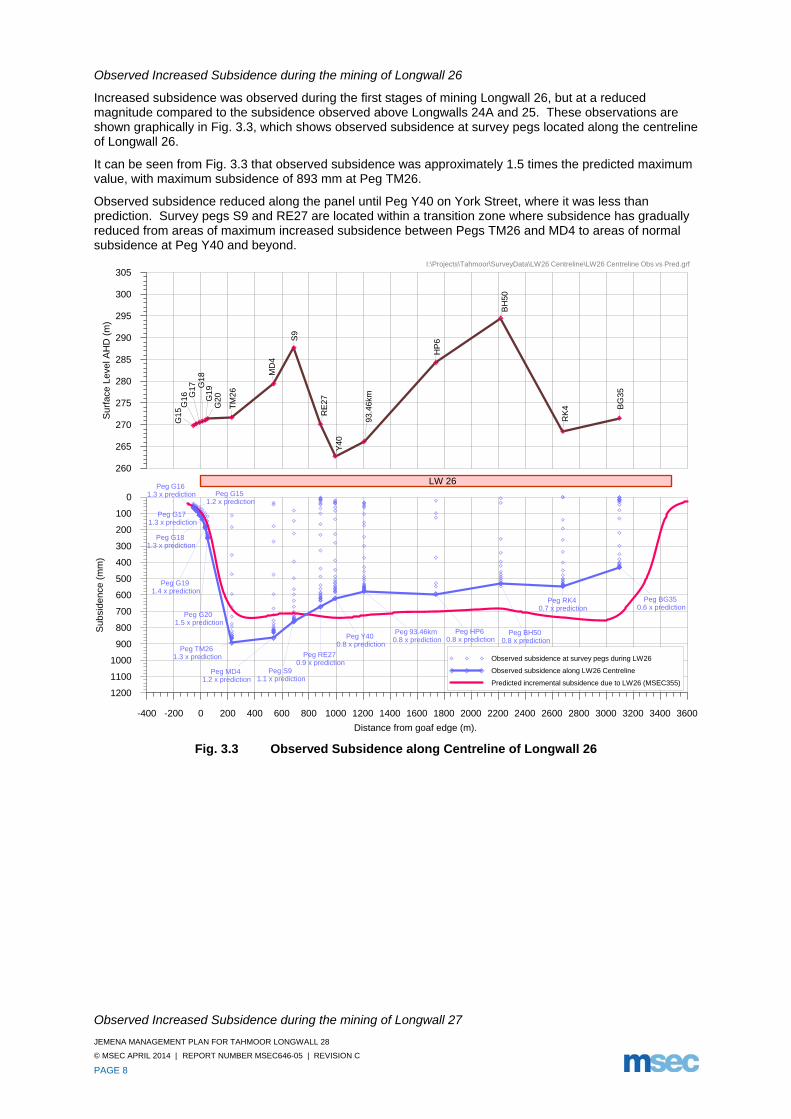
Observed Increased Subsidence during the mining of Longwall 26
Increased subsidence was observed during the first stages of mining Longwall 26, but at a reduced magnitude compared to the subsidence observed above Longwalls 24A and 25. These observations are shown graphically in Fig. 3.3, which shows observed subsidence at survey pegs located along the centreline of Longwall 26.
It can be seen from Fig. 3.3 that observed subsidence was approximately 1.5 times the predicted maximum value, with maximum subsidence of 893 mm at Peg TM26.
Observed subsidence reduced along the panel until Peg Y40 on York Street, where it was less than prediction. Survey pegs S9 and RE27 are located within a transition zone where subsidence has gradually reduced from areas of maximum increased subsidence between Pegs TM26 and MD4 to areas of normal subsidence at Peg Y40 and beyond.
-400 -200 0 200 400 600 800 1000 1200 1400 1600 1800 2000 2200 2400 2600 2800 3000 3200 3400 3600
Distance from goaf edge (m).
1200
1100
1000
900
800
700
600
500
400
300
200
100
0
Sub
sid
ence
(m
m)
Peg G151.2 x prediction
Peg G161.3 x prediction
Peg G171.3 x prediction
Peg G181.3 x prediction
Peg G191.4 x prediction
Peg G201.5 x prediction
Peg TM261.3 x prediction
Peg MD41.2 x prediction
Peg S91.1 x prediction
Peg RE270.9 x prediction
Peg Y400.8 x prediction
Peg 93.46km0.8 x prediction
Peg HP60.8 x prediction
Peg BH500.8 x prediction
Peg RK40.7 x prediction
Peg BG350.6 x prediction
Observed subsidence at survey pegs during LW26
Observed subsidence along LW26 Centreline
Predicted incremental subsidence due to LW26 (MSEC355)
260
265
270
275
280
285
290
295
300
305
Sur
face
Lev
el A
HD
(m
)
LW 26
G1
5
G19
TM
26
HP
6
G17
S9
MD
4
G20
G16
RK
4
BH
50
RE
27
Y40
BG
35
93.4
6km
G18
I:\Projects\Tahmoor\SurveyData\LW26 Centreline\LW26 Centreline Obs vs Pred.grf
Fig. 3.3 Observed Subsidence along Centreline of Longwall 26
Observed Increased Subsidence during the mining of Longwall 27
JEMENA MANAGEMENT PLAN FOR TAHMOOR LONGWALL 28
© MSEC APRIL 2014 | REPORT NUMBER MSEC646-05 | REVISION C
PAGE 9
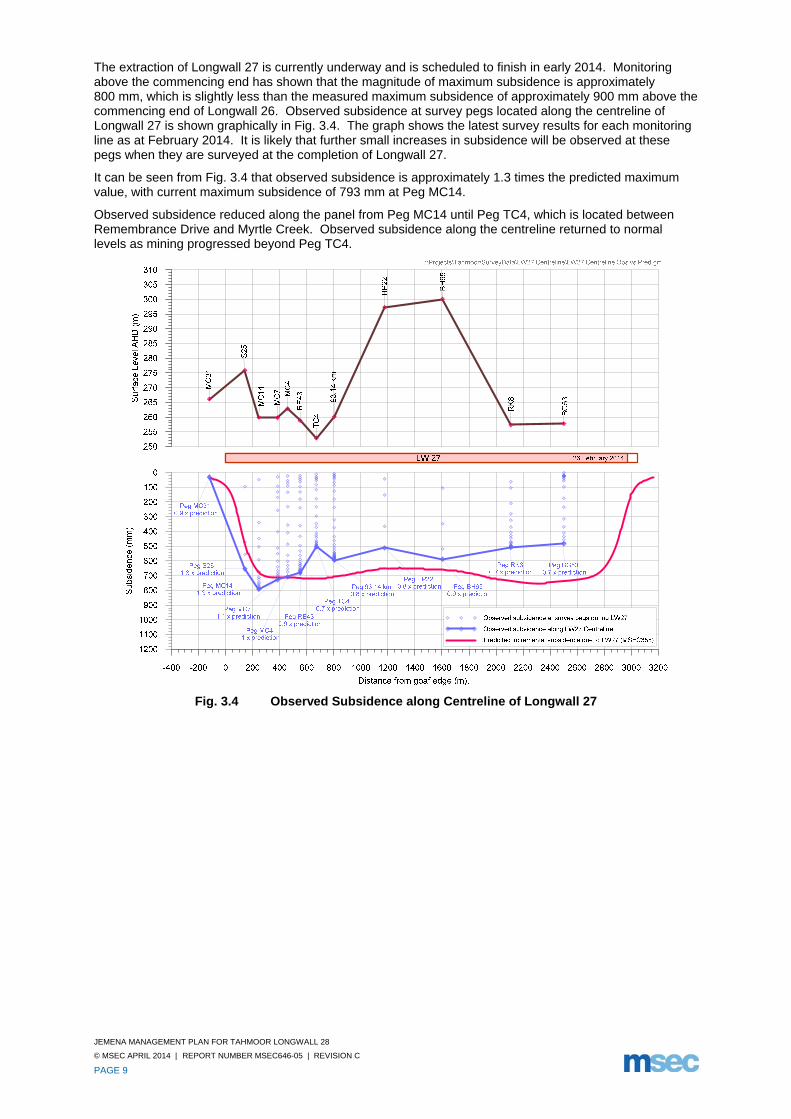
The extraction of Longwall 27 is currently underway and is scheduled to finish in early 2014. Monitoring above the commencing end has shown that the magnitude of maximum subsidence is approximately 800 mm, which is slightly less than the measured maximum subsidence of approximately 900 mm above the commencing end of Longwall 26. Observed subsidence at survey pegs located along the centreline of Longwall 27 is shown graphically in Fig. 3.4. The graph shows the latest survey results for each monitoring line as at February 2014. It is likely that further small increases in subsidence will be observed at these pegs when they are surveyed at the completion of Longwall 27.
It can be seen from Fig. 3.4 that observed subsidence is approximately 1.3 times the predicted maximum value, with current maximum subsidence of 793 mm at Peg MC14.
Observed subsidence reduced along the panel from Peg MC14 until Peg TC4, which is located between Remembrance Drive and Myrtle Creek. Observed subsidence along the centreline returned to normal levels as mining progressed beyond Peg TC4.
Fig. 3.4 Observed Subsidence along Centreline of Longwall 27
JEMENA MANAGEMENT PLAN FOR TAHMOOR LONGWALL 28
© MSEC APRIL 2014 | REPORT NUMBER MSEC646-05 | REVISION C
PAGE 10
Analysis and commentary
The cause for the increased subsidence has been investigated by Strata Control Technologies on behalf of Tahmoor Colliery (Gale and Sheppard, 2011). The investigations concluded that the increased subsidence is consistent with localised weathering of joint and bedding planes above a depressed water table adjacent to an incised gorge.
In light of the above observations, the region above the extracted longwalls at Tahmoor has been partitioned into three zones:
1. Normal subsidence zone – where the observed vertical subsidence is within the normal range and correlates well with predictions
2. Maximum increased subsidence zone – where the observed vertical subsidence is substantially greater than predictions but has reached it upper limit. Maximum subsidence above the centreline of the longwalls appears to be approximately 1.2 metres above Longwalls 24A and 25, 900 mm above Longwall 26 and 800 mm above Longwall 27.
3. Transition zone – where the subsidence behaviour appears to have transitioned between areas of maximum increased subsidence and normal subsidence.
When the locations of the three zones are plotted on a map, as shown in Drawing No. MSEC646-00-01 (refer Appendix), it can be seen that the transition zone is roughly consistent in width above Longwall 24A, Longwall 25 and Longwall 26. This orientation is roughly parallel to the Nepean Fault. The transition zone then appears to change direction above Longwall 27. This may suggest a relationship to the proximity of Longwall 27 to the Bargo River and a curved transition zone has been drawn to illustrate this. .
The observations above Longwalls 24A to 27 suggest that the location of the zone of increased subsidence is linked to both the alignment of the Nepean Fault and the proximity to the Bargo River. It correlates with the findings of Gale and Sheppard that the increased subsidence is linked to localised weathering of joint and bedding planes above a depressed water table adjacent to the incised gorge of the Bargo River.
The experiences of reduced maximum subsidence above Longwalls 26 and 27 suggest that the magnitude of maximum subsidence above the commencing ends of Longwalls 28 to 30 will be less than previously observed and may return close to normal levels of subsidence elsewhere at Tahmoor.
The zones of increased subsidence and transition to normal subsidence have been conservatively projected above Longwalls 28 to 30 in Drawing No. MSEC646-00-02 (refer Appendix). The projection is conservative as it is based on the orientation of the Nepean Fault rather than its proximity to the Bargo River. A curved dashed line is also shown in in Drawing No. MSEC646-00-02 above Longwall 28, which is an alternative projection based on the observations above Longwall 27 and its proximity to the Bargo River. This alternative projection appears reasonable based on the observations above Longwall 27.Despite the above observations and projections, it is recognised that substantially increased subsidence could develop above the commencing ends of Longwalls 28 to 30 and this Management Plan has been developed to manage potential impacts if substantial additional subsidence were to occur.
With respect to Jemena infrastructure, the gas main is located directly within a potential zone of increased subsidence above Longwall 28 only.
JEMENA MANAGEMENT PLAN FOR TAHMOOR LONGWALL 28
© MSEC APRIL 2014 | REPORT NUMBER MSEC646-05 | REVISION C
PAGE 11
3.3. Predicted Strain
The prediction of strain is more difficult than the predictions of subsidence, tilt and curvature. The reason for this is that strain is affected by many factors, including curvature and horizontal movement, as well as local variations in the near surface geology, the locations of pre-existing natural joints at bedrock, and the depth of bedrock. Survey tolerance can also represent a substantial portion of the measured strain, in cases where the strains are of a low order of magnitude. The profiles of observed strain, therefore, can be irregular even when the profiles of observed subsidence, tilt and curvature are relatively smooth.
In previous MSEC subsidence reports, predictions of conventional strain were provided based on the best estimate of the average relationship between curvature and strain. Similar relationships have been proposed by other authors. The reliability of the strain predictions was highlighted in these reports, where it was stated that measured strains can vary considerably from the predicted conventional values.
Adopting a linear relationship between curvature and strain provides a reasonable prediction for the conventional tensile and compressive strains. The locations that are predicted to experience hogging or convex curvature are expected to be net tensile strain zones and locations that are predicted to experience sagging or concave curvature are expected to be net compressive strain zones. In the Southern Coalfield, it has been found that a factor of 15 provides a reasonable relationship between the maximum predicted curvatures and the maximum predicted conventional strains.
At a point, however, there can be considerable variation from the linear relationship, resulting from non-conventional movements or from the normal scatters which are observed in strain profiles. When expressed as a percentage, observed strains can be many times greater than the predicted conventional strain for low magnitudes of curvature. In this report, therefore, we have provided a statistical approach to account for the variability, instead of just providing a single predicted conventional strain.
The data used in an analysis of observed strains included those resulting from both conventional and non-conventional anomalous movements, but did not include those resulting from valley related movements, which are addressed separately in this report. The strains resulting from damaged or disturbed survey marks have also been excluded.
A number of probability distribution functions were fitted to the empirical data. It was found that a Generalised Pareto Distribution (GPD) provided a good fit to the raw strain data. Confidence levels have been determined from the empirical strain data using the fitted GPDs. In the cases where survey bays were measured multiple times during a longwall extraction, the maximum tensile strain and the maximum compressive strain were used in the analysis (i.e. single tensile strain and single compressive strain measurement per survey bay).
3.3.1. Analysis of Strains Measured in Survey Bays
For features that are in discrete locations, such as building structures, farm dams and archaeological sites, it is appropriate to assess the frequency of the observed maximum strains for individual survey bays.
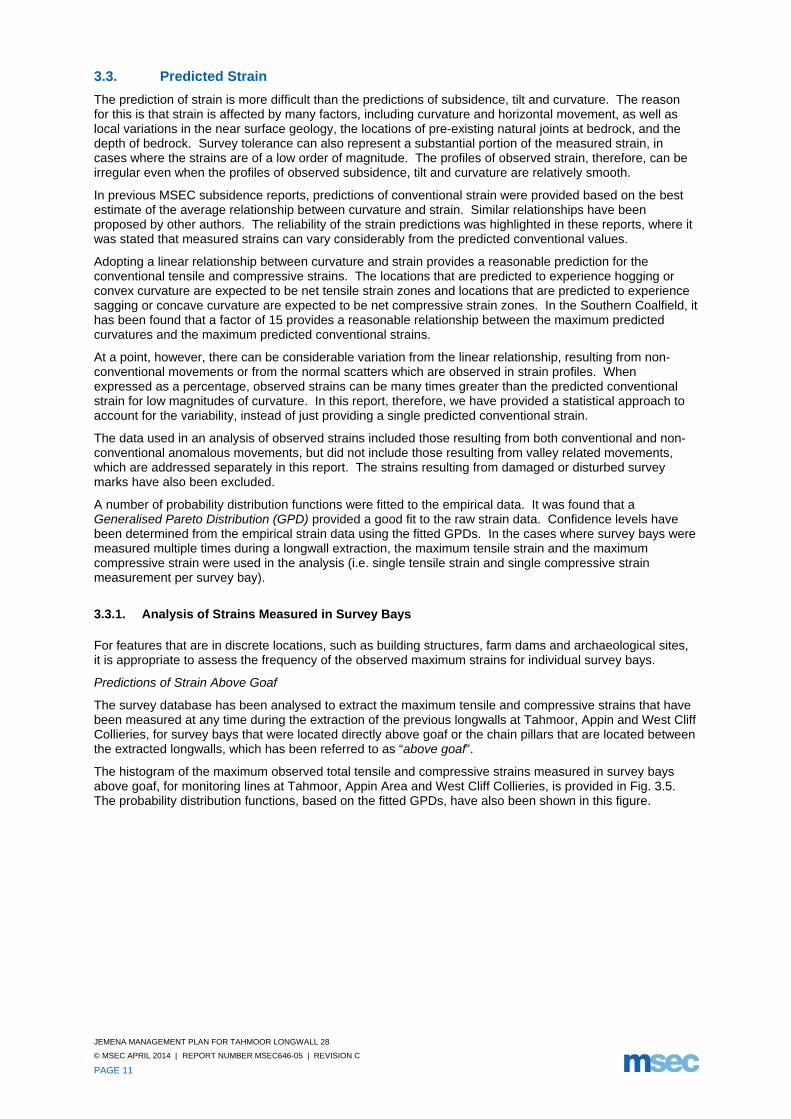
Predictions of Strain Above Goaf
The survey database has been analysed to extract the maximum tensile and compressive strains that have been measured at any time during the extraction of the previous longwalls at Tahmoor, Appin and West Cliff Collieries, for survey bays that were located directly above goaf or the chain pillars that are located between the extracted longwalls, which has been referred to as “above goaf”.
The histogram of the maximum observed total tensile and compressive strains measured in survey bays above goaf, for monitoring lines at Tahmoor, Appin Area and West Cliff Collieries, is provided in Fig. 3.5. The probability distribution functions, based on the fitted GPDs, have also been shown in this figure.
JEMENA MANAGEMENT PLAN FOR TAHMOOR LONGWALL 28
© MSEC APRIL 2014 | REPORT NUMBER MSEC646-05 | REVISION C
PAGE 12
Rel
ativ
e F
requ
ency
0.00
0.00
0.000.00
0.00
0.00
0.00
0.00
0.00
0.000.00
0.00
0.000.00
0.00
0.00
0.00
0.00
0.000.
00
0.00
0.00
0.00
0.00
0.000.01
0.010.
01
0.01
0.01
0.02
0.02
0.03
0.03
0.040.
05
0.070.
07
0.09
0.11
0.12
0.28
Pro
babi
lity
Den
sity
Rel
ativ
e F
requ
ency
0.14
0.12
0.10
0.07
0.05
0.04
0.03
0.02
0.01
0.00 0.01
0.01 0.01
0.00
0.00
0.00
0.00
0.00
0.00 0.00
0.00
0.00
0.00
Pro
babi
lity
Den
sity
Fig. 3.5 Distributions of the Measured Maximum Tensile and Compressive Strains for Surveys Bays Located Above Goaf at Tahmoor, Appin and West Cliff Collieries
The 95 % confidence levels for the maximum total strains that the individual survey bays above goaf experienced at any time during mining at Tahmoor, Appin and West Cliff Collieries were 0.9 mm/m tensile and 1.6 mm/m compressive. The strains for the proposed longwalls are predicted to be 30 % to 50 % greater than those previously observed at these collieries and, therefore, it is expected that 95 % of the strains measured above goaf would be less than 1.5 mm/m tensile and 2.5 mm/m compressive.
The 99 % confidence levels for the maximum total strains that the individual survey bays above goaf experienced at any time during mining at Tahmoor, Appin and West Cliff Collieries were 1.4 mm/m tensile and 3.1 mm/m compressive. Similarly, it is expected that 99 % of the strains measured above goaf for the proposed longwalls would be less than 2.0 mm/m tensile and 4.5 mm/m compressive.
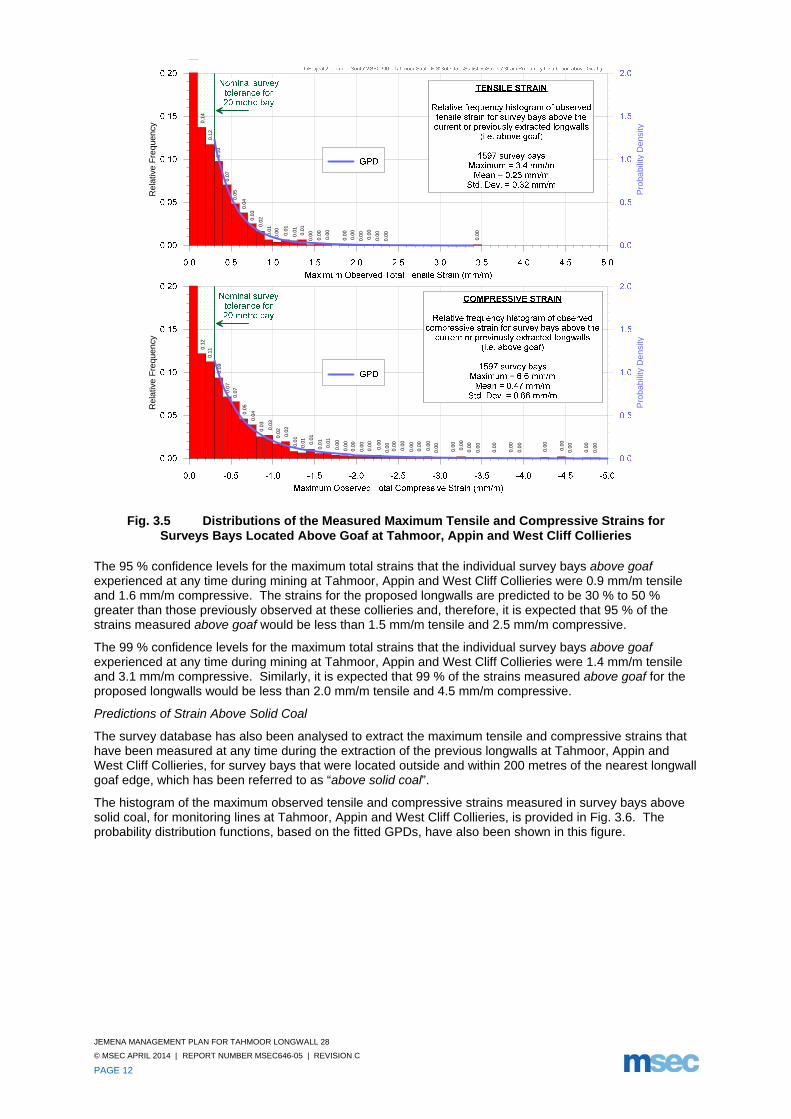
Predictions of Strain Above Solid Coal
The survey database has also been analysed to extract the maximum tensile and compressive strains that have been measured at any time during the extraction of the previous longwalls at Tahmoor, Appin and West Cliff Collieries, for survey bays that were located outside and within 200 metres of the nearest longwall goaf edge, which has been referred to as “above solid coal”.
The histogram of the maximum observed tensile and compressive strains measured in survey bays above solid coal, for monitoring lines at Tahmoor, Appin and West Cliff Collieries, is provided in Fig. 3.6. The probability distribution functions, based on the fitted GPDs, have also been shown in this figure.
JEMENA MANAGEMENT PLAN FOR TAHMOOR LONGWALL 28
© MSEC APRIL 2014 | REPORT NUMBER MSEC646-05 | REVISION C
PAGE 13
Re
lativ
e F
requ
ency
Pro
bab
ility
De
nsity
Rel
ativ
e F
requ
ency
Pro
babi
lity
Den
sity
Fig. 3.6 Distributions of the Measured Maximum Tensile and Compressive Strains for Survey Bays Located Above Solid Coal at Tahmoor, Appin and West Cliff Collieries
The 95 % confidence levels for the maximum total strains that the individual survey bays above solid coal experienced at any time during mining at Tahmoor, Appin and West Cliff Collieries were 0.6 mm/m tensile and 0.5 mm/m compressive. The strains for the proposed longwalls are predicted to be 30 % to 50 % greater than those previously observed at these collieries and, therefore, it is expected that 95 % of the strains measured above solid coal would be less than 1.0 mm/m tensile and compressive.
The 99 % confidence levels for the maximum total strains that the individual survey bays above solid coal experienced at any time during mining at Tahmoor, Appin and West Cliff Collieries were 0.9 mm/m tensile and compressive. Similarly, it is expected that 99 % of the strains measured above solid coal adjacent to the proposed longwalls would be less than 1.5 mm/m tensile and compressive.
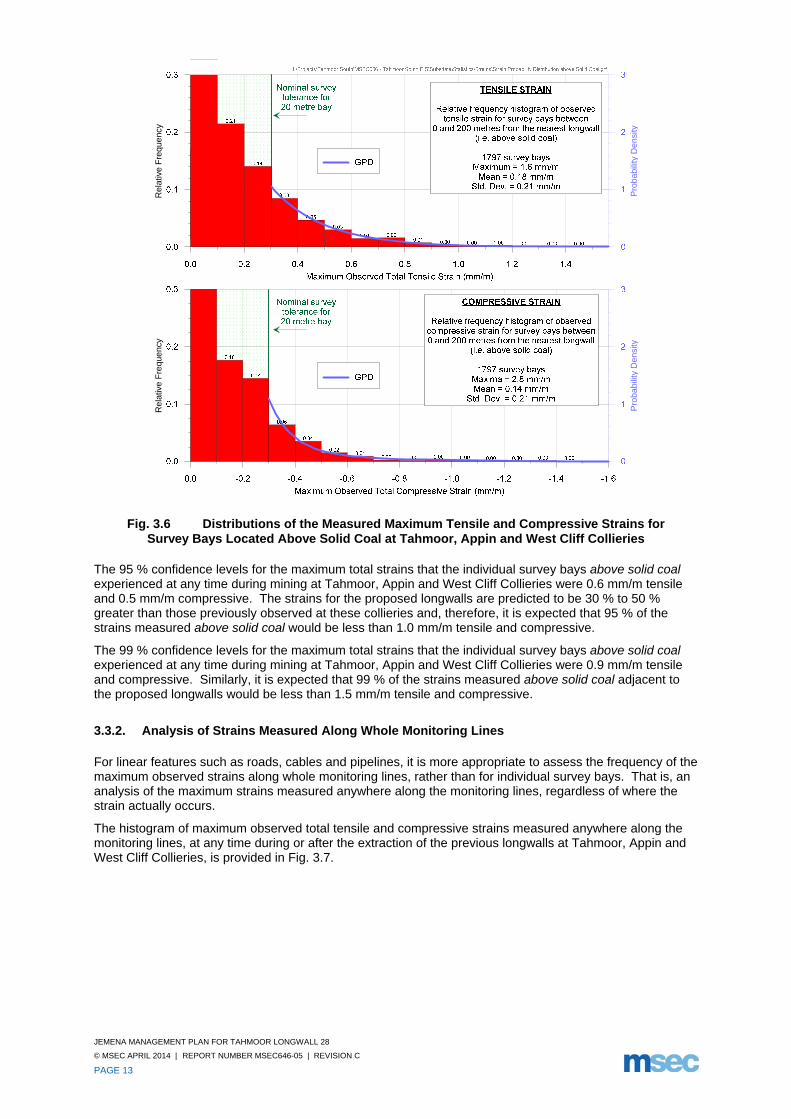
3.3.2. Analysis of Strains Measured Along Whole Monitoring Lines
For linear features such as roads, cables and pipelines, it is more appropriate to assess the frequency of the maximum observed strains along whole monitoring lines, rather than for individual survey bays. That is, an analysis of the maximum strains measured anywhere along the monitoring lines, regardless of where the strain actually occurs.
The histogram of maximum observed total tensile and compressive strains measured anywhere along the monitoring lines, at any time during or after the extraction of the previous longwalls at Tahmoor, Appin and West Cliff Collieries, is provided in Fig. 3.7.
JEMENA MANAGEMENT PLAN FOR TAHMOOR LONGWALL 28
© MSEC APRIL 2014 | REPORT NUMBER MSEC646-05 | REVISION C
PAGE 14
0.0 -0.5 -1.0 -1.5 -2.0 -2.5 -3.0 -3.5 -4.0 -4.5 -5.0 -5.5 -6.0 -6.5 -7.0
Maximum Observed Total Compressive Strain Along Monitoring Line (mm/m)
0
5
10
15
20
25
30
122
32
46
3
79
86
0.0 0.5 1.0 1.5 2.0 2.5 3.0 3.5 4.0 4.5 5.0 5.5 6.0 6.5 7.0
Maximum Observed Total Tensile Strain Along Monitoring Lines (mm/m)
0
5
10
15
20
25
30
1315
14
6
31
TENSILE STRAINFrequency histogram of observedtotal tensile strain for survey lines
with marks located above the current orpreviously extracted longwalls
52 monitoring linesMaximum = 3.4 mm/m
Mean = 1.0 mm/mStd. Dev. = 0.63 mm/m
COMPRESSIVE STRAIN
Frequency histogram of observedtotal compressive strain for survey lineswith marks located above the current or
previously extracted longwalls
52 monitoring linesMaximum = 6.6 mm/m
Mean = 2.2 mm/mStd. Dev. = 1.5 mm/m
Nominal surveytolerance for20 metre bay
Nominal surveytolerance for20 metre bay
I:\Projects\Tahmoor South\MSEC606 - Tahmoor South EIS\Subsdata\Statistics\Strains\Strain Probability Distribution along Lines.grf
Fig. 3.7 Distributions of Measured Maximum Tensile and Compressive Strains Anywhere along the Monitoring Lines at Tahmoor, Appin and West Cliff Collieries
It can be seen from Fig. 3.7, that 42 of the 52 monitoring lines (i.e. 92 % of the total) at Tahmoor, Appin and West Cliff Collieries had recorded maximum total tensile strains of 2.0 mm/m, or less. The strains for the proposed longwalls are predicted to be 30 % to 50 % greater than those previously observed at these collieries and, therefore, it is expected that 92 % of the monitoring lines above the proposed longwalls would experience maximum tensile strains of 3.0 mm/m, or less.
It can also be seen, that 45 of the 52 monitoring lines (i.e. 87 % of the total) at Tahmoor, Appin and West Cliff Collieries had recorded maximum total compressive strains of 4.0 mm/m, or less. The strains for the proposed longwalls are predicted to be 30 % to 50 % greater than those previously observed at these collieries and, therefore, it is expected that 87 % of the monitoring lines above the proposed longwalls would experience maximum compressive strains of 6.0 mm/m, or less.
3.4. Predicted and Observed Valley Closure across creeks
A number of bridges and culverts above Longwall 28 carry road transport over Myrtle Creek, Redbank Creek and other watercourses. Predictions of valley closure and upsidence at each of these features are provided later in this Management Plan.
A comparison between predicted and observed valley closure movements is provided below.
A map of monitoring lines across Myrtle Creek and a small creek that crosses the Main Southern Railway (called the Skew Culvert) is shown in Fig. 3.8.
JEMENA MANAGEMENT PLAN FOR TAHMOOR LONGWALL 28
© MSEC APRIL 2014 | REPORT NUMBER MSEC646-05 | REVISION C
PAGE 15
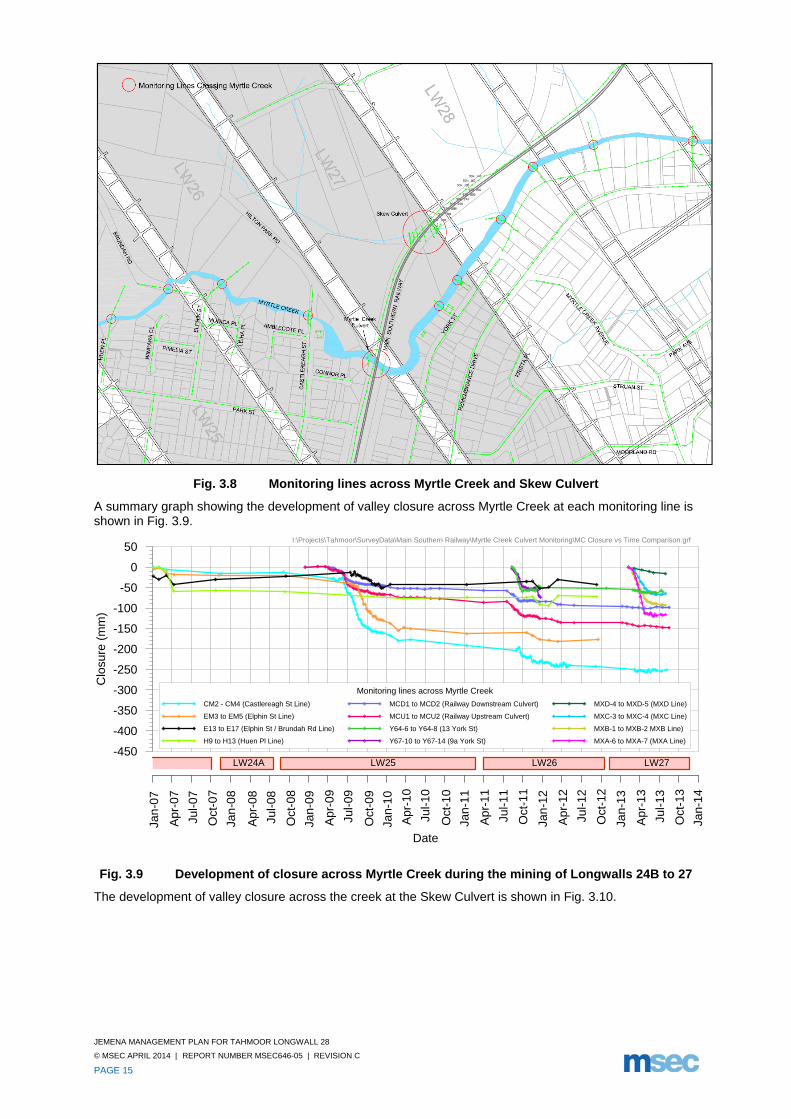
Fig. 3.8 Monitoring lines across Myrtle Creek and Skew Culvert
A summary graph showing the development of valley closure across Myrtle Creek at each monitoring line is shown in Fig. 3.9.
Jan-
07
Apr
-07
Jul-0
7
Oct
-07
Jan
-08
Apr
-08
Jul-0
8
Oct
-08
Jan-
09
Apr
-09
Jul-0
9
Oct
-09
Jan-
10
Apr
-10
Jul-1
0
Oct
-10
Jan-
11
Apr
-11
Jul-1
1
Oct
-11
Jan-
12
Apr
-12
Jul-1
2
Oct
-12
Jan-
13
Apr
-13
Jul-1
3
Oct
-13
Jan-
14
Date
-450
-400
-350
-300
-250
-200
-150
-100
-50
0
50
Clo
sure
(m
m)
LW27LW25 LW26LW24A
Monitoring lines across Myrtle Creek
CM2 - CM4 (Castlereagh St Line)
EM3 to EM5 (Elphin St Line)
E13 to E17 (Elphin St / Brundah Rd Line)
H9 to H13 (Huen Pl Line)
MCD1 to MCD2 (Railway Downstream Culvert)
MCU1 to MCU2 (Railway Upstream Culvert)
Y64-6 to Y64-8 (13 York St)
Y67-10 to Y67-14 (9a York St)
MXD-4 to MXD-5 (MXD Line)
MXC-3 to MXC-4 (MXC Line)
MXB-1 to MXB-2 MXB Line)
MXA-6 to MXA-7 (MXA Line)
I:\Projects\Tahmoor\SurveyData\Main Southern Railway\Myrtle Creek Culvert Monitoring\MC Closure vs Time Comparison.grf
Fig. 3.9 Development of closure across Myrtle Creek during the mining of Longwalls 24B to 27
The development of valley closure across the creek at the Skew Culvert is shown in Fig. 3.10.

JEMENA MANAGEMENT PLAN FOR TAHMOOR LONGWALL 28
© MSEC APRIL 2014 | REPORT NUMBER MSEC646-05 | REVISION C
PAGE 16
Fig. 3.10 Development of closure across Skew Culvert during the mining of Longwalls 26 and 27
A summary of predicted and observed valley closure across Myrtle Creek is provided in Table 3.3. The predictions are consistent with those provided in Report No. MSEC355, in support of Tahmoor Colliery’s SMP application to extract longwalls 27 to 30.
Table 3.3 Predicted and Observed Incremental Valley Closure across Myrtle Creek and Skew Culvert at monitoring lines
Location Category
Predicted and Observed Valley Closure due to Mining of Each Longwall (mm)
Due to LW24 Due to LW25 Due to LW26 Due to LW27
Castlereagh St (Pegs CM2 to CM4)
Predicted 30 55 45 25
Observed 12 179 52 8
Elphin-Myrtle (Pegs EM3 to EM5)
Predicted 60 70 40 -
Observed 21 142 22 -
Elphin St / Brundah Rd (Pegs E13 to E17)
Predicted 75 75 30 -
Observed 0 21 6 -
Huen Pl (Pegs H9 to H13)
Predicted 60 35 15 -
Observed 58 15 20 -
Main Southern Railway Upstream (MCU1 to MCU4)
Downstream (MCD1 to MCD4)
Predicted 15 30 30 15
Observed -
57 (d/s) to 86 (u/s)
36 (d/s) to 50 (u/s)
5 (d/s) to 12 (u/s)
Skew Culvert (8 cross-sections)
Predicted < 5 10 25 25
Observed - -
21 to 60 (average 36)
8 to 36 (average 21)
13 York St (Pegs Y64-6 to Y64-8)
Predicted - - 65 50
Observed - - 51 9
9a York St (Pegs Y67-10 to Y67-14)
Predicted - - 85 85
Observed - - 73 No access
MXA Line (Pegs MXA-6 to MXA-7)
Predicted - - - 150
Observed - - - 116
JEMENA MANAGEMENT PLAN FOR TAHMOOR LONGWALL 28
© MSEC APRIL 2014 | REPORT NUMBER MSEC646-05 | REVISION C
PAGE 17
Location Category Predicted and Observed Valley Closure due
to Mining of Each Longwall (mm)
MXB Line (Pegs MXB-1 to MXB-2)
Predicted - - - 170
Observed - - - 93
MXC Line (Pegs MXC-3 to MXC-4)
Predicted - - - 150
Observed - - - 64
MXD Line (Pegs MXD-4 to MXD-5)
Predicted - - - 50
Observed - - - 16
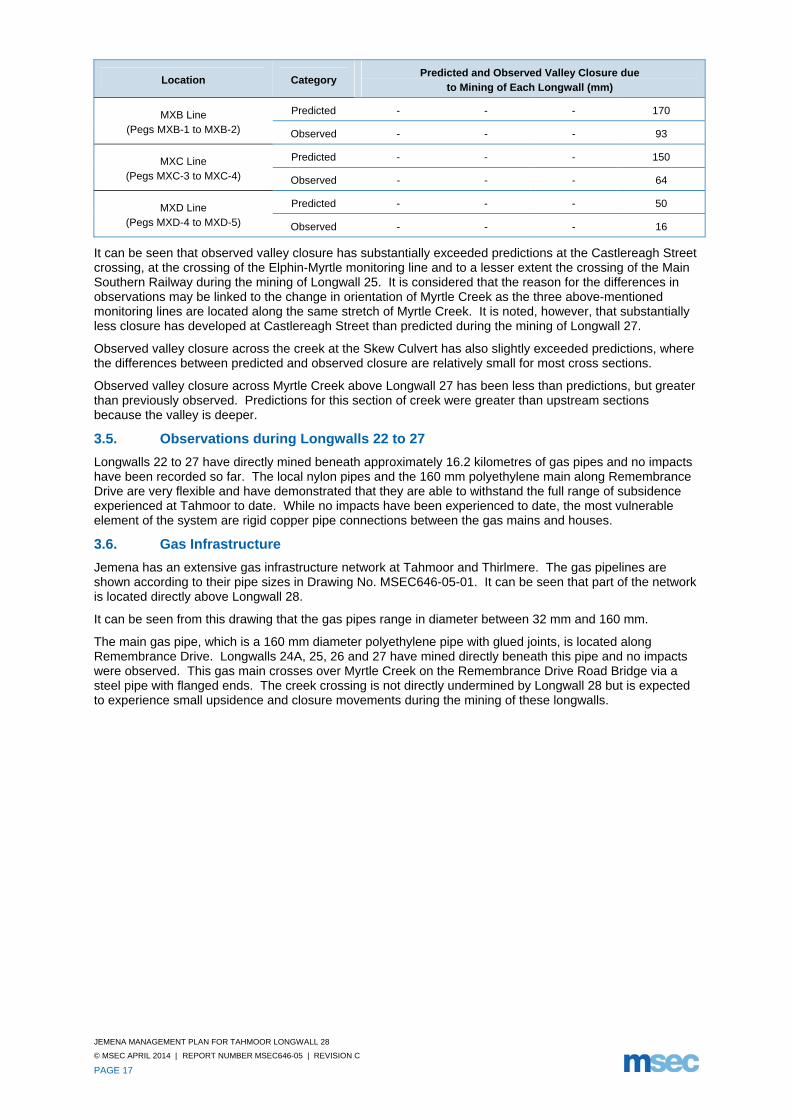
It can be seen that observed valley closure has substantially exceeded predictions at the Castlereagh Street crossing, at the crossing of the Elphin-Myrtle monitoring line and to a lesser extent the crossing of the Main Southern Railway during the mining of Longwall 25. It is considered that the reason for the differences in observations may be linked to the change in orientation of Myrtle Creek as the three above-mentioned monitoring lines are located along the same stretch of Myrtle Creek. It is noted, however, that substantially less closure has developed at Castlereagh Street than predicted during the mining of Longwall 27.
Observed valley closure across the creek at the Skew Culvert has also slightly exceeded predictions, where the differences between predicted and observed closure are relatively small for most cross sections.
Observed valley closure across Myrtle Creek above Longwall 27 has been less than predictions, but greater than previously observed. Predictions for this section of creek were greater than upstream sections because the valley is deeper.
3.5. Observations during Longwalls 22 to 27
Longwalls 22 to 27 have directly mined beneath approximately 16.2 kilometres of gas pipes and no impacts have been recorded so far. The local nylon pipes and the 160 mm polyethylene main along Remembrance Drive are very flexible and have demonstrated that they are able to withstand the full range of subsidence experienced at Tahmoor to date. While no impacts have been experienced to date, the most vulnerable element of the system are rigid copper pipe connections between the gas mains and houses.
3.6. Gas Infrastructure
Jemena has an extensive gas infrastructure network at Tahmoor and Thirlmere. The gas pipelines are shown according to their pipe sizes in Drawing No. MSEC646-05-01. It can be seen that part of the network is located directly above Longwall 28.
It can be seen from this drawing that the gas pipes range in diameter between 32 mm and 160 mm.
The main gas pipe, which is a 160 mm diameter polyethylene pipe with glued joints, is located along Remembrance Drive. Longwalls 24A, 25, 26 and 27 have mined directly beneath this pipe and no impacts were observed. This gas main crosses over Myrtle Creek on the Remembrance Drive Road Bridge via a steel pipe with flanged ends. The creek crossing is not directly undermined by Longwall 28 but is expected to experience small upsidence and closure movements during the mining of these longwalls.
JEMENA MANAGEMENT PLAN FOR TAHMOOR LONGWALL 28
© MSEC APRIL 2014 | REPORT NUMBER MSEC646-05 | REVISION C
PAGE 18
3.7. Hazard Identification
The hazard associated with gas infrastructure is that it may be damaged as a result of mine subsidence impacts. This damage could involve rupturing of pipes and hence become a dangerous hazard to the public.
3.7.1. Major Gas Pipeline along Remembrance Drive
The main gas pipeline is a 160 mm diameter polyethylene pipe, which is laid along the eastern side of Remembrance Drive. The pipeline has experienced no impacts during the mining of Longwalls 24A to 27.
During this time, ground surveys have measured maximum subsidence of approximately 960 mm with two sites of increased compressive ground strains:
A maximum compressive ground strain of approximately 3.0 mm/m over a 37 metre bay between Pegs R1 and RE1 along Remembrance Drive at the intersection with Thirlmere Way above Longwall 25. If all of the compressive strain is concentrated at one location, this would equate to a strain of approximately 6 mm/m over a 20 metre bay. A noticeable bump in the pavement and roundabout was also observed at this site. Regular gas patrols were undertaken in response to the observations though no impacts were observed.
A maximum compressive ground strain of approximately 3.7 mm/m over a 20 metre bay along Remembrance Drive above Longwall 26 between Pegs RE28 and RE29. A bump was observed in the road pavement and concrete footpath. Regular gas patrols were undertaken in response to the observations though no impacts were observed.
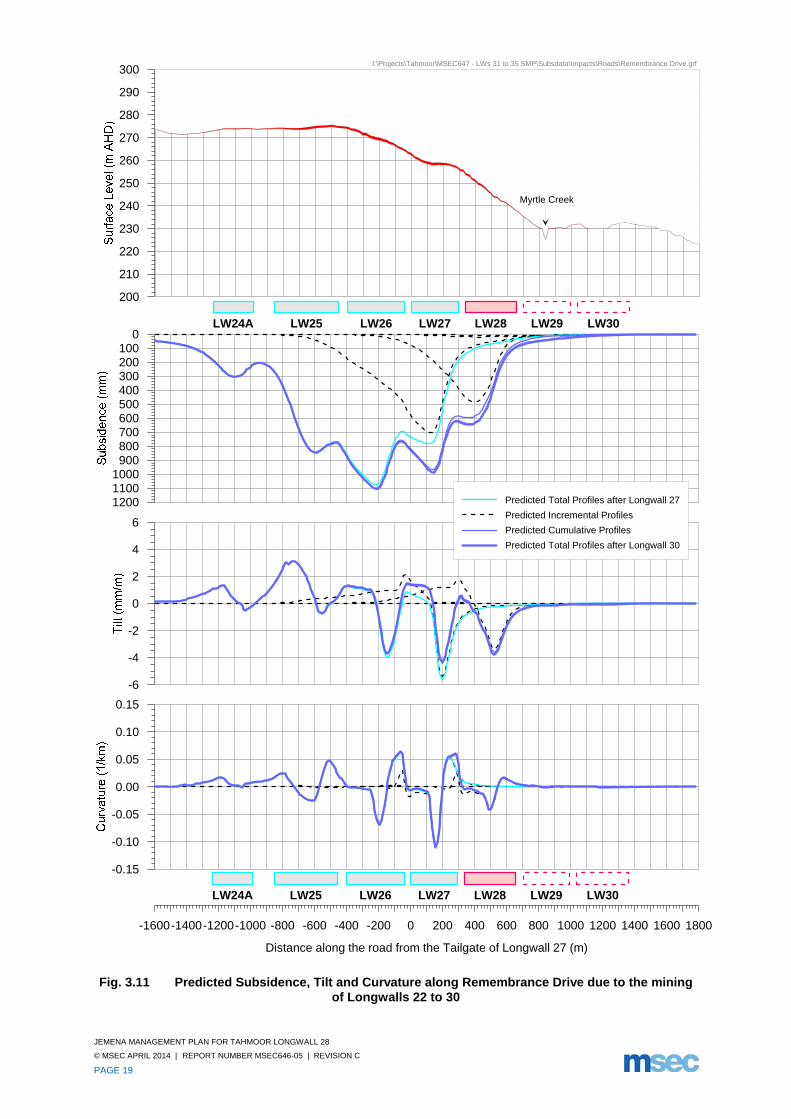
The pipeline is expected to experience additional subsidence movements during the mining of Longwall 28, with only minor additional movements during the mining of Longwalls 29 and 30. Predicted subsidence, tilt and curvature due to the mining of Longwalls 27 to 30 are shown in Fig. 3.11.
The experience of mining beneath Longwalls 24A to 27 provides confidence that the pipeline can accommodate typical mining-induced strains without adverse impacts, and protective works should not be necessary. While the pipelines are quite flexible, the 160 mm diameter pipes are connected with socket joints that are glued together. It is unlikely that these joints will be adversely affected by the proposed longwalls.
The likelihood of impacts occurring to the pipeline is therefore assessed as VERY RARE.
Given that this pipe is the main gas pipeline, any leakage of the pipeline would require emergency procedures, and since there is significant surface infrastructure in the vicinity of the pipeline, the consequence of damage to the pipeline is assessed as VERY SEVERE.
The level of risk for this pipeline is therefore assessed as VERY RARE / VERY SEVERE MODERATE.
Please refer to Section 3.7.4 for an assessment on the steel gas pipe crossing over Myrtle Creek on the Remembrance Drive Road Bridge.
3.7.2. Local Gas Pipeline
Remaining gas pipes are generally 32 mm diameter nylon pipes, which are located along most of the urban streets of Tahmoor and Thirlmere. These smaller diameter local reticulation pipes should be sufficiently flexible to accommodate the predicted levels of strain. It is noted that no impacts were observed during the extraction of Longwalls 22 to 27. This includes no impacts at a site on Abelia Street, where a large measured ground strain of 6.5 mm/m (over a 22 metre bay length) was observed between Pegs A12 and A13, coinciding with a measured vertical bump in the subsidence profile and an observed hump in the road pavement.
It is noted that a ground survey line has already been installed and monitored along Bridge Street, extending to the intersection with Redbank Place. This survey line covers the upstream part of a 32 mm nylon pipe on Bridge Street, which lies within the area of predicted subsidence for future Longwall 30.
The likelihood of damage occurring to these small pipes is therefore assessed as VERY RARE. The consequence of damage to these pipes is less than the main gas pipelines that run along Remembrance Drive and Thirlmere Way due to their size. The consequence of damage to these pipelines is therefore assessed as MODERATE.
The level of risk for this pipeline is therefore assessed as:- VERY RARE / MODERATE LOW.
JEMENA MANAGEMENT PLAN FOR TAHMOOR LONGWALL 28
© MSEC APRIL 2014 | REPORT NUMBER MSEC646-05 | REVISION C
PAGE 19
-1600-1400-1200-1000 -800 -600 -400 -200 0 200 400 600 800 1000 1200 1400 1600 1800
Distance along the road from the Tailgate of Longwall 27 (m)
-0.15
-0.10
-0.05
0.00
0.05
0.10
0.15
LW26LW25LW24A LW27 LW28 LW29 LW30
-6
-4
-2
0
2
4
6
120011001000900800700600500400300200100
0
Predicted Total Profiles after Longwall 27
Predicted Incremental Profiles
Predicted Cumulative Profiles
Predicted Total Profiles after Longwall 30
200
210
220
230
240
250
260
270
280
290
300
LW24A LW26LW25 LW27 LW28 LW29 LW30
I:\Projects\Tahmoor\MSEC647 - LWs 31 to 35 SMP\Subsdata\Impacts\Roads\Remembrance Drive.grf
Myrtle Creek
Fig. 3.11 Predicted Subsidence, Tilt and Curvature along Remembrance Drive due to the mining of Longwalls 22 to 30
JEMENA MANAGEMENT PLAN FOR TAHMOOR LONGWALL 28
© MSEC APRIL 2014 | REPORT NUMBER MSEC646-05 | REVISION C
PAGE 20
3.7.3. Gas Mains at Castlereagh Street Creek Crossing
Longwall 25 mined directly beneath a 32 mm diameter nylon gas main that crosses Myrtle Creek at Castlereagh Street and no impacts were observed. The gas main also experienced additional movement during the mining of Longwall 26 with no impact. Ground surveys have measured valley closure of approximately 250 mm at this creek crossing. Less than 10 mm of valley closure was observed during the mining of Longwall 27.
Given the offset distance of Longwall 28 from the Myrtle Creek gas pipe crossing at Castlereagh Street and experiences during the mining of previous longwalls, it is considered VERY UNLIKELY that the replaced pipe crossing will experience impacts due to mine subsidence movements during the mining of Longwall 28.
The level of risk is therefore assessed to be VERY RARE / MODERATE LOW for Longwall 28 only.
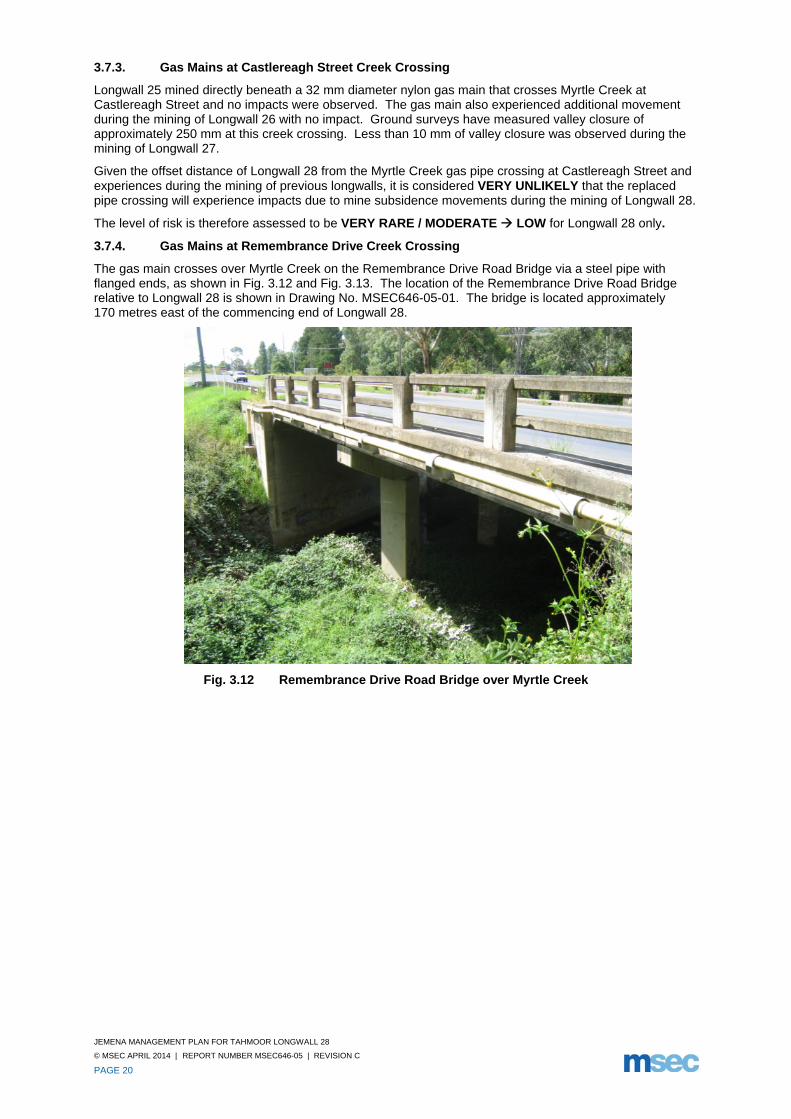
3.7.4. Gas Mains at Remembrance Drive Creek Crossing
The gas main crosses over Myrtle Creek on the Remembrance Drive Road Bridge via a steel pipe with flanged ends, as shown in Fig. 3.12 and Fig. 3.13. The location of the Remembrance Drive Road Bridge relative to Longwall 28 is shown in Drawing No. MSEC646-05-01. The bridge is located approximately 170 metres east of the commencing end of Longwall 28.
Fig. 3.12 Remembrance Drive Road Bridge over Myrtle Creek
JEMENA MANAGEMENT PLAN FOR TAHMOOR LONGWALL 28
© MSEC APRIL 2014 | REPORT NUMBER MSEC646-05 | REVISION C
PAGE 21
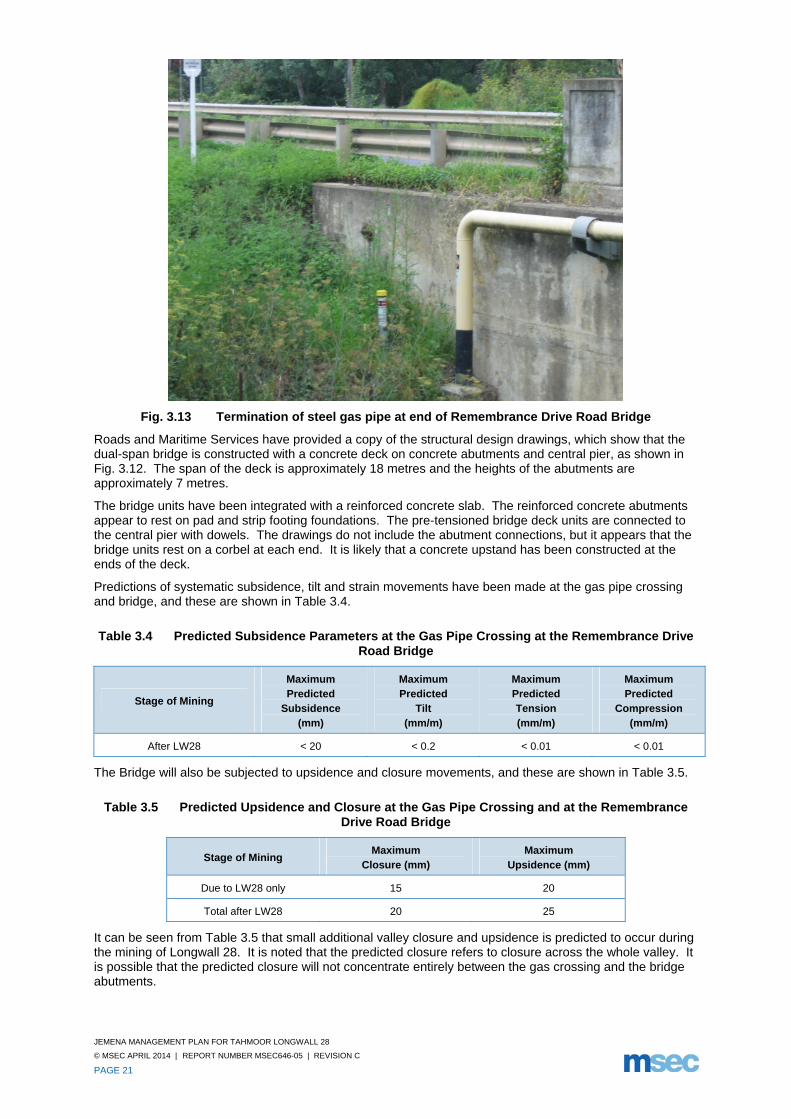
Fig. 3.13 Termination of steel gas pipe at end of Remembrance Drive Road Bridge
Roads and Maritime Services have provided a copy of the structural design drawings, which show that the dual-span bridge is constructed with a concrete deck on concrete abutments and central pier, as shown in Fig. 3.12. The span of the deck is approximately 18 metres and the heights of the abutments are approximately 7 metres.
The bridge units have been integrated with a reinforced concrete slab. The reinforced concrete abutments appear to rest on pad and strip footing foundations. The pre-tensioned bridge deck units are connected to the central pier with dowels. The drawings do not include the abutment connections, but it appears that the bridge units rest on a corbel at each end. It is likely that a concrete upstand has been constructed at the ends of the deck.
Predictions of systematic subsidence, tilt and strain movements have been made at the gas pipe crossing and bridge, and these are shown in Table 3.4.
Table 3.4 Predicted Subsidence Parameters at the Gas Pipe Crossing at the Remembrance Drive Road Bridge
Stage of Mining
Maximum Predicted
Subsidence (mm)
Maximum Predicted
Tilt (mm/m)
Maximum Predicted Tension (mm/m)
Maximum Predicted
Compression (mm/m)
After LW28 < 20 < 0.2 < 0.01 < 0.01
The Bridge will also be subjected to upsidence and closure movements, and these are shown in Table 3.5.
Table 3.5 Predicted Upsidence and Closure at the Gas Pipe Crossing and at the Remembrance Drive Road Bridge
Stage of Mining Maximum
Closure (mm) Maximum
Upsidence (mm)
Due to LW28 only 15 20
Total after LW28 20 25
It can be seen from Table 3.5 that small additional valley closure and upsidence is predicted to occur during the mining of Longwall 28. It is noted that the predicted closure refers to closure across the whole valley. It is possible that the predicted closure will not concentrate entirely between the gas crossing and the bridge abutments.
JEMENA MANAGEMENT PLAN FOR TAHMOOR LONGWALL 28
© MSEC APRIL 2014 | REPORT NUMBER MSEC646-05 | REVISION C
PAGE 22
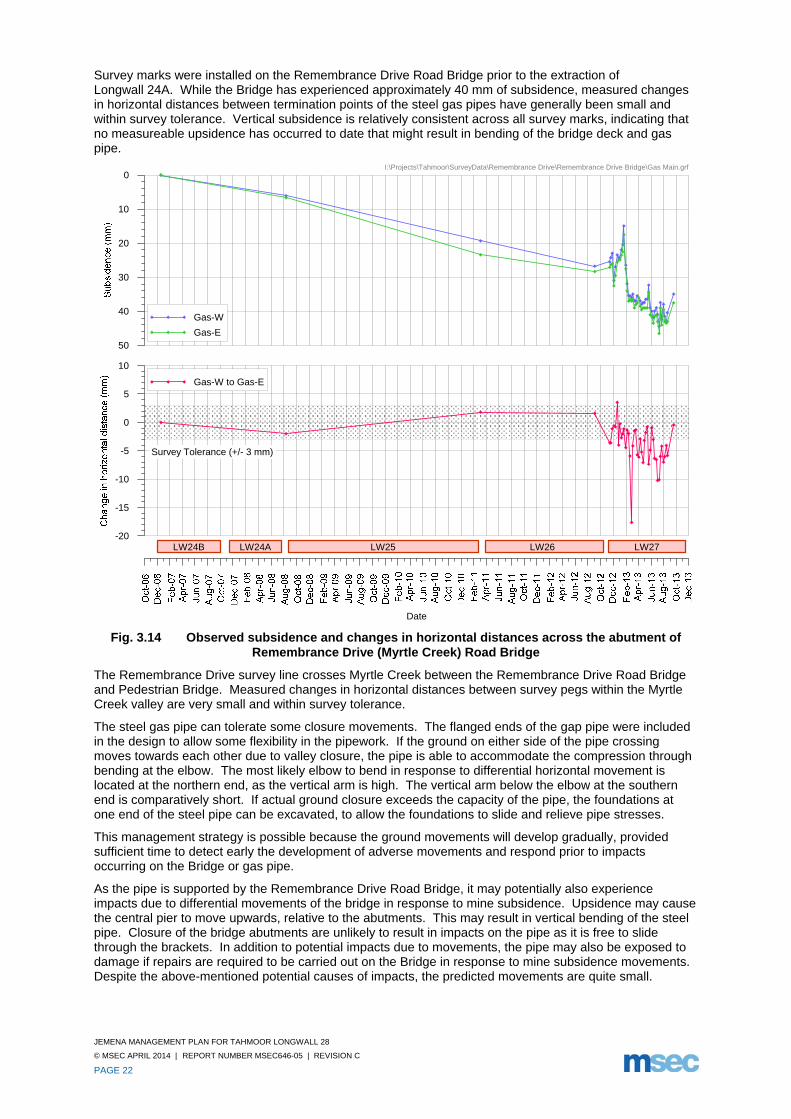
Survey marks were installed on the Remembrance Drive Road Bridge prior to the extraction of Longwall 24A. While the Bridge has experienced approximately 40 mm of subsidence, measured changes in horizontal distances between termination points of the steel gas pipes have generally been small and within survey tolerance. Vertical subsidence is relatively consistent across all survey marks, indicating that no measureable upsidence has occurred to date that might result in bending of the bridge deck and gas pipe.
Date
-20
-15
-10
-5
0
5
10
LW26LW24B LW25 LW27LW24A
Gas-W to Gas-E
50
40
30
20
10
0
Gas-W
Gas-E
Survey Tolerance (+/- 3 mm)
I:\Projects\Tahmoor\SurveyData\Remembrance Drive\Remembrance Drive Bridge\Gas Main.grf
Fig. 3.14 Observed subsidence and changes in horizontal distances across the abutment of Remembrance Drive (Myrtle Creek) Road Bridge
The Remembrance Drive survey line crosses Myrtle Creek between the Remembrance Drive Road Bridge and Pedestrian Bridge. Measured changes in horizontal distances between survey pegs within the Myrtle Creek valley are very small and within survey tolerance.
The steel gas pipe can tolerate some closure movements. The flanged ends of the gap pipe were included in the design to allow some flexibility in the pipework. If the ground on either side of the pipe crossing moves towards each other due to valley closure, the pipe is able to accommodate the compression through bending at the elbow. The most likely elbow to bend in response to differential horizontal movement is located at the northern end, as the vertical arm is high. The vertical arm below the elbow at the southern end is comparatively short. If actual ground closure exceeds the capacity of the pipe, the foundations at one end of the steel pipe can be excavated, to allow the foundations to slide and relieve pipe stresses.
This management strategy is possible because the ground movements will develop gradually, provided sufficient time to detect early the development of adverse movements and respond prior to impacts occurring on the Bridge or gas pipe.
As the pipe is supported by the Remembrance Drive Road Bridge, it may potentially also experience impacts due to differential movements of the bridge in response to mine subsidence. Upsidence may cause the central pier to move upwards, relative to the abutments. This may result in vertical bending of the steel pipe. Closure of the bridge abutments are unlikely to result in impacts on the pipe as it is free to slide through the brackets. In addition to potential impacts due to movements, the pipe may also be exposed to damage if repairs are required to be carried out on the Bridge in response to mine subsidence movements. Despite the above-mentioned potential causes of impacts, the predicted movements are quite small.
JEMENA MANAGEMENT PLAN FOR TAHMOOR LONGWALL 28
© MSEC APRIL 2014 | REPORT NUMBER MSEC646-05 | REVISION C
PAGE 23
By way of comparison, impacts were not observed on the Castlereagh Street Bridge until 23 September 2011 when the Longwall 26 face was approximately square with the Bridge and approximately 200 mm of valley closure had been observed.
Prior to the decision to shorten the commencing ends of Longwall 29 and 30, it had been planned to undertake detailed investigations and potentially undertake mitigation works on the Bridge to reduce the potential for mine subsidence impacts on the Bridge. The shortening of Longwalls 29 and 30, however, substantially reduces the potential for impacts on the Bridge and the steel gas pipe. In light of the shortening, it is planned to manage potential impacts on the Bridge and the gas pipe through monitoring and, if necessary, response measures.
Given the offset distance of the pipe crossing and the Bridge from Longwall 28 and the anticipated small amount of movement that is expected to occur to the pipe and the Bridge, the likelihood of impact on the steel gas pipe, is assessed as VERY RARE. The consequence of impacts on the steel gas pipe is assessed as VERY SEVERE. The risk is therefore assessed as VERY RARE / VERY SEVERE MODERATE.
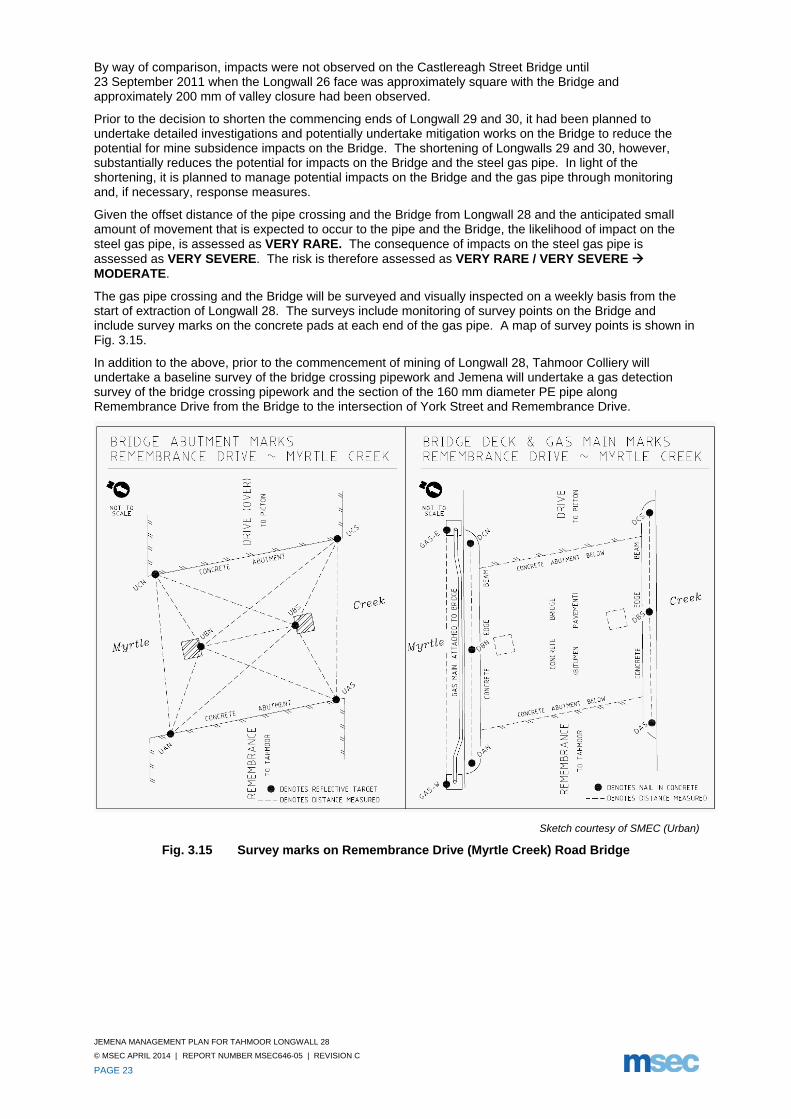
The gas pipe crossing and the Bridge will be surveyed and visually inspected on a weekly basis from the start of extraction of Longwall 28. The surveys include monitoring of survey points on the Bridge and include survey marks on the concrete pads at each end of the gas pipe. A map of survey points is shown in Fig. 3.15.
In addition to the above, prior to the commencement of mining of Longwall 28, Tahmoor Colliery will undertake a baseline survey of the bridge crossing pipework and Jemena will undertake a gas detection survey of the bridge crossing pipework and the section of the 160 mm diameter PE pipe along Remembrance Drive from the Bridge to the intersection of York Street and Remembrance Drive.
Sketch courtesy of SMEC (Urban)
Fig. 3.15 Survey marks on Remembrance Drive (Myrtle Creek) Road Bridge

JEMENA MANAGEMENT PLAN FOR TAHMOOR LONGWALL 28
© MSEC APRIL 2014 | REPORT NUMBER MSEC646-05 | REVISION C
PAGE 24
3.7.5. Summary of Risk Analysis for Gas Infrastructure
A summary of the levels of risk for the gas pipes are provided in Table 3.6.
Table 3.6 Risk Analysis Matrix for Gas Infrastructure
Risk Likelihood Consequence Level of Risk
Damage to main gas pipeline on Remembrance Drive (160 mm)
VERY RARE VERY SEVERE MODERATE
Damage to local reticulation pipes VERY RARE MODERATE LOW
Castlereagh Street gas main crossing at Myrtle Creek
VERY RARE MODERATE LOW
Remembrance Drive gas main crossing at Myrtle Creek
VERY RARE VERY SEVERE MODERATE

JEMENA MANAGEMENT PLAN FOR TAHMOOR LONGWALL 28
© MSEC APRIL 2014 | REPORT NUMBER MSEC646-05 | REVISION C
PAGE 25
4.0 RISK CONTROL PROCEDURES
4.1. Gas Management Group (GMG)
The Gas Management Group (GMG) is responsible for providing advice on all technical issues relating to mine subsidence related impacts to gas infrastructure due to the mining of Longwall 28 on which decisions are made by Jemena and Tahmoor Colliery. The GMG develops and reviews this management plan, collects and analyses monitoring results, determines potential impacts and provides advice to Jemena and Tahmoor Colliery regarding appropriate actions. The members of the GMG are highlighted in Chapter 8.0 .
4.2. Avoidance and Mitigation Measures
Given the results of the risk assessment and nature of the gas infrastructure, which has been constructed with flexible materials and buried beneath the surface in urban areas, it is considered impractical and unnecessary to implement avoidance and mitigation measures to the gas infrastructure that will experience mine subsidence movements as a result of the mining of Longwall 28.
Further confidence is drawn from the experience of mining Longwalls 22 to 27, where no impacts have been observed, even where predicted subsidence movements have been exceeded.
4.3. Monitoring Plan
A number of monitoring measures will be undertaken during mining.
4.3.1. Ground Monitoring Lines
Ground surveys of level and strain distance will be conducted during mining along monitoring lines that are generally located in streets.
General Ground Monitoring along streets
As a general guide, the frequency of ground monitoring within urban areas is every 200 metres of longwall extraction for all survey marks that are located within the active subsidence zone. This includes a survey line along Bridge Street, on which a small 32 mm nylon pipe is located. The timing of surveys within rural areas is determined by the location of street monitoring lines, where a survey has been scheduled to occur when the longwall face has passed each monitoring line by approximately 200 metres.
At the completion of each longwall, surveys will be undertaken along the full length of each monitoring line expected to have experienced some subsidence movements as a result of mining the longwall.
Ground Monitoring along Remembrance Drive
Weekly surveys of level and strain distance will be undertaken along Remembrance Drive from the start of extraction of Longwall 28.
Monitoring of Remembrance Drive Bridge over Myrtle Creek
Weekly surveys of the Remembrance Drive Bridge over Myrtle Creek and the termination points of the steel gas pipe will be undertaken after the start of extraction of Longwall 28. The survey will also include tilt measurements on both sides of the elbows at each end of the pipe crossing to measure potential bending at the elbow in response to subsidence.
4.4. Visual Inspections
Visual inspections will be undertaken within the active subsidence zone during mining.
4.5. Jemena Gas Patrols
Jemena pipeline officers conduct routine gas patrols in the Tahmoor area, which can be quickly increased in frequency in response to increased subsidence, curvature or strains.
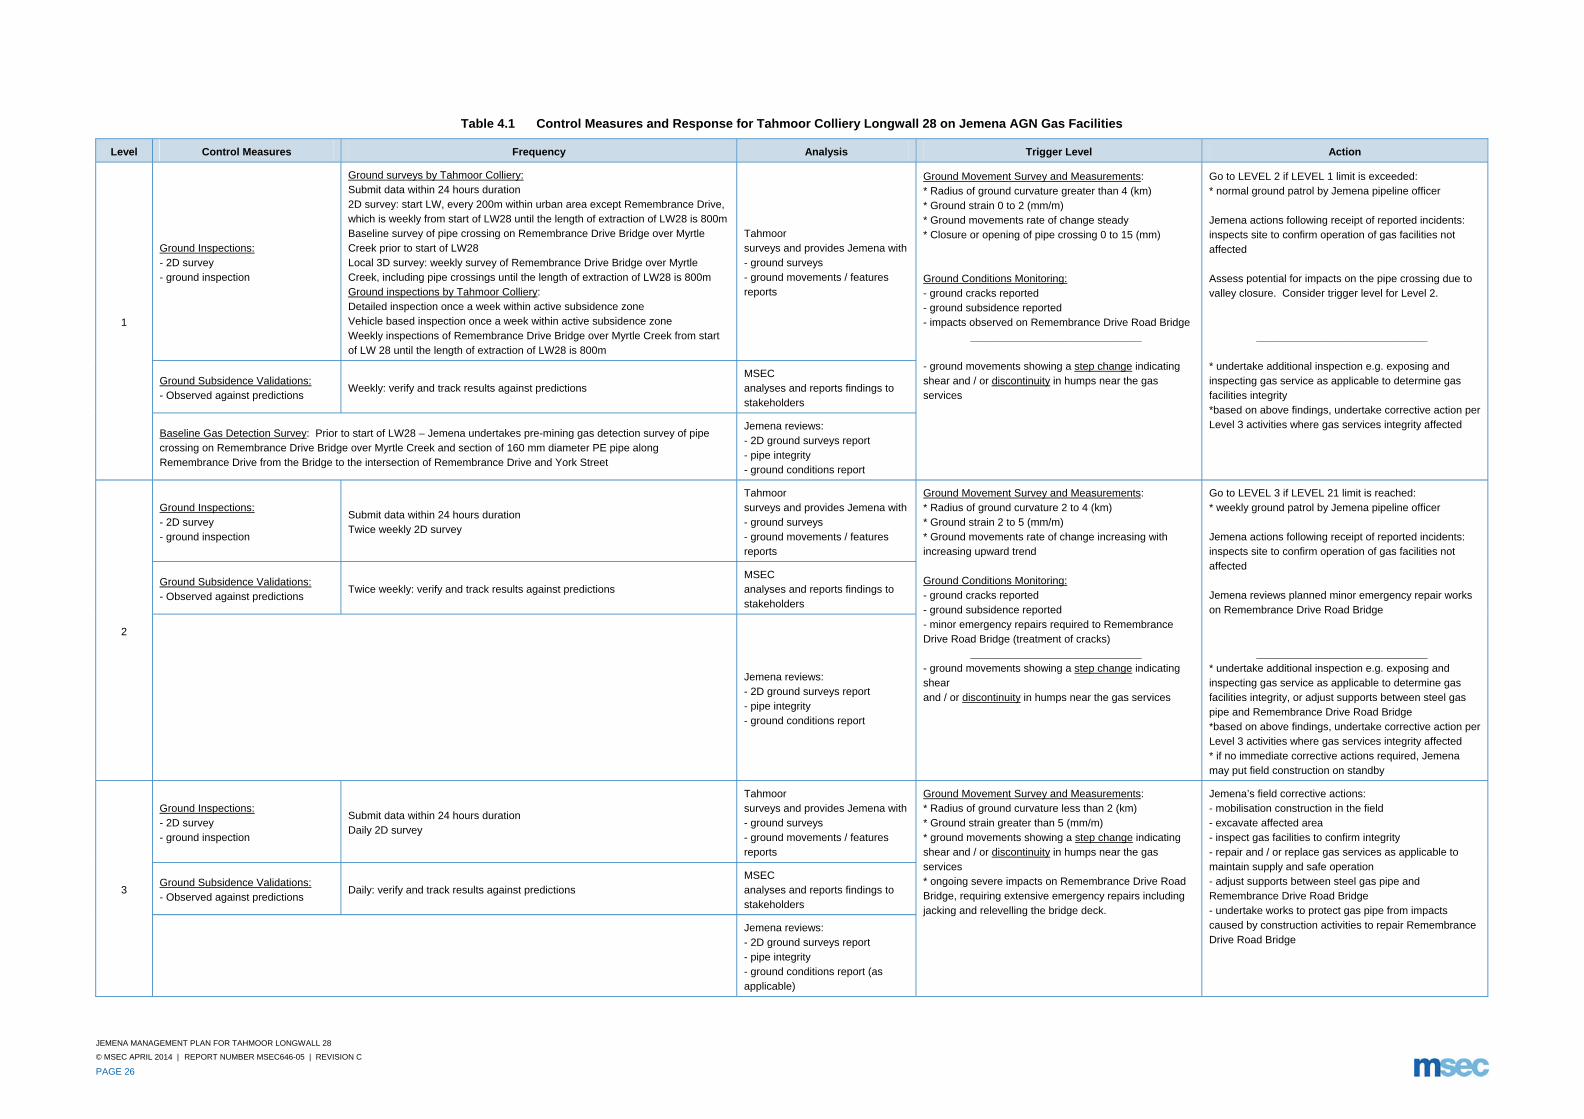
4.6. Triggers and Responses
Trigger levels have been developed by Jemena based on the capacity of the gas services to tolerate ground movements. Trigger levels for each monitoring parameter are described in Table 4.1.
JEMENA MANAGEMENT PLAN FOR TAHMOOR LONGWALL 28
© MSEC APRIL 2014 | REPORT NUMBER MSEC646-05 | REVISION C
PAGE 26
Table 4.1 Control Measures and Response for Tahmoor Colliery Longwall 28 on Jemena AGN Gas Facilities
Level Control Measures Frequency Analysis Trigger Level Action
1
Ground Inspections: - 2D survey - ground inspection
Ground surveys by Tahmoor Colliery: Submit data within 24 hours duration 2D survey: start LW, every 200m within urban area except Remembrance Drive, which is weekly from start of LW28 until the length of extraction of LW28 is 800mBaseline survey of pipe crossing on Remembrance Drive Bridge over Myrtle Creek prior to start of LW28 Local 3D survey: weekly survey of Remembrance Drive Bridge over Myrtle Creek, including pipe crossings until the length of extraction of LW28 is 800m Ground inspections by Tahmoor Colliery: Detailed inspection once a week within active subsidence zone Vehicle based inspection once a week within active subsidence zone Weekly inspections of Remembrance Drive Bridge over Myrtle Creek from start of LW 28 until the length of extraction of LW28 is 800m
Tahmoor surveys and provides Jemena with- ground surveys - ground movements / features reports
Ground Movement Survey and Measurements: * Radius of ground curvature greater than 4 (km) * Ground strain 0 to 2 (mm/m) * Ground movements rate of change steady * Closure or opening of pipe crossing 0 to 15 (mm) Ground Conditions Monitoring: - ground cracks reported - ground subsidence reported - impacts observed on Remembrance Drive Road Bridge _____________________________ - ground movements showing a step change indicating shear and / or discontinuity in humps near the gas services
Go to LEVEL 2 if LEVEL 1 limit is exceeded: * normal ground patrol by Jemena pipeline officer Jemena actions following receipt of reported incidents: inspects site to confirm operation of gas facilities not affected Assess potential for impacts on the pipe crossing due to valley closure. Consider trigger level for Level 2. _____________________________ * undertake additional inspection e.g. exposing and inspecting gas service as applicable to determine gas facilities integrity *based on above findings, undertake corrective action per Level 3 activities where gas services integrity affected
Ground Subsidence Validations: - Observed against predictions
Weekly: verify and track results against predictions MSEC analyses and reports findings to stakeholders
Baseline Gas Detection Survey: Prior to start of LW28 – Jemena undertakes pre-mining gas detection survey of pipe crossing on Remembrance Drive Bridge over Myrtle Creek and section of 160 mm diameter PE pipe along Remembrance Drive from the Bridge to the intersection of Remembrance Drive and York Street
Jemena reviews: - 2D ground surveys report - pipe integrity - ground conditions report
2
Ground Inspections: - 2D survey - ground inspection
Submit data within 24 hours duration Twice weekly 2D survey
Tahmoor surveys and provides Jemena with- ground surveys - ground movements / features reports
Ground Movement Survey and Measurements: * Radius of ground curvature 2 to 4 (km) * Ground strain 2 to 5 (mm/m) * Ground movements rate of change increasing with increasing upward trend Ground Conditions Monitoring: - ground cracks reported - ground subsidence reported - minor emergency repairs required to Remembrance Drive Road Bridge (treatment of cracks) _____________________________ - ground movements showing a step change indicating shear and / or discontinuity in humps near the gas services
Go to LEVEL 3 if LEVEL 21 limit is reached: * weekly ground patrol by Jemena pipeline officer Jemena actions following receipt of reported incidents: inspects site to confirm operation of gas facilities not affected Jemena reviews planned minor emergency repair works on Remembrance Drive Road Bridge _____________________________ * undertake additional inspection e.g. exposing and inspecting gas service as applicable to determine gas facilities integrity, or adjust supports between steel gas pipe and Remembrance Drive Road Bridge *based on above findings, undertake corrective action per Level 3 activities where gas services integrity affected * if no immediate corrective actions required, Jemena may put field construction on standby
Ground Subsidence Validations: - Observed against predictions
Twice weekly: verify and track results against predictions MSEC analyses and reports findings to stakeholders
Jemena reviews: - 2D ground surveys report - pipe integrity - ground conditions report
3
Ground Inspections: - 2D survey - ground inspection
Submit data within 24 hours duration Daily 2D survey
Tahmoor surveys and provides Jemena with- ground surveys - ground movements / features reports
Ground Movement Survey and Measurements: * Radius of ground curvature less than 2 (km) * Ground strain greater than 5 (mm/m) * ground movements showing a step change indicating shear and / or discontinuity in humps near the gas services * ongoing severe impacts on Remembrance Drive Road Bridge, requiring extensive emergency repairs including jacking and relevelling the bridge deck.
Jemena’s field corrective actions: - mobilisation construction in the field - excavate affected area - inspect gas facilities to confirm integrity - repair and / or replace gas services as applicable to maintain supply and safe operation - adjust supports between steel gas pipe and Remembrance Drive Road Bridge - undertake works to protect gas pipe from impacts caused by construction activities to repair Remembrance Drive Road Bridge
Ground Subsidence Validations: - Observed against predictions
Daily: verify and track results against predictions MSEC analyses and reports findings to stakeholders
Jemena reviews: - 2D ground surveys report - pipe integrity - ground conditions report (as applicable)

JEMENA MANGEMENT PLAN FOR TAHMOOR LONGWALL 28
© MSEC APRIL 2014 | REPORT NUMBER MSEC646-05 | REVISION C
PAGE 27
5.0 GMG MEETINGS
The monitoring of natural surface features and surface infrastructure which forms an integral part of this Management Plan will be carried out by Tahmoor Colliery. GMG Meetings will be held between Tahmoor Colliery and Jemena for discussion and resolution of issues raised in the operation of the Management Plan.
GMG Meetings will discuss any incidents reported in relation to the relevant surface feature, the progress of mining, the degree of mine subsidence that has occurred, and comparisons between observed and predicted ground movements.
It will be the responsibility of the meeting representatives to determine whether the incidents reported are due to the impacts of mine subsidence, and what action will be taken in response.
In the event that a significant risk is identified for a particular surface feature, any party may call an emergency GMG Meeting, with one day’s notice, to discuss proposed actions and to keep other parties informed of developments in the monitoring of the surface feature.
6.0 AUDIT AND REVIEW
All Management Plans within this document have been agreed between parties. The Management Plan will be reviewed following extraction of each longwall.
Should an audit of the Management Plan be required during that period, an auditor shall be appointed by the Tahmoor Colliery to review the operation of the Management Plan and report at the next scheduled Plan Review Meeting.
Other factors that may require a review of the Management Plan are:-
Observation of greater impacts on surface features due to mine subsidence than was previously expected.
Observation of fewer impacts or no impacts on surface features due to mine subsidence than was previously expected.
Observation of significant variation between observed and predicted subsidence.
7.0 RECORD KEEPING
Tahmoor Colliery will keep and distribute minutes of any GMG Meeting.

JEMENA MANAGEMENT PLAN FOR TAHMOOR LONGWALL 28
© MSEC APRIL 2014 | REPORT NUMBER MSEC646-05 | REVISION C
PAGE 28
8.0 CONTACT LIST
Organisation Contact Phone Email / Mail Fax
Jemena Control Centre Emergency Contact 131909
Jemena Meng Cheng* (02) 9397 9200 0408 469 091
NSW Department of Trade and Investment, Regional Infrastructure and Services, Division of Resources and
Energy (DTIRIS)
Phil Steuart (02) 4931 6648 [email protected] (02) 4931 6790
Gang Li (02) 4931 6644 0409 227 986
[email protected] (02) 4931 6790
Ray Ramage (02) 4931 6645 0402 477 620
[email protected] (02) 4931 6790
Mine Subsidence Board Darren Bullock (02) 4577 1967 0425 275 567
[email protected] (02) 4677 2040
Mine Subsidence Engineering Consultants (MSEC) Daryl Kay* (02) 9413 3777 0416 191 304
[email protected] (02) 9413 3822
Glencore Tahmoor Coal – Environment and Community Manager
Ian Sheppard (02) 4640 0156 0408 444 257
[email protected] (02) 4640 0140
Glencore Tahmoor Coal – Community Coordinator
Belinda Treverrow* (02) 4640 0133 0428 260 899
[email protected] (02) 4640 0140
* denotes member of Gas Management Group

JEMENA MANAGEMENT PLAN FOR TAHMOOR LONGWALL 28
© MSEC APRIL 2014 | REPORT NUMBER MSEC646-05 | REVISION C
PAGE 29
APPENDIX A. DRAWINGS