Tack Coat Presentation...Tack Coat Performance and Materials Study Bryan Wilson, Arif Chowdhury,...
57
Tack Coat Performance and Materials Study Bryan Wilson, Arif Chowdhury, Sheng Hu (TTI) Sang-Soo Kim, Munir Nazzal (OU) Ala Abbas (Akron) State Job #135097 Final Research Results July 10, 2017
Transcript of Tack Coat Presentation...Tack Coat Performance and Materials Study Bryan Wilson, Arif Chowdhury,...

Tack Coat Performance and Materials Study
Bryan Wilson, Arif Chowdhury, Sheng Hu (TTI)Sang-Soo Kim, Munir Nazzal (OU)
Ala Abbas (Akron)
State Job #135097Final Research Results
July 10, 2017

Presentation Overview• Introduction• Methodology and Results
• Bond Test• Field Work• Lab Testing and Analysis• Performance Prediction• Life-Cycle Cost Analysis
• Findings and Recommendations• Implementation

Introduction

Importance of Bonding• HMA overlay life largely dependent on bond quality
• Critical for thin overlays• Poor bonding can lead to:
Fatigue cracking Slippage cracking Delamination
www.eng.auburn.edu www.dot.state.fl.uswww.pavementinteractive.com

Simplified physics of bonding• Improves load transfer• Decreases pavement deflection• Lowers stress concentrations
High stress
Low stress
Non-bonded layers
Bonded layers

Tack coats are a critical part of achieving a good pavement layer bond.

Recent Technologies• Trackless tack
VS
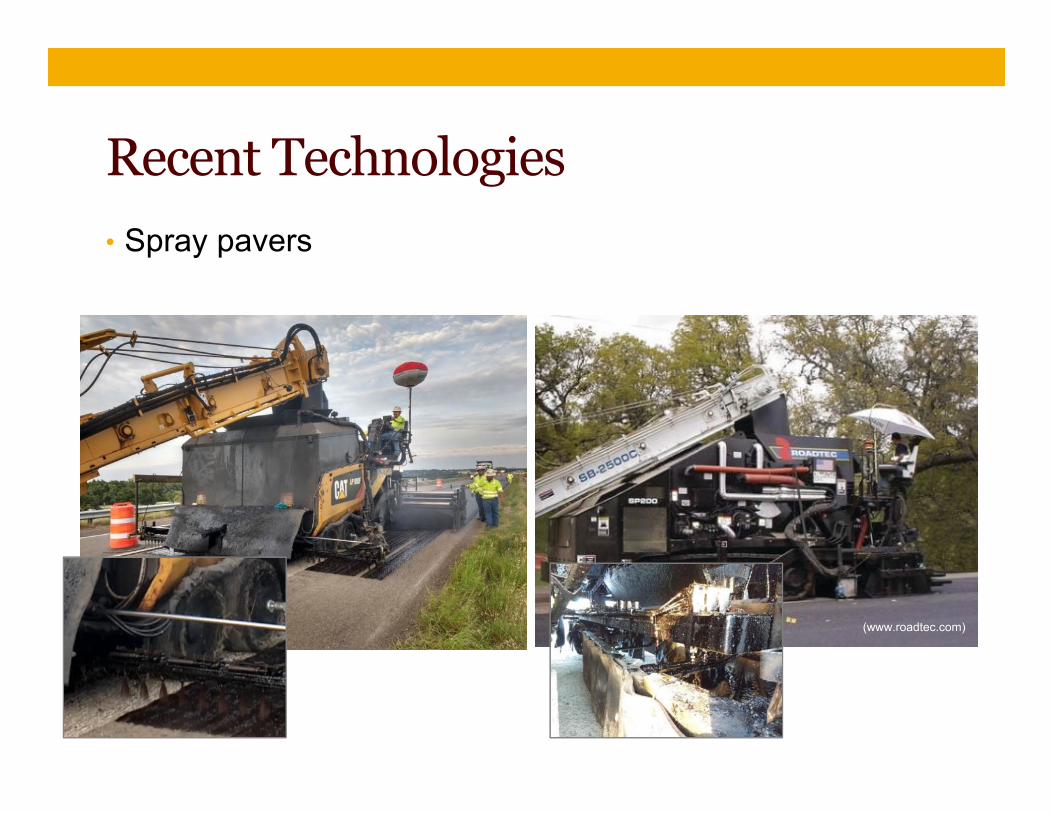
Recent Technologies• Spray pavers
(www.roadtec.com)

Research Goals• Justify or reject higher-cost tack coat strategies.• Select a performance-based or method-based
specification.
• Develop layer bond test.• Evaluate bond performance and predict long-term
performance of different tack coat strategies.• Assess minimum bond criteria.• Evaluate cost-effectiveness.
Research Objectives

Bond Test

Shear bond strength test• Reasonably represents loading scenario in the field.• Intuitive test method.• Ease of sample prep.• Ease of testing.• Inexpensive.

Field Work

Testing PlanSurface Type
Tack Material
Application Equipment
Tack Application RateTracking
Rank (gal/sy)
Milled Surface (Intermediate
Course)
None NA None 0 NA
Rubberized tack
Spray Paver
Mod. 0.08
NHigh 0.12
V. High 0.16
SS-1h Distributor truck
Low 0.04 NY
Moderate 0.08 N
Y
High 0.12NY
New Surface (Surface Course)
None NA None 0 NA
SS-1h Distributor truck
Low 0.04 N
Mod. 0.07 NY
High 0.10 NY
Rubberized Tack
Spray paver
Mod. 0.07NHigh 0.10
V. High 0.13
Trackless tack Distributor truck
Low 0.04 NY
Mod. 0.07 NY
High 0.10 NY
SS-1h Spray paver
Low 0.04NMod. 0.07
High 0.10

Test Section Variables
Property Values
Surface Type New HMA, Milled
Tack Type SS‐1H Trackless Rubberized
Application Method Distributor Spray paver
Tack Application Rate, (gal/sy) 0.04 – 0.13Tracking Yes and NoBond age Initial and 8‐months

FRA-270 Location
US 40
I-70

Section Layout
Intermediate Course (Milled surface)
Low Mod.V. High
Rubberized Tack (Spray Paver) SS‐1H (Distributor)
~700 ft
Highw/tracking
Loww/tracking
Mod. w/tracking
HighMod. High
Livingston Ave.
Bridge

Section LayoutSurface Course (New surface)
Surface Course (continued)
SB Mainline
Rubberized Tack (Spray Paver) SS‐1H (Spray Paver) SS‐1H (Distributor)
LowMod. Loww/ tracking
Mod. w/ tracking
High
~500 ft
Project Start Right lane divides
HighMod. V. High V. High Mod.US 40
SS‐1H (Distributor) Trackless Tack (Distributor)
Highw/ tracking
High Low Mod. High Bridge
~500 ft
Loww/ tracking
Highw/ tracking
Mod.w/ tracking
Livingston Ave.

Construction

Construction

Lab Testing and Analysis

Bond Testing
Bond Energy
Bond Strength
130 Samples
Testing Rate: 2-inch/min
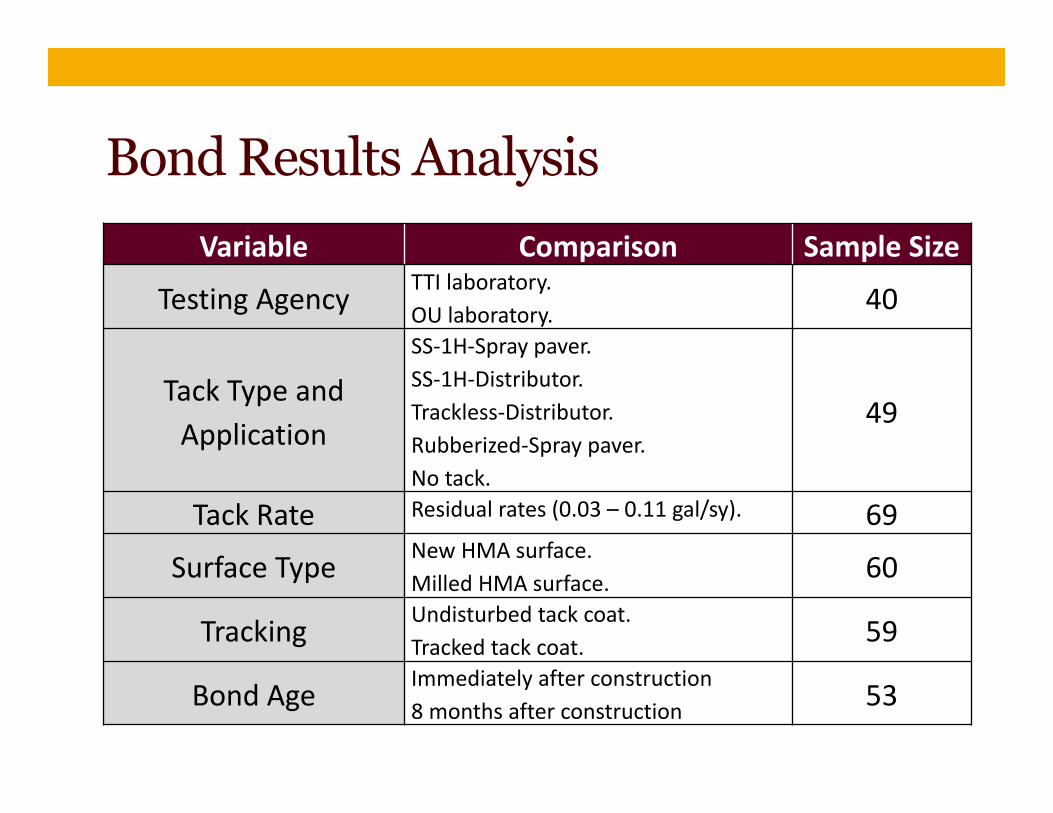
Bond Results AnalysisVariable Comparison Sample Size
Testing Agency TTI laboratory.OU laboratory. 40
Tack Type and Application
SS‐1H‐Spray paver.SS‐1H‐Distributor.Trackless‐Distributor.Rubberized‐Spray paver.No tack.
49
Tack Rate Residual rates (0.03 – 0.11 gal/sy). 69
Surface Type New HMA surface.Milled HMA surface. 60
Tracking Undisturbed tack coat.Tracked tack coat. 59
Bond Age Immediately after construction8 months after construction 53

Bond Results
0
50
100
150
200
250
300
350
400
450
Bond
Stren
gth (psi)
High
bond
Median
Max.
Min.
Low
bond
0
1
2
3
4
5
6
7
Bond
Ene
rgy (ft‐lb/in2)
High
bond
Median
Max.
Min.
Low
bond

Stats Analysis
VariableBond Strength (psi) Bond Energy (ft‐lb/in2)
Statistical Significancep‐value1
Model R2
Valuep‐value1
Model R2
ValueTesting Agency 0.345 0.02 0.877 0.00 NoTack Type and Application
<0.001 0.75 <0.001 0.85 Yes
Tack Rate 0.429 0.75 0.124 0.80 NoSurface Type 0.042 0.53 0.821 0.72 NoTracking 0.103 0.48 0.888 0.25 NoBond Age <0.001 0.90 <0.001 0.87 Yes
1 – The reported p‐value is for the variable in question and not the overall model.

Tack Type and Application Method
361
252226
140109
320286
302
229 208
050
100150200250300350400450
TracklessDistributor
SS‐1HDistributor
None RubberSpray paver
SS‐1HSpray paver
Bond
Stren
gth (psi)
Tack Type and Application Method
Low
bond
High
bond
95% Confidence
Initial
8‐Months

Tack Type and Application Method
4.0
2.9
1.8
1.10.7
4.4
2.6 2.4
1.91.5
0.00.51.01.52.02.53.03.54.04.55.0
TracklessDistributor
SS‐1HDistributor
None RubberSpray paver
SS‐1HSpray paver
Bond
Ene
rgy (ft
‐lb/in2)
Tack Type and Application Method
Low
bond
High
bond
95% Confidence
Initial
8‐Months

Testing Agency
2.2 2.1
0.00.51.01.52.02.53.03.54.04.5
TTI OU
Bond
Ene
rgy (ft‐lb/in2)
Testing Agency

Tack Rate (Application)
3.13.3
1.51.0
2.9
3.8
1.2
0.5
2.5
4.0
0.61.0
0.00.51.01.52.02.53.03.54.04.5
Rubber SS‐1H SS‐1H Trackless
Spray Paver Spray Paver Distributor Distributor
Bond
Ene
rgy (ft‐lb/in2)
Tack Type_Application
LowMod.HighVery High
Application Rate

Surface Type
1.91 1.88
0.00.51.01.52.02.53.03.54.04.5
New Milled
Bond
Ene
rgy (ft‐lb/in2)
Application Type

Tracking
3.7
2.9 2.8
4.0
2.6 2.7
0.00.51.01.52.02.53.03.54.04.5
New_Trackless New_SS1h Milled_SS1h
Bond
Ene
rgy (ft
‐lb/in2)
Surface_Tack Type
No Tracking
Tracking

Life-Cycle Cost Analysis

Overview• Long-Term Performance Prediction
• Model input parameters• Model development• Performance prediction outputs
• Life-Cycle Cost• 15-yrs• Material costs• Routine maintenance cost• Rehabilitation cost

Pavement and Bond Modeling
Bond Energy
Bond Strength
1. Test bond 2. Convert bond to shear modulus
3. Input modulus in BISAR model.

Bond-to-Log(Ks) Transformation
Bond Strength* (psi)
log(Ks) Description/Justification
0 2 No Bond
15 2Lowest bond strength observed. Samples below this could not be cored.
30 2.1From NCAT, lowest bond strength observed near delaminated areas.
35 2.2 Upper range of samples from similar low‐bond locations.
65 2.5From NCAT, highest bond strength observed near delaminated areas.
85 3From NCAT, lowest bond strength observed on projects away from delaminated areas. Consideration given as a minimum bond‐strength criteria.
175 5.5Generally, the maximum observed shear strength from Texas field samples.
250 6Lowest internal HMA shear strength among ODOT's samples
400 6Highest observed bond strength and also highest internal HMA shear strength from ODOT.
*Loading rate = 2‐inch/min
0
1
2
3
4
5
6
7
0 50 100 150 200 250 300 350 400
Shear Ind
ex (log
(mod
ulus))
Bond Strength (psi)

Models
Layer Thickness (mm) Modulus (MPa) Poisson RatioSurface AC 30 5,000 0.35
Intermediate AC 40 7,000 0.35
Existing AC 50 4,000 0.35
Existing PCC 250 30,000 0.15
Subbase 150 240 0.35
Subgrade - 120 0.35
Fatigue and RuttingReflection Cracking
Crack tipBottom of layers under load

Reflective Cracking Prediction
* Assumption that both layers had the same bond condition.

Rutting Prediction
Full Slip
Half Bond
Full Bond
* Assumption that both layers had the same bond condition.

Fatigue Prediction
1
10
100
0 1 2 3 4 5 6 7
Fatig
ue Life (Years)
Shear Index
No Bond
Partial Bond
Full Bond
* Assumption that both layers had the same bond condition.

Performance Prediction by Treatment –New HMA
0102030405060708090100
0 2 4 6 8 10 12 14 16
Refle
ction Cracking
(%)
Years
Distributor TracklessDistributor SS‐1HDistributor NoneSpraypaver RubberSpraypaver SS‐1H

Performance Prediction by Treatment –Milled HMA
0102030405060708090
100
0 2 4 6 8 10 12 14 16
Refle
ction Cracking
(%)
Years
Spraypaver, Rubber
Spraypaver, SS‐1H
Distributor TracklessDistributor SS‐1HNone

Paving Equipment Costs
Equipment Manufacturer Cost ($1,000)Standard Paver NA $400 ‐ $450
Spray Paver
Roadtec $875 ‐ $950Vogel $925
Caterpillar (Integral dx) $740 ‐ $800
Spray Paver Retrofit*
Caterpillar (Integral dx) $350
*Available for limited models

Life-Cycle Costs – New HMA
$212 $209 $205 $210 $209
$0
$50
$100
$150
$200
$250
$300
TracklessDistributor
SS‐1HDistributor
None RubberSpray paver*
SS‐1HSpray paver*
Presen
t Cost
($1000/la
ne‐m
ile)
* Additional equipment cost

Life-Cycle Costs – Milled HMA
$171 $169 $166 $166 $161
$0
$50
$100
$150
$200
$250
$300
TracklessDistributor
SS‐1HDistributor
None RubberSpray paver*
SS‐1HSpray paver*
Presen
t Cost
($1000/la
ne‐m
ile)
* Additional equipment cost

Findings & Recommendations

Key Findings• Most bond measurements were acceptable.• Tack type, application method, and bond age had a
significant impact on bond performance.• High bond: Trackless, SS-1H w/ Distributor, No tack• Mod-low bond: SS-1H and rubberized w/ spray paver (initial)• After 8-months: Bond doubled for spray paver sections
• Testing agency, tack rate, surface type, and tracking did not significantly influence bond performance.

Key Findings• Better bonding reduces reflection cracking and fatigue
cracking. There may be an optimal bond.• Better bonding reduces rutting.• Based on 8-month data, all test sections had near “Full
Bond” conditions and similar long-term life.• Life-cycle costs
• New HMA: ~$210,000/lane-mile.• Milled HMA: ~$165,000/lane-mile• Differences among treatment types about $3,000 to $10,000,
between 2 and 6 percent of overall cost.
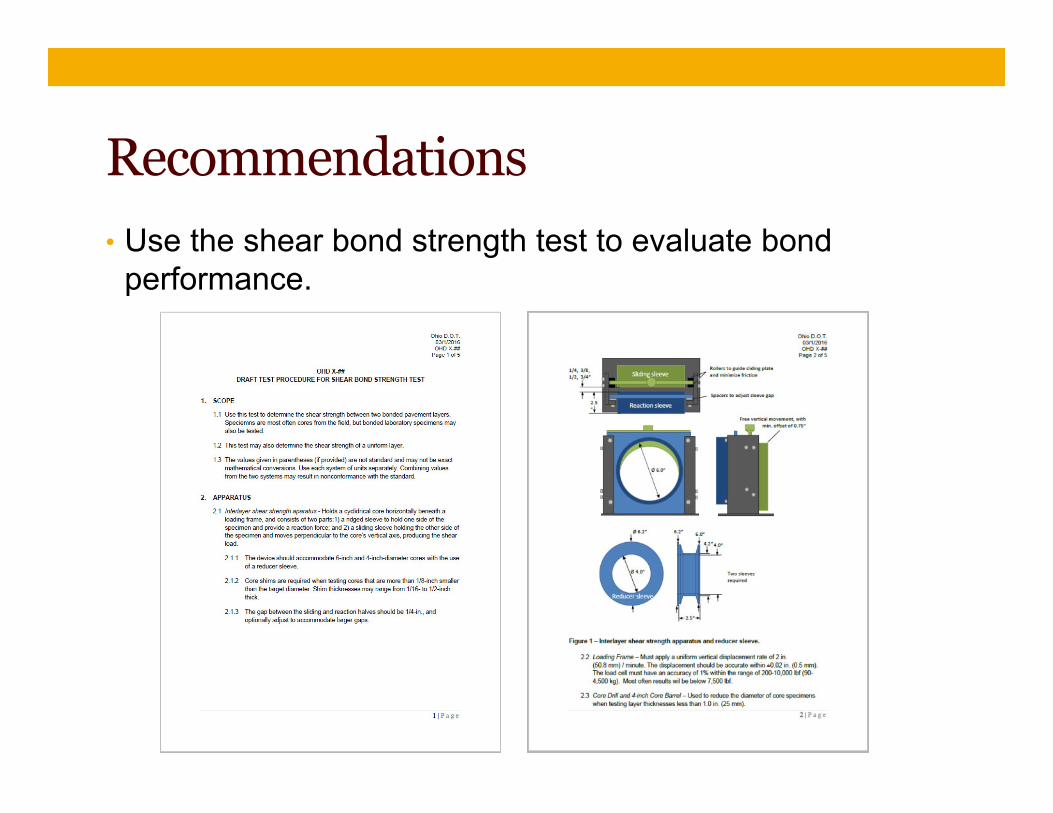
Recommendations• Use the shear bond strength test to evaluate bond
performance.

Method-Based Specification• Slight modifications.• Better incorporate spray pavers.• Allow slightly higher rates for
HMA.• Prescribe use of tack even
though results suggest it’s not always needed.

Performance-Based Specification• Responsibility to select tack rate moved to
contractor.• The application rate is chosen by the contractor
and must conform to the minimum rates specified in Table 407.06-1.
• Bond strength test added.• The Department will measure the bond strength of
the new overlay to the existing surface on the first day of paving. Core locations will be selected randomly and cores will be tested in accordance to the shear bond strength test (ODOT XXX). The average shear bond strength of three cores should be 70 psi or greater, with no single test result below 60 psi. If the contractor fails to meet this criteria, they must make changes to the tack material type, surface preparation procedures, and/or application procedures. Paving may be suspended until the contractor constructs a 1,000-ft test section meeting the criteria.

Long-Term Data Collection Plan• Bond Testing
• Initial• 8-month• 6-year
• FWD• Spring and Fall• Every 3 years
• Distress survey• Winter• Annually (Yrs 1-5)• Biennially (Yrs 7, 9, 11)
Overlay Age (yr) Month/Year Action Test
Sections
0 July 2016 ConstructionBond testing All
0.6 Mar. 2017 Bond testing Group A*1.25 Oct. 2017 FWD measurements Group B1.5 Jan. 2018 Distress survey Group B2.5 Jan. 2019 Distress survey Group B2.75 Apr. 2019 FWD measurements Group B3.25 Oct. 2019 FWD measurements Group B3.5 Jan. 2020 Distress survey Group B4.5 Jan. 2021 Distress survey Group B5.5 Jan. 2022 Distress survey Group C5.75 Apr. 2022 FWD measurements Group B
6.25 Oct. 2022 Bond testingFWD measurements
Group A*Group B
7.5 Jan. 2024 Distress survey Group B8.75 Apr. 2026 FWD measurements Group B9.25 Oct. 2026 FWD measurements Group B9.5 Jan. 2026 Distress survey Group B11.5 Jan. 2028 Distress survey Group C
*Also include no‐tack locations

Recommendations• Which tack coat strategy is best?
• Most cost-effective: SS-1H w/ spray paver, but savings were small.• The Department should consider allowing the contractor to chose
the tack material, application methods, and rates most convenient for their operations, considering they meet minimum application rate and uniformity requirements.
• Note: Initial bond from a spray paver can be much lower than from a distributor application. The bond will increase with time, but this may be a concern when paving in severe stopping/accelerating traffic conditions, where high bond performance is needed immediately after construction.

Implementation

What could be implemented?• Shear bond strength test.• Revised tack coat specification (Item 407), method-based
or performance-based.• General best-practices for tack coat construction.• Long-term data collection plan.

Possible Activities• Define scope of desired implementation. • Identify leadership group in Ohio to help with
implementation.• Develop presentation materials (powerpoint) about test
method and specification.• Present materials in key meetings/conferences/webinars.• Incorporate research findings into journal articles and
conference proceedings.
• Identify team for long-term data collection.• Schedule data collection activities.

Benefits• Eliminate poor layer bonding and associated distresses.• Save ODOT money on premature maintenance and
rehabilitation work.• Better understanding of long-term performance of different
tack coat strategies.
Potential Risks• Confirming relationship between bond shear strength and
actual short- and long-term performance.• Resolving differences in initial and long-term bond
performance. Can we rely on initial bond results? Particularly important for resolving cases with failed bond tests (i.e. spray paver construction) but adequate long-term field performance.
• Push-back from contractors about changes in specifications and additional shear testing.
• Too much load on labs to perform additional testing.

Principle InvestigatorBryan Wilson, [email protected]
Email administrative questions to: [email protected]
Final report will be available online in a couple weeks at: www.dot.state.oh.us\research