TACE: A Toolkit for Analyzing Concept Evolution in...
6
TACE: A Toolkit for Analyzing Concept Evolution in Computing Curricula Tiejian Luo, Libo Zhang, Lin Yang, Xin Chen University of Chinese Academy of Sciences, Beijing, China Abstract—Effective teaching and learning requires to knowing whether some concepts are needed to grasping. Our investigation for ACM Computing Curricula from 1991 to 2013 shows that the numbers of concepts are increased by 5 times. That phenomenon makes learners harder to distinguish which concept is update or not. In this paper, we develop a solution to explore the body of knowledge of computing. The proposed toolkit uses a graph model to represent the disciplinary knowledge structure. The analytic results by TACE give us insight for the various subjects in computing discipline. Our findings show that 61.3% concepts in CC1991 are obsolete. In CC2001, the proportion of obsolete concepts drops to 11.5%, and in CS2008 it is 16.8%. The OS, IM, DS, AL’s knowledge areas are more stable than CN, NC, GV, AR. The TACE’s framework is highly modular, adaptive and extendible for analyzing other discipline’s curricula. Keywords—Teaching and Learning; Curricular Knowledge Model; Concept Vitality; Information Visualization. I. INTRODUCTION All subjects are built on a foundation of a unified concept family. As the field develops, new concepts are introduced, and existing concepts could change continuously due to the emergence of new knowledge. For example, the concept “big data” was invented as a result of the technological development in highly distributed and scalable systems to process massive datasets [1]. And “smart phone” nowadays refers more to mobile phone with Android and IOS rather than with Symbian OS [2]. In any discipline, to achieve good teaching and learning performance, it is essential to understand concept evolution. Here we define concept evolution as the changing of a concept and its importance in the subject. Take a computer science course example, fundamental concepts such as “data structure” and “algorithm” are playing a significant role. Some concepts gradually became important as time elapses. For instance, “Networking” and “World Wide Web” lack emphasis at the beginning of the 1990s, but they became critical foundation of computer science a decade later [3]. Some concepts become outdated after being replaced by newer concepts. A representative example is the shifting of programming language from “COBOL”, “Fortran” in the mid- 1950s to “Java”, “C++”,”PHP” etc. today. We investigated the Computing Curricula published by ACM and IEEE-Computer Society, and we found that the concepts in the curricula are used to describe CS body of knowledge have increased from 465 in to 2685. By studying the development of the curricula’s concept system, we hope to further explore the following questions: How many concepts are there still vitality and the others are obsolete in the past 45 years? How much the proportion for the vitality and obsolete concetps from CC1991 to CS2013 curricular volumes respectively? Which knowledge areas are changed faster? Which knowledge areas are more stable? How many new knowledge units are emerged from CC1991 to CS2013? Analyzing so many concepts in CC1991 to CS2013 curricular volumes manually is not a easy work. That motivates us to develop a toolkit termed as TACE to fulfill this task. TACE automaticly extracts curricular volume’s body of knowledge, represents them in a unified graph model, it presents results with various diagrams. TACE helps us mining ACM computing curricula volumes and get some useful findings. We organize the rest of paper as follows. In Section 2 we review related works. In Section 3 we introduce the Computing Curricula dataset. Section 4 shows how we model the knowledge structure of Computing Curricula. The framework of TACE is presented in Section 5. Section 6 describes the application of TACE and some finding for analyzing ACM Computing Curricula from 1991 to 2013. In Section 7 we give the conclusion and future work. II. RELATED WORK Bibliometrics methods are applied to explore research trends in different fields[4][5][6][7], which reflect the changing of topics in academic research. But research frontiers cover only part of a discipline’s knowledge. Bogoiavlenski et al. [8] reviewed the evolving computing curricula in historical perspectives. The Computing Curricula 2005 overview report [9] briefly summarized the development of the computing field before, during and after 1990s in the experts’ view. Their conclusions depict the whole picture but are not enough for understanding how disciplinary concepts evolve. Marshall [10] makes a comparison to CC2001, CS2008 and CS2013 by modeling their knowledge structure as trees. That paper discusses the knowledge unit at topic level, whose granularity is too low comparing to concept level. Moreover, it has not explored how a concept and its implication change over time, which is our research theme in this paper. Our study not only intends for computing discipline, but also tries to develop a general framework and toolkit for analyzing other disciplines’ curricula. There are considerable number of software tools for information extraction, storage and visualization. But a holistic solution should overcome problems across all these areas. A generic toolkit’s requirements and design’s specifications are summarized as follow: Concept annotation (CA): The toolkit should be able to DOI reference number: 10.18293/SEKE2016-017 1 CC1991, CC2001, CS2008 and CS2013 are abbreviations for Computing Curricula 1991, Computing Curricula 2001, Computer Science Curriculum 2008 and Computer Science Curriculum 2013. 2 For the abbreviations of knowledge areas, see Fig. 7
Transcript of TACE: A Toolkit for Analyzing Concept Evolution in...
TACE: A Toolkit for Analyzing Concept Evolution in
Computing Curricula
Tiejian Luo, Libo Zhang, Lin Yang, Xin Chen
University of Chinese Academy of Sciences, Beijing, China
Abstract—Effective teaching and learning requires to
knowing whether some concepts are needed to grasping. Our
investigation for ACM Computing Curricula from 1991 to 2013
shows that the numbers of concepts are increased by 5 times.
That phenomenon makes learners harder to distinguish which
concept is update or not. In this paper, we develop a solution to
explore the body of knowledge of computing. The proposed
toolkit uses a graph model to represent the disciplinary
knowledge structure. The analytic results by TACE give us
insight for the various subjects in computing discipline. Our
findings show that 61.3% concepts in CC1991 are obsolete. In
CC2001, the proportion of obsolete concepts drops to 11.5%, and
in CS2008 it is 16.8%. The OS, IM, DS, AL’s knowledge areas
are more stable than CN, NC, GV, AR. The TACE’s framework
is highly modular, adaptive and extendible for analyzing other
discipline’s curricula.
Keywords—Teaching and Learning; Curricular Knowledge
Model; Concept Vitality; Information Visualization.
I. INTRODUCTION
All subjects are built on a foundation of a unified concept family. As the field develops, new concepts are introduced, and existing concepts could change continuously due to the emergence of new knowledge. For example, the concept “big data” was invented as a result of the technological development in highly distributed and scalable systems to process massive datasets [1]. And “smart phone” nowadays refers more to mobile phone with Android and IOS rather than with Symbian OS [2]. In any discipline, to achieve good teaching and learning performance, it is essential to understand concept evolution. Here we define concept evolution as the changing of a concept and its importance in the subject. Take a computer science course example, fundamental concepts such as “data structure” and “algorithm” are playing a significant role. Some concepts gradually became important as time elapses. For instance, “Networking” and “World Wide Web” lack emphasis at the beginning of the 1990s, but they became critical foundation of computer science a decade later [3]. Some concepts become outdated after being replaced by newer concepts. A representative example is the shifting of programming language from “COBOL”, “Fortran” in the mid-1950s to “Java”, “C++”,”PHP” etc. today.
We investigated the Computing Curricula published by ACM and IEEE-Computer Society, and we found that the concepts in the curricula are used to describe CS body of knowledge have increased from 465 in to 2685. By studying the development of the curricula’s concept system, we hope to further explore the following questions:
How many concepts are there still vitality and the others are obsolete in the past 45 years? How much the proportion for the vitality and obsolete concetps from CC1991 to CS2013 curricular volumes respectively? Which knowledge areas are changed faster? Which knowledge areas are more stable? How many new knowledge units are emerged from CC1991 to CS2013?
Analyzing so many concepts in CC1991 to CS2013 curricular volumes manually is not a easy work. That motivates us to develop a toolkit termed as TACE to fulfill this task. TACE automaticly extracts curricular volume’s body of knowledge, represents them in a unified graph model, it presents results with various diagrams. TACE helps us mining ACM computing curricula volumes and get some useful findings.
We organize the rest of paper as follows. In Section 2 we review related works. In Section 3 we introduce the Computing Curricula dataset. Section 4 shows how we model the knowledge structure of Computing Curricula. The framework of TACE is presented in Section 5. Section 6 describes the application of TACE and some finding for analyzing ACM Computing Curricula from 1991 to 2013. In Section 7 we give the conclusion and future work.
II. RELATED WORK
Bibliometrics methods are applied to explore research trends in different fields[4][5][6][7], which reflect the changing of topics in academic research. But research frontiers cover only part of a discipline’s knowledge. Bogoiavlenski et al. [8] reviewed the evolving computing curricula in historical perspectives. The Computing Curricula 2005 overview report [9] briefly summarized the development of the computing field before, during and after 1990s in the experts’ view. Their conclusions depict the whole picture but are not enough for understanding how disciplinary concepts evolve. Marshall [10] makes a comparison to CC2001, CS2008 and CS2013 by modeling their knowledge structure as trees. That paper discusses the knowledge unit at topic level, whose granularity is too low comparing to concept level. Moreover, it has not explored how a concept and its implication change over time, which is our research theme in this paper. Our study not only intends for computing discipline, but also tries to develop a general framework and toolkit for analyzing other disciplines’ curricula. There are considerable number of software tools for information extraction, storage and visualization. But a holistic solution should overcome problems across all these areas. A generic toolkit’s requirements and design’s specifications are summarized as follow:
Concept annotation (CA): The toolkit should be able to
DOI reference number: 10.18293/SEKE2016-017 1 CC1991, CC2001, CS2008 and CS2013 are abbreviations for Computing Curricula 1991, Computing Curricula 2001, Computer Science Curriculum
2008 and Computer Science Curriculum 2013. 2 For the abbreviations of knowledge areas, see Fig. 7

extract concepts and mark tags to them, which are the basic knowledge elements in the curricula. This task’s precision and recall performance should exceed 90%.
Knowledge model representation (KMR): The system should maintain a structural data model to represent the body of knowledge in the curricular volumes.
Knowledge model analysis(KMA): We need to devlope two algorithms for dealing with the knowledge model; They will compare concepts and calculate concept’s vitality according to the predefine criterion respectively.
Data persistence function (DPF): The toolkit should provide persistent mechanism which can index and access to both data and their analytic results.
Result export and visualization (REV): The toolkit should be able to export the results in CSV files then provide the three typical presentations: (1) statistic diagram (bar chart, pie chart and bubble chart etc.) for charting the amount, distribution or proportion of the concetps in the curricula, (2) Alluvial diagram3 for ploting the knowledge areas evolution, and(3) relationship diagram for showing the interconnection between knowledge areas.
TABLE I. RELEVANT TECHNOLOGIES
CA KMR KMA DPF REV
Wikipedia Miner √ × × × ×
Dbpedia Spotlight √ × × × ×
GATE √√ × × × ×
Neo4j × √√ × √√ ×
ggplot2 × × × × √
MapEquation × × × × √
Sankey Diagram × × × × √
We examined serveral information analysis and visulization tools by comparing five key features which are matter for the curricular knowledge volumes analysis requirements. The tools we investigated are listed in table I. Wikipedia Miner [11] and Dbpedia Spotlight [12] provide automatic annotation service, but their precision and recall are below 90% [12]. GATE [13] allows us to annotate the concepts and their relationship manually, annotation performance is good. Neo4j [14] opens an API for us to build, access and store our graph model. ggplot2 [15] supports plotting basic statistic diagrams. D3.js’s Sankey plugin [16] can be used to plot alluvial diagram. Map Equation [17] offers functionality for generating networked diagram. Table I shows that the availble technologies have their own pro and cons in terms of the five key features. How to combine those tools’s good features into our solution is not trivial.
III. COMPUTING CURRICULA DATASET
The ACM Computing Curricula4 is one of the most impact course guidelines for undergraduate study programs in computing field. In 1968, ACM released Curriculum 68, which is the first volume of Computing Curricula. A decade later, Curriculum 78 was published. And since 1991, when ACM
and IEEE Computer Society began working together on Computing Curricula, four volumes are released: CC1991, CC2001, CS2008 and CS2013.
TABLE II. STATISTICS OF CURRICULUM 68 AND CURRICULUM 78
Year Course Topic Course
Hour core elective total
1968 22 75 119 194 71
1978 18 47 57 104 59
TABLE III. STATISTICS OF CC1991, CC2001, CS2008 AND CS2013
Year KA KU Topic Course
Hour core elective total core Elective
total
1991 11 55 N/A 55 214 N/A 214 271
2001 14 63 69 132 402 548 950 280
2001 14 65 81 146 423 596 1019 290
2013 18 84 79 163 493 619 1112 307
Why do we exclude Curriculum 68’s and Curriculum 78’s from our dataset? The reason is that their disciplinary knowledge is organized in the exemplary courses form, which is significantly different from the later four volumes. They have three categories and are with hierarchical relationships.
Fig. 1. Hierachy of CC2001.
The four volumes arrange the CS body of knowledge in a hierarchical way. Fig 1 shows CC2001’s body of knowledge and Table III presents the statistics from CC1991 to CS2013. The whole CS field is subdivided in to Knowledge Areas (KAs), which are broken down further into Knowledge Units (KUs) and correspondent topics. In CC2001 and CS2008, some of the KUs are selected as core units, which are considered essential elements for a CS undergraduate degree. The rest of the KUs are elective, which are optimal for devising a curriculum. A minimum number of hours, which should be spent on instruction, are suggested for each core KU. CC1991 and CS2013 are little different from the former two volumes. CC1991 does not use the designation for core and elective because all its KUs are considered to be essential. CS2013 moves the designation to topic level, and breaks down the core topics further into core tier 1 and core tier 2. To model all these volumes in a uniform manner, we treat all KUs of CC1991 as core. And for CS2013, we ignore the difference of the two core tiers and label all them as core.
3 http://en.wikipedia.org/wiki/Alluvial_diagram 4 All retrieved from http://www.acm.org/education/ curricula-recommendations, May 12, 2014
PDF Files
HTML Files
Log Files
Curricula
Raw Data
Extracting the body of knowledge
Concept annotation
XML Files
XML Files
Knowledge structurerepresentation
Knowledge Graph analysis
Reporting & visualization
Conceptcomparison
ConceptVitality calculation
CSV Files
Graph model
FilterConcept
annotator
Knowledge structure extractor
Knowledge Graph database
Translator
Visualizer
Shell GATE Java Neo4j ggplot2 D3.js MapEquation
Knowledge body
ConceptanalyzerData flow
Implemented by
Data
Process
Computing tools
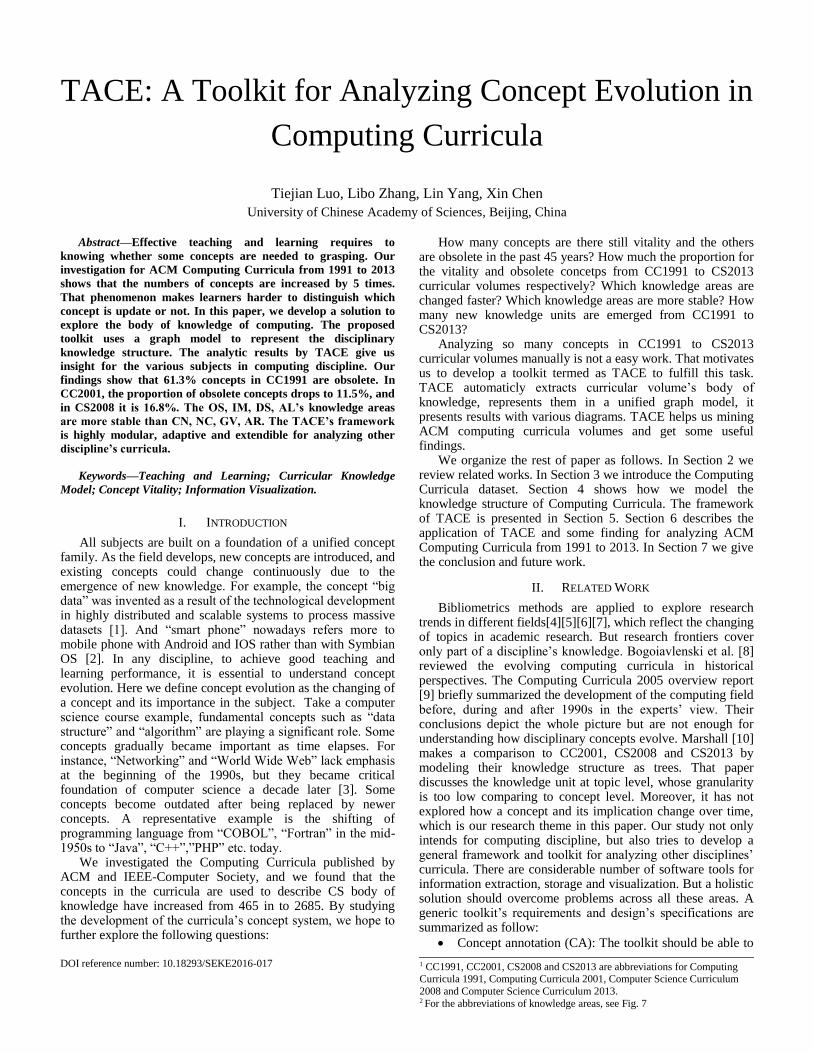
Fig. 2. The TACE framework.
IV. MODELING THE KNOWLEDGE STRUCTURE
One of the important task in our TACE framework is to devlop an appropriate knowledge structure model for the curricular volumes. In order to present our approach and data model clearly, we respectively define concept, concept relation, knowledge unit, knowledge area and curriculum in this section. In addition, we define relevant concept set, which is a collection of equivalent concepts. To measure the importance level of a concept appeared in the curricula, we defined three kinds of concept vitality: steady, vitality and obsolete:
Steady concepts are those that still be included in the curriculum over past two decades, such as sorting algorithm concept, “quicksort” and “mergesort” are steady.
Vitality concepts have diverse weight in different periods. There are two kinds of vitality concepts. One is those appear intermittently across curricular volumes, like “scripting language”, which appears in CC2001 and CS2008, but not in CS2013. Others are concepts newly introduced in the latest curricular volume, like “Software as a service” and “Infrastructure as a service” in CS2013.
Obsolete concepts are those appeared in the curricula no more than once. For example, programming languages like “Modual2” and “Ada” are obsolete, which have not been mentioned after CC1991.
V. THE TACE FRAMEWORK
TACE integrates several technologies to provide a qualitative analysis of concept evolution in the Computing Curricula. Fig 2 illustrates the overall architecture of TACE. The figure starts on the left with raw Computing Curricula raw data such as PDF files, HTML files, and Text files. The body of knowledge is extracted from them and saved in XML format. Concept annotation is subsequently employed to identify disciplinary concepts. The knowledge structure representation stage explains how we extract the annotations and build a graph model of the knowledge structure for later analysis. The graph analysis stage illustrates the analytic algorithms we
performed on the graph model. Finally the resulted information is exported as CSV files and presented in different kinds of diagrams, as described in the reporting and visualization stage.
A. Extracting the Body of Knowledge
The Computing Curricular volumes come in PDF format. We must extract the “body of knowledge” and save them in a unified structure, so that they can be processed by the component for concept annotation.
Firstly, UNIX shell program pdftotext is applied to trans- form the PDF files to plain text. The “body of knowledge” section needs to be picked out from the whole curricular re- port manually. A parser implemented by Java is responsible for parsing the section to extract KAs, KUs and topics; and save them in a unified XML format.
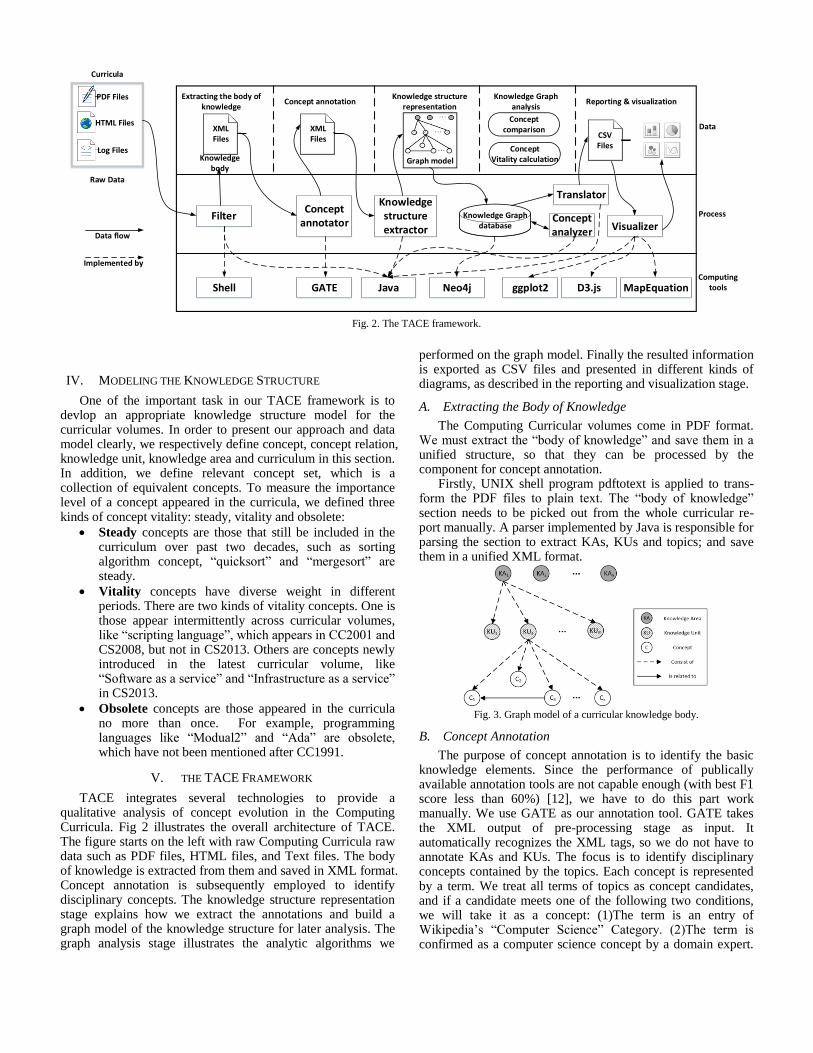
Fig. 3. Graph model of a curricular knowledge body.
B. Concept Annotation
The purpose of concept annotation is to identify the basic knowledge elements. Since the performance of publically available annotation tools are not capable enough (with best F1 score less than 60%) [12], we have to do this part work manually. We use GATE as our annotation tool. GATE takes the XML output of pre-processing stage as input. It automatically recognizes the XML tags, so we do not have to annotate KAs and KUs. The focus is to identify disciplinary concepts contained by the topics. Each concept is represented by a term. We treat all terms of topics as concept candidates, and if a candidate meets one of the following two conditions, we will take it as a concept: (1)The term is an entry of Wikipedia’s “Computer Science” Category. (2)The term is confirmed as a computer science concept by a domain expert.

The annotated result is also saved in XML format. The annotations can be extracted through the GATE’s Java API.
Obsolete
Vitality
Steady
Fig. 4. Concepts progress hisgram from CC1991 to CS2013.
C. Knowledge Structure Representation
Since we have defined a linear path from KA to concepts, it can model the curricular volume’s body of knowledge as a tree-structured graph, which is shown in Fig 3. There are three kinds of vertex: KA, KU and concept. These vertices are connected by two kinds of edges: a KA vertex consists of several KUs and a KU consist of several concepts; a concept vertex may be related to other concepts that provide context for determining the exact concept’s semantics.We employ Neo4j, an open source graph database, as data storage for our graph model. Neo4j provides a native Java API, which can be seamlessly integrated with GATE’s API, allowing us to extract the model from the annotation results. Also it provides persistent and indexed access to both nodes and edges. Fig.4 gives an overview of those classes which represent the graph model of knowledge structure, along with some selected properties and methods.
D. Graph Analysis
The analyzer is implemented in Java and it performs
analysis on the graph model. The results are saved as properties of nodes and edges in the graph database. The analyzer’s core function is to study the vitality of concepts in each curricular volume. To determine which volumes a concept has appeared in, it is necessary to compare concepts of different volumes. To decide whether a concept is the same as another one, we made some essential definitions based on observations to the dataset. The methodology for comparing two curricular volumes is
presented in Algorithm 1. Since KU is the minimum contextual unit, two different curricular volumes are compared KU by KU. Algorithm 2 describes the procedure of identifying whether a concept is vitality or not in each curricular volume. The related definitions used in algorithms are given in Section 4.
E. Reporting and visualization
A result dumper is implemented to save the analytical outcome as CSV files. Meanwhile, some visualization tools are utilized to present the results in useful way. We apply ggplot2 to plot basic statistical diagrams such as bar chart and scatter chart. We use the Sankey Plugin of D3.js to demonstrate the whole picture of how different Knowledge Areas evolves. MapEquation is employed to show how knowledge areas interconnect to each other within a same body of knowledge. Some of the visualization results are displayed in Section 6.
VI. TACE APPLICATION
A. Environment Setup
All experiments are done with an Intel Core i7 PC having 8GB main memory and running Windows 7. Versions of the JRE and Neo4j used are: 1.7.0 45, 2.0.0 respectively. The ggplot2 package version is 0.9.3.1 and the R version is 3.0.3.
B. Approach
The workflow of TACE follows the sequence presented in Section 5. The dataset is introduced in Section 3. We utilized pdftotext to transform the 4 raw PDF files to plain text and manually selected out the sections of “body of knowledge”. Then we employed the parser to parse them and save the output as XML files. We loaded them with GATE for concept annotation. It takes a volunteer student almost 38 hours to fulfilled concepts annotation work. It includes 6416 concepts and 363 concept relations. The final annotated concepts are saved into 4 XML files. We invoked the controller program of TACE and it automatically finished the process of knowledge structure representation and analysis. We wrote an R script for applying ggplot2 and an Excel VBA script for generating Sankey Diagram. MapEquation was utilized to plot KA interconnection diagrams.

Conc
ept N
umbe
rs
Fig. 5. Concepts distributions from CC1991 to CS2013.
Obsolete
Vitality
Steady
Fig. 6. Concepts varition hisgram from CC1991 to CS2013 for
“Architecture and Organization” knowledge area
Fig. 7. Concepts radar graph from CC1991 to CS2013.
C. Analytic Results
We got four kinds of result set as following:
Concept distribution: The counts of concept in KA and KU for each curricular volume. For example, CS2001 contains 1452 concepts. Among which, there are 119 concepts in “Operating System” KA and there are 10 concepts in the “Concurrency” KU.
Concept vitality: It has been defined in Section 4. For example, the concept “floating-point” is steady while “ada” (programming language) is obsolete.
Concept origin: It means that a concept is either newly introduced or inherited from a former curricular volume. For instance, the concept “Bayes theorem” is newly introduced in CC2001 and inherited by CS2008 and CS2013.
Concept duplication: It stands for those concepts have occurred repeatedly in most curricular volumes. For example, the concept “predicate logic” appeared in both “Knowledge Based Reasoning” KU and “Basic Logic” KU.
As space is limited, we only present some key analysis results in this paper. Fig 4 shows that CS discipline has been developed and progressed rapidly. From the perspective of concept vitality, we may find most concepts of CC1991 become obsolete, while in CC2001 and CS2008 obsolete concepts only take a small part. The number of new concepts in CS2013 accounts for most vitality concepts.
From the steady concepts perspective in Fig 5, we may find most topics in DS, OS, IM, and AL are always considered important for undergraduate curriculum. This is in accordance
with their fundamentality in CS. From the obsolete concepts perspective, most of the CN’s concepts are no longer
considered as necessary. This is because CN has a relatively small KA and contains no core KUs. Its content varies across the volumes and results in the large proportion of obsolete concepts in CS2001.
Specifically, we thoroughly observed at the concept vitality of “Architecture and Organization” from CC1991 to CS2013 in Fig 6. The count of concepts kept increasing in first three volumes but shrank at CS2013. The large proportion of obsolete concepts in CS2008 contributed to the decrease. Another reason for the drop was that some concepts in AR were categorized to other KAs like SF (System Fundamentals) and PD (Parallel and Distributed Computing). This also explained the drop of steady concepts’ percentage in CS2008.
In order to deeply understand the change of Knowledge Area in each curricular volumes, we drew the radar chart based on the distribution of concepts' number in the Knowledge Area, as shown in Fig 7. We have observed that the content of Knowledge Area has been increasing year by year. Some areas always have an important role, such as IM, SE and GV. Some new areas appear like IAS, SF and some like NC have been outdated. The change of human knowledge is like the evolution of Fig 7. Although the importance of each field is fluctuating, in the overall trend, all Knowledge Area has been improving gradually.
In Fig 8 the four vertical columns blocks represent the
topics of different curricula(1991,2001,2008,2013), the
height of each block stands for the weights of this topic in its curricula. The lines between different vertical columns represent the mapping of topics in two curricula (Thicker the line is, more part of the topic in the left column transfer into the
topic in the right column). For instance,the content of topic
"Artificial Intelligence and Robotics" in 1991 curricula transfer into "Algorithm and Complexity", "Human-Computer Interaction" and "Intelligent Systems" in 2001 curricula. The new topic "Algorithm and Complexity" in 2001 curricula assimilate the information of 4 topics in 1991 curricula. Topic "Algorithm and Data Structure" and topic "Programming Languages" provide larger proportion of content than topic "Artificial Intelligence and Robotic" and "Architecture". At last, topic "Algorithm and Complexity" is composed of the transfer content and the new content.

Fig. 8. New knowledge units are emerged from CC1991 to CS2013.
VII. CONCLUSION
In this paper, we presented TACE, a novel toolkit that enables people to explore the concept family’s development of computer science thoroughly. Our major work is four folds. First, we investigated the Computing Curricula, which is the dataset of TACE. Second, we defined a concept vitality metrics and introduced a graph model to represent the curricula’s body of knowledge. Third, we presented TACE’s framework in 3 layers: business workflow, software architecture and implementation tools. In detail, we described the 5 phases of the business workflow. Finally, we demonstrated some key findings of TACE, which illustrate the Computing Curricula’s development in the aspect of concept’s vitality. Given the similar knowledge hierarchy of all scientific disciplines, we hope its methodology can be applied to other subjects.
Our study shows that the number of knowledge areas has doubled and the amount of concepts has increased by 5 times from CC1991 to CS2013. The 61.3% of concepts in CC1991 are obsolete. In CC2001, the proportion of obsolete concepts drops to 11.5%, and in CS2008, it is 16.8%. From the steady concepts perspective, OS, IM, DS, AL are the most stable knowledge areas while CN, NC, GV, AR are changing rapidly. Currently the precision of analyses relies heavily on manual concept annotation, which is time-consuming and fallible. To apply TACE on a larger dataset and a broader variety of data source, we must develop a component to automatically extract domain concept with high performance.
REFERENCES
[1] Silva Y N, Dietrich S W, Reed J M, et al. Integrating big data into the computing curricula[C]//Proceedings of the 45th ACM technical symposium on Computer science education. ACM, 2014: 139-144.
[2] M. Butler. Android: Changing the mobile landscape. Pervasive Computing, IEEE, 10(1):4–7, 2011.
[3] G. Engel and E. Roberts. Computing curricula 2001 computer science. IEEE-CS, ACM. Final Report, 2001.
[4] K. W. Boyack, K. B orner, and R. Klavans. Mapping the structure and evolution of chemistry research. Scientometrics, 79(1):45–60, 2009.
[5] A. Hoonlor, B. K. Szymanski, and M. J. Zaki. Trends in computer science research. Communications of the ACM, 56(10):74–83, 2013.
[6] J.-l. Hung. Trends of e-learning research from 2000 to 2008: Use of text mining and bibliometrics. British Journal of Educational Technology, 43(1):5–16, 2012.
[7] J. Li, M.-H. Wang, and Y.-S. Ho. Trends in research on global climate change: A science citation index expanded-based analysis. Global and Planetary Change, 77(1):13–20, 2011.
[8] I. A. Bogoiavlenski, A. G. Clear, G. Davies, H. Flack, J. P. Myers, R. Rasala, M. Chairman-Goldweber, and J. Chairman-Impagliazzo. Historical perspectives on the computing curriculum. ACM SIGCUE Outlook, 25(4):94–111, 1997.
[9] R. Shackelford, A. McGettrick, R. Sloan, H. Topi, G. Davies, R. Kamali, J. Cross, J. Impagliazzo, R. LeBlanc, and B. Lunt. Computing curricula 2005: The overview report. ACM SIGCSE Bulletin, 38(1):456–457, 2006.
[10] L. Marshall. A comparison of the core aspects of the ACM/IEEE computer science curriculum 2013 strawman report with the specified core of CC2001 and CS2008 review. In Proceedings of Second Computer Science Education Research Conference, pages 29–34. ACM, 2012.
[11] D. Milne and I. H. Witten. An open-source toolkit for mining wikipedia. Artificial Intelligence, 194:222–239, Jan. 2013.
[12] P. N. Mendes, M. Jakob, A. Garc´ıa-Silva, and C. Bizer. DBpedia spotlight: shedding light on the web of documents. In Proceedings of the 7th International Conference on Semantic Systems, pages 1–8. ACM, 2011.
[13] H. Cunningham, D. Maynard, and K. Bontcheva. Text processing with gate. Gateway Press CA, 2011.
[14] Neo4j. Home. http://www.neo4j.org. Retrieved June 7, 2014.
[15] H. Wickham. ggplot2: elegant graphics for data analysis. Springer, 2009.
[16] M. Bostock. Sankey plugin of d3. https://github.com/d3/d3-plugins/tree/master/sankey. Retrieved June 7, 2014.
[17] D. Edler and M. Rosvall. The map generator software package. Online at http://www.mapequation.org, 2010. Retrieved June 7, 2014.