Taboos, agriculture and poverty - Stanford Universityfafchamp/taboo.pdf · Taboos, agriculture and...
48
Taboos, agriculture and poverty Abstract : We study the impact of work taboos (fady days) on agriculture and poverty. Using cross-sectional data from a national household survey for Madagascar, we find that 18% of agricultural households have two or more fady days per week and that an extra fady day is associated with 6 percent lower per capita consumption and 5 percent lower rice productivity. To address the possible endogeneity of fady days, we present instrumental variable estimates and heterogeneous effect regressions using village fixed effects. We find that smaller households and those with less education employ less labor in villages with more fady days.
-
Upload
vuongquynh -
Category
Documents
-
view
221 -
download
0
Transcript of Taboos, agriculture and poverty - Stanford Universityfafchamp/taboo.pdf · Taboos, agriculture and...
Taboos, agriculture and poverty
Abstract: We study the impact of work taboos (fady days) on agriculture and poverty. Using
cross-sectional data from a national household survey for Madagascar, we find that 18% of
agricultural households have two or more fady days per week and that an extra fady day is
associated with 6 percent lower per capita consumption and 5 percent lower rice productivity.
To address the possible endogeneity of fady days, we present instrumental variable estimates and
heterogeneous effect regressions using village fixed effects. We find that smaller households and
those with less education employ less labor in villages with more fady days.
Taboos, agriculture and poverty
‘Wednesday is an evil day. If one starts working in the rice fields on a Wednesday, there will be no harvest. On the other hand, Wednesday is a good day for burials… Thursday is dangerous. It might cause death in the village and it is fady to have burials on this day… Saturday is children’s day. It is an unfortunate day for big and important work… The morning is good on Sunday but the afternoon is evil and dangerous. It is therefore fady to work on Sunday, especially in the afternoon.’
(Ruud, 1960, pp. 32-35)
1. Introduction
Habits, customs and norms have had important consequences on economic behavior,
welfare and wellbeing throughout world history (Landes, 1998; Diamond, 1998; Putnam
et al., 1993; Kay, 2004).i For example, Austen (2003) examines the link between culture
and labor markets. Based on cross-country evidence, he finds that cultural norms
influence unemployment and the wage structure in economies in his sample. Platteau
(1994) argues that the cultural endowment of a society determines its economic growth
trajectory. While the link between culture and economic behavior and outcomes has
received little attention in economics, it has played a prominent role in the anthropology
and sociology literature. Although anthropologists and sociologists usually find large
effects on people’s behavior and wellbeing, they often fail to illustrate results at a large
statistical representative scale due to lack of adequate tools and/or data.ii
Only recently have economists started looking at explanations and effects of specific
beliefs, superstition and taboos. Fudenberg and Levine (2006) and Bénabou and Tirole
(2007) develop theoretical models to explain the persistence of superstition and taboos
2
while Do and Phung (2006), Rohlfs et al. (2010), Wong and Yung (2005) , and Lee
(2005) look empirically at effects of superstition. In this paper, we analyze empirically
the relationship between taboos and agriculture and household consumption in
Madagascar using a recent comprehensive nationally representative household survey.
Madagascar is a good place to study this linkage as it is characterised by multiple taboos
(called fadyiii), often associated with eating habits and burial practices.
We study the effect of a particular work taboo whereby individuals are not allowed to
work on specific days (called fady days).iv Using data from the 2004 national household
survey, we find that 18% of the population of agricultural households has two or more
fady days per week and that an extra fady day is associated with 6 percent lower per
capita consumption and 5 percent lower rice productivity, controlling for human and
physical characteristics.v This association is statistically significant whether we use
individually reported fady days or the village average.
What is unclear is whether the association between productivity and observance of fady
can be given a causal interpretation. In particular, we would like to know whether the
elimination of work taboos would increase consumption and productivity. This is a
difficult question since we do not have truly exogenous variation in fady observance. We
seek to address it in two ways. First, we note that fady observance varies systematically
with the extent to which local communities have been targeted by missionary efforts.
This suggests using religion as an (imperfect) instrument for fady observance. Using this
approach, we again find a strong association between productivity and instrumented fady
3
observance. We cannot, however, be certain that conversion does not proxy for
something else that affects both productivity and villagers’ desire to observe fady days,
such as proximity to cities and better market opportunities.
To circumvent this difficulty, we turn to a second approach that relies on variation in
labor demand across households. The logic behind this approach is as follows. Suppose
there are more observed fady days in a village. This penalises more those households
with more land per person. Hence the negative effect of fady days on labor use should be
stronger among land-rich households. We estimate a model where household land and
proxies for work opportunities are interacted with village fady days. Since we include
village fixed effects, factors such as proximity to cities and better market opportunities
are controlled for. We find that interaction terms are statistically significant with the
anticipated sign, suggesting that households with a higher land per manpower ratio are
more likely to be constrained by local work taboos. We similarly find that educated
households are less likely to abide by – and be constrained by – work taboos. These
results provide our strongest evidence that work taboos negatively affect agricultural
productivity in Madagascar.
The structure of the paper is as follows. In section 2, we discuss the meaning and
importance of taboos in Madagascar. After describing the data in section 3, we map out
the conceptual framework and the strategies employed to test the relationship between
fady days and household consumption and agricultural production in section 4. In doing
4
so, we discuss the market failures that are consistent with the observed outcomes. In
section 5, we present the results of these tests. We finish with some concluding remarks.
2. Taboos in Madagascar
Madagascar is a country off the African coast that was settled relatively late. The earliest
known traces of human communities date only from 800 A.D. (Wright and Raokotarisoa,
2003). The modern Malagasy people have a complex ancestry, with ancestors mainly
drawn from Indonesia and eastern Africa. While all Malagasy speak one common
language, around twenty ethnic groups are still distinguished (Ramamonjisoa, 2002). The
groups are identified by common traditions and group identity.
The importance of taboos cannot be understated in Madagascar (Gennep, 1904; Verin,
1990; Bloch, 1971; Ottino, 1986; Brown, 1999; Profita, 1978). This is well worded by
Ruud (1960), an anthropologist who spent twenty years in Madagascar and the author of
a seminal work on taboos: ‘…A European who lives in the country, mixes with the
Natives, and speaks their language every day, will soon discover that the taboos are
omnipresent. If he clashes with them, he will find himself up against a wall of difficulties.
If he is ignorant of these compact and massive rules, he will meet with many unpleasant
experiences…’ (Ruud, 1960, p. 1). A taboo or fady can be translated as a prohibition,
referring to what one is not allowed to do, objects which one must not come into contact,
words which must not be uttered and places which must be avoided (Ruud, 1960). The
transgressor becomes taboo himself to his environment and his fellows.

5
Fady are generally observed for two reasons. First, they are a means through which
individuals display respect for their ancestors and for their elders (Brown, 1999). Taboos
link individuals to their ancestors and living relatives. Sharing the same taboos allows
people to identify with their clans and/or ethnic groups (Lambek, 1992). By not
observing ancestral fady, or by observing them only selectively, individuals bring
dishonor to their ancestors and can find themselves socially alienated from their
community (Ruud, 1960). It is possible to draw inference regarding the social
relationships that a person values most highly through fady observance. By passing down
lineage and societal norms to their children in the form of taboos, elders use their
authority to naturalise the existing order (Brown, 1999).
Second, fady are often adhered to out of fear. People believe that violating their fady
invites misfortune in the form of illness, crop failure, or even death. In her case study in
the Northeast of Madagascar, Brown (1999) found that most of the villagers who did not
admit to violating or abandoning a fady, said that there was one simple reason for their
adherence – fear for leprosy. Almost everyone in her study region was convinced that this
illness is the outcome of eating a particular fady food.
Ruud (1960) gives a comprehensive overview of the fady that existed in the 1960s. They
include fady related to hospitality, habits regarding eating plants and animals, behavior
towards elders, burial and child-rearing practices, agricultural activities, and so forth.
Most of them are still largely observed and are believed to have an important influence
6
on the behavior of Malagasy people today. For example, fady may be an important
element affecting deforestation. Under local customs of indigenous populations all over
the South, forests are treated with respect and fear as they are the place where sacred
forces and spirits live (WWF, 2000; Fenn et al., 1999; Moizot, 1997). But this does not
seem to affect migrants who are less bound by the social and customary fady of their
place of residence and thus, as argued by Faroux (1999), are more destructive of forests
than the local population and more than they would be themselves towards forest
resources in their natal villages. The effect of fady can in some cases be quite dramatic.
For example, in areas around Mananjara in the Southeast of the country, it is fady to
accept twins in the household as they are associated with bad luck. Twins are therefore
abandoned immediately after birth.vi
In this paper, we will specifically address the relationship between agriculture and
consumption and the observance of fady days. Fady days are among the many customs in
Madagascar determined by the vintana (destiny) system, which is pervasive over the
island. In general, the vintana system requires that sowing and harvesting, marriage and
burial, and various kinds of important work must take place, or not take place, on certain
days of the week. Any given day may be lucky or unlucky. As illustrated in the quote at
the beginning of the paper, every day and every month has its vintana character. For
many Malagasy it is impossible – even unthinkable – to oppose the vintana power as it is
almighty (Ruud, 1960).vii
7
According to the cosmologic conception of Malagasy society, a month has 28 days and
starts with the new moon and ends with the wane of the moon. A month is generally
divided in four weeks. Not only do months, weeks and days have definite destinies that
must be observed, hours of the day can also have importance. By studying the vintana,
people know what is good or bad, and what is useful or harmful. They frequently take
this into account in their everyday activities. These practices are still widely observed
today, especially in rural areas where most of the poor live (Brown, 1999; Bloch, 1971;
Verin, 1990).
Solondraibe (1988) studied the origins of fady days in the Southern Highlands. He found
that they mostly arise for two reasons. First, the ombiasa (traditional priests) impose
specific days that people are not allowed to work, as part of their vintana. These days are
part of the general taboos for larger communities, called fadibe. Second, some days are
made fady by specific families or groups after some dramatic event happened and the
family believes that by starting a fady day, it will avoid having these events repeat
themselves. For example, Solondraibe (1988) mentions that death by lightning may be
regarded as a sign that the family should not work on that particular day anymore.
Based on anthropological literature, there seems to exist a strong link between ethnicity
and the observance of fady days.viii For example, Jarosz (1994) illustrates the case for the
Sihanaka ethnic group in the eastern part of Madagascar. This ethnic group is prohibited
to work on days 1, 4, and 7 of a 12-day cycle. The prohibition extends to seasonal and
permanently hired workers. De Bourdiec (1974) found that the Sakalava ethnic group is
8
not allowed to work on the land on Tuesday and Thursday. On top of this, they are not
allowed to work on Fridays due to their religion, which leaves them only four working
days in the week. Solondraibe (1988) studied fady days within the Betsileo tribe. He
found that the number of fady days within this tribe varies significantly. Brown (1999)
observed fady days with the Betsimisaraka ethnic group in the East of the country. In
contrast with other researchers, she states that her studied population show some
flexibility and treat fady days with pragmatism: ‘Many people, once they marry, begin to
work on those days that used to be fady for them because, in combining their fady days
with those of the spouse, they simply do not have enough time to get all their work done’
(Brown, 1999, p. 259). Brown (1999) further shows that husband and wives respond to
separate authorities. Similarly, neighbors might have separate taboo days, dictated by
separate ancestral rules and passed down through separate elders. These field
observations suggest that while fady days are largely dictated by custom, there is
nevertheless an element of agency that should be kept in mind when examining the data.ix
In the face of the extensive prevalence of fady observance in Madagascar, this paper is a
modest attempt to consider the effects of one particular type of fady (i.e. days for which
family members in rural areas are not permitted to work on the farm). Before describing
the framework we adopt to identify these effects, we turn to a description of the data and
some initial summary statistics.
3. Data
9
Our main source of information to study the link between fady days and agricultural
productivity and consumption is the 2004 Enquête Prioritaire Auprès des Ménages
(EPM), a nationally representative integrated household survey of 5,454 households. The
data were collected during the months of September 2003 and January and February
2004. The sample was selected through a multi-stage sampling technique in which strata
are defined by faritany (province) and milieu (rural centers, secondary urban centers, and
primary urban centers), and primary sampling units are communes. Each of the
communes was selected systematically with probability proportional to size. In the
analysis sampling weights, defined as the inverse probability of selection, are used to
obtain accurate population estimates.
The comprehensive household questionnaire includes sections on education, health,
employment, housing, agriculture, non-agricultural enterprises, and household
expenditures and assets. The agriculture section is particularly detailed for a nationally
representative survey as it contains plot- and crop-level information. For a measure of
household well-being, in this analysis we use the estimated household-level consumption
aggregate constructed by the Institut National de la Statistique (INSTAT). Because the
main variable of interest in this study is the number of fady days (“What is the number of
fady days for your household per week – i.e. number of days you are not permitted to
work?”), we limit our analysis to households that were asked that question – those in the
agricultural section of the survey. There are 3,454 farming households in total.
10
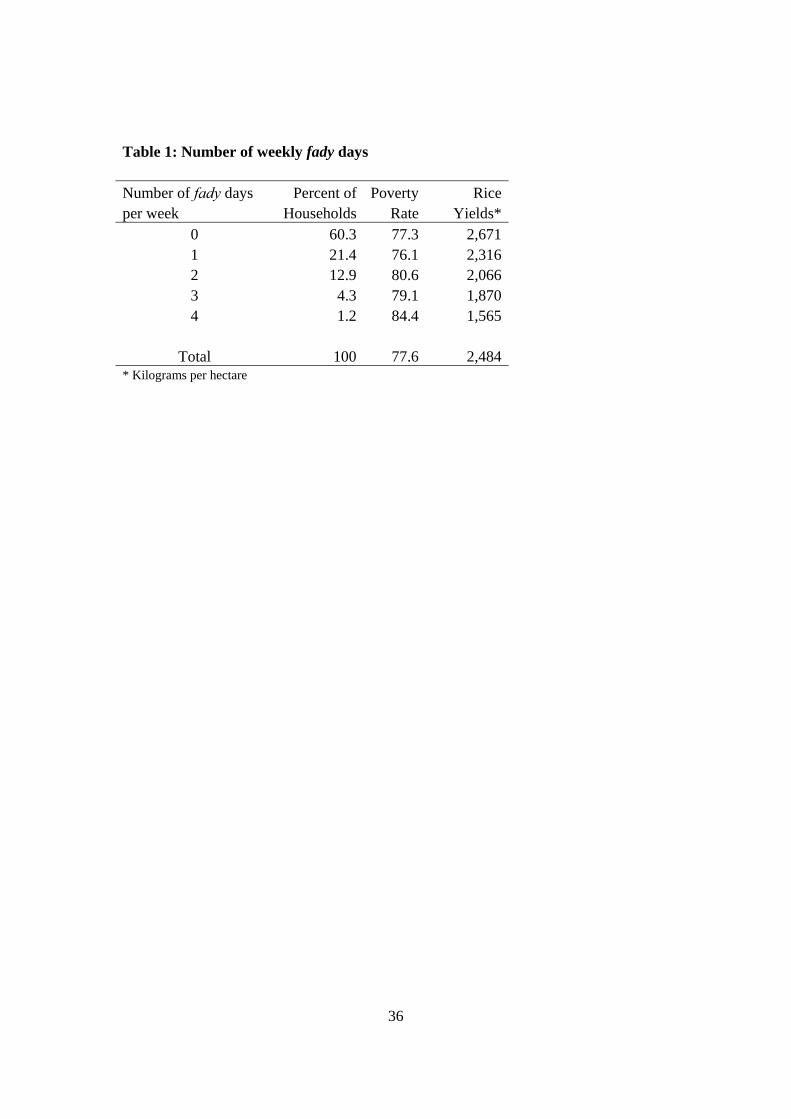
Just over 21% of households in our sample reported that, due to fady, household members
were not permitted to work one day per week (see Table 1). Some 18% reported two or
more fady days a week. At first glance, this might seem not extraordinarily high, as most
employed people in developed countries typically take two days off each week. It is
important to keep in mind, however, that agriculture is characterised by high seasonal
demand for labor.x The fady-day constraint on household supply of labor is not likely
binding during the slack periods of the agricultural calendar. But during the peak months
(that is field preparation, planting, transplanting, and harvest), the inability to fully tap
into the supply of family and hired labor is likely to have negative agricultural
productivity and consumption consequences. The evidence indeed indicates that across
households average rice yields are lower – and poverty rates higher – when the number of
fady days is high (see Table 1). For example, average rice yields for households with two
fady days are 11% lower than for those with one fady day, and the poverty rate is 6%
higher.
4. Conceptual Framework
While illustrative, the relationship depicted in Table 1 could be deceiving, that is driven
by a third factor that is correlated with both fady days and consumption/productivity. We
address this possibility using a variety of strategies. The first part of our analysis seeks to
identify the average effect of fady days on consumption and agricultural productivity.
The second examines how fady days affect different households differently.
11
In the first part of our analysis, we begin by simply regressing household consumption
and agricultural production on the reported number of fady days and a number of
household controls. This shows a strong conditional correlation between reported fady
days and welfare.
This approach is not entirely satisfactory because unobserved heterogeneity at the village
level may be correlated with fady observance and household consumption. This could
arise for instance if villages that are more backward and isolated are also poorer and more
respectful of taboos. Indeed, it could be optimal for households in more productive
villages to observe fewer fady days. Although we attempt to control for some of the
sources of these productivity differences such as soil quality and educational attainment,
others such as rainfall, access to rivers, and other dimensions of human capital are
missed.xi Allowing for this possibility by estimating village fixed effects models, the
strong conditional correlation remains between reported fady days and welfare.
Next we investigate if fady days reported by the household are correlated with
unobserved household characteristics that drive consumption income. For instance, more
prosperous households may have less time to respect fady, and thus may report lesser
fady obligations.xii To assess whether such a bias is affecting the results, we reestimate
the model by replacing the household reported number of fady days with the village
average.xiii Although, identification of the productivity effects of fady in this model
derives entirely from between village variation, the advantage of this approach is that the
village average of fady days also captures how the overall village-level labor market
12
constraints affect households. The idea is that the more fady days there are at the village
level, the more the supply of labor is restricted in the village, affecting both farm and
non-farm production of surveyed households. As noted previously, the seasonal character
of labor demand among agricultural households means that labor constraints are likely to
bind at least part of the year, and individual households may seek to overcome labor
constraints by hiring labor.xiv Such a strategy will fail, however, if the observance of fady
days by other households in the same village restricts the availability of hired labor.
Replacing individually reported fady days with the village average controls for this
possibility.xv
Replacing self-reported fady days by the village average does not eliminate all possible
sources of endogeneity however. One particular concern is that villages that got wealthier
in recent decades may be abandoning their fady practices. To address this concern, we re-
estimate the model using an instrumental variable approach in which the excluded
instrument is a dummy variable that is equal to 1 if the household head follows a
traditional religion. The assumptions needed for this instrument to be valid are discussed
in detail in the next section.
The second part of our empirical analysis focuses on the heterogeneous effect of village
average fady days on different households. To identify the relationship between
community-level fady days and household consumption, we have so far relied on
variation across villages, thereby ruling out the use of village fixed effects. As noted
previously, this is not entirely satisfactory. As such, in the second part of our analysis we
13
introduce village fixed effects into these models. Although this means that the average
effect of work taboos is no longer identified, we can still test for the existence of a
negative effect of fady days by focusing on heterogeneous effects (Angrist and Krueger,
2001).
The idea is that work taboos affect different households differently. Agricultural
households that have a lot of manpower relative to land are less likely to be constrained
by work taboos than those with a lot of land relative to their manpower. This follows
because whether the fady constraint is binding depends on a household’s demand for
labor. To illustrate this, initially consider the absence of labor markets. In this case, each
household has its own shadow wage which is determined by the household’s internal
demand for and supply of labor. On the supply side, fady observance reduces supply for a
given household size, which consequently raises the shadow wage with other things
being equal. On the demand side, the larger the land holdings relative to household size,
the more demand there is for labor relative to household size. As such, fady is more likely
to bind – that is, to push up the household shadow wage – for farmers with larger land
holdings. This implies that fady days are more likely to bind for households with a low
labor to land ratio. Introducing the existence of a labor market at the level of the village
can in principle ease the constraint for individual households.xvi But as long as fady days
bind for a large enough proportion of households, they will adversely affect village labor
supply and hence the village wage rate. Fady induced differences in the village wage rate
will then have a larger impact on farmers who demand more labor because of a low labor
to land ratio.
14
Whether taboos are constraining can thus be investigated by testing whether households
with a high labor to land ratio are less affected by village norms regarding fady days than
households with a low labor-land ratio. We also suspect that more educated heads of
household are less likely to believe in taboos and superstition. Hence they are more likely
to ignore them and hence less likely to be constrained by fady days.xvii
To test for heterogeneous effects of fady days, we estimate a reduced-form model of
demand for family labor. Because the information available in the data is limited to an
indicator of whether family labor was used on the plot, we estimate a logit model of
demand for family labor.xviii Since we also control for village fixed effects, we cannot
estimate the effect of average number of fady days observed in the village.
This test is best illustrated with the following simplified equation for a reduced form plot-
specific household demand for family labor (FL),
FL = β0 + β1( TL ) + β2( T
L * fady ) + β3(E) + β4(E* fady ) + β5(x) + ε ,
where TL , the ratio of household labor (adult equivalents) per are of landxix, represents the
availability of family labor; fady is the village average number of fady days; E is an
indicator of household educational attainment; and x represents other explanatory
variables. Village fady days are used to test two types of heterogeneous effects β2 and β4.
15
First, we test if fady norms affect households of varying sizes (relative to land holdings)
differently by using the interaction between the village average fady days and the number
of adult equivalent household members per are of cultivable land ( TL * fady ). A positive
coefficient for the interaction (β2>0) implies that fady norms are more constraining for
households with few members relative to their land holdings.xx
Second, the interaction between the village average fady days and household education
(E* fady ) is included as a way of testing how differential degrees of respect for fady
affect demand for household labor differently. A dummy variable for at least one member
of the household with a secondary or post-secondary level of education (E) is used as a
proxy for household education. A positive coefficient (β4>0) for the interaction term
implies that those with less education (more respect for fady) are more constrained by the
number of fady days observed in the village than those with more education.xxi This
would arise if more educated households disregard fady taboos during the agricultural
peak season.
5. Results
5.1. Average Effects
We begin by estimating standard OLS models (Table 2) in which the dependent variable
is the log of per capita household consumption – the measure of household ‘expenditures’
commonly used to calculate poverty. In addition to the number of fady days reported by
16
the household, we include a number of household controls to correct for possible omitted
variable bias. These controls include household demographics, education, and a series of
ethnicity and region dummies. The default ethnic group is the biggest, the Merina.
Because we suspect that respect for fady days is stronger in isolated communities and
isolated communities are poorer, we include dummies for geographical isolation
quintiles. Information on transportation costs were collected in the 2001 commune census
conducted by Cornell University. The variables used here are the quintiles of the cost of
transporting a 50 kilogram sack of rice to the nearest urban center to which commune
members travel.
The estimated coefficient on the number of reported fady days indicates that a 6 percent
lower household consumption is associated with each extra fady day. The magnitude of
the estimate is similar (5 percent) in the village fixed effects model (model 2). Estimated
coefficients for control variables are as expected and as documented in previous poverty
analysis in Madagascar (for example Razafindravonona et al., 2001). As such we do not
comment on them here, though it is interesting to note that almost none of the ethnic
variables is significant, indicating that most of the variation in consumption between
ethnic groups is accounted for by the included regressors, including variation in
remoteness.
As noted in section 4, a concern with these results is that fady days reported by the
household may be correlated with unobserved household characteristics that determine
household consumption. To correct for this, we reestimate the model using the village
17
average number of fady days as a proxy for the village norm and for the resulting village
labor market constraints. Results are shown in model 3 of Table 2. The number of village
fady days has an even larger correlation with household consumption: one extra fady day
is associated with 16 percent lower household consumption on average. To check
whether these results are driven by migrating households, we reestimate the model
without all households having migrated to their current place of residence in the last five
years. Virtually identical results are obtained; they are not shown here to save space.
Next we seek to instrument fady days. A main source of endogeneity may be that
respondents rationalise their underemployment as a result of respect for fady. As such,
the direction of causality can go either way: fady appears to cause underemployment,
while underemployment may cause respondents to report fady. To correct for this, we
need a variable that explains fady but does not cause underemployment. For this purpose,
we use adherence to traditional religions as an instrument for the observance of fady
days. Although this is the only reasonable instrument we could find given the available
data, it is important to realise its limitations.
As shown in Table 3, conversion to Christianity satisfies the inclusion restriction: the
Christian faith discourages the observance of taboos, a point that is borne out by the data.
Furthermore, since conversion to Christianity started a long time ago in Madagascar, it
cannot be suspected of simultaneity bias with the current observance of traditional taboos
– that is respondents did not convert last year in order not to follow fady days.
18
But adherence to traditional religions may nevertheless be correlated with location-
specific characteristics – such as socio-economic success – that affect labor demand and
therefore the shadow cost of respecting fady. The overall African anthropological record
seems to indicate that where conversion to various Christian faiths took place, it might
have been correlated with socio-economic change. Given this potential problem, we look
at the historical literature to better understand Christian conversion in Madagascar.
The historical literature (Raison-Jourde, 1991; Huebsch, 1993; Brown, 2002) agrees that
most early placements of missionaries in the country were driven by political objectives,
that is first the Anglicans/London Missionary Society (LMS) tried to get hold of the
Merina elite, the rulers of the country. In the late 19th and early 20th century, placements
were mostly driven by growing political competition between the Anglicans/Quakers on
the one hand and the Catholics on the other - in many cases they just tried to get
missionaries into the villages already covered by the respective other missionary societies
(the LMS also tried to get the Catholics expelled under the Merina rule and the Catholics
paid back in kind when the French took over).
Although some systematic patterns have been documented, subsequent conversion efforts
do not appear to have been systematically confined to a particular region or social class.
Raison-Jourde (1991) argues that missionaries preferred to target villages where people
were sedentary and where the state was present. These villages may have been wealthier
but there is no conclusive evidence and record on this. Within villages, poor as well as
rich people were targeted as missionaries aimed at converting as many people as possible
19
(Lupo, 1996). Brown (2002) argues that Protestants and Catholics followed different
conversions paths. Protestants went mostly for the higher castes while Catholics aimed
mostly at the lower castes of the population as well as the coastal areas because they were
more important in numbers. For example, Lupo (1996) shows that the majority of early
Catholic converts were slaves. These were attracted to Catholicism given the potential
promised abolishment of slavery, as it was contrary to Christian beliefs of human
equality. Conversion efforts thus appear to have been targeted at multiple ends of the
social scale both across and within villages.
To summarise, missionary activity in Madagascar was largely been driven by non-
economic considerations, such as political objectives and a strategy of mass conversions.
No intentional relationship should therefore exist between wealth and conversion to
Christian faith. Albeit not perfectxxii, the traditional faith variable is therefore not a totally
unreasonable instrument for the adherence to fady days.
In Table 3 we show the results of regressing fady days on religion dummies and the
household controls. The logit model relates households with two or more fady days with
religion dummies.xxiii The same controls as Table 2 appear in the regression, namely age
and gender of the household head, number of household members, ethnicity dummies,
region dummies, and isolation quintiles. xxiv
Results show that, as anticipated, Christian households report fewer fady days than those
following traditional religious traditions. The effect of religion is strongly significant,
20
indicating that the variable satisfies the inclusion restriction. Male headed households are
more likely to adhere to fady days than female-headed households. Higher levels of
education are associated with fewer fady days. Household size and the age of the head of
the household do not have a significant effect.
Instrumental variable regression results for household consumption are reported in Table
4. The effect of village fady days remains significant whether we used household
responses (with or without village fixed effects) or average village fady days. The
magnitude of the IV model coefficient estimates suggests a large impact of 47 percent
less household consumption for an extra fady day. While these results do not totally
eliminate the possibility of endogeneity bias, they nevertheless demonstrate that the
association between consumption and fady days is strong and not driven by household
response bias. They nevertheless remain fragile to the possibility that conversion to the
Christian faith is correlated with unobserved determinants of income and consumption, a
possibility that we find unlikely given the historical context in Madagascar but that we
cannot entirely rule out.
We have speculated that the channel through which fady days affect income and
consumption is through labor constraints during the agricultural peak period. To
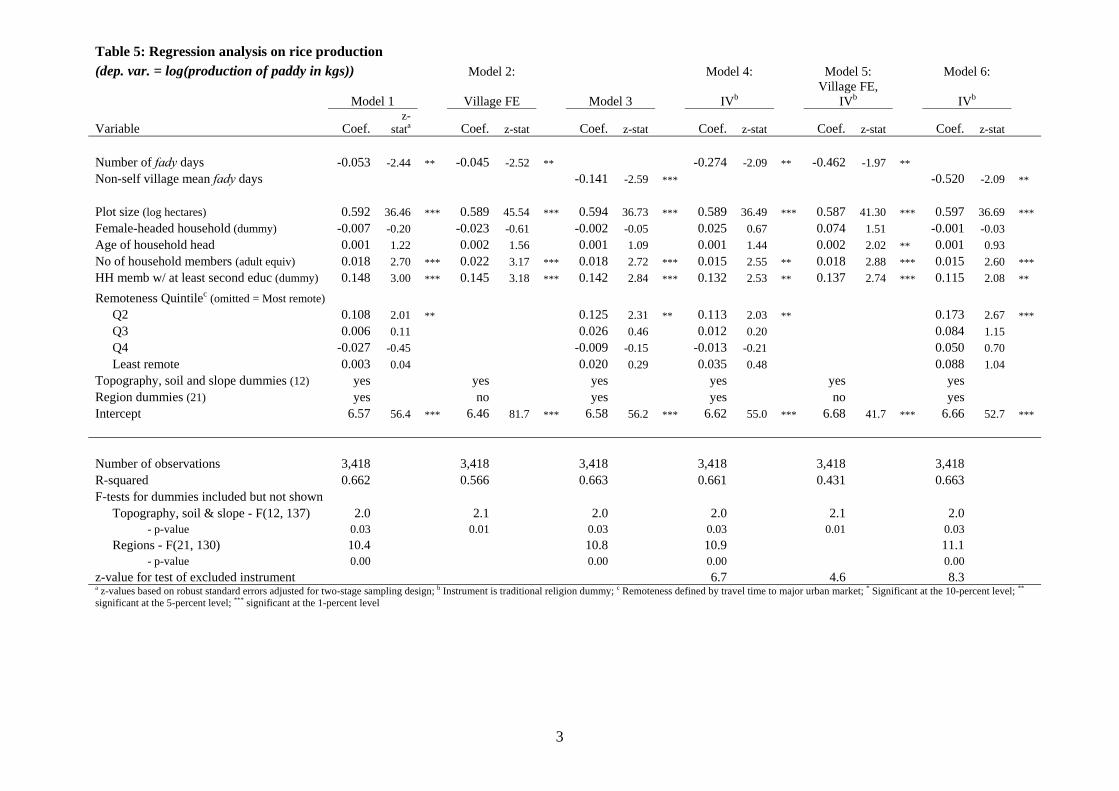
investigate this idea, we examine the effect of fady days on agricultural production. Table
5 presents reduced-form estimates of the determinants of rice production similar to those
reported in Tables 2 and 4 for consumption.xxv We focus just on rice production (log of
the kilograms of paddy produced per plot) as this is the predominant crop grown in
21
Madagascar, and as it allows for easier comparison across plots. In addition to our
variables of interest (fady days), controls include land quality and characteristics,
household demographics (to capture the quantity of household labor that can be supplied
in the absence of fady-day constraints), and education levels (to capture the quality of
labor inputs).xxvi Estimated coefficients for these variables are consistent with previous
estimates for Madagascar (Stifel and Minten, 2004), and we do not discuss them here.
In the first two models (OLS and village fixed effects) the household fady day variable is
negative and statistically significant. We find that an extra household fady day is
associated with 5 percent lower rice productivity, ceteris paribus. The next specification
(model 3) is again motivated by the possibility that household-reported fady day are
correlated with some unobserved household characteristic that also affects household rice
production. A 14% fall in rice production is associated with each extra average village
fady day. The remaining three models are the same as the first three, except that the fady
variable is instrumented, as before, using the traditional religion dummy. Coefficient
estimates for fady days remain negative and significant but are larger in magnitude.xxvii
These findings are subject to the same caveats as those discussed for the consumption
regression, but they nevertheless suggest that agricultural production may be a channel
through which fady days and household consumption are related.
5.2. Heterogeneous Effects
22
Identification of the average effect of fady days requires the assumption that household-
reported fady days are exogenous or that village fixed effects can be ignored. Despite
efforts to control for household level endogeneity using instrumental variables, neither
assumption is entirely satisfactory. In our search for evidence of a causal effect of fady
days on agricultural productivity, we now turn to a heterogeneous effect model and
estimate the model of demand for family labor outlined in section 4. Because the
information available in the data is limited to an indicator of whether family labor was
used on each plot, we estimate a reduced-form logit model. We control for unobserved
village heterogeneity by including village fixed-effects. Results are reported in Table 6.
The positive and significant marginal effects estimates for the two interaction terms in
Table 6 indicate that smaller households and those with less education employ less family
labor in villages where the average number of fady days is higher.xxviii,xxix Two points of
clarification are needed to understand these estimates fully. First, the interaction marginal
effects that appear in the table are calculated as the average of the partialxxx changes in
the probability of family labor use due to a one-day increase in fady days (holding
household size/education constant). We use the term partial because it measures the
effect of fady on family labor use only through the interaction effect.xxxi For the
household size-fady interaction, this means that we evaluate the probability change for
each observation, setting the household size per are of land equal to one, and then take
the average of the changes over the entire sample. Second, because these are partial
changes in the probabilities, the appropriate way to interpret them is to compare the
marginal effects of fady for the constrained households (for example, the ones with few
23
adults per are of land) relative to unconstrained households. The difference in marginal
effects is a measure of the effect of the constraint on labor use.
Regarding the household size relative to land holdings, it makes little sense to consider
households with no adults. As such, we estimate the interaction marginal effects of fady
for various household sizes and present them in Table 7. Thus the 0.07 marginal effect
for a household with one adult per are of land can be compared to the 0.04 for a
household with one adult for two are of land (or 0.5 adults per are of land – that is a
smaller household). This tells us that the household with more land and/or fewer adults
(0.5 adults per are) is 3 percent less likely to use family labor for rice production than the
household with less land and/or more adults (1 adult per are) in villages with one
additional fady day. Similarly, a household with one adult per are of land is 9 percent less
likely to use family labor than a household with two adults per are of land for a one day
increase in the village fady average (0.16 – 0.07).
These estimates suggest that households with more land per adult member are affected
more by the local fady norms, probably because they are more labor constrained. This
effect of fady days is progressively redistributive within villages as the more prosperous
(based on more land holdings) are more negatively influenced by fady-induced labor
constraints. Although this leads to lower intra-village inequality, it does so at the expense
of growth by merely pulling everyone to the bottom.
24
The opposite conclusion, however, follows from the interaction effect for educated
households. The marginal effect in Table 6 illustrates the difference in the effect of fady
norms between the constrained and unconstrained households and suggests those
constrained households are those with a lower level of education. Households without
secondary or post-secondary levels of education are 9 percent less likely than educated
households to use family labor in villages with a one-day higher observance in fady days.
This suggests that households with low levels of education are more likely to respect fady
norms and are more negatively affected than households with higher levels of education.
6. Conclusions
Although cultural practices and customs often have important consequences for
consumption and economic performance, they are seldom studied by economists. To fill
this gap, we study the impact of taboos on consumption and agriculture in Madagascar.
Madagascar provides a good case study because of the prevalence of taboos in everyday
life and the variation in cultural practices across the country. We analyze the effects of
days during which it is taboo to work (fady days) on agriculture and consumption. Using
data from a nationally representative household survey, we find that 18% of agricultural
households report two or more fady days per week and that an extra fady day is
associated with 6 percent lower per capita household consumption and 5 percent lower
rice productivity.
25
We adopt complementary strategies to address the potential endogeneity of fady days.
First, average effects of fady days are estimated using an instrumental variables approach
in which traditional religion serves as instrument. In the context of Madagascar, this is a
reasonable instrumentation strategy given the data constraints, albeit not a fully
convincing one because there may remain village-level factors that affect both fady
observance and welfare. To deal with this possibility, we introduce village fixed effects
and turn our attention to the presence of heterogeneous effects across households. We
find that smaller households and those with less education employ less labor in villages
with high fady observance. These results suggest that fady norms impose constraints on
labor use that differentially affect different households.
Although we estimate the effect of one particular taboo (fady days), other taboos are
widespread in rural areas and affect agricultural practices throughout Madagascar.
Freudenberger (1999), for example, illustrates how the required slaughtering of cows for
funerals, can lead to a vicious circle of deepening poverty in the case of quickly
succeeding deaths of family members. She also shows that this happens despite villagers
reporting a lack of manure as the main constraint on rice productivity in her study area. In
some other areas, it has been found that it is taboo to transport manure, generally
perceived as a major constraint to improved agricultural productivity in Africa (Barrett,
Place and Aboud, 2002). Solondraibe (1988) shows widespread taboos to cultivate even
fertile land in specific areas. Moser and Barrett (2003) further find economically and
statistically significant social conformity effects, that is Malagasy smallholders choose
their cultivation practices in part to conform to local behavioral norms, even if it means
26
sacrificing gains in expected rice output. Finally, Barrett (2005) illustrates how the
adoption of improved rice technologies is hindered because it departs with the ‘way of
the ancestors’ and although highland farmers say they cannot afford inorganic fertilisers,
they routinely pay extraordinary sums to exhume and re-shroud dead ancestors every 3-5
years, a ceremony known as famandihana.
We analyze the negative effects of taboos. Nonetheless, there could be gains from taboos
that are not analyzed here. For example, food taboos have been the subject of a large
body of research. Harris and Ross (1987) highlighted the benefits of some food taboos
towards survival. Other taboos might reflect received wisdom for social goods, for
example, Colding and Folke (2001) synthesise information on resource and habitat taboos
and find that they offer often clear benefits towards resource conservation and
management. In Madagascar in particular, Fauroux (2001) found that under local customs
of original populations all over the South, forests are treated with respect and fear as it is
the place where sacred forces and spirits live. These beliefs might thus contribute to
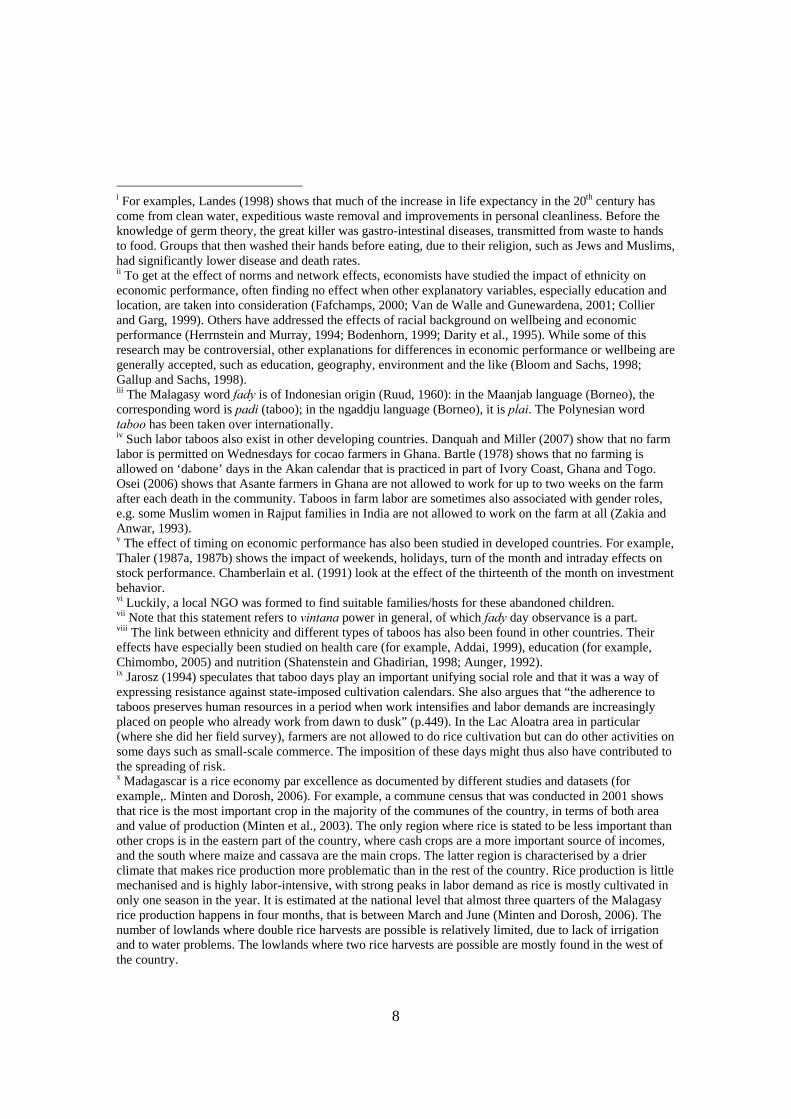
reducing deforestation.xxxii Additionally, Jarosz (1994) speculates that taboo days play an
important unifying social role and that it was a way of expressing resistance against state-
imposed cultivation calendars. She also argues that “the adherence to taboos preserves
human resources in a period when work intensifies and labor demands are increasingly
placed on people who already work from dawn to dusk” (p.449). In the Lac Alaotra area
in particular (where she did her field survey), farmers are not allowed to cultivate rice
cultivation on fady days, but can do other activities such as small-scale commerce. The
imposition of these days might thus also have contributed to the spreading of risk.
27
Taboos and other customs introduce constraints and affect the flexibility of input
markets. They can contribute to poverty and low agricultural productivity. This appears
to be the case in Madagascar. Our analysis thus contributes empirical evidence from the
agricultural field to the international literature on social capital and norms that has been
shown to potentially have important effects on economic prosperity and on development
(e.g. North, 1990; Keefer and Knack, 1997; Woolcock, 1998; Zak and Knack, 2001;
Aharonovitz and Nyaga, 2010).
28
References
Addai, I. (1999) Ethnicity and contraceptive use in Sub-Saharan Africa: The case of Ghana. Journal of Biosocial Science 31, pp. 105-120. Aharonovitz, G.D. and Nyaga, E.K. (2010) Values, Cultural Practices, and Economic Performance: Theory and Some Evidence from Kenya, World Development, forthcoming, doi:10.1016/j.worlddev.2009.12.012 Ai, C. and Norton, E. (2003) Interaction Term in Logit and Probit Models. Economic Letters 80, pp. 123-129. Angrist, J. and Krueger, A. (2001) Instrumental Variables and the Search for Identification: From Supply and Demand to Natural Experiments. Journal of Economic Perspectives, 15(4), pp. 69-85. Aunger, R. (1992) The nutritional consequences of rejecting food in the Ituri forest of Zaire. Human Ecology 20(3), pp. 263-291 Austen, S. (2003) Culture and the labor market. MA: Elgar Barrett, C. (2005) The Social Economics of Poverty. NY: Routledge. Barrett, C., Place, F. and Aboud, A. Eds. (2002) Natural Resources Management in African Agriculture: Understanding and Improving Current Practices. UK: CAB International. Bartle, F.W., (1978) Forty Days: The Akan Calendar. Africa: Journal of the International African Institute 48(1), pp.80-84 Bénabou, R. and Tirole, J. (2007) Identity, Dignity and Taboos: Beliefs as Assets. IZA Discussion Paper no. 2583, Institute for the Study of Labor (IZA), Bonn. Bloom, D. and Sachs, J. (1998) Geography, Demography and Economic Growth in Africa. Brookings Papers on Economic Activity 2, pp. 207-273. Bodenhorn, H. (1999) A Troublesome Caste: Height and Nutrition of Antebellum Virginia’s Rural Free Blacks. Journal of Economic History 59(4), pp. 972-996 Bloch, M. (1971) Placing the Dead: Tombs, Ancestral Villages and Kinship Organizations in Madagascar. NY: Seminar Press. Brown, M. (1999) Authority Relations and Trust: Social Cohesion on the Eastern Maosala Peninsula, Madagascar. Ph.D. diss., Washington University, St. Louis.
29
Brown, M. (2002) A History of Madagascar. NJ: Markus Wiener Publishers. Chamberlain, T., Chueng, C. S. and Kwan, C. (1991) The Friday the Thirteenth Effect: Myth or Reality. Quarterly Journal of Business and Economics 30(2), pp. 111-117 Chimombo, J. (2005) Issues in Basic Education in Developing Countries: An Exploration of Policy Options for Improved Delivery. Journal of International Cooperation in Education 18(1), pp. 129-152. Cogneau, D., and Robilliard, A. (2000) Growth, Distribution and Poverty in Madagascar: Learning from a Microsimulation Model in a General Equilibrium Framework. IFPRI Trade and Macroeconomics Division Discussion Paper No. 61. International Food Policy Research Institute: Washington, DC. Colding, J. and Folke, C. (2001) Social Taboos: ‘Invisible’ Systems of Local Resource Management and Biological Conservation. Ecological Applications 11(2), pp. 584-600. Collier, P. and Garg, A. (1999) On Kin Groups and Wages in the Ghanaian Labor Market. Oxford Bulletin of Economics and Statistics 61(2), pp. 133-151. Conley, T. and Udry, C. (2001) Social Learning through Networks: The Adoption of New Agricultural Technologies in Ghana. American Journal of Agricultural Economics 83(3), pp. 668-673. Cornell, B. and Welch, I. (1996) Culture, Information and Screening Discrimination. Journal of Political Economy 104(3), pp. 542-571. Cutler, D. and Glaeser, E. (1997) Are ghettos good or bad? Quarterly Journal of Economics 112(3), pp. 827-872. Danquah, F. and Miller, S.K. (2007) Cocoa farming in Ghana: Emic experience, etic interpretation, Southern Rural Sociology 22(1), pp. 65-79 Darity, W., Guilkey, D. and Wilfrey, W. (1995) Ethnicity, Race and Earnings. Economic Letters 47(3-4), pp. 401-408. Diamond, J. (1998) Guns, Germs and Steel: The Fate of Human Societies. NY: W.W. Norton & Company. Do, Q. and Phung, T.D. (2006) Superstition, Family Planning and Human Development. World Bank Policy Research Working Paper no. 4001, World Bank, Washington, DC. Fafchamps, M. (2000) Ethnicity and Credit in African Manufacturing. Journal of Development Economics 61(1), pp. 205-235.
30
Fauroux, E. (2001) Dynamiques Migratoires, Tensions Foncières, et Déforestation dans l’Ouest Malgache. In Sociétés Paysannes, Transitions Agraires et Dynamiques Écologiques dans le Sud-Ouest de Madagascar, Actes de l’Atelier CNRE – IRD, ed. Razanaka S., M. Grouzis, P. Milleville, B. Moizot et C. Aubry, Antananarivo, Madagascar.
Fenn, M., Robinson, M., Whyner, D. and Bernard, K. (1999) Les Tendances Actuelles de la Migration des Peuples et son Impact dans la Région Écologique des Forêts Épineuses à Madagascar. Photocopy, WWF, Madagascar. Freudenberger, K. (1999) Livelihoods without Livestock: A Study of Communities and Households in the Village of Andaladranovao. Photocopy, LDI, Madagascar. Fudenberg, D. and Levine, D. (2006) Superstition and Rational Learning. American Economic Review 96(3), pp. 630-651. Gallop, J.L. and Sachs, J. (1998) Geography and Economic Growth. In Proceedings of the Annual World Bank Conference on Development Economics, ed. Boris Pleskovic and Joseph Stiglitz. Washington DC: World Bank. Harris, M. and Ross, E. (1987) Food and evolution: Toward a Theory of Human Food Habits. Wenner-Gren Foundation for Anthropological Research Symposium. Herrnstein, R. and Murray, C. (1994) The Bell Curve: Intelligence and Class Structure in American Life. Free Press, New York. Huebsch, B., Ed. (1993) Madagascar et le Christianisme. Paris: Karthala Press. Jacoby, H. and Minten, B. (2008) On Measuring the Benefits of Lower Transport Costs. World Bank Policy Research Working Paper no. 4844, World Bank, Washington, DC. Jarosz, L. (1994) Taboo and Time-Work Experience in Madagascar. Geographical Review 84(4), pp. 439-450. Kay, J. (2004) Culture and Prosperity: The Truth about Markets – Why Some Nations are Rich but Most Remain Poor. NY: HarpinsCollins Publishers. Knack, S. and Keefer, P. (1997) Does Social Capital Have an Economic Payoff? A Cross-Country Investigation The Quarterly Journal of Economics, 112(4), pp. 1251-88 La Ferrera, E. (2003) Kin Groups and Reciprocity: A Model of Credit Transactions in Ghana. American Economic Review 39(5), pp. 1730-1751. Lambek, M. (1992) Taboo as a Cultural Practice among Malagasy Speakers. Man 27(2), pp. 245-266.
31
Landes, D. (1998) The Wealth and Poverty of Nations: Why Some are so Rich and Some so Poor. NY: W.W. Norton & Company. Lee, J. (2005) Marriage, Female labor supply, and Asian zodiacs. Economic Letters 87, pp. 427-432 Le Bourdiec, F. (1974) Hommes et paysages du Riz à Madagascar. Photocopy, FTM, Antananarivo.
Lokshin, M., Umapathi, N. and Paternostro, S. (2001) Robustness of Subjective Welfare Analysis in a Poor Developing Country: Madagascar 2001. World Bank Research Paper no. 2003, World Bank, Washington, DC.
Lupo, P. (1996) Perception de L’Esclavage dans Quelques Documents Catholiques à Madagascar, in L’Esclavage à Madagascar: Aspects Historiques et Résurgences Contemporaines. Actes du Colloque International sur l’Esclavage, Antananarivo, pp. 181-190
Minten, B. and Dorosh, P. (2006) Rice Markets in Madagascar in Disarray: Policy Options for Increased Efficiency and Price Stabilization. World Bank Africa Region Working Paper Series, No. 101, World Bank, Washington, DC.
Minten, B., Randrianarisoa, J.C. and Randrianarison, L. (2003) Agriculture, Pauvreté Rurale et Politiques Économiques à Madagascar. Antananarivo: Cornell University/FOFIFA/INSTAT.
Moser, C. and Barrett, C. (2003) The Disappointing Adoption Dynamics of a Yield-increasing, Low External Input Technology: the Case of SRI in Madagascar. Agricultural Systems 76(3), pp. 1085-1100. Moizot, B. (1997) Des Esprits, des Tombeaux, du Miel et des Bœufs : Perception et Utilisation de la Forêt en Pays Bara Imamono. Milieux et Sociétés dans le Sud-Ouest de Madagascar, Collecion Iles et Archipels no 23, Madagascar. North, D.C. (1990) Institutions, Institutional Change and Economic Performance. New York: Cambridge University Press. Osei, J. (2006) The Value of African Taboos for Biodiversity and Sustainable Development. Journal of Sustainable Development in Africa 8(3): 42-61 Ottino, P. (1986) L’Étrangère Intime : Essaie d’Anthropologie de la Civilisation de l’Ancien Madagascar. Editions des Archives Contemporaines. Platteau, J. (1994) Behind the Market Stage where Real Societies Exist – Part II : The Role of Moral Norms. Journal of Development Studies 30(3), pp. 753-817.
32
Profita, P. (1978) La Societé Malgache et ses Valeurs Ancestrales. Photocopy Eveche d’Ambatondrazaka. Putnam, R.D., Leonardi, R. and Nanetti, R. (1993) Making Democracy Work: Civic Institutions in Modern Italy. Princeton University Press, Princeton, NJ. Raison-Jourde, F. (1991) Bible et pouvoir à Madagascar au XIXe siècle : Invention d'une identité chrétienne et construction de l'État (1780-1880). Paris: Karthala Press. Rakotomahefa, P., Razakamanantsoa, M. and Romani, M. (2002) Madagascar Poverty Profile 2001: Technical Report. Photocopy INSTAT, Antananarivo, Madagascar Ramamonjisoa, J. (2002) Les Relations entre Ethnies à Madagascar : Une Problématique Souvent Mal Posée. Afrique Contemporaine, Trimestriel no. 202-203. Rohlfs, C., Reed, A., Yamado, H. (2010) Causal effects of sex preference on sex-blind and sex-selective child avoidance and substitution across Birth Years: Evidence from the Japanese Year of the Fire Horse Journal of Development Economics 92(1), pp. 82-95 Ruud, J. (1960) Taboo: A Study of Malagasy Customs and Beliefs. Oslo: Oslo University Press. Shatenstein, B. and Ghadirian, P. (1998) Influence of Diet, Health Behavior and their Outcome in Select Ethnocultural and Religious Groups. Nutrition 14(2), pp. 223-230. Solondraibe, T. (1988) Croyances Religieuses et Populaires Traditionelles et Agriculture: Le Cas des ‘tany fady’ et ‘andro fady’ dans le Betsileo. Recherche pour le Développement 5(1), pp. 35-62 Stifel, D. and Minten, B. (2008) Isolation and Agricultural Productivity. Agricultural Economics 39(1), pp. 1-115. Thaler, R. (1987a) Seasonal Movements in Security Prices II: Weekend, Holiday, Turn of the Month and Intraday Effects. Journal of Economic Perspectives 1(2), pp. 169-177. Thaler, R. (1987b) The January Effect. Journal of Economic Perspectives 1(1), pp. 197-201. Van Gennep, A. (1904) Tabou et totémisme à Madagascar. Paris: Ernest Leroux. Van de Walle, D. and Gunewardena, D. (2001) Sources of Ethnic Inequality. Journal of Development Economics 65(1), pp. 177-207. Verin, P. (1990) Madagascar. Paris: Editions Karthala.
33
Wong, K. and Yung, L. (2005) Do Dragons have Better Fate. Economic Inquiry 43(3), pp. 689-97 Woolcock, M. (1998) Social Capital and Economic Development: Toward a Theoretical Synthesis and Policy Framework Theory and Society 27, pp. 151-208. Wright, H. and Rakotoarisao, J.A. (2003) The Rise of Malagasy Societies: New Developments in the Archaeology of Madagascar. In The Natural History of Madagascar, ed. Steven Goodman and Jonathan Benstead. Chicago: The University of Chicago Press. Zak, P.J. and Knack, S. (2001) Trust and Growth, The Economic Journal 111(470), pp. 295-321 Zakia, A.S. and Anwar, J.Z. (1993) Muslim women: Problems and prospects, MD Publications, New Delhi
34
Appendix: Descriptive statistics
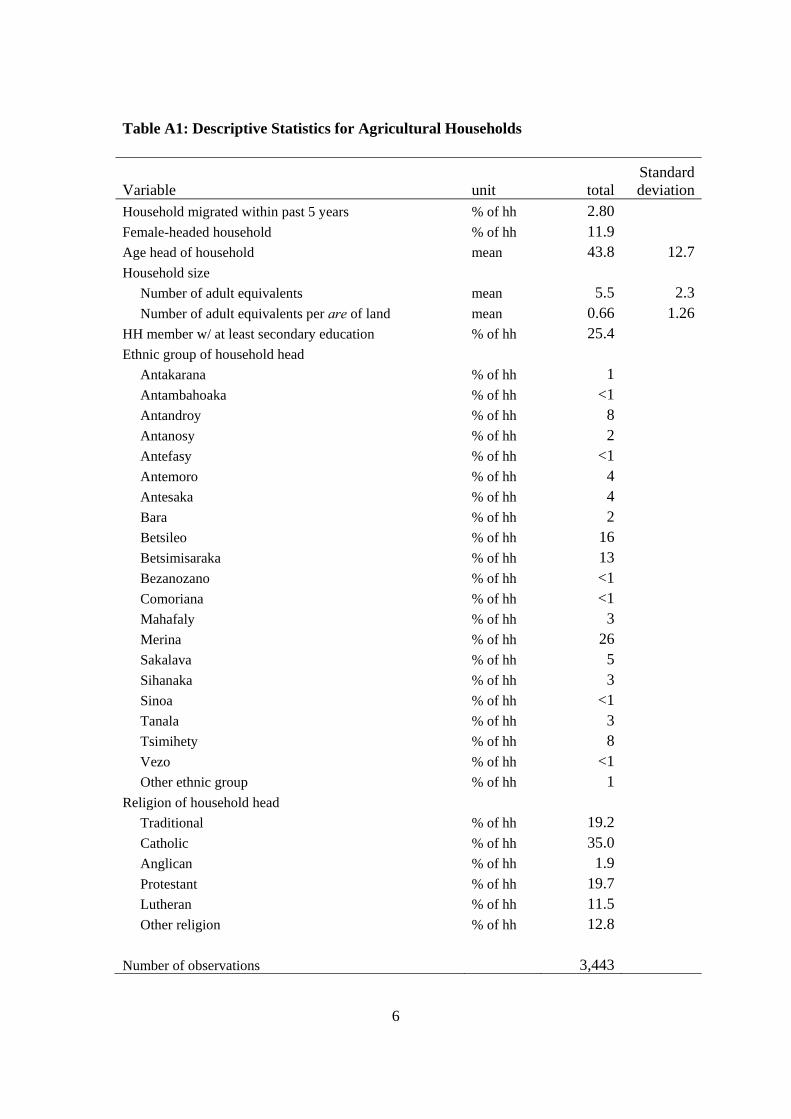
Table A1 shows some of the basic socio-economic descriptive statistics of the households
that we study. The age of the average household is 43 years. 18% of the households are
headed by females and the size of the household is 5 members. Education levels are low
as 29% of the heads of households did not receive any education. About 17% of
household heads went on to pursue secondary or higher education. The survey allowed
for 22 ethnic groups, the most important of which are the Betsileo and Merina, mostly
resident in the highlands, and the Betsimisaraka located mostly on the east coast.
Together, they account for 55% of our sample.
Poverty is high by any measure. The head-count ratio of poverty (P0) is estimated to be
77.6% of individuals in our sample, which comparable to estimates from other national
household surveys that have been held in the last decade. The depth of poverty (P1) is
estimated at 28%. The average annual per capita expenditures are estimated at almost 1
million Fmg in 2001 currency (about 150$ annually or 0.41$ per day). This high
objective poverty measurement is consistent with subjective measures in the data. About
54% of the households state that they have difficulties while 29% state that they must to
pay attention.xxxiii
Agriculture is a main source of income for households in Madagascar. Further, rice is the
primary staple crop, accounting for almost 50% of all calorie consumption in the country
(Faostat, 2000). The data used in this analysis include detailed information about
agricultural inputs and production, providing us with important information about

35
people’s livelihoods. As illustrated in Table A2, just over 37% of the reported plots in the
sample were lowland plots where mostly only rice is grown. The average plot size is
small: the mean is 38 ares and the median is 12 ares. To facilitate comparison over plots,
we focus only on rice crops in this paper. Physical characteristics of rice plots are
reported in Table A2. The low rice yields seen in Table 1 are often due to the low
adoption of improved agricultural technologies. It is estimated that only 16% of the rice
plots receive some type of modern inputs (defined as chemical fertiliser, pesticides or
herbicides). Manure and compost was used on 31% of the plots.
36
Table 1: Number of weekly fady days Number of fady days Percent of Poverty Riceper week Households Rate Yields*
0 60.3 77.3 2,6711 21.4 76.1 2,3162 12.9 80.6 2,0663 4.3 79.1 1,8704 1.2 84.4 1,565
Total 100 77.6 2,484* Kilograms per hectare
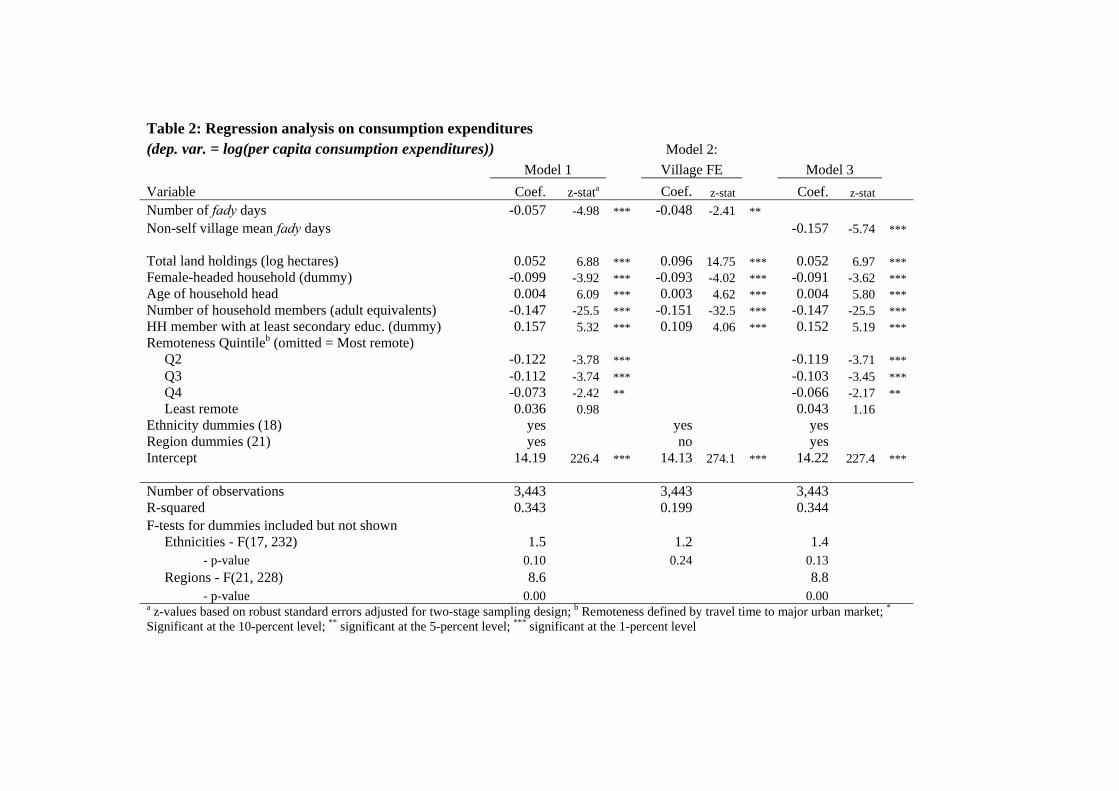
Table 2: Regression analysis on consumption expenditures
(dep. var. = log(per capita consumption expenditures)) Model 2:
Model 1 Village FE Model 3
Variable Coef. z-stata Coef. z-stat Coef. z-stat
Number of fady days -0.057 -4.98 *** -0.048 -2.41 **
Non-self village mean fady days -0.157 -5.74 *** Total land holdings (log hectares) 0.052 6.88 *** 0.096 14.75 *** 0.052 6.97 *** Female-headed household (dummy) -0.099 -3.92 *** -0.093 -4.02 *** -0.091 -3.62 *** Age of household head 0.004 6.09 *** 0.003 4.62 *** 0.004 5.80 *** Number of household members (adult equivalents) -0.147 -25.5 *** -0.151 -32.5 *** -0.147 -25.5 *** HH member with at least secondary educ. (dummy) 0.157 5.32 *** 0.109 4.06 *** 0.152 5.19 *** Remoteness Quintileb (omitted = Most remote) Q2 -0.122 -3.78 *** -0.119 -3.71 ***
Q3 -0.112 -3.74 *** -0.103 -3.45 *** Q4 -0.073 -2.42 ** -0.066 -2.17 ** Least remote 0.036 0.98 0.043 1.16 Ethnicity dummies (18) yes yes yes Region dummies (21) yes no yes Intercept 14.19 226.4 *** 14.13 274.1 *** 14.22 227.4 ***
Number of observations 3,443 3,443 3,443 R-squared 0.343 0.199 0.344
F-tests for dummies included but not shown Ethnicities - F(17, 232) 1.5 1.2 1.4
- p-value 0.10 0.24 0.13
Regions - F(21, 228) 8.6 8.8
- p-value 0.00 0.00 a z-values based on robust standard errors adjusted for two-stage sampling design; b Remoteness defined by travel time to major urban market; * Significant at the 10-percent level; ** significant at the 5-percent level; *** significant at the 1-percent level
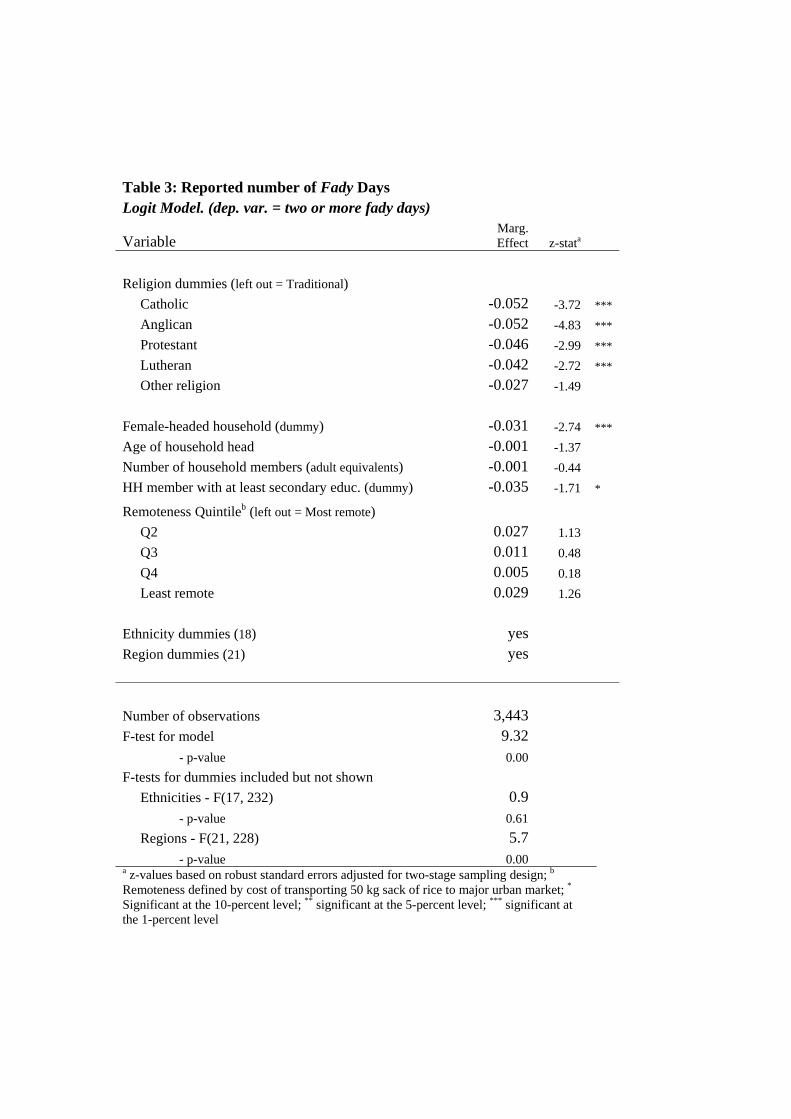
Table 3: Reported number of Fady Days
Logit Model. (dep. var. = two or more fady days)
Variable Marg. Effect z-stata
Religion dummies (left out = Traditional)
Catholic -0.052 -3.72 ***
Anglican -0.052 -4.83 ***
Protestant -0.046 -2.99 ***
Lutheran -0.042 -2.72 ***
Other religion -0.027 -1.49
Female-headed household (dummy) -0.031 -2.74 ***
Age of household head -0.001 -1.37
Number of household members (adult equivalents) -0.001 -0.44
HH member with at least secondary educ. (dummy) -0.035 -1.71 *
Remoteness Quintileb (left out = Most remote)
Q2 0.027 1.13
Q3 0.011 0.48
Q4 0.005 0.18
Least remote 0.029 1.26
Ethnicity dummies (18) yes
Region dummies (21) yes
Number of observations 3,443
F-test for model 9.32
- p-value 0.00
F-tests for dummies included but not shown
Ethnicities - F(17, 232) 0.9
- p-value 0.61
Regions - F(21, 228) 5.7
- p-value 0.00 a z-values based on robust standard errors adjusted for two-stage sampling design; b Remoteness defined by cost of transporting 50 kg sack of rice to major urban market; * Significant at the 10-percent level; ** significant at the 5-percent level; *** significant at the 1-percent level
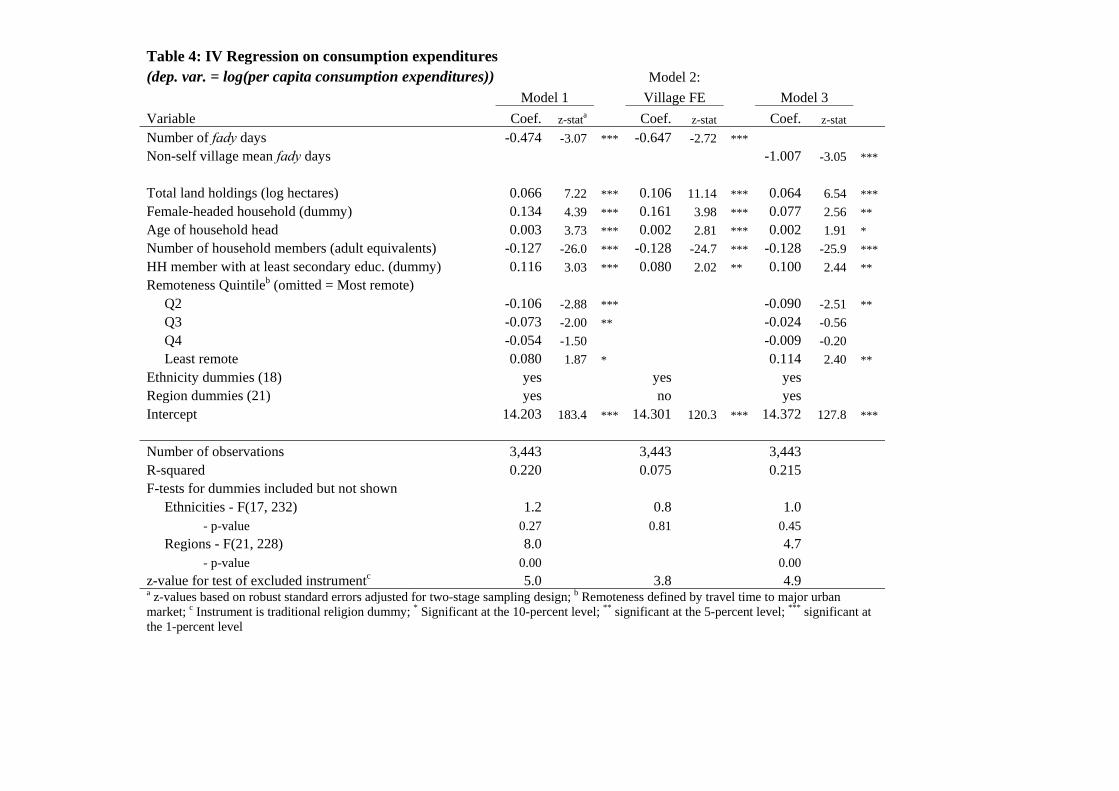
Table 4: IV Regression on consumption expenditures
(dep. var. = log(per capita consumption expenditures)) Model 2:
Model 1 Village FE Model 3
Variable Coef. z-stata Coef. z-stat Coef. z-stat
Number of fady days -0.474 -3.07 *** -0.647 -2.72 ***
Non-self village mean fady days -1.007 -3.05 ***
Total land holdings (log hectares) 0.066 7.22 *** 0.106 11.14 *** 0.064 6.54 ***
Female-headed household (dummy) 0.134 4.39 *** 0.161 3.98 *** 0.077 2.56 **
Age of household head 0.003 3.73 *** 0.002 2.81 *** 0.002 1.91 *
Number of household members (adult equivalents) -0.127 -26.0 *** -0.128 -24.7 *** -0.128 -25.9 ***
HH member with at least secondary educ. (dummy) 0.116 3.03 *** 0.080 2.02 ** 0.100 2.44 **
Remoteness Quintileb (omitted = Most remote)
Q2 -0.106 -2.88 *** -0.090 -2.51 **
Q3 -0.073 -2.00 ** -0.024 -0.56
Q4 -0.054 -1.50 -0.009 -0.20
Least remote 0.080 1.87 * 0.114 2.40 **
Ethnicity dummies (18) yes yes yes
Region dummies (21) yes no yes
Intercept 14.203 183.4 *** 14.301 120.3 *** 14.372 127.8 ***
Number of observations 3,443 3,443 3,443
R-squared 0.220 0.075 0.215
F-tests for dummies included but not shown
Ethnicities - F(17, 232) 1.2 0.8 1.0
- p-value 0.27 0.81 0.45
Regions - F(21, 228) 8.0 4.7 - p-value 0.00 0.00
z-value for test of excluded instrumentc 5.0 3.8 4.9 a z-values based on robust standard errors adjusted for two-stage sampling design; b Remoteness defined by travel time to major urban market; c Instrument is traditional religion dummy; * Significant at the 10-percent level; ** significant at the 5-percent level; *** significant at the 1-percent level
3
Table 5: Regression analysis on rice production
(dep. var. = log(production of paddy in kgs)) Model 2: Model 4: Model 5: Model 6:
Model 1 Village FE Model 3 IVb Village FE,
IVb IVb
Variable Coef. z-
stata Coef. z-stat Coef. z-stat Coef. z-stat Coef. z-stat Coef. z-stat Number of fady days -0.053 -2.44 ** -0.045 -2.52 ** -0.274 -2.09 ** -0.462 -1.97 **
Non-self village mean fady days -0.141 -2.59 *** -0.520 -2.09 **
Plot size (log hectares) 0.592 36.46 *** 0.589 45.54 *** 0.594 36.73 *** 0.589 36.49 *** 0.587 41.30 *** 0.597 36.69 ***
Female-headed household (dummy) -0.007 -0.20 -0.023 -0.61 -0.002 -0.05 0.025 0.67 0.074 1.51 -0.001 -0.03
Age of household head 0.001 1.22 0.002 1.56 0.001 1.09 0.001 1.44 0.002 2.02 ** 0.001 0.93
No of household members (adult equiv) 0.018 2.70 *** 0.022 3.17 *** 0.018 2.72 *** 0.015 2.55 ** 0.018 2.88 *** 0.015 2.60 ***
HH memb w/ at least second educ (dummy) 0.148 3.00 *** 0.145 3.18 *** 0.142 2.84 *** 0.132 2.53 ** 0.137 2.74 *** 0.115 2.08 **
Remoteness Quintilec (omitted = Most remote)
Q2 0.108 2.01 ** 0.125 2.31 ** 0.113 2.03 ** 0.173 2.67 ***
Q3 0.006 0.11 0.026 0.46 0.012 0.20 0.084 1.15
Q4 -0.027 -0.45 -0.009 -0.15 -0.013 -0.21 0.050 0.70
Least remote 0.003 0.04 0.020 0.29 0.035 0.48 0.088 1.04
Topography, soil and slope dummies (12) yes yes yes yes yes yes
Region dummies (21) yes no yes yes no yes
Intercept 6.57 56.4 *** 6.46 81.7 *** 6.58 56.2 *** 6.62 55.0 *** 6.68 41.7 *** 6.66 52.7 ***
Number of observations 3,418 3,418 3,418 3,418 3,418 3,418 R-squared 0.662 0.566 0.663 0.661 0.431 0.663 F-tests for dummies included but not shown Topography, soil & slope - F(12, 137) 2.0 2.1 2.0 2.0 2.1 2.0 - p-value 0.03 0.01 0.03 0.03 0.01 0.03
Regions - F(21, 130) 10.4 10.8 10.9 11.1 - p-value 0.00 0.00 0.00 0.00
z-value for test of excluded instrument 6.7 4.6 8.3 a z-values based on robust standard errors adjusted for two-stage sampling design; b Instrument is traditional religion dummy; c Remoteness defined by travel time to major urban market; * Significant at the 10-percent level; ** significant at the 5-percent level; *** significant at the 1-percent level
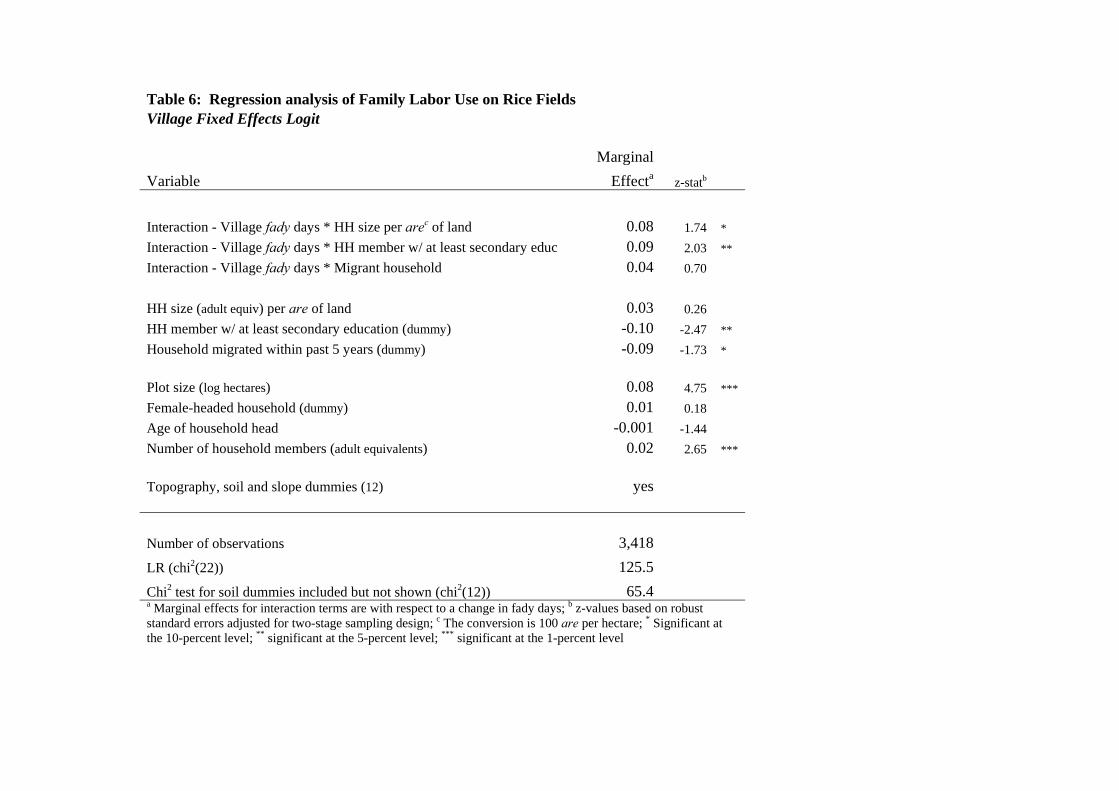
Table 6: Regression analysis of Family Labor Use on Rice Fields
Village Fixed Effects Logit
Marginal
Variable Effecta z-statb
Interaction - Village fady days * HH size per arec of land 0.08 1.74 *
Interaction - Village fady days * HH member w/ at least secondary educ 0.09 2.03 **
Interaction - Village fady days * Migrant household 0.04 0.70
HH size (adult equiv) per are of land 0.03 0.26
HH member w/ at least secondary education (dummy) -0.10 -2.47 **
Household migrated within past 5 years (dummy) -0.09 -1.73 *
Plot size (log hectares) 0.08 4.75 ***
Female-headed household (dummy) 0.01 0.18
Age of household head -0.001 -1.44
Number of household members (adult equivalents) 0.02 2.65 ***
Topography, soil and slope dummies (12) yes
Number of observations 3,418
LR (chi2(22)) 125.5
Chi2 test for soil dummies included but not shown (chi2(12)) 65.4 a Marginal effects for interaction terms are with respect to a change in fady days; b z-values based on robust standard errors adjusted for two-stage sampling design; c The conversion is 100 are per hectare; * Significant at the 10-percent level; ** significant at the 5-percent level; *** significant at the 1-percent level
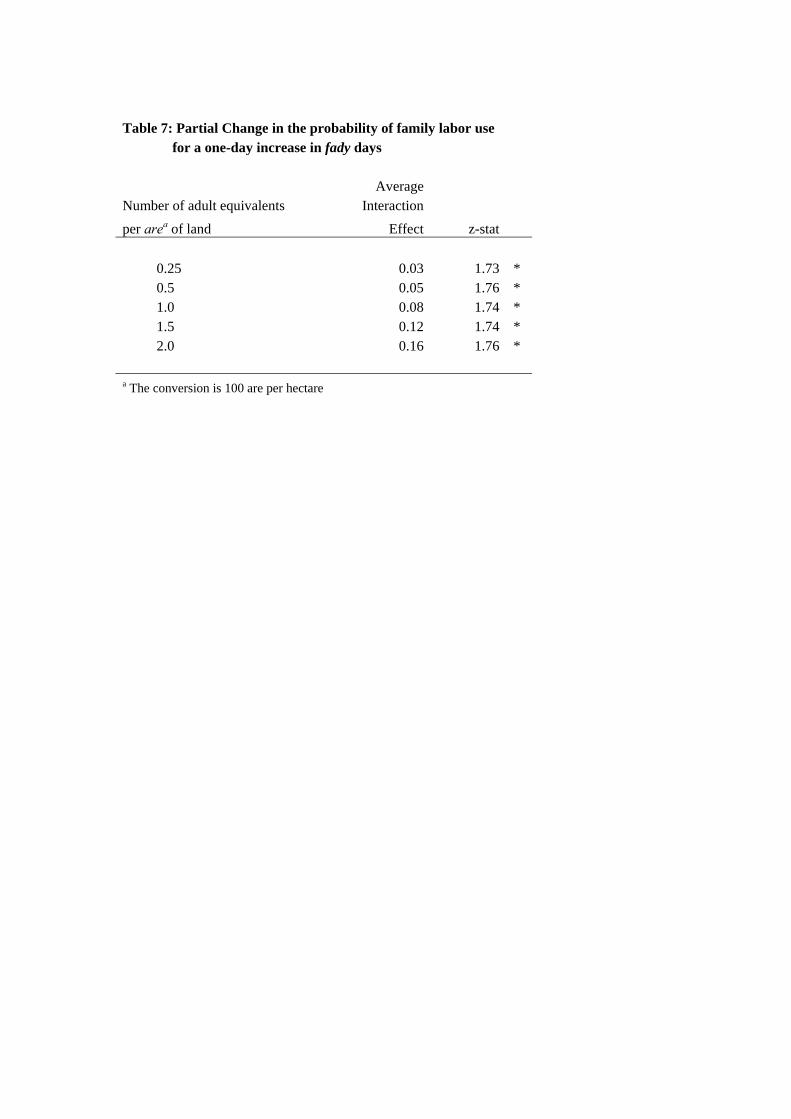
Table 7: Partial Change in the probability of family labor use for a one-day increase in fady days Average Number of adult equivalents Interaction
per area of land Effect z-stat
0.25 0.03 1.73 * 0.5 0.05 1.76 * 1.0 0.08 1.74 * 1.5 0.12 1.74 * 2.0 0.16 1.76 * a The conversion is 100 are per hectare
6
Table A1: Descriptive Statistics for Agricultural Households
Variable unit total Standard deviation
Household migrated within past 5 years % of hh 2.80 Female-headed household % of hh 11.9 Age head of household mean 43.8 12.7Household size Number of adult equivalents mean 5.5 2.3 Number of adult equivalents per are of land mean 0.66 1.26HH member w/ at least secondary education % of hh 25.4 Ethnic group of household head Antakarana % of hh 1 Antambahoaka % of hh <1 Antandroy % of hh 8 Antanosy % of hh 2 Antefasy % of hh <1 Antemoro % of hh 4 Antesaka % of hh 4 Bara % of hh 2 Betsileo % of hh 16 Betsimisaraka % of hh 13 Bezanozano % of hh <1 Comoriana % of hh <1 Mahafaly % of hh 3 Merina % of hh 26 Sakalava % of hh 5 Sihanaka % of hh 3 Sinoa % of hh <1 Tanala % of hh 3 Tsimihety % of hh 8 Vezo % of hh <1 Other ethnic group % of hh 1 Religion of household head Traditional % of hh 19.2 Catholic % of hh 35.0 Anglican % of hh 1.9 Protestant % of hh 19.7 Lutheran % of hh 11.5 Other religion % of hh 12.8 Number of observations 3,443
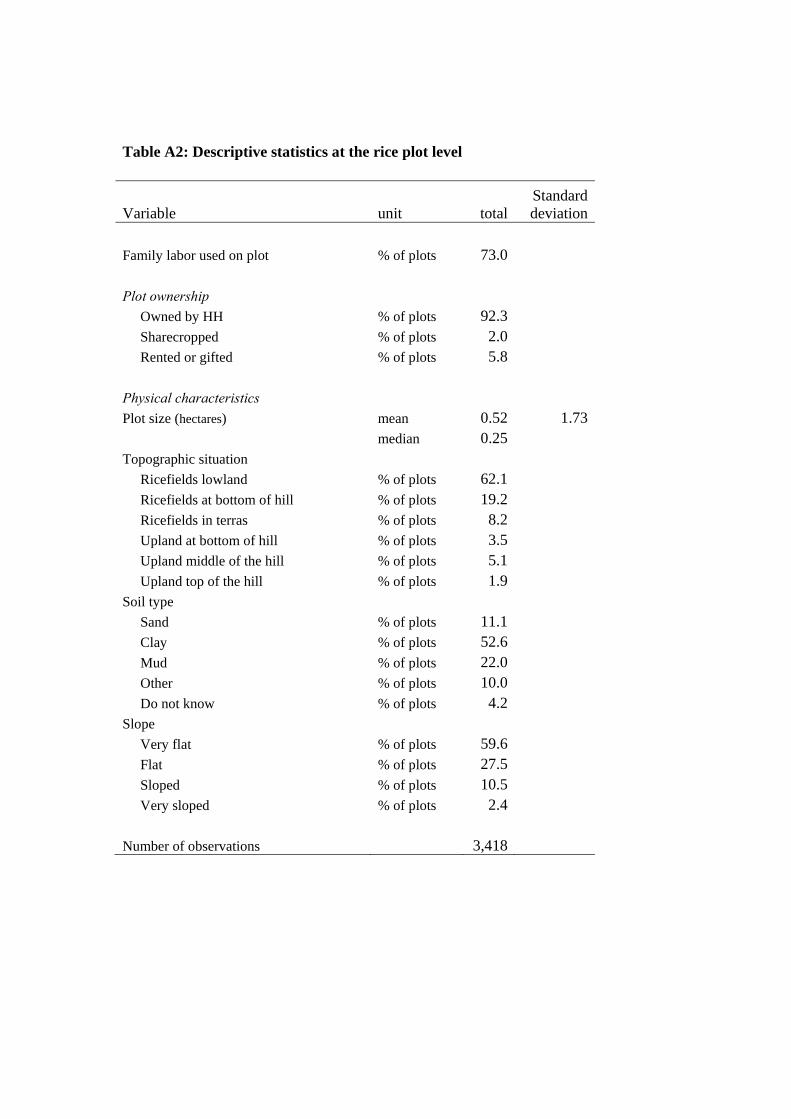
Table A2: Descriptive statistics at the rice plot level
Variable unit totalStandard deviation
Family labor used on plot % of plots 73.0 Plot ownership Owned by HH % of plots 92.3 Sharecropped % of plots 2.0 Rented or gifted % of plots 5.8 Physical characteristics Plot size (hectares) mean 0.52 1.73 median 0.25 Topographic situation Ricefields lowland % of plots 62.1 Ricefields at bottom of hill % of plots 19.2 Ricefields in terras % of plots 8.2 Upland at bottom of hill % of plots 3.5 Upland middle of the hill % of plots 5.1 Upland top of the hill % of plots 1.9 Soil type Sand % of plots 11.1 Clay % of plots 52.6 Mud % of plots 22.0 Other % of plots 10.0 Do not know % of plots 4.2 Slope Very flat % of plots 59.6 Flat % of plots 27.5 Sloped % of plots 10.5 Very sloped % of plots 2.4 Number of observations 3,418
8
i For examples, Landes (1998) shows that much of the increase in life expectancy in the 20th century has come from clean water, expeditious waste removal and improvements in personal cleanliness. Before the knowledge of germ theory, the great killer was gastro-intestinal diseases, transmitted from waste to hands to food. Groups that then washed their hands before eating, due to their religion, such as Jews and Muslims, had significantly lower disease and death rates. ii To get at the effect of norms and network effects, economists have studied the impact of ethnicity on economic performance, often finding no effect when other explanatory variables, especially education and location, are taken into consideration (Fafchamps, 2000; Van de Walle and Gunewardena, 2001; Collier and Garg, 1999). Others have addressed the effects of racial background on wellbeing and economic performance (Herrnstein and Murray, 1994; Bodenhorn, 1999; Darity et al., 1995). While some of this research may be controversial, other explanations for differences in economic performance or wellbeing are generally accepted, such as education, geography, environment and the like (Bloom and Sachs, 1998; Gallup and Sachs, 1998). iii The Malagasy word fady is of Indonesian origin (Ruud, 1960): in the Maanjab language (Borneo), the corresponding word is padi (taboo); in the ngaddju language (Borneo), it is plai. The Polynesian word taboo has been taken over internationally. iv Such labor taboos also exist in other developing countries. Danquah and Miller (2007) show that no farm labor is permitted on Wednesdays for cocao farmers in Ghana. Bartle (1978) shows that no farming is allowed on ‘dabone’ days in the Akan calendar that is practiced in part of Ivory Coast, Ghana and Togo. Osei (2006) shows that Asante farmers in Ghana are not allowed to work for up to two weeks on the farm after each death in the community. Taboos in farm labor are sometimes also associated with gender roles, e.g. some Muslim women in Rajput families in India are not allowed to work on the farm at all (Zakia and Anwar, 1993). v The effect of timing on economic performance has also been studied in developed countries. For example, Thaler (1987a, 1987b) shows the impact of weekends, holidays, turn of the month and intraday effects on stock performance. Chamberlain et al. (1991) look at the effect of the thirteenth of the month on investment behavior. vi Luckily, a local NGO was formed to find suitable families/hosts for these abandoned children. vii Note that this statement refers to vintana power in general, of which fady day observance is a part. viii The link between ethnicity and different types of taboos has also been found in other countries. Their effects have especially been studied on health care (for example, Addai, 1999), education (for example, Chimombo, 2005) and nutrition (Shatenstein and Ghadirian, 1998; Aunger, 1992). ix Jarosz (1994) speculates that taboo days play an important unifying social role and that it was a way of expressing resistance against state-imposed cultivation calendars. She also argues that “the adherence to taboos preserves human resources in a period when work intensifies and labor demands are increasingly placed on people who already work from dawn to dusk” (p.449). In the Lac Aloatra area in particular (where she did her field survey), farmers are not allowed to do rice cultivation but can do other activities on some days such as small-scale commerce. The imposition of these days might thus also have contributed to the spreading of risk. x Madagascar is a rice economy par excellence as documented by different studies and datasets (for example,. Minten and Dorosh, 2006). For example, a commune census that was conducted in 2001 shows that rice is the most important crop in the majority of the communes of the country, in terms of both area and value of production (Minten et al., 2003). The only region where rice is stated to be less important than other crops is in the eastern part of the country, where cash crops are a more important source of incomes, and the south where maize and cassava are the main crops. The latter region is characterised by a drier climate that makes rice production more problematic than in the rest of the country. Rice production is little mechanised and is highly labor-intensive, with strong peaks in labor demand as rice is mostly cultivated in only one season in the year. It is estimated at the national level that almost three quarters of the Malagasy rice production happens in four months, that is between March and June (Minten and Dorosh, 2006). The number of lowlands where double rice harvests are possible is relatively limited, due to lack of irrigation and to water problems. The lowlands where two rice harvests are possible are mostly found in the west of the country.
9
xi We thank an anonymous referee for making this point. xii Another concern is that more traditional households may simultaneously be more likely to adhere to fady days and less likely to adopt modern agricultural technologies. In an effort to address this concern, we included use of modern inputs as regressors in the agricultural production regressions. The results were insignificant and thus not reported here. This is likely due to the fact only 12 percent of respondents reported using modern methods. xiii The household’s reported fady days are omitted from the village average. Further, a detailed analysis of the distributions of reported fady days within villages indicates that there do not exist villages in which the average masks the simultaneous coexistence of concentrations of low and high fady-observance groups. In other words, the averages genuinely represent central tendencies. xiv For example, as Cogneau and Robilliard (2000) write “hiring [labor] is particularly important at the time of rice transplanting in irrigated rice fields. On each field, this operation must be carried out quickly, ideally in a day, so that the seedlings grow at the same pace and appropriate water control can be assured. Typically, rice-grower households call upon paid work or mutual aid during this period.” xv Note that this specification rules out the possibility of estimating village fixed effects models since the village average fady days would not be identified. xvi Village-level labor markets that are not nationally integrated are fair to assume given high transport costs (Stifel and Minten, 2008, and Jacoby and Minten, 2008). xvii Fady days are related to working on the farm and do not restrict schooling activities. As such, while education levels may affect the degree of fady observance, the number of fady days reported by households is not likely to affect human capital accumulation. xviii Note that for 25 percent of plots in the sample, households do not use any household labor and instead rely entirely on hired labor. xix The conversion is 100 are per hectare. xx Note that we expect β1 < 0, as a lower labor/land ratio increases the marginal product of labor. xxi More educated individuals may have less cash or credit constraints and thus may be in a better position to hire labor. This is why household education enters the regression as a separate regressor. This should not affect the interpretation of the interaction term with fady days. xxii One caveat might exist if there are clear benefits from religious affiliation. These could be local-run projects and political advantages. However, most political parties in Madagascar are not formed along religious lines and would thus not lead to a systematic relationship. No data are available on the presence of local church-run projects. Another problem might be that while there is no evidence that indicates that missionaries were selective at converting villages to Christianity, villages might however have been differentially receptive to those efforts, with more productive or richer ones having greater benefits in accepting conversion or higher opportunity costs in resisting it and less productive characterized by the reverse configuration. Unfortunately, we have no data at our disposal as to test and completely eliminate this possibility. xxiii Similar regressions of reported number of fady days were also estimated using OLS, Tobit and ordered probit methods. The results were not qualitatively different from those that appear in Table 3 and are thus not reported here, though they are available from the authors upon request. xxiv Although the ethnicity estimates are not presented in the table, twelve out of the 19 ethnic groups in the data show a significant different number of fady days than the Merina, the main ethnic group in Madagascar. They all have more fady days except for the Chinese and Comoron immigrants, who have significantly fewer. As expected, these latter groups are little affected by local customs. xxv While the plot-level data used in this analysis are very detailed for a nationally representative household survey, they do not include information on quantities of labor and non-labor inputs. As such, structural estimates of production functions are not possible. xxvi Descriptive statistics appear in Appendix Table A2. xxvii In addition, the z-statistics for the tests of significance of the excluded instruments are 6.7 (p<0.001) and 8.3 (p<0.001), indicating that we can have confidence in the exclusion restriction. xxviii Roughly 6 percent of the households in the sample practice sharecropping. To address the effect that this may have on land (and consequently household size relative to land), the models in Table 6 were re-estimated using various different specifications to control for sharecropping. These include using dummy variables for sharecropping, adjusting household land size by the area of land sharecropped, and estimating
10
the model on the sample of households not practicing sharecropping. The results reported in Table 6 are robust to these different specifications of the model and are thus not reported here. xxix We also include an interaction between village fady days and the household’s migrant status. The rationale is that household with a migrant may be less inclined to follow local customs. As illustrated in Table 6, this interaction term is not significantly different from zero. xxx That is we take the average of the following probabilities evaluated for each observation,
F( x ) (1- F( x )) xL/T βL/T * fady ,
where xL/T is the number of adults per are of land (set to one), and βL/T*fady is the estimated coefficient for the interaction. Ignoring the education interaction for simplicity, note that the change in the probability of family labor use for a one day increase in village fady observance is
F( x ) (1- F( x )) (βfady + xL/T βL/T*fady).
The difference between the interaction marginal effect and the total change in the probability of family labor use is the direct effect of fady day observance (F( x ) (1- F( x )) (βfady)). This cannot be estimated
because we estimate a fixed effects logit model (that is βfady is differenced out). Thus the marginal effects reported in Table 5 for the interaction terms are partial changes in the probabilities. xxxi Note further that this is different from Ai and Norton (2003), who interpret the interaction in a logit model as a double-difference. xxxii It is especially the migrants that are destructive for forests as they are less bound by social and customary obligations (Fauroux, 1999). xxxiii By comparing actual expenditures of the household with self-reported welfare levels in the case of Madagascar, Lokshin et al. (2003) show that this type of subjective assessment are a good alternative indication of the welfare level of households in the absence of expenditure measurements.