Tables and Slope Return to Table of Contents. xy -3 05 311 How can slope and the y-intercept be...
30
Tables and Slope Return to Table of Contents
-
Upload
mercy-davidson -
Category
Documents
-
view
218 -
download
0
Transcript of Tables and Slope Return to Table of Contents. xy -3 05 311 How can slope and the y-intercept be...

Tables and Slope
Return to Table
of Contents

x y
-3 -1
0 5
3 11
How can slope and the y-intercept be found within the table?
· Look for the change in the y-values· Look for the change in the x-values· Write as a ratio (simpified) - this will be the "slope"· Determine the corresponding y-value to the x-value of 0 - this will be the "y-intercept"
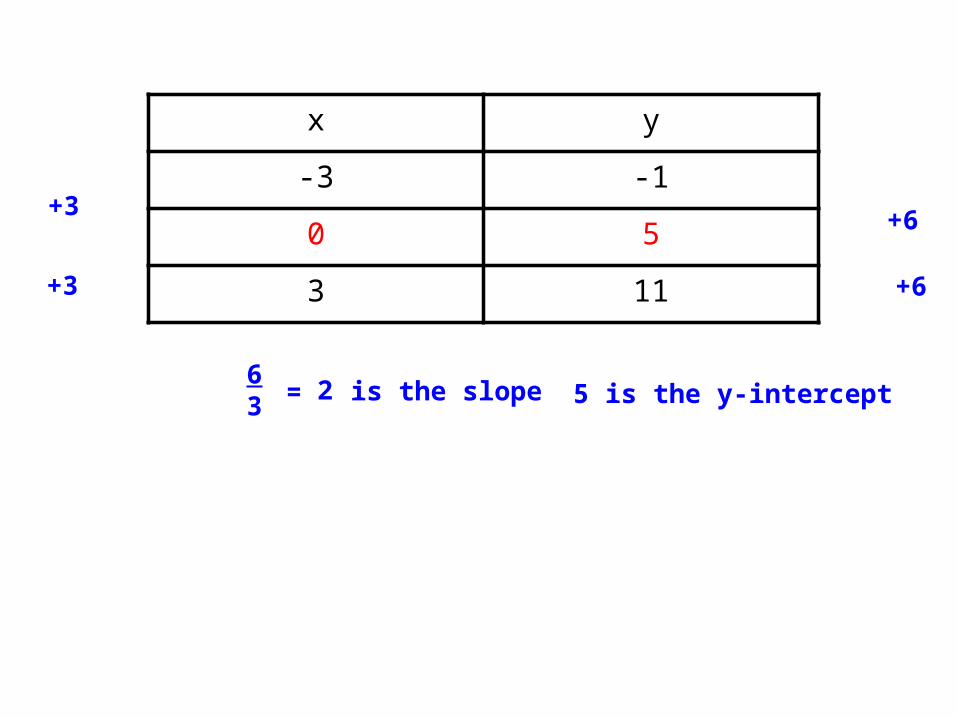
x y
-3 -1
0 5
3 11
+6
+6
+3
+3
63 = 2 is the slope 5 is the y-intercept

-4 is the y-intercept is the slope
x y
5 -5
0 -4
-5 -3
Determine the slope and y-intercept from this table.
click to reveal answer

34
x y
-2 5
0 3
2 1
What is the slope?

35
x y
-1 -12
1 -4
3 4
What is the y-intercept? You may have to do a little extra work for this one...

36
x y
-1 -12
1 -4
3 4
What is the slope?

37
x y
-3 10
-2 8
-1 6
What is the y-intercept? You may have to do a little extra work for this one...

38
x y
-3 10
-2 8
-1 6
What is the slope?

Another Application of the Definition of Slope
Slope of a line is meant to measure how fast it is climbing or descending.
A road might rise 1 foot for every 10 feet of horizontal distance.
10 feet
1 foot
The ratio, 1/10, which is called slope, is a measure of the steepness of the hill. Engineers call this use of slope grade.
What do you think a grade of 4% means?

Slope of 3/20
20 feet
3 feet
3 feet
7 feet
slope of -3/7(The grade of this hill is 3/20 = .15= 15%)
(The grade of this hill is 3/7 = .43= 43%)

y = mx + b
Return to Table
of Contents
Slope-Intercept Form

Once you have identified the slope and y-intercept in an equation, it is easy to graph it!
To graph y = 3x + 5...follow these steps:· Plot the y-intercept, in this case (0, 5)· Use the simplified rise over run to plot the next point - in this case, from (0, 5) go UP 3 units and RIGHT 1 unit to plot the next point. Connect the points.

Try this...graph y = -2x - 3
· Start at the y-intercept - plot it.· From the y-intercept, use the slope "m" to plot the next point. How would you use rise over run to plot -2?· Connect the points.
Did you have different points plotted? Does it make a difference?

Try this...graph 4y = x + 12 (is this in y=mx + b form?)
· Start at the y-intercept - plot it.· From the y-intercept, use the slope "m" to plot the next point. How would you use rise over run to plot it?· Connect the points.
Did you have different points plotted? Does it make a difference?

Try this...graph 5x + y = -4 (is this in y=mx + b form?)
· Start at the y-intercept - plot it.· From the y-intercept, use the slope "m" to plot the next point. How would you use rise over run to plot it?· Connect the points.
Did you have different points plotted? Does it make a difference?
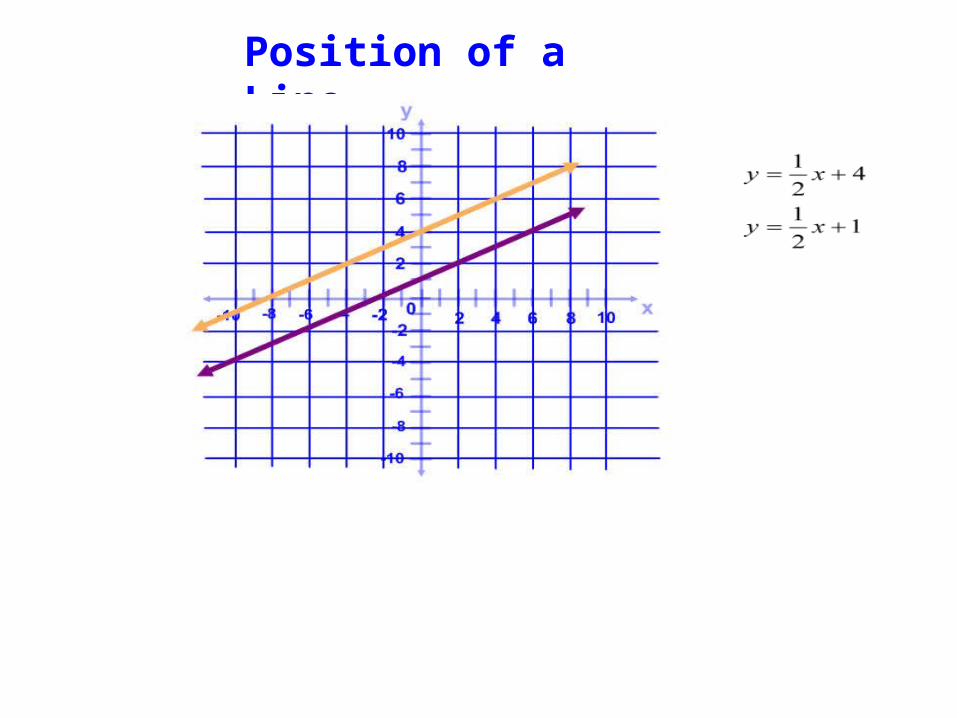
Position of a Line

What are the similarities and differences between the lines below?

The lines were in the form of y = mx+b.

So it is the b in y = mx + b that is responsible for the position of the line.
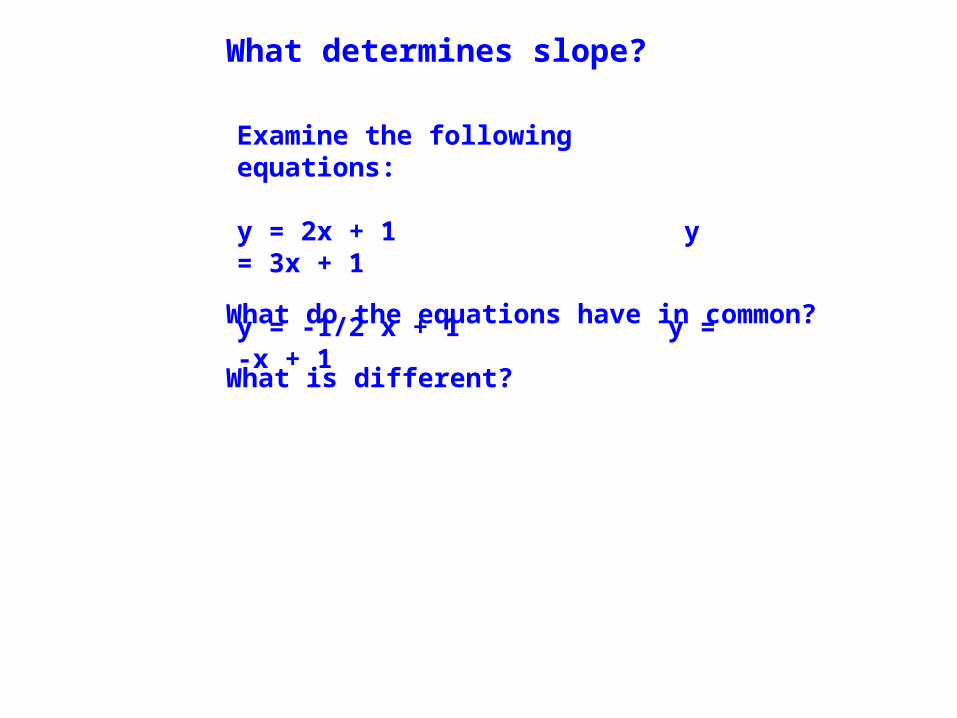
What determines slope?
Examine the following equations:
y = 2x + 1 y = 3x + 1
y = -1/2 x + 1 y = -x + 1
What do the equations have in common?
What is different?


Any equation of the form y = mx + b gives a line where
b is the y intercept
m is the slope

44 Which equation does the graph represent?
A y = -6x-6B y = -1x+6C y = 6x+6D y = x-6
y
x
2468
10
-2-4-6-8
-10
2 4 6 8 10-2-4-6-8-10
0

45 Which equation does the graph represent?
A y = 4xB y = x+4C y = 4D y = x
y
x
2468
10
-2-4-6-8
-10
2 4 6 8 10-2-4-6-8-10
0

46 Which equation does the graph represent?
A
B
C
D
y
x
2468
10
-2-4-6-8
-10
2 4 6 8 10-2-4-6-8-10
0

47 Which equation does the graph represent?
A
B
C
D
y
x
2468
10
-2-4-6-8
-10
2 4 6 8 10-2-4-6-8-10 0
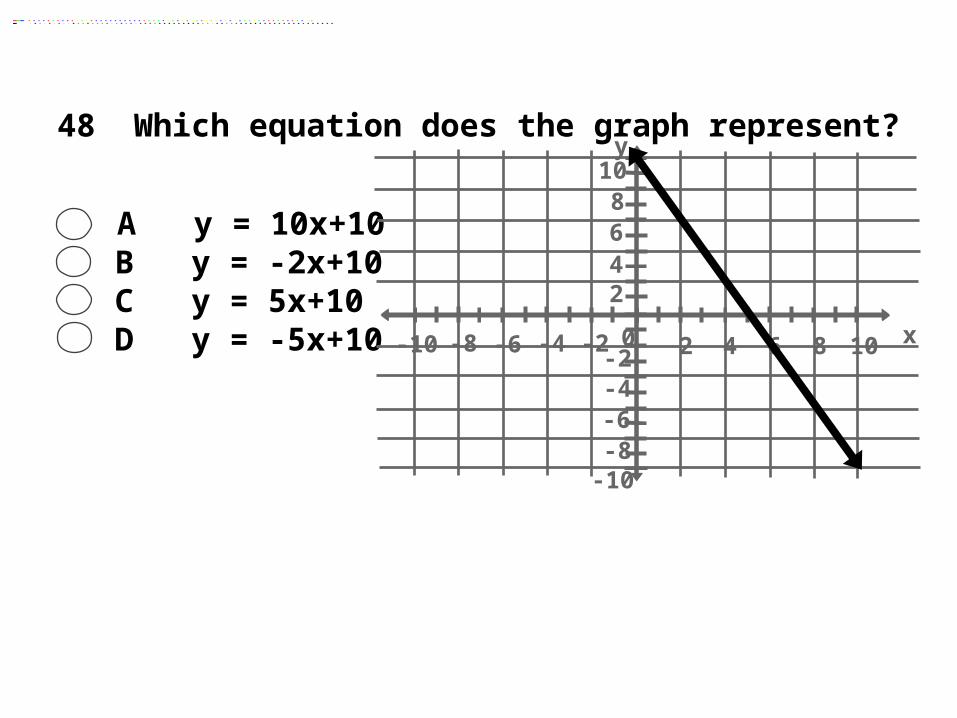
48 Which equation does the graph represent?
A y = 10x+10B y = -2x+10C y = 5x+10D y = -5x+10
y
x
2468
10
-2-4-6-8
-10
2 4 6 8 10-2-4-6-8-10 0

49 Which graph represents the equation y = 3x-2?
A line AB line BC line CD line D
y
x
24
68
10
-2-4-6-8
-10
2 4 6 8 10-2-4-6-8-10 0
A
B
C
D

51 Which graph represents
A line AB line BC line CD line D
y
x
2468
10
-2
-4
-6
-8
-10
2 4 6 8 10-2-4-6-8-10 0
AB
C D