
Tableau Solution Examples - Matthias Mazur
11
1 Tableau Solution Examples Matthias Mazur
-
Upload
matthias-mazur -
Category
Documents
-
view
45 -
download
2
Transcript of Tableau Solution Examples - Matthias Mazur
1
Tableau Solution Examples
Matthias Mazur
2
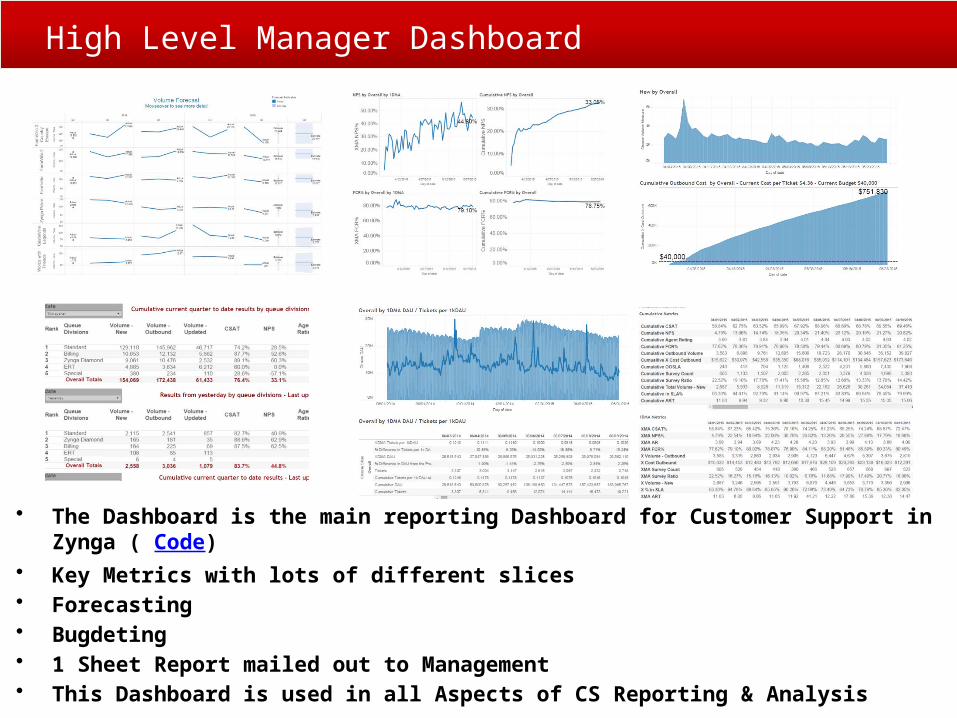
High Level Manager Dashboard
• The Dashboard is the main reporting Dashboard for Customer Support in Zynga ( Code)• Key Metrics with lots of different slices• Forecasting• Bugdeting• 1 Sheet Report mailed out to Management• This Dashboard is used in all Aspects of CS Reporting & Analysis
3
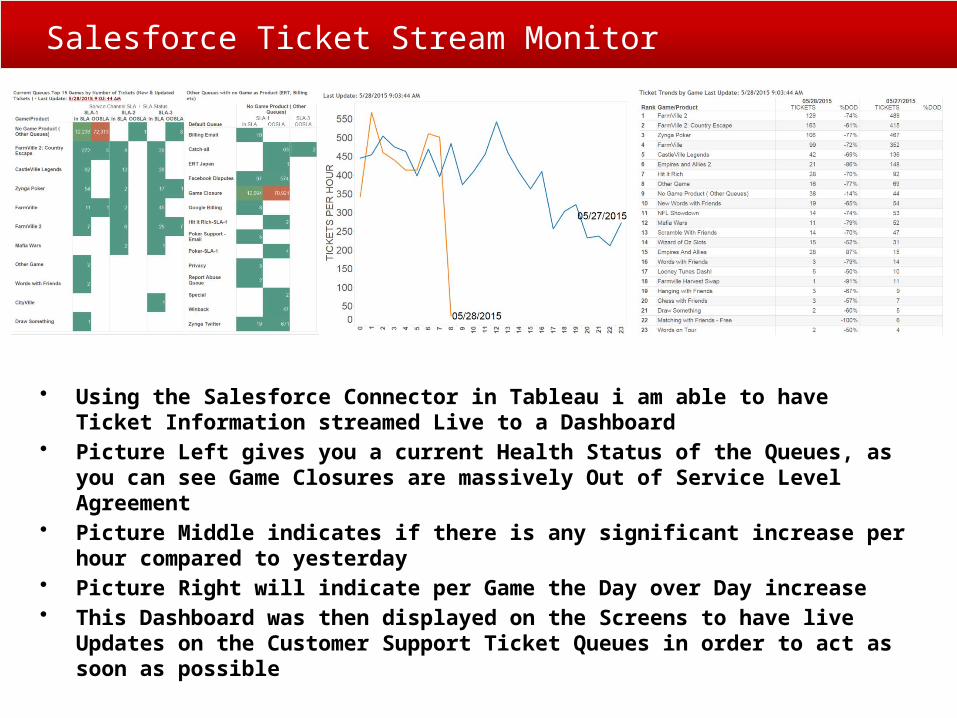
Salesforce Ticket Stream Monitor
• Using the Salesforce Connector in Tableau i am able to have Ticket Information streamed Live to a Dashboard
• Picture Left gives you a current Health Status of the Queues, as you can see Game Closures are massively Out of Service Level Agreement
• Picture Middle indicates if there is any significant increase per hour compared to yesterday
• Picture Right will indicate per Game the Day over Day increase• This Dashboard was then displayed on the Screens to have live Updates on the
Customer Support Ticket Queues in order to act as soon as possible
4
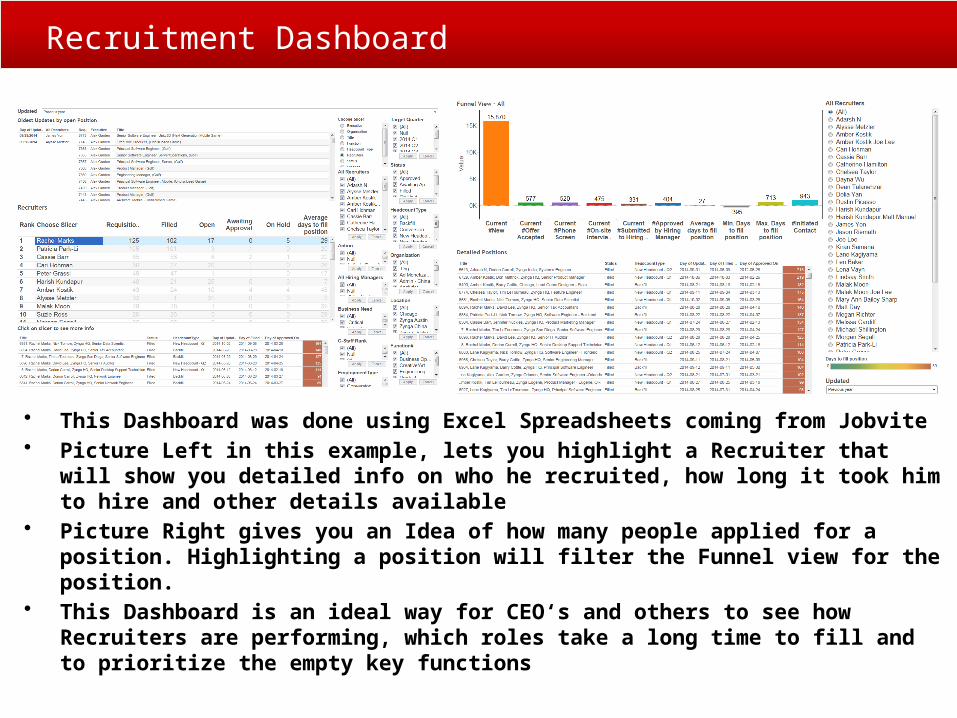
Recruitment Dashboard
• This Dashboard was done using Excel Spreadsheets coming from Jobvite• Picture Left in this example, lets you highlight a Recruiter that will show you detailed
info on who he recruited, how long it took him to hire and other details available• Picture Right gives you an Idea of how many people applied for a position. Highlighting
a position will filter the Funnel view for the position.• This Dashboard is an ideal way for CEO‘s and others to see how Recruiters are
performing, which roles take a long time to fill and to prioritize the empty key functions
5
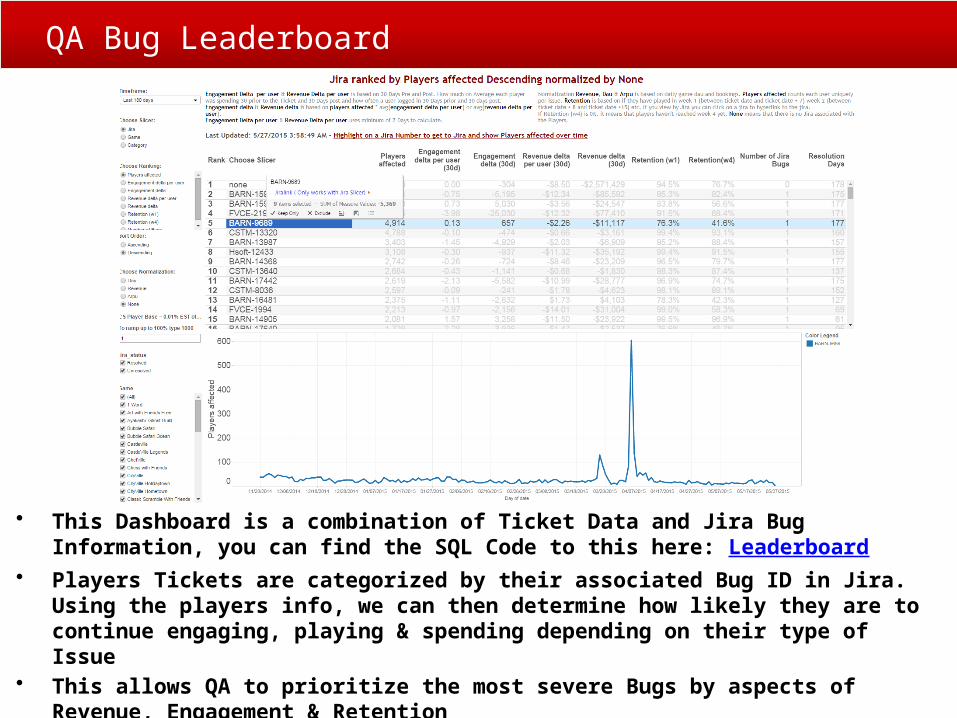
QA Bug Leaderboard
• This Dashboard is a combination of Ticket Data and Jira Bug Information, you can find the SQL Code to this here: Leaderboard
• Players Tickets are categorized by their associated Bug ID in Jira. Using the players info, we can then determine how likely they are to continue engaging, playing & spending depending on their type of Issue
• This allows QA to prioritize the most severe Bugs by aspects of Revenue, Engagement & Retention
6
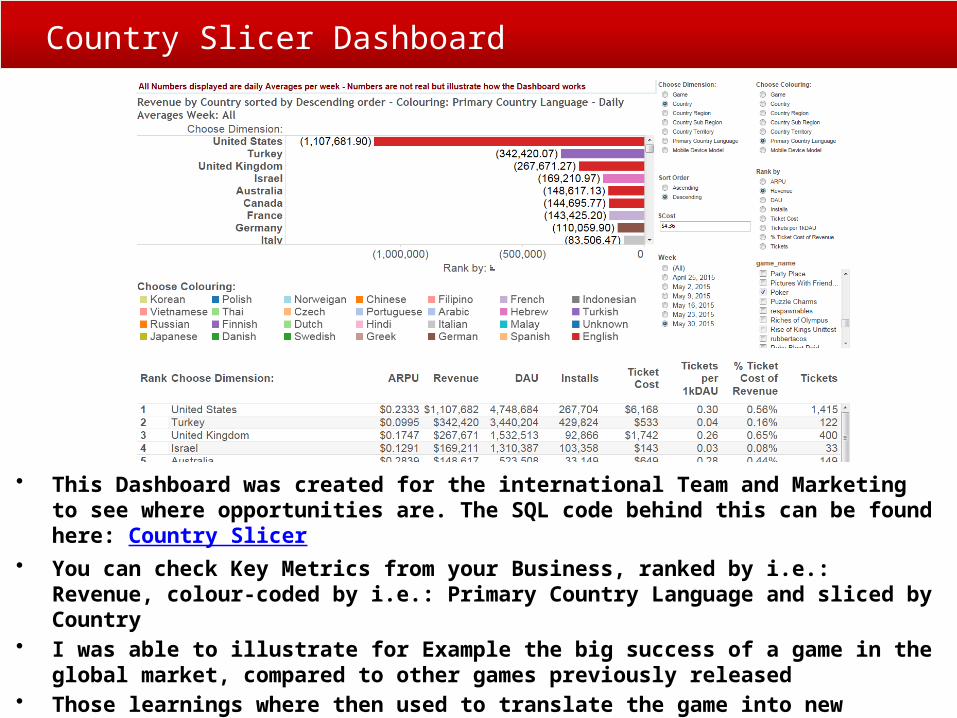
Country Slicer Dashboard
• This Dashboard was created for the international Team and Marketing to see where opportunities are. The SQL code behind this can be found here: Country Slicer
• You can check Key Metrics from your Business, ranked by i.e.: Revenue, colour-coded by i.e.: Primary Country Language and sliced by Country
• I was able to illustrate for Example the big success of a game in the global market, compared to other games previously released
• Those learnings where then used to translate the game into new languages
7
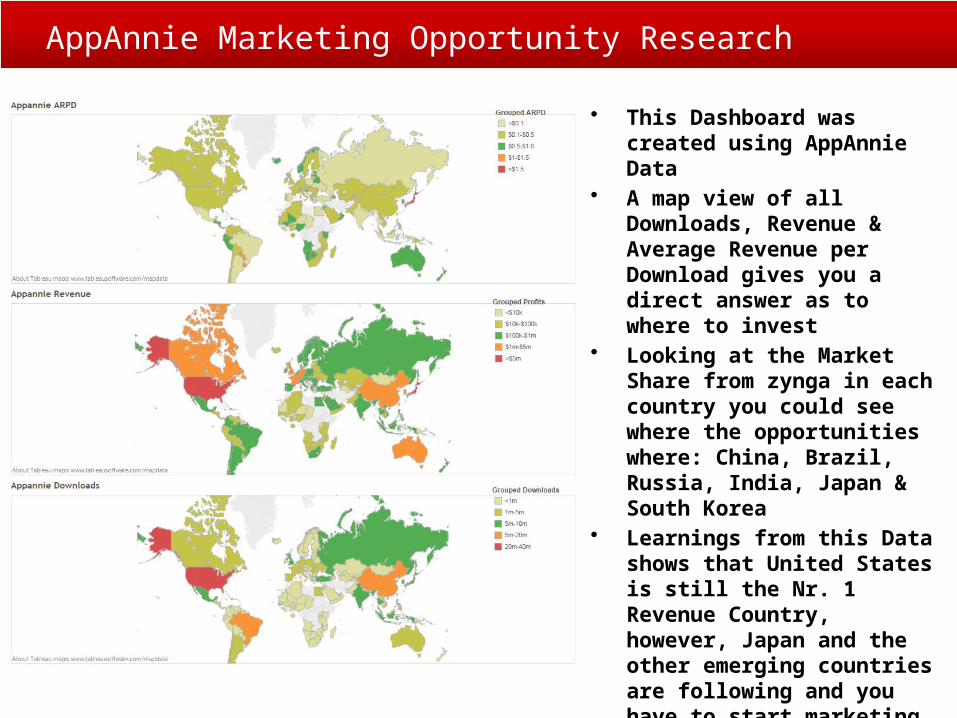
AppAnnie Marketing Opportunity Research
• This Dashboard was created using AppAnnie Data
• A map view of all Downloads, Revenue & Average Revenue per Download gives you a direct answer as to where to invest
• Looking at the Market Share from zynga in each country you could see where the opportunities where: China, Brazil, Russia, India, Japan & South Korea
• Learnings from this Data shows that United States is still the Nr. 1 Revenue Country, however, Japan and the other emerging countries are following and you have to start marketing and investing into these
8
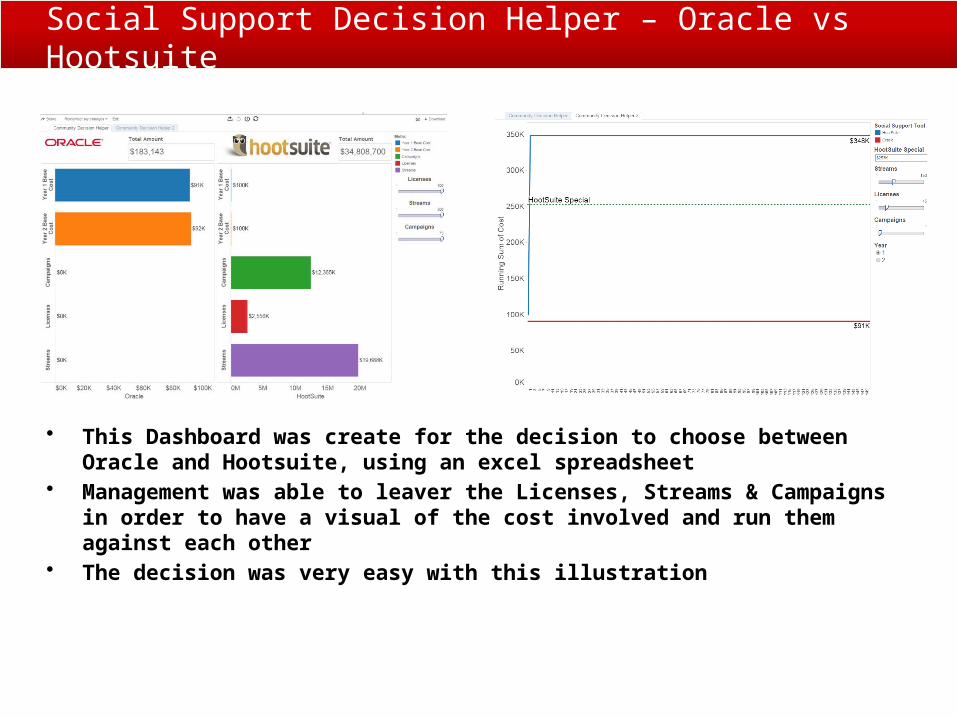
Social Support Decision Helper – Oracle vs Hootsuite
• This Dashboard was create for the decision to choose between Oracle and Hootsuite, using an excel spreadsheet
• Management was able to leaver the Licenses, Streams & Campaigns in order to have a visual of the cost involved and run them against each other
• The decision was very easy with this illustration
9
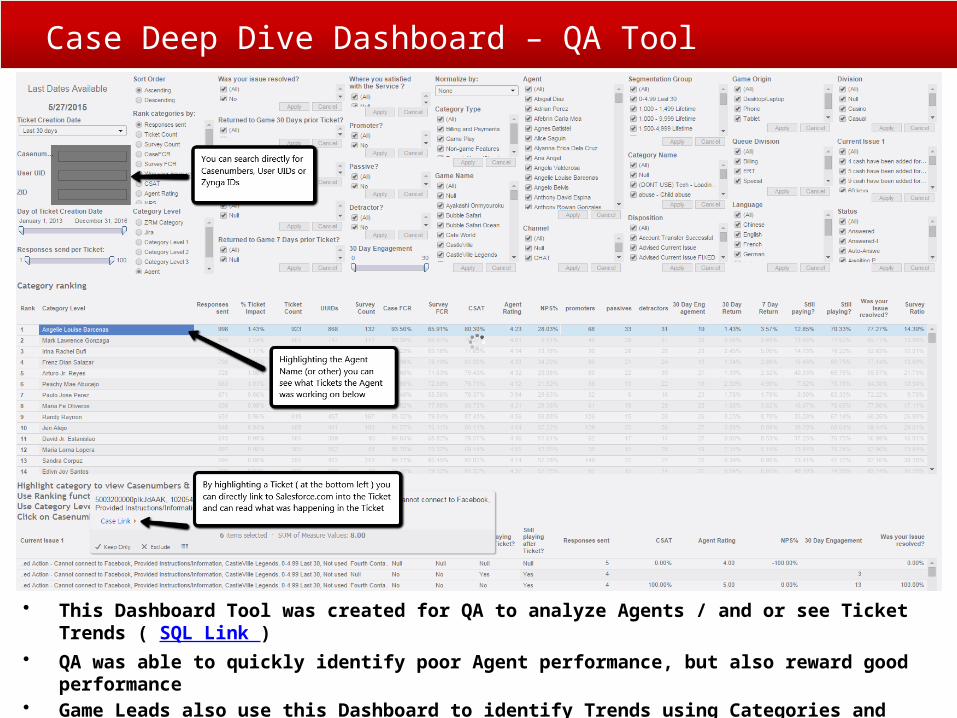
Case Deep Dive Dashboard – QA Tool
• This Dashboard Tool was created for QA to analyze Agents / and or see Ticket Trends ( SQL Link )• QA was able to quickly identify poor Agent performance, but also reward good performance• Game Leads also use this Dashboard to identify Trends using Categories and giving Examples to
Studios using the Caselink feature
10
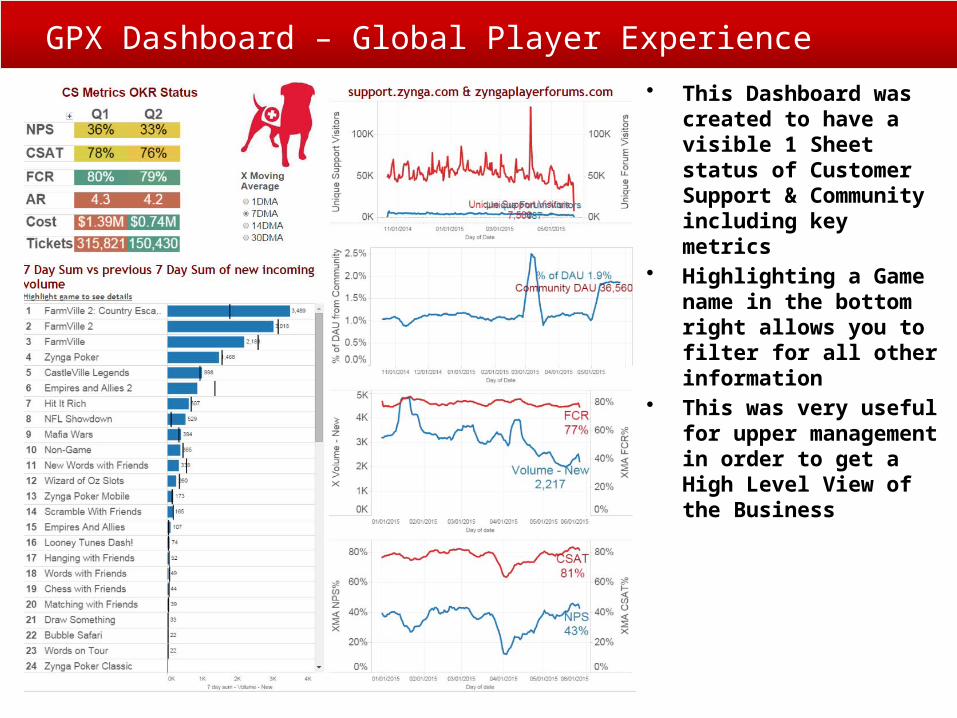
GPX Dashboard – Global Player Experience
• This Dashboard was created to have a visible 1 Sheet status of Customer Support & Community including key metrics
• Highlighting a Game name in the bottom right allows you to filter for all other information
• This was very useful for upper management in order to get a High Level View of the Business
11
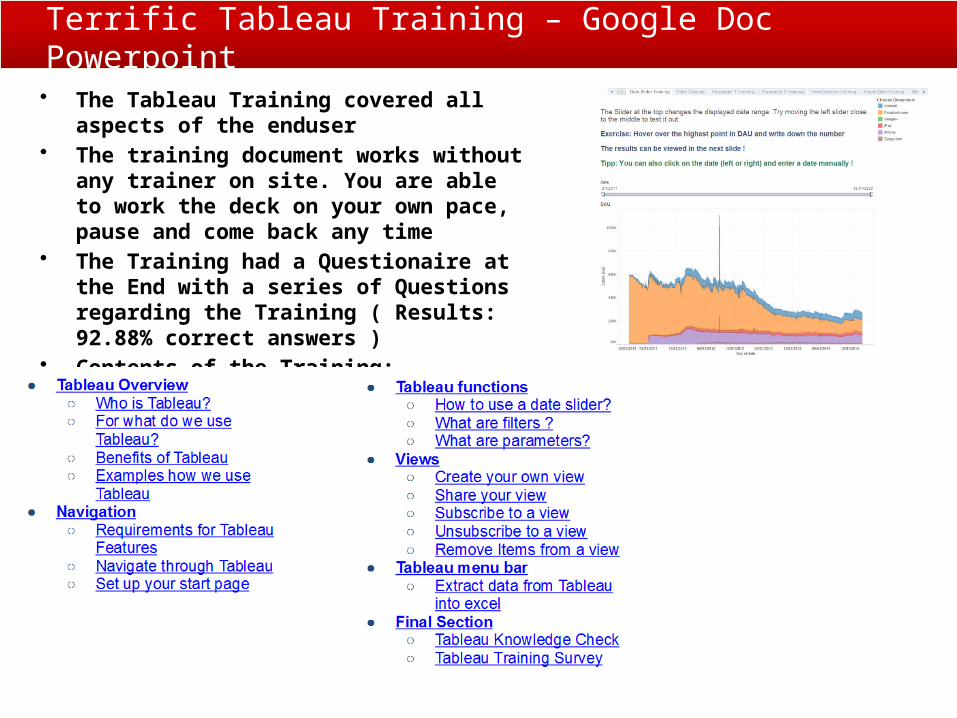
Terrific Tableau Training – Google Doc Powerpoint
• The Tableau Training covered all aspects of the enduser
• The training document works without any trainer on site. You are able to work the deck on your own pace, pause and come back any time
• The Training had a Questionaire at the End with a series of Questions regarding the Training ( Results: 92.88% correct answers )
• Contents of the Training:


