TABLE OF CONTENTS - Vibrant...
44
Transcript of TABLE OF CONTENTS - Vibrant...


TABLE OF CONTENTS
1. Renewable Energy Sector
1.1 Global Scenario
1.2 India Scenario
1.3 Gujarat Scenario
1.4 Gujarat Scenario: Success Stories
1.5 Gujarat Scenario: Vision 2020 and Investment Opportunities
1.6 Government Initiatives and Interventions

1. RENEWABLE ENERGY SECTOR
1.1 RENEWABLE ENERGY SECTOR: GLOBAL SCENARIO

RENEWABLE ENERGY SECTOR: GLOBAL SCENARIO
Sufficient renewable energy resources are available to satisfy World’s current and future energy demand. Solar energy alone could meet the existing global energy needs 10,000 times over
Source: REN 21, www.cleantechnica.com Note: RE stands for Renewable Energy
0100200300400500
480
210128 90 86 71 31 29 24
Renewable Power Capacities (Gigawatts)
0
200
400
600
800
1000
2010 2020 2030 2040
TotalOECD
TotalNonOECDWorldTotal
World Total Energy Consumption (Quadrillion, Btu)
CAGR: 1.5%
1 China
2 US
3 Germany
4 Spain
5 Italy
6 India
• From 2011 to 2012 renewable energy capacity saw a growth of 8.5 percent and reached to a total renewable energy capacity of 1,470GW in 2012
• Solar industry experienced a market growth of 18 percent in 2013
• Biofuels grew modestly in 2013, with global production of ethanol and biodiesel sprouting up to USD 97.8 billion in investment compared to USD 95.2 billion in 2012
• Wind energy saw an investment of ~USD 58.5 billion in 2013
Top 6 countries
RE capacity, Dec.2012

247.6
97.858.5
91.3
397.8
145.693.8
158.4
0
100
200
300
400
500
Total Biofuels Wind Power Solar Power
Global Clean Energy Projected Growth 2013 - 2023 (USD Billion)
2013
2023
RENEWABLE ENERGY SECTOR: GLOBAL SCENARIO
European Union has expressed commitment to a 20:20:20 ambition: 20 percent emissions reduction,
20 percent renewable energy and 20 percent improvement in energy efficiency by 2020
Source: REN 21, Clean Edge, Inc. , 2014
Selected indicators of RE
market developmentUnit 2011 2012
Global new investment in
renewable energy (annual)
billion USD 279 244
Solar PV cell production
(annual)GW 71 100
Ethanol production (annual)billion litres 84.2 83.1
Biodiesel production (annual)billion litres 22.4 22.5
Countries with policy targets # 118 138
Countries with feed-in policies # 94 99
GROWH DRIVERS
Continued growth in
energy demand
Technological progress
driving down capital cost
Energy dependence and energy
security
Stakeholder pressure for environmen
tal action
Focus on sustainability and lowering
environmental impact

1.2 RENEWABLE ENERGY SECTOR: INDIA SCENARIO

RENEWABLE ENERGY SECTOR: INDIA SCENARIO
Renewable energy is becoming an increasingly important element of India’s national energy mix
Source: Ministry of Power, Government of India;Ministry of New and Renewable Energy, Government of India
58.30%
12.30%
17.70%
2.10%
0.50%
9%
Break-up of installed power generation capacity
Coal Renewable Hydro Nuclear Oil Gas
67.90%
12.90%
12.80%
6%
0.30%
Installed capacity of renewable energy in India
Wind
small hydro
Biomass
Solar
Others
• As per the Ministry of New and Renewable Energy (MNRE), India’s total renewable potential is ~245 GW, however the current installed capacity is only 28 GW
• Wind energy dominates India’s renewable energy sector. As on 31st March, 2013 wind accounts for ~68 percent (i.e. 19.05 GW) of India’s total renewable installed capacity
• To boost the growth of renewable energy in India, Government of India and many state governments have incentivized the installation of renewable energy through various policies and fiscal measures
• By 2050, 69 percent of the country’s energy generation will be from renewable energy (Greenpeace vision)

RENEWABLE ENERGY SECTOR INDIA SCENARIO: WIND ENERGY
India ranks fifth in the world in wind power installed capacity with an installed capacity of19,565 MW (as on June 30th, 2013)
Source: Ministry of New and Renewable Energy, Government of India; IGEF
26.6%
21.2%
11.1%
8.1%
6.5%
2.7%
2.9%
3.0%
2.2%15.7%
Global installed capacity of wind energy (%)
China
U.S.A
Germany
Spain
India
France
Italy
UK
Canada
Rest of World
02000400060008000
100001200014000160001800020000
7196
3294 3250 2717 2170514 386 35.1 4.3
19565State wise installed capacity (MW)
• To drive commercialization of wind power, promote research and development in wind power and to support wind power projects in country, Government of India initiated the “Wind Power Program” in the year 1984
• Wind power accounts for 8.5 percent of total energy mix of India
• 95 percent of wind power comes from 5 states: Tamil Nadu, Gujarat, Maharashtra, Rajasthan and Karnataka

RENEWABLE ENERGY SECTOR INDIA SCENARIO: SOLAR ENERGY
India has one of the highest irradiation levels in the world
852
553
100
23 37
115
State wise split of solar power projects (MW)
Gujarat
Rajasthan
Maharashtra
Andhra Pradesh
Madhya Pradesh
Others
JNNSM Capacity addition target
Phase 1 (2009-13)
Phase 2 (2013-17)
Phase3 (2017-22)
Utility grid power including roof top(MW)
1100 4000-10000 20000
Off grid installations (MW)
200 1000 2000
Solar collectors (million square meters)
7 15 20
• Policies at the central government and state government level are the main growth drivers of solar energy sector• Regulations like Renewable Purchase Obligations (RPOs) inclusion with favorable policies play a major role in
growth of the solar sector• Gujarat was the first state to release the solar policy in year 2009. In 2010 MNRE launched the Jawaharlal Nehru
National solar Mission (JNNSM) with the objective to add 20 GW of solar power projects by the year 2022
Source: Ministry of New and Renewable Energy, Government of India; IGEF

RENEWABLE ENERGY SECTOR INDIA SCENARIO: BIO ENERGY
Bio energy comprises of bio mass, bio fuels and bio gas. A total of 4,449 MW capacity has been installed in bio energy in both grid connected and off grid capacities in India as on March 31st, 2013
0
1000
2000
3000
4000
2006-072007-082008-092009-102010-112011-122012-13
Growth of Biomass based power generation (MW)
CAGR: 21.6%
0
1000
2000
3000
4000
Utt
ar…
Mah
aras
htr
a
Tam
il N
adu
Kar
nat
aka
An
dh
ra…
Ch
atti
sgar
h
Pu
nja
b
Raj
asth
an
Har
yan
a
Bih
ar
Gu
jara
t
All
Ind
ia
776 756538 491 380249.9
124.591.3 45.3 43.3 30.5
3601
Biomass power installed capacity (MW)
• Biomass based power generation grew at a CAGR of 21.6 percent and increased from 1,112 MW to 3,601 MW between FY07-FY13
• 65 percent of biomass based generation comes from baggase based co-generation
• MNRE is drafting a new policy for National Bio Energy Mission which will be implemented in two phases. Phase1 will be executed in 12th five year plan and Phase 2 in 13th five year plan
• Incentives of USD 557 million will be provided in phase 1 to add 3000 MW capacity during the period
Source: Ministry of New and Renewable Energy, Government of India; IGEF

RENEWABLE ENERGY SECTOR INDIA SCENARIO: SMALL HYDRO POWER
Small Hydro1 Power Capacity increased with CAGR of 11.35percent from 1.905 MW to 3,632 MW between FY07-FY13
Source: Ministry of New and Renewable Energy, Government of India; IGEF, Economic Times 1. Projects under 25 MW capacity are considered as “Small Hydro Power” and comes under renewable energy source in India
• MNRE is providing 'Central Financial Assistance (CFA)' to set up small/micro hydro projects both in public and private sectors
• Financial assistance of around USD25 million is being provided to the states by the centre for the development of small hydro-power projects
• Government created a data base for the potential sites for small hydro projects and identified 6,474 such sites with a potential of ~19.8 MW
• MNRE signed MOU with IIT, Roorkee for development of small hydropower plants on a contractual basis
0500
1000150020002500300035004000
Small Hydro power generation in India (MW)
CAGR: 11.35%
0500
1000150020002500300035004000
964588
300 219 175 158 155 131
943
3632
State wise installed capacity(MW)

RENEWABLE ENERGY SECTOR INDIA SCENARIO: WAY FORWARD
Interplay of favorable risk-return profile at project level coupled with the emerging Indian merchant power opportunity creates a positive strategic framework for Indian renewable IPP players
PROJECT LEVEL
•Shorter time-to-commissioning than conventional power projects
•Fast-track project approval- significantly fewer environmental or CERC clearances required compared to conventional power projects
•Easier to achieve financial closure vis-à-vis larger projects, Greater predictability of project execution
•Plethora of small-to-mid size units in “locally constrained” entrepreneurial setups: ideal for consolidation play
•Bidding route not mandatory for new capacities
FINANCIAL PERSPECTIVE
•Low working capital requirements, particularly for small hydro and wind projects
•Ability to boost returns through emissions trading options
•Regulatory support, including preferential tariffs
•Fiscal incentives (subsidies, grants and tax incentives) available in some States
SUSTAINABILITY
•Lower fuel sourcing and pricing risk compared to conventional power projects
•Opportunity to de-risk asset portfolio through geographic and technological options- exposure to multiple markets, regulatory regimes, technologies and climatic conditions
•Lower social friction concerns by promoting ‘inclusive growth’
•Broadening fuel base complements efforts to decouple India’s economic growth from emissions growth and helps to achieve energy security
FUND REQUIREMENT
• Consolidated fund requirement estimated by MNRE (Strategic plan for new and renewable energy sector for the period 2011 -17 is:
- For grid connected renewable energy technologies – USD 2.6 billion
- For off grid renewable energy programs – USD 2.7 billion
Source: Vibrant Gujarat Website

1.3 RENEWABLE ENERGY SECTOR: GUJARAT SCENARIO

RENEWABLE ENERGY SECTOR GUJARAT SCENARIO
Gujarat was a power deficient state barely a decade ago, but now has a surplus power and a vibrant energy sector. Gujarat contributes ~ 15 percent to India’s renewable energy basket
Source: Energy & Petrochemicals Department, Government of Gujarat,Gujarat Energy Development Agency Note: RE stands for Renewable Energy
Source
Total Potential (India),
MW
Total potential (Gujarat),
MW
RE Installed Capacity MW
Wind 45,000 12,000 3,250
Solar > 100,000 69,000 852.31
• Share of RE in total energy mix in Gujarat is ~18 percent
• Gujarat’s share of RE sources in Western Region is 46 percent
• Timely tariff revisions have made the sector viable enabling the state to set up adequate generation capacity
• Uninterrupted power supply attracts companies to set up business in Gujarat
76%17.80%
2.50%
1.70%
Installed power capacity in Gujarat
Thermal RenewableNuclear Hydro
77.80%
21.30%0.70%
0.20%
Break up RE source in Gujarat
Wind
Solar
Biomass
Small Hydro

RENEWABLE ENERGY SECTOR GUJARAT SCENARIO: RENEWABLE ENERGY POTENTIAL
Source: Gujarat Power Corporation Limited, TERI, Economic Times, CII, India Today
SOURCE RESOURCE POTENTIAL
Sun Solar Radiation 5.75 kWh/Sq.m./day
Biomass 24 million Tonnes 900 MWe
Biogas 200 lakh cattle population 933 MWe
Energy Plantation 67 lakh Ha.Wasteland 15000 MWe
Wind Coastline & Hilly Regions 12000 MWe
Renewable Energy in Gujarat by 2020 aims at increase of RE power to the national grid, from 5 percentin 2009-10 to 15 percent of the energy mix by 2020 (National Action Plan on Climate Change).
The state has signed power purchase agreements (PPAs) for solar power generation with 80 private players for 25 years, including Tata Power, US-based SunEdision and Moser Baer Solar. These deals are worth USD 3 billion
According to TERI, “The overall renewable energy potential in Gujarat is very high, considering if all the identified suitable lands can be made available. Gujarat's overall integrated renewable energy potential is estimated to be around 748.77 GW”

RENEWABLE ENERGY SECTOR GUJARAT SCENARIO: RENEWABLE ENERGY MAP
Gujarat has a large amount of waste land along with good solar radiation and wind flow for most of the year. Biomass, Tidal, Geothermal resources are also available in the state.
Source: Gujarat Energy Development Agency

RENEWABLE ENERGY SECTOR GUJARAT SCENARIO: WIND POWER
Gujarat has the second largest Wind Power Plant installed capacity in the country which is about 3250 MW . Annually generating about 5447 million units of electricity.
Source: TERI, Gujarat Energy Development Agency
Wind Power Density in Gujarat, W/m2
• Potential: 12000 MW• Installed Capacity: 3250 MW till date• Cost: USD 1 million per MW
• The Centre for Wind Energy Technology, an autonomous R&D institution under MNRE, has identified and approved 40 sites for wind energy deployment with annual average wind power density greater than 200 W/sq. m. at a 50 m height in Gujarat
• Over a period of last more than 25 years more than 65 sites have been monitored for the wind speed and wind power density, and over 50 sites have been found feasible for harnessing wind power
Gujarat: At a Glance

RENEWABLE ENERGY SECTOR GUJARAT SCENARIO: WIND POWER
The State of Gujarat with its longest coast line in the country and inland windy sites has a potential of 12,000 MW of wind power
Source: GEDA, GERC0
In November 2008 Gujarat won the Best Wind
Power Developer State (Percentage Increase)
Award 2008 for achieving the maximum capacity
additions during the two consequent year FY07
and FY 08 alone the coast of Saurashtra
01000200030004000
271 5551,171 1,485 1,782 2,095
2,885 3010
Wind Power capacity (in MW)
CAGR: 48%
Eligible Unit: Any company/corporate body/association/body of individualsSale: Fixed tariffTariff: INR 4.15 kWh for 25 years
Open Access / 3rd party sale: Allowed banking
Wheeling:At 66 kV: Normal charges as applicable to open accessBelow 66 kV: Normal charges as applicable to open access + 10% of generated fed to the grid
Land:On a Private Land ; On a Revenue waste land @ 1 hectare per Wind turbine generator on long term lease of 20 years to the developer
WIND POWER POLICY AND GERC REGULATORY FEATURES

RENEWABLE ENERGY SECTOR GUJARAT SCENARIO: SOLAR POWER
Gujarat has the highest solar generation potential in India –300 days of 5.6 to 6.0 kWh/sq.m/day solar radiation
GHI DNI
Jamnagar 2,216 2,697
Junagadh 2,212 2,661
Navsari 2,110 2,427
Patan 1,883 2,008
Districts with the highest GH/DN Irradiance, kWh/m2/year
• In Gujarat there is a potential of generating 10,000 MW from
0.1 percent of available wasteland
• The area with the highest solar potential is the district of
Kachchh which gets 310 sunny days in a year and has the
highest direct solar insolation of 6.4 kWh/sq. m. / day
throughout the year
• The sites do not require sun tracing
Source: TERI, Gujarat Energy Development Agency

RENEWABLE ENERGY SECTOR GUJARAT SCENARIO: SOLAR POWER
77 plants totaling to about 891 MW capacity were commissioned in Gujarat up to March 2014
GUJARAT’S LARGEST SOLAR POWER PLANTS
Plant District MW
Adani Enterprises Ltd. Kachchh 40
Sanland Real Estate Pvt. Ltd. Banaskantha 25
Tata Power Company Ltd. Jamnagar 25
Alex Astral Power Pvt. Ltd. Patan 25
Roha Dyechem Pvt. Ltd. Patan 25
Sun Edison Energy India Pvt.
Ltd.Patan 25
Kiran Energy Solar Power Pvt.
Ltd.Patan 20
PLG Photovoltaic Patan 20
Hiraco Renewable Energy
Pvt. Ltd.Porbandar 20
• Gujarat has taken a lead over other states in renewable energy initiatives, particularly in solar power generation. It is the first state in India to achieve RPO target
• Gujarat also has Asia’s First Solar Park • Village Charanka, Ta:Santalpur, Patan 2024 hectares of
wasteland• For setting up 3000MW Generation & Manufacturing
Facilities• 258 MW Capacity Power Plants have been installed• GPCL is the Project Managers
PHASEDEVELOPERS
(NOS.)CAPACITY, MW
Phase I allotment 57 406.5
Phase II allotment 27 562.0
Total 84 968.5
SOLAR POWER POLICY : 1ST STATE POLICY IN THE COUNTRY
Source: TERI, Gujarat Energy Development Agency

RENEWABLE ENERGY SECTOR GUJARAT SCENARIO: SOLAR POWER - TARIFF
Summary of solar Tariffs, Rs./kWh (projects commissioned Jan 29, 2012 - March 31, 2015)
Source: GERC Order no. 1 of 2012: Determination of tariff for procurement of power by distribution licensees and others from Solar Energy Projects for the State of Gujarat – Rehearing in order No.1 of 2012 as per the directions of the Hon’ble APTEL vide Judgment dated 17.04.2013 in Appeal No. 75 of 2012.
PERIOD JAN 29, 2012 –MAR 31, 2012APR 1, 2013 –MAR 31, 2014
APR 1, 2014 –MAR 31, 2015
Megawatt - scale PV projects availing accelerated depreciation
Levelized tariff for 25 years 9.70 9.02 8.39
First 12 years 10.52 9.64 8.82
Subsequent 13 years 7.00 7.00 7.00
Megawatt - scale PV projects not availing accelerated depreciation
Levelized tariff for 25 years 10.92 10.15 9.44
First 12 years 11.97 10.96 10.03
Subsequent 13 years 7.50 7.50 7.50
Kilowatt - scale PV projects availing accelerated depreciation
Levelized tariff for 25 years 11.64 10.82 10.07
Kilowatt - scale PV projects availing accelerated depreciation
Levelized tariff for 25 years 13.10 12.18 11.33
LEVELIZED TARIFF FOR SOLAR THERMAL PROJECTS
With accelerated depreciation benefit 11.83 per kWh for 25 years
Without accelerated depreciation benefit 13.23 per kWh for 25 years

RENEWABLE ENERGY SECTOR GUJARAT SCENARIO: SOLAR POWER – PROJECT LOCATIONS
Geographical locations of Solar power projects
Source: GETCO

RENEWABLE ENERGY SECTOR GUJARAT SCENARIO: BIO ENERGY
The total bio-mass potential for Gujarat is about 1,800 MW from crop residue and about 140 MW from forest residue
Biomass potential in Gujarat
Crop Residue
Forest Residue
FORESTJunagadh 18 The dangs 18
Sabarkantha 16 Valsad 15 Dahod 12
Banaskantha 11
CROPRajkot 228
Jamnagar 203 Bhavnagar 192
Junagadh 168 Surendranagar 142
Amreli 137
DISTRICTS WITH THE HIGHEST BIOMASS POTENTIAL, MW
BIO-ENERGY PROGRAMMES
• Institutional biogas plants 9835 m3/day capacity in various institutions across
the state
• India’s first and Asia’s biggest power plant based on biomass gasification has
recently been commissioned at village Kothara in the border district of Kutch,
Gujarat. The project is expected to generate 500 KW electricity from its two
generating units
41.20 MW capacity biomass projects commissioned in Amreli, Junagadh and Vadodara
13.23 MW waste-to-energy power generation projects
Source: TERI, Gujarat Energy Development Agency

1.4 RENEWABLE ENERGY SECTOR: GUJARAT SCENARIO – SUCCESS STORIES

RENEWABLE ENERGY SECTOR GUJARAT SCENARIO: MODEL SOLAR CITY PROJECT - GANDHINAGAR
Government of India declared Gandhinagar as a Model Solar City setting example for Solar Cities throughout India and other nations
Source: MNRE, GEDA
10 KW capacity wind-solar hybrid system commissioned at Udyog Bhavan, Gandhinagar
19 solar rooftop systems of 10 KW each commissioned at government buildings, Gandhinagar
4,000 KW SPV-based grid-connected power generating rooftop systems at government buildings
240 solar rooftop systems of 1 KW each commissioned at godowns
6 solar hybrid systems of 5 KW each commissioned on government buildings
Gandhinagar: The Model Solar City project
The program assists Urban Local Governments in:• Preparation of a master plan for increasing energy
efficiency and renewable energy supply in the city• Setting-up institutional arrangements for the
implementation of the master plan.• Awareness generation and capacity building
activities.
Ministry of New and Renewable Energy (MNRE) has launched a program on “Development of Solar Cities” on
January 24, 2011
The program aims at minimum 10% reduction inprojected demand of conventional energy at the end offive years, which can be achieved through a combination ofenergy efficiency measures and enhancing supply fromrenewable energy sources.

RENEWABLE ENERGY SECTOR. GUJARAT SCENARIO: 5 MW GANDHINAGAR SOLAR ROOFTOP PROGRAMME
Government of Gujarat has launched the ambitious “Gandhinagar (Solar) Photovoltaic Rooftop Programme” to encourage alternative clean energy sources like solar energy as well as social participation
to advance towards energy self-sustainability
• This Programme provides an opportunity to property owners in Gandhinagar City for participation by offering their rooftop or terrace for installation of Solar Photovoltaic System for solar power generation
• The owner of property will be paid a “Green Incentive,” which shall be based on the units (kWh) of electricity generated by the SPV system installed on their property
OPPORTUNITY FOR ROOFTOP OWNERS
• In this programme the developer is selected through a transparent competitive bidding process. The selected developer will finance/Install/Own/Operate and maintain PV roof systems on owners roof tops
• The energy generated from this system will be sold to Distribution Company and Distribution Company will pay duly approved tariff to developers
• Selected developers will execute the “Green Incentive and Lease Agreement” with individual property owners, whose rooftop or terrace will be utilized for the SPV system
ROLE OF PROJECT DEVELOPER
TO BE IMPLEMENTED IN• Surat• Rajkot• Mehsana• Bhavnagar• Vadodara
Source: Gujarat Energy Development Agency, Gujarat Power Corporation Ltd
RENEWABLE ENERGY SECTOR GUJARAT SCENARIO: GUJARAT SOLAR PARK – MAKING INDIA A SOLAR HUB
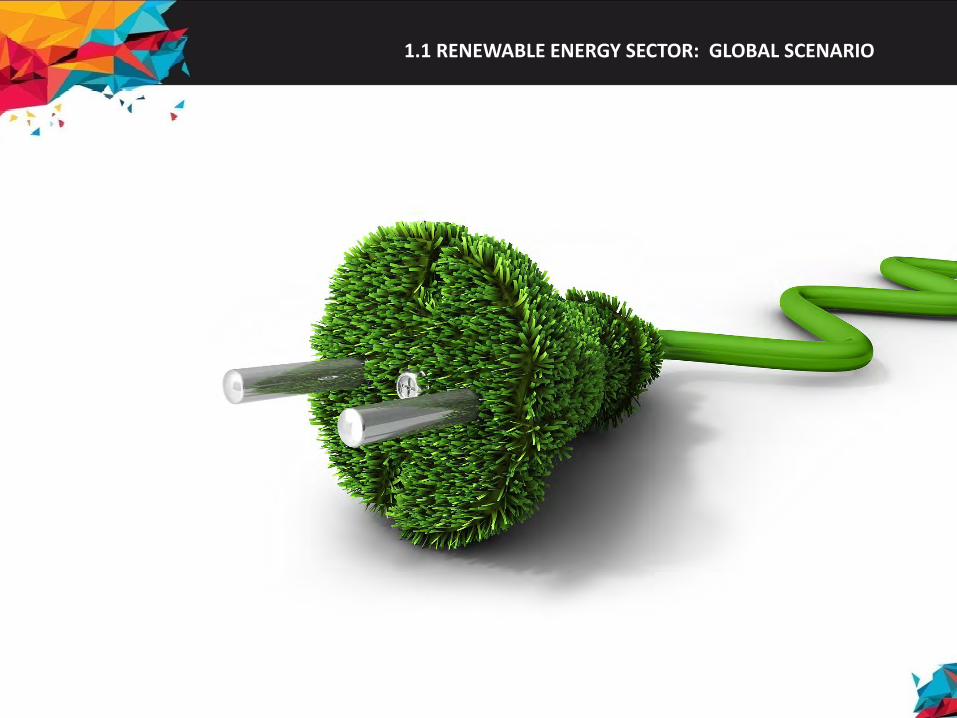
Asia’s largest "Gujarat Solar Park" to mitigate impact of Climate Change and to protect environment for our future generation, making Solar Sector vibrant and viable not only in India but also across the Globe
GUJARAT SOLAR PARK, CHARANKA, PATAN DISTRICT
GEDA FINANCIAL INSTITUTES
Policy directives Project
funding
Processed applications
GPCLNodal Agency for Solar
Park development
GETCO
SSNNL
GERC/CERC
Government agencies
Transmission infrastructure
Water availability
Tariff determination
Tariff determination
Infrastructure development charge
Shared with solar developer, manufacture, R&D setup
Area: approx. 2,024 HaCapacity Installed: 258 MWNo. of developers: 20
KEY FEATURES
Concentrated zone of development for solar power related activities• Solar thermal/ PV generation based projects, Solar components manufacturing/ assembling• Research and development, Capacity Building• Single window facility for solar power project developers for providing common
Source: Gujarat Energy Development Agency, Gujarat Power Corporation Ltd

RENEWABLE ENERGY SECTOR GUJARAT SCENARIO: GUJARAT SOLAR PARK – MAKING INDIA A SOLAR HUB
The only project in Power sector of India that has won this prestigious award
AWARD MERITS:• Gave a discrete definition of “solar park” in
the Indian context• World’s largest multi-developer and multi-
beneficiary solar park with targeted 500 MWSolar Power Projects at single location
SOCIAL COMMITMENT:• All-weather road connectivity• Water to carry out cultivation activities• Drinking water facility to the Charanka village• Ambulance service• State-of-the-art training facility to provide
training to the villages in various fields
Source: Gujarat Energy Development Agency, Gujarat Power Corporation Ltd

RENEWABLE ENERGY SECTORGUJARAT SCENARIO: INDIA’S FIRST CANAL TOP SOLAR POWER PROJECT
Gujarat has initiated the world’s first canal-based solar power project on Narmada branch canal new Chandrasan village of Mehsana district
Source: GSECL
Energy generated from this pilot project will be directly fed into the local electricity grid and utilized by nearby towns and villages
INNOVATIVE IDEAS• Cover the canal with Solar Panels to• Save Land @ 5 acre per MW• Minimize evaporation from canal (9 million liters
water saving per MW per year)• Produce eco-friendly power• Shadowing effect of panel results in reduced
photosynthesis and less algae growth leading to less maintenance cost
• Pilot Project is for 1 MW
TECHNICAL DETAIL• Projected energy production: 1.6 million
units/year/MW• Irradiation: 4.6 – 6.4 kWh/m2• Installed capacity: 1 MWp• Technology: polycrystalline solar modules, 280 Wp• Number of modules: 3616• Canal length used: 750 m• Power evacuation system: 11 KV

• Sayaji Industries, Kathwada is dealing with maize starch products. As a result of maize corn milling, grinding and processing, about 14000 nm3 biogas is generated. Earlier biogas was being used in the coal fired boilers. Under the MNRE programme of energy recovery from industrial & commercial wastes, the biogas based power project was taken up. The project commissioned in April'2009 and has been running successfully at about 80% PLF since commissioning.
0.95 MW biogas based power project at Sayaji Industries, Kathwada, 2009-10
• 12000nm3 /day capacity biomethanation plant is completed & commissioned in December 2009 under MNRE waste-to-energy (WTE) scheme. Plant has been running successfully since its commissioning date. Produced biogas gas is used in 100% biogas engines in CPP
12000 nm3 biogas per day (1 MWeq.) maize starch industry liquid waste based biomethanation plant by Gujarat Ambuja Exports Ltd., at Dalpur , Dist: S.K., 2009-10
• Sayaji Industries, Kathwada increased its maize grinding capacity from 325 MT/day to 550 MT/day, the effluent also increased with higher COD value of about 16000 to 20000 KGs COD. One 10000 nm3/day capacity biomethanation plant has been installed & commissioned December 2011.The same is working with more than 80% efficiency. The produced biogas is used in its CPP
0.833 MWeq.(10000 nm3/day) capacity maize starch industry liquid waste based biomethanation plant at Sayaji Industries Ltd., Kathwada, 2010-11
RENEWABLE ENERGY SECTOR GUJARAT SCENARIO: BIO ENERGY
Source: Gujarat Energy Development Agency
Various Bio energy projects have been implemented in Gujarat. Few of them are enlisted below:

RENEWABLE ENERGY SECTORGUJARAT SCENARIO: LARGE RE PLAYERS IN GUJARAT
Solar power developers
Solar PV manufac-turers
Wind power developers
Wind equipment manufac-turers
Sonki Solar India.

1.5 GUJARAT SCENARIO: VISION 2020 AND INVESTMENT OPPORTUNITIES
RENEWABLE ENERGY SECTOR GUJARAT SCENARIO: 2020
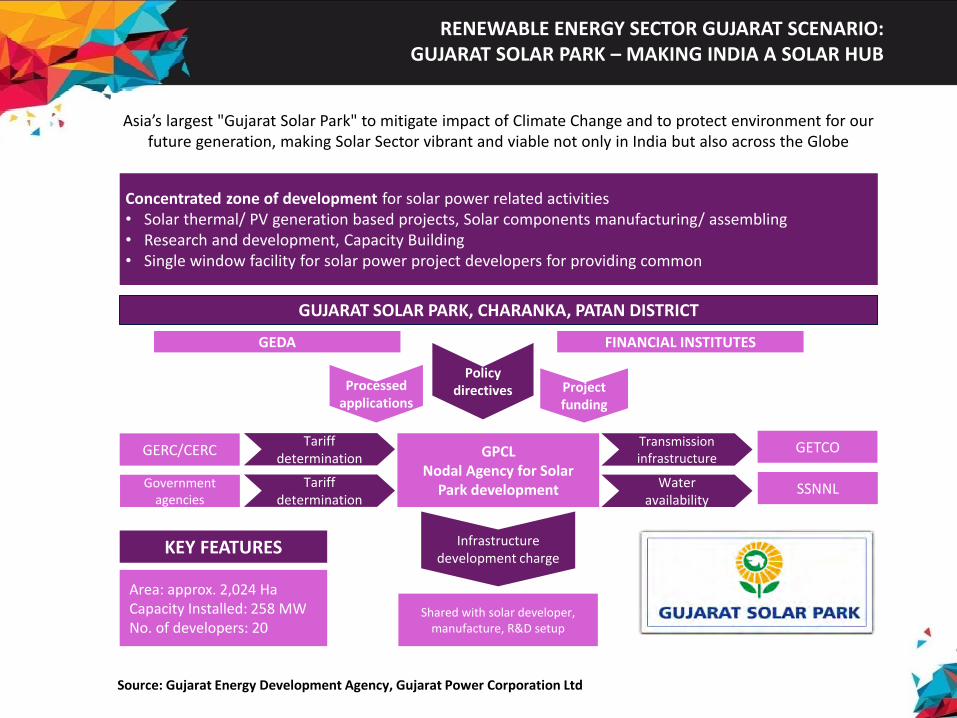
NAPCC goal: 1 percent annual increase of RE power to the national grid, from 5 percent in 2009-10 to 15 percent of the energy mix by 2020
Source: Energy & Petrochemicals Department, Government of Gujarat0
Source /Technology
Installed capacity (MW)
as on May 2012
12th five year Plan period Capacity additions 12th
PlanFY13 FY14 FY15 FY16 FY17
Wind 3,352 326 377 456 498 508 2,165
SHP 7 2 3 4 3 3 15
BIO 41.2 35 45 55 60 44 239
Solar 891 209 331 331 441 560 1,872
WTE 0 2 2 0 2 6
Total 4,291.2 572 758 848 1,002 1,117 4,297
Expected capacity addition in RE sector by 2017 will be 4,297 MW with highest
contribution from wind – 50 percent and solar – 44 percent
Total installed capacity from RE sources by 2017 – 7,863 MW

RENEWABLE ENERGY SECTOR GUJARAT SCENARIO: 2020
PROJECTFUND REQUIRED
(USD BILLION)
Wind 2.65
SHP 0.02
Bio Mass 0.24
Solar 3.82
WTE 0.01
Total 6.74
Fund requirementNon- Conventional power projects
under private sector
Development of wind-solar hybrid
installations and biomass projects
Development of solar manufacturing capacities
Development of large scale solar parks and
canal-top solar projects
Development of projects under solar rooftop
programme (Bhavnagar, Surat, Rajkot, Mehsana)
Tidal and geothermal projects first at a pilot
scale, and then at a commercial scale
Offshore wind projects development
Development of distributed gas based power combined
with non conventional sources
Source: Energy & Petrochemicals Department, Government of Gujarat

RENEWABLE ENERGY SECTOR GUJARAT SCENARIO:INVESTMENT OPPORTUNITIES
The state endeavors to become a leader in terms of capacity and introduction of new technologies in other renewable energy sources, like wind-solar hybrid, WTE, OTEC, tidal energy, etc.
WIND SOLAR HYBRID INSTALLATION, MW
Rajkot 23,182
Kachchh 16,151
Jamnagar 8,707
Surendranagar 6,625
Amreli 3,585
Bhavnagar 2,514
Sabarkantha 2,303
Banaskantha 2,044
Junagadh 2,038
DISTRICTS WITH THE HIGHEST HYBRID POTENTIAL, MW
• The total potential for wind solar hybrid installations is about 74,000 MW with the largest potential in Rajkot and Kachchh
• Gujarat has a 1,600 km coast line and good wind velocity offshore. The total offshore wind potential is about 5,000 MW
• Preliminary activities have been initiated to explore Off-shore wind mill projects installation in consultation with Central Government
Source: TERI, Gujarat Energy Development Agency, Gujarat Power Corporation Ltd
Renewable Energy Sector Gujarat Scenario: Investment Opportunities
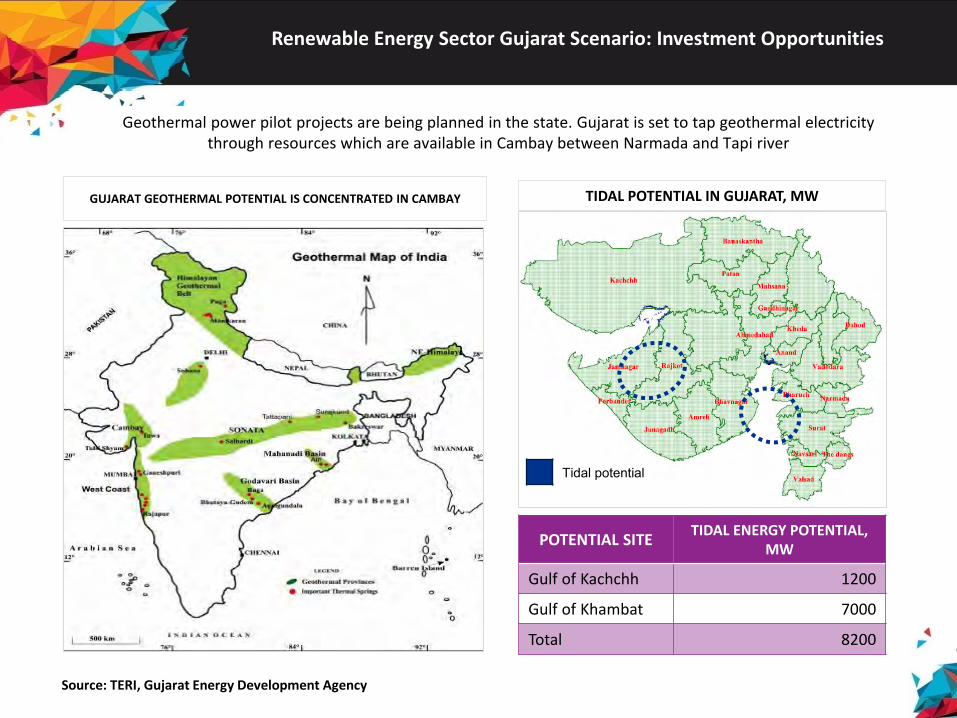
Geothermal power pilot projects are being planned in the state. Gujarat is set to tap geothermal electricity through resources which are available in Cambay between Narmada and Tapi river
GUJARAT GEOTHERMAL POTENTIAL IS CONCENTRATED IN CAMBAY TIDAL POTENTIAL IN GUJARAT, MW
Tidal potential
POTENTIAL SITETIDAL ENERGY POTENTIAL,
MW
Gulf of Kachchh 1200
Gulf of Khambat 7000
Total 8200
Source: TERI, Gujarat Energy Development Agency

1.6 GOVERNMENT INITIATIVES AND INTERVENTIONS

Renewable Energy Sector Government Initiatives & Interventions
A robust regulatory framework has been put in place to realize India’s wind, hydro, solar and biomass potential
Electricity Act 2003
• Mandated State Electricity Regulatory Commissions (SERCs) to
• Promote generation of electricity from renewable sources of energy by providing suitable measures for connectivity with the grid and sale of electricity to any person
• Fix certain minimum percentages for purchase of renewable power
National Electricity Policy 2005
• Further provided for progressive increase in generation of electricity from renewable sources and supported purchases by distribution companies through competitive bidding process
Tariff Policy 2006
• Provided for fixation by SERCs of a minimum percentage of Renewable Purchase Obligation (RPO) from RE sources taking into account availability of such resources in the region and its impact on retail tariffs and procurement by distribution companies at preferential tariffs determined by the SERCs
National Action Plan on Climate Change 2008
• Outlined existing and future policies and programs addressing climate mitigation and adaptation
• NAPCC has advised that starting 2009-10, RPOs be set at 5% of total grids purchase, and be increased by 1% each year for 10 years.
Source: Ministry of Power, Government of India; Ministry of New and Renewable Energy, Government of India

Renewable Energy SectorGovernment Initiatives & Interventions- National Solar Mission
Objective of the National Solar Mission is to establish India as a global leader in Solar Energy, by creating the policy conditions for its diffusion across the country as quickly as possible.
Source: Ministry of New and Renewable Energy, Government of India
Phase 1: 2010-13
Policy framework to attract and scale-up
Grid: 1,100 MWOff-grid: 200 MW
Phase 2: 2013-17
Market based on FIT and mandatory solar RPO
Grid: 4-10,000 MW
Off-grid: 1000 MW
Phase 3: 2017-22
Grid competitive solar power
Grid: 20,000 MW
Off-grid: 2000 MW
A. 20 GW Grid based solar power projects by 2022
• Large power plants (5 MW solar PV; 5 to 100 MW CSP in NSM 1 and 5MW to 50MW solar PV in NSM 2)
100 MW rooftop and small projects
• Connected below 33 kV. Target (10 MW of up to 100kW; and 90 MW of 0.1 to 2 MW.
B. 2000 MW off-Grid project by 2022
• Off grid solar and decentralized solar applications.
• Capital and interest subsidy; Refinance by IREDA et al
• Other channels to supply & maintain Products
C. Support projects
• Centre of excellence and incubation
• Demonstration and pilot projects
• 100MW parabolic trough based
• 100-150MW solar hybrid plant
• Accelerate generation capacity addition to drive down costs and achieve grid parity by 2022
• National Tariff Policy amended (January 2011) for mandatory Solar RPOs for all power utilities

Renewable Energy SectorGovernment Initiatives & Interventions- Support mechanism for RE in India
Source:
Policy Instrument Indian Experience Incentives for Developers
Feed in Tariffs/ Preferential Tariffs• Being used for all active RE technologies. introduced by most states
except J&K, Bihar, Jharkhand, Odisha and the North Eastern states. • Preferred by developers because it enhances project bankability
• Financial as well as economic costs and benefits of RE are not yet factored in FIT
• Technology upgradation could lead to better returns as it is not considered in FIT
Accelerated Depreciation (AD)• Acknowledged as the key instrument for success of wind industry in
India • Most wind installations in India have been developed under AD.
• The sector has attained scale & commercial viability on its own.
Generation Based Incentives (GBI)
• Recently introduced to shift investment focus from capacity addition to electricity generation – move from capital subsidies (AD) to generation based incentive.
• Presents avenues for additional guaranteed revenues for project developers
Renewable Purchase Obligation (RPO)
• RPOs are mandated by the Electricity Act 2003 and National Tariff Policy
• RPOs adopted by 23 SERCs
• Readymade market for renewable power sources
Clean Energy Cess• The government plans to develop these funds for development of
renewable energy
Renewable Energy Certificates (REC’s)
• MNRE and CERC have developed a REC regime which has kicked off recently
• Serves as a mechanism to fulfill the RPO obligations thereby reducing penalties
• Helps renewable power developers to trade REC's and realise the value of power
Carbon Trading
• India has largest number of registered and pipeline CDM projects in the world.
• Helped to push the RE industry by making projects more financially attractive
• Additional cushion for developers to increase their project returns and RoE
Tax Incentives - Exemptions on Capital Investments and
Generation
• Tax exemption instruments such as exemptions or reductions on excise and customs duty have been introduced
• Tax Incentives help improving RoE ofdeveloper
State RE Policies• Examples of state with policies for RE include Karnataka, Punjab,
Madhya Pradesh, Gujarat, Himachal Pradesh, Uttarakhand etc
• The number of clearances required for renewable projects has come down
Renewable Energy SectorGovernment Initiatives & Interventions
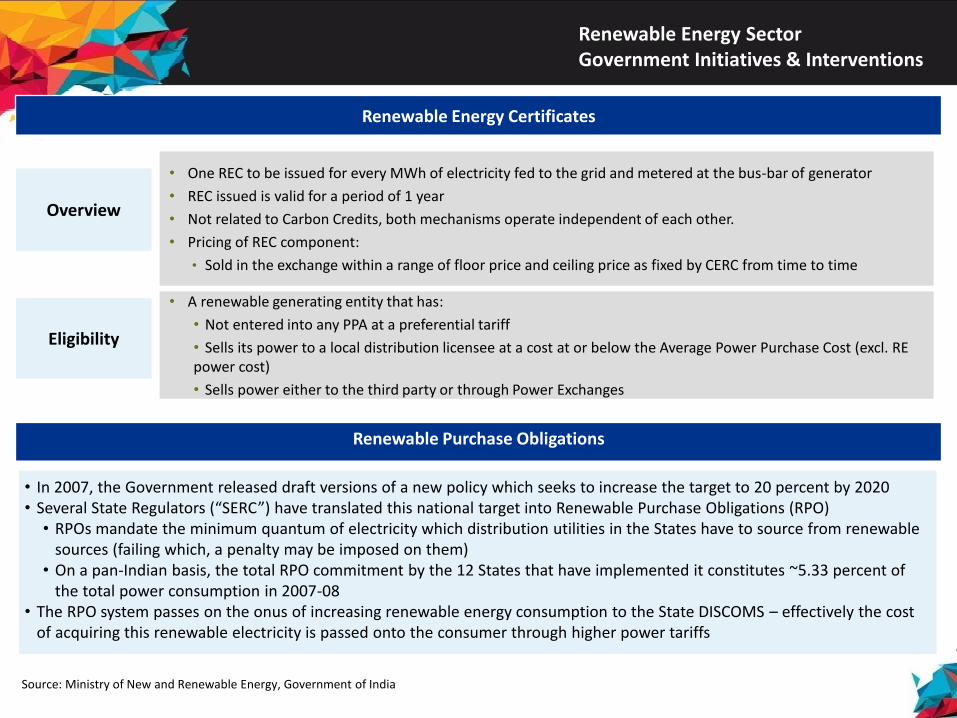
• One REC to be issued for every MWh of electricity fed to the grid and metered at the bus-bar of generator
• REC issued is valid for a period of 1 year
• Not related to Carbon Credits, both mechanisms operate independent of each other.
• Pricing of REC component:
• Sold in the exchange within a range of floor price and ceiling price as fixed by CERC from time to time
• A renewable generating entity that has:
• Not entered into any PPA at a preferential tariff
• Sells its power to a local distribution licensee at a cost at or below the Average Power Purchase Cost (excl. RE power cost)
• Sells power either to the third party or through Power Exchanges
Overview
Eligibility
Renewable Energy Certificates
Renewable Purchase Obligations
• In 2007, the Government released draft versions of a new policy which seeks to increase the target to 20 percent by 2020• Several State Regulators (“SERC”) have translated this national target into Renewable Purchase Obligations (RPO)
• RPOs mandate the minimum quantum of electricity which distribution utilities in the States have to source from renewable sources (failing which, a penalty may be imposed on them)
• On a pan-Indian basis, the total RPO commitment by the 12 States that have implemented it constitutes ~5.33 percent of the total power consumption in 2007-08
• The RPO system passes on the onus of increasing renewable energy consumption to the State DISCOMS – effectively the cost of acquiring this renewable electricity is passed onto the consumer through higher power tariffs
Source: Ministry of New and Renewable Energy, Government of India

FOR ADDITIONAL INFORMATION CONNECT US @
Gujarat Energy Development Agency
Gujarat Power Corporation Ltd
http://www.geda.gujarat.gov.in
http://www.gpclindia.com
Energy and Petrochemicals Deapartment http://www.guj-epd.gov.in
Gujarat Energy Research & Management Institute http://www.germi.org
Knowledge Partner Event PartnerOrganized By
Visit us at www.vibrantgujarat.com