TABLE OF CONTENTS - causewaycap.com · Financial Highlights 18 Notes ... the Philippines, Pakistan,...
32
TABLE OF CONTENTS Letter to Shareholders 2 Schedule of Investments 6 Sector Diversification 14 Statement of Assets and Liabilities 15 Statement of Operations 16 Statements of Changes in Net Assets 17 Financial Highlights 18 Notes to Financial Statements 20 Disclosure of Fund Expenses 28
Transcript of TABLE OF CONTENTS - causewaycap.com · Financial Highlights 18 Notes ... the Philippines, Pakistan,...

T A B L E O F C O N T E N T S
Letter to Shareholders 2
Schedule of Investments 6
Sector Diversification 14
Statement of Assets and Liabilities 15
Statement of Operations 16
Statements of Changes in Net Assets 17
Financial Highlights 18
Notes to Financial Statements 20
Disclosure of Fund Expenses 28

L E T T E R T O S H A R E H O L D E R S
For the six months ended March 31, 2018, Causeway International Small Cap Fund’s (the “Fund’s”) InstitutionalClass returned 5.80% and Investor Class returned 5.72% compared to the MSCI ACWI ex USA Small Cap Index (Gross)(“Index”) return of 6.31%. Since the Fund’s inception on October 20, 2014, its average annual total returns are12.68% for the Institutional Class and 12.44% for the Investor Class compared to the Index’s average annual totalreturn of 10.90%. As of March 31, 2018, the Fund had net assets of $31.5 million.
Performance ReviewThe global bull market of 2017 carried almost every country’s equity index to (or near) record highs to finish theyear. Investors reacted positively to signs of improved global growth and US tax reform. However, despite continuedequity market strength in January 2018, investor fears regarding increasingly hawkish central bank rhetoric and apotential trade war between the US and China dragged equities down in February and March 2018. However, despitethe increase in market volatility, international smaller capitalization equities outperformed larger capitalization equitiesduring the period. The Economist’s poll of forecasters, March averages, indicated that US gross domestic product(“GDP”) growth remained healthy, increasing to a 2.8% annualized rate for 2018. A sustained low unemploymentrate, elevated consumer confidence, and high business investment intentions have led to anticipation of more hawkishFederal Reserve (“Fed”) policy. Fed Chair Jerome Powell has indicated that he aims to avoid overheating the economywithout derailing economic expansion. However, the announcement of US tariffs on Chinese imports (and vice versa)kicked off fears of a global trade war, threatening the health of both massive economies. Larger challenges loomshould these protectionist policies have a damaging effect on broader global growth. In Europe, consumer confidenceremained buoyant and the unemployment rate continued to decline. The European Central Bank remained cautious,but the removal of quantitative easing at the end of 2018 still seems likely based on gradually rising real GDP growth(expected GDP growth in the Eurozone increased to 2.5% annualized). The best performing markets in our investableuniverse in the six months ended March 31, 2018 included Egypt, South Korea, South Africa, New Zealand, andTaiwan. The biggest laggards included Poland, Peru, the Philippines, Pakistan, and Canada. The best performingsectors in the ACWI ex USA Small Cap Index were health care, information technology, and consumer staples, whileenergy, telecommunication services, and utilities were the worst performing Index sectors.
To evaluate stocks in our investable universe, our multi-factor quantitative model examines broad factor categoriesincluding valuation, earnings growth, technical indicators, quality, macroeconomics, and country. Late in 2017, weadded a 10% top-down component to our quantitative model. Previously, we found that the top down model whichwe use for our Emerging Markets (EM) strategy had limited efficacy for country selection in Developed Markets (DM).In 2017, however, we created a separate DM country selection model and tested it throughout the year. We ultimatelymerged the best elements of the EM and DM country models to supplement company-specific factors in our interna-tional small cap model. Each stock’s alpha(1) score now consists of 90% stock-specific factors, 5% macroeconomicfactors, and 5% country factors. Our valuation and financial strength factors lagged during the period. Our technicalfactor provided the strongest predictive power during the period, followed by our earnings growth factor. For the firstquarter of 2018, our macroeconomic and country top-down factors both posted positive returns.
2 Causeway International Small Cap Fund

From a sector perspective, holdings in the consumer discretionary, health care, and industrials sectors detracted themost from relative performance versus the Index, while holdings in the materials, consumer staples, and energy sec-tors were the largest relative contributors. The top detractors from performance relative to the Index were overweightpositions in natural gas & electricity retailer, Just Energy Group Inc. (Canada), digital communications & mailroomequipment provider, Neopost SA (France), and knitwear manufacturer, Nameson Holdings Ltd. (Hong Kong). The topindividual contributors included overweight positions in computer hardware manufacturer, Gigabyte Technology Co.,Ltd. (Taiwan), steel & iron distribution company, EVRAZ Plc (United Kingdom), and integrated poultry producer,Astral Foods Ltd. (South Africa).
Significant Portfolio ChangesAs of March 31, 2018, the Fund’s largest overweight positions relative to the Index by industry group were theinsurance, energy, and real estate industry groups, while the Fund’s largest relative underweight positions were thepharmaceuticals & biotechnology, software & services, and consumer services industry groups. From a country per-spective, the largest country overweight positions relative to the Index were Thailand, Australia, and China, while thelargest active country underweight positions were Japan, the United Kingdom, and Canada.
Significant purchases in the first half of the fiscal year included purchases of the following new securities: gold miner,Harmony Gold Mining Co. Ltd. (South Africa), integrated oil refiner & producer, Esso Thailand Public Co. Ltd.(Thailand), automobile components manufacturer, Keihin Corp. (Japan), latex glove manufacturer, Supermax Corp. Bhd.(Malaysia), and construction company, Implenia AG (Switzerland). The largest sales during the period included the fol-lowing full exits from the Fund: property developer, Hemfosa Fastigheter AB (Sweden), airline, Air New Zealand Ltd.(New Zealand), residential property developer, Yuzhou Properties Co., Ltd. (China), passenger & cargo airline company,Air France-KLM SA (France), as well as a reduced exposure to oil & natural gas producer, Paz Oil Co. Ltd. (Israel).
Investment OutlookWe continue to observe a number of intriguing features in the smaller capitalization landscape. We believe the inter-section of international equities and smaller capitalization companies creates a recipe for inefficiency. Additionally,international smaller capitalization stocks are an underappreciated asset class that we believe can offer meaningfuldiversification benefits with the potential to reduce portfolio volatility. Finally, smaller capitalization stocks are typi-cally less exposed to the potential risk of rising barriers to trade, given their home country revenue exposure. In spiteof the potential benefits, we believe many investors may be underallocated to the asset class despite its meaningfulgrowth and diversification prospects.
The outlook for smaller capitalization equities remains favorable in our view. Smaller capitalization equities are cur-rently exhibiting a higher long-term earnings-per-share growth trend than larger capitalization equities. Additionally,international smaller capitalization equities have exhibited greater valuation dispersion than larger capitalization equi-ties on both a forward earnings yield basis and a price-to-book value basis, indicating more information content invaluation ratios for these equities. This characteristic has allowed us to construct a portfolio with lower valuation ratios
Causeway International Small Cap Fund 3

relative to the Index without, in our view, compromising quality. Causeway’s international small cap strategy com-bines the flexibility and breadth of quantitative analysis with our global industry knowledge, which we believe willbenefit long-term investors.
We thank you for your continued confidence in Causeway International Small Cap Fund.
March 31, 2018
Arjun Jayaraman MacDuff Kuhnert Joseph GublerPortfolio Manager Portfolio Manager Portfolio Manager
The above commentary expresses the portfolio managers’ views as of the date shown and should not be relied upon by the reader as research orinvestment advice. These views are subject to change. There is no guarantee that any forecasts made will come to pass.
Holdings are subject to change. Current and future holdings are subject to risk. Securities mentioned do not make up the entire portfolio and, in theaggregate, may represent a small percentage of the portfolio.
Investing involves risk including loss of principal. In addition to the normal risks associated with investing, international investments may involve risk of capitalloss from unfavorable fluctuation in currency values, from differences in generally accepted accounting principles or from economic or political instability inother nations. Emerging markets involve heightened risks related to the same factors as well as increased volatility and lower trading volume. Investments insmaller companies involve additional risks and typically exhibit higher volatility. Diversification does not prevent all investment losses. Forward Earnings Yieldis the projected earnings yield for the current fiscal year.
(1) Alpha – Excess returns relative to the Fund’s benchmark.
4 Causeway International Small Cap Fund

March 31, 2018
One YearReturn
3 YearReturn
AnnualizedInception
to Date
Institutional Class 25.85% 11.89% 12.68%
Investor Class 25.66% 11.66% 12.44%
MSCI ACWI ex USA
Small Cap Index (Gross) 21.03 10.79% 10.90%
Inception is October 20, 2014. The performance data represents past performance and is not an indication of future results. Investment return and theprincipal value of an investment will fluctuate so that an investor’s shares, when redeemed, may be worth less than their original cost and currentperformance may be lower than the performance quoted. For performance data current to the most recent month end, please call 1-866-947-7000 or visitwww.causewayfunds.com. Investment performance reflects contractual fee waivers in effect during certain periods. In the absence of such fee waivers, totalreturn would be reduced. The contractual expense limits are in effect until January 31, 2019. Total returns assume reinvestment of dividends and capitalgains distributions at net asset value when paid. Investor Class shares pay a shareholder service fee of up to 0.25% per annum of average daily net assets.Institutional Class shares pay no shareholder service fee. Pursuant to the current January 25, 2018 prospectus, the Fund’s annualized gross ratios ofexpenses in relation to average net assets were 3.09% and 3.32% for the Institutional Class and Investor Class, respectively, and the Fund’s annualizedratios of expenses in relation to net assets after fee waivers and reimbursements were 1.31% and 1.56% for the Institutional Class and Investor Class,respectively. The Fund imposes a 2% redemption fee on the value of shares redeemed less than 60 days after purchase. If your account incurred aredemption fee, your performance will be lower than the performance shown here. For more information, please see the prospectus.
The MSCI ACWI ex USA Small Cap Index (Gross) is a free float-adjusted market capitalization weighted index, designed to measure the equity marketperformance of smaller capital stocks in developed and emerging markets, excluding the US market, consisting of 46 country indices. The index coversapproximately 14% of the free float adjusted market capitalization in each country. The Index is gross of withholding taxes, assumes reinvestment ofdividends and capital gains, and does not reflect the payment of transaction costs, fees and expenses associated with an investment in the Fund. It is notpossible to invest directly in an index. There are special risks in foreign investing (please see Note 5 in the Notes to Financial Statements).
MSCI has not approved, reviewed or produced this report, makes no express or implied warranties or representations, and is not liable whatsoever for anydata in this report. You may not redistribute the MSCI data or use it as a basis for other indices or investment products.
Causeway International Small Cap Fund 5

S C H E D U L E O F I N V E S T M E N T S (000)*March 31, 2018 (Unaudited)
Causeway International Small Cap Fund Number of Shares Value
COMMON STOCKAustralia — 6.9%
Abacus Property Group1 32,081 $ 86Beach Energy Ltd. 252,116 240Cromwell Property Group1 120,299 99CSR Ltd. 36,287 146Downer EDI Ltd. 16,076 80FlexiGroup Ltd. 304,158 423Mineral Resources Ltd. 16,425 218Nine Entertainment Co. Holdings Ltd. 172,222 302Sandfire Resources NL 101,777 580
2,174
Belgium — 0.6%AGFA-Gevaert NV2 25,197 97Befimmo S.A.1 1,327 86
183
Canada — 4.5%AGF Management Ltd., Class B 36,400 185Artis Real Estate Investment Trust1 8,500 90Cominar Real Estate Investment Trust1 7,500 75Dream Global Real Estate Investment Trust1 54,500 581Just Energy Group Inc. 44,300 196Transcontinental Inc., Class A 10,800 213WestJet Airlines Ltd. 4,500 83
1,423
China — 6.5%Agile Property Holdings Ltd. 150,000 313China Aoyuan Property Group Ltd. 112,000 105China South City Holdings Ltd. 758,000 172Huaxin Cement Co. Ltd., Class B 311,400 421KWG Property Holding Ltd. 164,000 228Lao Feng Xiang Co. Ltd., Class B 39,752 144
The accompanying notes are an integral part of the financial statements.
6 Causeway International Small Cap Fund

S C H E D U L E O F I N V E S T M E N T S (000)* (continued)
March 31, 2018 (Unaudited)
Causeway International Small Cap Fund Number of Shares Value
China — (continued)Yuexiu Property Co. Ltd. 2,766,000 $ 658
2,041
Denmark — 0.3%Per Aarsleff Holding A/S 2,512 94
Egypt — 0.9%ElSewedy Electric Co. 23,449 288
Finland — 0.3%Finnair OYJ 6,101 85
France — 1.3%Coface S.A. 16,241 186Metropole Television S.A. 3,904 100Neopost SA 4,805 127
413
Germany — 3.8%Deutsche Pfandbriefbank AG 14,631 231Kloeckner & Co. SE 31,708 398Salzgitter AG 1,486 76Wuestenrot & Wuerttembergische AG 21,399 506
1,211
Greece — 0.8%Motor Oil Hellas Corinth Refineries SA 10,675 241
Hong Kong — 0.4%Nameson Holdings Ltd. 634,000 136
Indonesia — 2.2%Bukit Asam 352,100 76Indo Tambangraya Megah Tbk PT 296,000 614
690
The accompanying notes are an integral part of the financial statements.
Causeway International Small Cap Fund 7

S C H E D U L E O F I N V E S T M E N T S (000)* (continued)
March 31, 2018 (Unaudited)
Causeway International Small Cap Fund Number of Shares Value
Israel — 0.8%El Al Israel Airlines 342,666 $ 115Paz Oil Co. Ltd. 542 80SodaStream International Ltd.2 600 55
250
Italy — 4.7%Immobiliare Grande Distribuzione SIIQ SpA1 43,092 403Societa Cattolica di Assicurazioni SC 33,535 357Societa Iniziative Autostradali e Servizi SpA 5,502 102Unipol Gruppo SpA 125,531 614
1,476
Japan — 16.8%Asahi Intecc Co. Ltd. 2,400 97CONEXIO Corp. 4,300 92Cosmo Energy Holdings Co. Ltd. 4,100 133Daiho Corp. 22,000 126DTS Corp. 2,600 90EDION Corp. 7,100 82FCC Co. Ltd. 3,000 84Foster Electric Co. Ltd. 22,300 550Geo Holdings Corp. 7,500 119Haseko Corp. 11,000 169Hosiden Corp. 21,700 273Japan Aviation Electronics Industry Ltd. 6,000 86JVC Kenwood Corp. 21,200 70Keihin Corp. 29,800 613Kyowa Exeo Corp. 3,700 99Melco Holdings Inc. 4,100 137NET One Systems Co. Ltd. 13,600 200Nippon Chemi-Con Corp. 8,900 210Rengo Co. Ltd. 8,300 72Showa Corp. 30,800 528
The accompanying notes are an integral part of the financial statements.
8 Causeway International Small Cap Fund

S C H E D U L E O F I N V E S T M E N T S (000)* (continued)
March 31, 2018 (Unaudited)
Causeway International Small Cap Fund Number of Shares Value
Japan — (continued)Sojitz Corp. 141,600 $ 451Sumitomo Forestry Co. Ltd. 5,400 87Takasago Thermal Engineering Co. Ltd. 5,400 100Toho Holdings Co. Ltd. 4,300 102Token Corp. 900 90Toshiba Machine Co. Ltd. 14,000 97Tosoh Corp. 9,500 187Towa Pharmaceutical Co. Ltd. 1,200 76TS Tech Co. Ltd. 2,200 88Unipres Corp. 3,400 77Yuasa Trading Co. Ltd. 2,700 89
5,274
Malaysia — 1.9%Supermax Corp. BHD 919,700 613
Mexico — 1.9%Macquarie Mexico Real Estate Management SA de CV1,2 541,500 608
Netherlands — 1.7%ASR Nederland NV 8,675 371BE Semiconductor Industries NV 847 87Intertrust NV 4,305 89
547
Norway — 2.7%Atea ASA 15,745 256Austevoll Seafood ASA 10,788 108Salmar ASA 2,253 93SpareBank 1 SMN 36,436 378
835
Singapore — 2.2%Best World International Ltd. 68,700 97
The accompanying notes are an integral part of the financial statements.
Causeway International Small Cap Fund 9
S C H E D U L E O F I N V E S T M E N T S (000)* (continued)
March 31, 2018 (Unaudited)
Causeway International Small Cap Fund Number of Shares Value
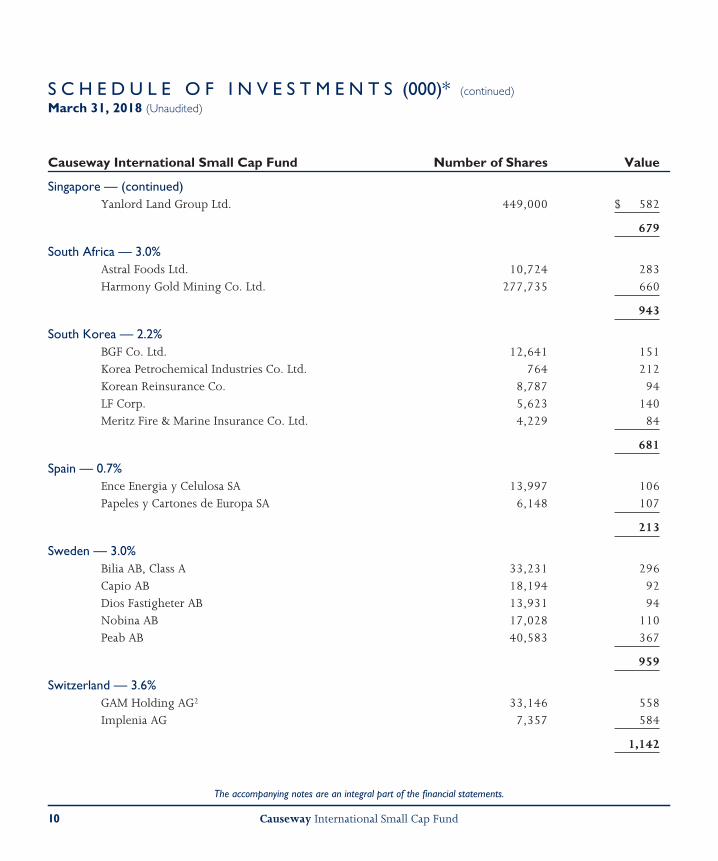
Singapore — (continued)Yanlord Land Group Ltd. 449,000 $ 582
679
South Africa — 3.0%Astral Foods Ltd. 10,724 283Harmony Gold Mining Co. Ltd. 277,735 660
943
South Korea — 2.2%BGF Co. Ltd. 12,641 151Korea Petrochemical Industries Co. Ltd. 764 212Korean Reinsurance Co. 8,787 94LF Corp. 5,623 140Meritz Fire & Marine Insurance Co. Ltd. 4,229 84
681
Spain — 0.7%Ence Energia y Celulosa SA 13,997 106Papeles y Cartones de Europa SA 6,148 107
213
Sweden — 3.0%Bilia AB, Class A 33,231 296Capio AB 18,194 92Dios Fastigheter AB 13,931 94Nobina AB 17,028 110Peab AB 40,583 367
959
Switzerland — 3.6%GAM Holding AG2 33,146 558Implenia AG 7,357 584
1,142
The accompanying notes are an integral part of the financial statements.
10 Causeway International Small Cap Fund

S C H E D U L E O F I N V E S T M E N T S (000)* (continued)
March 31, 2018 (Unaudited)
Causeway International Small Cap Fund Number of Shares Value
Taiwan — 5.1%Ardentec Corp. 69,000 $ 90Chlitina Holding Ltd. 20,000 135Gigabyte Technology Co. Ltd. 135,000 319Radiant Opto-Electronics Corp. 221,000 548Simplo Technology Co. Ltd. 71,000 455Taiwan Surface Mounting Technology Co. Ltd. 76,450 74
1,621
Thailand — 3.6%Esso Thailand PCL 1,145,600 651Quality Houses PCL 352,400 33Thai Vegetable Oil PCL 400,000 438
1,122
Turkey — 2.0%Anadolu Cam Sanayii AS 79,152 69Is Gayrimenkul Yatirim Ortakligi AS1 577,574 189Soda Sanayii AS 129,589 180Tekfen Holding AS 46,634 202
640
United Arab Emirates — 0.3%Air Arabia PJSC 279,222 87
United Kingdom — 7.7%Bellway PLC 1,976 84Centamin PLC 65,982 143Central Asia Metals PLC 98,764 445Debenhams PLC 221,575 65Evraz PLC 77,573 473Firstgroup PLC2 76,942 89Forterra PLC 11,720 49J D Wetherspoon PLC 5,221 84JD Sports Fashion PLC 10,289 48
The accompanying notes are an integral part of the financial statements.
Causeway International Small Cap Fund 11

S C H E D U L E O F I N V E S T M E N T S (000)* (continued)
March 31, 2018 (Unaudited)
Causeway International Small Cap FundNumber of
Shares/Rights Value
United Kingdom — (continued)Kier Group PLC 6,773 $ 89Lancashire Holdings Ltd. 14,170 115Pendragon PLC 300,137 98Petrofac Ltd. 38,105 272Redrow PLC 10,603 89Stagecoach Group PLC 43,403 80Thomas Cook Group PLC 57,800 96Victrex PLC 2,670 96
2,415
Total Common Stock
(Cost $27,644) — 92.4% 29,084
EXCHANGE TRADED FUNDSVanEck Vectors India Small-Capital Index ETF 9,149 523Vanguard FTSE All World ex-US Small-Capital ETF 10,716 1,278
Total Exchange Traded Funds
(Cost $1,810) — 5.7% 1,801
PREFERENCE STOCKBrazil — 0.3%
Banco do Estado do Rio Grande do Sul 12,800 79
Total Preference Stock
(Cost $73) — 0.3% 79
RIGHTSItaly — 0.1%
Immobiliare Grande Distribuzione SIIQ SpA,Expires 4/16/20182 43,092 46
Total Rights
(Cost $—) — 0.1% 46
The accompanying notes are an integral part of the financial statements.
12 Causeway International Small Cap Fund

S C H E D U L E O F I N V E S T M E N T S (000)* (concluded)
March 31, 2018 (Unaudited)
Causeway International Small Cap FundNumber of
Shares Value
SHORT-TERM INVESTMENTInvesco Short-Term Investment Trust: Government & Agency
Portfolio, Institutional Class, 1.550%** 438,050 $ 438
Total Short-Term Investment
(Cost $438) — 1.4% 438
Total Investments — 99.9%
(Cost $29,965) 31,448
Other Assets in Excess of Liabilities — 0.1% 21
Net Assets — 100.0% $31,469
* Except for share data.** The rate reported is the 7-day effective yield as of September 30, 2017.1 Real Estate Investment Trust.2 Non-income producing security.ETF Exchange Traded Fund
The accompanying notes are an integral part of the financial statements.
Causeway International Small Cap Fund 13

S E C T O R D I V E R S I F I C A T I O N
As of March 31, 2018, the sector diversification was as follows (Unaudited):
Causeway International Small Cap FundCommon
StockPreference
Stock% of
Net Assets
Real Estate 13.7% 0.0% 13.7%
Consumer Discretionary 13.6 0.0 13.6
Financials 13.3 0.3 13.6
Industrials 13.6 0.0 13.6
Materials 13.5 0.0 13.5
Information Technology 9.7 0.0 9.7
Energy 7.3 0.0 7.3
Consumer Staples 3.7 0.0 3.7
Health Care 3.4 0.0 3.4
Utilities 0.6 0.0 0.6
Total 92.4 0.3 92.7
Exchange Traded Funds 5.7
Rights 0.1
Short-Term Investment 1.4
Other Assets in Excess of Liabilities 0.1
Net Assets 100.0%
The accompanying notes are an integral part of the financial statements.
14 Causeway International Small Cap Fund

S T A T E M E N T O F A S S E T S A N D L I A B I L I T I E S (000)*(Unaud i t ed )
CAUSEWAYINTERNATIONAL
SMALL CAP FUND
3/31/18
ASSETS:
Investments at Value (Cost $29,965) $31,448Cash 2Foreign Currency (Cost $36) 36Receivable for Dividends 119Receivable for Tax Reclaims 11Prepaid Expenses 13
Total Assets 31,629
LIABILITIES:
Payable for Investment Securities Purchased 100Payable Due to Adviser 12Payable Due to Administrator 2Other Accrued Expenses 46
Total Liabilities 160
Net Assets $31,469
NET ASSETS:
Paid-in Capital (unlimited authorization — no par value) $29,353Undistributed Net Investment Income 12Accumulated Net Realized Gain on Investments and Foreign Currency Transactions 621Net Unrealized Appreciation on Investments 1,483
Net Assets $31,469
Net Asset Value Per Share (based on net assets of$29,355,731 ÷ 2,221,226 shares) — Institutional Class $13.22
Net Asset Value Per Share (based on net assets of$2,113,187 ÷ 159,811 shares) — Investor Class $13.22
* Except for Net Asset Value Per Share data.
The accompanying notes are an integral part of the financial statements.
Causeway International Small Cap Fund 15

S T A T E M E N T O F O P E R A T I O N S (000)(Unaud i t ed )
CAUSEWAYINTERNATIONAL
SMALL CAP FUND
10/01/17 to3/31/18
INVESTMENT INCOME:
Dividend Income (net of foreign taxes withheld of $31) $ 250
Total Investment Income 250
EXPENSES:
Investment Advisory Fees 85Transfer Agent Fees 29Professional Fees 18Custodian Fees 17Registration Fees 17Administration Fees 10Printing Fees 9Pricing Fees 6Shareholder Service Fees — Investor Class 2(1)
Total Expenses 193
Waiver of Investment Advisory Fees (82)
Total Waiver and Reimbursement (82)
Net Expenses 111
Net Investment Income 139
Net Realized and Unrealized Gain (Loss) on Investments and Foreign CurrencyTransactions:
Net Realized Gain on Investments 697Net Realized Loss from Foreign Currency Transactions (1)Net Change in Unrealized Depreciation on Investments (652)
Net Realized and Unrealized Gain on Investments and Foreign Currency Transactions 44
Net Increase in Net Assets Resulting from Operations $ 183
(1) Fees have been reduced by a one-time adjustment as a result of a management change in accrual estimate in the amount of $–. Excludingthe adjustment, shareholder service fees would have been $2.
Amount designated as “—” has been rounded to $0.
The accompanying notes are an integral part of the financial statements.
16 Causeway International Small Cap Fund

S T A T E M E N T S O F C H A N G E S I N N E T A S S E T S (000)
CAUSEWAY INTERNATIONALSMALL CAP FUND
10/01/17 to3/31/18
(Unaudited)
10/01/16 to9/30/17
(Audited)
OPERATIONS:
Net Investment Income $ 139 $ 231Net Realized Gain on Investments 697 778Net Realized Loss from Foreign Currency Transactions (1) (4)Net Change in Unrealized Appreciation (Depreciation) on Investments (652) 1,604
Net Increase in Net Assets Resulting From Operations 183 2,609
DIVIDENDS AND DISTRIBUTIONS TO SHAREHOLDERS:
Dividends from Net Investment Income:Institutional Class (314) (234)Investor Class (29) (10)
Total Dividends from Net Investment Income (343) (244)
Distributions from Net Capital Gains:Institutional Class (594) —Investor Class (58) —
Total Distributions from Net Capital Gains (652) —
Total Dividends and Distributions to Shareholders (995) (244)
Net Increase in Net Assets Derived from Capital Share Transactions(1) 20,152 577Redemption Fees(2) 6 —
Total Increase in Net Assets 19,346 2,942
NET ASSETS:
Beginning of Period 12,123 9,181
End of Period $31,469 $12,123
Undistributed Net Investment Income $ 12 $ 216
(1) See Note 7 in the Notes to Financial Statements.(2) See Note 2 in the Notes to Financial Statements.Amounts designated as “—” are $0 or are rounded to $0.
The accompanying notes are an integral part of the financial statements.
Causeway International Small Cap Fund 17

F I N A N C I A L H I G H L I G H T SFor the Six Months Ended March 31, 2018 (Unaudited) and the Fiscal Years or Period Ended September 30,For a Share Outstanding Throughout the Period or Fiscal Year
Net AssetValue,
Beginningof Period ($)
NetInvestmentIncome ($)
Net Realizedand
UnrealizedGain
(Loss) onInvestments ($)
Totalfrom
Operations ($)
Dividendsfrom Net
InvestmentIncome ($)
Distributionsfrom
CapitalGains ($)
TotalDividends
andDistributions ($)
RedemptionFees ($)
CAUSEWAY INTERNATIONAL SMALL CAP FUND†Institutional
2018(1) 13.56 0.11 0.65 0.76 (0.38) (0.72) (1.10) —(3)
2017 10.91 0.26 2.68 2.94 (0.29) — (0.29) —2016 10.12 0.21 0.82 1.03 (0.24) — (0.24) —2015(1)(2) 10.00 0.23 (0.11) 0.12 — — — —
Investor2018(1) 13.55 0.07 0.63 0.70 (0.36) (0.72) (1.08) 0.052017 10.90 0.26 2.65 2.91 (0.26) — (0.26) —2016 10.10 0.16 0.82 0.98 (0.21) — (0.21) 0.032015(1)(2) 10.00 0.23 (0.13) 0.10 — — — —
† Per share amounts calculated using average shares method.(1) All ratios for periods less than one year are annualized. Total returns and portfolio turnover rate are for the period indicated and have not
been annualized.(2) Commenced operations on October 20, 2014.(3) Amount represents less than $0.01 per share (See Note 2 in the Notes to Financial Statements).(4) The ratio of expenses to average net assets has been reduced by a one-time adjustment as a result of a management change in accrual
estimate relating to shareholder service fees. Excluding the adjustment, the annualized ratio of expenses to average net assets would havebeen 1.52%.
Amounts designated as “—” are $0 or round to $0.
The accompanying notes are an integral part of the financial statements.
18 Causeway International Small Cap Fund

Net AssetValue, End
of Period ($)Total
Return (%)
Net Assets,End ofPeriod($000)
Ratio ofExpenses to
Average NetAssets (%)
Ratio ofExpenses
to AverageNet Assets(Excluding
Waivers andReimburse-ments) (%)
Ratioof Net
InvestmentIncome
to AverageNet Assets (%)
PortfolioTurnoverRate (%)
13.22 5.80 29,356 1.30 2.26 1.68 4513.56 27.77 11,218 1.30 3.08 2.27 9110.91 10.29 8,795 1.30 3.42 2.05 10810.12 1.20 8,663 1.30 3.40 2.30 76
13.22 5.72 2,113 1.52(4) 2.50 1.10 4513.55 27.45 905 1.55 3.31 2.23 9110.90 10.08 386 1.55 3.68 1.51 10810.10 1.00 654 1.55 3.64 2.30 76
The accompanying notes are an integral part of the financial statements.
Causeway International Small Cap Fund 19

N O T E S T O F I N A N C I A L S T A T E M E N T S (Unaudited)
1. Organization
Causeway International Small Cap Fund (the “Fund”) isa series of Causeway Capital Management Trust (the“Trust”). The Trust is an open-end managementinvestment company registered under the InvestmentCompany Act of 1940, as amended (the “1940 Act”)and is a Delaware statutory trust that was established onAugust 10, 2001. The Fund began operations onOctober 20, 2014. The Fund is authorized to offer twoclasses of shares, the Institutional Class and the InvestorClass. The Declaration of Trust authorizes the issuanceof an unlimited number of shares of beneficial interestof the Fund. The Fund is diversified. The Fund’s pro-spectus provides a description of the Fund’s investmentobjectives, policies and strategies. The Trust has fiveadditional series, the financial statements of which arepresented separately.
2. Significant Accounting Policies
The following is a summary of the significant account-ing policies consistently followed by the Fund.
Use of Estimates in the Preparation of Financial State-ments – The Fund is an investment company thatapplies the accounting and reporting guidance issued inTopic 946 by the U.S. Financial Accounting StandardsBoard. The Fund’s financial statements have been pre-pared to comply with U.S. generally accepted account-ing principles (“U.S. GAAP”). The preparation offinancial statements in conformity with U.S. GAAPrequires management to make estimates and assump-tions that affect the reported amount of net assets andliabilities and disclosure of contingent assets andliabilities at the date of the financial statements and thereported amounts of increases and decreases in netassets from operations during the reporting period.Actual results could differ from those estimates.
Security Valuation – Except as described below, securitieslisted on a securities exchange (except the NASDAQStock Market (“NASDAQ”)) or Over-the-Counter(“OTC”) for which market quotations are available) arevalued at the last reported sale price as of the close oftrading on each business day, or, if there is no suchreported sale, at the last reported bid price for longpositions. For securities traded on NASDAQ, the NAS-DAQ Official Closing Price is used. Securities listed onmultiple exchanges or OTC markets are valued on theexchange or OTC market considered by the Fund to bethe primary market. The prices for foreign securities arereported in local currency and converted to U.S. dollarsusing currency exchange rates. Prices for most securitiesheld in the Fund are provided daily by recognizedindependent pricing agents. If a security price cannot beobtained from an independent pricing agent, the Fundseeks to obtain a bid price from at least oneindependent broker. Investments in money marketfunds are valued daily at the net asset value per share.
Securities for which market prices are not “readily avail-able” are valued in accordance with fair value pricingprocedures approved by the Fund’s Board of Trustees(the “Board”). The Fund’s fair value pricing proceduresare implemented through a Fair Value Committee (the“Committee”) designated by the Board. Some of themore common reasons that may necessitate that a secu-rity be valued using fair value pricing proceduresinclude: the security’s trading has been halted or sus-pended; the security has been delisted from a nationalexchange; the security’s primary trading market istemporarily closed at a time when under normal con-ditions it would be open; or the security’s primary pric-ing source is not able or willing to provide a price.When the Committee values a security in accordancewith the fair value pricing procedures, the Committee
20 Causeway International Small Cap Fund

N O T E S T O F I N A N C I A L S T A T E M E N T S (Unaudited)( con t i nued )
will determine the value after taking into considerationrelevant information reasonably available to theCommittee.
The Fund uses a third party vendor to fair value certainnon-U.S. securities if there is a movement in a des-ignated exchange-traded fund that trades in the U.S.that exceeds thresholds established by the Committee.The vendor provides fair values for foreign securitiesbased on factors and methodologies involving, gen-erally, tracking valuation correlations between the U.S.market and each non-U.S. security and such fair valuesare applied by the administrator if a pre-determinedconfidence level is reached for the security.
In accordance with the authoritative guidance on fairvalue measurements and disclosure under U.S. GAAP,the Fund discloses fair value of its investments in ahierarchy that prioritizes the inputs to valuation tech-niques used to measure the fair value. The objective of afair value measurement is to determine the price thatwould be received to sell an asset or paid to transfer aliability in an orderly transaction between marketparticipants at the measurement date (an exit price).Accordingly, the fair value hierarchy gives the highestpriority to quoted prices (unadjusted) in active marketsfor identical assets or liabilities (Level 1) and the lowestpriority to unobservable inputs (Level 3). The guidanceestablishes three levels of fair value hierarchy as follows:
• Level 1 — Unadjusted quoted prices in activemarkets for identical, unrestricted assets orliabilities that the Fund has the ability to access atthe measurement date;
• Level 2 — Quoted prices for similar asset orliability in active markets, quoted prices for identi-cal or similar asset or liability in markets which arenot active, or prices based on inputs that areobservable (either directly or indirectly); and
• Level 3 — Prices, inputs or exotic modeling tech-niques which are both significant to the fair valuemeasurement and unobservable (supported by lit-tle or no market activity).
Investments are classified within the level of the lowestsignificant input considered in determining fair value.Investments classified within Level 3 which fair valuemeasurement considers several inputs may includeLevel 1 or Level 2 inputs as components of the overallfair value measurement.
The following table sets forth information about thelevels within the fair value hierarchy at which theFund’s investments are measured at March 31, 2018(000):
Investments inSecurities Level 1 Level 2† Level 3 Total
Common StockAustralia $ — $2,174 $— $2,174Belgium — 183 — 183Canada 1,423 — — 1,423China — 2,041 — 2,041Denmark — 94 — 94Egypt — 288 — 288Finland — 85 — 85France — 413 — 413Germany — 1,211 — 1,211Greece — 241 — 241Hong Kong — 136 — 136Indonesia — 690 — 690Israel 55 195 — 250Italy — 1,476 — 1,476Japan — 5,274 — 5,274Malaysia — 613 — 613Mexico 608 — — 608Netherlands — 547 — 547Norway — 835 — 835Singapore — 679 — 679South Africa 283 660 — 943South Korea — 681 — 681Spain — 213 — 213Sweden — 959 — 959Switzerland — 1,142 — 1,142Taiwan — 1,621 — 1,621
Causeway International Small Cap Fund 21

N O T E S T O F I N A N C I A L S T A T E M E N T S (Unaudited)( con t i nued )
Investments inSecurities Level 1 Level 2† Level 3 Total
Thailand $ — $ 1,122 $— $ 1,122Turkey — 640 — 640United Arab Emirates 87 — — 87United Kingdom 262 2,153 — 2,415
Total Common Stock 2,718 26,366 — 29,084
Exchange Traded Funds 1,801 — — 1,801
Preference StockBrazil 79 — — 79
Rights 46 — — 46
Short-Term Investment 438 — — 438
Total Investments inSecurities $5,082 $26,366 $— $31,448
† Holdings represent securities trading outside the United States,the values of which were adjusted as a result of significant marketmovements following the close of local trading and/or due to“foreign line” securities using “local line” prices. Securities with avalue of $660 (000), which represented 2.1% of the net assets ofthe Fund, transferred from Level 1 to Level 2 since the prior fiscalyear end primarily due to market movements following the closeof local trading that triggered fair valuation at the end of theperiod.
Please refer to the Schedule of Investments for addi-tional information regarding the composition of theamounts listed above.
Changes in valuation techniques may result in transfersin or out of an investment’s assigned level within thehierarchy during the reporting period. Changes in theclassification between Levels 1 and 2 occur primarilywhen foreign equity securities are fair valued by theFund’s third party vendor using other observable mar-ket–based inputs in place of closing exchange prices dueto events occurring after foreign market closures and/ordue to adjustments to security values due to “ForeignLine” securities using “Local Line” prices. Due to cur-rency and ownership restrictions on foreign persons incertain countries, including without limitation Russiaand Thailand, securities sometimes trade in a “foreign
line” (designated for foreign ownership) and via a“local line” (shares traded locally and held byresidents). Liquidity of shares held in the foreign line ismore often limited that the local line. As the last tradedprice of a foreign line may not represent fair value, ifthe securities can readily be traded through a broker toaccess the local line, the securities may be priced usingthe last traded local line price.
For the six months ended March 31, 2018, no securitiestransferred in or out of Level 3. Transfers between levelsare recognized at period end.
For the six months ended March 31, 2018, there wereno changes to the Fund’s fair value methodologies.
Federal Income Taxes – The Fund intends to continue toqualify as a regulated investment company under Sub-chapter M of the Internal Revenue Code and to distrib-ute all of its taxable income. Accordingly, no provisionfor Federal income taxes has been made in the financialstatements.
The Fund evaluates tax positions taken or expected to betaken in the course of preparing the Fund’s tax returnsto determine whether it is “more-likely-than-not” (i.e.,greater than 50-percent) that each tax position will besustained upon examination by a taxing authority basedon the technical merits of the position. Tax positionsnot deemed to meet the “more-likely-than-not”threshold are recorded as a tax benefit or expense in thecurrent year. The Fund did not record any tax provisionin the current period. However, management’s con-clusions regarding tax positions taken may be subject toreview and adjustment at a later date based on factorsincluding, but not limited to, examination by taxauthorities (i.e., the last 3 tax years, as applicable), andon-going analysis of and changes to tax laws, regu-lations and interpretations thereof.
22 Causeway International Small Cap Fund

N O T E S T O F I N A N C I A L S T A T E M E N T S (Unaudited)( con t i nued )
As of and during the six months ended March 31,2018, the Fund did not have a liability for anyunrecognized tax benefits. The Fund recognizes interestand penalties, if any, related to unrecognized tax bene-fits as income tax expense in the Statement of Oper-ations. During the period, the Fund did not incur anysignificant interest or penalties.
Security Transactions and Related Income – Securitytransactions are accounted for on the date the security ispurchased or sold (trade date). Dividend income isrecognized on the ex-dividend date, and interestincome is recognized using the accrual basis of account-ing. Costs used in determining realized gains and losseson the sales of investment securities are those of thespecific securities sold.
Foreign Currency Translation – The books and records ofthe Fund are maintained in U.S. dollars on the follow-ing basis:
(1) the market value or fair value of investmentsecurities, assets and liabilities is converted at thecurrent rate of exchange; and
(2) purchases and sales of investment securities,income and expenses are converted at the relevantrates of exchange prevailing on the respective datesof such transactions.
The Fund does not isolate that portion of gains andlosses on investments in equity securities that is due tochanges in the foreign exchange rates from that whichis due to changes in market prices of equity securities.
Foreign Currency Exchange Contracts – When the Fundpurchases or sells foreign securities, it enters into corre-sponding foreign currency exchange contracts to settlethe securities transactions. Losses from these foreignexchange transactions may arise from changes in the
value of the foreign currency or if the counterparties donot perform under the contract’s terms.
Expense/Classes – Expenses that are directly related toone Fund of the Trust are charged directly to that Fund.Other operating expenses of the Trust are prorated tothe Fund and the other series of the Trust on the basisof relative daily net assets. Class specific expenses areborne by that class of shares. Income, realized andunrealized gains/losses and non-class specific expensesare allocated to the respective classes on the basis ofrelative daily net assets.
Dividends and Distributions – Dividends from netinvestment income, if any, are declared and paid on anannual basis. Any net realized capital gains on sales ofsecurities are distributed to shareholders at leastannually.
Redemption Fee – The Fund imposes a redemption feeof 2% on the value of capital shares redeemed by share-holders less than 60 days after purchase. Theredemption fee also applies to exchanges from theFund. The redemption fee is paid to the Fund. Theredemption fee does not apply to shares purchasedthrough reinvested distributions or shares redeemedthrough designated systematic withdrawal plans. Theredemption fee does not normally apply to accountsdesignated as omnibus accounts with the transfer agent.These are arrangements through financial intermediarieswhere the purchase and sale orders of a number ofpersons are aggregated before being communicated tothe Fund. However, the Fund may seek agreementswith these intermediaries to impose the Fund’sredemption fee or a different redemption fee on theircustomers if feasible, or to impose other appropriaterestrictions on excessive short-term trading. The officersof the Fund may waive the redemption fee for share-holders in asset allocation and similar investment
Causeway International Small Cap Fund 23
N O T E S T O F I N A N C I A L S T A T E M E N T S (Unaudited)( con t i nued )
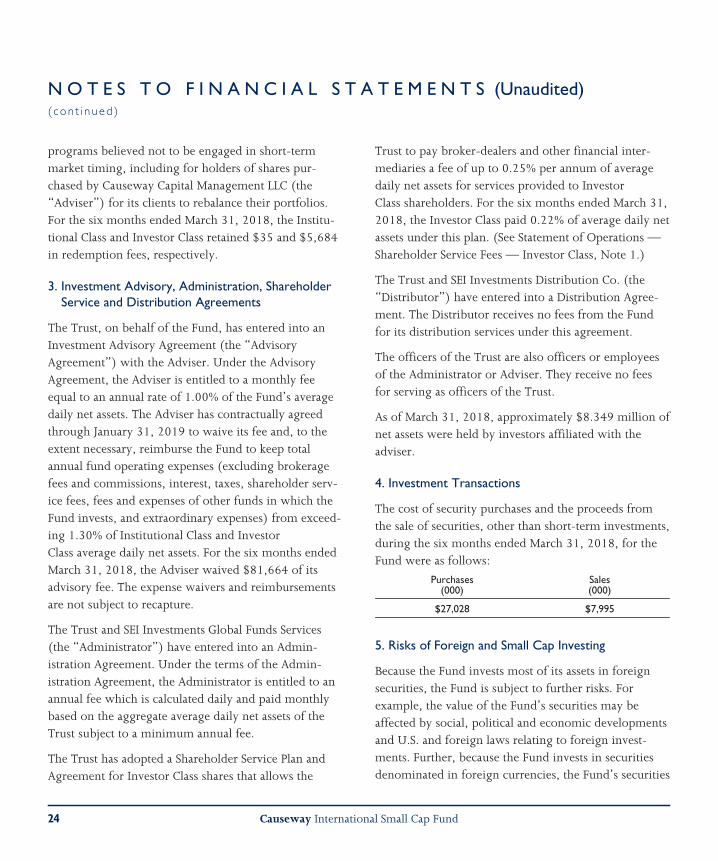
programs believed not to be engaged in short-termmarket timing, including for holders of shares pur-chased by Causeway Capital Management LLC (the“Adviser”) for its clients to rebalance their portfolios.For the six months ended March 31, 2018, the Institu-tional Class and Investor Class retained $35 and $5,684in redemption fees, respectively.
3. Investment Advisory, Administration, ShareholderService and Distribution Agreements
The Trust, on behalf of the Fund, has entered into anInvestment Advisory Agreement (the “AdvisoryAgreement”) with the Adviser. Under the AdvisoryAgreement, the Adviser is entitled to a monthly feeequal to an annual rate of 1.00% of the Fund’s averagedaily net assets. The Adviser has contractually agreedthrough January 31, 2019 to waive its fee and, to theextent necessary, reimburse the Fund to keep totalannual fund operating expenses (excluding brokeragefees and commissions, interest, taxes, shareholder serv-ice fees, fees and expenses of other funds in which theFund invests, and extraordinary expenses) from exceed-ing 1.30% of Institutional Class and InvestorClass average daily net assets. For the six months endedMarch 31, 2018, the Adviser waived $81,664 of itsadvisory fee. The expense waivers and reimbursementsare not subject to recapture.
The Trust and SEI Investments Global Funds Services(the “Administrator”) have entered into an Admin-istration Agreement. Under the terms of the Admin-istration Agreement, the Administrator is entitled to anannual fee which is calculated daily and paid monthlybased on the aggregate average daily net assets of theTrust subject to a minimum annual fee.
The Trust has adopted a Shareholder Service Plan andAgreement for Investor Class shares that allows the
Trust to pay broker-dealers and other financial inter-mediaries a fee of up to 0.25% per annum of averagedaily net assets for services provided to InvestorClass shareholders. For the six months ended March 31,2018, the Investor Class paid 0.22% of average daily netassets under this plan. (See Statement of Operations —Shareholder Service Fees — Investor Class, Note 1.)
The Trust and SEI Investments Distribution Co. (the“Distributor”) have entered into a Distribution Agree-ment. The Distributor receives no fees from the Fundfor its distribution services under this agreement.
The officers of the Trust are also officers or employeesof the Administrator or Adviser. They receive no feesfor serving as officers of the Trust.
As of March 31, 2018, approximately $8.349 million ofnet assets were held by investors affiliated with theadviser.
4. Investment Transactions
The cost of security purchases and the proceeds fromthe sale of securities, other than short-term investments,during the six months ended March 31, 2018, for theFund were as follows:
Purchases(000)
Sales(000)
$27,028 $7,995
5. Risks of Foreign and Small Cap Investing
Because the Fund invests most of its assets in foreignsecurities, the Fund is subject to further risks. Forexample, the value of the Fund’s securities may beaffected by social, political and economic developmentsand U.S. and foreign laws relating to foreign invest-ments. Further, because the Fund invests in securitiesdenominated in foreign currencies, the Fund’s securities
24 Causeway International Small Cap Fund

N O T E S T O F I N A N C I A L S T A T E M E N T S (Unaudited)( con t i nued )
may go down in value depending on foreign exchangerates. Other risks include trading, settlement, custodial,and other operational risks; withholding or other taxes;and the less stringent investor protection and disclosurestandards of some foreign markets. All of these factorscan make foreign securities less liquid, more volatileand harder to value than U.S. securities. These risks arehigher for emerging markets investments.
The Fund invests a significant portion of its assets in thesecurities of smaller capitalization companies. Invest-ments in smaller companies involve additional risks andtypically exhibit higher volatility. The values of secu-rities of smaller, less well-known companies can bemore sensitive to, and react differently to, company,political, market, and economic developments than themarket as a whole and other types of securities. Smallercompanies can have more limited product lines, mar-kets, growth prospects, depth of management, andfinancial resources, and these companies may haveshorter operating histories and less access to financing,creating additional risk. Further, smaller companies maybe particularly affected by interest rate increases, as theymay find it more difficult to borrow money to continueor expand operations, or may have difficulty in repay-ing any loans that have floating rates. Because of theseand other risks, securities of smaller capitalizationcompanies tend to be more volatile and less liquid thansecurities of medium and larger capitalization compa-nies. During some periods, securities of smaller capital-ization companies, as an asset class, haveunderperformed the securities of larger capitalizationcompanies.
6. Federal Tax Information
The Fund is classified as a separate taxable entity forFederal income tax purposes. The Fund intends to
continue to qualify as a separate “regulated investmentcompany” under Subchapter M of the Internal RevenueCode and make the requisite distributions to share-holders that will be sufficient to relieve it from Federalincome tax and Federal excise tax. Therefore, no Federaltax provision is required. To the extent that dividendsfrom net investment income and distributions from netrealized capital gains exceed amounts reported in thefinancial statements, such amounts are reportedseparately.
The Fund may be subject to taxes imposed by countriesin which it invests in issuers existing or operating insuch countries. Such taxes are generally based onincome earned. The Fund accrues such taxes when therelated income is earned. Dividend and interest incomeis recorded net of non-U.S. taxes paid.
The amounts of distributions from net investmentincome and net realized capital gains are determined inaccordance with Federal income tax regulations, whichmay differ from those amounts determined under U.S.GAAP. These book/tax differences are either temporaryor permanent in nature. The character of distributionsmade during the year from net investment income ornet realized gains, and the timing of distributions madeduring the year may differ from those during the yearthat the income or realized gains (losses) were recordedby the Fund. To the extent these differences are perma-nent, adjustments are made to the appropriate equityaccounts in the period that the differences arise.
The tax character of dividends and distributionsdeclared during the fiscal years ended September 30,2017 and September 30, 2016 were as follows (000):
OrdinaryIncome Total
2017 $244 $244
2016 192 192
Causeway International Small Cap Fund 25

N O T E S T O F I N A N C I A L S T A T E M E N T S (Unaudited)( con t i nued )
As of September 30, 2017, the components ofaccumulated losses on a tax basis were as follows (000):
Undistributed Ordinary Income $ 529Undistributed Long-Term Capital Gains 384Unrealized Appreciation 2,013Other Temporary Differences 2
Total Distributable Earnings $2,928
Under the Regulated Investment Company Moderniza-tion Act of 2010, the Fund is permitted to carry forwardcapital losses incurred for an unlimited period. Capitallosses that are carried forward will retain their characteras either short-term or long-term capital losses.
For the fiscal year ended September 30, 2017, the Fundused $56 (000) in capital loss carryforwards.
At March 31, 2018, the total cost of investments forFederal income tax purposes and the aggregate grossunrealized appreciation and depreciation on invest-ments for the Fund were as follows (000):
FederalTax Cost
AppreciatedSecurities
DepreciatedSecurities
NetUnrealized
Appreciation
$30,086 $2,760 $(1,398) $1,362
7. Capital Shares Issued and Redeemed (000)Six Months Ended
March 31, 2018 (Unaudited)Fiscal Year Ended
September 30, 2017 (Audited)
Shares Value Shares Value
Institutional ClassShares Sold 1,324 $18,011 12 $ 128Shares Issued in Reinvestment of
Dividends and Distributions 71 908 23 234Shares Redeemed (1) (5) (14) (151)
Increase in Shares OutstandingDerived from Institutional Class Transactions 1,394 18,914 21 211
Investor ClassShares Sold 114 1,535 40 467Shares Issued in Reinvestment of
Dividends and Distributions 7 86 1 10Shares Redeemed (28) (377) (9) (111)
Increase in Shares OutstandingDerived from Investor Class Transactions 93 1,244 32 366
Net Increase in Shares Outstanding fromCapital Share Transactions 1,487 $20,158 53 $ 577
8. Significant Shareholder Concentration
As of March 31, 2018, three of the Fund’s shareholdersof record owned 86% of net assets in the InstitutionalClass. The Fund may be adversely affected when ashareholder purchases or redeems large amounts of
shares, which may impact the Fund in the same manneras a high volume of redemption requests. Such largeshareholders may include, but are not limited to, otherfunds, institutional investors, and asset allocators whomake investment decisions on behalf of underlying
26 Causeway International Small Cap Fund

N O T E S T O F I N A N C I A L S T A T E M E N T S (Unaudited)( conc l uded )
clients. Significant shareholder purchases andredemptions may adversely impact the Fund’s portfoliomanagement and may cause the Fund to make invest-ment decisions at inopportune times or prices or missattractive investment opportunities. Such transactionsmay also increase the Fund’s transaction costs, accel-erate the realization of taxable income if sales of secu-rities resulted in gains, or otherwise cause the Fund toperform differently than intended.
9. Indemnifications
Under the Trust’s organizational documents, eachTrustee, officer, employee or other agent of the Trust isindemnified against certain liabilities that may arise outof the performance of his or her duties to the Fund.Additionally, in the normal course of business, the Fundenters into contracts, including the Fund’s servicingagreements, that contain a variety of indemnificationclauses. The Fund’s maximum exposure under thesearrangements is unknown as this would involve futureclaims that may be made against the Fund that have notyet occurred. The risk of material loss as a result of suchindemnification claims is considered remote.
10. Line of Credit
The Fund, along with certain other series of the Trust,entered into an agreement on February 24, 2015, asamended by Amendment No. 1, dated as ofFebruary 24, 2016, Amendment No. 2, dated as ofFebruary 22, 2017, and Amendment No. 3, dated as ofFebruary 21, 2018, which enables it to participate in a$10 million secured committed revolving line of credit,with The Bank of New York Mellon which expiresFebruary 21, 2019. The proceeds from the borrowings,if any, shall be used to finance the Fund’s short-termgeneral working capital requirements, including thefunding of shareholder redemptions. Interest, if any, ischarged to the Fund based on its borrowings duringthe period at the applicable rate plus 1.5%. The Fundis also charged a portion of a commitment fee of0.175% per annum. As of March 31, 2018, there wereno borrowings outstanding under the line of credit.
11. Subsequent Events
The Fund has evaluated the need for disclosures and/oradjustments resulting from subsequent events throughthe date the financial statements were issued. Based onthis evaluation, no adjustments were required to thefinancial statements.
Causeway International Small Cap Fund 27

D I S C L O S U R E O F F U N D E X P E N S E S (Unaudited)
As a shareholder of the Fund, you incur two types of costs: (1) transaction costs, including redemption fees, and(2) ongoing costs, including management fees, shareholder service fees, and other Fund expenses. It is important foryou to understand the impact of these costs on your investment returns.
Ongoing operating expenses are deducted from a mutual fund’s gross income and directly reduce its final investmentreturn. These expenses are expressed as a percentage of a mutual fund’s average net assets; this percentage is known asa mutual fund’s expense ratio.
The following examples use the expense ratio and are intended to help you understand the ongoing costs (in dollars)of investing in the Fund and to compare these costs with those of other mutual funds. The examples are based on aninvestment of $1,000 made at the beginning of the period shown and held for the entire period (October 1, 2017 toMarch 31, 2018).
The table on the next page illustrates the Fund’s costs in two ways:
Actual Fund Return. This section helps you to estimate the actual expenses after fee waivers that the Fund incurredover the period. The “Expenses Paid During Period” column shows the actual dollar expense cost incurred by a$1,000 investment in the Fund, and the “Ending Account Value” number is derived from deducting that expense costfrom the Fund’s gross investment return.
You can use this information, together with the actual amount you invested in the Fund, to estimate the expenses youpaid over that period. Simply divide your actual account value by $1,000 to arrive at a ratio (for example, an $8,600account value divided by $1,000 = 8.6), then multiply that ratio by the number shown under “Expenses Paid DuringPeriod.”
Hypothetical 5% Return. This section helps you compare the Fund’s costs with those of other mutual funds. Itassumes that the Fund had an annual 5% return before expenses during the year, but that the expense ratio (Column3) for the period is unchanged. This example is useful in making comparisons because the Securities and ExchangeCommission requires all mutual funds to make this 5% calculation. You can assess the Fund’s comparative cost bycomparing the hypothetical result for the Fund in the “Expenses Paid During Period” column with those that appear inthe same charts in the shareholder reports for other mutual funds.
NOTE: Because the return is set at 5% for comparison purposes — NOT the Fund’s actual return — the account valuesshown may not apply to your specific investment.
28 Causeway International Small Cap Fund

D I S C L O S U R E O F F U N D E X P E N S E S (Unaudited)( conc l uded )
BeginningAccount
Value10/01/17
EndingAccount
Value3/31/18
AnnualizedExpenseRatios
ExpensesPaid
DuringPeriod*
Causeway International Small Cap Fund
Actual Portfolio ReturnInstitutional Class $1,000.00 $1,058.00 1.30% $6.67
Hypothetical 5% ReturnInstitutional Class $1,000.00 $1,018.45 1.30% $6.54
Causeway International Small Cap Fund
Actual Portfolio ReturnInvestor Class** $1,000.00 $1,057.20 1.52% $7.80
Hypothetical 5% ReturnInvestor Class** $1,000.00 $1,017.35 1.52% $7.64
* Expenses are equal to the Fund’s annualized expense ratio multiplied by the average account value over the period, multiplied by 182/365(to reflect the period since inception to period end.)
** The ratio of expenses to average net assets has been reduced by a one-time adjustment as a result of a management change in accrualestimate relating to shareholder service fees. Excluding the adjustment, the annualized ratio of expenses to average net assets would havebeen 1.52%, ending account values would have been $1,057,20 and $1,017.35 for actual and hypothetical returns, respectively, andexpenses paid during the period would have been $7.80 and $7.64 for actual and hypothetical returns, respectively.
Causeway International Small Cap Fund 29

N O T E S

N O T E S

INVESTMENT ADVISER:Causeway Capital Management LLC11111 Santa Monica Boulevard15th FloorLos Angeles, CA 90025
DISTRIBUTOR:SEI Investments Distribution Co.One Freedom Valley DriveOaks, PA 19456
TO OBTAIN MORE INFORMATION:Call 1-866-947-7000 or visit us online atwww.causewayfunds.com
This material must be preceded or accompanied by acurrent prospectus.
The Fund will file its complete schedule of portfolioholdings with the Securities and ExchangeCommission (“Commission”) for the first and thirdquarters of each fiscal year on Form N-Q within sixtydays after the end of the period. The Fund’s FormsN-Q are available on the Commission’s website athttp://www.sec.gov, and may be reviewed and copiedat the Commission’s Public Reference Room inWashington, DC. Information on the operation of thePublic Reference Room may be obtained by calling1-800-SEC-0330.
A description of the policies and procedures that theFund uses to determine how to vote proxies relatingto portfolio securities, as well as information relatingto how the Trust voted proxies relating to portfoliosecurities during the most recent 12-month periodended June 30, is available (i) without charge, uponrequest, by calling 1-866-947-7000; and (ii) on theCommission’s website at http://www. sec.gov.
CCM-SA-010-0400
> SEMI-ANNUAL REPORTMARCH 31, 2018
Causeway InternationalSmall Cap Fund