
Table of Contents · Connect an 841-PE-USB / 844-PE-USB After completing the software installation,...
126
Transcript of Table of Contents · Connect an 841-PE-USB / 844-PE-USB After completing the software installation,...


___________________________________________________________________________________
PMManager User Manual 1
Table of Contents
About this Manual ..................................................................................................................................... 7
How the Document is Organized .......................................................................................................... 7
Definition of Terms ............................................................................................................................... 7
Chapter 1 - PMManager and Devices ....................................................................................................... 8
PMManager Features ........................................................................................................................... 8
Package Contents .................................................................................................................................. 9
System Requirements ......................................................................................................................... 10
Install PMManager ............................................................................................................................. 10
Chapter 2 - Connect Devices ................................................................................................................... 11
Connect a 1919-R ................................................................................................................................ 11
Connect an 843-R-USB ........................................................................................................................ 12
Connect an 841-PE-USB / 844-PE-USB ................................................................................................ 13
Chapter 3 - Getting Started ..................................................................................................................... 14
Start and End a PMManager Session ................................................................................................. 14
Select a Sensor .................................................................................................................................... 15
PMManager Window.......................................................................................................................... 16
Channel Area ....................................................................................................................................... 17
Channel Controls ................................................................................................................................. 18
Display Area ........................................................................................................................................ 19
Numeric Display Area .......................................................................................................................... 19
Graph Configuration Area ................................................................................................................... 20
Statistics Area ...................................................................................................................................... 22
Logging Area ........................................................................................................................................ 23
Title Bar Controls ................................................................................................................................. 23
Resize PMManager Window Areas .................................................................................................... 24
Chapter 4 - PMManager Window Features ............................................................................................ 26
Channel ............................................................................................................................................... 26
Measuring Modes ............................................................................................................................... 26

___________________________________________________________________________________
PMManager User Manual 2
Functions ............................................................................................................................................. 28
Average .................................................................................................................................................. 28
Offset ...................................................................................................................................................... 29
Scale Factor ............................................................................................................................................ 30
dBm and dB offset .................................................................................................................................. 30
Normalize ............................................................................................................................................... 31
Density ................................................................................................................................................... 31
Pass/Fail Limits ....................................................................................................................................... 31
Graphic Setup ...................................................................................................................................... 32
Line Graph .............................................................................................................................................. 33
Histogram Graph .................................................................................................................................... 34
Pulse Chart ............................................................................................................................................. 35
Needle Graph ......................................................................................................................................... 36
Position................................................................................................................................................... 37
Stability ................................................................................................................................................... 39
Apply to All ............................................................................................................................................. 42
Chapter 5 - Measuring with Thermopile Sensors ................................................................................... 43
About Thermopile Sensors .................................................................................................................. 43
Configure Measurement Settings ....................................................................................................... 43
Configure Power Settings .................................................................................................................... 44
Laser Wavelengths .............................................................................................................................. 44
LP1 Sensors ......................................................................................................................................... 44
Power Ranges ...................................................................................................................................... 44
Auto Range .......................................................................................................................................... 45
Average the Measurements................................................................................................................ 45
Configure Energy Settings ................................................................................................................... 45
Instrument is Ready ............................................................................................................................ 45
Energy Thresholds ............................................................................................................................... 45
Configure Pulsed Power Settings ........................................................................................................ 46
Pulsed Power .......................................................................................................................................... 46
Pulse Width ............................................................................................................................................ 46
Optimize the Readings ........................................................................................................................ 47

___________________________________________________________________________________
PMManager User Manual 3
Apply an Offset ....................................................................................................................................... 47
Zero the Instrument ............................................................................................................................... 48
Specify Line Frequency ........................................................................................................................... 49
Calibration Factors .............................................................................................................................. 50
Adjust Power Calibration Factors ........................................................................................................... 50
Configure the Response Factor .............................................................................................................. 51
Adjust Energy Calibration Factors .......................................................................................................... 54
PEPS Sensors ....................................................................................................................................... 56
Configure Track w/Power Settings ..................................................................................................... 56
Additional Graphical Display Options ................................................................................................. 56
Chapter 6 - Measuring With Photodiode Sensors .................................................................................. 57
About Photodiode Sensors ................................................................................................................. 57
Configure Measurement Settings ....................................................................................................... 57
Configure Laser Wavelengths ................................................................................................................ 58
Select the Range ..................................................................................................................................... 60
Filter Settings ......................................................................................................................................... 60
Photodiode Exposure ............................................................................................................................. 61
Low Frequency Power ............................................................................................................................ 62
Average the Measurements ................................................................................................................... 64
Optimize the Readings ........................................................................................................................ 64
Apply an Offset ....................................................................................................................................... 64
Zero the Instrument ............................................................................................................................... 64
Specify Line Frequency ........................................................................................................................... 64
Adjust Calibration Factors ...................................................................................................................... 64
Additional Graphical Display Options ................................................................................................. 65
Chapter 7 - Measuring with Pyroelectric and PD Energy Sensors .......................................................... 66
About Pyroelectric and PD Energy Sensors ........................................................................................ 66
Configure Measurement Settings ....................................................................................................... 67
Configure Laser Wavelengths ............................................................................................................. 68
Broadband (BB) Sensors ......................................................................................................................... 68
Select the Range ..................................................................................................................................... 68
Add a Diffuser ......................................................................................................................................... 69
Configure the Pulse Width ..................................................................................................................... 69

___________________________________________________________________________________
PMManager User Manual 4
Average the Measurements ................................................................................................................... 70
Set the Thresholds.................................................................................................................................. 70
Optimize the Readings ........................................................................................................................ 70
Zero the Instrument ............................................................................................................................... 70
Measure the Total Energy Exposure ................................................................................................... 71
Adjust Calibration Factors ................................................................................................................... 73
Additional Graphical Display Options ................................................................................................. 74
Chapter 9 - Multiple Channels ................................................................................................................ 75
Connect Multiple Sensors ................................................................................................................... 75
Select Sensors ..................................................................................................................................... 75
Select Device Options ......................................................................................................................... 76
Two Channel Displays ......................................................................................................................... 77
Merge and Split ...................................................................................................................................... 77
Split......................................................................................................................................................... 77
Merge ..................................................................................................................................................... 77
Multiple Sessions ................................................................................................................................... 78
Track w/Power ....................................................................................................................................... 80
View the List of Active Sensors .............................................................................................................. 81
Chapter 10 - Math Channels ................................................................................................................... 82
Add and Close a Math Channel ........................................................................................................... 82
Adjust Default Operations .................................................................................................................. 82
Create a User Defined Formula ........................................................................................................... 83
Chapter 11 - Log Files .............................................................................................................................. 85
Default Log Files .................................................................................................................................. 85
Configure Log File Settings .................................................................................................................. 86
Log One Screen of Data Only ................................................................................................................. 86
Configure Log Duration .......................................................................................................................... 87
Configure the Number of Measurements .............................................................................................. 88
Begin and End a Log ............................................................................................................................... 89
Add Notes to a Log File .......................................................................................................................... 90
Standard Format Log Files ...................................................................................................................... 91
Excel Friendly Format Log Files .............................................................................................................. 91

___________________________________________________________________________________
PMManager User Manual 5
Select the Log File Format ...................................................................................................................... 91
Chapter 12 - View Log Files ..................................................................................................................... 93
Upload Files ......................................................................................................................................... 93
Access the Log Viewer ......................................................................................................................... 93
Log Viewer Window ............................................................................................................................ 94
Zoom In, Zoom Out ................................................................................................................................ 94
View Log Files in NotePad ................................................................................................................... 95
Log Files Entries ...................................................................................................................................... 96
Open Log Files in Excel ........................................................................................................................ 97
Chapter 13 - Preferences and Features ................................................................................................ 101
Save Sensor Settings ......................................................................................................................... 101
Preferences ....................................................................................................................................... 101
StartUp ................................................................................................................................................. 102
Communication .................................................................................................................................... 103
Logging ................................................................................................................................................. 103
Advanced .............................................................................................................................................. 104
Export and Print a Screen Capture .................................................................................................... 104
Diagnostics ........................................................................................................................................ 106
Upgrade Internal Software ............................................................................................................... 107
Upgrade Sensor Software ................................................................................................................. 107
Access Help ....................................................................................................................................... 108
Appendix A - Device Specifications ....................................................................................................... 109
841-PE-USB / 844-PE-USB Specifications .......................................................................................... 109
843-R-USB Specifications .................................................................................................................. 110
1919-R Specifications ........................................................................................................................ 111
Appendix B – Calibration, Traceability, and Recalibration ................................................................... 113
Newport Thermopile Sensors ........................................................................................................... 113
Surface Absorbers ............................................................................................................................. 113
Volume Absorbers ............................................................................................................................. 113
Factory Calibration of Thermopile Sensors ....................................................................................... 114
Linearity and Accuracy of Thermopile Sensors ................................................................................. 115
Recalibration from a Known Source of Laser Energy ........................................................................ 116

___________________________________________________________________________________
PMManager User Manual 6
Newport Photodiode Sensors ........................................................................................................... 117
Factory Calibration of Photodiode Sensors.......................................................................................... 117
Linearity and Accuracy of Photodiode Sensors .................................................................................... 117
User Recalibration ............................................................................................................................. 118
Newport Pyroelectric PD Energy Sensors ......................................................................................... 119
Metallic ................................................................................................................................................. 119
Broadband ............................................................................................................................................ 120
Calibration ......................................................................................................................................... 120
Accuracy of Calibration ........................................................................................................................ 121
Recalibration from a Known Source of Laser Energy ........................................................................... 121
Periodic Recalibration .......................................................................................................................... 123
Appendix C – Safety and Compliance ................................................................................................... 125
CE Compliance ................................................................................................................................... 125

PMManager User Manual 7
About this Manual
This manual describes how to operate the Newport PMManager application with any of the following
Newport measuring devices:
PC Interfaces (without a GUI)
• 841-PE-USB / 844-PE-USB – compact sensor to USB interface
Power/Energy Meters
• 1919-R, for data-logging
• 843-R-USB, for data-logging
How the Document is Organized
This manual describes installation and operation in the following order:
• Install the PMManager Software
• Connect the measuring device
• Using the PMManager application
• Sensor and device information in Appendices A through B
• Safety and Compliance in Appendix C
Definition of Terms
The Newport devices are referred to in this manual as device or instrument. The connection between the
smart sensor detector, referred to as a sensor, the 841-PE-USB / 844-PE-USB.
1919-R or 843-R-USB devices, and the PMManager software running on your PC, is referred to as a channel.
Using the PMManager system, you can view each channel’s laser power and energy information. You can
work with multiple channels depending on the type of device you have and the number of free USB ports
you have on your PC.

PMManager User Manual 8
Chapter 1 - PMManager and Devices
This section includes the following topics:
• PMManager Features
• Package Contents
• System Requirements
• Install PMManager
PMManager Features
PMManager converts a PC into a laser power/energy multi-channel analysis workstation.
The PMManager software features include:
• Extensive graphic display of data:
- Line Plot, Histogram, Pulse Chart, Simulated Analog Needle, Position, and Stability Graph
- Multiple data sets on separate graphs on the same screen
• Advanced measurement processing
- Power/energy density, scale factor, normalize against a reference
- Multi-channel comparisons
- User defined mathematical equations: channels A/B, etc.
• Connect additional devices during active measurements
• Data logging for future review
- Displayed graphically or saved in text format
- Exported to an Excel spreadsheet
• Printing of graphs and data
• Interfaces and supports data logging with Newport’s devices

PMManager User Manual 9
Package Contents
Each measuring device purchased from Newport ships with various items, depending on the device. When
you receive a device package, inspect the packaging before unpacking. Evidence of damage should be noted
and reported immediately. Unpack and check the contents against the relevant list below.
1919-R
The 1919-R package contains the following items:
• 1919-R device
• USB cable
• 12v power supply
843-R-USB
The 843-R-USB package contains the following items:
• 843-R-USB device
• USB cable
• 12v power supply
841-PE-USB / 844-PE-USB
The 841-PE-USB / 844-PE-USB package contains the following items:
• 841-PE-USB / 844-PE-USB device
• USB cable
• Analog output connector 2.5 mm mono jack

PMManager User Manual 10
System Requirements
To run the PMManager application, you need a computer with the following minimum requirements:
Item Requirement
CPU Intel® Core i7-2600 CPU @3.40 GHz 3.40 GHz
RAM 4GB
Operating System Windows 7 / 8 / 10 (32-bit or 64-bit)
Display 1024 X 768 resolution (17” recommended)
Install PMManager
Install PMManager software
Download the PMManager from the product page in the web site (https://www.newport.com/g/optical-
power-meters) and following the Installation Wizard steps.

PMManager User Manual 11
Chapter 2 - Connect Devices
After completing the software installation, follow the instructions in the relevant section below to connect
the device to your PC.
When you start PMManager, it recognizes the connected device(s) and responds according to the options
specified in the Preferences dialog. You can manually select which device(s) connect to PMManager.
❖ If you experience issues when trying to connect your device, refer to the troubleshooting section in
Preferences and Features.
Connect a 1919-R
After completing the software installation, connect the 1919-R device.
❖ If this is the first time you are connecting the 1919-R to your PC, ensure Windows is running in
Administrator mode.
1. Connect the sensor to the sensor input located on the device.
2. Connect the USB cable between the USB port located on the device, and your PC.
3. Connect the 12v power cable between the electrical outlet and the 12VDC input located on the device.
4. Open PMManager - double-click the PMManager shortcut icon, located on the desktop.
• The device is connected and ready for use
PMManager User Manual 12
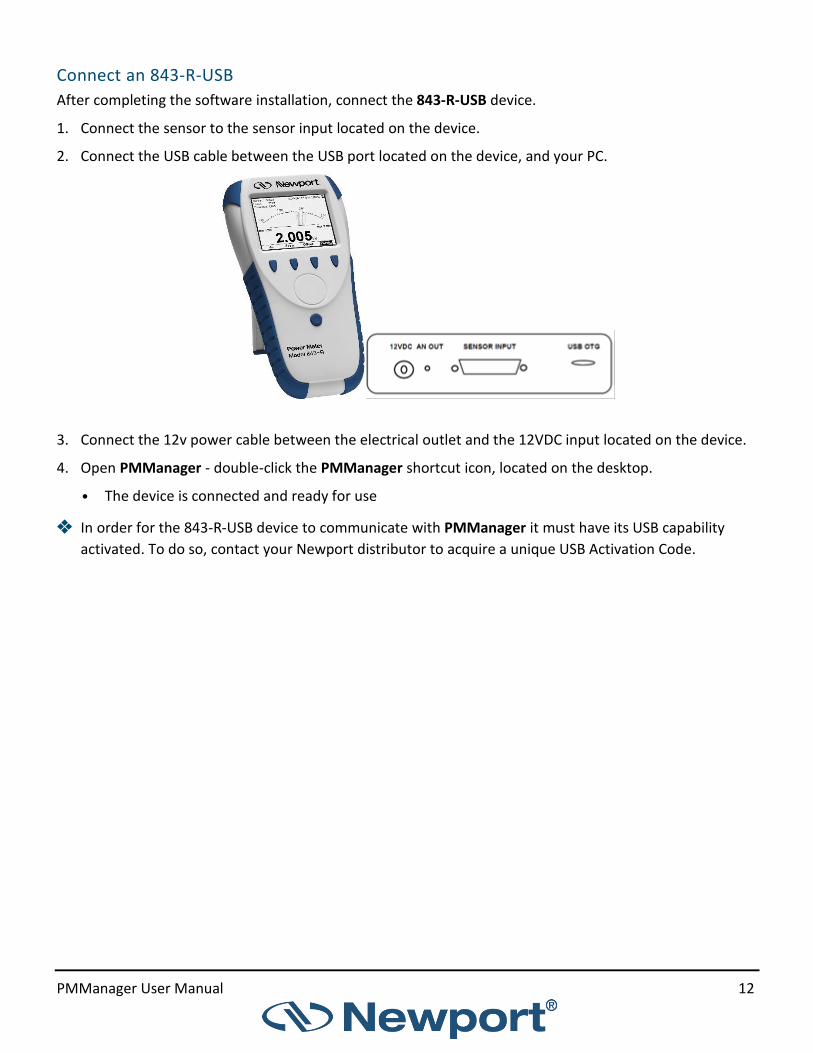
Connect an 843-R-USB
After completing the software installation, connect the 843-R-USB device.
1. Connect the sensor to the sensor input located on the device.
2. Connect the USB cable between the USB port located on the device, and your PC.
3. Connect the 12v power cable between the electrical outlet and the 12VDC input located on the device.
4. Open PMManager - double-click the PMManager shortcut icon, located on the desktop.
• The device is connected and ready for use
❖ In order for the 843-R-USB device to communicate with PMManager it must have its USB capability
activated. To do so, contact your Newport distributor to acquire a unique USB Activation Code.

PMManager User Manual 13
Connect an 841-PE-USB / 844-PE-USB
After completing the software installation, connect the 841-PE-USB / 844-PE-USB device
❖ If this is the first time you are connecting the 841-PE-USB / 844-PE-USB to your PC, ensure Windows is
running in Administrator mode.
1. Connect the sensor to the sensor head input.
2. Connect the USB cable between the device and your PC.
• The LINK LED flickers momentarily, indicating USB enumeration of the device.
3. Open PMManager - double-click the PMManager shortcut icon, located on the desktop.
• The device is connected and ready for use.
PMManager User Manual 14
Chapter 3 - Getting Started
PMManager application is used with the following devices:
• 1919-R
• 843-R-USB
• 841-PE-USB / 844-PE-USB
Multiple Sensors
PMManager application supports the use of multiple sensors.
Channels
Each connection between a sensor, device, and PMManager is referred to as a channel.
You can view channels as either separate graphs or combined graphs.
Multiple Channels
In PMManager you can simultaneously work with multiple channels from one or more devices.
The devices can be connected to many different kinds of sensors, including thermal, photodiode,
pyroelectric, or a combination of different sensor types.
Example:
• Use a combination of single-channel devices (e.g., 843-R-USB, 841-PE-USB / 844-PE-USB) working
with one channel per device.
In addition to being able to connect PMManager to numerous channels simultaneously, you can also
specify which of the connected channels you wish to view and use multiple Newport devices to create
additional channel connections. For more information, see Multiple Channels.
This section describes the following:
• Start and end a PMManager session
• PMManager Window
• Resize PMManager Window Areas
Start and End a PMManager Session
Start a PMManager session
Double-click the PMManager shortcut icon , located on the desktop.
PMManager opens and searches for connected devices.

PMManager User Manual 15
• If only one device is discovered PMManager opens by default in “merged screen”mode using the full
PMManager screen"
• If multiple devices are discovered, or if there is more than one sensor on a single device, refer to
Multiple Channels
❖ During a PMManager communication session, the keypad/touchscreen of the
1919-R, and 843-R-USB devices are disabled until the device is released from
the PMManager communication session.
End a PMManager session
• Select Exit from the Options menu
• Click X (located in the title bar)
❖ Refer to Preferences and Features to learn about options available when ending a PMManager session.
Select a Sensor
PMManager enables you to work with multiple channels from one device or various devices
simultaneously. The devices may be connected to many types of sensors including thermopile, photodiode,
pyroelectric or a combination of different sensor types. In addition to being able to connect the application
to numerous channels at once, you can specify which of the connected channels you wish to view.
For more information about multiple sensors, refer to Multiple Channels.
Select a device
1. Click Select Device(s) in the window title bar.
• PMManager begins to search for attached devices
• In addition to devices that connect via USB, there are devices that require a wireless or an ethernet
connection. When using such devices, open the menu adjacent to the relevant icon.
• When the search is completed, a separate window opens, enabling you to select device(s) that are
currently connected
PMManager User Manual 16
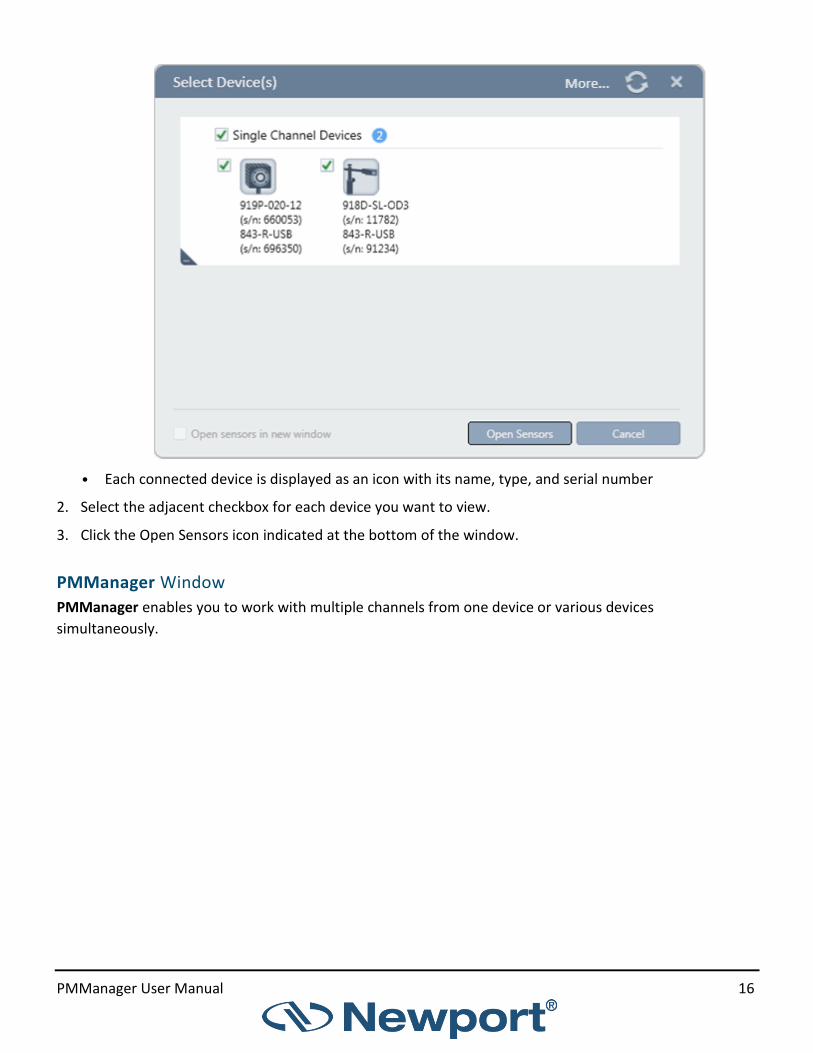
• Each connected device is displayed as an icon with its name, type, and serial number
2. Select the adjacent checkbox for each device you want to view.
3. Click the Open Sensors icon indicated at the bottom of the window.
PMManager Window
PMManager enables you to work with multiple channels from one device or various devices
simultaneously.
PMManager User Manual 17
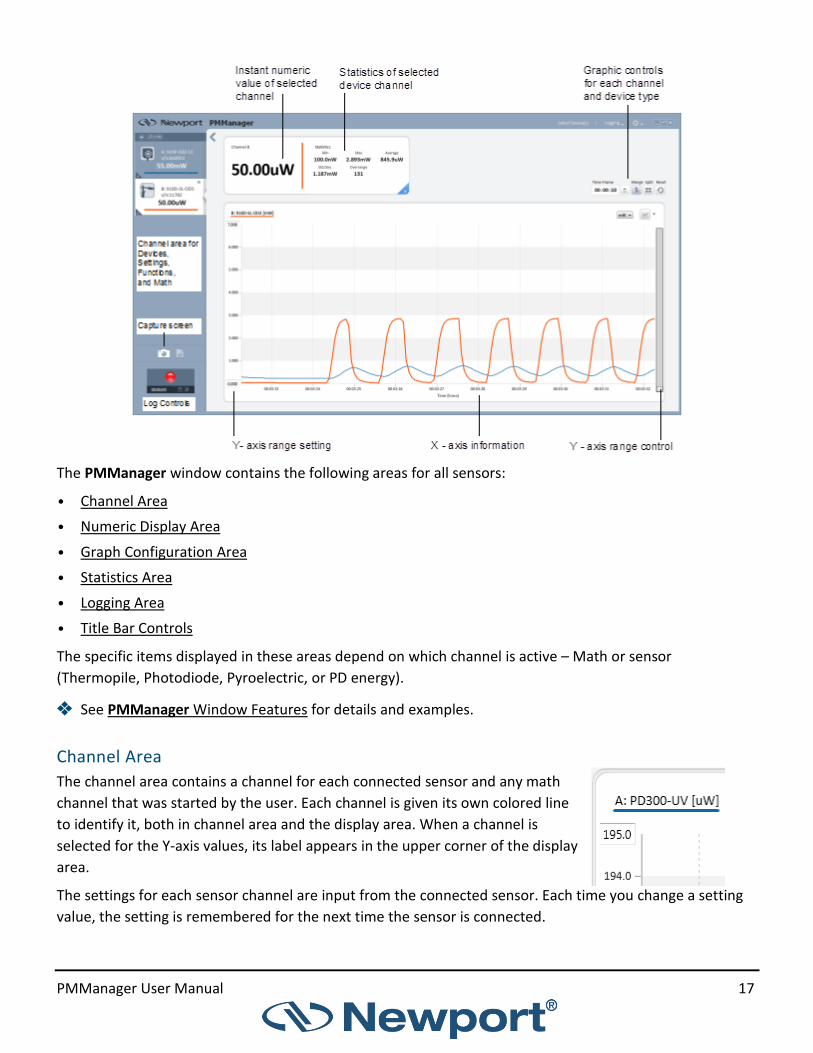
The PMManager window contains the following areas for all sensors:
• Channel Area
• Numeric Display Area
• Graph Configuration Area
• Statistics Area
• Logging Area
• Title Bar Controls
The specific items displayed in these areas depend on which channel is active – Math or sensor
(Thermopile, Photodiode, Pyroelectric, or PD energy).
❖ See PMManager Window Features for details and examples.
Channel Area
The channel area contains a channel for each connected sensor and any math
channel that was started by the user. Each channel is given its own colored line
to identify it, both in channel area and the display area. When a channel is
selected for the Y-axis values, its label appears in the upper corner of the display
area.
The settings for each sensor channel are input from the connected sensor. Each time you change a setting
value, the setting is remembered for the next time the sensor is connected.

PMManager User Manual 18
The Functions options can be set for each connected sensor.
Changes in settings, functions, and math are applied immediately and the results are shown in the display
area. Making changes usually requires adjusting values in the graph configuration area.
For information on configuring measurement settings for the various types of sensors, refer to PMManager
Window Features.
Channel Controls
When a sensor is connected, only the current reading and properties of the device and sensor are shown in
the channel area. Its settings, math, and function dialogs are closed.
Icons are available to disconnect the device and to connect other devices.
Channel display with all controls closed:
Select
Device(s)
Opens Math
Channel
Disconnects
Device
Opens Settings & Functions Controls
PMManager User Manual 19
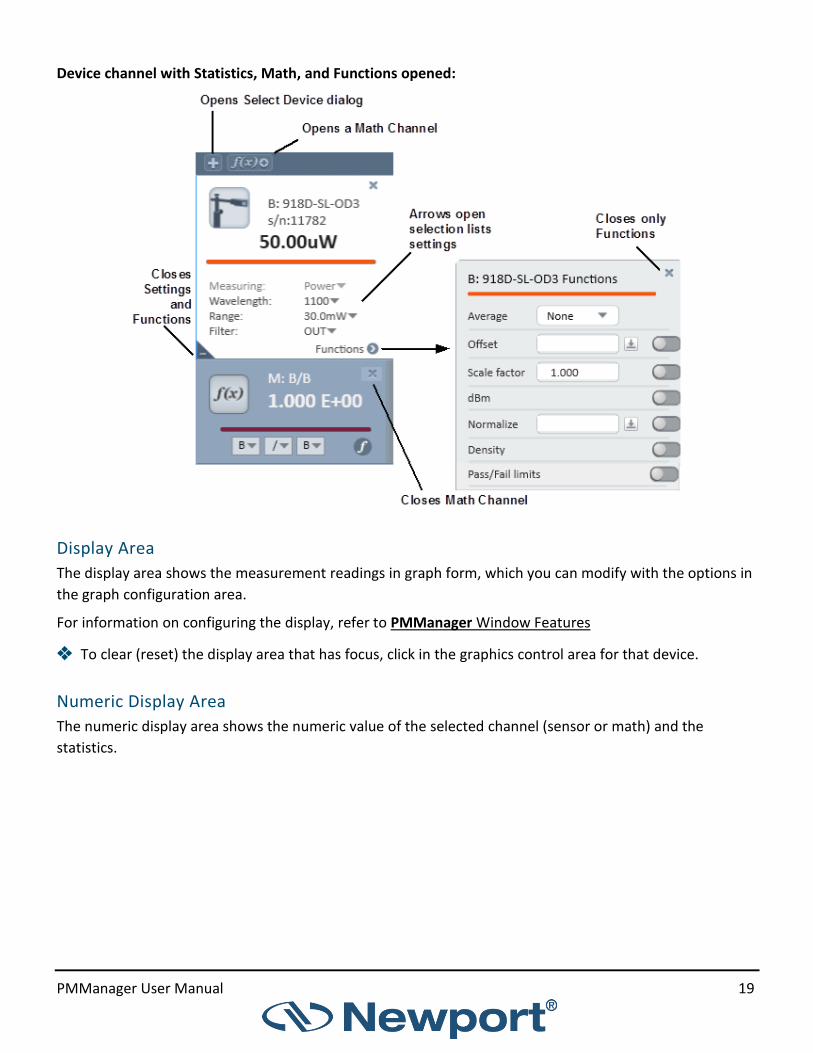
Device channel with Statistics, Math, and Functions opened:
Display Area
The display area shows the measurement readings in graph form, which you can modify with the options in
the graph configuration area.
For information on configuring the display, refer to PMManager Window Features
❖ To clear (reset) the display area that has focus, click in the graphics control area for that device.
Numeric Display Area
The numeric display area shows the numeric value of the selected channel (sensor or math) and the
statistics.

PMManager User Manual 20
The colored vertical line separating the measurement value and the statistics identifies the sensor in the
display area.
Graph Configuration Area
The graph configuration area is used to configure graph display settings.
Control Description
Time Frame
Value selected determines time period for the X-axis. Time is divided into three sections HH:MM:SS. To change a section value, click in the section (numbers shown with dark background), and click the up/down arrow to the desired value.

PMManager User Manual 21
Control Description
Power and Energy Graphs
Click the down arrow to open the list of graphs. • The Line graph plots the values by connecting a line between
points. The Y-axis is the value and the X-axis the time. • The Histogram presents a statistical analysis of all the
measurements. • The Pulse Chart graph displays readings as bars with lengths
proportional to the measurement. • The Needle graph displays value(s) as an analog meter.
Option to include previous displays as a gray persistence. • Apply to all’: Applies the current graph mode of the selected
channel to the other channels, where applicable.
Track Graphs
These graph types are for sensors in the Track w/ Power measurement mode. • The Position graph shows the location of the laser beam as an
offset from the center of the graph. • The Stability graph shows how stable the beam retains its position
by counting the number of times the center of the beam remains within defined x-y cells on the graph.
Apply to all': Applies the current graph mode of the selected channel to the other channels, where applicable.
• Merge to display multiple channels on the same graph.
• Split to display multiple channels in separate graphs.
If the graph mode on any channel is Position, Stability, or Needle, then Merge is not available.
Y-axis
A y-axis range is set from the Range control in the Device Channel. For the graph modes Line and Pulse, different range values can be manually entered on the graph display itself, by clicking and entering a new value on top range value at the top of the Y-axis.Measurements that are outside the immediate display area can be moved into view by the y-slide control. See Line Graph.
X-axis The x-axis measurement is determined by the Graph Mode. The measurement can be time (Line), power/energy (Histogram and Needle), pulses (Pulse Chart).
❖ For more information on configuring graph display settings, refer to PMManager Window Features.

PMManager User Manual 22
Statistics Area
The statistics area displays statistics for the current parameters. Changes made to the Math and Function
settings are updated in the statistics.
Statistic Description
Min Displays the minimum measurement taken.
Max Displays the maximum measurement taken.
Average Displays the average measurement taken.
Std. Dev. Displays the standard deviation.
Overrange
Displays the number of readings measured that were over the maximum value for the chosen range. When a reading is over the maximum value for the chosen range, OVER is displayed in the numeric display area.
Total Pulses
(Thermopile sensors in
Energy Mode and
pyroelectric and PD energy
sensors in power or energy
modes)
Displays the total number of measurements taken.
Frequency
(Pyroelectric and PD energy
sensors only)
Displays the frequency at which the laser is firing.
PMManager User Manual 23
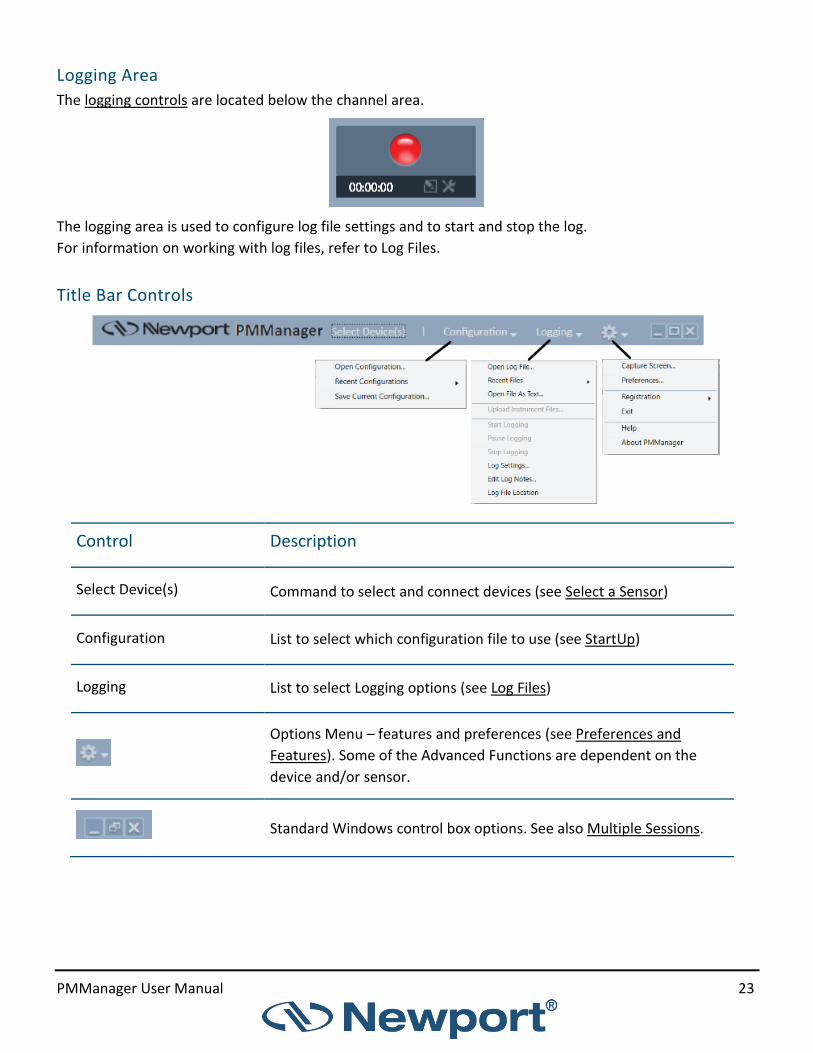
Logging Area
The logging controls are located below the channel area.
The logging area is used to configure log file settings and to start and stop the log.
For information on working with log files, refer to Log Files.
Title Bar Controls
Control Description
Select Device(s) Command to select and connect devices (see Select a Sensor)
Configuration List to select which configuration file to use (see StartUp)
Logging List to select Logging options (see Log Files)
Options Menu – features and preferences (see Preferences and
Features). Some of the Advanced Functions are dependent on the
device and/or sensor.
Standard Windows control box options. See also Multiple Sessions.

PMManager User Manual 24
Resize PMManager Window Areas
PMManager is meant to run in full screen mode. Although, you can resize the entire window by using the
controls in the upper right corner, doing so may hide options in the graph configuration area.
There are individual controls to hide/show or expand/contract certain areas.
• Display area
This area can be expanded to fill the entire screen by clicking the icon of the display area.
To contract to the default size, click the icon in the expanded view.
• These actions hide and show the left control panel.
• Numerical Measurement and Statistics
This area can be expanded to fill the entire display area or expanded to fill the entire screen.
- To fill the display area, click the hide/reveal triangle located in the lower corner of the numerical
area. While in this expanded mode, …you can hide the statistics area so that only the measurement
area is shown. To do this, click ‘X’ at at the end of the horizontal line below the measurement value
. To leave the view, click the hide/reveal triangle.
- To return to the default size, click the hide/reveal triangle in corner of the numerical area.

PMManager User Manual 25
- To fill the entire screen area with the expanded view of the numerical area, click the icon, in the
display area. Click the appropriate button(s) to return to default size.
- To invert the color of the measurement area at any viewing option, click the Invert Color icon,
located in the lower left corner.
PMManager User Manual 26
Chapter 4 - PMManager Window Features
PMManager offers a range of options to view, analyze, and plot sensor outputs.
You can analyze sensors individually, perform mathematical operations on their output, and then have
outputs and/or results displayed individually or merged on a single graph with other sensors.
Each sensor output is assigned to its own channel (settings and functions) where the available settings are
read from the sensor.
This section describes the following:
Channel
Measuring Modes
Analog Output
Functions
Graphic Setup
Math channels have their primary usage when more than one channel is present. Refer to Multiple
Channels.
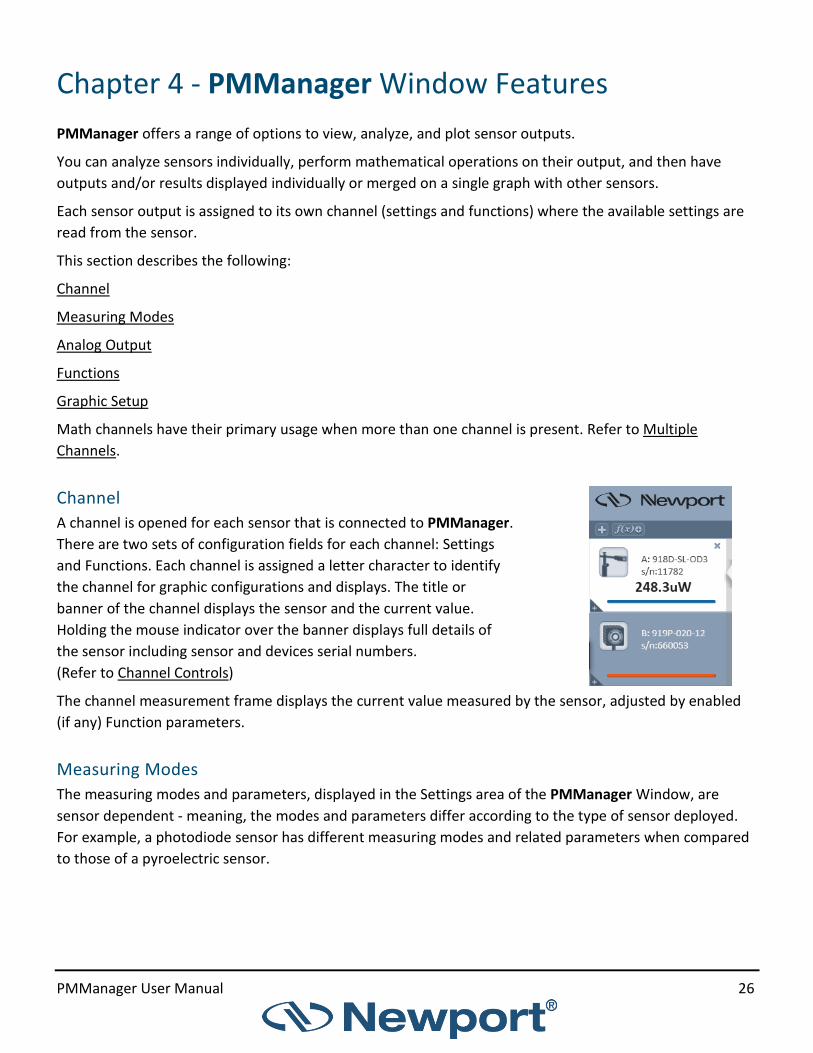
Channel
A channel is opened for each sensor that is connected to PMManager.
There are two sets of configuration fields for each channel: Settings
and Functions. Each channel is assigned a letter character to identify
the channel for graphic configurations and displays. The title or
banner of the channel displays the sensor and the current value.
Holding the mouse indicator over the banner displays full details of
the sensor including sensor and devices serial numbers.
(Refer to Channel Controls)
The channel measurement frame displays the current value measured by the sensor, adjusted by enabled
(if any) Function parameters.
Measuring Modes
The measuring modes and parameters, displayed in the Settings area of the PMManager Window, are
sensor dependent - meaning, the modes and parameters differ according to the type of sensor deployed.
For example, a photodiode sensor has different measuring modes and related parameters when compared
to those of a pyroelectric sensor.

PMManager User Manual 27
• The Save button, which is common for all sensors, is enabled each time a mode or parameter is
modified.
• Click Save to save the measuring mode and parameters as the default settings the next time the sensor
is connected to PMManager.
The table below displays the measuring modes available for different sensor types.
Device Photodiode Thermopile / PEPS* Pyroelectric
1919-R • Power • Exposure • Low Freq Power
• Power /Track • Energy • Pulsed Power
• Power • Energy • Exposure
841-PE-USB / 844-PE-USB
• Power • Low Freq Power
• Power / Track • Energy • Pulsed Power
• Power • Energy • Exposure
843-R-USB • Power • Power / Track • Energy
• Power • Energy
For further information, refer to the following:
• Measuring with Thermopile Sensors
• Measuring with Photodiode Sensors
• Measuring with Pyroelectric and PD Energy Sensors
* PEPS includes the Track measuring mode
Pyroelectricsensor
Measuring mode and parameters
Photodiode sensor
Measuring mode and parameters

PMManager User Manual 28
Functions
Each sensor channel comes with a Functions section. The parameters are the same for each sensor, but
their values are related to the sensor and the current readings of the settings.
Functions apply to power and energy readings. For a sensor in Track w/Power measurement mode, the
functions will apply to the power reading, not to the position and size readings.
Average
The Average function offers several choices as to the time interval over which sensor
readouts are averaged.
When you set the channel to average mode, PMManager displays the average of the
readings spanning from the last time average mode was activated, to the present.
Once the time period of the average is reached, the average becomes a running
average, spanning the average period backwards in time. For example, if the average
period is 30 seconds, at 15 seconds, the average is over 15 seconds; at 30 seconds, the average is over 30
seconds; at 5 minutes, it is over the period from 4 minutes and 30 seconds to 5 minutes (30 seconds back
from the present).

PMManager User Manual 29
Offset
The Offset function lets you select a “current” value as an
offset value.
1. Open the Function dialog.
If this is the first use of Offset, the value is blank (grey).
2. To use the current measurement value, click
That value becomes the Offset value and the adjacent
slide switch is engaged.
Every time you click the current value becomes the offset value and shows in the adjacent
field. The offset value remains until another value is selected.
The difference between the “current” value and the Offset is displayed in the measurement
frame.
If you click the button while the offset is in effect, the new offset value is the “current” value,
not the displaced difference.
3. Slide the toggle to off , to remove the Offset value, but maintain the current value.

PMManager User Manual 30
Scale Factor
The Scale Factor function multiplies the “current” value with the positive or negative value you enter in the
adjacent field once you select the check box.
1. Open the Function dialog.
If this is the first use of Offset, the value is 1.000 (grey).
2. Slide the toggle to ON, to enable the value field.
3. Enter the scale factor.
4. Slide the toggle to OFF to set and use the factor.
5. Slide the toggle to OFF to remove the scale value, but maintain the current value.
This option is especially useful in measurement configurations that have a beam splitter in front of the
sensor. By multiplying by the correct scale factor (usually about 20), the user will see the actual laser
power/energy measurement and not just what hits the sensor.
dBm and dB offset
The dBm function enables you to display current values as dBm values and with a dB offset.
1. Open the Function dialog.
2. Verify that the Normalize function is off.
3. Slide the toggle to ON.
The dBm options are enabled.
The measurements values are displayed as dBm.
4. To include dBm offset, click the adjacent
This offset parameter functions like the Offset one. Every time you click the adjacent button, the
current value becomes the offset value. The difference between the “current” dBm value and the dB
Offset value is displayed in the Channel Measurement frame.
5. Slide the toggles to OFF to remove dBm (and offset, keeping current value).

PMManager User Manual 31
Normalize
The Normalize function uses the selected “current” value and divides all subsequent values by the selected
value and displays the result in Channel Measurement frame.
1. Open the Function dialog.
2. Verify that dBm function is off.
3. To begin normalization, click the adjacent button.
4. The current value becomes the normalizing value and is displayed in the text field.
You can also enter the normalization value manually.
5. To remove normalization, keeping current value, slide the toggle.
Density
The Density function displays the sensor output as a per cm2 value. The option lets you choose a Round
Spot or a Rectangular Spot diameter from the adjacent list box.
1. Open the Functions dialog.
2. Verify that the dBm option is off.
3. Select a spot:
• For a round spot, check the Round Spot option, and
enter the diameter.
• For a rectangular spot, check the Rectangular Spot
option, and enter the width
(W and height H).respective fields.
With either of the selections, the Graph plot power
density, and the displayed measurement Statistics is
updated to reflect the selection.
Pass/Fail Limits
Define maximum and minimum limits for the reading. If a reading ‘out of the limits’ is received, it will be
marked. This feature is ideal for final QA testing
PMManager User Manual 32
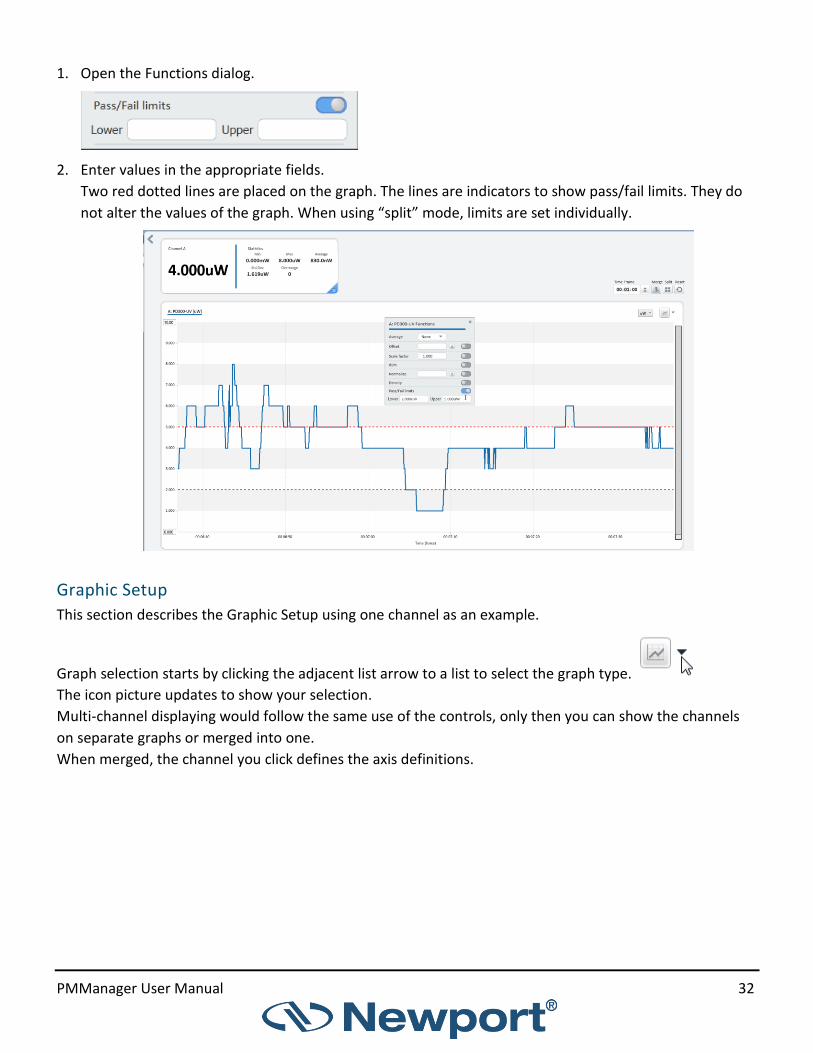
1. Open the Functions dialog.
2. Enter values in the appropriate fields.
Two red dotted lines are placed on the graph. The lines are indicators to show pass/fail limits. They do
not alter the values of the graph. When using “split” mode, limits are set individually.
Graphic Setup
This section describes the Graphic Setup using one channel as an example.
Graph selection starts by clicking the adjacent list arrow to a list to select the graph type.
The icon picture updates to show your selection.
Multi-channel displaying would follow the same use of the controls, only then you can show the channels
on separate graphs or merged into one.
When merged, the channel you click defines the axis definitions.

PMManager User Manual 33
Line Graph
Configure a line graph
1. In the Graph option list, select Line.
2. In the Time Period section, select the time period to represent the width of
the X-axis.
Since the X-axis always has 10 major divisions, then in this case,
each one is 1‑ second.
After 10 seconds has elapsed, the X-axis will begin sliding to right and after
each second another division is added to the right and one division is
removed on the left.
3. Observe the value in the Channel A Measurement frame as well as the Min and Max displayed in the
Statistics frame. This information will guide you in selecting Y-axis limits.
4. Open the list box to select the units for the Y-axis.
5. Select a unit based on the information gathered from the previous steps.
With the slide controls in this position, the values are 0 to 1,000 of the unit that you
selected.
❖ When options from Functions are used, the unit selection will change accordingly.
Refer to Y-axis with Functions for details.
6. Adjust the slide controls to give you the definition that you wish to see in the display.

PMManager User Manual 34
Y-axis with Functions
Function Y-axis Unit
dBm dBm
Normalize No units displayed
Density W/cm² or J/ cm²
Offset and Scale Factor Selecting one of these functions does not change the units of the Y-axis scale but may require adjusting the limits.
Histogram Graph
Configure a histogram
1. In the Graphic option list, select Histogram.
2. Observe the value in the Channel A Measurement frame as well as the Min and Max shown in the
Statistics frame. This information will guide you in selecting X-axis limits.
3. Open the list box to select the units for the X-axis.
4. Experiment with the controls in Histogram Settings so the data is
displayed in appropriately.
❖ When options from Functions are used, the unit selection will
change accordingly.
Refer to Y-axis with Functions for details.
❖ Measurements that are out of the selected X-Axis limits can be
displayed by the slide below

PMManager User Manual 35
Pulse Chart
Configure a pulse chart
1. In the Graphic option list, select Pulse Chart.
2. Observe the value in the Channel A Measurement
frame as well as the Min and Max shown in the
Statistics frame.
This information guides you in selecting Y-axis
limits.
3. Open the list box to select the units for the X-axis.
In this example, the Y-axis was modified to display 5.000W at the top because the measurement
values were less. Initially, the value 30.000 was changed and after clicking in the bottom field
(0.0), the chart show was displayed.

PMManager User Manual 36
Needle Graph
A needle graph simulates an analog display, similar to the style of an analog voltmeter.
Configure a needle graph
1. In the Graphic option list, select Needle.
2. Observe the value in the Channel A Measurement
frame as well as the Min and Max shown in the
Statistics frame.
This information guides you in selecting Y-axis limits.
3. Follow the steps for a Line Graph as the
requirements for these two graphs are similar.
Needle Modes
The Needle graph has two modes:
• Persistence
In this mode, previous measurements remain and are displayed in gray.
Also, the Min and Max values are displayed.
Click Clear to clear the display of previous measurements, including Min and Max.
Clear the Persistence option to convert to Non-Persistence display.

PMManager User Manual 37
• Non-Persistence
In this mode, only the current measurement is displayed.
Position
When a sensor is in Track w/Power measurement mode, the graphic display can either be Position or
Stability. In the Position graph, PMManager displays the position of the laser beam on a coordinate graph
as well as numerically. It also displays size as a circle drawn to scale on the graph and numerically. If size
cannot be measured, then position data only will be shown.
The numeric display and statistics are of the power measurement. Functions that are set will affect the
power and statistics measurement. They have no effect on the position and size measurements.
Centering — A slide switch in the display area can be set for absolute or for relative position measurements
when the switch is moved to the left side.

PMManager User Manual 38
You can select the current position of the laser as center, and all the later positions of the laser will be
calculated according to the origin. The offset of the current position will be displayed on the graph.

PMManager User Manual 39
Stability
When a sensor is in Track w/Power measurement mode, the graphic display can either be Stability or
Position. The Stability graph tracks the pointing stability of the laser beam over time.
PMManager User Manual 40
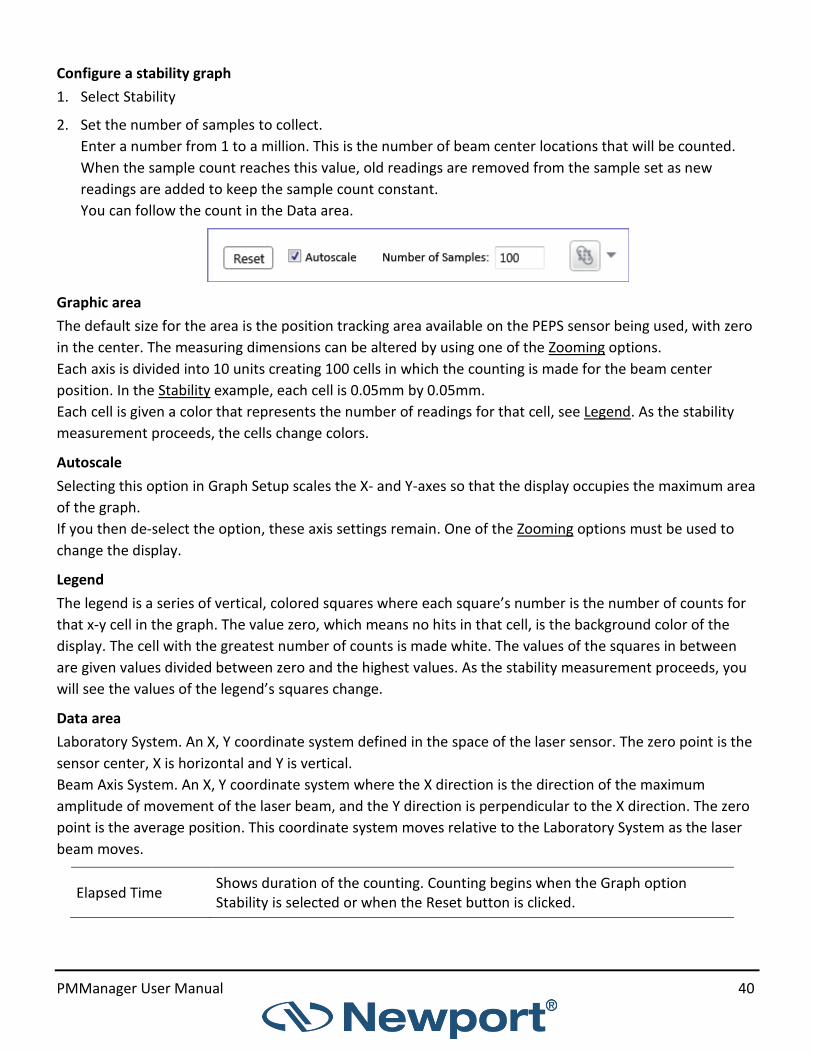
Configure a stability graph
1. Select Stability
2. Set the number of samples to collect.
Enter a number from 1 to a million. This is the number of beam center locations that will be counted.
When the sample count reaches this value, old readings are removed from the sample set as new
readings are added to keep the sample count constant.
You can follow the count in the Data area.
Graphic area
The default size for the area is the position tracking area available on the PEPS sensor being used, with zero
in the center. The measuring dimensions can be altered by using one of the Zooming options.
Each axis is divided into 10 units creating 100 cells in which the counting is made for the beam center
position. In the Stability example, each cell is 0.05mm by 0.05mm.
Each cell is given a color that represents the number of readings for that cell, see Legend. As the stability
measurement proceeds, the cells change colors.
Autoscale
Selecting this option in Graph Setup scales the X- and Y-axes so that the display occupies the maximum area
of the graph.
If you then de-select the option, these axis settings remain. One of the Zooming options must be used to
change the display.
Legend
The legend is a series of vertical, colored squares where each square’s number is the number of counts for
that x-y cell in the graph. The value zero, which means no hits in that cell, is the background color of the
display. The cell with the greatest number of counts is made white. The values of the squares in between
are given values divided between zero and the highest values. As the stability measurement proceeds, you
will see the values of the legend’s squares change.
Data area
Laboratory System. An X, Y coordinate system defined in the space of the laser sensor. The zero point is the
sensor center, X is horizontal and Y is vertical.
Beam Axis System. An X, Y coordinate system where the X direction is the direction of the maximum
amplitude of movement of the laser beam, and the Y direction is perpendicular to the X direction. The zero
point is the average position. This coordinate system moves relative to the Laboratory System as the laser
beam moves.
Elapsed Time Shows duration of the counting. Counting begins when the Graph option Stability is selected or when the Reset button is clicked.

PMManager User Manual 41
Sample Size Indicates how many samples have been measured. This value increases until the entered value for the number of samples is reached; after which old samples are discarded from the sample set to keep the value constant.
Errors When value is greater than zero indicates number of times a count could not be made. The usual reason is that the beam center when outside the sensor’s field of view.
Last X and Y The position of the beam center for the last reading, in the Laboratory System.
Average X and Y Shows the average X and Y positions for the readings in the sample set, in the Laboratory System.
Azimuth The rotation angle of the X axis of the Beam Axis System relative to the X axis of the Laboratory System.
∆, Y, and S The position stability, calculated as 4 in the X, Y and S directions respectively in the Beam Axis System, where is the standard deviation. S represents a general radial direction.
Zooming
Zooming the displayed stability graph is available during measurements as well when viewing a recorded
log file. Zooming is accomplished by keyboard, the left mouse button, and by the mouse wheel. As zooming
is increased or decreased, the X- and Y-axes will adjust. Moreover, cell colors and legend values will change.
You can use the scroll bars of the graph to center the new zoom field.
- Keyboard
Clicking the Plus and Minus keys on the main keyboard section or on the Number
keypad will zoom in and zoom out the display.
The arrow keys can be used to scroll the display.
- Left mouse button
This button can zoom the display by clicking the appropriate button
on the Zoom control.
The left mouse will drag the display by holding down the button and
moving in the desired direction. The mouse indicator changes to a 4-
point motion indicator icon.
- Mouse wheel
Rolling the mouse wheel away from you zooms in, and towards you zooms out. The display may be
scrolled in any direction by pressing the mouse wheel (or middle mouse button) and dragging.

PMManager User Manual 42
Apply to All
This option sets all displays to the same Graph mode as the display
that is selected. Apply to All does not affect displays which cannot be
changed to the selected graph.
PMManager User Manual 43
Chapter 5 - Measuring with Thermopile Sensors
This chapter describes how to take measurements with thermopile sensors.
About Thermopile Sensors
Newport thermopile sensors measure both power and single shot energy. When a radiant heat source, such
as a laser, is directed at the absorber sensor aperture, a temperature gradient is created across the
thermopile of the enclosed detector disc.
This generates a voltage proportional to the incident power.
The instrument amplifies this signal and indicates the power level received by the sensor. At the same time,
the signal-processing software enables the instrument to respond faster than the thermal rise time of the
detector disc, reducing the response time of instrument.
The energy of a single pulse is measured by digitally integrating the pulse power over time.
Configure Measurement Settings
If you are planning to repeat similar measurements, you can configure the settings for each individual
sensor, and save them to the instrument. The saved settings become the default configuration for that
channel, and are displayed every time the channel is opened.
The following sections describe how to select a measuring mode, how to configure thermopile sensors
measurement settings, and how to save the settings as the default configuration for that channel.
❖ Measurement settings are mode dependent, meaning the settings differ depending on the measuring
mode selected.
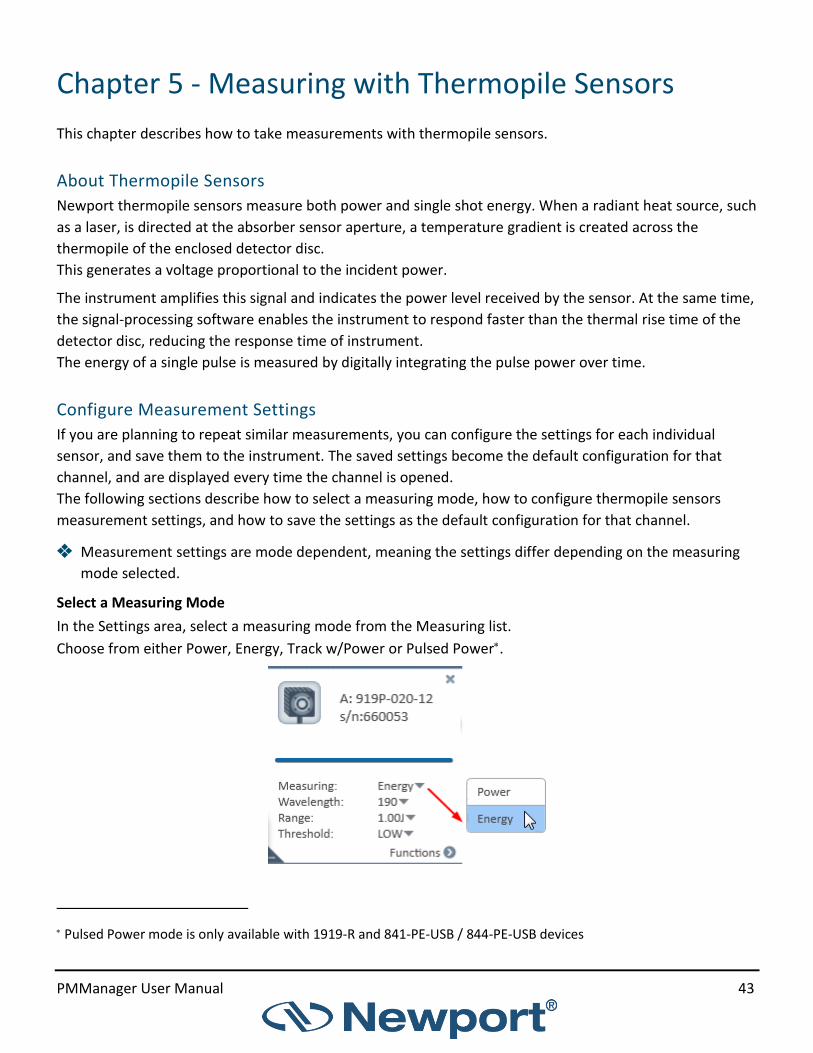
Select a Measuring Mode
In the Settings area, select a measuring mode from the Measuring list.
Choose from either Power, Energy, Track w/Power or Pulsed Power.
Pulsed Power mode is only available with 1919-R and 841-PE-USB / 844-PE-USB devices
PMManager User Manual 44
Configure Power Settings
Specify the laser wavelength
Specify a power range
Average the measurements
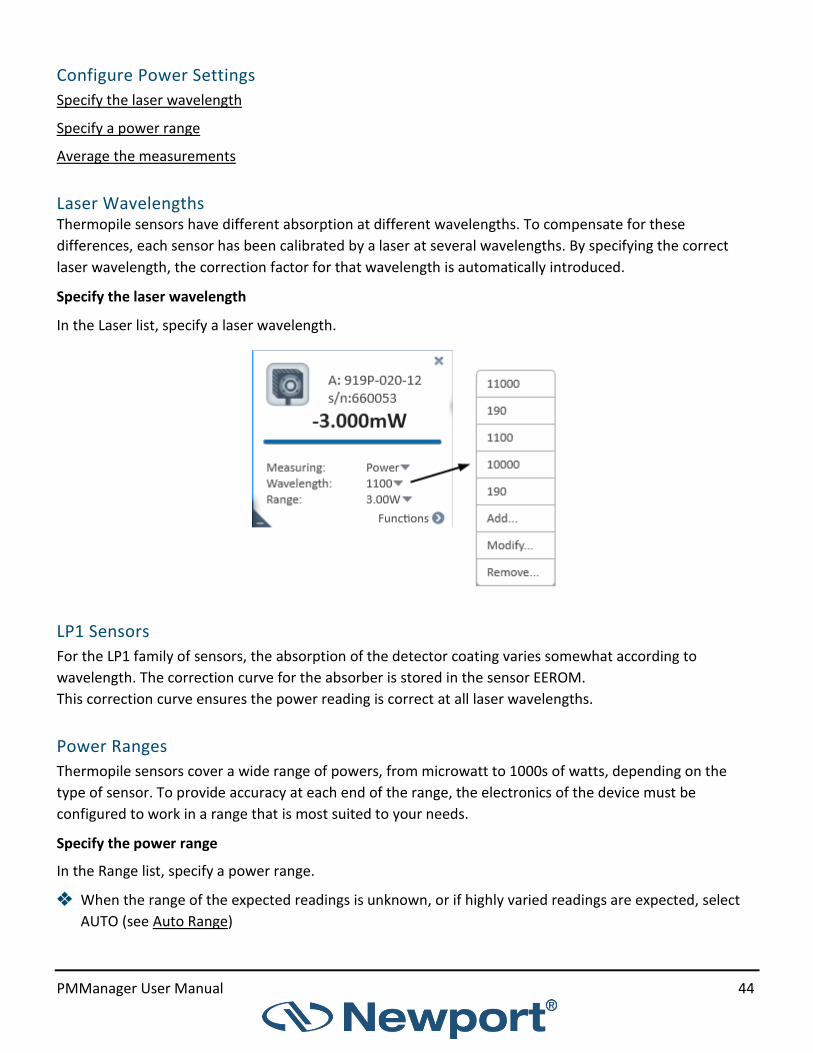
Laser Wavelengths Thermopile sensors have different absorption at different wavelengths. To compensate for these
differences, each sensor has been calibrated by a laser at several wavelengths. By specifying the correct
laser wavelength, the correction factor for that wavelength is automatically introduced.
Specify the laser wavelength
In the Laser list, specify a laser wavelength.
LP1 Sensors
For the LP1 family of sensors, the absorption of the detector coating varies somewhat according to
wavelength. The correction curve for the absorber is stored in the sensor EEROM.
This correction curve ensures the power reading is correct at all laser wavelengths.
Power Ranges
Thermopile sensors cover a wide range of powers, from microwatt to 1000s of watts, depending on the
type of sensor. To provide accuracy at each end of the range, the electronics of the device must be
configured to work in a range that is most suited to your needs.
Specify the power range
In the Range list, specify a power range.
❖ When the range of the expected readings is unknown, or if highly varied readings are expected, select
AUTO (see Auto Range)

PMManager User Manual 45
The instrument configures itself according to the selected range.
Auto Range
When the range is set to Auto, the instrument configures itself in the lowest range possible that is higher
than the latest readings.
• If the readings exceed 100% of the present range, the instrument reconfigures itself for the next higher
range
• If the readings fall below 9% of the present range, the instrument reconfigures itself for the next lower
range after a short delay
The delay prevents an infinite range-changing loop when readings are close to the end of the scale.
Average the Measurements
The thermopile sensor is measured 15 times per second. PMManager automatically refines the readings
and applies a moving average (see Average).
Configure Energy Settings
Specify the laser wavelength, power range, and energy thresholds.
Instrument is Ready When the instrument is ready to measure a new pulse, the word READY flashes in the numeric display area.
The next pulse automatically clears the screen, and the new value is then displayed.
If a further pulse is fired before the word READY is displayed, the reading may be inaccurate or may not be
displayed.
Energy Thresholds If the instrument is used in a noisy environment, or where high levels of background thermal radiation are
present, the instrument may trigger spuriously on the noise or background radiation. It would then fail to
measure the intended pulse. Since some degree of noise or background radiation is inevitable, the
instrument is designed not to respond to pulses below a preset minimum level.

PMManager User Manual 46
The minimum energy threshold is typically set to 0.3% of the full scale of the selected range.
However, the range can be modified when the level is too sensitive for particular environment.
The thresholds however, should not be raised higher than necessary, as this will cause degradation in the
accuracy of energy measurements of pulses below about 4 times the threshold level.
Specify the energy thresholds
In the Threshold list, specify the energy thresholds as described as follows.
‣ Low Select this threshold when measuring small energies and unit does not trigger
‣ Medium This is the default factory setting
‣ High Select this threshold when there is noise and unit does not trigger
Configure Pulsed Power Settings
❖ The Pulsed Power setting is only available with 1919-R, 841-PE-USB / 844-PE-USB devices
Specify the laser wavelength, power range, energy thresholds. and pulse width.
Pulsed Power
Thermopile sensors models are capable of measuring pulsed power in order to display instantaneous power
of a laser pulse. Power can be calculated from energy if the length of the pulse is known.
ⓘ The accuracy of measurement is dependent on setting the pulse width correctly
Pulse Width
A key element in measuring pulsed lasers is to define the pulse width ( or pulse length ) of the laser pulses.
Specify the pulse width
Specify the pulse width to the shortest time that is longer than the expected pulse width.
1. In the Pulse Width list, select Modify.
2. In the Modify Pulse Width dialog box, specify the pulse width duration in the seconds field.
• Specify a shorter pulse width setting for higher frequency lasers

PMManager User Manual 47
• Specify a longer pulse width setting for higher energy lasers
Optimize the Readings
PMManager can be optimized to achieve the most accurate and efficient results. This section describes the
most commonly used optimizations: offset, zeroing the instrument, and setting line frequency.
Apply an Offset
When there is thermal background in the environment, thermopile sensors may show a non-zero power
reading, even when there is no laser. For example, the display reads 0.1 Watts when the laser is blocked,
and reads 20.5 Watts when laser power is applied.
In this case, the true power is 20.5 - 0.1 = 20.4 Watts.
To subtract the background, apply an offset while the laser is blocked. The display will now read zero, and
the 0.1 Watt background will be subtracted from all subsequent readings.
The laser power reading will be 20.4 Watts.
❖ If you suspect the instrument has a permanent zero offset, disconnect the sensor while the sensor is in
power measurement mode. If the instrument still displays a similar reading even when the sensor is not
connected, zero the instrument.
PMManager User Manual 48
Zero the Instrument
All adjustments performed on Newport devices, including zeroing internal circuits, are done via the
software. This ensures simple and accurate realignment.
For optimum performance, it is recommended to frequently zero the instruments.
• 1919-R and 843-R-USB, devices:
- Thermopile sensors:
It is necessary to zero the instrument with no sensor attached, and then repeat with the sensor
attached
- Photodiode sensors:
It is only required to zero with the sensor attached
• 841-PE-USB / 844-PE-USB, instruments:
- All sensors:
It is only required to zero the instrument with the sensor attached.
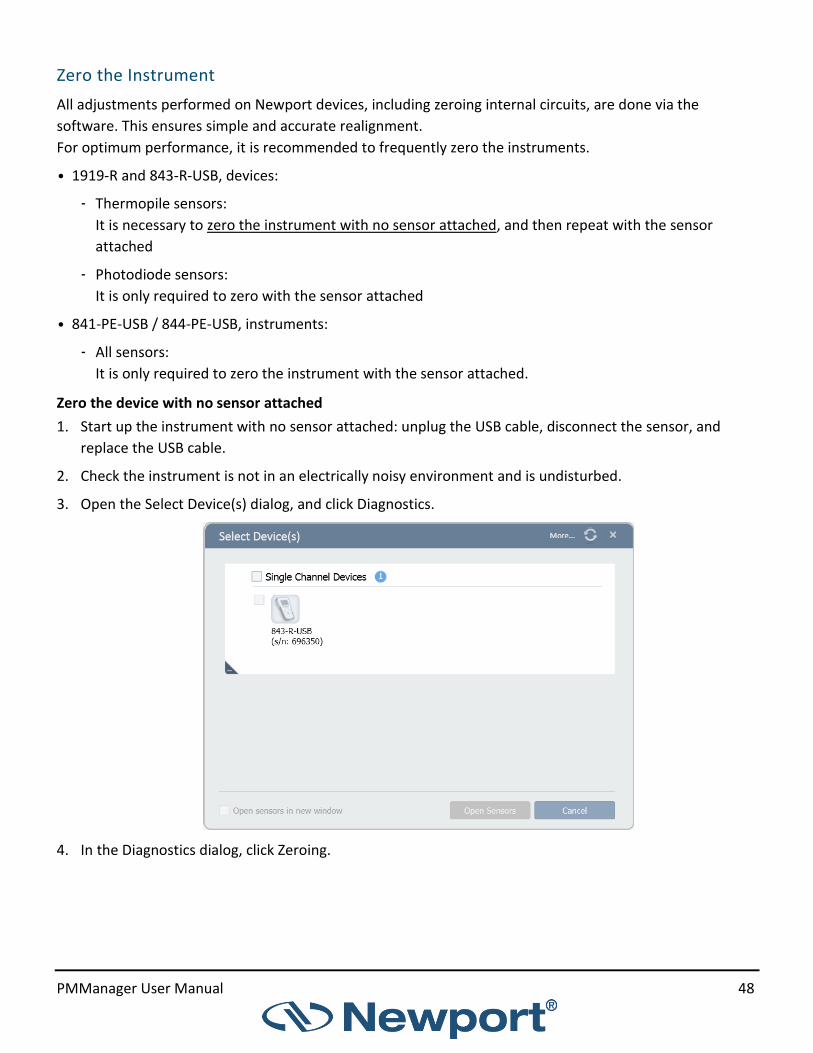
Zero the device with no sensor attached
1. Start up the instrument with no sensor attached: unplug the USB cable, disconnect the sensor, and
replace the USB cable.
2. Check the instrument is not in an electrically noisy environment and is undisturbed.
3. Open the Select Device(s) dialog, and click Diagnostics.
4. In the Diagnostics dialog, click Zeroing.

PMManager User Manual 49
The Zeroing Instrument dialog opens.
5. In the Zeroing Instrument dialog, click Start to begin zeroing the instrument.
When the zeroing is complete, a dialog opens with a message describing if the zeroing was successfully
completed or failed. Click OK to dismiss the message.
Zero the device with a sensor attached
1. Start up the instrument with a sensor attached.
2. From the Settings option Cogwheel, Open the Advanced Functions menu and select Zeroing. The
Zeroing Instrument dialog opens.
3. In the Zeroing Instrument dialog, click Start to begin zeroing the instrument.
4. When the zeroing is complete, click Save to save the zeroing.
Specify Line Frequency
Use the line frequency feature to remove interference caused by AC electricity in the room.
The 843-R-USB, 1919-R, and 841-PE-USB / 844-PE-USB are factory set at 50Hz.
❖ Reset the line frequency if your country uses 60Hz

PMManager User Manual 50
Set line frequency
1. In Options, select Line Frequency.
2. Select the line frequency according to your
geographical location:
• Europe = 50Hz
• USA, Japan = 60Hz
Calibration Factors PMManager enables you to adjust power calibration factors, configure the response factor, and adjust energy calibration factors.
⚠ WARNING
Adjusting the calibration factor makes a permanent change in the sensor. It is strongly recommended that before making any change to the factor, the original factory setting is recorded separately. This makes it easier, if required, to later restore the value to its original setting.
Adjust Power Calibration Factors
The absorption of the various Newport thermal absorbers can vary from disc to disc. Therefore, all Newport
absorbers are individually calibrated against NIST traceable standards. Newport sensors are laser-calibrated
at several wavelengths, against a NIST calibrated standard meter. For more information on Newport sensor
calibration and traceability, refer to Appendix B – Calibration, Traceability, and individually Recalibration.
PMManager offers two types of calibration:
• Overall Calibration - Changes the calibration at all wavelengths simultaneously
• Laser Specific Calibration - Changes the calibration at one specific laser wavelength
Adjust the power calibration factors
1. Make sure Measuring is set for
Power.
2. In Options, select Calibrate.
The Adjust Calibration Factors
dialog opens.
The Original area displays the original Measurement, Overall Sensitivity, and Laser Factor fields.
The Current wavelength is displayed beneath the Original area.

PMManager User Manual 51
3. Use the Overall Power Calibration Factor scroll bar to attain an accurate reading in the Overall
Sensitivity field in the Adjusted area,
OR
Enter the desired factor into the text box above the scroll bar.
❖ Adjusting the overall power calibration factor effects both the Measurement and the Overall
Sensitivity values.
4. Use the Laser Specific Factor scroll bar to attain an accurate reading in the Overall Sensitivity and Laser
Factor fields in the Adjusted area,
OR
Enter the desired factor into the text box above the scroll bar.
❖ Adjusting the Laser Specific Factor effects both the Measurement and the Laser Factor values.
5. Click Save to save the adjustment for the active channel.
Configure the Response Factor
The response factor feature finds the optimum response time to enable an accurate reading as quickly as
possible, while minimizing the risk of overshoot, (the erroneous reporting of readings above 100% of the
full scale). Response factor adjustment is only possible when the sensor is in power mode.
PMManager User Manual 52
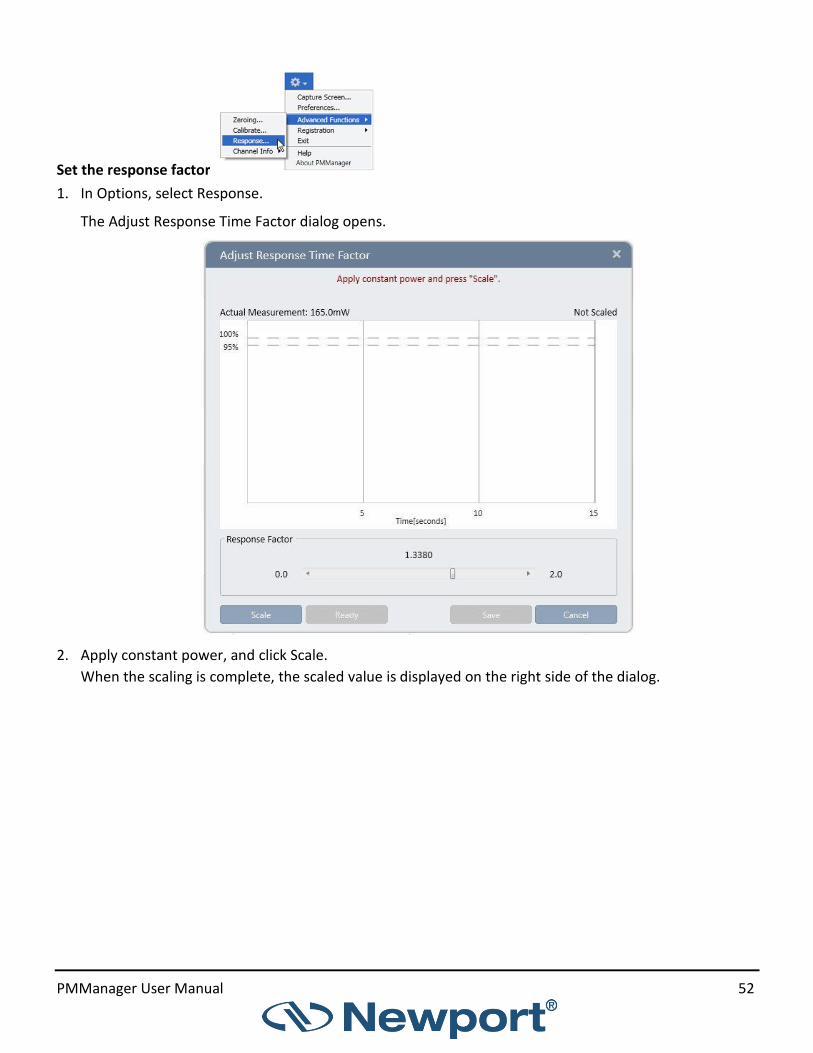
Set the response factor
1. In Options, select Response.
The Adjust Response Time Factor dialog opens.
2. Apply constant power, and click Scale.
When the scaling is complete, the scaled value is displayed on the right side of the dialog.

PMManager User Manual 53
Use the scroll bar to adjust the response factor in the Response Factor area.
3. Apply constant power to the thermopile sensor until the graph stabilizes.
4. Click Scale.
5. Block the laser for several moments to allow the sensor to cool down.
6. Adjust the response factor:
• To reduce overshoot, at the risk of possibly slowing down the response of the sensor, lower the
response factor
• To speed up the response of the sensor, at the risk of possible overshoot, raise the response factor
8. Click Ready.
7. Unblock the thermopile sensor.
8. Take a second reading.
9. Repeat steps 5 through 9 until the response is optimized.

PMManager User Manual 54
Adjust Energy Calibration Factors
Both power and energy readings are equally affected by changes in the absorption and/or sensitivity of the
thermal disc. Therefore, changing power calibration proportionately changes energy calibration. In addition,
adjusting the response time of the sensor can also affect energy calibration. For this reason, provisions are
made to adjust energy calibration without affecting power calibration.

PMManager User Manual 55
Adjust the energy calibration factors
1. In Options, select Calibrate.
The Adjust Calibration Factor
dialog opens
The Original area displays the original Measurement and Calibration Factor. The Current wavelength is
displayed beneath the Original area.
2. Use the scroll bar to adjust the Calibration Factor in order to attain an accurate Calibration Factor
reading.
3. Click Save to save the adjustment for the active channel.
PMManager User Manual 56
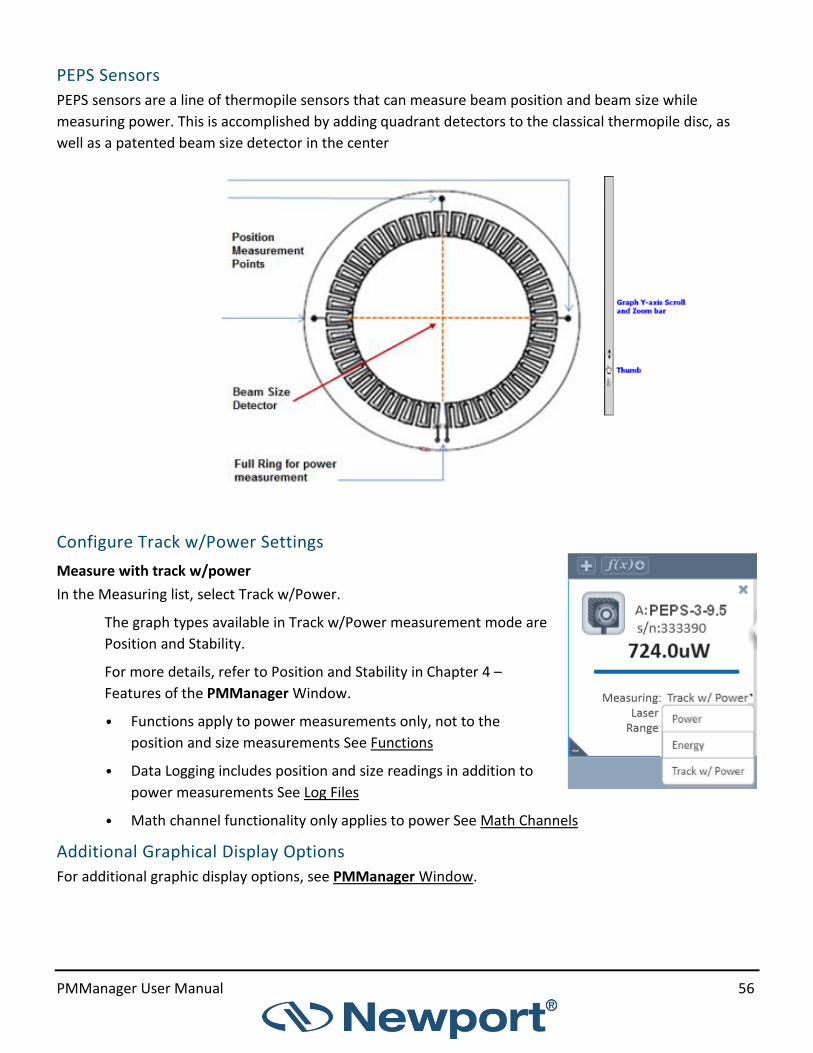
PEPS Sensors
PEPS sensors are a line of thermopile sensors that can measure beam position and beam size while
measuring power. This is accomplished by adding quadrant detectors to the classical thermopile disc, as
well as a patented beam size detector in the center
Configure Track w/Power Settings
Measure with track w/power
In the Measuring list, select Track w/Power.
The graph types available in Track w/Power measurement mode are
Position and Stability.
For more details, refer to Position and Stability in Chapter 4 –
Features of the PMManager Window.
• Functions apply to power measurements only, not to the
position and size measurements See Functions
• Data Logging includes position and size readings in addition to
power measurements See Log Files
• Math channel functionality only applies to power See Math Channels
Additional Graphical Display Options
For additional graphic display options, see PMManager Window.

PMManager User Manual 57
Chapter 6 - Measuring With Photodiode Sensors
This section describes how to take measurements with photodiode sensors.
About Photodiode Sensors
When a photon source, such as a laser, is directed at a photodiode sensor, a current is created proportional
to the light intensity and dependent on the wavelength.
Newport photodiode sensors significantly reduce background noise because they have a unique dual
detector sensor, containing two identical detectors which are connected back-to-back.
When a uniform signal, such as background room light, falls on the detector sensor, the signal from the two
detectors cancels. Conversely, when a laser beam falls on the sensor, it illuminates the first detector only
and is detected. This is how the sensor subtracts most of the background while still detecting the desired
signal. In general, 98% of the background signal is eliminated.
This means that the detector can be used in ordinary laboratory lighting conditions.
The instrument amplifies this signal and indicates the power level received by the sensor.
Due to the superior circuitry of the Newport instruments, the noise level is very low, and Newport
photodiode sensors have a large dynamic range, from pico Watts to Watts.
Since many low power lasers have powers ranging from 5 to 30mW, and most photodiode detectors
saturate at about 2mW, Newport photodiode sensors have a built in filter to allow the sensor to measure
up to 30mW or more without saturation. When the additional filter is applied, the maximum power can
range from 300mW to 3W. Photodiode sensors saturate when the output current exceeds 1.3mA so the
exact maximum power depends on the sensitivity of the detector at the wavelength used.
For a more detailed description of the principles of operation of Newport photodiode sensors, refer to the
Newport Optronics catalog, available for download from http://www.Newportopt.com.
Configure Measurement Settings
If you are planning to repeat similar measurements, you can configure the settings for each individual
sensor, and save them to the instrument. The saved settings become the default configuration for that
channel, and are displayed each time the channel is opened.
The following sections describe how to configure measurement settings for photodiode sensors and how to
save them as the default configuration for that channel.
Configuration settings include: configuring laser wavelengths, range, average readings, and
inserting/removing the filter.
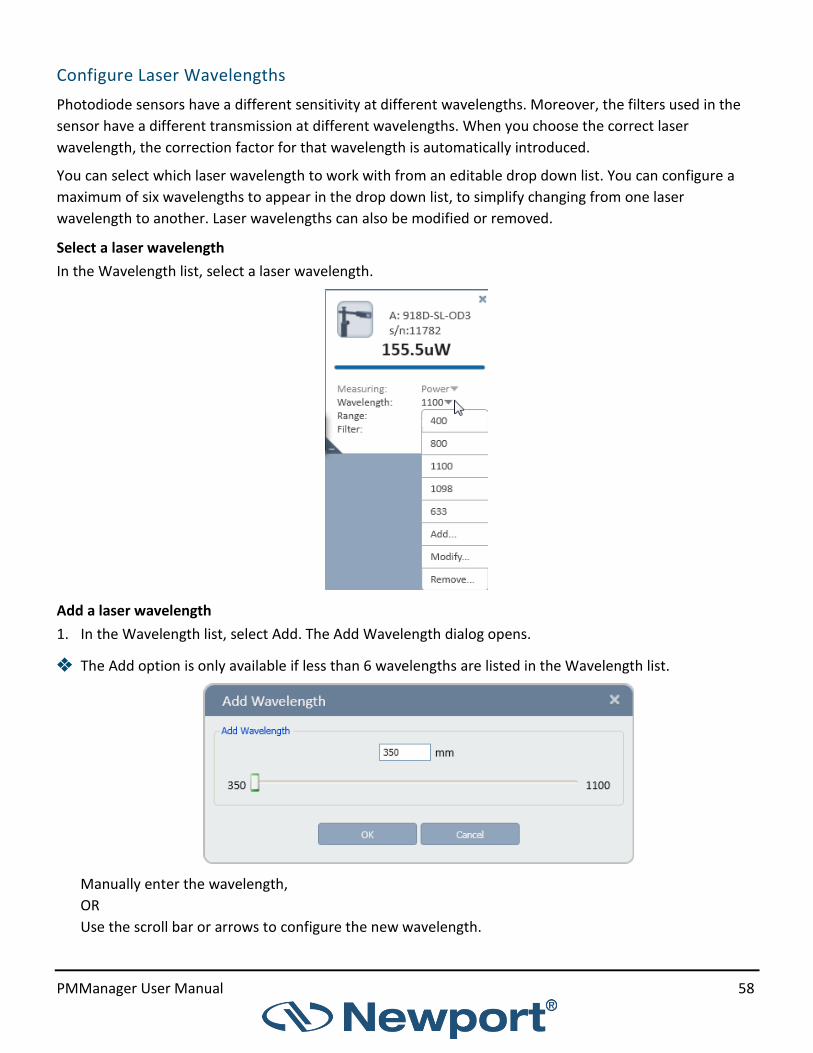
PMManager User Manual 58
Configure Laser Wavelengths
Photodiode sensors have a different sensitivity at different wavelengths. Moreover, the filters used in the
sensor have a different transmission at different wavelengths. When you choose the correct laser
wavelength, the correction factor for that wavelength is automatically introduced.
You can select which laser wavelength to work with from an editable drop down list. You can configure a
maximum of six wavelengths to appear in the drop down list, to simplify changing from one laser
wavelength to another. Laser wavelengths can also be modified or removed.
Select a laser wavelength
In the Wavelength list, select a laser wavelength.
Add a laser wavelength
1. In the Wavelength list, select Add. The Add Wavelength dialog opens.
❖ The Add option is only available if less than 6 wavelengths are listed in the Wavelength list.
Manually enter the wavelength,
OR
Use the scroll bar or arrows to configure the new wavelength.
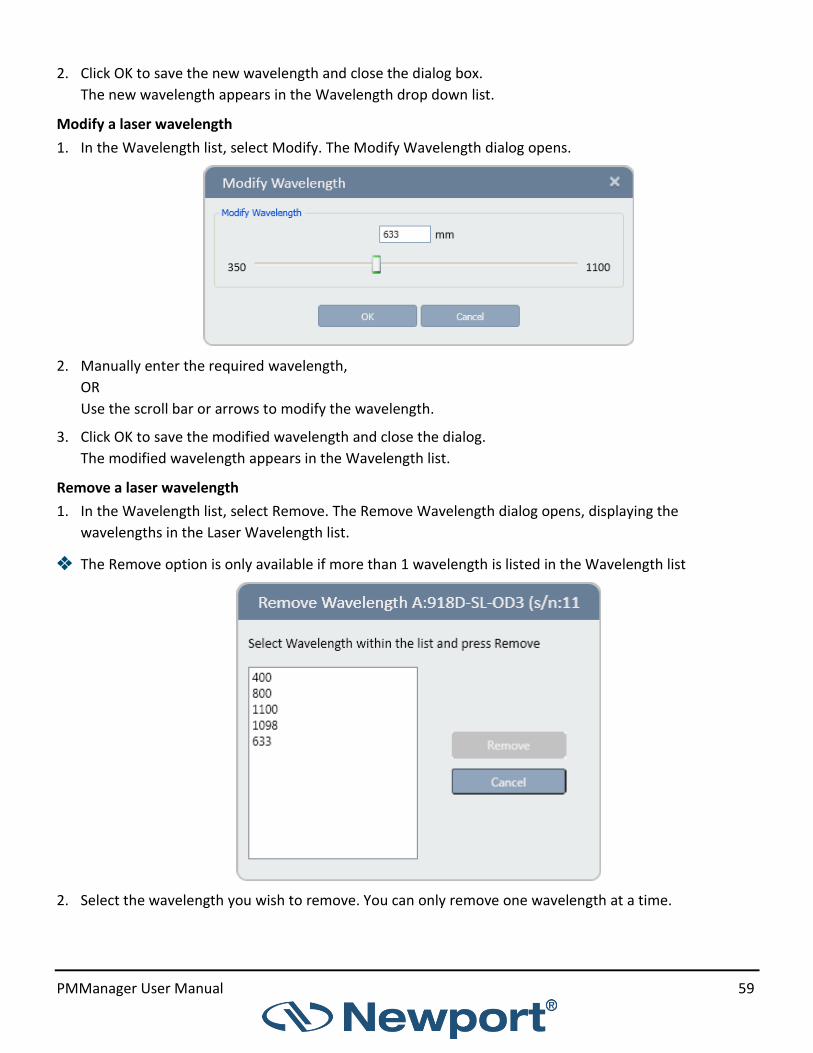
PMManager User Manual 59
2. Click OK to save the new wavelength and close the dialog box.
The new wavelength appears in the Wavelength drop down list.
Modify a laser wavelength
1. In the Wavelength list, select Modify. The Modify Wavelength dialog opens.
2. Manually enter the required wavelength,
OR
Use the scroll bar or arrows to modify the wavelength.
3. Click OK to save the modified wavelength and close the dialog.
The modified wavelength appears in the Wavelength list.
Remove a laser wavelength
1. In the Wavelength list, select Remove. The Remove Wavelength dialog opens, displaying the
wavelengths in the Laser Wavelength list.
❖ The Remove option is only available if more than 1 wavelength is listed in the Wavelength list
2. Select the wavelength you wish to remove. You can only remove one wavelength at a time.

PMManager User Manual 60
3. Click Remove to remove the selected wavelength and close the dialog.
The removed wavelength no longer appears in the Wavelength list.
Select the Range
Photodiode sensors cover a wide range of powers, depending on the type of sensor in use. In order to
provide accuracy at each end of the range, the electronics of the device must be configured to work in a
range that is most suited to your needs.
Configure the range
• When you know the approximate range of the expected readings:
In the Range list, select a range. The instrument configures itself according to the selected range.
• When the range of the expected readings is not known, or highly varying readings are expected:
In the Range list, select AUTO.
❖ AUTO instructs the instrument to configure itself in the lowest range possible that is higher than the
latest readings.
- If the readings exceed 100% of the present range, the instrument reconfigures itself for the
next higher range.
- If the readings fall below 9% of the present range, the instrument reconfigures itself for the
next lower range after a short delay. The delay prevents an infinite range-changing loop when
readings are close to the end of the scale.
Filter Settings
Most photodiode sensors are equipped with an optional filter that allows them to measure up to 300mW or
more without saturating the detector. The exact maximum power is reached when the reading reaches full

PMManager User Manual 61
scale, or when the output current from the sensor reaches 1.3mA, whichever comes first. You can work
with or without the filter, depending on which powers you wish to measure.
Configure the instrument to measure
• When the filter is inserted: In the Filter list, select IN
• When the filter is removed: In the Filter list, select OUT
❖ Make sure to physically insert or remove the filter, according to the filter setting selected.
Failure to do so will result in erroneous readings.
❖ For sensors with built-in filter state detection, the Filter list displays the current active setting only
Photodiode Exposure
❖ Photodiode exposure is currently only supported on 1919-R devices.
• For Photodiode sensors, measuring total exposure is based on summing photodiode power
measurements over time
• In exposure mode, the devices measure 15 times per second, updating the exposure displayed on the
screen 5 times per second
Measure total exposure
1. In the Measuring list, select Exposure.
2. In the Stop Mode list, select either Manual or Timeout.
3. Click Start.
The accumulated laser power exposure and elapsed time are displayed.
• Click Stop, to stop measuring the exposure before the chosen period (Manual or Timeout).
• Click Reset, to reset the reading to zero before another reading

PMManager User Manual 62
4. To return to the main power measurement screen, in the Measuring list, select Power.
Low Frequency Power
❖ Low frequency power is supported on 1919-R and 841-PE-USB / 844-PE-USBdevices.
Low frequency power mode is useful when measuring the average power for pulsed lasers with a frequency
in the ~5 - ~100Hz range. Using the regular power mode with such a laser source can cause beating effects
and saturation of the electronics, which causes unstable or incorrect readings in many cases. The low
frequency power mode solves these problems using a special measurement technique in the firmware that
synchronizes to the laser frequency (as supplied by the user). This mode is only supported when using
Photodiode sensors (PD300-xx) - it is not supported when using Thermopile sensors (which normally do not
exhibit such problems, as their response time is much slower than photodiodes).
When switching to low frequency power mode, the firmware inside the device makes several changes to
the way the electronics are configured and how it measures the photodiode signals, to accommodate the
low frequency pulses being measured.
❖ While the Low Freq. Power Mode will improve overall performance relative to the regular power mode,
a certain increase in noise is still likely to be observed. In some cases it may be possible to reduce noise
by averaging power measurements over a longer period.
Measure the average power for low frequency pulsed laser sources
1. In the Measuring list, select Low Freq Power.

PMManager User Manual 63
❖ When switching to Low Freq. Power mode, pay special attention when zeroing the sensor.
2. If required, configure the Wavelength, Range, Filter, and Pulse Frequency.
3. In the Pulse Frequency list, select Modify. The Modify Pulse Frequency dialog opens.
4. In the Modify Pulse Frequency dialog, manually enter the required pulse frequency,
OR
Use the scroll bar or arrows to modify the pulse frequency.
• If the frequency setting is too low, this may result in periodic positive power spikes above the
average power level being measured
• If the frequency is too high, the spikes will be negative, below the average power level
5. Click OK to save the modified pulse frequency, and close the dialog.
❖ Due to slight errors in the nominal internal clock frequency of the measurement device, or of the laser
pulse frequency, the exact frequency setting required for perfect measurements may not be exactly as
expected.

PMManager User Manual 64
Average the Measurements
To configure an average reading for a photodiode sensor, refer to Average.
Optimize the Readings
PMManager can be optimized to achieve the most accurate and efficient results. This section describes the
most commonly used optimizations: offset, zeroing the instrument, and setting line frequency.
Apply an Offset
Newport’s unique dual-detector sensors detect and subtract 98% of background light. The residual
background signal can be removed using the Offset feature.
For example, the display reads 0.1 µW when the laser is blocked, and reads 20.5 µW when laser power is
applied. In this case, the true power is 20.5 - 0.1 = 20.4 µW. To subtract the background, apply an offset
while the laser is blocked. The display will now read zero, and the 0.1 µW background will be subtracted
from all subsequent readings. The laser power reading will be 20.4 µW.
To apply an offset, see Offset
❖ If you suspect the instrument has a permanent zero offset, disconnect the sensor while the sensor is in
power measurement mode. If the instrument still displays a similar reading even when the sensor is not
connected, zero the instrument.
Zero the Instrument
To zero the instrument for a photodiode sensor, see Zero the Instrument.
Specify Line Frequency
To specify the line frequency for a photodiode sensor, see Specify Line Frequency.
Adjust Calibration Factors
⚠ WARNING
Adjusting the calibration factor makes a permanent change in the sensor. It is strongly recommended that before making any change to the factor, the original factory setting is recorded separately. This makes it easier, if required, to later restore the value to its original setting.
Photodiode detectors are inherently very linear but do vary broadly in sensitivity from wavelength to
wavelength. In addition, Newport PD300 models are equipped with both a built in and a removable filter to
enable measurement of higher powers without detector saturation. The transmission of these filters
depends on wavelength. The PD300 has a built in calibration adjustment for wavelength. For more
information on the PD300 built in calibration adjustment, refer to Appendix B – Calibration, Traceability,

PMManager User Manual 65
and Recalibration. The user cannot recalibrate the whole calibration curve, but can adjust the overall
calibration, which in turn adjusts all wavelengths proportionately.
Adjust the power calibration factor
1. In Options, select Calibrate. The Adjust Calibration Faction dialog opens.
The Original area of the dialog box displays the original Measurement and
Calibration Factor.
The Current wavelength is displayed beneath the Original area
2. Use the Calibration Factor scroll bar to attain an accurate reading in the Calibration Factor field in the
Adjusted area,
OR
Enter the factor into the text box above the scroll bar.
❖ Adjusting the Calibration Factor changes the calibration of all wavelengths by the same factor.
3. Click Save to save the adjustment for the active channel.
Additional Graphical Display Options
For additional graphic display options, see PMManager Window for details.

PMManager User Manual 66
Chapter 7 - Measuring with Pyroelectric and PD Energy Sensors
This section provides an overview of pyroelectric and PD energy sensors and describes how to take
measurements with these sensors.
About Pyroelectric and PD Energy Sensors
Newport pyroelectric sensors measure both frequency and energy of pulsed lasers. When a pulsed heat
source, such as a laser, is directed at the detector, a temperature gradient is created across the pyroelectric
crystal mounted in the sensor. This produces an electric charge, which is proportional to the energy
absorbed. The detector sensor has sophisticated circuitry unique to Newport (patented) that determines
the baseline before the pulse is received, measures the voltage after a pre-determined interval, amplifies it,
and holds it for a pre-determined time.
Due to this innovative circuitry, Newport pyroelectric sensors can measure very long pulses as well as short
ones; low energies as well as high energies. They can also measure at higher repetition rates than ever
before possible.
The device to which the sensor is connected converts this signal to a digital value and indicates the energy
received by the sensor, as well as the frequency at which the laser is pulsing. Using the energy and
frequency information, the PMManager application is also able to display average power.
Newport PD energy sensors differ from pyroelectric sensors in that their detector is a photodiode instead of
a pyroelectric crystal. They use a similar circuit to the pyroelectric sensors and offer similar functionality.
Therefore, throughout this manual, they are included in the generic term "pyroelectric" when referring to
software and control functions, even when this is not stated explicitly.

PMManager User Manual 67
⚠ WARNING
Before using the sensor for frequency or energy measurements, make sure that your laser power, energy, and energy density do not exceed the sensor ratings listed in the specifications table for the specific sensor. Otherwise, you may damage the absorber. Refer to the Newport Laser Power/Energy Measurement, at www.Newportopt.com, for full details on each sensor. A test slide is provided with each pyroelectric sensor, which contains the same coating as the pyroelectric detector. (You can obtain additional slides from your supplier.) Use this slide to test the damage threshold of your laser pulses. If the laser pulses damage the slide, either enlarge the beam or lower the laser energy until no damage is detected. To measure pyroelectric energies properly, it is important that the sensor is not grounded to the optical bench. Make sure that the sensor is isolated electrically from the ground. Each pyroelectric sensor is supplied with an insulating mounting post for this purpose.
Configure Measurement Settings
If you are planning to repeat similar measurements, you can configure the settings for each individual
sensor, and save them to the instrument. The saved settings become the default configuration for that
channel, and are displayed each time the channel is opened.
The following sections describe how to select the measurement mode, how to configure measurement
settings for pyroelectric sensors, and how to save them as the default configuration for that channel.
The measurement setting fields differ for frequency and energy modes.
Measurement settings include: laser wavelength, power range, diffuser, pulse width, and average reading.
Select the measurement mode
In the Measuring list, select Power or Energy.
The pyroelectric screen fields displayed depend on the mode selected.

PMManager User Manual 68
Configure Laser Wavelengths
Metallic and PD Energy Sensors
For metallic and PD energy sensors, the absorption of the detector coating varies somewhat according to
wavelength. The correction curve for the absorber is stored in the sensor EEROM.
This correction curve ensures that the power reading is correct at all laser wavelengths.
• To configure laser wavelengths, refer to Configure Laser Wavelengths when measuring with Photodiode
sensors
Broadband (BB) Sensors
Broadband (BB) sensors have less variation according to wavelength. For broadband sensors, fixed
wavelength ranges are provided, similar to thermopile sensors.
• To configure laser wavelengths, refer to Specify the Laser Wavelength when measuring with
Thermopile sensors
Select the Range
Pyroelectric sensors cover a wide range of energies (from tens of nano joules to tens of joules) depending
on the type of sensor in use. In order to provide accuracy throughout the range, the electronics of the
sensor must be configured to the range you are working in.
Configure the range when you know the approximate range of the expected readings
In the Range list, select a range. The instrument configures itself according to the selected range.
⚠ WARNING
While measuring pulsing lasers, an erroneous energy reading will result if the energy range is not set up correctly.

PMManager User Manual 69
Add a Diffuser
You can add a diffuser to some pyroelectric sensors. A diffuser enables the energy ranges to reach very high
levels. When using a sensor that can have a diffuser, configure the diffuser settings in the Measurement
Parameters Area.
Specify if a diffuser is in use
In the Diffuser list, do the following:
• Select IN if the diffuser is in use
• Select OUT if the diffuser is not in use
❖ When the diffuser setting is changed, a message is displayed, reminding you you to either insert or
remove the diffuser
❖ This setting is not enabled for sensors that are not equipped with a diffuser - the sensors are configured
to measure in Diffuser Out mode.
Configure the Pulse Width
Some pyroelectric sensors can be configured to measure long as well as short pulses. To accomplish this,
the user must configure the sensor for long laser pulses or short pulses.
❖ If the pulse length is incorrectly set to the short setting for pulses longer than that value, the reading
will be erroneously low. If it is set to the longer setting for short pulses, the reading will be correct, but
noisier.
Select a pulse width
In the Pulse Width list, select a pulse width.
❖ For sensors with only one pulse width setting, the Pulse Width list is unavailable and the sensor is
configured to measure in its correct mode

PMManager User Manual 70
Average the Measurements
The PMManager application automatically refines your readings and applies a moving average. For
pyroelectric sensors, the PMManager application averages the number display, not the graph display.
❖ For details see Average
Set the Thresholds
In order to screen out false triggers the user can set a minimum threshold. Threshold is a percentage of the
full scale of the presently selected range. Pulses above the threshold are understood to be true readings
that should be recorded. Anything below the threshold is assumed to be noise and is filtered out from the
recorded set of measurements.
Optimize the Readings
The PMManager application can be optimized to achieve the most accurate and efficient results.
This section describes the most commonly used optimization of zeroing the instrument with the sensor
connected.
Zero the Instrument
Unlike thermopile and photodiode sensors, pyroelectric readings are slightly dependent on the instrument.
Therefore, for the most accurate pyroelectric energy measurements, it is necessary to zero the sensor
against the instrument with which it is being used. After this is done, the sensor is conditioned to work with
that specific instrument. It is not necessary to repeat this procedure unless the sensor will be used with a
different instrument. If this procedure is not performed, errors of up to approximately 2% may occur.
❖ For pyroelectric, it is necessary to leave the sensor connected when zeroing the instrument

PMManager User Manual 71
Zero the instrument
1. Turn off the laser.
2. Make sure the instrument is not in an electrically noisy environment and
is undisturbed.
3. Select Zeroing (Settings > Advance Functions > Zeroing). The Zeroing
Instrument dialog opens.
4. Click Start to begin zeroing the instrument.
5. When zeroing is complete, click Save to save the zeroing.
6. In the confirmation message, click OK.
Measure the Total Energy Exposure
For pyroelectric sensors, the PMManager application has the ability to sum the total energy of a number of
pulses over a given time period or number of pulses. This returns the total energy exposure over the
selected period. For example, if the laser is pulsing at 30 times per second, at 1mJ per pulse, and you
measure the exposure over 20 seconds, then the total exposure is 30 x 1 x 20 = 600mJ.
❖ The maximum exposure measurement time is one hour
❖ PMManager supports exposure with the 1919-R and 841-PE-USB / 844-PE-USB. (843-R-USB devices are
not supported.)
Measure the total exposure
1. In the Measuring list, select Exposure.
The Exposure window opens displaying the default time required for the exposure.

PMManager User Manual 72
2. Choose a stop mode from the Stop Mode list.
3. Click Start to begin the measurement.
4. Specify the Time Out required for the Stop Mode.
5. Click Stop to discontinue Exposure measurement.
• The total number of Pulses Measured are displayed
• The Elapsed Time is displayed

PMManager User Manual 73
Adjust Calibration Factors
⚠ WARNING
Adjusting the calibration factor makes a permanent change in the sensor. It is strongly recommended that before making any change to the factor, the original factory setting is recorded separately. This makes it easier, if required, to later restore the value to its original setting.
The sensitivity of the various Newport pyroelectric sensors varies from one to another, as well as with
wavelengths. Therefore, Newport pyroelectric detectors are individually calibrated against NIST traceable
standards. In addition, the calibration is corrected in the devices for different wavelengths. For more
information on calibration, refer to Appendix B – Calibration, Traceability, and Recalibration.
❖ For metallic sensors, when the calibration is changed at one laser wavelength, the overall calibration of
all other wavelengths changes proportionately. For broadband sensors, there is an option to adjust the
calibration factor for all wavelengths or only for a selected wavelength.
Adjust the energy calibration factor 1. Select Calibrate (Settings > Advance Functions > Calibrate)
The Adjust Calibration Factor dialog opens.
The calibration screen depends whether the Metallic or
Broadband sensor is selected.
- The Original area displays the original Measurement and Calibration Factor.
- The Current wavelength is displayed beneath the Original area.
Metallic sensor

PMManager User Manual 74
Broadband sensor
2. Use the Calibration Factor scroll bar to attain an accurate reading in the Calibration Factor field in the Adjusted area, or Enter the desired factor into the text box above the scroll bar.
3. Click Save to save the adjustment for the active channel.
Additional Graphical Display Options
For additional graphic display options, see PMManager Window for details.

PMManager User Manual 75
Chapter 9 - Multiple Channels
This section describes how to work with multiple sensors and channels from various connected devices.
Connect Multiple Sensors
It is possible to attach more than one Newport sensor to a PC as several single channel devices (841-PE-USB
/ 844-PE-USB, and 843-R-USB)
PMManager creates a channel for each sensor/device that is selected.
Multiple USB devices can be attached to the PC by using more than one USB port.
Most PCs are equipped with between 2 and 6 USB ports. However, the USB standard specifies that up to
127 devices can be attached to one USB controller. The standard relies on a device called a hub. Hubs
provide ports to allow multiple devices to be attached.
• 841-PE-USB / 844-PE-USB devices are bus-powered and therefore require a hub that can provide power
to downstream high-power devices
• 1919-R and 843-R-USB are self-powered and do not require power from the USB port
Select Sensors
The PMManager application allows you to work with multiple channels from various devices at the same
time. The devices may be connected to many types of sensors including thermopile, photodiode,
pyroelectric or a combination of different sensor types. In addition to being able to connect the application
to numerous channels at once, you can specify which of the connected channels you wish to view.
Select a sensor
1. Open PMManager. The Select Device(s) dialog opens.

PMManager User Manual 76
2. Select one or more sensors with which you wish to work,
OR
If all the devices are single sensor types, select the check box above the devices to selects them all.
Select Device Options
This section describes the available device options and an explanation about each option.
Number of devices is displayed inside a blue circle
Label displays connected device type/name
When more than one device is selected, each
device gets a channel, but they appear together in
one graphic window. This is the recommended way
to display more than one device.
Each device gets a separate graphic window.
Opens the Diagnostic Screen to select a device for
the diagnostic routine.
Displays all devices, no need to pre-select devices.
PMManager re-scans ports to find connected
devices.
Select to have two PMManager sessions. See
Multiple Sessions.
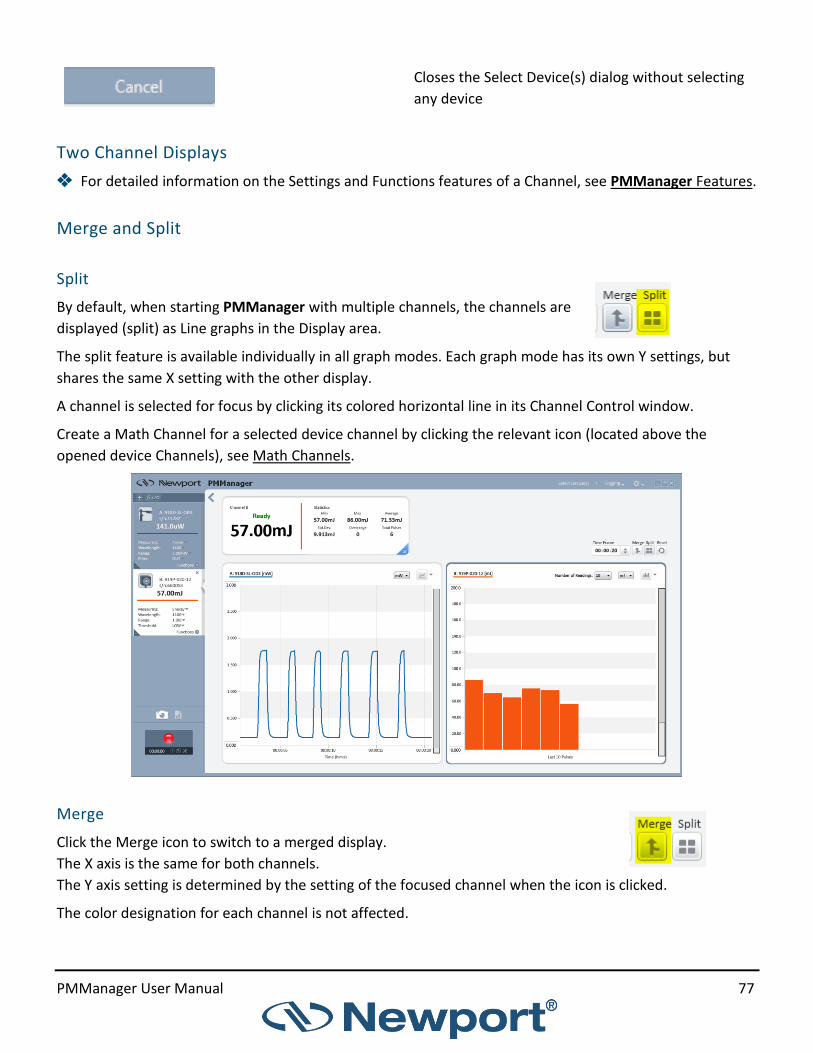
PMManager User Manual 77
Closes the Select Device(s) dialog without selecting
any device
Two Channel Displays
❖ For detailed information on the Settings and Functions features of a Channel, see PMManager Features.
Merge and Split
Split
By default, when starting PMManager with multiple channels, the channels are
displayed (split) as Line graphs in the Display area.
The split feature is available individually in all graph modes. Each graph mode has its own Y settings, but
shares the same X setting with the other display.
A channel is selected for focus by clicking its colored horizontal line in its Channel Control window.
Create a Math Channel for a selected device channel by clicking the relevant icon (located above the
opened device Channels), see Math Channels.
Merge
Click the Merge icon to switch to a merged display.
The X axis is the same for both channels.
The Y axis setting is determined by the setting of the focused channel when the icon is clicked.
The color designation for each channel is not affected.
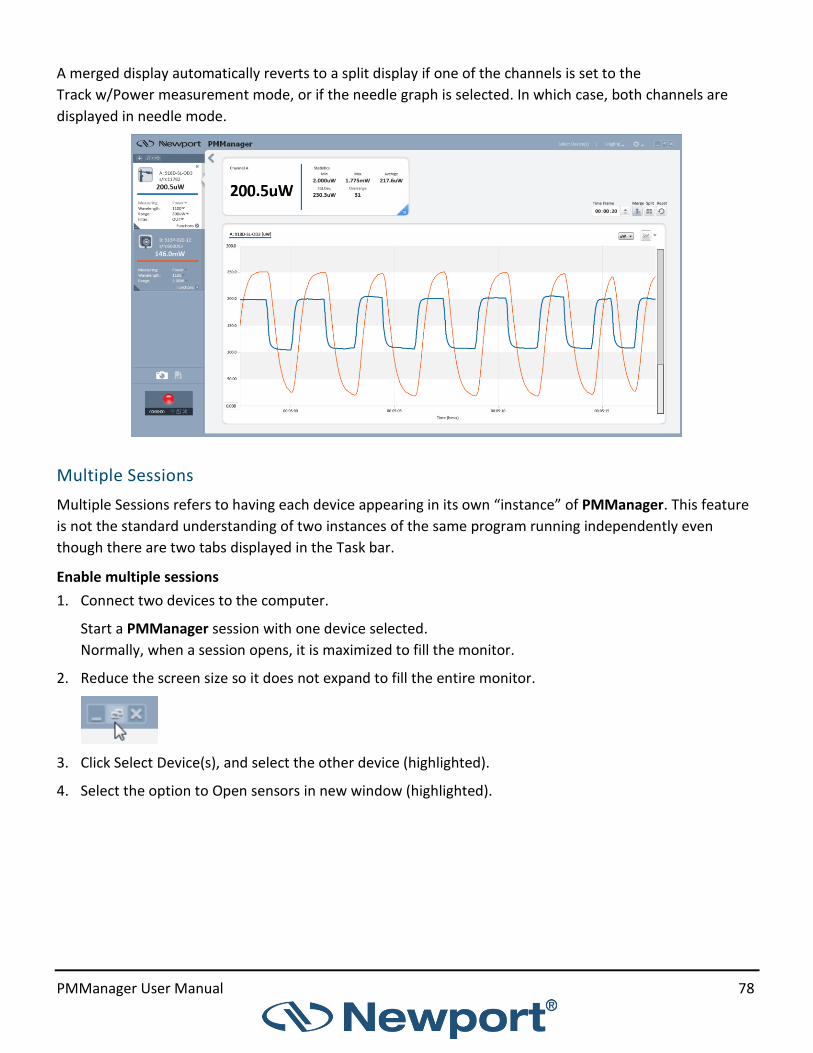
PMManager User Manual 78
A merged display automatically reverts to a split display if one of the channels is set to the
Track w/Power measurement mode, or if the needle graph is selected. In which case, both channels are
displayed in needle mode.
Multiple Sessions
Multiple Sessions refers to having each device appearing in its own “instance” of PMManager. This feature
is not the standard understanding of two instances of the same program running independently even
though there are two tabs displayed in the Task bar.
Enable multiple sessions
1. Connect two devices to the computer.
Start a PMManager session with one device selected.
Normally, when a session opens, it is maximized to fill the monitor.
2. Reduce the screen size so it does not expand to fill the entire monitor.
3. Click Select Device(s), and select the other device (highlighted).
4. Select the option to Open sensors in new window (highlighted).

PMManager User Manual 79
5. Click Open Sensors.
6. In the new open window, click in the upper right corner to reduce the display.
7. Position the screens so their displays are separate.

PMManager User Manual 80
This display method may have a purpose when certain time-related analyses are required because each
X-axis can have its own definition. Each channel is given the same default color.
However, the method does not allow performing Math Channel operations between two channels. Only
operations on the same channel are available. See Math Channels. Moreover, the option to
Capture Screen, outputs only the selected channel and not both channels.
Track w/Power
When one of the channels is set to the Track w/Power measurement mode, the graphs are forced into split
mode display, and a merged display of the graphs is not possible.
The above image shows the PEPS sensor displayed in Track w/Power mode as the orange Position graph
and power from another sensor as the Line graph in blue.
Since the focus is the orange display, the Statistics window displays the results of power measured with the
PEPS sensor.
The Graph Setup also corresponds to display in focus. In either case, Merge is disabled.
The option, Apply to All, is unavailable in this display configuration.

PMManager User Manual 81
View the List of Active Sensors
View a list of all the currently active sensors
Click Select Device(s) from the menu bar. The checked sensor is the active sensor.
Click the expand/reveal triangle to minimize the list when multiple devices are connected.
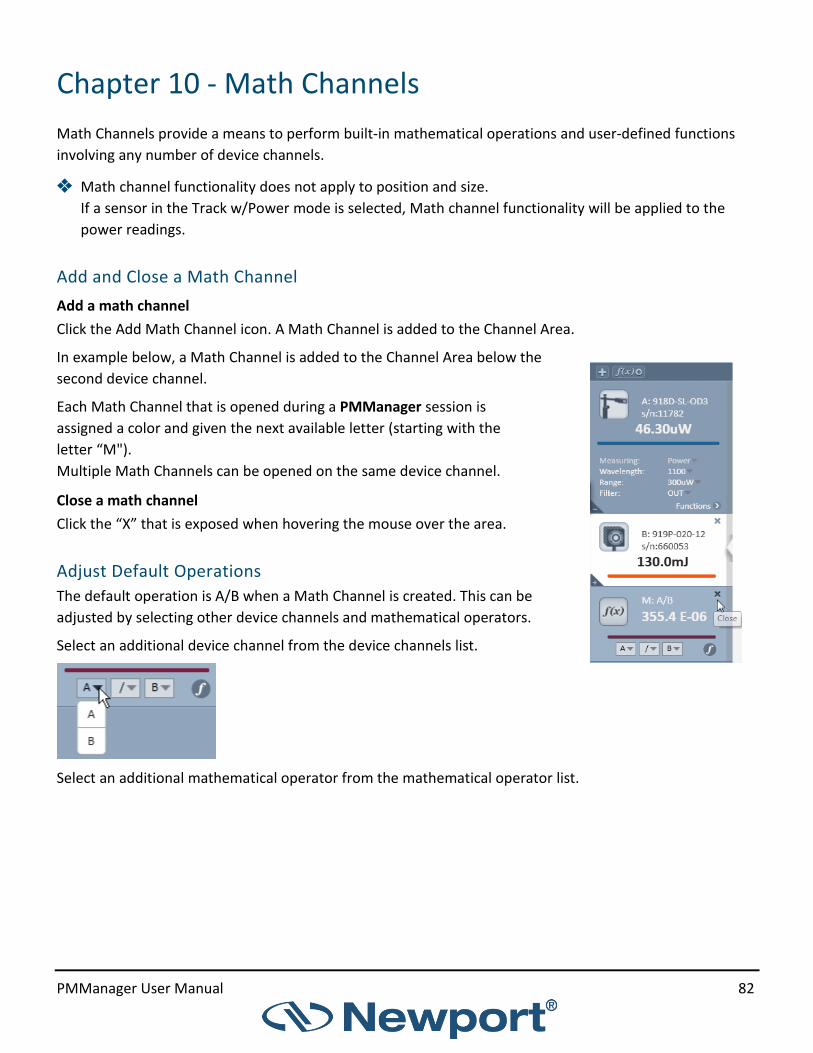
PMManager User Manual 82
Chapter 10 - Math Channels
Math Channels provide a means to perform built-in mathematical operations and user-defined functions
involving any number of device channels.
❖ Math channel functionality does not apply to position and size.
If a sensor in the Track w/Power mode is selected, Math channel functionality will be applied to the
power readings.
Add and Close a Math Channel
Add a math channel
Click the Add Math Channel icon. A Math Channel is added to the Channel Area.
In example below, a Math Channel is added to the Channel Area below the
second device channel.
Each Math Channel that is opened during a PMManager session is
assigned a color and given the next available letter (starting with the
letter “M").
Multiple Math Channels can be opened on the same device channel.
Close a math channel
Click the “X” that is exposed when hovering the mouse over the area.
Adjust Default Operations
The default operation is A/B when a Math Channel is created. This can be
adjusted by selecting other device channels and mathematical operators.
Select an additional device channel from the device channels list.
Select an additional mathematical operator from the mathematical operator list.
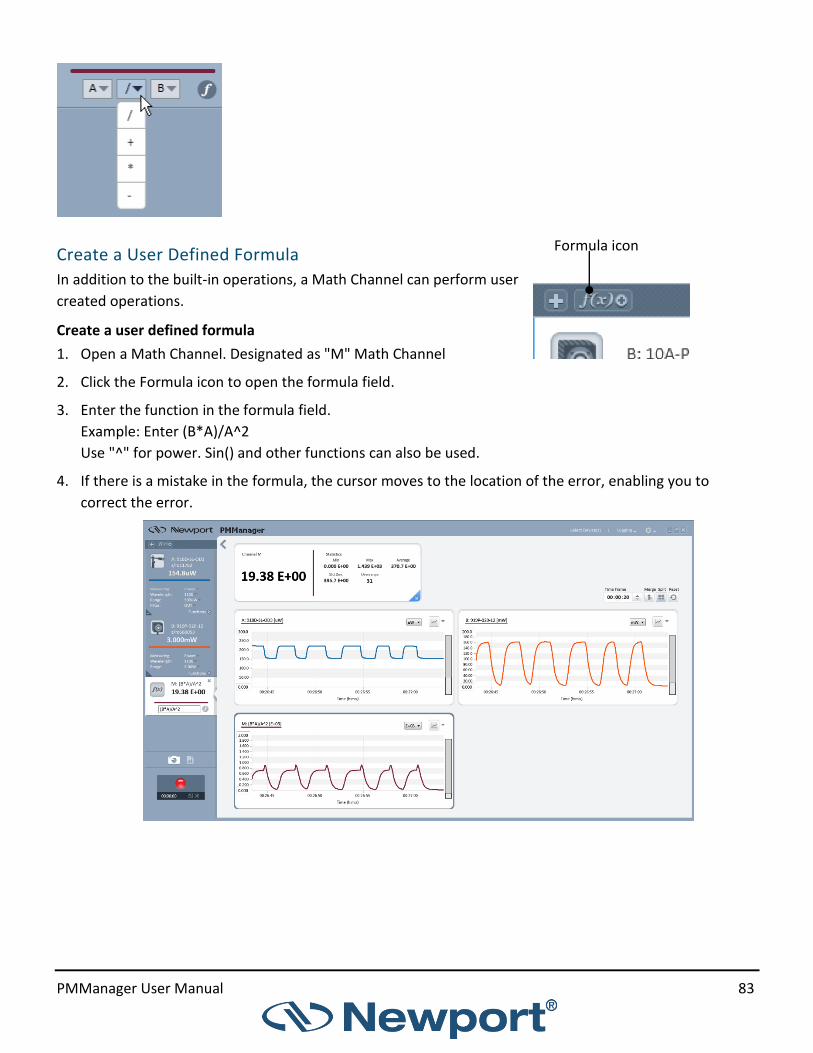
PMManager User Manual 83
Create a User Defined Formula
In addition to the built-in operations, a Math Channel can perform user
created operations.
Create a user defined formula
1. Open a Math Channel. Designated as "M" Math Channel
2. Click the Formula icon to open the formula field.
3. Enter the function in the formula field.
Example: Enter (B*A)/A^2
Use "^" for power. Sin() and other functions can also be used.
4. If there is a mistake in the formula, the cursor moves to the location of the error, enabling you to
correct the error.
Formula icon

PMManager User Manual 84
View the math result in the Statistics area
Click the colored line of the Channel “M” in the Channel Area. The example below displays the built-in
function, A/B, merged with the channels shown on the previous page.
The vertical axis control was used to bring the plots into view
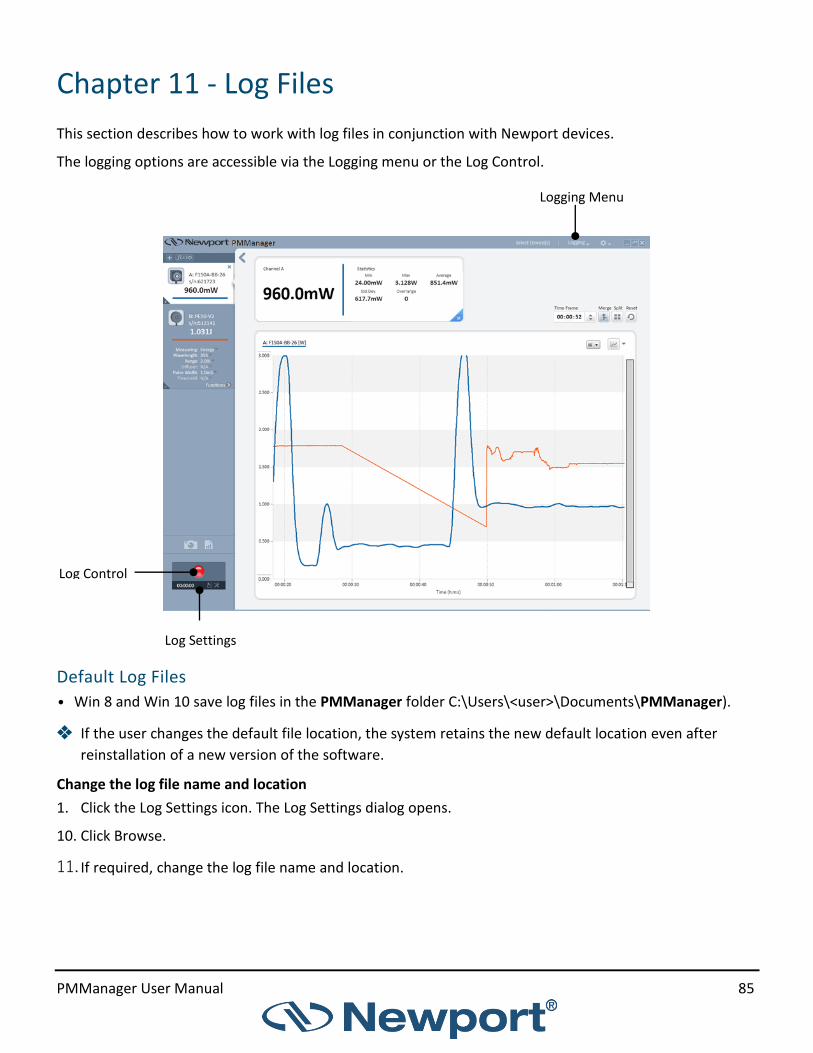
PMManager User Manual 85
Logging Menu
Chapter 11 - Log Files
This section describes how to work with log files in conjunction with Newport devices.
The logging options are accessible via the Logging menu or the Log Control.
Default Log Files
• Win 8 and Win 10 save log files in the PMManager folder C:\Users\<user>\Documents\PMManager).
❖ If the user changes the default file location, the system retains the new default location even after
reinstallation of a new version of the software.
Change the log file name and location
1. Click the Log Settings icon. The Log Settings dialog opens.
10. Click Browse.
11. If required, change the log file name and location.
Log Control
Log Settings

PMManager User Manual 86
Configure Log File Settings
It is possible to log just one screen of data, specify the duration of the log or the number of measurements
to be taken.
Log One Screen of Data Only
Log one screen of data
1. Click the Log Settings icon . The Log Settings dialog opens.
2. Check the Log one screen of date option.
3. Click Browse, and select a file location to save the log data.
❖ See Default Log Files

PMManager User Manual 87
Configure Log Duration
Configure the log duration
1. Click the Log Settings icon. The Log Settings dialog opens.
2. Clear the Log one screen of data option.
3. Select Stop after Time Out.
4. Specify the Duration.
5. When logging power readings, a time interval can be set for measurements configured to stop after
time out. The interval determines how often a measurement is taken and added to the log.
Select Sample, to log one sample per interval,
OR
Select Average, to log an average of all the readings in an interval.
6. Click Browse and select a file location to save the log data,
OR
The log data will be saved to the default file, as displayed in the File Name area.
7. Click OK to save the log settings.
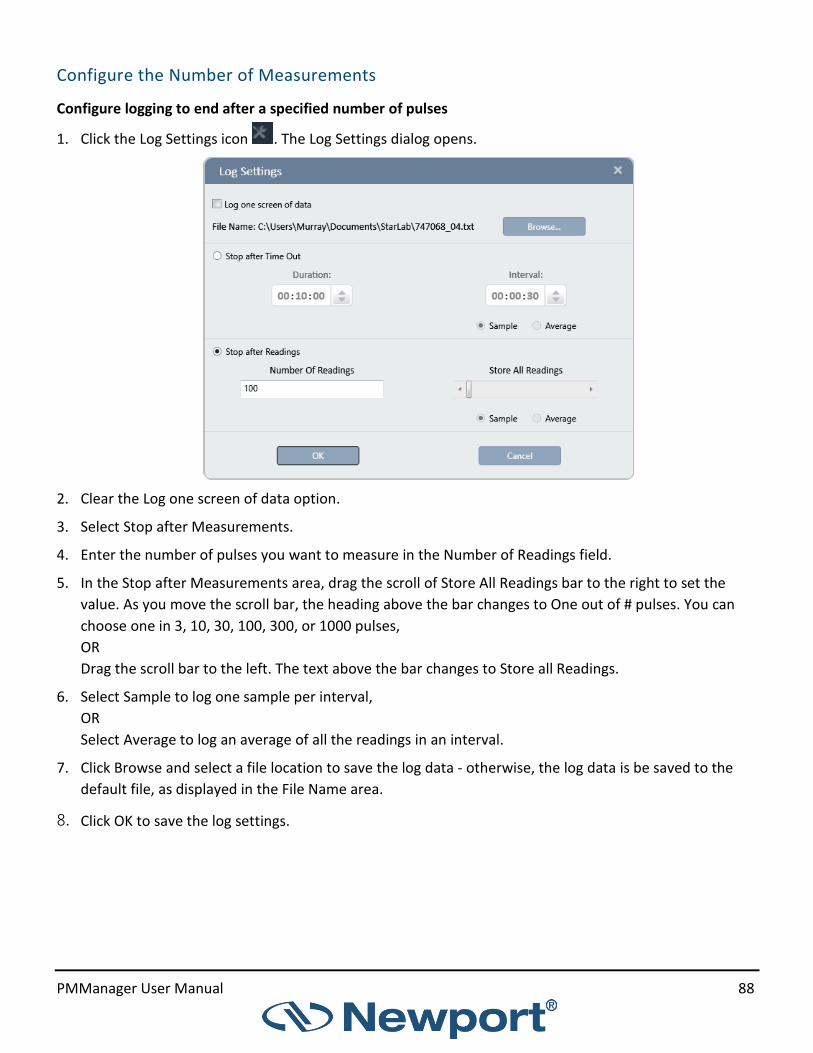
PMManager User Manual 88
Configure the Number of Measurements
Configure logging to end after a specified number of pulses
1. Click the Log Settings icon . The Log Settings dialog opens.
2. Clear the Log one screen of data option.
3. Select Stop after Measurements.
4. Enter the number of pulses you want to measure in the Number of Readings field.
5. In the Stop after Measurements area, drag the scroll of Store All Readings bar to the right to set the
value. As you move the scroll bar, the heading above the bar changes to One out of # pulses. You can
choose one in 3, 10, 30, 100, 300, or 1000 pulses,
OR
Drag the scroll bar to the left. The text above the bar changes to Store all Readings.
6. Select Sample to log one sample per interval,
OR
Select Average to log an average of all the readings in an interval.
7. Click Browse and select a file location to save the log data - otherwise, the log data is be saved to the
default file, as displayed in the File Name area.
8. Click OK to save the log settings.
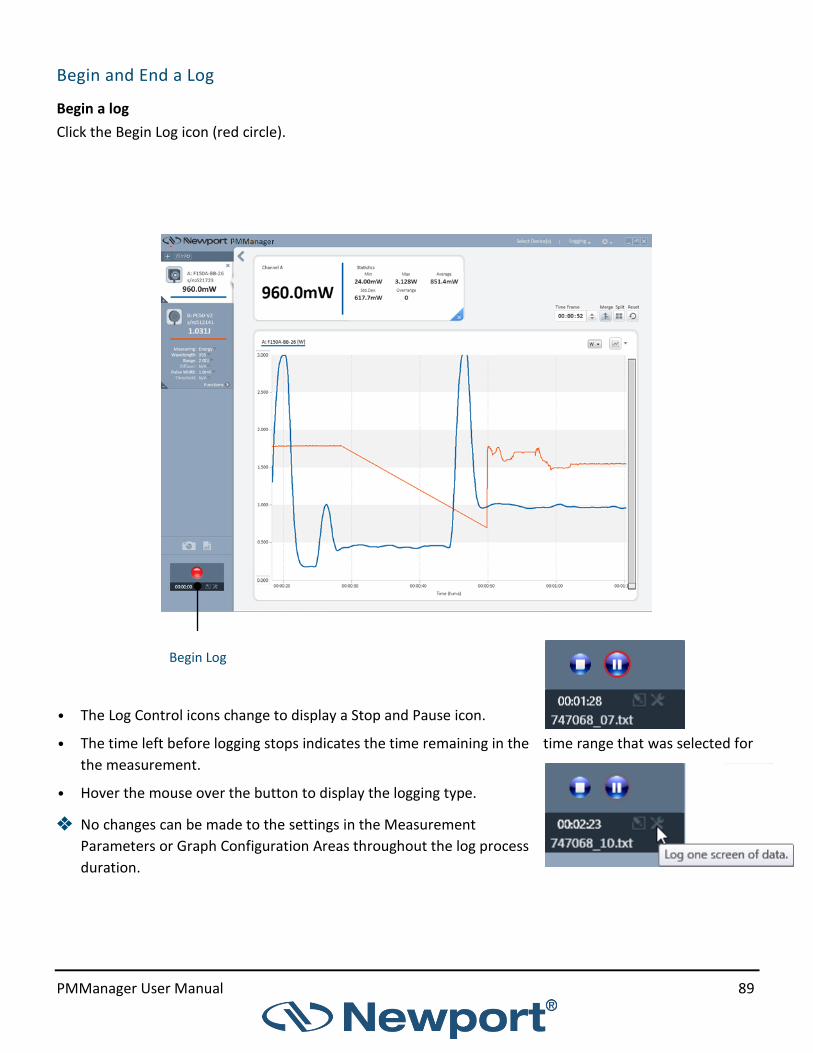
PMManager User Manual 89
Begin and End a Log
Begin a log
Click the Begin Log icon (red circle).
• The Log Control icons change to display a Stop and Pause icon.
• The time left before logging stops indicates the time remaining in the time range that was selected for
the measurement.
• Hover the mouse over the button to display the logging type.
❖ No changes can be made to the settings in the Measurement
Parameters or Graph Configuration Areas throughout the log process
duration.
Begin Log

PMManager User Manual 90
Pause a log
Click the Pause Log icon.
Restart a log
Click the Begin Log icon.
End a log
1. Wait for the log time to elapse,
or,
Click the Stop icon stop.
2. Click the show/hide arrow to view the Open File in Log Viewer, or to open the file location where the log
is stored.
It is possible to add a note to a displayed log file.
See View Log Files.
Add Notes to a Log File
Add notes to log files
1. Open the file in Log View.
The Note dialog is located at the top, below the Title bar.
2. Enter a note into the text field.
3. Click the icon to save the note to the log file.
Choose the Log File Format
Log files are stored by the PMManager application as tab-delimited text files.
Two file formats are available in the software:
• Standard
• Excel Friendly
The two formats differ only in the way the timestamp is recorded in the file.
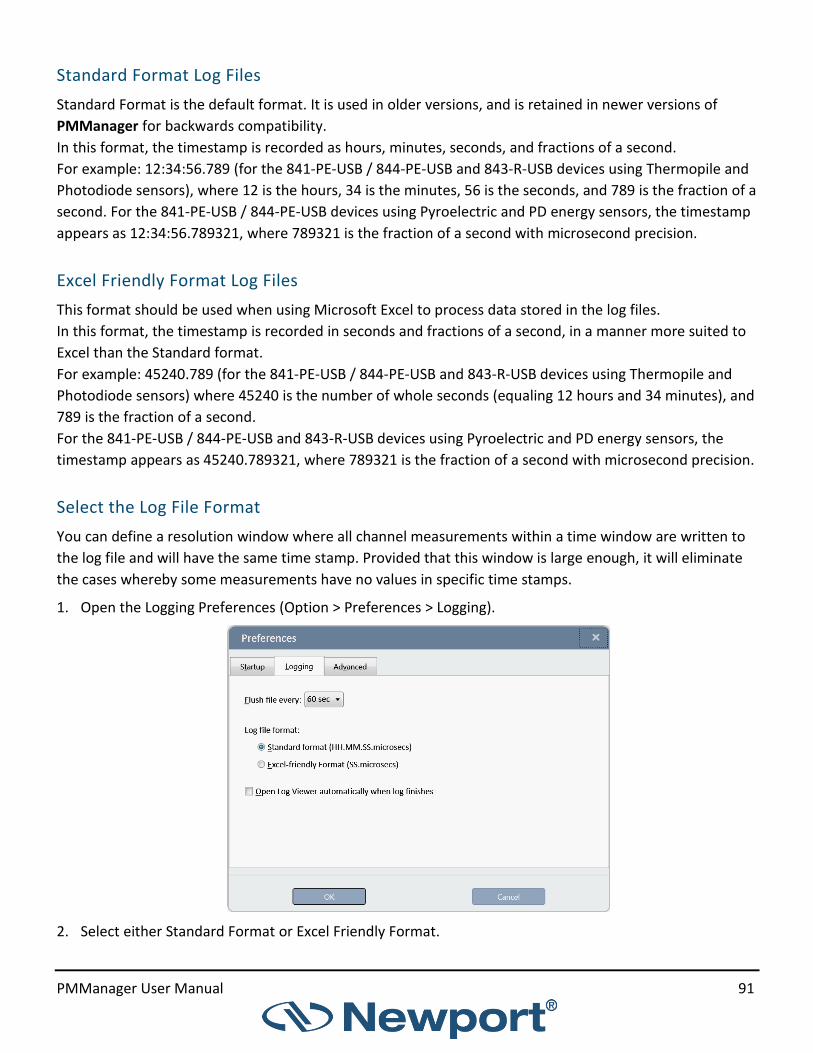
PMManager User Manual 91
Standard Format Log Files
Standard Format is the default format. It is used in older versions, and is retained in newer versions of
PMManager for backwards compatibility.
In this format, the timestamp is recorded as hours, minutes, seconds, and fractions of a second.
For example: 12:34:56.789 (for the 841-PE-USB / 844-PE-USB and 843-R-USB devices using Thermopile and
Photodiode sensors), where 12 is the hours, 34 is the minutes, 56 is the seconds, and 789 is the fraction of a
second. For the 841-PE-USB / 844-PE-USB devices using Pyroelectric and PD energy sensors, the timestamp
appears as 12:34:56.789321, where 789321 is the fraction of a second with microsecond precision.
Excel Friendly Format Log Files
This format should be used when using Microsoft Excel to process data stored in the log files.
In this format, the timestamp is recorded in seconds and fractions of a second, in a manner more suited to
Excel than the Standard format.
For example: 45240.789 (for the 841-PE-USB / 844-PE-USB and 843-R-USB devices using Thermopile and
Photodiode sensors) where 45240 is the number of whole seconds (equaling 12 hours and 34 minutes), and
789 is the fraction of a second.
For the 841-PE-USB / 844-PE-USB and 843-R-USB devices using Pyroelectric and PD energy sensors, the
timestamp appears as 45240.789321, where 789321 is the fraction of a second with microsecond precision.
Select the Log File Format
You can define a resolution window where all channel measurements within a time window are written to
the log file and will have the same time stamp. Provided that this window is large enough, it will eliminate
the cases whereby some measurements have no values in specific time stamps.
1. Open the Logging Preferences (Option > Preferences > Logging).
2. Select either Standard Format or Excel Friendly Format.

PMManager User Manual 92
❖ With the 841-PE-USB / 844-PE-USB, 1919-R, and 843-R-USB devices, using a pyroelectric or PD energy
sensor, timestamps are stored in the log file with microsecond precision (six decimal places after the
decimal point) and have a resolution of 1us.
Using a thermopile or photodiode sensors, timestamps are stored with millisecond precision.
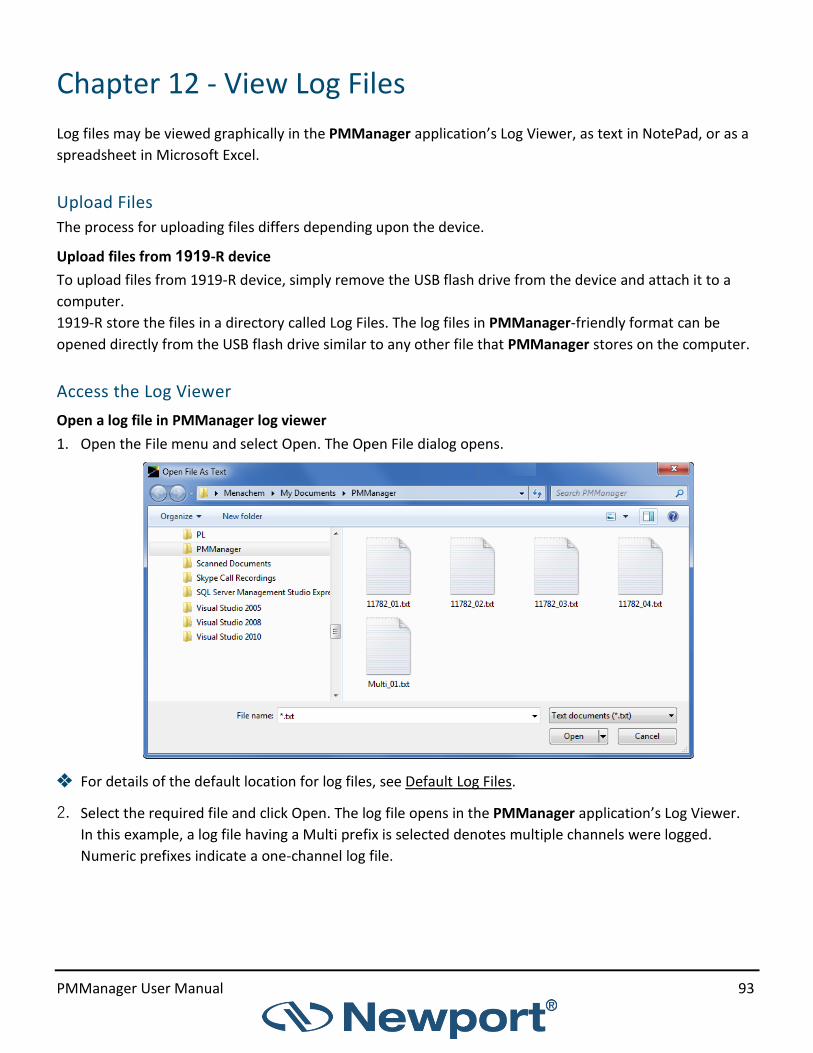
PMManager User Manual 93
Chapter 12 - View Log Files
Log files may be viewed graphically in the PMManager application’s Log Viewer, as text in NotePad, or as a
spreadsheet in Microsoft Excel.
Upload Files
The process for uploading files differs depending upon the device.
Upload files from 1919-R device
To upload files from 1919-R device, simply remove the USB flash drive from the device and attach it to a
computer.
1919-R store the files in a directory called Log Files. The log files in PMManager-friendly format can be
opened directly from the USB flash drive similar to any other file that PMManager stores on the computer.
Access the Log Viewer
Open a log file in PMManager log viewer
1. Open the File menu and select Open. The Open File dialog opens.
❖ For details of the default location for log files, see Default Log Files.
2. Select the required file and click Open. The log file opens in the PMManager application’s Log Viewer.
In this example, a log file having a Multi prefix is selected denotes multiple channels were logged.
Numeric prefixes indicate a one-channel log file.
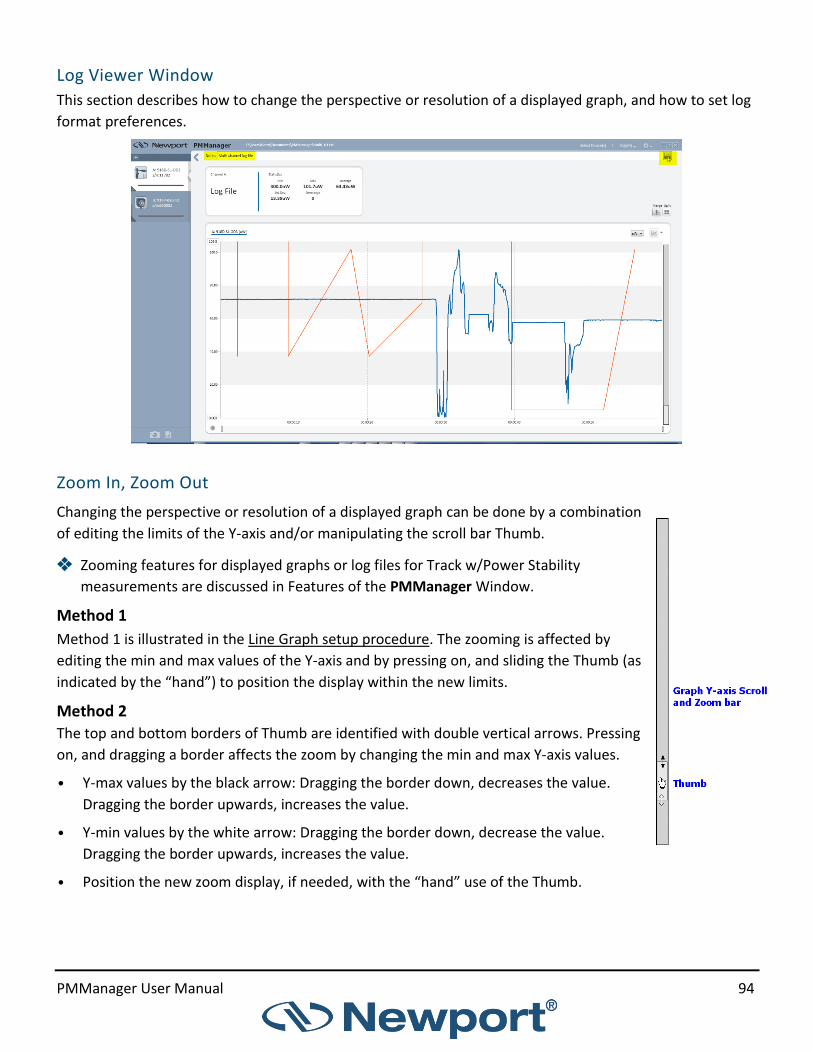
PMManager User Manual 94
Log Viewer Window
This section describes how to change the perspective or resolution of a displayed graph, and how to set log
format preferences.
Zoom In, Zoom Out
Changing the perspective or resolution of a displayed graph can be done by a combination
of editing the limits of the Y-axis and/or manipulating the scroll bar Thumb.
❖ Zooming features for displayed graphs or log files for Track w/Power Stability
measurements are discussed in Features of the PMManager Window.
Method 1
Method 1 is illustrated in the Line Graph setup procedure. The zooming is affected by
editing the min and max values of the Y-axis and by pressing on, and sliding the Thumb (as
indicated by the “hand”) to position the display within the new limits.
Method 2
The top and bottom borders of Thumb are identified with double vertical arrows. Pressing
on, and dragging a border affects the zoom by changing the min and max Y-axis values.
• Y-max values by the black arrow: Dragging the border down, decreases the value.
Dragging the border upwards, increases the value.
• Y-min values by the white arrow: Dragging the border down, decrease the value.
Dragging the border upwards, increases the value.
• Position the new zoom display, if needed, with the “hand” use of the Thumb.

PMManager User Manual 95
Reset the zoom
Change the settings in the channel area or the range in the graph configuration area.
Specify logging format preferences
The default format of a logging file is set in the Logging tab preferences.
1. In the Options menu, select Preferences. The Preferences dialog opens.
2. Click Logging.
3. Select the log file format.
4. If required, select the option to open the log file automatically when logging ends.
5. Click OK to save the settings.
View Log Files in NotePad
This section describes how to view log files in NotePad.
Open a log file in NotePad
1. Open the File menu and select Open File As Text.
The Open File dialog opens.
2. Navigate to the log files directory.
3. Select the required file, and click Open.
The log file opens in NotePad.

PMManager User Manual 96
Log Files Entries
- Portion of a 2‑ channel log file in NotePad displaying power or energy without tracking
The first paragraph identifies the PMManager, graph mode, logging time, and any note that was added by
the Add Notes to a Log File option.
The next paragraphs contain the information that describe the devices, sensors, channel association,
parameters per channel when the log measurement was made, followed by statistics for each channel.
The next section is the data that was measured. Using the First Pulse Arrived value, 11:05:23.980000 as a
basis, the times in the first column are the incremental changes in the X-axis.
After new readings on both channels have been logged, the math channel is evaluated.
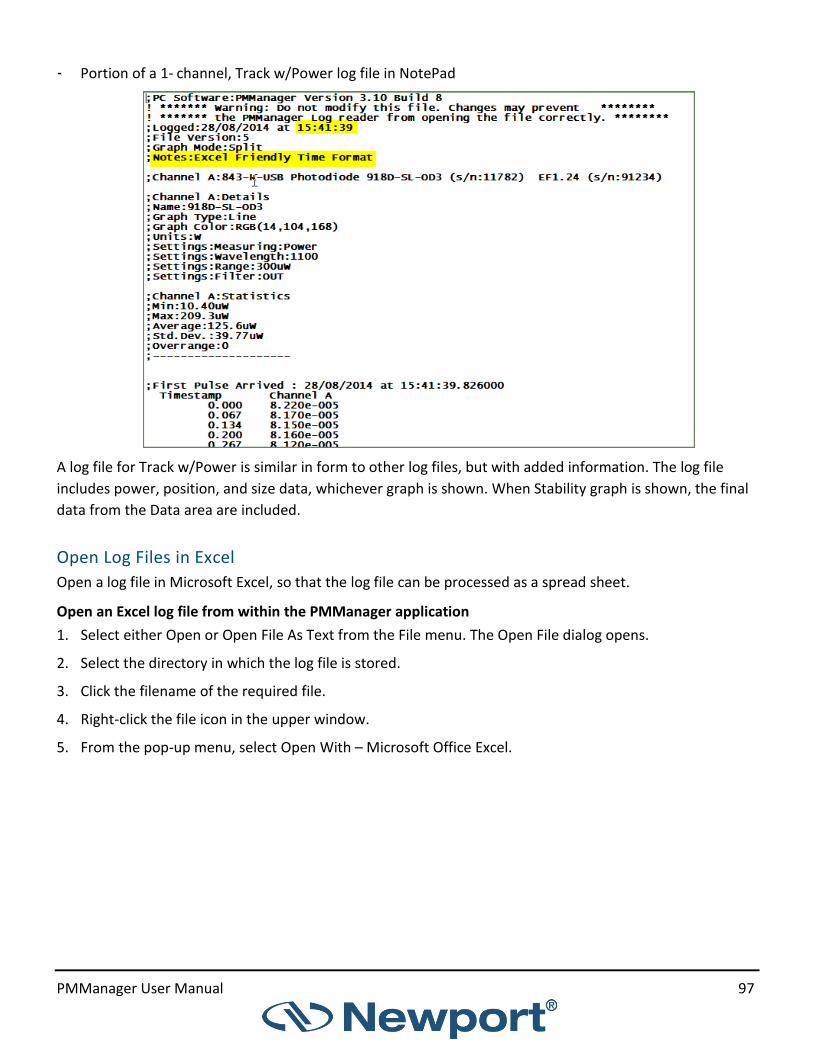
PMManager User Manual 97
- Portion of a 1‑ channel, Track w/Power log file in NotePad
A log file for Track w/Power is similar in form to other log files, but with added information. The log file
includes power, position, and size data, whichever graph is shown. When Stability graph is shown, the final
data from the Data area are included.
Open Log Files in Excel
Open a log file in Microsoft Excel, so that the log file can be processed as a spread sheet.
Open an Excel log file from within the PMManager application
1. Select either Open or Open File As Text from the File menu. The Open File dialog opens.
2. Select the directory in which the log file is stored.
3. Click the filename of the required file.
4. Right-click the file icon in the upper window.
5. From the pop-up menu, select Open With – Microsoft Office Excel.

PMManager User Manual 98
Open an Excel log file from outside the PMManager application
1. Use the Windows Explorer to locate and select the log file.
2. Right-click the file name, and select Open With from the pop-up menu, and select Microsoft Excel from
the sub menu.
3. The log file opens inside Excel as a spread sheet with two active columns: Energy in joules and
Timestamp in seconds.
Open a standard format log file in Excel
A log file stored in the standard format can also be opened using Microsoft Excel, but it is more difficult
than opening a log file stored in Excel Friendly format. For more details, refer to the Microsoft Excel Help
section.
1. From the Windows taskbar, select Start – All Programs – Microsoft Excel to open Microsoft Excel from
Windows. Microsoft Excel opens.
2. In Excel, from the menu select File – Open. The File Open dialog opens.
3. In the Files of Type area, select Text files.
4. Navigate to the directory in which the log file is located (see section Default Location and Name for Log
Files; by default, the PMManager application directory is under \Program Files\Newport Optronics).
Select the log file icon and click Open. The Text Import Wizard opens.
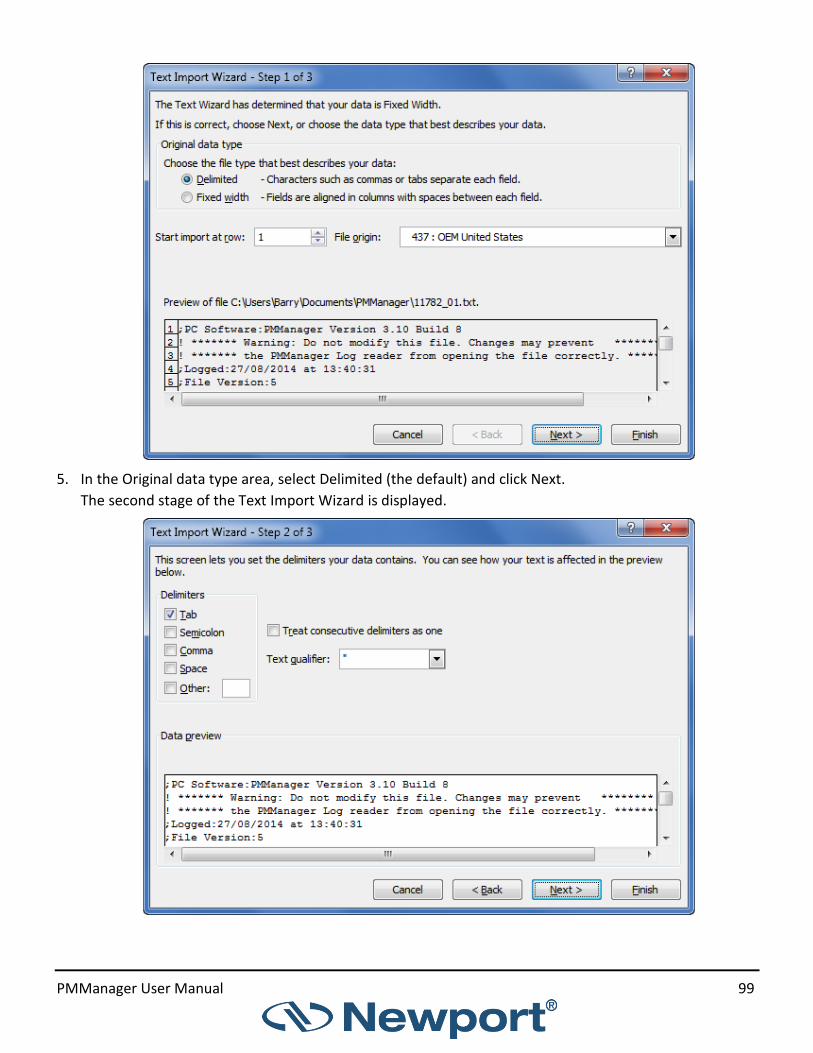
PMManager User Manual 99
5. In the Original data type area, select Delimited (the default) and click Next.
The second stage of the Text Import Wizard is displayed.

PMManager User Manual 100
6. In the Delimiters area, check Tab (the default.)
7. Click Finish. The log file opens as a spread sheet.

PMManager User Manual 101
Chapter 13 - Preferences and Features
Save Sensor Settings
PMManager provides a range of sensor optimization options that can be adjusted to deliver the most
accurate readings. Whenever you change the value of a parameter in Settings, it is saved as the value for
this parameter to be used the next time this sensor is connected.
For more information on configuring and optimizing measurement settings for the various sensor types, see
the following:
• Measuring with Thermopile Sensors
• Measuring with Photodiode Sensors
• Measuring with Pyroelectric and PD Energy Sensors
Preferences
1. Click the Preferences icon in the title bar, and select Preferences.
The Preferences dialog opens consisting of four-tabs:
• StartUp
• Communication
• Logging
• Advanced

PMManager User Manual 102
StartUp
The table below describes the Startup options
Option Description
Restart devices on application startup
When PMManager begins, all connected devices are restarted
Show Select Device dialog When selected, always show Select Device(s) window when PMManager starts.
Open all sensors When selected, connects to all devices without showing Select Device(s) window
Open last configuration When selected, uses previous PMManager configuration settings.
Select configuration file When selected, enables the buttons Browse and Save current configuration. • Use browse to load an existing config file • To create a new config file, enter the file name in the text
field, and click Save current config

PMManager User Manual 103
In addition to Open last configuration and Open fixed configuration in the StartUp preferences you can also
save, and later open, multiple configurations from the Configuration drop down menu.
Communication
There are three communication options.
• Use USB Devices
• Use Wireless Devices
• Use Ethernet Devices
When an option is selected, that device(s) is included in the Select Devices(s) searching.
Click to select which found device(s) are to be used in the current session.
Logging
Navigate to the Logging tab to specify the logging preferences

PMManager User Manual 104
The table below describes the Logging options
Option Description
Flush file every Set PMManager to zero log file every 60 (default), 10, and 3 seconds
Log file format Set log format as either Excel-type (default) or standard
Open Log Viewer automatically when log finishes
Have Log View automatically open when log is finished
Advanced
Navigate to the Advanced tab to specify how PMManager handles firmware downgrade and software
graphics rendering.
Option Description
Allow firmware downgrade Allows loading a firmware version that is lower than the installed firmware in the device. See, Upgrade Internal Software
Use software graphics rendering Use of this option if PMManager displays any graphic anomalies
Export and Print a Screen Capture
It is possible to capture a PMManager window as .png file or send it to print.
❖ The entire screen is captured except the Function dialog.
This option works with active measurement sessions and when viewing a log file.
Export a screen capture as a PNG file
1. Click the camera icon. A dialog opens overlaying the screen that includes the captured screen and
option buttons.

PMManager User Manual 105
2. To save to a PNG file, click .
The Save dialog opens. By default the files are saved in the StartLab folder:
\User\My Documents\PMManager.
If required, change file location.
3. Enter a file name.
4. Click Save.
5. Enter the file name in the File name field.
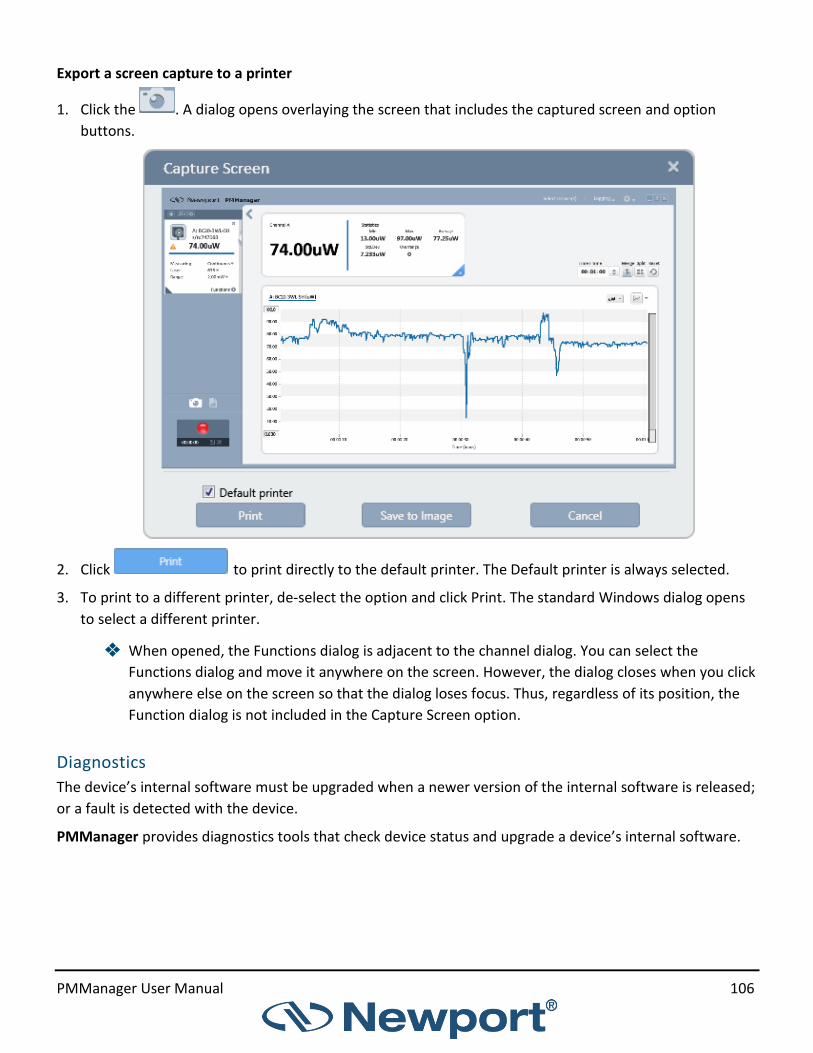
PMManager User Manual 106
Export a screen capture to a printer
1. Click the . A dialog opens overlaying the screen that includes the captured screen and option
buttons.
2. Click to print directly to the default printer. The Default printer is always selected.
3. To print to a different printer, de-select the option and click Print. The standard Windows dialog opens
to select a different printer.
❖ When opened, the Functions dialog is adjacent to the channel dialog. You can select the
Functions dialog and move it anywhere on the screen. However, the dialog closes when you click
anywhere else on the screen so that the dialog loses focus. Thus, regardless of its position, the
Function dialog is not included in the Capture Screen option.
Diagnostics
The device’s internal software must be upgraded when a newer version of the internal software is released;
or a fault is detected with the device.
PMManager provides diagnostics tools that check device status and upgrade a device’s internal software.

PMManager User Manual 107
Upgrade Internal Software
Upgrade a device’s internal firmware
1. Open the Select Device(s) dialog screen and click Diagnostics in the title bar.
2. Click the Upgrade button
2. Click Browse to locate the file.
PMManager recognizes the correct file if it is located in the selected folder.
3. Click Start to begin the upgrade.
The upgrade progress (erasing, programming, finished) is displayed in progress bars.
PMManager generates a message if the device is loaded with a more recent version of firmware.
ⓘ Downgrading may cause degradation in performance and is not recommended.
See Allow firmware downgrade.
When complete, click Done to close the update window.
The Upgrade option becomes disabled and a flashing message is displayed, at the bottom of the Diagnostics
window, with instructions on how to repeat the upgrade if required.
Please visit Newport’s website (www.Newportopt.com), for the latest device firmware information.
Upgrade Sensor Software
The PEPS series of Thermopile sensors contain software to support their position and size measurement
capabilities. Similarly, new thermopile sensors also contain software in the sensor itself.
Upgrade the sensor software
1. Click Upgrade Sensor. The Upgrade Sensor Software dialog window opens.

PMManager User Manual 108
2. Click Browse to locate and select the bin file for the sensor.
3. Click Start to begin the upgrade.
• If the bin file has already been upgraded, a message asks if you wish to continue.
• The upgrade progress (erasing, programming, finished) is displayed in progress bars
Access Help
Access the PMManager Help
1. Do one of the following:
• Select Options Cogwheel -> Help
• The PMManager Help module appears.
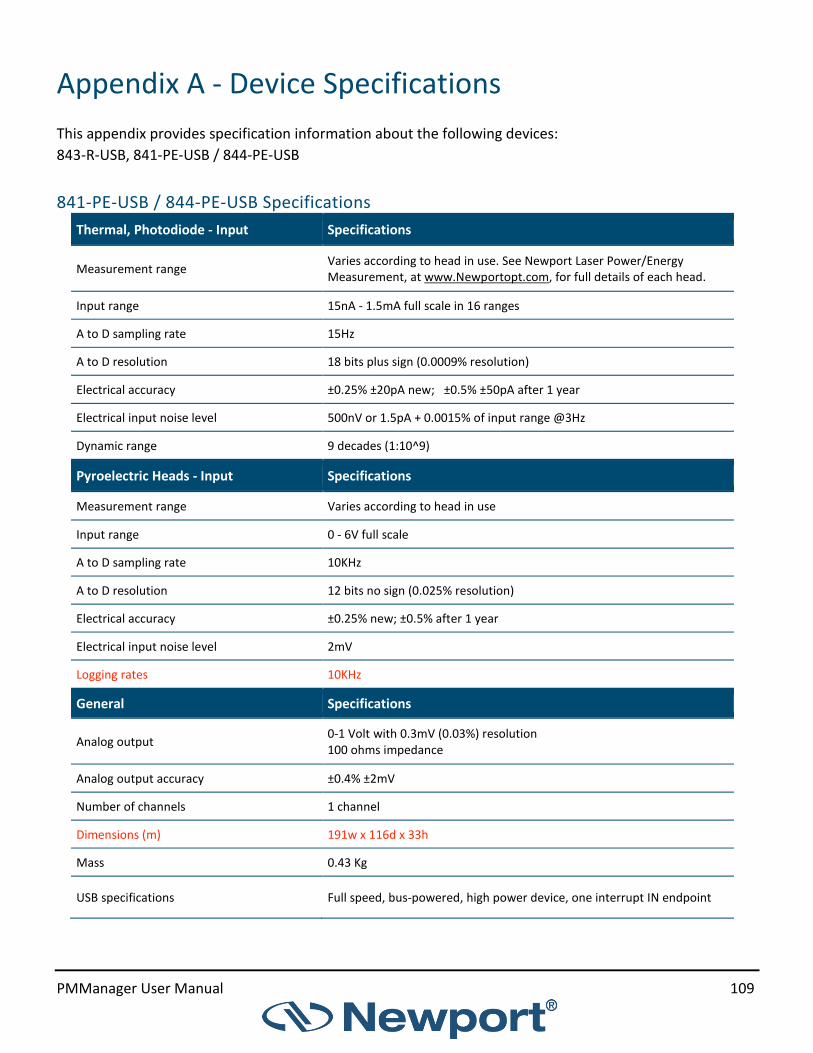
PMManager User Manual 109
Appendix A - Device Specifications
This appendix provides specification information about the following devices:
843-R-USB, 841-PE-USB / 844-PE-USB
841-PE-USB / 844-PE-USB Specifications
Thermal, Photodiode - Input Specifications
Measurement range Varies according to head in use. See Newport Laser Power/Energy Measurement, at www.Newportopt.com, for full details of each head.
Input range 15nA - 1.5mA full scale in 16 ranges
A to D sampling rate 15Hz
A to D resolution 18 bits plus sign (0.0009% resolution)
Electrical accuracy ±0.25% ±20pA new; ±0.5% ±50pA after 1 year
Electrical input noise level 500nV or 1.5pA + 0.0015% of input range @3Hz
Dynamic range 9 decades (1:10^9)
Pyroelectric Heads - Input Specifications
Measurement range Varies according to head in use
Input range 0 - 6V full scale
A to D sampling rate 10KHz
A to D resolution 12 bits no sign (0.025% resolution)
Electrical accuracy ±0.25% new; ±0.5% after 1 year
Electrical input noise level 2mV
Logging rates 10KHz
General Specifications
Analog output 0-1 Volt with 0.3mV (0.03%) resolution 100 ohms impedance
Analog output accuracy ±0.4% ±2mV
Number of channels 1 channel
Dimensions (m) 191w x 116d x 33h
Mass 0.43 Kg
USB specifications Full speed, bus-powered, high power device, one interrupt IN endpoint

PMManager User Manual 110
843-R-USB Specifications
Thermal, Photodiode - Input Specifications
Input range 15nA - 1.5mA full scale in 16 ranges
A to D sampling rate 15Hz
A to D resolution 18 bits plus sign
Electrical accuracy ±0.25% ±20pA new; ±0.5% ±50pA after 1 year
Electrical input noise level 500nV or 1.5pA + 0.0015% of input range @3Hz
Dynamic range 9 decades (1:10^9)
Pyroelectric Sensors - Input Specifications
Input range 0 - 6V full scale
A to D sampling rate 500Hz
A to D resolution 12 bits no sign (0.025% resolution)
Electrical accuracy ±0.25% new; ±0.5% after 1 year
Electrical input noise level 2mV
General Specifications
Detector compatibility Thermopile (including PEPS), photodiode and pyroelectric (PE-C)
PC interface (optional) USB
Analog output 1v full-scale; 0.03% resolution. 100 ohms impedance
Analog output accuracy ±0.2% (of reading) ±0.3% of full scale volts
Dimensions (m) 114w x 41d x 212h
Mass 0.47 Kg
Display 320 x 240 pixel TFT LCD; Active area ~70 x ~52 mm
Display digital height 15 mm
LCD lighting LED: Operates from charger or battery Lighting level can be adjusted between 3 levels using on/off button.
Bargraph segments 310
Battery 2x Li-Ion 3.7V, 5.2Amp-hour battery pack built-in
Charger input DC 12-16v, 1W Charge time approx. 5 hours Automatically stops charging when battery is full

PMManager User Manual 111
Thermal, Photodiode - Input Specifications
Operation between charges • With low backlight: Thermal, Photodiode 19, Pyroelectric 16 • With medium backlight: Thermal/Photodiode 17, Pyroelectric 15 • With high backlight: Thermal/Photodiode 15, Pyroelectric 13
1919-R Specifications
Thermal, Photodiode - Input Specifications
Input range 15nA - 1.5mA full scale in 16 ranges
A to D sampling rate 15Hz
A to D resolution 18 bits plus sign
Electrical accuracy ±0.25% ±20pA new; ±0.5% ±50pA after 1 year
Electrical input noise level 500nV or 1.5pA + 0.0015% of input range @3Hz
Dynamic range 9 decades (1:10^9)
Pyroelectric Sensors - Input Specifications
Input range 0 - 6V full scale
A to D sampling rate 500Hz
A to D resolution 12 bits no sign (0.025% resolution)
Electrical accuracy ±0.25% new; ±0.5% after 1 year
Electrical input noise level 2mV
General Specifications
Detector compatibility Thermopile (including PEPS), photodiode and pyroelectric (PE-C)
PC interface (optional) USB; RS232 (max baud rate 115200)
Analog output 1v full-scale; 0.03% resolution. 100 ohms impedance
Analog output accuracy ±0.2% (of reading) ±0.3% of full scale volts
Dimensions (m) 114w x 41d x 212h
Mass 0.47 Kg
Display 320 x 240 pixel TFT LCD; Active area ~70 x ~52 mm
Display digital height 15 mm
LCD lighting LED: Operates from charger or battery Lighting level can be adjusted between 3 levels using on/off button.
Bargraph segments 310

PMManager User Manual 112
Thermal, Photodiode - Input Specifications
Battery 2x Li-Ion 3.7V, 5.2Amp-hour battery pack built-in
Charger input DC 12-16v, 1W Charge time approx. 5 hours Automatically stops charging when battery is full
Operation between charges
• With low backlight: Thermal, Photodiode 19, Pyroelectric 16 • With medium backlight: Thermal/Photodiode 17, Pyroelectric 15 • With high backlight: Thermal/Photodiode 15, Pyroelectric 13
❖ Battery charge will be depleted faster if a USB flash drive is left plugged in the 1919-R meter.
Data Logging Specifications
Log period 1 sec to 1000 hours
Max points stored onboard per file Limited only by USB capacity
Max points direct to PC file in real time Unlimited
Max points stored onboard Limited only by USB capacity
Real time logging of power 15Hz Onboard, USB, RS232
Real time logging of energy 5000Hz Onboard, USB; 30Hz RS232

PMManager User Manual 113
Appendix B – Calibration, Traceability, and Recalibration
Newport develops three main types of sensors: thermopile, photodiode, and pyroelectric. Each type of
sensor needs to be calibrated and recalibrated in a specific way.
Newport Thermopile Sensors
Newport develops two kinds of thermopile sensors – Surface Absorbers and Volume Absorbers. This section
describes the range of both kinds of Newport thermopile sensors.
Surface Absorbers
BB (Broadband) Absorber
A special refractory coating is used to provide high absorption from the UV through to the IR on standard,
high power density, broadband monitor sensors. This coating withstands very high power densities (up to
20 kW/cm²) without changing calibration. The absorption ability of this coating is above 90% for most of its
range.
EX (Excimer) Absorber
The EX Absorber provides high absorption in the UV, and can withstand both the pulse energies and the
average power of excimer lasers. These discs also have excellent absorption for 10.6m and other
wavelengths. Consequently, they can also be used for other types of lasers.
LP1 (long pulse) Absorber
This absorber has a very high damage threshold for long pulse (ms) or continuous lasers and is therefore
offered for use with high power and energy lasers. It is calibrated for the spectral range
250-2200nm with some sensors also being calibrated for 2940nm. It is not suitable for long wavelength CO2
operation.
LP (Long Pulse) Absorber
The LP Absorber has a particularly high damage threshold for long pulse (ms), or continuous lasers and is
therefore offered for use with high power sensors. It is calibrated for use with the YAG laser at 1.064m, or
the CO2 laser at 10.6m, and absorbs about 90% at these wavelengths.
Volume Absorbers
P (Pulse) Type Absorber
The models with the P suffix, are used with pulsed lasers, and have a special absorbing glass with an
absorbance of 95 +2% over the operating range. Since the surface is glass, its reflectivity does not change
even if damaged or melted locally.
HE/HE1 (High Energy) Absorber
The HE and HE1 Absorbers have a particularly high damage threshold for pulsed and repetitively pulsed
lasers, of both the short and long pulse variety. The HE and HE1 Absorbers are useful where the highest
pulse energies and average powers are used.
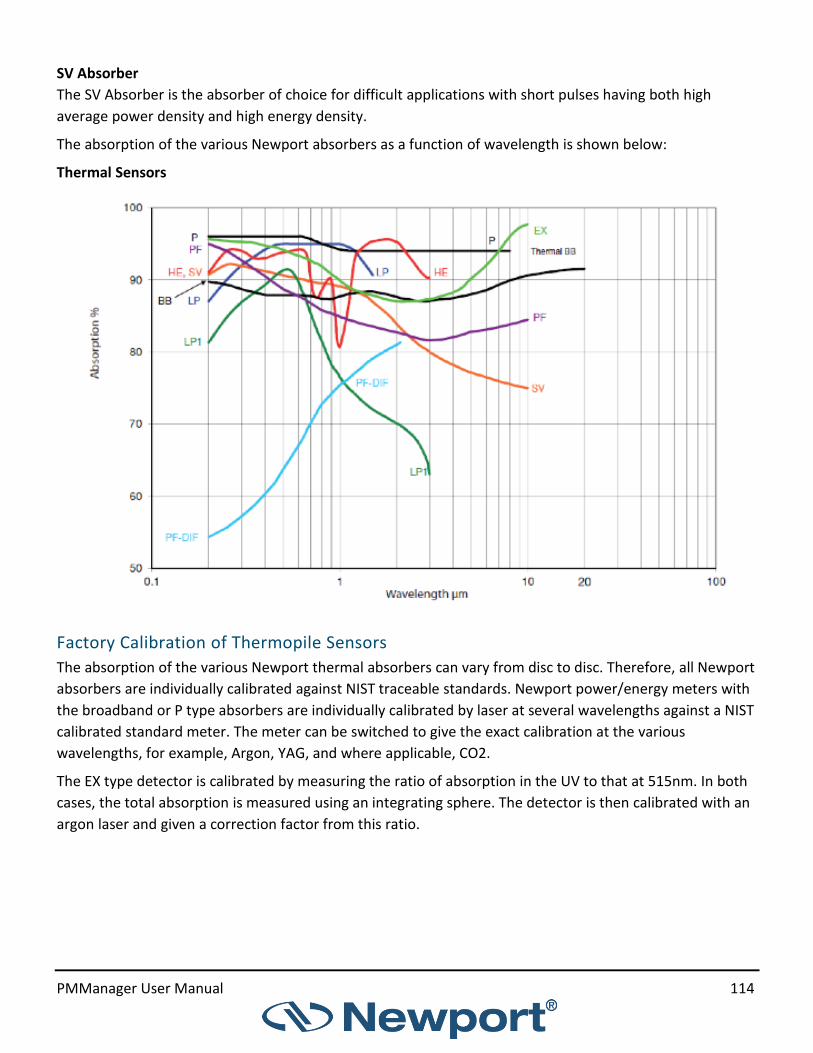
PMManager User Manual 114
SV Absorber
The SV Absorber is the absorber of choice for difficult applications with short pulses having both high
average power density and high energy density.
The absorption of the various Newport absorbers as a function of wavelength is shown below:
Thermal Sensors
Factory Calibration of Thermopile Sensors
The absorption of the various Newport thermal absorbers can vary from disc to disc. Therefore, all Newport
absorbers are individually calibrated against NIST traceable standards. Newport power/energy meters with
the broadband or P type absorbers are individually calibrated by laser at several wavelengths against a NIST
calibrated standard meter. The meter can be switched to give the exact calibration at the various
wavelengths, for example, Argon, YAG, and where applicable, CO2.
The EX type detector is calibrated by measuring the ratio of absorption in the UV to that at 515nm. In both
cases, the total absorption is measured using an integrating sphere. The detector is then calibrated with an
argon laser and given a correction factor from this ratio.

PMManager User Manual 115
Linearity and Accuracy of Thermopile Sensors
Linearity
The linearity of most Newport thermal detectors is specified to be 1% over the specified power range of
each particular instrument, and is periodically tested by Newport.
For models whose linearity is not tested over their entire range, samples are randomly chosen and
periodically tested over their entire range. The test is performed with a high power laser that covers the
entire detector range using a rear leak detector for comparison. The rear leak detector is a low power
Newport detector that has previously been tested for linearity. In all cases, the linearity of the detectors is
traceable to electrical standards.
Accuracy of Calibration
Since the instruments are calibrated against NIST standards, the accuracy is generally 1% at the power level
at which the calibration has been performed. This accuracy has been verified by checking the scatter of the
results when several instruments are calibrated against the same standard. The maximum measurement
error is less than the sum of the specified accuracy and linearity. Since the linearity is also 1%, the maximum
error in measurement is generally less than 2%.
See http://www.Newportopt.com/laser-measurement-instruments/laser-power-energy-
meters/tutorial/calibration-procedure for a complete analysis of Newport calibration accuracy.
Adjust the power calibration for one wavelength only
1. Apply known laser power and wait for measurement to stabilize.
2. Select Calibrate (Options > Advanced Functions > Calibrate)
The Adjust Calibration Factors dialog opens.

PMManager User Manual 116
The Original area displays the original Measurement, Overall Sensitivity and Laser Factor fields. The
Current wavelength is displayed beneath the Original area.
3. Adjust the Laser Specific Factor until the Adjusted measurement equals the power applied to the
sensor.
Adjusting the Laser Specific Factor effects both the Measurement and the Laser Factor values.
4. Click Save to save the adjustment for the active channel.
❖ For units that have different calibration factors (e.g., CO2, YAG, or VIS), select the correct laser
wavelength from the main Configuration Area before calibration. Only the calibration of the chosen
laser wavelength changes.
For more information on calibrating all wavelengths proportionately, refer to Factory Calibration of
Thermopile Sensors.
❖ Changing power calibration also changes energy calibration proportionately. However, changing the
energy calibration does not change the power calibration.
Recalibration from a Known Source of Laser Energy
Newport sensors are equipped with one overall energy calibration factor.
Recalibrate from a known source of laser energy
1. Apply the known laser energy. Select Calibrate (Options > Advanced Functions > Calibrate)
The Adjust Calibration Factor dialog opens
The Original area displays the original Measurement and Calibration Factor fields.
The Current wavelength is displayed beneath the Original area.
2. Adjust the Calibration Factor until the Adjusted measurement equals the energy applied to the
sensor.
3. Click Save to save the adjustment for the active channel.
PMManager User Manual 117
❖ For units that have different calibration factors (e.g., CO2, YAG, or VIS), select the correct laser
wavelength from the main Configuration Area before calibration.
❖ Changing energy calibration at one wavelength will affect all other wavelengths proportionately.
However, changing the energy calibration will not change the power calibration.
Newport Photodiode Sensors
This section discusses calibration of Newport photodiode sensors.
Factory Calibration of Photodiode Sensors
Photodiode detectors are inherently very linear but also have a large variation in sensitivity with
wavelength. In addition, the Newport model PD300 is equipped with both a built in filter and removable
filter to allow measurement of higher powers without detector saturation. These filters also have a
transmission that depends on wavelength. Therefore, the PD300 has a built in calibration adjustment for
wavelength.
The sensitivity of various Newport photodiode sensors can vary from one to another as well as with
wavelengths. Therefore, Newport photodiode detectors are individually calibrated against NIST traceable
standards over the entire operating range of wavelengths for both filter out and filter in. The calibration
curve is normalized to the correct absolute calibration at 632.8 nm using a HeNe laser against a reference
meter traceable to NIST.
The spectral sensitivity curve of the detector and the spectral transmission curve of the filters are fed into
the sensor EEROM. This information is used to set the gain to the proper value at wavelengths other than
the wavelength at which the instrument was calibrated. When the user selects his wavelength on the
instrument, the correction factor for that wavelength is applied.
Linearity and Accuracy of Photodiode Sensors
Since the instruments are calibrated against NIST standards, the accuracy is generally ±2% at the
wavelength that the calibration has been performed. The maximum error in measurement will be less than
the sum of:
calibration accuracy + linearity + inaccuracy due to errors in the wavelength curve + variations in gain with
temperature
The linearity of the photodiode detector is extremely high and errors due to this factor can be ignored.
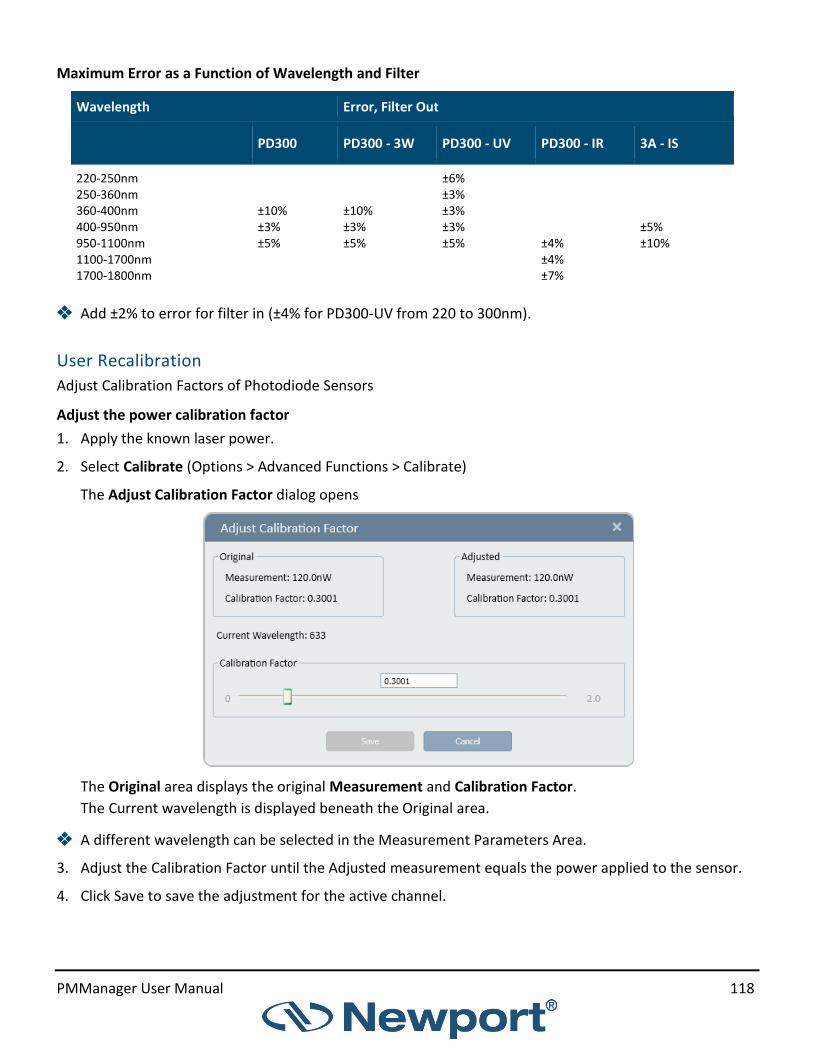
PMManager User Manual 118
Maximum Error as a Function of Wavelength and Filter
Wavelength Error, Filter Out
PD300 PD300 - 3W PD300 - UV PD300 - IR 3A - IS
220-250nm 250-360nm 360-400nm 400-950nm 950-1100nm 1100-1700nm 1700-1800nm
±10% ±3% ±5%
±10% ±3% ±5%
±6% ±3% ±3% ±3% ±5%
±4% ±4% ±7%
±5% ±10%
❖ Add ±2% to error for filter in (±4% for PD300-UV from 220 to 300nm).
User Recalibration
Adjust Calibration Factors of Photodiode Sensors
Adjust the power calibration factor
1. Apply the known laser power.
2. Select Calibrate (Options > Advanced Functions > Calibrate)
The Adjust Calibration Factor dialog opens
The Original area displays the original Measurement and Calibration Factor.
The Current wavelength is displayed beneath the Original area.
❖ A different wavelength can be selected in the Measurement Parameters Area.
3. Adjust the Calibration Factor until the Adjusted measurement equals the power applied to the sensor.
4. Click Save to save the adjustment for the active channel.

PMManager User Manual 119
❖ The relative readings at different wavelengths are fixed by the wavelength calibration curve stored in
the sensor EEROM. When changing the calibration at one wavelength, the calibration at all other
wavelengths changes proportionately.
Newport Pyroelectric PD Energy Sensors
This section discusses calibration of Newport pyroelectric sensors. Two types of absorber surface are used
in Newport pyroelectric measuring sensors:
• Metallic
• Broadband
Metallic
Metallic sensors do not have a BB suffix in the sensor name. They have a partially reflective multi-layer
metallic coating that absorbs approximately 50% of the laser pulse (see image below).
The metallic coating permits very high repetition rates, up to 5000Hz, as well as relatively high damage
threshold.
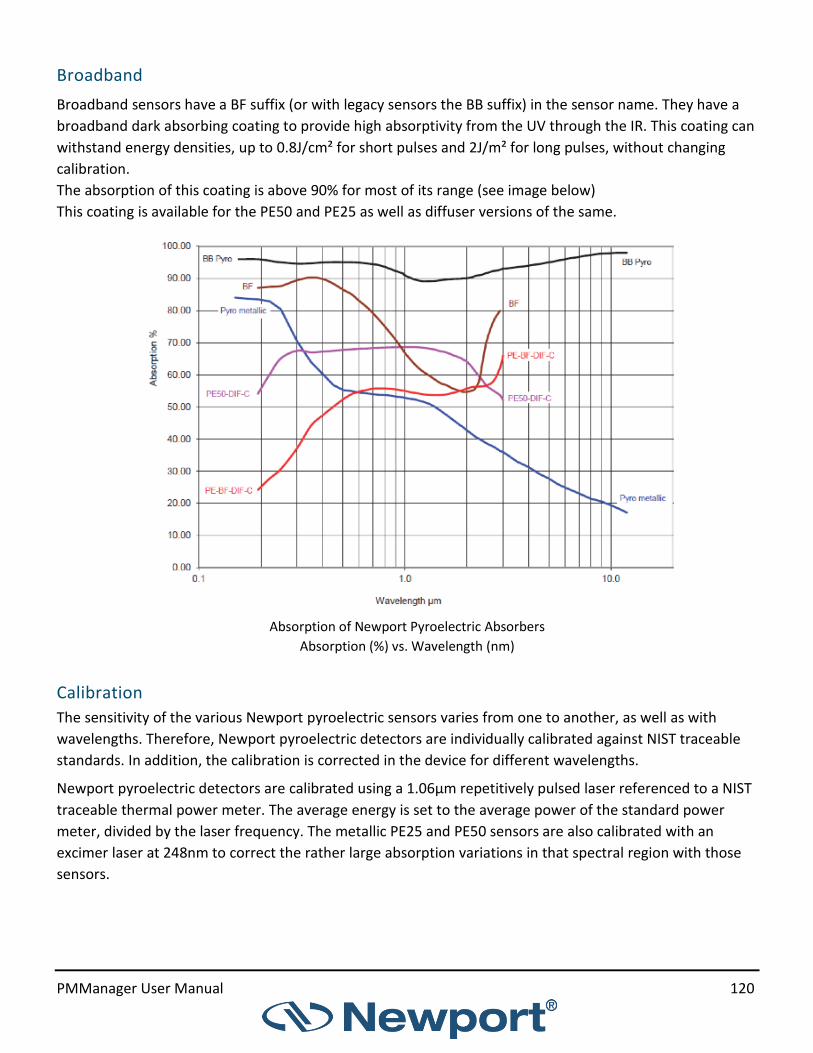
PMManager User Manual 120
Broadband
Broadband sensors have a BF suffix (or with legacy sensors the BB suffix) in the sensor name. They have a
broadband dark absorbing coating to provide high absorptivity from the UV through the IR. This coating can
withstand energy densities, up to 0.8J/cm² for short pulses and 2J/m² for long pulses, without changing
calibration.
The absorption of this coating is above 90% for most of its range (see image below)
This coating is available for the PE50 and PE25 as well as diffuser versions of the same.
Absorption of Newport Pyroelectric Absorbers
Absorption (%) vs. Wavelength (nm)
Calibration
The sensitivity of the various Newport pyroelectric sensors varies from one to another, as well as with
wavelengths. Therefore, Newport pyroelectric detectors are individually calibrated against NIST traceable
standards. In addition, the calibration is corrected in the device for different wavelengths.
Newport pyroelectric detectors are calibrated using a 1.06µm repetitively pulsed laser referenced to a NIST
traceable thermal power meter. The average energy is set to the average power of the standard power
meter, divided by the laser frequency. The metallic PE25 and PE50 sensors are also calibrated with an
excimer laser at 248nm to correct the rather large absorption variations in that spectral region with those
sensors.

PMManager User Manual 121
The spectral absorption of the detector coating is measured spectroscopically and the absorption curve is
used to correct the calibration for other wavelengths. When the user selects his wavelength in the
PMManager application, the correction factor for that wavelength is applied.
Accuracy of Calibration
Since the instruments are calibrated against NIST standards, the accuracy is generally 3% at the energy level
and wavelength at which the calibration has been performed. This accuracy has been verified by checking
the scatter of the results when several instruments are calibrated against the same standard. The maximum
error in measurement will be less than the sum of the specified accuracy, linearity, and inaccuracy due to
errors in the wavelength curve. The non-linearity is approximately 2%.
For error due to wavelength, see table below.
In addition to the above errors, the reading of a pyroelectric sensor changes with frequency. The device has
a built-in correction for this error. For frequencies above 50% of maximum frequency, inaccuracies in this
correction can increase the total error up to 3%.
The maximum error in measurement will be less, and in general will be considerably less, than the sum of
the above mentioned errors.
See http://www.Newportopt.com/laser-measurement-instruments/laser-power-energy-
meters/tutorial/calibration-procedure for a complete analysis of Newport calibration accuracy.
Coating Type
Wavelength Error
190 - 350nm 400 - 800nm
1064nm 2 - 3µm 10.6µm
Broadband ±2% ±2%
0 ±2% ±5%
Metallic ±2% ±2%
0 ±2%
±15%
Recalibration from a Known Source of Laser Energy
Recalibrate from a known source of laser energy
1. Apply the known laser power.
2. Select Calibrate (Options > Advanced Functions > Calibrate)
The Adjust Calibration Factor dialog opens.
The calibration dialog depends whether the Metallic or Broadband sensor is selected.
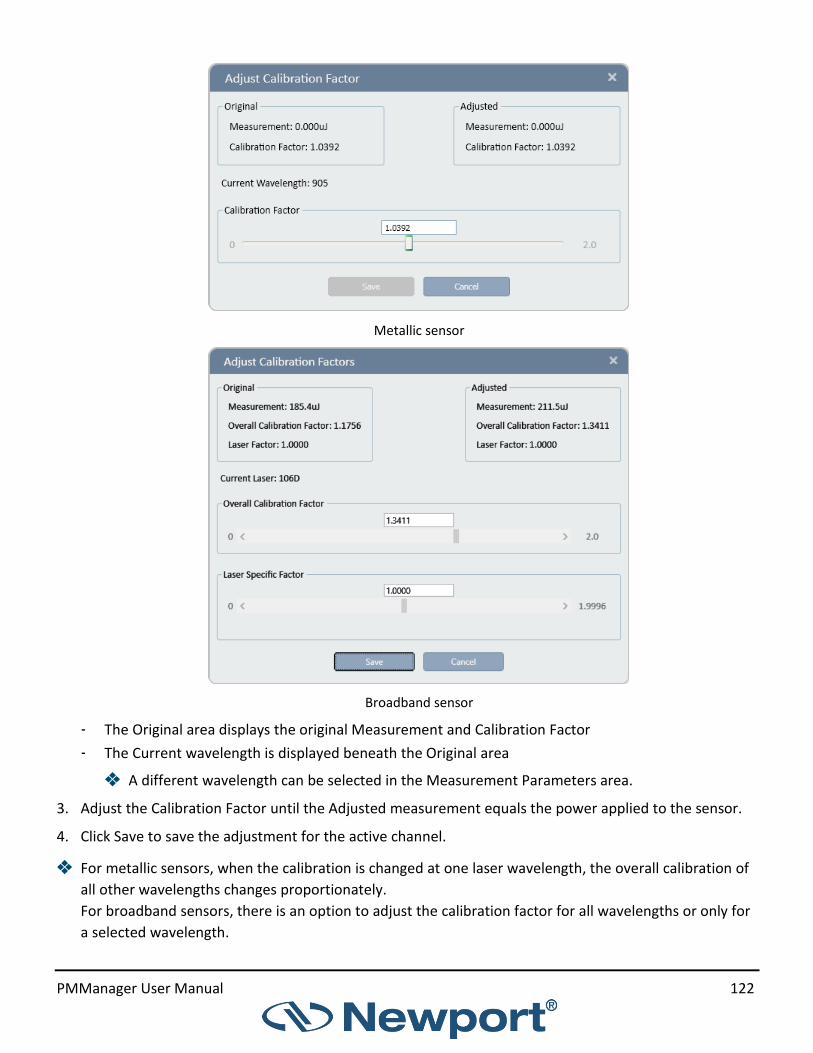
PMManager User Manual 122
Metallic sensor
Broadband sensor
- The Original area displays the original Measurement and Calibration Factor
- The Current wavelength is displayed beneath the Original area
❖ A different wavelength can be selected in the Measurement Parameters area.
3. Adjust the Calibration Factor until the Adjusted measurement equals the power applied to the sensor.
4. Click Save to save the adjustment for the active channel.
❖ For metallic sensors, when the calibration is changed at one laser wavelength, the overall calibration of
all other wavelengths changes proportionately.
For broadband sensors, there is an option to adjust the calibration factor for all wavelengths or only for
a selected wavelength.

PMManager User Manual 123
Periodic Recalibration
All Newport equipment is factory-calibrated according to NIST-traceable standards. Due to the drifting
nature of electronic components, equipment should be returned to a service center for recalibration on a
periodic basis.
PMManager provides an indication when recalibration is due in the following three examples:
When Selecting a Device
An orange warning triangle adjacent to a sensor icon indicates the sensor and or the instrument should be
factory recalibrated.

PMManager User Manual 124
Click More
View the Channel Icon

PMManager User Manual 125
Appendix C – Safety and Compliance
CE Compliance
All Newport devices, as installed on a CE compliant PC, will comply with all pertinent CE requirements
relating to safety, sensitivity to interference, EMC and emissions.
PMManager User Manual 30 Jun 2019 Rev 3.40-3
For the latest version, please visit our website: https://www.newport.com/c/optical-meters


![Chapter 296-841 Chapter 296-841 WAC AIRBORNE …lawfilesext.leg.wa.gov/law/WACArchive/2013/WAC-296-841-CHAPTE… · (2/20/07) [Ch. 296-841 WAC—p. 1] Chapter 296-841 Chapter 296-841](https://static.fdocuments.net/doc/165x107/605db1edd2831252ec0d5d41/chapter-296-841-chapter-296-841-wac-airborne-22007-ch-296-841-wacap-1.jpg)