Table of Contents - CARD MBA
116
Transcript of Table of Contents - CARD MBA


Table of Contents
4568
182022233436383940
About the coverVision and missionMessage: CARD MBA PresidentThe Metamorphosis: Message from the General ManagerActivities and eventsOperational highlightsCommunity developmentCorporate governanceThe Board of TrusteesManagement CommitteePartnersDirectoryAudited financial report


6
Not wished for but granted; this could be God’s plan for me, I thought. I was an ordinary member of CARD since 2000 until I became the center treasurer, secretary and the center chief. Eventually, I was also elected to become our unit’s MBA coordinator. The management and the members trusted me with all their hearts so I trusted them back. The distant locations of the members and beneficiaries who needed validations did not concern me for all I could see was their gratefulness despite their bereavement because we were able to respond at a time when they needed help. With the help from our provincial office (PO), I persevered implementing the 1-3-5 day target. I validate claims even on Saturdays, Sundays, and during Holidays. Through the nomination of our provincial manager (PM), I became part of the esteemed Board of Trustees (BOT). I was initially nervous for I did not have any idea on what is about to happen. Even so, I was sincerely happy and excited. I thanked God, my co-members, the staff, and our provincial managers for the new opportunity that was given to me.During the first year, I served as the secretary for the BOT. Almost every day, I was in the office to sign documents. Together with other
Trustees, I attended meetings, seminars, and trainings. I also conducted center visits in order to gather concerns from the members outside my unit. It was on my second year as a trustee that I became the president of CARD MBA. It was more nerve-wracking since I had more duties to fulfill and had to work with some of the new board members. Nonetheless, I did my best to be a good leader of our batch.There were a number of things that I’ve learned and a lot of experiences that I will never forget from being a Trustee. I was privileged with tons of benefits and was able to make a lot of new friends through the Association. Most significantly, I received respect and felt an infinite amount of love from the whole Association.To CARD MRI family, thank you for the support and care that you’ve given to us members; for the products that you’ve provided and for the continuous development of more products to help us improve our lives. We are confident that you will continue to strive for the good. We are proud to be part of CARD MRI because you have always been our guide in our development. You taught us how to be zealous, orderly, and responsible members. For my co-members, we made the right decision to choose this institution, which we can rely on
President’s Message

7
EULALIA A. VILLANUEVAPresident
CARD Mutual Benefit Association, Inc.
at all times; an institution which is stable and established. We are always assured that the institution is taking care of our funds. It doesn’t ignore our concerns; instead, it develops its products for our benefit. I am congratulating all of us members because we’re leaning on a wall. Thank you for the trust and I hope all of us can experience what I’ve experienced for the last two years that I’ve been part of the Board of Trustees. Let’s continue to become respectable members of this institution.Once again, I thank God for giving me the privilege of being a member and an officer of CARD, an MBA coordinator, and most of all, for allowing me to reach the peak of what an ordinary member like me could achieve — to become part of CARD MBA’s Board of Trustees from 2015 to 2017. Being transformed as a leader of the Association, I will continue to be a good member and example to others, together with my husband and child who are also currently members of the institution. I will always be proud to be a member of this institution. Mabuhay CARD MBA! Mabuhay CARD MRI! Continue on helping and empowering people as you have successfully been doing now.

8

9
A s one of the earliest member institutions of the CARD MRI group, CARD Mutual Benefit Association (CARD MBA) was established
with CARD, Inc.’s commitment to widen the range of its services while keeping the members’ best interests in mind. For the primary purpose of loan redemption in case of the death of member-borrowers and the provision of death benefits for the members and their legal dependents, CARD, Inc. started an informal in-house insurance arm known as the Member’s Mutual Fund (MMF) in 1994. In 1999, the concept of insuring the members started with a proposal from a commercial insurance company offering such service. At the time, CARD staff has already been receiving queries from the
members along this line: “What will happen if we die?” However, upon reviewing the premiums needed to be paid by members from a commercial insurance’s proposal, CARD officials agreed that the members will not be able to pay for such amount.Learning from this experience, CARD, Inc. transferred the assets of MMF to its members who then formed another company with a separate Board of Trustees. This led to the establishment of CARD MBA in 1999 as a separate non-profit, legal identity owned, and managed by the members. With this remarkable milestone in its history, CARD MBA committed to pioneering microinsurance products and services for members and took pride in transforming them into empowered leaders of the Association.
IMPROVING LIVES, Transpiring
MAY S. DAWATGeneral Manager
CARD Mutual Benefit Association, Inc.
CHANGES
11

10

11
DEVELOPING OUR MICROINSURANCE PRODUCTSIn 2000, after being established as a separate institution, CARD MBA started to develop products and services that would enable us to set our identity as a microinsurance mutual benefit association. We reviewed the existing products under MMF and enhanced the packaging of some of our products including loan redemption, Basic Life Insurance Program, and Retirement Savings Fund. Learning from our previous experience as an in-house microinsurance arm, we also
hired an insurance professional to assist in the growth and expansion of our microinsurance business. Since then, we formally set up CARD MBA as an institution comprised of several departments that manages its operations and continuously develops products that will suit the growing needs of members. Among the microinsurance products that the institution provided include the Basic Life Insurance, Golden Life Insurance, Credit Life Insurance, and Retirement Saving Fund. When various calamities affected the lives of our members, CARD MBA, in partnership with Pioneer
Life, Inc., developed a calamity insurance known as the Package Assistance in case of Disaster (PAID) Plan in 2007. With the assistance of our institution, CARD MRI gave birth to its 7th institution, the CARD MRI Insurance Agency, which then continued the distribution of PAID Plan. Our joint venture with Pioneer also paved the way to the establishment of CARD MRI’s 12th institution, the CARD Pioneer Microinsurance, Inc., in 2013.In our aim to create an impact to more socio-economically challenged Filipinos, CARD MBA also committed to create
9
13

12

13
community development programs that would cater to the non-financial needs of our members as well as our non-members. Through our Build-Operate-and Transfer (BOAT) Program, we transferred our technologies to other organized groups and cooperatives that provided microinsurance protection to their members but did not have the financial and technical capacity to do so. This year, CARD MBA served 30,087 members under the BOAT Program and is continuously providing scholarship assistance to 11 children of members of BOAT Partners. Nine of the scholars have already graduated.We also developed the CARD MRI Disaster Relief Assistance Program (CDRAP) and helped families in times of disaster by distributing relief goods and medicines from our sister institution, BotiCARD. Furthermore, we conducted mass weddings and participated in health, livelihood, and education programs.
PURSUING COMPETENCE AND EXCELLENCEAs a member of CARD MRI, our association continuously strives for competence and excellence by ensuring the effectiveness of
our operations through tested strategies. We develop some of our member-borrowers into MBA coordinators who are tasked to coordinate with center chiefs and branch/unit managers in terms of claim validation and other reports needed by the head office. They perform other functions that include enlisting CARD members and monitoring their membership status. Our MBA coordinators serve as our direct link to members. This allowed timely settlement of claims and high quality feedback mechanism. We also utilize this link to guarantee the wide acceptance of our products and services. In relation to this, we also contract actuary experts to conduct actuarial risk analysis of products before we introduce them to our members.The association continuously expands its operations through the establishment of provincial offices across the country. We started this expansion in 2002 and have already set up 49 provincial offices as of 2016.
GIVING MORE TO OUR CLIENTSAs we continuously expand our operations, we improve our products and services to fit the growing and changing demands
of our members. In 2016, we enhanced our existing Loan Redemption Fund (LRF) to LRF-PLUS. We added the Motor Vehicular Accident Hospitalization Benefit (MVAH) rider without requiring additional premium contribution. This ensured the provision of benefits based on the amount of the member-borrower’s loan in case of a motor vehicular accident. In addition to the death benefits that we are providing, we introduced our Memorial Assistance Program, which provides loans for memorial lots, among five units of CARD SME Bank in Tanauan, Batangas. We conducted microinsurance caravans to promote our microinsurance products and services to our savers who did not have the opportunity to be updated with our products, services, and policies through center meetings. Our institution takes pride in leading the microfinance industry in returning surplus to its members. We are the first microinsurance MBA to distribute Experience Refund and Loyalty Rewards that benefited 1.5 million members. This is one of our ways to pay back the unwavering trust of our long-time members. Also, we
11
16

14

15

16
acknowledged the significant role of our members, particularly the MBA coordinators, through the “Natatanging MBA Coordinator” citation.
AN EXCITING YEAR AHEADIn 2017, CARD MBA will introduce the Katuparan Plan, a savings
program, in three branches under CARD MRI’s banking institutions. These include CARD Bank in Bay, Laguna, CARD SME Bank in Sto. Tomas, Batangas, and Rizal Bank, Inc. in Sta. Cruz, Laguna. We also intend to enhance our Golden Life Insurance Program by offering it to our members age 50 years old.
An exciting year is ahead as CARD MBA explores new programs and territories. We will soon open provincial offices in Ilocos Norte, Davao Oriental, and Antique. Our institution will also conduct an exposure program for the Takaful Insurance, which is intended for our Muslim members. We
13

17
will have more microinsurance caravans to help our staff build on their knowledge and capacities in our microinsurance operations. In addition, we will continue our selection of health insurance providers as we also plan to cover the health insurance needs of our members.
In 2016, we increased our number of insured individuals to 12,262,672. We will continuously refuel our commitment to provide the 40 million insured individuals to CARD MRI’s 5-8-40 strategy. CARD MBA will always strive to enhance and innovate
its products and services to extend our impact to more socio-economically challenged Filipinos. CARD MBA will remain committed in empowering its members into leaders as it transforms itself into a global leader in the microinsurance industry.

18

19

20

21

22
Driven by our goal to create an impact to more socio-economically challenged Filipinos, CARD MBA developed programs that addressed the non-financial needs of its members and non-members. Through our Build-Operate-and-Transfer (BOAT) Program, we transfer our technologies to other organized groups and cooperatives that aimed to provide microinsurance protection to their members but did not have the financial and technical capacity to do so. It comes as a packaged assistance for organized groups in setting up their own mutual benefits associations.
Through the CARD Scholarship Program of CARD MRI, we provided scholarships to the children of members of our BOAT partners as an additional provision to the loyal and performing members. With this program, we were able to help thousands of students achieve their dream of earning a college degree by providing quarterly financial assistance in college.
In line with our goal to provide assistance and security to our members without additional contribution, we developed the CARD MRI Disaster Relief Assistance Program (CDRAP). We helped families in times of disaster by distributing relief goods and medicines from our sister institution, BotiCARD. Furthermore, we conducted mass weddings for our members who are not legally married. This initiative also served as our means to ensure that the whole family of our members get the full coverage of our products.
Together with other member institutions of CARD MRI, we also continuously take part in different social development programs in health, education, and livelihood with the aim to continuously empower our members. Through these community development activities, we are able to ensure that our institution actively participates in CARD MRI’s mission towards nation building.
Community Developmemt

23
Corporate GovernanceAs the first and biggest Microinsurance - Mutual Benefit Association in the country, CARD MBA takes pride in pioneering microinsurance products and services for our members and in transforming them into empowered leaders of the Association. We continuously aim to become a global leader in the microinsurance industry by achieving financial sustainability and implementing a sound corporate governance at the same time. This will be attained through our business operations, which are guided and protected with good governance practices and policies that strongly adhere to our core values of competence, family spirit, integrity, simplicity, humility, excellence, and stewardship. CARD MBA, Inc. confirms full compliance with the Code of Corporate Governance as presented below.BOARD OF TRUSTEES The Board of Trustees is the governing body of the Association. It is primarily responsible for overseeing the implementation of the policies, procedures, and action plans and checks the performance of the senior management to ensure that the strategic objectives and the corporate values of CARD MBA are being observed. Decisions of the management on the major acquisitions, procurements, changes on the policies/benefits of the members, and other major decisions that is not in the usual business operation of the Association shall require Board approval.One of CARD MBA’s ways of putting the members’ best interests in mind is by transforming them into empowered leaders of the Association. Majority of the seats in the Board of Trustees were occupied by members who were elected in position by the 3.3. million members of CARD MBA. As members of the Association themselves, we are ensured that our Trustees know and understand the needs of the members, thus qualifying them as the most suitable leaders for an association founded on a sound corporate governance. The 13 elected members of the Board of Trustees are joined by two independent trustees who are professionals and experts in their own field. Each of the members of the BOT receives a monthly allowance of Php 5,000.00 for the incidental expenses they incurred during attendance to meetings and on their monthly visitation to centers and members. The Independent Trustees, apart from their fees are independent of the management and free from any business or other relationship, which could materially interfere with the exercise of any independent judgment in carrying out responsibilities as a director of the Association. Together with the 13 elected members, they are to ensure a high standard of best practice for the Association and its stakeholders. As the Association continuously demonstrates competence and excellence in the field of both microinsurance and empowerment, we further build on our Trustees’ skills and capabilities as leaders by sending them to different trainings and seminars.

24
The Board holds regular meetings every two months. Below is the attendance for the meetings held in 2016.
*Term has ended on September 9, 2016

25
THE BOARD COMMITTEES
Committees in aid of their good corporate governance constitute the Board. Results of respective committee meeting are reported to the Board for them to discuss and address any issue on the Association’s controls and risk management.
AUDIT COMMITTEE
Ms. Arlette A. Umali – ChairpersonMr. Josef M. LeronMs. Juvelyn D. GarciaMs. Eulalia A. Villanueva (term ended September 9, 2016)Ms. Cynthia D. Fajarito (term ended September 9, 2016) Ms. Thelma M. Magculang (started October 2016)Ms. Nancy V. Santiago (started October 2016)
The role of the Audit Committee is to oversee the internal and external audit functions of the Association, set up the internal audit department, and appoint an independent external auditor. The Committee approves and reviews the audit scope and frequency and ensures that the necessary and timely actions are taken in addressing weaknesses and non-compliance with policies and regulations identified by the auditors. It holds explicit authority to investigate any matter within its terms of reference, full access to, and cooperation by management and full discretion to invite any director or executive officer to attend its meetings.
The Committe also ensures that a review of the effectiveness of the institution’s internal financial, operational and compliance controls, and risk management, is conducted at least annually. It may also perform other tasks as the board may designate from time to time.
The Audit Committee meets every first Monday of every month.

26
REMUNERATION COMMITTEE Atty. Jomer H. Aquino – ChairpersonMs. Deverna dT. BrionesMs. May S. DawatMr. Solomon A. AramilMs. Abundia C. Manabes (term ended September 9, 2016)Ms. Eulalia A. Villanueva (started September 9, 2016)The Remuneration Committee is a separate and independent body established to ensure that the remuneration arrangements within the Association enable personnel recruitment, motivation, and retention while complying with the requirements of the regulatory and governance bodies. It also makes sure that the remuneration arrangements support the strategic objectives of CARD MBA.The Remuneration Committee meets at least twice a year and as the need arises.
TREASURY COMMITTEE
Ms. Mary Jane A. Perreras – ChairpersonMs. Lorenza dT. BanezMs. Janet D. CaneoMs. Marie Sharon D. RoxasMs. Eden A. JacalneMs. Jennifer O. RedubloMs. Abundia C. Manabes (term ended September 9, 2016)Ms. Eulalia A. Villanueva (started September 9, 2016)
The Treasury Committee reviews, advises, and recommends decisions and actions in terms of the financial matters of the Association. They are also responsible for the establishment of and changes to financial, accounting, and
27
PRODUCT DEVELOPMENT AND INNOVATION COMMITTEE
Mr. Wilfredo M. Llanto – ChairpersonMs. May S. DawatMs. Janet D. CaneoMs. Arlene R. UmandapMr. Mauricio B. MaurMr. Michael Kelvin N. JunosMs. Abundia C. Manabes (term ended September 9, 2016)Ms. Nimfa M. Santos (term ended September 9, 2016)Ms. Eulalia A. Villanueva (started September 9, 2016)Ms. Analyn R. Andrade (started September 9, 2016)
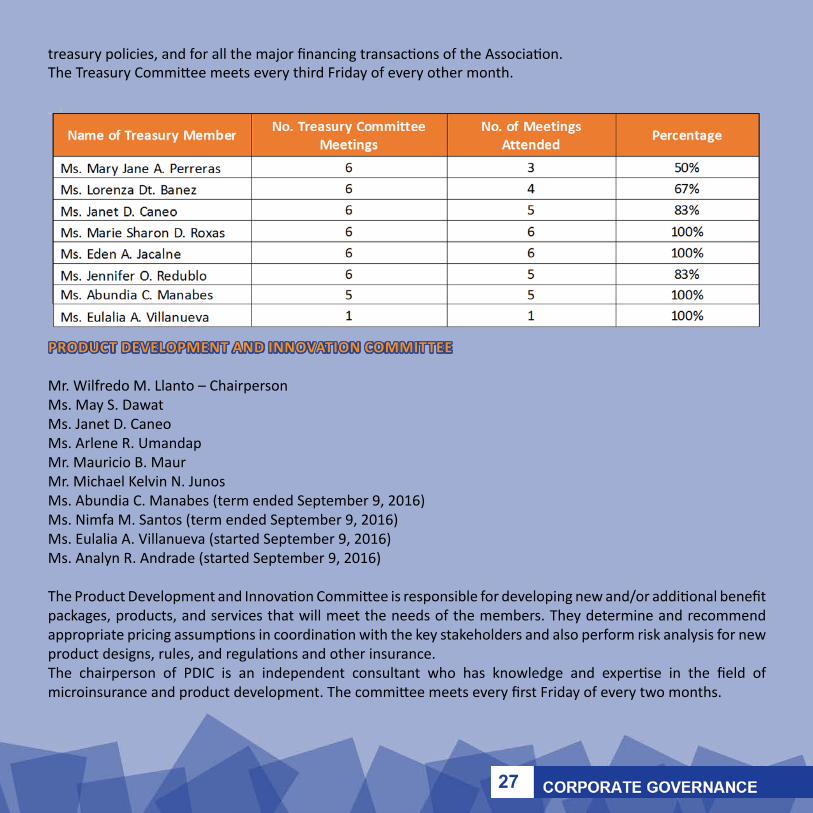
The Product Development and Innovation Committee is responsible for developing new and/or additional benefit packages, products, and services that will meet the needs of the members. They determine and recommend appropriate pricing assumptions in coordination with the key stakeholders and also perform risk analysis for new product designs, rules, and regulations and other insurance. The chairperson of PDIC is an independent consultant who has knowledge and expertise in the field of microinsurance and product development. The committee meets every first Friday of every two months.
treasury policies, and for all the major financing transactions of the Association. The Treasury Committee meets every third Friday of every other month.

28
NOMINATION COMMITTEE (CENTRAL SELECTION COMMITTEE) Ms. Devena dT. Briones – Chairperson Ms. Virginia D. Baldo Atty. Anatalia F. Buenaventura Ms. Pascuala S. Geñoso
ELECTION COMMITTEE
Atty. Charlene Bacud Ms. Jennifer P. MasaMs. Laarni D. Paje
The nomination of CARD MBA’s Board of Trustees underwent two levels of screening during the Nomination Committee meetings (Central Selection Committee) on 25 April 2016 and on 12 May 2016. All members of the committee are present in the meetings. The assessment, review, and background investigation of the nominees were conducted to scrutinize their eligibility. All members of the committee are indepedent and hold no executive position in the Association.
This year, the Annual General Meeting (AGM) was held on 5 September 2016 at the CARD-MRI Development Institute, Inc., Bay, Laguna. The election for the seven new members of the Board of Trustees was conducted in the presence of independent Election Committee composed of Atty. Charlene Bacud as the Chairperson, Jennifer Masa, and Laarne Paje. The independent Election Committee supervised and validated the whole election process during the AGM up to the counting of votes and announcement of results.

29
RISK OVERSIGHT COMMITTEE
Atty. Jomer H. Aquino – ChairpersonMs. May S. DawatMs. Janet D. CaneoMs. Juliana B. De LeonMs. Cynthia B. BaldeoMr. Wilfredo M. Llanto Ms. Abundia C. Manabes (term ended September 9, 2016)Ms. Eulalia A. Villanueva (started September 9, 2016)
Risk Oversight Committee is responsible for the development and oversight of the risk management program of CARD MBA including reputational risk, compliance risk, underwriting risk, financial risk, and operational risk. The committee meets every two months.
THE MANAGEMENTThe Management is represented by a Management Committee (ManCom), which consists of officers and executives, headed by the General Manager. All principal policies and directions governing the organization, management, and operation of the Association as well as its subsidiaries shall be formulated and implemented by this committee, subject to board approval when required by existing laws. The Committee regularly reports to the Board during its regular board meeting or during special meetings on all matters concerning the Association’s operations as well as significant events or occurrences affecting the Association.

30
INDEPENDENT CHECKS AND BALANCES To ensure the soundness of CARD MBA’s operations, the Association implements the following independent functions:
Internal Auditor Under the Board Audit Committee’s direct supervision, the Internal Audit Group, headed by Ms. Jennifer P. Masa, evaluates and ensures the adequacy and effectiveness of the internal controls of the Association. The Internal Audit Unit’s responsibilities include tasks on compliance audit, operation audit, management audit, and information systems audit. It also holds full access rights to all activities, information, records, properties, and personnel relevant to the internal audit activity.Audit Committee Chairperson, Ms. Arlette A. Umali, certifies that CARD MBA has sufficient internal control systems and is aware that constant review of the said systems and procedures is a must to keep abreast with the changing times.
External AuditorMs. Bernalette L. Ramos from Sycip Gorres Velayo & Co. with CPA Certificate No. 0091096 is authorized to certify financial statements of the association. The external auditor was paid PhP 550,000.00 for its engagement to audit the 2016 financial statements. There were no non-audit engagement in 2016, hence, no non- audit fees paid.In 2016, Audited Financial statement of the CARD MBA SGV gave an unqualified opinion and it was affirmed by the Board of Trustees during the BOT meeting on 21 March 2016.
Company Compliance The Compliance Unit is responsible for ensuring that the Association complies with the requirements, policies, circulars, and guidelines issued by the Insurance
Commission, Securities and Exchange Commission, Bureau of Internal Revenue, Local Government Units, and other government agencies.The unit is headed by a compliance officer who is appointed by the Board.
CODE OF CONDUCT AND BUSINESS ETHICS CARD MBA strictly implements the CARD MRI Code of Conduct. The Code outlines the policies that govern the activities of the institutions, its trustees, officers and employees, and specifies the fair treatment of employees and business partners. Members of the board, management, officers, and employees are committed to adhere to ethical business conduct/corporate governance rules and principles. The Association complies with the legal and regulatory requirements pertaining to related party transactions, transparency and disclosures, and board performance evaluation.
Related Party TransactionsArm’s length transactions in all related party transactions shall be observed at all times to protect the best interest of the Association, its members, and stakeholders. The Association shall seek the assistance of a committee of independent trustees to review and check the materiality and fairness of the transactions. Details of Related Party transactions (RPTs) are provided in Note 23 of the Audited Financial Statement.
Transparency and Disclosures The Board, management, and employees of CARD MBA promote full disclosure, transparency, and accountability. The Board complies with all disclosure requirements specifically those that will include material information as mandated by regulators within the prescribe period of time. To guarantee the members and stakeholders’ access to information, the company disclosure and other

31
corporate information such as monthly operations update on the number of insured individuals, claim payment and statistics, and number of members given non financial services are uploaded in the official website of CARD MBA: www.cardmba.com. Further CARD MBA publish all its events/activities conducted in the quarterly CARD MRI newspaper called SULONG.
Board Performance EvaluationThe Association conducts the Board performance assessment to evaluate the performance and effectiveness of the Board and to identify areas for continuous improvement. The criteria of assessment are on the Board of Trustees Performance of Duties and Responsibilities. The annual evaluation is conducted through self-assessment by the individual Trustees of their respective individual performance and peer assessment. Every member of the Board rates their colleagues using the following rating scale: 1 - Strongly Agree, 2 - Agree, 3 - Disagree, 4 - Strongly Disagree. This year, the Board conducted the performance assessment on November 4.
STAKEHOLDER INTEREST It is the Association’s vision to become a global leader in microinsurance while remaining anchored to our values and keeping stakeholders’ best interests in mind. The Association ensures that quality service and programs are given to stakeholders and that every transaction with them are conducted in a transparent and fair manner.
Members’ SatisfactionThe CARD MBA Client Satisfaction Survey was conducted From October to December 2016 using a structured survey questionnaire. A total of 1, 914 respondents took part in the survey by which 81% are the respondents without claims and 19% are those with claims. The
results of the survey showed that 88% of without claims and 86% of with claims respondents are generally happy with what they know and experience about CARD MBA. Overall, there are 90% who still want to be covered by CARD MBA for the reason that it is affordable and the benefit provides a great help for the member and his/her family.
Community Health Days The Microfinance and Health Protection (MaHP) Unit of the Community Development Group visits the communities of our members and their families. The Unit regularly provides free medical and dental services during Community Health Days. In 2016, MaHP has provided these health services to a total of 215,280 people.
Disaster Preparedness and First Aid TrainingLast 23 April 2016, through the cooperation of San Pablo City Fire Department and PNP, Fire and Earthquake Drills, and First Aid and Robbery/Theft Training was conducted by the employees of the Association. These aimed to orient and teach all the participants on how to be prepared in times of disaster or unfortunate event. Last 28 September 2016, under the supervision of Mr. Winil Costa and Mr. Lemuel Ragasa of the Philippine Red Cross, CARD MBA joined the Emergency First Aid Training. This aimed to certify and give license to the participants to provide first aid in case of emergency.
Supplier/Contractor Selection CriteriaLast 16 September 2016, the Bidding Committee conducted a review of the accredited suppliers to ensure that the Association get an effective and efficient third-party products and services. The due diligence considered the financial stability of the supplier, the ability to provide competitive price, good products, and services, and its compliance with the regulatory requirements.

32
LOCAL TRAININGS
INTERNATIONAL TRAININGS
Environmentally-friendly Value Chain CARD MBA, Inc. supports the Republic Act 9003, also known as the “Ecological Solid Waste Management Act”, by implementing proper segregation and disposal of solid wastes. Furthermore, as the issue of climate change continues to threaten our water resources, we implemented a policy that encourages all our offices to use water efficiently. CARD MBA, Inc. also supports reciprocal and mutual benefits among CARD MRI institutions. We have availed solar panels through CARD Leasing and Finance Corporation to ensure continuous Provincial Offices’ operations despite certain calamities, specially storms and typhoons. This endeavor is also in support to CARD-Business Development Service Foundation Inc.’s renewable energy initiatives.
Interaction with CommunitiesCARD MBA, Inc. takes part in community activities. This year, we participated in the 2nd Annual Fun Run/Walk and Health Expo. The fun runs were held at the Sampaloc Lake, San Pablo City, Laguna on 1 May 2016.In partnership with DZJV 1458KHz through its radio program K2D2 hosted by Saul Pa-a, Zen Trinidad, and Robert Maico, members of the Association shared their stories to various audience from the CALABARZON region. Also sharing the benefits of being a part of CARD MRI family, the CARD MBA members were heard on air on the following dates: Feb 24, March 2, March 9, March 30, April 6, and May 18, 2016.
Anti-Corruption Program Bantay Integridad Policy was implemented last August 8-12, 2016 to provide consciousness and commitment to every employee’s duty to report in good faith any instances of suspected or actual commission of fraud and any event that is contrary to the value of integrity of
CARD. Since its implementation no report was received by HR department regarding any illegal activities against the integrity of the Association. Also, on August 8-10, 2016 as simultaneous Cluster Manager Audit Monitoring was conducted in Capiz and Davao del Norte Provincial Office. The procedure is done to ensure strict internal control against any type of fraud.
Creditors’ Right The Association has no credit obligation/s to any third party. However, the Association is committed to meet its obligations to the members, suppliers and third party service providers by ensuring enough liquidity to meet its obligations. The Association’s creditors, if any, are given priority in payment of obligations in the normal course of business and in the event of liquidation. In 2016, CARD MBA has no record of credit obligation to any third party except for those resulted by the regular operation, which is closed and paid immediately.
EMPLOYEES’ DEVELOPMENT PROGRAM Annual Physical Examination (APE) CARD MBA annually conducts a physical examination for our staff. This year, a total of 278 staff underwent APE.
Training and Development
33
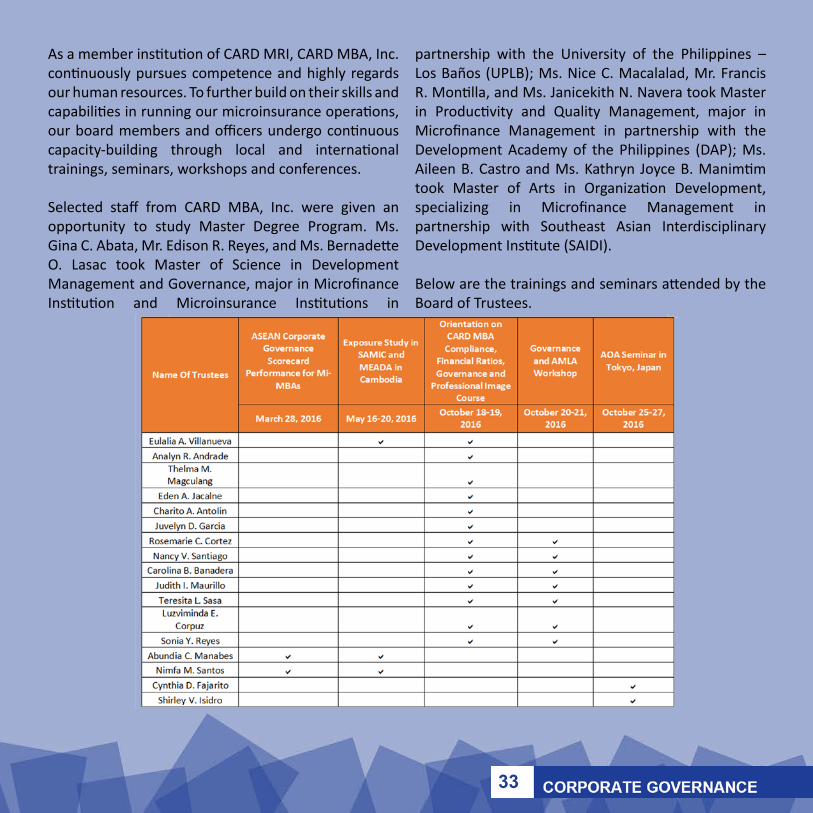
As a member institution of CARD MRI, CARD MBA, Inc. continuously pursues competence and highly regards our human resources. To further build on their skills and capabilities in running our microinsurance operations, our board members and officers undergo continuous capacity-building through local and international trainings, seminars, workshops and conferences.
Selected staff from CARD MBA, Inc. were given an opportunity to study Master Degree Program. Ms. Gina C. Abata, Mr. Edison R. Reyes, and Ms. Bernadette O. Lasac took Master of Science in Development Management and Governance, major in Microfinance Institution and Microinsurance Institutions in
partnership with the University of the Philippines – Los Baños (UPLB); Ms. Nice C. Macalalad, Mr. Francis R. Montilla, and Ms. Janicekith N. Navera took Master in Productivity and Quality Management, major in Microfinance Management in partnership with the Development Academy of the Philippines (DAP); Ms. Aileen B. Castro and Ms. Kathryn Joyce B. Manimtim took Master of Arts in Organization Development, specializing in Microfinance Management in partnership with Southeast Asian Interdisciplinary Development Institute (SAIDI).
Below are the trainings and seminars attended by the Board of Trustees.

34

35

36
The Management
Committee

37
Management Committee
MS. MAY S. DAWATGeneral Manager
MR. MAURICIO B. MAURDeputy Director for Operations- Luzon 3,4,5
MR. OLIVER M. REYESDeputy Director for Operations- Visayas
MS. RONA R. NAVADeputy Director for Operations- Mindanao
MR. ARISTOPHER F. PUNZALANDeputy Director for Operations- Luzon 1 & 2
MS. JANET D. CANEODeputy Director for Admin & Finance
MS. ARLENE R. UMANDAPDeputy Director for Claims and Technical Support
MR. SOLOMON A. ARAMIL Senior Admin Manager
MS. MA. JOYCE M. ALIMAGNOCluster Manager
MR. MICHAEL KELVIN N. JUNOSIn-house Actuary
MS. AILEEN C. BARRERAClaims Manager
MS. JENNIFER O. REDUBLOCompliance Officer
MS. JANICEKITH N. NAVERACluster Manager
MS. GINA C. ABATACluster Manager
MR. EDISON R. REYESCluster Manager
MR. FRANCIS R. MONTILLACluster Manager
MS. CATHERINE M. PATAYCluster Manager

38
Partners
• Bagnos Multipurpose Cooperative
• Bukidnon Integrated Network of Home Industries, Inc.
• Caunayan Multipurpose Cooperative
• Los Arcos Multipurpose Cooperative
• Maddela Integrated Farmers Savings Development
Cooperative
• Magdiwang Agrarian Reform Multipurpose Cooperative
• Media Once Farmers Multipurpose Cooperative
• Naguilian Christian Multipurpose Cooperative
• Nangalisan Multipurpose Cooperative
• New Massba Agrarian Reform Cooperative
• Padre Burgos Multipurpose Cooperative
• Progressive Women Agrarian Reform Cooperative
• San Julian Multipurpose Cooperative
• Libercon Multipurpose Cooperative
• Sipsipin Multipurpose Cooperative
• Tinabangay sa Igsoong Mag-uuma Gasa ni San Isidro
(TIMGAS) Multipurpose Cooperative
• USWAG Development Foundation, Inc.
• Tinagacan Agrarian Reform Beneficiaries Cooperative
• Grains Multipurpose Cooperative
• Sto. Niño Visares Transport Services Multipurpose
Cooperative
• Umiray Agrarian Reform Beneficiaries Multipurpose
Cooperative

39

40
Audited Financial
statements
41
*SGVFS023432*
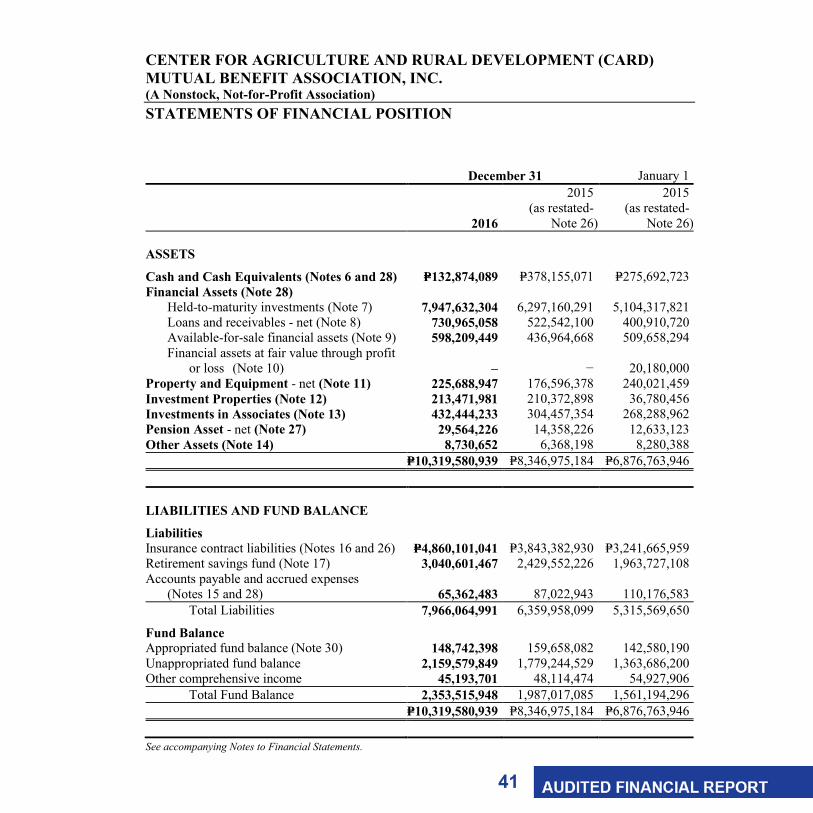
CENTER FOR AGRICULTURE AND RURAL DEVELOPMENT (CARD) MUTUAL BENEFIT ASSOCIATION, INC. (A Nonstock, Not-for-Profit Association) STATEMENTS OF FINANCIAL POSITION December 31 January 1
2016
2015 (as restated-
Note 26)
2015 (as restated-
Note 26)
ASSETS
Cash and Cash Equivalents (Notes 6 and 28) P=132,874,089 P=378,155,071 P=275,692,723 Financial Assets (Note 28)
Held-to-maturity investments (Note 7) 7,947,632,304 6,297,160,291 5,104,317,821 Loans and receivables - net (Note 8) 730,965,058 522,542,100 400,910,720 Available-for-sale financial assets (Note 9) 598,209,449 436,964,668 509,658,294 Financial assets at fair value through profit or loss (Note 10) – − 20,180,000
Property and Equipment - net (Note 11) 225,688,947 176,596,378 240,021,459 Investment Properties (Note 12) 213,471,981 210,372,898 36,780,456 Investments in Associates (Note 13) 432,444,233 304,457,354 268,288,962 Pension Asset - net (Note 27) 29,564,226 14,358,226 12,633,123 Other Assets (Note 14) 8,730,652 6,368,198 8,280,388 P=10,319,580,939 P=8,346,975,184 P=6,876,763,946
LIABILITIES AND FUND BALANCE
Liabilities Insurance contract liabilities (Notes 16 and 26) P=4,860,101,041 P=3,843,382,930 P=3,241,665,959 Retirement savings fund (Note 17) 3,040,601,467 2,429,552,226 1,963,727,108 Accounts payable and accrued expenses
(Notes 15 and 28) 65,362,483 87,022,943 110,176,583 Total Liabilities 7,966,064,991 6,359,958,099 5,315,569,650
Fund Balance Appropriated fund balance (Note 30) 148,742,398 159,658,082 142,580,190 Unappropriated fund balance 2,159,579,849 1,779,244,529 1,363,686,200 Other comprehensive income 45,193,701 48,114,474 54,927,906 Total Fund Balance 2,353,515,948 1,987,017,085 1,561,194,296 P=10,319,580,939 P=8,346,975,184 P=6,876,763,946 See accompanying Notes to Financial Statements.

42
*SGVFS023432*
CENTER FOR AGRICULTURE AND RURAL DEVELOPMENT (CARD) MUTUAL BENEFIT ASSOCIATION, INC. (A Nonstock, Not-for-Profit Association) STATEMENTS OF COMPREHENSIVE INCOME Years Ended December 31
2016
2015 (as restated-
Note 26)
REVENUE Gross premiums on insurance contracts (Note 18) P=2,329,174,617 P=1,839,785,168 Reinsurance’ share on gross earned premium on insurance contracts (Note 18) (2,646,045) (1,477,500) Net premiums on insurance contracts 2,326,528,572 1,838,307,668 Interest income (Notes 6, 7, 8, 19 and 27) 216,416,627 199,476,726 Dividend income (Notes 9 and 10) 26,508,032 24,340,922 Surrender charge 16,970,148 16,357,739 Equity in net earnings of associates (Note 13) 73,666,278 11,219,179 Rental income (Notes 12, 20 and 22) 7,918,705 5,683,660 Reversal of impairment losses (Note 8) 13,024,673 − Others 8,403,525 2,657,771 Other revenue 362,907,988 259,735,997 2,689,436,560 2,098,043,665
BENEFITS, CLAIMS AND EXPENSES Gross change in insurance contract liabilities (Note 16) 1,021,839,529 601,716,971 Gross insurance contract benefits and claims paid (Note 16) 825,554,143 692,479,452 Insurance benefits and claims 1,847,393,672 1,294,196,423 General and administrative expenses (Note 21) 363,032,821 300,395,279 Fair value loss from financial assets at fair value through profit or loss (Note 10) − 180,000 Expenses and losses 363,032,821 300,575,279 2,210,426,493 1,594,771,702
EXCESS OF REVENUE OVER EXPENSES BEFORE PROVISION FOR TAXES 479,010,067 503,271,963
PROVISION FOR (Note 24):
Current tax 216,396 127,522 Final tax 45,771,404 43,265,622
EXCESS OF REVENUE OVER EXPENSES 433,022,267 459,878,819
(Forward)

43
*SGVFS023432*
- 2 - Years Ended December 31
2016
2015 (as restated-
Note 26)
EXCESS OF REVENUE OVER EXPENSES P=433,022,267 P=459,878,819
OTHER COMPREHENSIVE INCOME (LOSS) Item that will be reclassified to profit or loss in
subsequent periods Fair value losses on available-for-sale financial assets
(Note 9) (7,101,585) (1,080,051) Items that will not be reclassified to profit or loss in
subsequent periods Equity in other comprehensive income (loss) of an
associate (Note 13) 4,020,589 (2,447,787) Remeasurement gain (loss) on defined benefit plan
(Note 27) 160,223 (3,285,594)
TOTAL COMPREHENSIVE INCOME P=430,101,494 P=453,065,387 See accompanying Notes to Financial Statements.

44
*SGVFS02
3432*
CE
NT
ER
FO
R A
GR
ICU
LT
UR
E A
ND
RU
RA
L D
EV
EL
OPM
EN
T (C
AR
D)
MU
TU
AL
BE
NE
FIT
ASS
OC
IAT
ION
(A
Non
stoc
k, N
ot-f
or-P
rofit
Ass
ocia
tion)
ST
AT
EM
EN
TS
OF
CH
AN
GE
S IN
FU
ND
BA
LA
NC
E
O
ther
Com
preh
ensi
ve In
com
e
App
ropr
iate
d Fu
nd B
alan
ce
(Not
e 30
) U
napp
ropr
iate
d Fu
nd B
alan
ce
Res
erve
for
Fluc
tuat
ion
in V
alue
of
Ava
ilabl
e-fo
r-
Sale
Fin
anci
al
Ass
ets
(Not
e 9)
Rem
easu
rem
ent
of A
ctua
rial
G
ains
/Los
ses
(Not
e 27
)
Equ
ity in
oth
er
com
preh
ensi
ve
inco
me
of
an a
ssoc
iate
(N
ote
13)
Tot
al O
ther
C
ompr
ehen
sive
In
com
e T
otal
Fu
nd B
alan
ce
At J
anua
ry 1
, 201
6
As p
revi
ousl
y re
porte
d P=1
59,6
58,0
82
P=1,6
85,7
83,5
27
P=41,
780,
646
P=6,5
04,3
23
(P=17
0,49
5)
P=48,
114,
474
P=1,8
93,5
56,0
83
Prio
r per
iod
adju
stm
ents
(Not
e 26
) −
93,4
61,0
02
− −
− −
93,4
61,0
02
As r
esta
ted
159,
658,
082
1,77
9,24
4,52
9 41
,780
,646
6,
504,
323
(170
,495
) 48
,114
,474
1,
987,
017,
085
App
ropr
iatio
n du
ring
the
year
93
,584
,551
(9
3,58
4,55
1)
− −
− −
− R
ever
sal o
f app
ropr
iatio
n (4
0,89
7,60
5)
40,8
97,6
05
− −
− −
− U
tiliz
atio
n of
app
ropr
iatio
n (6
3,60
2,63
0)
− −
− −
− (6
3,60
2,63
0)
Tota
l com
preh
ensi
ve in
com
e:
Exce
ss o
f rev
enue
ove
r exp
ense
s −
433,
022,
267
− −
− −
433,
022,
267
O
ther
com
preh
ensi
ve in
com
e (lo
ss)
− −
(7,1
01,5
85)
160,
223
4,02
0,58
9 (2
,920
,773
) (2
,920
,773
) B
alan
ce a
t Dec
embe
r 31
, 201
6 P=1
48,7
42,3
98
P=2,1
59,5
79,8
50
P=34,
679,
061
P=6,6
64,5
46
P=3,8
50,0
94
P=45,
193,
701
P=2,3
53,5
15,9
49
At J
anua
ry 1
, 201
5
A
s pre
viou
sly
repo
rted
P=142
,580
,190
P=1
,285
,160
,743
P=4
2,86
0,69
7 P=9
,789
,917
P=2
,277
,292
P=5
4,92
7,90
6 P=1
,482
,668
,839
Pr
ior p
erio
d ad
just
men
ts (N
ote
26)
− 78
,525
,457
−
− −
− 78
,525
,457
A
s res
tate
d 14
2,58
0,19
0 1,
363,
686,
200
42,8
60,6
97
9,78
9,91
7 2,
277,
292
54,9
27,9
06
1,56
1,19
4,29
6 A
ppro
pria
tion
durin
g th
e ye
ar
44,3
20,4
90
(44,
320,
490)
−
− −
− −
Rev
ersa
l of a
ppro
pria
tion
− U
tiliz
atio
n of
app
ropr
iatio
n (2
7,24
2,59
8)
− −
− −
− (2
7,24
2,59
8)
Tota
l com
preh
ensi
ve in
com
e:
Exce
ss o
f rev
enue
ove
r exp
ense
s −
459,
878,
819
− −
− −
459,
878,
819
O
ther
com
preh
ensi
ve lo
ss
− −
(1,0
80,0
51)
(3,2
85,5
94)
(2,4
47,7
87)
(6,8
13,4
32)
(6,8
13,4
32)
Bal
ance
at D
ecem
ber
31, 2
015
P=159
,658
,082
P=1
,779
,244
,529
P=4
1,78
0,64
6 P=6
,504
,323
(P=
170,
495)
P=4
8,11
4,47
4 P=1
,987
,017
,085
Se
e ac
com
pany
ing
Note
s to
Fina
ncia
l Sta
tem
ents.

45*SGVFS023432*
CENTER FOR AGRICULTURE AND RURAL DEVELOPMENT (CARD) MUTUAL BENEFIT ASSOCIATION, INC. (A Nonstock, Not-for-Profit Association) STATEMENTS OF CASH FLOWS Years Ended December 31
2016
2015 (as restated)
(Note 26)
CASH FLOWS FROM OPERATING ACTIVITIES Excess of revenue over expenses before provision for current and final tax P=479,010,067 P=503,271,963 Adjustments for:
Increase in aggregate reserves (Note 16) 1,004,869,380 583,660,128 Amortization of bond premium (Note 7) 127,702,909 22,937,395
Pension expense (Note 27) 3,942,178 3,562,765 Depreciation (Notes 11, 12, and 21) 11,852,537 9,035,200 Provision for (reversal of) impairment losses (Note 8) (13,024,673) 3,285,338 Fair value losses from financial assets at fair value through profit or loss (Note 10) − 180,000 Loss (gain) on sale/retirement of transportation equipment (Note 11) (370,666) 35,817
Interest income on pension asset (Notes 19 and 27) (1,111,813) (740,436) Equity in net earnings of associates - net (Note 13) (73,666,278) (11,219,179)
Dividend income (Notes 9 and 10) (26,508,032) (24,340,922) Interest income (Notes 6, 7, 8, and 19) (215,304,814) (198,736,290) Cash generated from operations before changes in working capital 1,297,390,795 890,931,779 Changes in operating assets and liabilities: Decrease (increase) in: Receivables 47,924,833 (40,667,375) Other assets (2,362,454) 1,912,190 Increase (decrease) in:
Claims payable 11,848,729 18,056,843 Retirement savings fund 611,049,241 465,825,118 Accounts payable and accrued expenses (21,660,460) (23,153,640) Net cash generated from operations 1,944,190,684 1,312,904,915 Contribution to pension fund (Note 27) (17,876,142) (7,833,026) Utilization of appropriation (Note 30) (63,602,630) (27,242,598) Taxes paid (45,987,800) (43,393,144) Net cash flows provided by operating activities 1,816,724,112 1,234,436,147
CASH FLOWS FROM INVESTING ACTIVITIES Interest received 206,044,756 186,037,620 Cash dividends received 35,535,040 20,023,116 Acquisitions of: Available-for-sale financial assets (Note 9 and 25) (124,169,366) (3,383,800) Investment properties (Note 12) (24,617,200) (71,405,700) Investments in associates (Note 13) (52,700,012) (28,300,000) Property and equipment (Note 11) (39,432,839) (47,832,678) Held-to-maturity investments (Note 7) (2,377,095,796) (1,338,942,053) Short-term investments (Note 8) (1,414,506,236) (294,513,149) Long-term investments (Note 8) (402,707,594) − Loans receivable (Note 8) (25,000,000) (10,000,000)
(Forward)

46
*SGVFS023432*
- 2 - Years Ended December 31
2016
2015 (as restated)
(Note 26) Proceeds from sale/maturities of: Held-to-maturity investments (Note 7) P=598,920,875 P=123,162,188
Available-for-sale financial assets (Note 9) − 74,997,375 Financial assets at fair value through profit or loss (Note 10) − 20,000,000 Short-term investments (Note 8) 1,541,513,428 222,349,949 Property and equipment (Note 11) 376,516 − Loans receivable (Note 8) 15,833,334 15,833,333
Net cash flows used in investing activities (2,062,005,094) (1,131,973,799)
NET INCREASE (DECREASE) IN CASH AND CASH EQUIVALENTS (245,280,982) 102,462,348
CASH AND CASH EQUIVALENTS AT BEGINNING OF YEAR 378,155,071 275,692,723
CASH AND CASH EQUIVALENTS AT END OF YEAR (Note 6) P=132,874,089 P=378,155,071 See accompanying Notes to Financial Statements.

47
*SGVFS023432*
CENTER FOR AGRICULTURE AND RURAL DEVELOPMENT (CARD) MUTUAL BENEFIT ASSOCIATION, INC. (A Nonstock, Not-for-Profit Association) NOTES TO FINANCIAL STATEMENTS 1. Corporate Information
Center for Agriculture and Rural Development (CARD) Mutual Benefit Association, Inc. (the Association) was registered with the Securities and Exchange Commission (SEC) as a nonstock, not-for-profit association on October 29, 1999. It was granted a license by the Insurance Commission (IC) on May 22, 2001 to engage as a mutual benefit association that extends benefits and services for the welfare and financial security of its members and their families in the form of death benefits, medical subsidy, pension and loan redemption assistance and ensuring continued access to benefits and resources. The Association actively involves the members in the direct management of the Association including the implementation of policies and procedures geared towards sustainability and improved services.
As a nonstock, not-for-profit and mutual benefit association, the Association was granted tax exemption with respect to income and value-added taxes (VAT) except for those activities which are conducted for profit and are not directly related to its main purpose as provided under the National Internal Revenue Code of 1997 as amended by Republic Act 8424 known as the Comprehensive Tax Reform Program by the Bureau of Internal Revenue (BIR).
In June 2015, the Association obtained its registration from BIR as a VAT registered entity in relation to its rental income earned from investment properties. This income is subjected to current income tax and VAT.
The registered office address of the Association is 120 M. Paulino St., corner P. Burgos St., Brgy. VII-D, San Pablo City, Laguna.
The accompanying financial statements of the Association were authorized for issue by the Board of Trustees on March 17, 2017.
2. Basis of Preparation
The Association’s financial statements have been prepared on a historical cost basis, except for financial assets at fair value through profit or loss (FVPL) and available-for-sale (AFS) financial assets which have been measured at fair value. The financial statements are presented in Philippine Peso (P=), which is the Association’s functional and presentation currency. All amounts are rounded to the nearest peso, unless otherwise indicated.
Statement of Compliance The financial statements of the Association have been prepared in compliance with Philippine Financial Reporting Standards (PFRS).

48
- 2 -
*SGVFS023432*
3. Changes in Accounting Policies
The accounting policies adopted are consistent with those of the previous financial year except for the following new and amended PFRS and Philippine Accounting Standards (PAS) which became effective beginning January 1, 2016. The adoption of these new and amended standards did not have any significant impact on financial statements of the Association.
Amendments to PFRS 10, Consolidated Financial Statements, PFRS 12, Disclosure of
Interests in Other Entities, and PAS 28, Investments in Associates and Joint Ventures, Investment Entities: Applying the Consolidation Exception
Amendments to PFRS 11, Joint Arrangements, Accounting for Acquisitions of Interests in Joint Operations
PFRS 14, Regulatory Deferral Accounts Amendments to PAS 1, Presentation of Financial Statements, Disclosure Initiative Amendments to PAS 16, Property, Plant and Equipment and PAS 38, Intangible Assets,
Clarification of Acceptable Methods of Depreciation and Amortization Amendments to PAS 16 and PAS 41, Agriculture: Bearer Plants Amendments to PAS 27, Separate Financial Statements, Equity Method in Separate Financial
Statements Annual Improvements to PFRSs 2012 - 2014 Cycle Amendment to PFRS 5, Non-current Assets Held for Sale and Discontinued Operations,
Changes in Methods of Disposal Amendment to PFRS 7, Financial Instruments: Disclosures, Servicing Contracts Amendment to PFRS 7, Applicability of the Amendments to PFRS 7 to Condensed Interim
Financial Statements Amendment to PAS 19, Employee Benefits, Discount Rate: Regional Market Issue Amendment to PAS 34, Interim Financial Reporting, Disclosure of Information ‘Elsewhere in
the Interim Financial Report’
Future Changes in Accounting Policies The Association has not applied the succeeding amended PFRS which are not yet effective for the year ended December 31, 2016. Unless otherwise indicated, the succeeding amended PFRS will not significantly impact the financial statements:
Effective beginning on or after January 1, 2017 Amendment to PFRS 12, Clarification of the Scope of the Standard (Part of Annual
Improvements to PFRSs 2014 - 2016 Cycle) Amendments to PAS 7, Statement of Cash Flows, Disclosure Initiative Amendments to PAS 12, Income Taxes, Recognition of Deferred Tax Assets for Unrealized
Losses
Effective in 2018 Amendments to PFRS 2, Share-based Payment, Classification and Measurement of Share-
based Payment Transactions Amendments to PFRS 4, Insurance Contracts, Applying PFRS 9, Financial Instruments, with
PFRS 4

49
- 3 -
*SGVFS023432*
The amendments address concerns arising from implementing PFRS 9, the new financial instruments standard before implementing the forthcoming insurance contracts standard. They allow entities to choose between the overlay approach and the deferral approach to deal with the transitional challenges. The overlay approach gives all entities that issue insurance contracts the option to recognize in other comprehensive income, rather than profit or loss, the volatility that could arise when PFRS 9 is applied before the new insurance contracts standard is issued. On the other hand, the deferral approach gives entities whose activities are predominantly connected with insurance an optional temporary exemption from applying PFRS 9 until the earlier of application of the forthcoming insurance contracts standard or January 1, 2021.
The overlay approach and the deferral approach will only be available to an entity if it has not previously applied PFRS 9.
The Association is assessing which approach it will use and the potential impact of the chosen approach in its financial statements.
PFRS 9, Financial Instruments PFRS 9 reflects all phases of the financial instruments project and replaces PAS 39, Financial Instruments: Recognition and Measurement, and all previous versions of PFRS 9. The standard introduces new requirements for classification and measurement, impairment, and hedge accounting. PFRS 9 is effective for annual periods beginning on or after January 1, 2018, with early application permitted. Retrospective application is required, but providing comparative information is not compulsory. For hedge accounting, the requirements are generally applied prospectively, with some limited exceptions.
The adoption of PFRS 9 will have an effect on the classification and measurement of the Association’s financial assets and impairment methodology for financial assets, but will have no impact on the classification and measurement of the Association’s financial liabilities. The adoption will also have an effect on the Association’s application of hedge accounting and on the amount of its credit losses. The Association is currently assessing the impact of adopting this standard.
PFRS 15, Revenue from Contracts with Customers
PFRS 15 establishes a new five-step model that will apply to revenue arising from contracts with customers. Under PFRS 15, revenue is recognized at an amount that reflects the consideration to which an entity expects to be entitled in exchange for transferring goods or services to a customer. The principles in PFRS 15 provide a more structured approach to measuring and recognizing revenue. The new revenue standard is applicable to all entities and will supersede all current revenue recognition requirements under PFRSs. Either a full or modified retrospective application is required for annual periods beginning on or after January 1, 2018. The Association is currently assessing the impact of PFRS 15 and plans to adopt the new standard on the required effective date.
Effective beginning on or after January 1, 2019 PFRS 16, Leases
Under the new standard, lessees will no longer classify their leases as either operating or finance leases in accordance with PAS 17, Leases. Rather, lessees will apply the single-asset model. Under this model, lessees will recognize the assets and related liabilities for most

50
- 4 -
*SGVFS023432*
leases on their balance sheets, and subsequently, will depreciate the lease assets and recognize interest on the lease liabilities in their profit or loss. Leases with a term of 12 months or less or for which the underlying asset is of low value are exempted from these requirements.
The accounting by lessors is substantially unchanged as the new standard carries forward the principles of lessor accounting under PAS 17. Lessors, however, will be required to disclose more information in their financial statements, particularly on the risk exposure to residual value.
Entities may early adopt PFRS 16 but only if they have also adopted PFRS 15. When adopting PFRS 16, an entity is permitted to use either a full retrospective or a modified retrospective approach, with options to use certain transition reliefs.
The Association is currently assessing the impact of adopting PFRS 16 and plans to adopt the new standard on the required effective date.
Deferred effectivity Amendments to PFRS 10 and PAS 28, Sale or Contribution of Assets between an Investor and
its Associate or Joint Venture 4. Summary of Significant Accounting Policies
Cash and Cash Equivalents Cash includes cash on hand and in banks. Cash equivalents are short-term, highly liquid investments that are readily convertible to known amounts of cash with original maturities of three months or less from dates of placement and that are subject to an insignificant risk of changes in value.
Financial Instruments Date of recognition Financial instruments are recognized in the statement of assets, liabilities and fund balance when the Association becomes a party to the contractual provisions of the instrument. Purchases or sales of financial assets that require delivery of assets within the time frame established by regulation or convention in the marketplace are recognized on the trade date.
Initial recognition of financial instruments Financial instruments are initially recognized at fair value of the consideration given (in case of an asset) or received (in case of a liability). Except for financial instruments at FVPL, the initial measurement of financial assets includes transaction costs. The Association classifies its financial assets in the following categories: held-to-maturity (HTM) investments, AFS investments, FVPL investments, and loans and receivables. The Association classifies its financial liabilities into financial liabilities at FVPL and other financial liabilities. The classification depends on the purpose for which the investments were acquired and whether they are quoted in an active market. Management determines the classification of its investments at initial recognition and, where allowed and appropriate, re-evaluates such designation at every end of the reporting period.
Fair Value Measurement The Association measures financial instruments at fair value. Also, fair values of financial instruments measured at amortized cost and non-financial assets and investment properties carried at cost are disclosed in Note 28.

51
- 5 -
*SGVFS023432*
Fair value is the price that would be received to sell an asset or paid to transfer a liability in an orderly transaction between market participants at the measurement date. The fair value measurement is based on the presumption that the transaction to sell the asset or transfer the liability takes place either: In the principal market for the asset or liability, or In the absence of a principal market, in the most advantageous market for the asset or liability
The principal or the most advantageous market must be accessible to the Association.
The fair value of an asset or a liability is measured using the assumptions that market participants would use when pricing the asset or liability, assuming that market participants act in their economic best interest.
A fair value measurement of a non-financial asset takes into account a market participant's ability to generate economic benefits by using the asset in its highest and best use or by selling it to another market participant that would use the asset in its highest and best use.
The Association uses valuation techniques that are appropriate in the circumstances and for which sufficient data are available to measure fair value, maximizing the use of relevant observable inputs and minimizing the use of unobservable inputs.
All assets and liabilities for which fair value is measured or disclosed in the financial statements are categorized within the fair value hierarchy, described as follows, based on the lowest level input that is significant to the fair value measurement as a whole:
Level 1 - Quoted (unadjusted) market prices in active markets for identical assets or liabilities Level 2 - Valuation techniques for which the lowest level input that is significant to the fair
value measurement is directly or indirectly observable Level 3 - Valuation techniques for which the lowest level input that is significant to the fair
value measurement is unobservable
For assets and liabilities that are recognized in the financial statements on a recurring basis, the Association determines whether transfers have occurred between Levels in the hierarchy by re-assessing categorization (based on the lowest level input that is significant to the fair value measurement as a whole) at the end of each reporting period.
Day 1 profit Where the transaction price in a non-active market is different to the fair value from other observable current market transactions in the same instrument or based on a valuation technique whose variables include only data from observable market, the Association recognizes the difference between the transaction price and fair value (a Day 1 profit) in the statement of comprehensive income. In cases where use is made of data which is not observable, the difference between the transaction price and model value is only recognized in the statement of comprehensive income when the inputs become observable or when the instrument is derecognized. For each transaction, the Association determines the appropriate method of recognizing the Day 1 profit amount.
Loan and receivables Receivables include non-derivative financial assets with fixed or determinable payments that are not quoted in an active market and for which the Association has no intention of trading. Receivables are carried at amortized cost using the effective interest rate (EIR) method, reduced

52
- 6 -
*SGVFS023432*
by allowance for impairment losses. Gains and losses are recognized in the statement of comprehensive income when the receivables are derecognized or impaired based on comparison with fair value.
Short-term Investments Short-term investments are short-term, highly liquid investments that are readily convertible to known amounts of cash with original maturities of more than three months but less than one year from dates of placement. These earn interests at the respective short-term investment rates.
Long-term Investments Long-term investments are non-current assets that are not used in operating activities to generate revenues. In other words, long-term investments are assets that are held for more than one year or accounting period and are used to create other income outside of the normal operations of the Association.
Financial assets or financial liabilities at FVPL This category consists of financial assets or financial liabilities that are held for trading or designated by management as at FVPL on initial recognition. Derivative instruments, except those covered by hedge accounting relationships, are also classified under this category. Financial assets or financial liabilities at FVPL are recorded in the Association’s statement of financial position at fair value, with changes in fair value being recorded under “Fair value gains from financial assets at FVPL” account in the association statement of comprehensive income.
Financial assets or financial liabilities are classified in this category are designated by management on initial recognition when any of the following criteria are met:
the designation eliminates or significantly reduces the inconsistent treatment that would
otherwise arise from measuring the assets or liabilities or recognizing gains or losses on a different basis; or
the assets and liabilities are part of a group of financial assets, financial liabilities or both which are managed and their performance are evaluated on a fair value basis, in accordance with a documented risk management or investment strategy; or
the financial instrument contains an embedded derivative, unless the embedded derivative does not significantly modify the cash flows or it is clear, with little or no analysis, that it would not be separately recorded.
AFS financial assets AFS financial assets are those investments which are designated as such or do not qualify to be classified as designated as at FVPL, HTM investments or loans and receivables. They are purchased and held indefinitely, and may be sold in response to liquidity requirements or changes in market conditions. They include equity investments, money market papers and other debt instruments.
These investments are initially recorded at cost, being the fair value of the consideration paid for the acquisition of the investment, including all transaction costs directly attributable to the acquisition. After initial recognition, AFS financial assets are subsequently measured at fair value. Interest earned on holding AFS financial assets are reported as interest income using the EIR. The unrealized gains and losses arising from the fair valuation of AFS financial assets are excluded from reported earnings and are reported as “Reserve for fluctuation in value of AFS financial assets” (net of tax, where applicable) in the other comprehensive income in the fund balance section of the Association’s statement of financial position. When the security is disposed

53
- 7 -
*SGVFS023432*
of, the cumulative gains or losses previously recognized in equity is recognized in the Association’s statement of comprehensive income.
When the fair value of AFS financial assets cannot be measured reliably because of lack of reliable estimates of future cash flows and discount rates necessary to calculate the fair value of unquoted equity instruments, these investments are carried at cost, less any allowance for impairment losses. Dividends earned on holding AFS financial assets are recognized in the Association’s statement of comprehensive income when the right of payment has been established. The losses arising from impairment of such investments are recognized as “Provision for impairment losses” included under “Operating expenses” in the Association’s statement of comprehensive income.
As of December 31, 2016, AFS financial assets include investments in mutual fund and investments in unquoted shares. Investments in mutual funds are initially recorded at fair value and revalued at year end in reference to published net asset value. The investments in unquoted preferred shares are initially recorded at cost, being the fair value of the investment at the time of acquisition. The investments in unquoted preferred shares are carried at cost due to the unpredictable nature of future cash flows and the lack of other suitable methods of arriving at a reliable fair value. The investments in mutual funds are carried at fair value.
HTM investments HTM investments are non-derivative financial assets that comprise fixed or determinable income securities of which the Association has the positive intension and ability to hold until maturity. Investments intended to be held for an undefined period are not included in this classification. These investments are initially recognized at cost, being the fair value of the consideration paid for the acquisition of the investment. All transaction costs directly attributable to the acquisition are also included in the cost of the investment. Subsequent to initial recognition, these investments are carried at amortized cost, using the EIR method. The cost is computed as the amount initially recognized minus principal repayments, plus or minus the cumulative amortization using the EIR method of any difference between the initially recognized amount and the maturity amount. This calculation includes all fees and points paid or received between parties to the contract that are an integral part of the EIR, transaction costs and all other premiums and discounts. Gains and losses are recognized in the statement of comprehensive income when the investments are derecognized or impaired, as well as through the amortization process. These investments represent debt securities where the Association has the positive intent and financial capability to hold to maturity.
Other financial liabilities Issued financial instruments or their components, which are not designated at FVPL are classified as other financial liabilities where the substance of the contractual arrangement results in the Association having an obligation either to deliver cash or another financial asset to the holder, or to satisfy the obligation other than by the exchange of a fixed amount of cash or another financial asset for a fixed number of own equity shares. The components of issued financial instruments that contain both liability and equity elements are accounted for separately, with the equity component being assigned the residual amount after deducting from the instrument as a whole the amount separately determined as the fair value of the liability component on the date of issue. After initial measurement, other financial liabilities are subsequently measured at amortized cost using the EIR method. Amortized cost is calculated by taking into account any discount or premium on the issue and fees that are an integral part of the EIR.
This accounting policy applies primarily to the Association’s “Accounts payable and accrued expenses”, “Retirement savings fund” and other obligations that meet the above definition (other

54
- 8 -
*SGVFS023432*
than liabilities covered by other accounting standards, such as income tax payable and pension liability).
Classification of Financial Instruments Between Debt and Equity A financial instrument is classified as debt if it provides for a contractual obligation to:
deliver cash or another financial asset to another entity; or exchange financial assets or financial liabilities with another entity under conditions that are
potentially unfavourable to the Association; or satisfy the obligation other than by the exchange of a fixed amount of cash or another financial
asset for a fixed number of equity shares.
If the Association does not have an unconditional right to avoid delivering cash or another financial asset to settle its contractual obligation, the obligation meets the definition of a financial liability.
The components of issued financial instruments that contain both liability and equity elements are accounted for separately, with the equity component being assigned the residual amount, after deducting from the instrument as a whole, the amount separately determined as the fair value of the liability component on the date of issue.
Offsetting Financial assets and financial liabilities are offset and the net amount is reported in the statement of financial position if, and only if, there is a currently enforceable legal right to offset the recognized amounts and there is an intention to settle on a net basis, or to realize the asset and settle the liability simultaneously.
Impairment of Financial Assets An assessment is made at each reporting date as to whether there is objective evidence that a specific financial asset may be impaired. If such evidence exists, any impairment loss is recognized in the statement of comprehensive income.
Assets carried at amortized cost If there is objective evidence that an impairment loss on financial assets carried at amortized cost has been incurred, the amount of the loss is measured as the difference between the asset’s carrying amount and the present value of estimated future cash flows (excluding future credit losses that have not been incurred) discounted at the financial asset’s original EIR (i.e., the EIR computed at initial recognition). The carrying amount of the asset shall be reduced through use of an allowance account. The amount of the loss shall be recognized in the statement of comprehensive income.
The Association first assesses whether objective evidence of impairment exists individually for financial assets that are individually significant, and individually or collectively for financial assets that are not individually significant. If it is determined that no objective evidence of impairment exists for an individually assessed financial asset, whether significant or not, the asset is included in a group of financial assets with similar credit risk characteristics and that group of financial assets is collectively assessed for impairment. Assets that are individually assessed for impairment and for which an impairment loss is or continues to be recognized are not included in a collective assessment of impairment.

55
- 9 -
*SGVFS023432*
If, in a subsequent period, the amount of the impairment loss decreases and the decrease can be related objectively to an event occurring after the impairment was recognized, the previously recognized impairment loss is reversed. Any subsequent reversal of an impairment loss is recognized in the statement of comprehensive income, to the extent that the carrying value of the asset does not exceed its amortized cost at the reversal date.
Assets carried at cost If there is objective evidence that an impairment loss on an unquoted equity instrument that is not carried at fair value because its fair value cannot be reliably measured, or on a derivative asset that is linked to and must be settled by delivery of such an unquoted equity instrument has been incurred, the amount of the loss is measured as the difference between the asset’s carrying amount and the present value of estimated future cash flows discounted at the current market rate of return for a similar financial asset.
AFS financial assets If an AFS financial asset is impaired, an amount comprising the difference between its cost (net of any principal payment and amortization) and its current fair value, less any impairment loss previously recognized in the statement of comprehensive income, is transferred from equity to the statement of comprehensive income. Reversals in respect of equity instruments classified as AFS financial assets are not recognized in the statement of comprehensive income. Reversals of impairment losses on debt instruments are reversed through the statement of comprehensive income if the increase in fair value of the instrument can be objectively related to an event occurring after the impairment loss was recognized in the statement of comprehensive income.
Derecognition of Financial Assets and Liabilities Financial assets A financial asset (or, where applicable a part of a financial asset or part of a group of similar financial assets) is derecognized when:
the right to receive cash flows from the asset has expired; the Association retains the right to receive cash flows from the asset, but has assumed an
obligation to pay them in full without material delay to a third party under a ‘pass through’ arrangement; or
the Association has transferred its right to receive cash flows from the asset and either (a) has transferred substantially all the risks and rewards of the asset, or (b) has neither transferred nor retained substantially all the risks and rewards of the asset, but has transferred control of the asset.
Where the Association has transferred its right to receive cash flows from an asset and has neither transferred nor retained substantially all the risks and rewards of the asset nor transferred control of the asset, the asset is recognized to the extent of the Association’s continuing involvement in the asset. Continuing involvement that takes the form of a guarantee over the transferred asset is measured at the lower of the carrying amount of the asset and the maximum amount of consideration that the Association could be required to repay.
Financial liabilities A financial liability is derecognized when the obligation under the liability is discharged, cancelled or has expired. Where an existing financial liability is replaced by another from the same lender on substantially different terms, or the terms of an existing liability are substantially modified, such an exchange or modification is treated as a derecognition of the original liability

56
- 10 -
*SGVFS023432*
and the recognition of a new liability, and the difference in the respective carrying amounts is recognized in the Association’s statement of comprehensive income.
Investments in Associates Investments in CARD MRI Information Technology, Inc. (CMIT), BotiCARD, Inc. (BotiCARD), CARD Pioneer Microinsurance Inc. (CPMI), CARD MRI Holding, Inc. (CMHI) and CARD MRI Property Holding, Inc. (CMPHI), associates, are accounted for under the equity method of accounting. An associate is an entity in which the Association has significant influence and which is neither a subsidiary nor a joint venture. Under the equity method, the investment in associate is carried in the statement of financial position at cost plus post-acquisition changes in the Association’s share in the net assets of the investee. The statement of comprehensive income reflects the Association’s share of the results of the operations of the investee. Unrealized gains arising from inter Association transactions are eliminated to the extent of the Association’s interest therein. Unrealized losses are eliminated similarly but only to the extent that there is no evidence of impairment of the asset transferred. Dividends received are treated as a reduction in the carrying value of the investment.
Property and Equipment Property and equipment, except for land, are stated at cost less accumulated depreciation and any impairment in value. Land is carried at cost less any impairment in value. The initial cost of property and equipment comprises its purchase price, including taxes and directly attributable cost to bring the asset to its working condition and location for its intended use. Expenditures incurred after the fixed assets have been put into operation, such as repairs and maintenance are normally charged to income in the period in which the costs are incurred. In situations where it can be clearly demonstrated that the expenditures have resulted in an increase in the future economic benefits expected to be obtained from the use of an item of property and equipment beyond its originally assessed standard of performance, the expenditures are capitalized as an additional cost of property and equipment.
Depreciation is computed using the straight-line method over the estimated useful lives (EUL) of the assets as follows:
Years Building 10-15 Transportation equipment 5 Computer and office equipment 3 Office furniture and fixtures 3
Fully depreciated assets are retained in the accounts until they are no longer in use and no further charge for depreciation is made with respect to these assets.
The useful life and the depreciation method are reviewed periodically to ensure that the period and the method of depreciation are consistent with the expected pattern of economic benefits from items of property and equipment.
The carrying values of the property and equipment are reviewed for impairment when events or changes in circumstances indicate the carrying values may not be recoverable. If any such indication exists and where the carrying values exceed the estimated recoverable amounts, an impairment loss is recognized in the statement of comprehensive income.

57
- 11 -
*SGVFS023432*
Investment Properties Investment properties comprise of land and building that are held to earn rentals or capital appreciation or both and that are not occupied by the Association.
Investment properties are measured initially at cost, including transaction costs. Subsequent to initial recognition, investment property is stated at cost less accumulated depreciation and amortization and any impairment in value. Depreciation and amortization of investment properties are computed using the straight-line method over the estimated useful lives (EUL) of assets as follows:
In Years Building 10-15
Construction in-progress is carried at cost and transferred to the related investment property account when the construction and related activities to prepare the property for its intended use are complete, and the property is ready for occupancy.
The EUL and depreciation and amortization method are reviewed periodically to ensure that the period and method of depreciation and amortization are consistent with the expected pattern of economic benefits from items of investment properties.
Investment properties are derecognized when they have either been disposed of or when the investment properties are permanently withdrawn from use and no future benefit is expected from its disposal. Any gain or loss on the retirement or disposal of an investment property is recognized in profit or loss in which it arises.
Expenditures incurred after the investment properties have been put into operations, such as repairs and maintenance costs, are normally charged to operations in the period in which the costs are incurred.
Transfers are made to investment properties when, and only when, there is a change in use, evidenced by the end of owner occupation or commencement of an operating lease to another party. Transfers are made from investment properties when, and only when, there is a change in use, as evidenced by commencement or owner occupation or commencement of development with a view to sale.
Impairment of Nonfinancial Assets The Association assesses at each end of the reporting period whether there is an indication that property and equipment may be impaired. If any such indication exists, or when annual impairment testing for an asset is required, the Association makes an estimate of the asset’s recoverable amount. An asset’s recoverable amount is the higher of an asset’s or cash-generating unit’s fair value less costs to sell and its value in use and is determined for an individual asset, unless the asset does not generate cash inflows that are largely independent of those from other assets or groups of assets. Where the carrying amount of an asset exceeds its recoverable amount, the asset is considered impaired and is written down to its recoverable amount. In assessing value in use, the estimated future cash flows are discounted to their present value using a pre-tax discount rate that reflects current market assessments of the time value of money and the risks specific to the asset.

58
- 12 -
*SGVFS023432*
An assessment is made at each end of the reporting period as to whether there is any indication that previously recognized impairment losses may no longer exist or may have decreased. If such indication exists, the recoverable amount is estimated. A previously recognized impairment loss is reversed only if there has been a change in the estimates used to determine the asset’s recoverable amount since the last impairment loss was recognized. If that is the case, the carrying amount of the asset is increased to its recoverable amount. That increased amount cannot exceed the carrying amount that would have been determined, net of depreciation, had no impairment loss been recognized for the asset in prior years. Such reversal is recognized in statement of comprehensive income unless the asset is carried at revalued amount, in which case, the reversal is treated as a revaluation increase. After such reversal the depreciation charge is adjusted in future periods to allocate the asset’s revised carrying amount, less any residual value, on a systematic basis over its remaining useful life.
Fund Balance Fund balance represents accumulated excess of revenue over expenses.
Revenue Recognition The Association assesses its revenue arrangements against specific criteria in order to determine if it is acting as principal or agent. The Association has concluded that it is acting as principal and agent in its revenue agreements. The following specific recognition criteria must also be met before revenue is recognized:
Premiums revenue Premiums are recognized when collected. When premiums are recognized, actuarial liabilities are computed, with the result that benefits and expenses are matched with such revenue. The Association collects its premiums through the following affiliates that are considered as collecting institutions: (a) CARD Bank, Inc., (b) CARD, Inc., (c) CARD SME Bank, Inc. and (d) Rizal Bank, Inc.
Surrender charge Surrender charge pertains to the fee imposed by the Association for the cancellation of the member’s policy. This is intended for the administration costs incurred by the Association. Surrender charge is recognized when earned.
Interest income Interest on interest-bearing placements and securities are recognized based on the accrual accounting using the EIR.
Rental income Rental income is the income generated from the investment properties of the Association and recognized when earned.
Other income Income from other sources is recognized when earned.
Insurance Contract Liabilities Life insurance contract liabilities Life insurance contract liabilities are recognized when the contracts are entered into and the premiums are recognized. The reserve for life insurance contracts is calculated in compliance with the statutory requirements as set by the IC where the assumptions used are based on 60% of gross premiums of the Association for the year.

59
- 13 -
*SGVFS023432*
Golden life contract liabilities Golden life insurance contract liabilities are recognized when the contracts are entered into and the premiums are recognized. The reserve for golden life insurance contracts is calculated on the basis of a prudent prospective actuarial valuation method wherein the assumptions used are the 1980 Commissioners Standard Ordinary (CSO) Male - Age Nearest Birth Table for mortality and 4% as discount rate per annum. Both assumptions are duly approved by IC.
Loan redemption contract liabilities Loan redemption contract liabilities are recognized when the contracts are entered into and the premiums are recognized. The reserve for loan redemption is computed using the unearned net premium reserves method.
Liability adequacy test Liability adequacy tests are performed annually to ensure the adequacy of the insurance contract liabilities. In performing these tests, current best estimates of future contractual cash flows, claims handling and policy administration expenses are used. Any deficiency is immediately charged against the statement of comprehensive income initially by establishing a provision for losses arising from the liability adequacy tests.
Claim Costs Liabilities for unpaid claim costs and loss adjustment expenses relating to insurance contracts are accrued when insured events occur. The liabilities for unpaid claims, including those for incurred but not reported losses, are measured using the chain ladder method, based on a reasonable estimate of ultimate claim amounts. The method of determining such estimates and establishing reserves are continually reviewed and updated. Changes in estimates of claim costs resulting from the continuous review process and differences between estimates and payments for claims are recognized as income or expense in the period when the estimates are changed or payments are made.
Expense Recognition Expenses are decreases in economic benefits during the accounting period in the form of outflows or decrease of assets or incurrence of liabilities that result in decrease in equity, other than those relating to distributions to equity participants.
Benefits and claims Life insurance claims reflect the cost of all claims arising during the year, including claims handling costs. Death claims and surrenders are recorded on the basis of notifications received. Maturities and annuity payments are recorded when due. Benefits recorded are then accrued as liabilities.
Claims handling costs include internal and external costs incurred in connection with the negotiation and settlement of claims. Internal costs include all direct expenses of the claims department and any part of the general and administrative expenses directly attributable to the claims function.
General and administrative expenses Expenses consist of costs of administering the business. These are recognized as expenses as incurred.

60
- 14 -
*SGVFS023432*
Defined benefit plan The net defined benefit liability or asset is the aggregate of the present value of the defined benefit obligation at the end of the reporting period reduced by the fair value of plan assets (if any), adjusted for any effect of limiting a net defined benefit asset to the asset ceiling. The asset ceiling is the present value of any economic benefits available in the form of refunds from the plan or reductions in future contributions to the plan.
The cost of providing benefits under the defined benefit plans is actuarially determined using the projected unit credit method.
Defined benefit costs comprise the following: Service cost Net interest on the net defined benefit liability or asset Remeasurements of net defined benefit liability or asset
Service costs which include current service cost, past service cost and gains or losses on non-routine settlements are recognized as expense in profit or loss. Past service costs are recognized when plan amendment or curtailment occurs. These amounts are calculated periodically by independent qualified actuaries.
Net interest on the net defined benefit liability or asset is the change during the period in the net defined benefit liability or asset that arises from the passage of time which is determined by applying the discount rate based on government bonds to the net defined benefit liability or asset. Net interest on the net defined benefit liability or asset is recognized as expense or income in the statement of comprehensive income.
Remeasurements comprising actuarial gains and losses, return on plan assets and any change in the effect of the asset ceiling (excluding net interest on defined benefit liability) are recognized immediately in other comprehensive income in the period in which they arise. Remeasurements are not reclassified to profit or loss in subsequent periods.
Plan assets are assets that are held by a long-term employee benefit fund or qualifying insurance policies. Plan assets are not available to the creditors of the Group, nor can they be paid directly to the Association. Fair value of plan assets is based on market price information. When no market price is available, the fair value of plan assets is estimated by discounting expected future cash flows using a discount rate that reflects both the risk associated with the plan assets and the maturity or expected disposal date of those assets (or, if they have no maturity, the expected period until the settlement of the related obligations). If the fair value of the plan assets is higher than the present value of the defined benefit obligation, the measurement of the resulting defined benefit asset is limited to the present value of economic benefits available in the form of refunds from the plan or reductions in future contributions to the plan.
Leases The determination of whether an arrangement is, or contains a lease, is based on the substance of the arrangement at inception date, and requires an assessment of whether the fulfillment of the arrangement is dependent on the use of a specific asset and the arrangement conveys a right to use the asset. A reassessment is made after inception of the lease only if one of the following applies: a) there is a change in contractual terms, other than a renewal or extension of the arrangement; b) a renewal option is exercised or an extension granted, unless that term of the renewal or
extension was initially included in the lease term;

61
- 15 -
*SGVFS023432*
c) there is a change in the determination of whether fulfillment is dependent on a specified asset; or
d) there is a substantial change to the asset.
Where a reassessment is made, lease accounting shall commence or cease from the date when the change in circumstances gave rise to the reassessment for any of the scenarios above, and at the renewal or extension period for the second scenario.
The Association as lessee Leases where the lessor retains substantially all the risks and benefits of ownership of the asset are classified as operating leases. Operating lease payments are recognized as expense in the statement of comprehensive income on a straight-line basis over the lease term. Indirect costs incurred in negotiating an operating lease are added to the carrying value of the leased asset and recognized over the lease term on the same basis as the lease income. Minimum lease payments are recognized on a straight-line basis while the variable rent is recognized as an expense based on the terms of the lease contract.
The Association as lessor Leases where the Association retains substantially all the risks and benefits of ownership of the asset are classified as operating leases. Initial direct costs incurred in negotiating an operating lease are added to the carrying amount of the leased asset and recognized over the lease term on the same bases as rental income. Contingent rents are recognized as revenue in the period in which these are earned.
Provisions Provisions are recognized when an obligation (legal or constructive) is incurred as a result of a past event and where it is probable that an outflow of resources embodying economic benefits will be required to settle the obligation and a reliable estimate can be made of the amount of the obligation. If the effect of the time value of money is material, provisions are determined by discounting the expected future cash flows at a pre-tax rate that reflects current market assessment of the time value of money and, where appropriate, the risks specific to the liability. Where discounting is used, the increase in the provision due to the passage of time is recognized as an interest expense.
Contingent Liabilities and Contingent Assets Contingent liabilities are not recognized in the financial statements. They are disclosed unless the possibility of an outflow of resources embodying economic benefits is remote. Contingent assets are not recognized in the financial statements but disclosed when an inflow of economic benefits is probable.
Events After the End of the Reporting Period Any post period year-end event that provides additional information about the Association’s position at the end of the reporting period (adjusting event) is reflected in the financial statements. Any post year-end event that is not adjusting event, is disclosed when material to the financial statements.

62
- 16 -
*SGVFS023432*
5. Significant Accounting Judgments, Estimates and Assumptions
The preparation of the financial statements in accordance with PFRS requires the Association to make estimates and assumptions that affect the reported amounts of assets, liabilities, income and expenses and disclosure of contingent assets and contingent liabilities. Future events may occur which will cause the assumptions used in arriving at the estimates to change. The effects of any change in estimates are reflected in the financial statements as they become reasonably determinable.
Estimates and judgments are continually evaluated and are based on historical experience and other factors, including expectations of future events that are believed to be reasonable under the circumstances.
Judgments Product classification The Association has determined that the insurance policies it issues have significant insurance risk and therefore meet the definition of an insurance contract and should be accounted for as such. The significance of insurance risk is dependent on both the probability of an insured event and the magnitude of its potential effect. As a general guideline, the Association defines significant insurance risk as the possibility of having to pay benefits on the occurrence of an insured event that are at least 10% more than the benefits payable if the insured event did no occur.
Classification of HTM investments The Association classifies non-derivative financial assets with fixed or determinable payments and fixed maturities as HTM investments. This classification requires significant judgment. In making this judgment, the Association evaluates its intention and ability to hold such investments to maturity. If the Association fails to keep these investments to maturity other than in certain specific circumstances, the Association will be required to reclassify the entire portfolio as AFS financial assets and to measure these at fair value and not at amortized cost. The Association has HTM investments amounting to P=7,947.63 million and P=6,297.16 million as of December 31, 2016 and 2015, respectively (see Note 7). As of December 31, 2016 and 2015, the fair value of HTM investments amounted to P=7,799.65 million and P=6,357.12 million, respectively (see Note 7).
Operating leases - Association as lessee The Association has entered into lease agreements related to various properties for its provincial offices. The Association has determined that the lessors retain all significant risks and rewards of ownership of these properties and thus accounts for these as operating leases.
Operating leases - Association as lessor The Association has entered into contracts of lease for its investment properties. The Association has determined that it retains all the significant risks and rewards of ownership of these properties which are leased out on operating leases.
Distinction between investment properties and owner-occupied properties The Association determines whether a property qualifies as an investment property. In making its judgment, the Association considers whether the property generates cash flows largely independent of the other assets held by an entity. Owner-occupied properties generate cash flows that are attributable not only to property but also to the other assets used in the production or supply process.

63
- 17 -
*SGVFS023432*
Classification of financial assets The Association classifies financial assets by evaluating, among others, whether the asset is quoted or not in an active market. Included in the evaluation on whether a financial asset is quoted in an active market is the determination on whether quoted prices are readily and regularly available, and whether those prices represent actual and regularly occurring market transactions on an arm’s-length basis. The carrying value of AFS financial assets not quoted in an active market amounted to P=234.99 million and P=167.08 million as of December 31, 2016 and 2015, respectively (see Note 9).
Fair value of financial instruments The Association carries certain financial assets at fair value, which requires extensive use of accounting estimates and judgments. Fair value determinations for financial assets and liabilities are based generally on listed or quoted market prices. If prices are not readily determinable or if liquidating the positions is reasonably expected to affect market prices, fair value is based on either internal valuation models or management’s estimate of amounts that could be realized under current market conditions, assuming an orderly liquidation over a reasonable period of time.
While significant components of fair value were determined using verifiable objective evidence (i.e., foreign exchange rates, interest rates, volatility rates), the amount of changes in fair value of these financial assets and liabilities would affect profit and loss and equity.
The following are the details of financial instruments carried at fair value:
2016 2015 Financial assets AFS financial assets (Note 9) P=363,217,249 P=269,889,468
The fair values of the Association’s financial instruments follow (see Note 28):
2016 2015 Financial assets P=9,353,498,547 P=7,676,747,398 Financial liabilities 65,362,483 87,022,943
Estimates Impairment of nonfinancial assets The Association assesses impairment on assets whenever events or changes in circumstances indicate that the carrying amount of an asset may not be recoverable. The factors that the Association considers important which could trigger an impairment review include the following:
significant underperformance relative to expected historical or projected future operating
results; significant changes in the manner of use of the acquired assets or the strategy for overall
business; and significant negative industry or economic trends.
The Association recognizes an impairment loss whenever the carrying amount of the asset exceeds its recoverable amount. Recoverable amounts are estimated for individual assets or, if it is not possible, for the CGU to which the asset belongs.
For the years ended December 31, 2016 and 2015, no impairment loss has been recognized for the Association’s property and equipment.

64
- 18 -
*SGVFS023432*
The following table sets forth the carrying values of property and equipment and investment properties as of December 31:
2016 2015 Property and equipment (Note 11) P=225,688,947 P=176,596,378 Investment property (Note 12) 213,471,981 210,372,898
Impairment of receivables The Association reviews its receivables to assess impairment annually. In determining whether an impairment loss should be recorded in the statement of revenue and expenses, the Association makes judgments as to whether there is any observable data indicating that there is a measurable decrease in the estimated future cash flows from a portfolio of loans before the decrease can be identified with an individual loan in that portfolio. Total receivables net of allowance for impairment losses amounted to P=142.16 million and P=209.44 million as of December 31, 2016 and 2015, respectively (see Note 8). Allowance for impairment losses amounted to P=2.81 million and P=20.42 million as of December 31, 2016 and 2015, respectively (see Note 8).
Impairment of AFS financial assets The Association determines that AFS financial assets are impaired when there has been a significant or prolonged decline in the fair value below cost. This determination of what is significant or prolonged requires judgment. In making this judgment, the Association evaluates among other factors, the normal volatility in price. In addition, impairment may be appropriate when there is evidence of deterioration in the financial health of the investee, industry and sector performance, changes in technology, and operational and financing cash flows. As of December 31, 2016 and 2015, the fair value of AFS financial assets amounted to P=598.21 million and P=436.96 million, respectively (see Note 9). There is no impairment loss recognized on AFS financial assets in 2016 and 2015.
Retirement and other employee benefits The cost of defined benefit pension plans and other post-employment benefits as well as the present value of the pension obligation are determined using actuarial valuations. The actuarial valuation involves making various assumptions. These include the determination of the discount rates, future salary increases, mortality rates and future pension increases. Due to the complexity of the valuation, the underlying assumptions and its long-term nature, defined benefit obligations are highly sensitive to changes in these assumptions. All assumptions are reviewed at each reporting date. The net pension asset amounted to P=29.56 million as at December 31, 2016 and the P=14.36 million as at December 31, 2015. Further details are provided in Note 27.
In determining the appropriate discount rate, management considers the interest rates of government bonds that are denominated in the currency in which the benefits will be paid, with extrapolated maturities corresponding to the expected duration of the defined benefit obligation.
The mortality rate is based on publicly available mortality tables for the specific country and is modified accordingly with estimates of mortality improvements. Future salary increases and pension increases are based on expected future inflation rates for the specific
Provision for reserves The estimation of ultimate liability arising from claims made under life insurance contracts is the Association’s most critical accounting estimate. There are several sources of uncertainty that need to be considered in the estimate of the liability that the Association will ultimately pay for such claims. Previous experience and trends are fundamentally considered in determining the liability. In determining the provision for reserves, estimates are made as to the expected number of deaths,

65
- 19 -
*SGVFS023432*
illness or injury for each of the years in which the Association is exposed to risk. These estimates are based on standard industry and national mortality and morbidity tables. The estimated number of deaths, illness or injury determines the value of possible future benefits to be paid out, which will be factored into ensuring sufficient cover by reserves, which in return is monitored against current and future premiums. Estimates are also made to future investment income arising from the assets backing life insurance contracts. These estimates are based on weighted average rate of return arising from the assets backing life insurance contracts. Refer to Note 28 for the key assumptions used in the estimation of provision for reserves.
6. Cash and Cash Equivalents
This account consists:
2016 2015 Cash on hand P=171,158 P=1,345,678 Cash in banks 56,420,739 86,869,375 Cash equivalents 76,282,192 289,940,018 P=132,874,089 P=378,155,071
Cash in banks earns interest at the prevailing bank deposit rates ranging from 0.10% to 2.00% in 2016 and in 2015.
Cash equivalents are made for varying periods of up to three (3) months depending on the immediate cash requirements of the Association and earn interest at the prevailing rates ranging from 1.75% to 1.80% and 1.25% to 2.00% in 2016 and 2015, respectively.
Interest income earned from cash and cash equivalents amounted to P=4.32 million and P=6.12 million in 2016 and 2015, respectively (see Note 19).
7. Held-to-Maturity Investments
As of December 31, 2016 and 2015, the carrying amounts and fair values of these securities follow:
2016 2015 Carrying Value Fair Value Carrying Value Fair Value Fixed treasury notes P=4,989,968,026 P=4,886,751,309 P=4,045,476,854 P=4,090,081,597 Retail treasury bonds 2,579,664,278 2,541,171,846 1,945,763,507 1,951,892,160 Corporate bonds 348,000,000 341,244,782 188,100,000 191,536,083 Government bonds 30,000,000 30,477,882 117,819,930 123,612,347 P=7,947,632,304 P=7,799,645,819 P=6,297,160,291 P=6,357,122,187
These investments bear annual interest rates which ranged from 3.25% to 7.75% in 2016 and 3.25% to 9.13% in 2015 and will mature between one (1) and ten (10) years from the statements of financial position date. Interest income from these investments net of premium amortization amounted to P=199.16 million and P=182.71 million in 2016 and 2015, respectively (see Note 19).

66
- 20 -
*SGVFS023432*
The carrying value of HTM investments follows:
2016 2015 At January 1 P=6,297,160,292 P=5,104,317,821 Additions 2,377,095,796 1,338,942,053 Amortization of bond premium (127,702,909) (22,937,395) Maturities (598,920,875) (123,162,188) At December 31 P=7,947,632,304 P=6,297,160,291
As at December 31, 2016 and 2015, HTM investments include government securities classified as guaranty fund amounting to P=136.21 million and P=125.76 million, respectively. These investments are deposited with the IC, in accordance with the provisions of Section 405 of the 2013 Revised Insurance Code, as security for the benefit of policyholders and creditors of the Association.
8. Loans and Receivables
As of December 31, 2016 and 2015, the Association’s loans and receivables are as follows:
2016 2015 Receivables - net P=142,162,929 P=209,440,373 Short term investments 113,413,490 240,420,682 Long term investments 475,388,639 72,681,045 P=730,965,058 P=522,542,100
Receivables This account consists of:
2016 2015 Receivables from:
Related parties (Note 23) P=20,006,170 P=79,782,447 Members and employees 1,930,843 1,474,989
Accrued interest receivable 79,338,746 70,078,688 Loans receivable (Note 23) 35,000,000 25,833,334 Advances for future stock subscription (Note 9) 4,000,000 44,177,000 Dividends receivable − 6,627,008 Others 4,698,751 1,884,299 144,974,510 229,857,765 Less allowance for impairment losses 2,811,581 20,417,392 P=142,162,929 P=209,440,373
Receivables from related parties pertain to premiums collected by related parties from the Association’s members, commissions and claims paid on behalf of CPMI. These are generally on 1-to-30 day terms. Receivables from members and employees include receivables from the Association’s members of Build-Operate and Transfer (BOAT) program representing unremitted premiums. It also includes receivables from the Association’s employees due to the excess claims and benefits disbursed to its members. These receivables are expected to be settled and collected within thirty (30) days.

67
- 21 -
*SGVFS023432*
Accrued interest receivable pertains mainly to interest accrued arising from cash and cash equivalents, short-term and long term investments, investments in government securities, corporate bonds and notes. Loans receivable pertain to loan agreements of the Association with its related parties. The movements in loans receivable follow:
2016 2015 At January 1 P=25,833,334 P=31,666,667 Additions 25,000,000 10,000,000 Principal collections (15,833,334) (15,833,333) At December 31 P=35,000,000 P=25,833,334
Details of the loan receivable per related party follow:
2016
Outstanding
balance Release date Interest rate Terms CARD Leasing and Finance
Corporation (CLFC) P=10,000,000 September 4,
2015 4.5% per
annum payable
quarterly
Principal payable upon maturity on September
3, 2018
CARD MRI Information
Technology, Inc. (CMIT) 15,000,000 September 16,
2016 4% per annum
payable quarterly
Principal payable upon maturity on September
15, 2017
10,000,000 December 13, 2016
4% per annum payable
quarterly
Principal payable upon maturity on Dec. 13,
2017
2015
Outstanding
balance Release date Interest rate Terms Responsible Investments for
Solidarity and Empowerment (RISE) Financing Company
P=2,500,000 October 16, 2014 6% per annum payable
quarterly
Principal payable quarterly for 2 years until
October 28,2016 CARD Employees Multipurpose
Cooperative (EMPC) 6,666,667 October 10, 2013 5% per annum
payable quarterly
Principal payable semi-annually for 3 years until
October 28, 2016 CARD Leasing and Finance
Corporation (CLFC) 6,666,667 October 4, 2013 6% per annum
payable quarterly
Principal payable semi-annually for 3 years until
October 4, 2016
10,000,000 September 4, 2015
4.5% per annum payable
quarterly
Principal payable upon maturity on September 3,
2018
Total interest income received from the loans receivable amounted to P=1.37 million and P=1.47 million in 2016 and 2015, respectively (see Note 19).
Advances for future stock subscriptions as of December 31, 2016 pertain to deposit made by the Association to Rizal Bank, Inc. for the subscription of 20,000 shares at P=200 par. As of December 31, 2016, Bangko Sentral ng Pilipinas (BSP) has not yet issued approval for the increase in authorized capital stock of Rizal Bank, Inc.

68
- 22 -
*SGVFS023432*
As of December 31, 2016, advances for future stock subscription pertain to subscription for 20,000 preferred shares of Rizal Bank, Inc. at P=200 par. In 2015, advances for future stock subscription pertain to CARD Bank, Inc. and UniHealth Lucena Hospital and Medical Center for the subscription of 213,385 shares at P=200 par and 1,500 shares at P=1,000 par, respectively, which were already transferred to available-for-sale investments in 2016.
Other receivables represent claims from the different suppliers of the Association due to overpayment of services and products availed and purchased. These amounts are expected to be settled within seven (7) days.
As of December 31, 2016 and 2015, allowance for impairment losses for receivables determined based on specific identification and assessment follows:
Receivables from
Related Parties Other
Receivables Total At January 1, 2015 Write-off
P=16,791,367 (13,078)
P=746,340 (392,575)
P=17,537,707 (405,653)
Provision for impairment losses (Note 21) 3,220,227 65,111 3,285,338
At December 31, 2015 19,998,516 418,876 20,417,392 Write-off (4,559,560) (21,578) (4,581,138) Reversal (12,949,917) (74,756) (13,024,673) At December 31, 2016 P=2,489,039 P=322,542 P=2,811,581
In 2016, amounts written off represent accounts from CaMIA which are related to the advances for claims made by the Association due to calamities which are assessed to be uncollectible after exerting all the best efforts to retrieve the required documents.
In 2015, amounts written off represent accounts from CARD MRI staff which are assessed to be uncollectible after due effort to collect since the involved persons have already resigned.
Short Term Investments Short-term investments are money market placements with maturities of more than three (3) months but less than one (1) year and bear annual interest at rates that ranged from 0.75% to 4.25% in 2016 and 0.75% to 1.83% in 2015. Interest income earned from these investments amounted to P=5.78 million and P=4.07 million in 2016 and 2015, respectively (see Note 19).
The rollforward analysis of short-term investments follows:
2016 2015 Balance at January 1 P=240,420,682 P=168,257,482 Additions 1,414,506,236 294,513,149 Maturities (1,541,513,428) (222,349,949) Balance at December 31 P=113,413,490 P=240,420,682

69
- 23 -
*SGVFS023432*
Long Term Investments The long-term investments are placements with maturity of more than one (1) year but less than five (5) years that bear annual interest of 4.00% to 6.00% in 2016 and 6.00% in 2015. Interest income earned from these investments amounted to P=4.67 million and P=4.36 million in 2016 and 2015, respectively (see Note 19). Acquisitions during the year amounted to P=402.71 million.
2016 2015 Balance at January 1 P=72,681,045 P=72,681,045 Additions 402,707,594 − Balance at December 31 P=475,388,639 P=72,681,045
9. Available-for-Sale Financial Assets
This account consists of:
2016 2015 Quoted securities - at fair value Mutual funds P=363,217,249 P=269,889,468 Unquoted securities - at cost Preferred shares 234,992,200 167,075,200 P=598,209,449 P=436,964,668
The carrying values of AFS financial assets have been determined as follows:
Quoted Equity
Securities
Unquoted Equity
Securities Investments in Mutual Funds Total
At January 1, 2015 Additions
P=76,147,335 −
P=163,691,400 3,383,800
P=269,819,559 −
P=509,658,294 3,383,800
Fair value gains (1,149,960) − 69,909 (1,080,051) Disposals (74,997,375) − − (74,997,375) At December 31, 2015 − 167,075,200 269,889,468 436,964,668 Additions − 67,917,000 100,429,366 168,346,366 Fair value losses − − (7,101,585) (7,101,585) At December 31, 2016 P=− P=234,992,200 P=363,217,249 P=598,209,449
Investments in quoted equity securities pertain to the Association’s investment in San Miguel Corporation preferred shares which was redeemed in September 2015 for a settlement price of P=75.00 million.
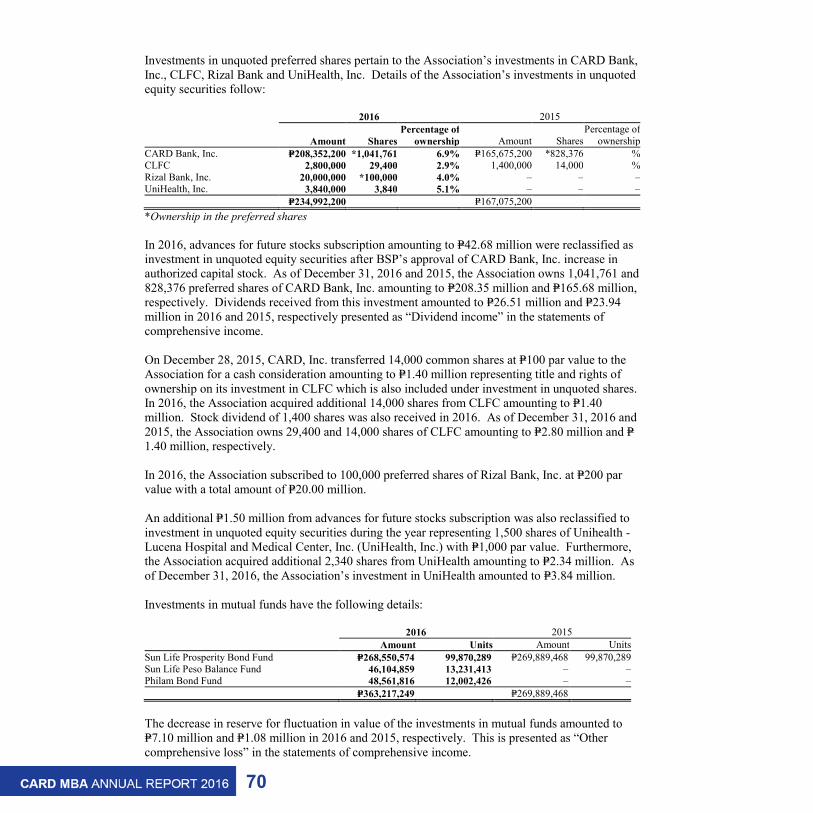
70
- 24 -
*SGVFS023432*
Investments in unquoted preferred shares pertain to the Association’s investments in CARD Bank, Inc., CLFC, Rizal Bank and UniHealth, Inc. Details of the Association’s investments in unquoted equity securities follow:
2016 2015
Amount Shares Percentage of
ownership Amount Shares Percentage of
ownership CARD Bank, Inc. P=208,352,200 *1,041,761 6.9% P=165,675,200 *828,376 % CLFC 2,800,000 29,400 2.9% 1,400,000 14,000 % Rizal Bank, Inc. 20,000,000 *100,000 4.0% – – – UniHealth, Inc. 3,840,000 3,840 5.1% – – – P=234,992,200 P=167,075,200 *Ownership in the preferred shares
In 2016, advances for future stocks subscription amounting to P=42.68 million were reclassified as investment in unquoted equity securities after BSP’s approval of CARD Bank, Inc. increase in authorized capital stock. As of December 31, 2016 and 2015, the Association owns 1,041,761 and 828,376 preferred shares of CARD Bank, Inc. amounting to P=208.35 million and P=165.68 million, respectively. Dividends received from this investment amounted to P=26.51 million and P=23.94 million in 2016 and 2015, respectively presented as “Dividend income” in the statements of comprehensive income. On December 28, 2015, CARD, Inc. transferred 14,000 common shares at P=100 par value to the Association for a cash consideration amounting to P=1.40 million representing title and rights of ownership on its investment in CLFC which is also included under investment in unquoted shares. In 2016, the Association acquired additional 14,000 shares from CLFC amounting to P=1.40 million. Stock dividend of 1,400 shares was also received in 2016. As of December 31, 2016 and 2015, the Association owns 29,400 and 14,000 shares of CLFC amounting to P=2.80 million and P=1.40 million, respectively.
In 2016, the Association subscribed to 100,000 preferred shares of Rizal Bank, Inc. at P=200 par value with a total amount of P=20.00 million.
An additional P=1.50 million from advances for future stocks subscription was also reclassified to investment in unquoted equity securities during the year representing 1,500 shares of Unihealth - Lucena Hospital and Medical Center, Inc. (UniHealth, Inc.) with P=1,000 par value. Furthermore, the Association acquired additional 2,340 shares from UniHealth amounting to P=2.34 million. As of December 31, 2016, the Association’s investment in UniHealth amounted to P=3.84 million.
Investments in mutual funds have the following details: 2016 2015 Amount Units Amount Units Sun Life Prosperity Bond Fund P=268,550,574 99,870,289 P=269,889,468 99,870,289 Sun Life Peso Balance Fund 46,104,859 13,231,413 – – Philam Bond Fund 48,561,816 12,002,426 – – P=363,217,249 P=269,889,468
The decrease in reserve for fluctuation in value of the investments in mutual funds amounted to P=7.10 million and P=1.08 million in 2016 and 2015, respectively. This is presented as “Other comprehensive loss” in the statements of comprehensive income.

71
- 25 -
*SGVFS023432*
The rollforward of the reserve for fluctuation in value of AFS financial assets follows:
2016 2015 At January 1 P=41,780,646 P=42,860,697 Fair value losses on AFS financial assets (7,101,585) (1,080,051) At December 31 P=34,679,061 P=41,780,646
10. Financial Assets at FVPL
This account consists of San Miguel Corporation quoted preferred shares. All San Miguel Corporation shares were retired on February 24, 2015. Total dividend income amounted to P=0.40 million in 2015.
2015 At January 1 P=20,180,000 Fair value losses on FVPL financial assets (180,000) Disposal (20,000,000) At December 31 P=−

72
- 26
-
*SGV
FS02
3432
*
11. P
rope
rty
and
Equ
ipm
ent -
net
The
com
posi
tion
and
mov
emen
ts in
this
acc
ount
follo
w:
2016
L
and
Lan
d im
prov
emen
t T
rans
port
atio
n eq
uipm
ent
Com
pute
r an
d of
fice
equi
pmen
t O
ffic
e fu
rnitu
re
and
fixtu
res
Bui
ldin
g C
onst
ruct
ion
in -
prog
ress
T
otal
C
ost
At J
anua
ry 1
P=1
38,1
52,9
52
P=159
,750
P=5
,747
,474
P=2
2,70
5,55
6 P=2
,607
,740
P=1
3,78
3,36
9 P=1
9,63
2,80
9 P=2
02,7
89,6
50
Add
ition
s 25
,000
35
4,41
8 −
2,42
7,90
8 84
4,22
5 35
,781
,288
39,4
32,8
39
Rec
lass
ifica
tions
−
− −
− −
19,6
32,8
09
(19,
632,
809)
−
Sale
−
− (2
,173
,487
) −
(58,
195)
−
− (2
,231
,682
) R
etire
men
t −
− −
(7,3
67,9
36)
− −
− (7
,367
,936
) Tr
ansf
ers f
rom
inve
stm
ent p
rope
rties
(Not
e 12
) −
− −
− −
14,7
39,0
02
− 14
,739
,002
A
t Dec
embe
r 31
138,
177,
952
514,
168
3,57
3,98
7 17
,765
,528
3,
393,
770
83,9
36,4
68
− 24
7,36
1,87
3 A
ccum
ulat
ed D
epre
ciat
ion
At J
anua
ry 1
−
2,60
1 5,
038,
511
17,4
84,7
21
1,84
8,75
7 1,
818,
682
− 26
,193
,272
D
epre
ciat
ion
(Not
e 21
) −
39,9
46
89,2
82
1,97
2,16
2 49
5,68
1 2,
476,
351
− 5,
073,
422
Sale
−
− (2
,173
,487
) −
(52,
345)
−
− (2
,225
,832
) R
etire
men
t −
− −
(7,3
67,9
36)
− −
− (7
,367
,936
) A
t Dec
embe
r 31
− 42
,547
2,
954,
306
12,0
88,9
47
2,29
2,09
3 4,
295,
033
− 21
,672
,926
N
et B
ook
Val
ue
P=138
,177
,952
P=4
71,6
21
P=619
,681
P=5
,676
,581
P=1
,101
,677
P=7
9,64
1,43
5 P=−
P=2
25,6
88,9
47
2015
La
nd
Land
Im
prov
emen
t Tr
ansp
orta
tion
equi
pmen
t C
ompu
ter a
nd
offic
e eq
uipm
ent
Offi
ce fu
rnitu
re
and
fixtu
res
Bui
ldin
g C
onst
ruct
ion
in -
prog
ress
To
tal
Cos
t
A
t Jan
uary
1
P=186
,167
,373
P=−
P=5
,839
,109
P=1
9,79
5,38
7 P=2
,071
,320
P=8
,613
,576
P=3
9,09
4,45
4 P=2
61,5
81,2
19
Add
ition
s (3
73,5
01)
159,
750
(30,
235)
2,
933,
669
536,
420
5,16
9,79
3 39
,436
,782
47
,832
,678
R
etire
men
t −
− (6
1,40
0)
(23,
500)
−
− −
(84,
900)
Tr
ansf
ers t
o in
vest
men
t pro
perti
es (N
ote
12)
(47,
640,
920)
−
− −
− −
(58,
898,
427)
(1
06,5
39,3
47)
At D
ecem
ber 3
1 13
8,15
2,95
2 15
9,75
0 5,
747,
474
22,7
05,5
56
2,60
7,74
0 13
,783
,369
19
,632
,809
20
2,78
9,65
0 A
ccum
ulat
ed D
epre
ciat
ion
At J
anua
ry 1
−
− 4,
060,
123
15,4
85,6
27
1,42
8,02
4 58
5,98
6 −
21,5
59,7
60
Dep
reci
atio
n (N
ote
21)
− 2,
601
1,00
3,97
1 2,
022,
594
420,
733
1,23
2,69
6 −
4,68
2,59
5 R
etire
men
t −
− (2
5,58
3)
(23,
500)
−
−
−
(49,
083)
A
t Dec
embe
r 31
− 2,
601
5,03
8,51
1 17
,484
,721
1,
848,
757
1,81
8,68
2 −
26,1
93,2
72
Net
Boo
k V
alue
P=1
38,1
52,9
52
P=157
,149
P=7
08,9
63
P=5,2
20,8
35
P=758
,983
P=1
1,96
4,68
7 P=1
9,63
2,80
9 P=1
76,5
96,3
78

73
- 27 -
*SGVFS023432*
In 2016, reclassifications amounting to P=19.63 million pertain to transfer of completed construction in progress to building.
In 2016, gain on retirement of transportation equipment and office furniture and fixtures amounted to P=370,666. While in 2015, loss on retirement of transportation equipment amounted to P=35,817. The transfers to/from investment properties were due to changes in management’s intention over the use of the properties (see Note 12).
The cost of fully depreciated property and equipment still in use amounted to P=10.55 million and P=16.30 million as of December 31, 2016 and 2015, respectively.
12. Investment Properties
The movement of this account follows:
2016
Land Building Construction in
Progress Total Cost At January 1 P=111,760,955 P=45,924,024 P=58,898,427 P=216,583,406 Additions 541,587 24,075,613 − 24,617,200 Reclassifications − 58,898,427 (58,898,427) − Transfers to property and
equipment (Note 11) − (14,739,002) − (14,739,002) At December 31 112,302,542 114,159,062 − 226,461,604 Accumulated Depreciation At January 1 − 6,210,508 − 6,210,508 Depreciation (Note 21) − 6,779,115 − 6,779,115 At December 31 − 12,989,623 − 12,989,623 Net Book Value P=112,302,542 P=101,169,439 P=− P=213,471,981
2015
Land Building Construction in
Progress Total Cost At January 1 P=− P=34,733,155 P=3,905,204 P=38,638,359 Additions 64,120,035 3,874,712 3,410,953 71,405,700 Reclassifications − 7,316,157 (7,316,157) − Transfers from property and
equipment (Note 11) 47,640,920 − 58,898,427 106,539,347 At December 31 111,760,955 45,924,024 58,898,427 216,583,406 Accumulated Depreciation At January 1 − 1,857,903 − 1,857,903 Depreciation (Note 21) − 4,352,605 − 4,352,605 At December 31 − 6,210,508 − 6,210,508 Net Book Value P=111,760,955 P=39,713,516 P=58,898,427 P=210,372,898
In 2016, the Association transferred portion of its investment properties with a carrying value of P=14.74 million to property and equipment. While in 2015, ₱106.54 million of property and equipment was transferred to investment properties. The transfers from/to property and equipment were due to changes in management’s intention over the use of the properties (see Note 11).
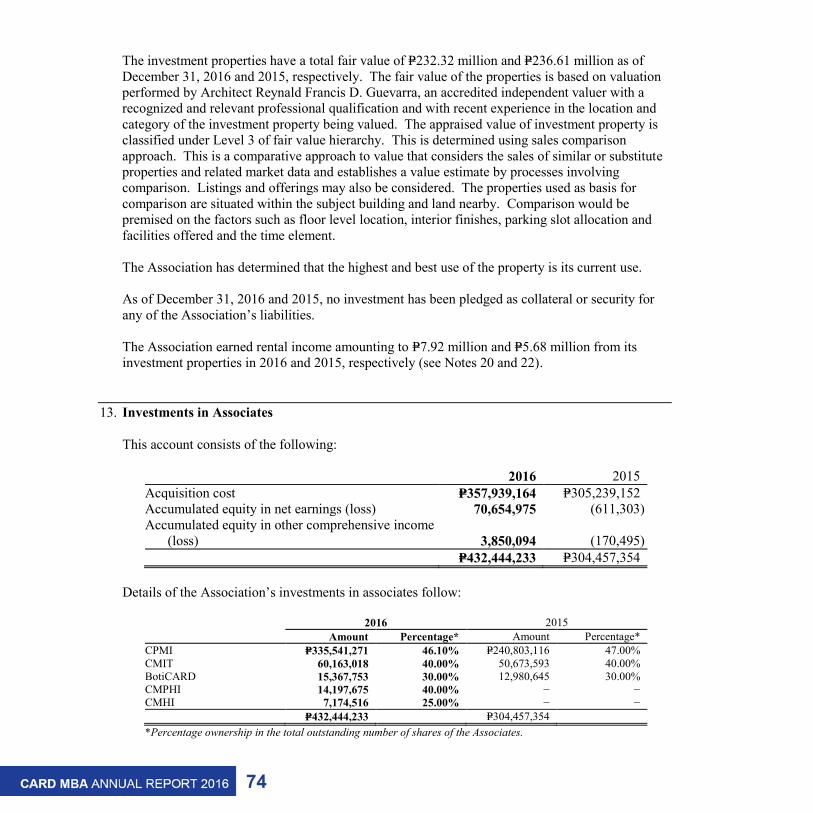
74
- 28 -
*SGVFS023432*
The investment properties have a total fair value of P=232.32 million and P=236.61 million as of December 31, 2016 and 2015, respectively. The fair value of the properties is based on valuation performed by Architect Reynald Francis D. Guevarra, an accredited independent valuer with a recognized and relevant professional qualification and with recent experience in the location and category of the investment property being valued. The appraised value of investment property is classified under Level 3 of fair value hierarchy. This is determined using sales comparison approach. This is a comparative approach to value that considers the sales of similar or substitute properties and related market data and establishes a value estimate by processes involving comparison. Listings and offerings may also be considered. The properties used as basis for comparison are situated within the subject building and land nearby. Comparison would be premised on the factors such as floor level location, interior finishes, parking slot allocation and facilities offered and the time element.
The Association has determined that the highest and best use of the property is its current use.
As of December 31, 2016 and 2015, no investment has been pledged as collateral or security for any of the Association’s liabilities.
The Association earned rental income amounting to P=7.92 million and P=5.68 million from its investment properties in 2016 and 2015, respectively (see Notes 20 and 22).
13. Investments in Associates
This account consists of the following:
2016 2015 Acquisition cost P=357,939,164 P=305,239,152 Accumulated equity in net earnings (loss) 70,654,975 (611,303) Accumulated equity in other comprehensive income
(loss) 3,850,094 (170,495) P=432,444,233 P=304,457,354
Details of the Association’s investments in associates follow:
2016 2015 Amount Percentage* Amount Percentage* CPMI P=335,541,271 46.10% P=240,803,116 47.00% CMIT 60,163,018 40.00% 50,673,593 40.00% BotiCARD 15,367,753 30.00% 12,980,645 30.00% CMPHI 14,197,675 40.00% − − CMHI 7,174,516 25.00% − − P=432,444,233 P=304,457,354 *Percentage ownership in the total outstanding number of shares of the Associates.

75
- 29 -
*SGVFS023432*
CARD Pioneer Microinsurance, Inc.
The details of this investment follow:
2016 2015 Acquisition cost: At January 1 P=258,039,152 P=258,039,152 Placements 27,737,412 − At December 31 285,776,564 258,039,152 Accumulated equity in net earnings (loss): At January 1 (17,231,756) (21,935,495) Equity in net earnings 66,834,434 4,703,739 At December 31 49,602,678 (17,231,756) Accumulated equity in other comprehensive income
(loss): At January 1 (4,280) −
Equity in other comprehensive income 166,309 (4,280) At December 31 162,029 (4,280) P=335,541,271 P=240,803,116
On July 16, 2013, the Association entered into an agreement with CPMI for the purchase of 2,303,428 shares at P=100 par value representing 47.00% ownership in CPMI. On September 30, 2013, the consideration paid to CPMI amounted to P=257.98 million. No goodwill was recognized since the consideration paid is equal to the proportionate ownership in CPMI. In 2014, an amount of P=0.06 million was added to the investment in CPMI representing adjustments at the time of its acquisition.
In 2016, the Association invested additional P=27.74 million in CPMI representing contributed surplus in order for CPMI to meet the minimum capitalization requirement by IC. Moreover, the P=67.00 million equity in net earnings is net of the P=6.79 million dilution on investment in CPMI resulting from the decrease of the Association’s percentage ownership from 47% to 46.1% in December 2016. This decrease is the result of the Association’s waiver of its pre-emptive right over the remaining unissued authorized capital stock of CPMI.
As of December 31, 2016 and 2015, the Association’s investment in CPMI amounted to P=335.54 million and P=240.80 million, respectively.
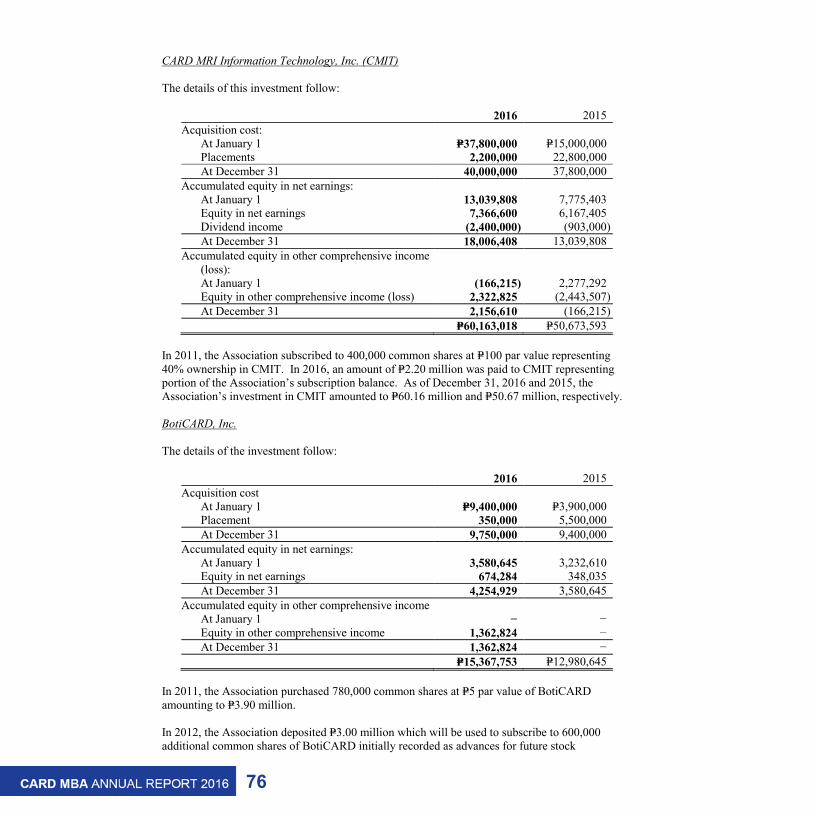
76
- 30 -
*SGVFS023432*
CARD MRI Information Technology, Inc. (CMIT) The details of this investment follow:
2016 2015 Acquisition cost: At January 1 P=37,800,000 P=15,000,000 Placements 2,200,000 22,800,000 At December 31 40,000,000 37,800,000 Accumulated equity in net earnings: At January 1 13,039,808 7,775,403 Equity in net earnings 7,366,600 6,167,405 Dividend income (2,400,000) (903,000)
At December 31 18,006,408 13,039,808 Accumulated equity in other comprehensive income
(loss): At January 1 (166,215) 2,277,292 Equity in other comprehensive income (loss) 2,322,825 (2,443,507)
At December 31 2,156,610 (166,215) P=60,163,018 P=50,673,593
In 2011, the Association subscribed to 400,000 common shares at P=100 par value representing 40% ownership in CMIT. In 2016, an amount of P=2.20 million was paid to CMIT representing portion of the Association’s subscription balance. As of December 31, 2016 and 2015, the Association’s investment in CMIT amounted to P=60.16 million and P=50.67 million, respectively.
BotiCARD, Inc.
The details of the investment follow:
2016 2015 Acquisition cost At January 1 P=9,400,000 P=3,900,000 Placement 350,000 5,500,000 At December 31 9,750,000 9,400,000 Accumulated equity in net earnings: At January 1 3,580,645 3,232,610 Equity in net earnings 674,284 348,035 At December 31 4,254,929 3,580,645 Accumulated equity in other comprehensive income At January 1 − − Equity in other comprehensive income 1,362,824 −
At December 31 1,362,824 − P=15,367,753 P=12,980,645
In 2011, the Association purchased 780,000 common shares at P=5 par value of BotiCARD amounting to P=3.90 million.
In 2012, the Association deposited P=3.00 million which will be used to subscribe to 600,000 additional common shares of BotiCARD initially recorded as advances for future stock

77
- 31 -
*SGVFS023432*
subscription. On May 19, 2015, the SEC already approved BotiCARD’s request for increase in authorized capital stock. The P=3.00 million advances were reclassified from advances for future stock subscription as investment in BotiCARD as of December 31, 2015 together with the additional investment of P=2.50 million. Additional investment amounting to P=0.35 million was made in 2016. As of December 31, 2016 and 2015, the Association’s investment in BotiCARD amounted to P=15.37 million and P=12.98 million, respectively.
CARD MRI Property Holdings, Inc. (CMPHI)
The details of the investment follow:
2016 Acquisition cost: Placements P=14,600,100 Accumulated equity in net loss: Equity in net loss (402,425) P=14,197,675
In October and November 2016, the Association invested in 146,001 shares of CMPHI with par value of P=100 representing 40% ownership. Total amount of initial investment is P=14,600,100.
CARD MRI Holdings, Inc. (CMHI)
The details of the investment follow:
2016 Acquisition cost: Placements P=7,812,500 Accumulated equity in net loss: Equity in net loss (806,615) Accumulated equity in other comprehensive income: Equity in other comprehensive income 168,631 P=7,174,516
On February 5, 2016, the Association invested in 78,125 shares of CMHI with par value of P=100 representing 25% ownership. Total amount of initial investment is P=7,812,500.
The total undistributed accumulated equity in associate’s net earnings are included in the Association’s unappropriated fund balance and are not available for dividend declaration until these are actually received.

78
- 32 -
*SGVFS023432*
Financial information of the Association’s associates follow:
2016 2015 CPMI Total assets P=1,105,616,685 P=731,081,503 Total liabilities 368,766,927 224,306,696 Net income 159,714,196 10,007,955 CMIT Total assets 266,167,076 113,718,156 Total liabilities 124,731,994 10,287,208 Net income 18,416,499 15,418,512 BotiCARD Total assets 34,980,997 34,111,262 Total liabilities 3,818,713 7,581,351 Net income 2,247,614 803,157 CMPHI Total assets 33,361,465 − Total liabilities 1,017,027 − Net loss (1,006,062) − CMHI Total assets 32,533,753 − Total liabilities 3,835,201 − Net loss (3,226,474) −
14. Other Assets
This account consists of:
2016 2015 Prepaid expenses P=3,190,013 P=1,287,892 Supplies inventory 1,802,238 2,266,967 Prepaid rent 1,412,291 1,573,107 Deferred reinsurance premiums (Note 18) 1,033,695 535,051 Other funds and deposits 990,554 − Prepaid taxes 301,861 141,986 Prepaid insurance − 563,195 P=8,730,652 P=6,368,198
Prepaid expenses include advance payment to ARK KMFD Development, Inc. for the construction of the CARD MBA building in San Pablo, Laguna and advance payments for the acquisition of computer equipment of the Association’s provincial offices. Supplies inventory includes office items that are being used in the operations of the Association.
Prepaid rent pertains to the payment made in advance to the owners of the spaces being leased by the Association as provincial offices.
Prepaid taxes of the Association pertain to the excess creditable withholding taxes over the income tax due from rental income and interest income from loans to related parties.

79
- 33 -
*SGVFS023432*
Other funds and deposits pertain to mutual guaranty fund paid to Microinsurance Association of the Philippines (MiMAP). This fund represents a claim reserve held and being managed by MiMAP that will be subsequently used to satisfy the claims of the Association’s members that cannot be met by the net asset in case of insolvency.
15. Accounts Payable and Accrued Expenses
This account consists of:
2016 2015 Accounts payable - land and building P=19,324,222 P=16,663,719 Accrued expenses 10,917,469 7,382,001 Accounts payable - CAMIA (Note 23) 9,200,683 52,253,643 Collection fee payable Staff, members and employees 2,279,245 1,137,105 Related parties (Note 23) 727,728 3,067,344 Accounts payable - related parties (Note 23) 16,962,540 3,251,733 Rent deposits 1,343,514 29,684 Due to government agencies 1,335,559 1,367,425 Due to suppliers 703,564 − Accounts payable - others 2,567,959 1,870,289 P=65,362,483 P=87,022,943
Accounts payable - land and buildings pertain to the amounts owed by the Association to its contractors for the on-going building constructions of provincial offices. It also includes unpaid balances for the land properties acquired by the Association.
Accrued expenses pertain to accruals for employee benefits, professional fees, utilities and supplies. These are non-interest bearing and are generally settled upon receipt of actual billings.
Accounts payable - CAMIA represents unremitted premiums collected from policyholders on behalf of CAMIA pertaining to the payments of Packaged Assistance in Case of Disaster (PAID) Plan awaiting receipt of accomplished return stubs. These are non-interest-bearing and are payable on demand.
Collection fee payable pertains to the Association‘s payable to its collecting institutions (see Note 23), staff, members and employees regarding the amount of claims and expenses paid in excess of the premiums collected. These are non-interest-bearing and are generally on 1-30 day payment terms.
Accounts payable - related parties include amounts owed by the Association to its related parties representing payment for medicines to BotiCARD, rentals to CLFC, system development fees to CMIT, staff training fees incurred by CARD MRI Development Institute (CMDI), remaining balances for the delivered furniture in the provincial office, and collections of insurance premium for CPMI.
Rent deposits represent the amounts received from the Association’s lessees as security deposit. This amount is returnable to the lessees upon expiration of the lease agreement subject to the lessor’s conditions.

80
- 34 -
*SGVFS023432*
Due to government agencies are obligations of the Association to government agencies. This account includes withholding taxes payable, SSS loan and contribution payable, PAG –IBIG loan and contribution payable and Medicare contribution which are subsequently remitted within one month from reporting date based on the requirements of the government agencies.
Due to suppliers are obligation of the Association for the delivered supplies used in main and provincial offices such as sunblocks, uniforms of employees, official receipts and delivered goods.
Other accounts payable include unpaid balances for the services availed by the Association such as legal, actuarial valuation and driving services. These are non-interest bearing and are generally settled within thirty (30) days.
16. Insurance Contract Liabilities
This account consists of:
2016 2015 Life insurance contract liabilities P=4,737,929,555 P=3,748,344,023 Loan redemption contract liabilities 122,171,486 95,038,907 P=4,860,101,041 P=3,843,382,930
a) Life insurance contract liabilities
Details of the life insurance contract liabilities follow:
2016 2015 Provision for unearned premiums P=4,686,413,458 P=3,709,691,763 Outstanding claims provision 51,516,097 38,652,260 Total life insurance contract liabilities P=4,737,929,555 P=3,748,344,023
This account represents reserves for life insurance which is computed in compliance with the statutory requirements as set by the IC which is equal to 60% of gross contributions to Basic Life Insurance for the year.
The rollforward analysis of provision for unearned premiums follows:
2016 2015 At January 1 P=3,709,691,762 P=3,143,318,226 Premiums received 1,174,693,044 919,556,676 Liability released for payments of death, maturity
and surrender benefits and claims (197,971,348) (353,183,140) At December 31 P=4,686,413,458 P=3,709,691,762

81
- 35 -
*SGVFS023432*
The rollforward analysis of outstanding claims provision follows:
2016 2015 At January 1 P=38,652,260 P=24,413,140 Claims incurred in the current year 758,762,989 639,291,843 Claims paid during the year (745,899,152) (625,052,723) At December 31 P=51,516,097 P=38,652,260
b) Loan redemption contract liabilities
Details of the loan redemption contract liabilities follow:
2016 2015 Provision for unearned premiums P=119,368,870 P=91,221,185 Provision for claims incurred but not reported
(IBNR) 2,758,382 3,817,722 Outstanding claims provision 44,234 − Total loan redemption contract liabilities P=122,171,486 P=95,038,907
The rollforward analysis of provision for unearned premiums follows:
2016 2015 At January 1 P=91,221,185 P=73,934,593 Premiums received 390,835,470 307,803,647 Earned premiums (362,687,784) (290,517,055) At December 31 P=119,368,871 P=91,221,185
This account represents reserves for loan redemption insurance computed using the unearned net premium reserves method.
The rollforward analysis of outstanding claims provision follows:
2016 2015 At January 1 P=− P=− Claims incurred in the current year 79,699,225 67,426,730 Claims paid during the year (79,654,991) (67,426,730) At December 31 P=44,234 P=−
The loan redemption insurance covers the outstanding loan balance of members from CARD, Inc., CARD SME Bank, Inc., CARD Bank, Inc., and Rizal Rural Bank, Inc. in case of death of a member-borrower. The Association also records reserves on loan redemption insurance. As of December 31, 2016 and 2015, loans covered by the Association’s loan redemption insurance amounted to P=51.39 billion and P=40.60 billion, respectively.

82
- 36 -
*SGVFS023432*
17. Retirement Savings Fund
The retirement savings fund or provident fund represents contributions of members of the Association to the provident fund, net of administrative expenses. The provident fund is being administered by the Association and is intended for the retirement of its members. The contributions are invested and the interests thereon are credited to the retirement savings fund. It can be availed of at the age of 65 if the member has completed a minimum of five (5) consecutive years of membership in the Association. The benefit shall be equal to all the contributions made by the member to the provident fund plus interest earned. If a member decides to resign prior to age of 65, the member shall be entitled to refund of 100.00% of the member’s total contributions plus interest based on prevailing interest rates for regular savings of commercial banks.
The rollforward analysis of retirement savings fund follows:
2016 2015 At January 1 P=2,429,552,226 P=1,963,727,108 Contribution 642,507,510 509,884,404 Interest income 96,293,911 74,404,874 Claims and expenses (127,752,180) (118,464,160) At December 31 P=3,040,601,467 P=2,429,552,226
The allocation of interest for retirement savings fund is equivalent to 3.57% and 4.20% in 2016 and 2015, respectively, of the beginning balance of the account plus contribution from members during the year. Interest expense incurred for retirement savings claims amounted to P=3.67 million and P=3.86 million in 2016 and in 2015, respectively.
18. Net Earned Premiums
The net earned premiums consist of the following:
2016 2015 Gross earned premiums on insurance contracts Life insurance premiums P=1,938,339,147 P=1,531,981,522 Loan insurance premiums 390,835,470 307,803,646 Total gross premiums earned on insurance contracts 2,329,174,617 1,839,785,168 Less: Reinsurer’s share on gross earned premium on
insurance contracts Life insurance 2,646,045 1,477,500 Net earned premiums on insurance contracts P=2,326,528,572 P=1,838,307,668
Under the Association’s basic life insurance program, members and its qualified dependents are entitled to receive a minimum amount of benefit upon death or permanent disability duly approved by the Association after meeting certain conditions as stated in the certificate of membership issued to members. The member’s contribution is P=15 every week.
Under the basic life insurance program is the golden life insurance program wherein members aging 70 years old are entitled to enroll in the program and have continued coverage up to 100 years old. The member has the option to choose between P=50 or P=100 premium every week with death benefit of P=25,000 or P=50,000, respectively. Premiums are payable for ten (10) years.

83
- 37 -
*SGVFS023432*
The loan redemption insurance covers the outstanding loan balance of members to CARD Micro-finance institutions namely: CARD Inc., CARD Bank, Inc., CARD SME Bank Inc. and Rizal Rural Bank, Inc. in case of death. Under this program, the member contributes 1.5% per annum of his/her principal loan to be recognized by the Association as gross premiums.
In April 2014, the Association entered into a reinsurance agreement with National Reinsurance Corporation of the Philippines (PHILNARE) in response to the increased risk brought by severe calamities hitting the country. Portion of the premiums received amounting to P=3.14 million and P=1.65 million in 2016 and 2015, respectively, are allocated and ceded to the reinsurer.
Reinsurance will limit the possible loss that the Association would experience in case of disaster. The rollforward of the deferred reinsurance premiums follows:
2016 2015 Balance at January 1 P=535,051 P=358,000 Premiums ceded to reinsurer 3,144,689 1,654,551 Reinsurer’s share of gross earned premiums on
insurance contracts (2,646,045) (1,477,500) Balance at December 31 P=1,033,695 P=535,051
Deferred reinsurance premiums pertain to the unamortized portion of the premiums ceded to PHILNARE (see Note 14).
19. Interest Income
This account consists of
2016 2015 Interest income on: HTM investments (Note 7) P=199,164,330 P=182,709,093 Short-term investments (Note 8) 5,783,150 4,073,239 Long-term investments (Note 8) 4,667,767 4,360,863 Cash and cash equivalents (Note 6) 4,320,517 6,124,889 Loans receivable (Note 8) 1,369,050 1,468,206 Pension asset (Note 27) 1,111,813 740,436 P=216,416,627 P=199,476,726
20. Rental Income
In 2016 and 2015, the Association earned P=7.92 million and P=5.68 million, respectively from renting its investment properties to its affiliates: CARD Bank, Inc., Rizal Bank, Inc., CMIT, CaMIA, BotiCARD and CARD SME Bank,Inc. (see Notes 22 and 23).

84
- 38 -
*SGVFS023432*
21. General and Administrative Expenses
This account consists of:
2016 2015 Transportation and travel P=128,646,156 P=103,450,292 Salaries and allowances (Note 27) 83,458,767 76,816,730 Supplies 17,840,227 13,787,171 Program, monitoring and evaluation 17,537,012 16,393,830 Professional fees 14,907,149 13,308,065 Depreciation (Note 11 and 12) 11,852,537 9,035,200 Training and development 9,782,903 9,428,174 Donation and contribution 9,367,852 7,496,143 Rental (Note 22) 8,724,946 7,574,596 Security and janitorial services 7,968,068 3,601,551 Communication 7,347,053 5,982,639 Meetings and seminars 6,755,541 5,999,784 Insurance 6,659,189 6,911,431 Repairs and maintenance 4,075,712 3,216,593 Pension expense (Note 27) 3,942,178 3,562,765 Interest expense (Note 17) 3,666,610 3,855,266 Taxes and licenses 3,570,381 1,470,334 Light and water 2,736,069 2,262,213 Membership dues 1,638,645 1,652,814 Bank charges 703,051 788,832 Entertainment, amusement and recreation 513,976 336,464 Research and documentation 112,498 79,866 Provision for impairment losses (Note 8) − 3,285,338 Miscellaneous 11,226,301 99,188 P=363,032,821 P=300,395,279
22. Lease Commitments
Operating leases - Association as lessee In 2016, the Association entered into operating lease agreements with various lessors with terms ranging from six (6) months to one (1) year. Rent expense included in the statements of comprehensive income in 2016 and 2015 amounted to P=8.72 million and P=7.57 million, respectively. The future minimum rentals payable within one (1) year of the existing contracts amounted to a total of P=6.01 million and P=7.62 million as of December 31, 2016 and 2015, respectively.
Operating leases - Association as lessor The Association entered into operating lease agreements with its related parties with terms ranging from three (3) to five (5) years. Rent income included in the statements of comprehensive income under “rental income” account in 2016 and 2015 amounted to P=7.92 million and P=5.68 million, respectively.

85
- 39 -
*SGVFS023432*
As of December 31, the amount of future minimum rental receivable based on the remaining term of the existing lease contracts are as follow:
2016 2015 Within 1 year P=10,616,731 P=5,495,580 More than 1 year but not more than 5 years 29,068,524 13,974,860 P=39,685,255 P=19,470,440
23. Related Party Transactions
Parties are related if one party has the ability, directly or indirectly, to control the other party or exercise significant influence over the other party in making financial and operating decisions, and the parties are subject to common control or common significant influence. Related parties may be individuals or corporate entities.
The significant transactions of the Association with related parties in the normal course of business are as follow:
December 31, 2016 Category Amount Outstanding Nature Terms Conditions Associates
CMIT Accounts receivable P=367,756 P=– Unremitted Collection
of members (Staff contribution) and others expense incurred
On-demand; noninterest-bearing
Unsecured; no impairment
Loan Receivable 25,000,000 25,000,000 Loan made by CMIT On-demand; Interest at 4%
per annum
Unsecured;
Rental income 276,099 – Income received from office space rentals
On-demand; noninterest-bearing
Unsecured; no impairment
Interest Income from Financial Assistance
400,000 – Income from Financial Assistance
On-demand; noninterest-
bearing
Unsecured
BotiCARD Accounts receivable
81,598 10,813 Unremitted Collection of members (Staff contribution) and others expense incurred
On-demand; noninterest-bearing
Unsecured; no impairment
Accounts payable
1,883,015
1,883,015
Unpaid medicines and other expenses incurred
On-demand; noninterest-bearing
Unsecured; no impairment
Rental income 131,158 – Income received from office space rentals
On-demand; noninterest-bearing
Unsecured
CPMI Accounts receivable 67,293,743 12,103,830 Unremitted collection
of member (Staff's ) Contribution and other expenses incurred
On-demand; noninterest bearing
Unsecured; no impairment
(Forward)

86
- 40 -
*SGVFS023432*
Category Amount Outstanding Nature Terms Conditions Accounts payable P=180,714,900 P=13,574,845 Claims unpaid to
members who avail CaMIA products
On-demand; noninterest bearing
Unsecured; no impairment
CARD MNLI
Accounts payable 122,439 122,439 Unpaid expenses incurred in MNLI Product
On-demand; noninterest bearing
Unsecured
Affiliates
CaMIA Accounts receivable 77,079,528 6,988,355 Claims unpaid to
members who avail CaMIA products
On-demand; noninterest-bearing
Unsecured; no impairment
Accounts payable (Note 15)
458,157,549 1,099,067 Premiums collected from policy holders.in behalf of CaMIA
On-demand; noninterest-bearing
Unsecured
Held In Trust 8,101,616 8,101,616 Premiums uncollected without return stub
On-demand; noninterest-bearing
Unsecured
Rental income 176,080 – Income received from office space rental
On-demand; noninterest-bearing
Unsecured; no impairment
CMDI Accounts receivable
143,898 – Unremitted Collection of members (Staff contribution) and others expense incurred
On-demand; noninterest-bearing
Unsecured; no impairment
Accounts payable
51,445 46,569 Unpaid expenses for administration and training cost of staffs
On-demand; noninterest-bearing
Unsecured
CARD, Inc. Accounts receivable
150,340,481 308,965 Unremitted collection of members contribution
On-demand; noninterest-bearing
Unsecured; no impairment
Collection fee payable
194,156,350 684,079 Unpaid claims and expenses incurred
1 – 30 days term; noninterest-bearing
Unsecured
CARD SME Bank Inc. Cash and cash equivalents
759,960,215 20,588,052 Various On-demand; interest at 1.50% for regular savings deposit
Unsecured; no impairment
Accounts receivable 5,684,927 24,619 Unremitted collection of members contribution
On-demand; noninterest-bearing
Unsecured; no impairment
Collection fee payable
10,567,951 – Unpaid claims and expenses incurred
1 – 30 days term; noninterest-bearing
Unsecured
Rent Income 2,092,038 – Income received from office space rentals
On-demand; noninterest- bearing
Unsecured
Interest income 637,290 – Income from deposited made (included in cash and cash equivalents)
On-demand; interest at 1.50% for regular savings deposit
Unsecured
CARD BDSFI Accounts receivable
642 – Unpaid collection of members’ contribution
On-demand; noninterest-bearing
Unsecured; no impairment
(Forward)

87
- 41 -
*SGVFS023432*
Category Amount Outstanding Nature Terms Conditions
CARD EMPC Accounts receivable P=722,759 P= Unpaid collection of
members’ contribution
On-demand; noninterest-bearing
Unsecured; no impairment
Loan receivable 6,666,667 Loan made by EMPC On-demand; interest at 5% per annum
Unsecured; no impairment
Accounts payable
1,380,142 1,335,672 Unpaid administrative expenses incurred for Association’s staff
On-demand; noninterest-bearing
Unsecured
Interest Income from Financial Assitar
662,037 –
Rizal Rural Bank Cash and cash equivalents
121,175,785 1,825,937 Various On-demand; interest at 1.50% for regular savings deposit
Unsecured; no impairment
Accounts receivable 412,822 386 Unremitted collection of members contribution
On-demand; noninterest-bearing
Unsecured; no impairment
Collection fee payable
3,507,478 1,715 Unpaid claims and expenses incurred
1 – 30 days term; noninterest-bearing
Unsecured
Rental income 1,252,762 – Income received from office space rentals
On-demand; noninterest-bearing
Unsecured
Interest income 30,434 – Income from deposits made (included in cash and cash equivalents)
On-demand; interest at 1.50% for regular savings deposit and 4.00% for time deposit
Unsecured
CLFC Accounts receivable 482,796 450,866 Unremitted Collection
of members (Staff contribution) and others expenses
On-demand; noninterest-bearing
Unsecured; no impairment
Loans receivable
16,666,667 10,000,000 Loans made by CARD LFC
Interest at 4.50% per annum
Unsecured; no impairment
Accounts payable
– – Unpaid expenses incurred in leasing Association’s equipment
On-demand; noninterest-bearing
Unsecured; no impairment
Interest Income from Financial Assistance
662,037 – Income from Financial Assistance
On-demand; noninterest-bearing
CARD Bank, Inc. Cash and cash equivalents
2,702,896,980 13,910,599 Various On demand; interest at 1.50% for regular savings deposit
Unsecured; no impairment
Accounts receivable 18,008,432 118,336 Unremitted collection of members contribution
On-demand; noninterest-bearing
Unsecured; no impairment
Collection fee payable 28,232,084 41,934 Unpaid claims and expenses incurred
On-demand; noninterest-bearing
Unsecured
Rental income 2,890,049 – Income received from office space rentals
On-demand; noninterest-bearing
Unsecured
(Forward)

88
- 42 -
*SGVFS023432*
Category Amount Outstanding Nature Terms Conditions Interest income
P=869,240 P=– Income from deposits made (included in cash and cash equivalents)
On-demand; interest at 1.50% for regular savings deposit and 4.00% for time deposit
Unsecured
RISE Loans receivable
2,500,000 – Loan made by RISE On-demand; interest at 5.00% per annum
Unsecured; no impairment
The above outstanding balances as of December 31, 2016 are summarized as follows:
2016 Cash and cash equivalents P=36,324,588 Loan receivable (Note 8) 35,000,000 Accounts receivable (Note 8) 20,006,170 Accounts payable (Note 15)
Accounts payable - CAMIA (9,200,683) Related parties (727,728) Accounts payable - related parties (16,962,540)
Net due from related parties P=64,439,807 December 31, 2015 Category Amount Outstanding Nature Terms Conditions Associates
CMIT Accounts receivable P=93,919 P=– Unremitted Collection of
members (Staff contribution) and others expense incurred
On-demand; noninterest-bearing
Unsecured; no impairment
Rental income 254,498 – Income received from office space rentals
On-demand; noninterest-bearing
Unsecured
BotiCARD Accounts receivable
69,843 – Unremitted Collection of members (Staff contribution) and others expense incurred
On-demand; noninterest-bearing
Unsecured; no impairment
Accounts payable
1,467,999
966,057
Unpaid medicines and other expenses incurred
On-demand; noninterest-bearing
Unsecured; no impairment
Rental income 95,184 – Income received from office space rentals
On-demand; noninterest-bearing
Unsecured
CPMI Account receivable 297,231 190,585 Unremitted collection of
member (Staff's ) Contribution and other expenses incurred
On-demand; noninterest bearing
Unsecured; no impairment
Account payable 12,451,934 – Claims unpaid to members who avail CaMIA products
On-demand; noninterest bearing
Unsecured; no impairment
Affiliates
CaMIA
(Forward)
Accounts receivable P=205,334,952 P=75,916,569 Claims unpaid to members who avail
On-demand; noninterest-
Unsecured; no impairment

89
- 43 -
*SGVFS023432*
Category Amount Outstanding Nature Terms Conditions CaMIA products bearing
Accounts payable (Note 15)
418,996,741 52,253,643 Premiums collected from policy holders.in behalf of CaMIA
On-demand; noninterest-bearing
Unsecured
Rental income 150,341 – Income received from office space rental
On-demand; noninterest-bearing
Unsecured; no impairment
CMDI Accounts receivable
67,481 14,359 Unremitted Collection of members (Staff contribution) and others expense incurred
On-demand; noninterest-bearing
Unsecured; no impairment
Accounts payable
2,323,288 2,035,591 Unpaid expenses for administration and training cost of staffs
On-demand; noninterest-bearing
Unsecured
CARD, Inc. Accounts receivable
109,437,479 1,046,292 Unremitted collection of members contribution
On-demand; noninterest-bearing
Unsecured; no impairment
Collection fee payable
106,250,345 2,356,054 Unpaid claims and expenses incurred
1 – 30 days term; noninterest-bearing
Unsecured
CARD SME Cash and cash equivalents
454,148,822 9,750,779 Various On-demand; interest at 1.50% for regular savings deposit
Unsecured; no impairment
Accounts receivable 2,622,378 1,805,703 Unremitted collection of members contribution
On-demand; noninterest-bearing
Unsecured; no impairment
Collection fee payable
4,590,522 6,293 Unpaid claims and expenses incurred
1 – 30 days term; noninterest-bearing
Unsecured
Interest income 148,295 – Income from depositd made (included in cash and cash equivalents)
On-demand; interest at 2.00% for regular savings deposit
Unsecured
CARD BDSFI Accounts receivable
34,310 – Unpaid collection of members’ contribution
On-demand; noninterest-bearing
Unsecured; no impairment
CARD EMPC Accounts receivable 455,642 393,652 Unpaid collection of
members’ contribution On-demand; noninterest-bearing
Unsecured; no impairment
Loan receivable – 6,666,667 Loan made by EMPC On-demand; interest at 5% per annum
Unsecured; no impairment
Accounts payable
124,489 124,489 Unpaid administrative expenses incurred for Association’s staff
On-demand; noninterest-bearing
Unsecured
Rizal Rural Bank Cash and cash equivalents
288,576,778 1,177,369 Various On-demand; interest at 1.50% for regular savings deposit
Unsecured; no impairment
Accounts receivable 14,880,833 255 Unremitted collection of members contribution
On-demand; noninterest-bearing
Unsecured; no impairment
Collection fee payable
550,864 1,584 Unpaid claims and expenses incurred
1 – 30 days term; noninterest-bearing
Unsecured
(Forward)

90
- 44 -
*SGVFS023432*
Category Amount Outstanding Nature Terms Conditions Rental income P=1,558,079 P=– Income received from
office space rentals On-demand; noninterest-bearing
Unsecured
Interest income 3,494,149 – Income from deposits made (included in cash and cash equivalents)
On-demand; interest at 1.50% for regular savings deposit and 4.00% for time deposit
Unsecured
CLFC Accounts receivable 165,976 152,068 Unremitted Collection of
members (Staff contribution) and others expenses
On-demand; noninterest-bearing
Unsecured; no impairment
Loans receivable
10,000,000 16,666,667 Loans made by CARD LFC
Interest at 4.50% per annum
Unsecured; no impairment
Accounts payable
519,486 125,596 Unpaid expenses incurred in leasing Association’s equipment
On-demand; noninterest-bearing
Unsecured; no impairment
CARD Bank, Inc. Cash and cash equivalents
2,416,712,857 28,332,203 Various On demand; interest at 1.50% for regular savings deposit
Unsecured; no impairment
Accounts receivable 100,080,786 262,964 Unremitted collection of members contribution
On-demand; noninterest-bearing
Unsecured; no impairment
Collection fee payable 10,703,494 703,413 Unpaid claims and expenses incurred
1 – 30 days term; noninterest-bearing
Unsecured
Rental income 3,398,501 – Income received from office space rentals
On-demand; noninterest-bearing
Unsecured
Interest income
4,839,738 – Income from deposits made (included in cash and cash equivalents)
On-demand; interest at 2.00% for regular savings deposit and 4.00% for time deposit
Unsecured
RISE Loans receivable
– 2,500,000 Loan made by RISE On-demand; interest at 6.00% per annum
Unsecured; no impairment
The above outstanding balances as of December 31, 2015 are summarized as follows:
2015 Cash and cash equivalents P=79,782,447 Loan receivable (Note 8) 39,260,351 Accounts receivable (Note 8) 25,833,334 Accounts payable (Note 15)
Accounts payable - CAMIA (52,253,643) Related parties (3,067,344) Accounts payable - related parties (3,251,733)
Net due from related parties P=86,303,412

91
- 45 -
*SGVFS023432*
24. Income Tax
The provision for income tax consists of:
2016 2015 Current tax ₱216,396 P=127,522 Final tax 45,771,404 43,265,622 Provision for income tax ₱45,987,800 P=43,393,144
The reconciliation of the income tax expense computed based on the excess of revenue over expenses before tax at the statutory income tax rate to the provision for income tax in the statements of comprehensive income follows:
2016 2015 Statutory income tax P=143,703,020 P=150,981,589 Add (deduct) the tax effect of: Gross premiums on insurance contracts (697,958,572) (551,492,300) Equity in net earnings of associates (22,099,883) (3,365,754) Interest income subjected to final tax (20,982,645) (17,975,086) Dividend income (7,952,410) (7,302,277) Surrender charge (5,091,044) (4,907,322) Other income (2,521,057) (797,331) Rental income (330,155) (179,886) Gross change in insurance contract liabilities 306,551,859 180,515,091 Gross insurance contract benefits and claims
paid 247,666,243 207,743,836 General and administrative expenses 105,002,444 90,118,584
Fair value loss from financial assets at FVPL – 54,000 Provision for income tax P=45,987,800 P=43,393,144
25. Notes to Statement of Cash Flows
The Association’s principal noncash investing activity in 2016 pertains to the transfer of advances for future stock subscription from loans and receivables to AFS financial assets amounting to P=44,177,000 (see Notes 8 and 9).
26. Restatements
In prior years, the reserve for loan redemption insurance is computed as 60% of gross premiums for the year. This was patterned after the reserves computation for life insurance in compliance with the minimum statutory requirements as set by the IC which is a minimum of 50% of gross contributions to Basic Life Insurance for the year. However, it was noted in the actuarial notes submitted to the IC that the reserves for the loan redemption insurance shall be computed using the unearned net premium reserves method. The Association recomputed the reserves for the redemption insurance and restated the comparative amounts for the prior period presented.

92
- 46 -
*SGVFS023432*
The impact of the adjustments follow:
December 31, 2015
As previously
reported Adjustments As restated Statement of financial position Insurance contract liabilities P=3,936,843,932 (P=93,461,002) P=3,843,382,930 Unappropriated fund balance 1,685,783,527 93,461,002 1,779,244,529 Statement of activities Gross change in insurance contract liabilities 616,652,516 (14,935,545) 601,716,971
January 1, 2015 As previously
reported Adjustments As restated Statement of financial position Insurance contract liabilities P=3,320,191,416 (P=78,525,457) P=3,241,665,959 Unappropriated fund balance 1,285,160,743 78,525,457 1,363,686,200
27. Employee Benefits
The Association maintains a funded and formal noncontributory retirement plan - the CARD Multi-Employer Retirement Plan - covering all employees. The plan has a projected unit cost format and is financed by the Association. The plan complies with the requirement of Republic Act No. 7641 and provides lump sum benefits upon retirement, death, total and permanent disability, involuntary separation (except for cause) or voluntary separation after completion of at least ten years of service with the participating institutions.
Under the existing regulatory framework, Republic Act 7641 requires a provision for retirement pay to qualified private sector employees in the absence of any retirement plan in the entity, provided however that the employee’s retirement benefits under any collective bargaining and other agreements shall not be less than those provided under the law. The law does not require minimum funding of the plan. The Association also provides additional post employment healthcare benefits to certain senior employees.

93
- 47
-
*SGVFS023432*
Cha
nges
in fu
nded
retir
emen
t pla
n ar
e as
follo
ws:
20
16
N
et b
enef
it co
st in
stat
emen
t of c
ompr
ehen
sive
inco
me
Rem
easu
rem
ents
in o
ther
com
preh
ensi
ve in
com
e
At
Janu
ary
1
Cur
rent
se
rvic
e co
st
(Not
e 21
) N
et in
tere
st
(Not
e 19
) Su
btot
al
Ben
efits
pai
d T
rans
fer
to p
lan
Ret
urn
on
plan
ass
ets
(exc
ludi
ng
amou
nt
incl
uded
in
net i
nter
est)
Act
uari
al
chan
ges
aris
ing
from
ch
ange
s in
dem
ogra
phic
a
ssum
ptio
ns
Act
uari
al
chan
ges
aris
ing
from
ch
ange
s in
finan
cial
as
sum
ptio
ns
A
ctua
rial
ch
ange
s ari
sing
fr
om c
hang
es
in e
xper
ienc
e
Eff
ect o
f ch
ange
s in
asse
t cei
ling
Subt
otal
C
ontr
ibut
ion
by e
mpl
oyer
A
t D
ecem
ber
31
Pres
ent v
alue
of d
efin
ed
be
nefit
obl
igat
ion
P=34,
855,
448
P=3,9
42,1
78
P=1,6
93,9
75
P=5,6
36,1
53
(P=98
8,28
0)
P=149
,290
P=–
(P=
903,
410)
(P=
6,88
1,96
8)
P=35
0,86
8 P=–
(P=
7,43
4,51
0)
P=–
P=32,
218,
101
Fair
val
ue o
f pla
n as
sets
(5
1,01
8,16
7)
(2
,893
,486
) (2
,893
,486
) P=9
88,2
80
(P=14
9,29
0)
1,42
2,26
5 –
– –
– 1,
422,
265
(17,
876,
142)
(6
9,52
6,54
0)
Eff
ect o
f cha
nges
in
as
set c
eilin
g 1,
804,
493
– 87
,698
87
,698
–
– –
– –
– 5,
852,
022
5,85
2,02
2 –
7,74
4,21
3
(P=
14,3
58,2
26)
P=3,9
42,1
78
(₱1,111,813)
P=2
,830
,365
P=–
P=–
P=1
,422
,265
(P=
903,
410)
(P=
6,88
1,96
8)
P=35
0,86
8 P=5
,852
,022
(P=
160,
223)
(P=
17,8
76,1
42)
(P=29
,564
,226
)
2015
Net
ben
efit
cost
in st
atem
ent o
f com
preh
ensi
ve in
com
e
R
emea
sure
men
ts in
oth
er c
ompr
ehen
sive
inco
me
At
Janu
ary
1
Cur
rent
se
rvic
e co
st
(Not
e 21
) N
et in
tere
st
(Not
e 19
) Su
btot
al
Bene
fits p
aid
Tran
sfer
to
pla
n
Ret
urn
on p
lan
ass
ets
(exc
ludi
ng
am
ount
in
clud
ed in
net
in
tere
st)
Act
uaria
l ch
ange
s a
risin
g fro
m
cha
nges
in
dem
ogra
phic
a
ssum
ptio
ns
Act
uaria
l c
hang
es
aris
ing
from
c
hang
es in
fi
nanc
ial
ass
umpt
ions
A
ctua
rial
cha
nges
aris
ing
from
cha
nges
in
exp
erie
nce
Effe
ct o
f ch
ange
s in
ass
et
ceili
ng
Subt
otal
C
ontri
butio
n by
em
ploy
er
At
Dec
embe
r 31
Pres
ent v
alue
of d
efin
ed b
enef
it
oblig
atio
n P=2
9,51
5,59
5 P=
3,56
2,76
5 P=1
,316
,396
P=4
,879
,161
(P=
150,
436)
P=3
6,59
8 P=–
P=8
83,7
49
(P=3,
405,
363)
P=
3,09
6,14
4 P=–
P=574
,530
P=–
P=
34,8
55,4
48
Fair
valu
e of
pla
n as
sets
Ef
fect
of c
hang
es in
asse
t cei
ling
(42,
148,
718)
–
– –
(2,0
56,8
32) –
(2,0
56,8
32) –
150,
436 –
(36,
598)
–
906,
571 –
– –
– –
– –
– 1,
804,
493
906
,571
1,
804,
493
(7
,833
,026
) –
(51,
018,
167)
1,
804,
493
(P=
12,6
33,1
23)
P=3,5
62,7
65
(P=74
0,43
6)
P=2,8
22,3
29
P=–
P=–
P=906
,571
P=8
83,7
49
(P=3,
405,
363)
P=
3,09
6,14
4 P=1
,804
,493
P=3
,285
,594
(P=
7,83
3,02
6)
(P=14
,358
,226
)

94
- 48 -
*SGVFS023432*
The principal actuarial assumptions used in determining retirement liability for the Association’s retirement plan are shown below:
2016 2015 Discount rate 5.86% 4.86% Salary increase rate 7.00% 7.00% Average remaining working lives 31.8 years 31.9 years
The fair value of net plan assets by each class is as follows:
2016 2015
Assets Cash and cash equivalents P=28,881,325 P=20,769,495 Investment in bonds 34,095,815 23,320,404 Investment in mutual funds 361,538 397,942 Loans 5,249,254 5,387,518 Others 938,608 1,142,808
P=69,526,540 P=51,018,167
The sensitivity analysis below has been determined based on reasonably possible changes of each significant assumption on the defined benefit obligation as of December 31, 2016, assuming if all other assumptions were held constant:
Effect on defined pension plan
Increase (decrease) 2016 2015 Discount rate +100 basis points (P=5,416,484) (P=7,119,151) -100 basis points 6,881,968 9,234,250 Future salary increase +100 basis points 6,368,028 8,547,582 -100 basis points (5,157,230) (6,806,362)
The Association expects to contribute P=28.22 million to the defined pension plan in 2017.
The average duration of the defined benefit obligation at the end of the reporting period is 19.1 years.
The Association paid salaries and other benefits to its employees amounting to P=83.46 million and P=76.82 million in December 31, 2016 and December 31, 2015, respectively (see Note 21).
28. Management of Insurance and Financial Risks
Governance Framework The Association has established a risk management function with clear terms of reference and with the responsibility for developing policies on market, credit, liquidity, insurance and operational risk. It also supports the effective implementation of policies at the overall association and individual business unit levels.

95
- 49 -
*SGVFS023432*
The policies define the Association’s identification of risk and its interpretation, limit structure to ensure the appropriate quality and diversification of assets, alignment of underwriting and reinsurance strategies to the corporate goals and specify reporting requirements.
Regulatory Framework Regulators are interested in protecting the rights of the members and maintain close vigil to ensure that the Association is satisfactorily managing affairs for the member’s benefit. At the same time, the regulators are also interested in ensuring that the Association maintains appropriate solvency position to meet liabilities arising from claims and that the risk levels are at acceptable levels.
The operations of the Association are subject to the regulatory requirements of the IC. Such regulations not only prescribe approval and monitoring of activities but also impose certain restrictive provisions (e.g., margin of solvency to minimize the risk of default and insolvency on the part of the insurance companies to meet the unforeseen liabilities as these arise, minimum guaranty fund, risk-based capital requirements).
Guaranty fund As a mutual benefit association, IC requires the Association to possess a guaranty fund of P=5.00 million. This minimum amount shall be maintained at all times and it must be increased by an amount equivalent to 5% of the Association’s gross premium collections until the guaranty fund reaches 12.5% of the minimum paid up capital for domestic life insurance companies or P=125.00 million. As of December 31, 2016 and 2015, the Association has a total of P=136.21 million and P=125.76 million, respectively, representing guaranty fund which is deposited with the IC (see Notes 7).
Risk-based capital requirements (RBC) On December 8, 2006, the IC issued IMC NO. 11-2006 adopting the RBC framework for the mutual benefit associations to establish the required amounts of capital to be maintained by entities in relation to their investment and insurance risks. Every mutual benefit association is annually required to maintain a minimum RBC ratio of 100.00% and not fail the trend test. Failure to meet the minimum RBC ratio shall subject the insurance entity to the corresponding regulatory intervention which has been defined at various levels. The RBC ratio shall be calculated as member’s equity divided by the RBC requirement whereas, members’ equity is defined as admitted assets minus all liabilities inclusive of actuarial reserves and other policy obligations. The following table shows how the RBC ratio was determined by the Association based on its calculation:
2016 2015 Member’s equity P=2,085,052,442 P=1,661,823,883 RBC requirement 624,060,470 474,758,706 RBC Ratio 334.11% 350.04%
The final amount of the RBC ratio can be determined only after the accounts of the Association have been examined by the IC specifically as to admitted and non-admitted assets as defined under the same Code.

96
- 50 -
*SGVFS023432*
Standard chart of accounts IC has released Circular No. 2014-41 containing the standard chart of accounts for all new and existing mutual benefit associations doing business in the Philippines. This circular is in line with the requirements of SRC Rule 68, Section 189 of the Amended Insurance Code, and the current accounting standards in the Philippines. This circular is effective immediately and should be used in the annual statement filed with IC starting calendar year 2014. The Association is in compliance with this circular.
Valuation of reserves IC has released Circular No. 2016-66 on the Valuation Standards for Life Insurance Policy Reserves which provides a change in the basis of valuation of the life insurance policy reserves from Net Premium Valuation (NPV) to Gross Premium Valuation (GPV). Whereas, the methods and assumptions shall be in accordance with the internationally accepted actuarial standards and consider the generally accepted actuarial principles concerning financial reporting framework promulgated by the Actuarial Society of the Philippines (ASP) which now considers other assumptions such as morbidity, lapse and/or persistency, expenses, non-guaranteed benefits and margin for adverse deviation. This valuation method is applicable to the Association’s golden life insurance product which will take effect beginning January 1, 2017.
The main risks arising from the Association’s financial instruments follow:
Insurance Risk The principal risk the Association faces under insurance contracts is that the actual claims and benefit payments or the timing thereof, differ from expectations. This is influenced by the frequency of claims, severity of claims, actual benefits paid are greater than originally estimated and subsequent development of long term claims. Therefore, the objective of the Association is to ensure that sufficient reserves are available to cover these liabilities.
The above risk exposure is mitigated by diversification across a large portfolio of insurance contracts and geographical areas. The variability of risks is also improved by careful selection and implementation of underwriting strategy and guidelines, as well as the use of reinsurance arrangements for the loan redemption fund. Amounts recoverable from reinsurers are estimated in a manner consistent with the outstanding claims provision and are in accordance with the reinsurance contract. Although the Association has reinsurance arrangements, it is not relieved of its direct obligations to its policyholders and thus, a credit exposure exists with respect to ceded insurance, to the extent that any reinsurer is unable to meet its obligations assumed under such reinsurance agreements. The Association’s placement of reinsurance is diversified such that it is neither dependent on a single reinsurer nor are the operations of the Association substantially dependent upon any single reinsurance contract.
Underwriting risk Underwriting risk represents the exposure to loss resulting from actual policy experience adversely deviating from assumptions made in the product pricing. Underwriting risks are brought about by a combination of the following:
Mortality risk - risk of loss arising due to policyholder death experience being different than
expected. Morbidity risk - risk of loss arising due to policyholder health experience being different than
expected. Investment return risk - risk of loss arising from actual returns being different than expected. Expense risk - risk of loss arising from expense experience being different than expected.

97
- 51 -
*SGVFS023432*
Policyholder decision risk - risk of loss arising due to policyholder experiences (lapses and surrenders) being different than expected.
These risks do not vary significantly in relation to the location of the risk insured by the Association, type of risk insured and by industry. Undue concentration by amounts could have an impact on the severity of benefit payments on a portfolio basis.
The Association’s underwriting strategy is designed to ensure that risks are well diversified in terms of type of risk and level of insured benefits. Underwriting limits are in place to enforce appropriate risk selection criteria. For example, the Association has the right not to renew individual policies, it can impose deductibles and it has the right to reject the payment of fraudulent claims. Insurance contracts also entitle the Association to pursue third parties for payment of some or all cost. The Association further enforces a policy of actively managing and prompt pursuing of claims, in order to reduce its exposure to unpredictable future developments that can negatively impact the Association.
The key assumptions to which the estimation of liabilities is particularly sensitive are as follows:
Mortality and morbidity rates Assumptions are based on standard industry and national tables, according to the type of contract written, reflecting recent historical experience and which are adjusted where appropriate to reflect the Association’s own experiences. An appropriate but not excessive prudent allowance is made for expected future improvements.
An increase in rates will lead to a larger number of claims and claims could occur sooner than anticipated, which will increase the expenditure and decrease the funds of the Association.
Investment return The weighted average rate of return is derived based on a model portfolio that is assumed to back liabilities, consistent with the long term asset allocation strategy. These estimates are based on current market returns as well as expectations about future economic and financial developments. An increase in investment return would lead to a reduction in expenditure and an increase in the funds of the Association.
Expenses Operating expenses assumptions reflect the projected costs of maintaining and servicing in force policies and associated overhead expenses. The current level of expenses is taken as an appropriate expense base, adjusted for expected expense inflation adjustments if appropriate. An increase in the level of expenses would result in an increase in expenditure thereby reducing the funds of the Association. Lapse and surrender rates Lapses relate to the termination of policies due to nonpayment of premiums. Surrenders relate to the voluntary termination of policies by policyholders. Policy termination assumptions are determined using statistical measures based on Association’s experience and vary by product type, policy duration and sales trends.
An increase in lapse rates early in the life of the policy would tend to reduce the funds of the Association, but later increases are broadly neutral in effect.

98
- 52 -
*SGVFS023432*
Discount rate Life insurance liabilities are determined as the sum of the discounted value of the expected benefits and future administration expenses directly related to the contract, less the discounted value of the expected theoretical premiums that would be required to meet these future cash outflows. Discount rates are based on current industry risk rates, adjusted for the Association’s own risk exposure.
A decrease in the discount rate will increase the value of the liability.
Sensitivities The analysis below is performed for a reasonable possible movement in key assumptions with all other assumptions held constant, on the statement of revenue and expenses. The correlation of assumptions will have a significant effect in determining the ultimate claims liabilities. It should also be stressed that these assumptions are nonlinear and larger or smaller impacts cannot easily be gleaned from these results. Sensitivity information will also vary according to the current economic assumptions, mainly due to the impact of changes to both the intrinsic cost and time value of options and guarantees.
2016
Increase of 1.00% on discount rate
and decrease of 25.00% on
mortality rate
Increase of 1.00% on discount rate
and decrease of 25.00% on
mortality rate Increase (decrease) on liabilities P=3,783,942,799 (P=268,377,876) Increase (decrease) on revenue (3,783,942,799) 268,377,876
2015
Increase of 1.00% on discount rate
and decrease of 25.00% on mortality rate
Increase of 1.00% on discount rate
and decrease of 25.00% on mortality rate
Increase (decrease) on liabilities P=941,319,169 (P=1,021,819,480) Increase (decrease) on revenue (941,319,169) 1,021,819,480
The sensitivity analyses take into account upward movements in the discount rates and upward and downward movements in mortality and morbidity rates. These do not necessarily represent management's view of expected future rate changes.
Fair value hierarchy The Association uses the following hierarchy for determining and disclosing the fair value of its financial instruments and other non-financial instruments by valuation technique:
Level 1: Quoted (unadjusted) prices in active markets for identical assets or liabilities.
Level 2: Other techniques for which all inputs which have a significant effect on the recorded
fair value are observable, either directly or indirectly.
Level 3: Techniques which use inputs which have a significant effect on the recorded fair value that are not based on observable market data.

99
- 53 -
*SGVFS023432*
Financial instruments The Association’s principal financial instruments are cash and cash equivalents, loans and receivables, financial assets at FVPL, AFS financial assets, HTM investments, accounts payable and accrued expenses. The main purpose of these financial instruments is to finance their operations. The following table sets forth the carrying values and estimated fair values of financial assets and liabilities recognized as of December 31, 2016 and 2015:
2016 2015 Carrying Value Fair Value Carrying Value Fair Value Financial Assets Cash and cash equivalents P=132,874,089 P=132,874,089 P=378,155,071 P=378,155,071 HTM investments 7,947,632,304 7,799,645,819 6,297,160,291 6,357,132,187 Loans and Receivables Accrued interest receivable 79,338,746 79,338,746 70,078,688 70,078,688 Accounts receivables 22,727,946 22,727,946 81,257,437 81,257,437 Loans receivable 35,000,000 35,000,000 25,833,333 25,127,445 Other receivables 3,907,817 3,907,817 8,511,307 8,511,307 Short-term investments 113,413,490 113,413,490 240,420,682 240,420,682 Long-term investments 475,388,639 568,241,191 72,681,045 79,099,913 AFS financial assets Quoted 363,217,249 363,217,249 269,889,468 269,889,469 Unquoted 234,992,200 234,992,200 167,075,200 167,075,200
P=9,408,492,480 P=9,353,358,547 P=7,611,062,522 P=7,676,747,399 Financial Liabilities Accounts payable and accrued
expenses P=65,362,483 P=65,362,483 P=87,022,943 P=87,022,943
Due to the short-term nature of transactions, the carrying amounts of financial instruments such as cash and cash equivalents, short-term investments, receivables except loan receivable, financial assets at FVPL, quoted equity securities classified as AFS financial assets, accounts payable and accrued expenses approximate their fair values.
For unquoted equity investments classified as AFS, these investments are carried at cost less allowance for impairment losses due to the unpredictable nature of future cash flows and the lack of suitable methods for arriving at a reliable fair value.
For loans receivable and long-term investments classified under loans and receivable, fair value are based on discounted value of future cash flows using applicable rates for similar types of instruments. The discount rate used ranged from 4.00% to 6.00% and 2.44% to 3.92% as of December 31, 2016 and 2015, respectively.
For investments in mutual fund companies under AFS and HTM investments, fair values are established by reference to their market quoted price.
As of December 31, 2016 and 2015, the fair value of the investments in mutual funds designated as AFS financial assets of the Association amounted to P=363,217,249 and P=269,889,469, respectively.
The Association classifies AFS financial assets under Level 1 of the fair value hierarchy, except for the unlisted equity securities that do not have quoted market prices in an active market which are measured at cost and hence, not included above. During the reporting period ended December 31, 2016 and 2014, there were no transfers between Level 1 and Level 2 fair value measurements, and no transfers into and out of Level 3 fair value measurements.

100
- 54 -
*SGVFS023432*
Financial Risks The Association is exposed to financial risk through its financial assets, financial liabilities and insurance liabilities. In particular, the key financial risk that the Association is exposed to is that the proceeds from its financial assets may not be sufficient to fund the obligations arising from its insurance contracts. The most important components of this financial risk are credit risk, liquidity risk and market risk.
These risks arise from open positions in interest rate, currency and debt securities products, all of which are exposed to general and specific market movements.
Credit risk This is the risk that one party to a financial instrument will cause a financial loss for the other party by failing to discharge an obligation.
The following policies and procedures are in place to mitigate the Association’s exposure to credit risk:
a. The credit risk in respect of customer balances, incurred on non-payment of premiums or
contributions will only persist during the grace period specified in the policy document or when the policy is either paid up or terminated.
b. Reinsurance is placed with highly rated counterparties and concentration of risk is avoided by
following policy guidelines in respect of counterparties’ limits that are set each year and are subject to regular reviews. At each reporting date, management performs an assessment of creditworthiness of reinsurers and update the reinsurance purchase strategy, ascertaining suitable allowance for impairment.
c. The Association sets the maximum amounts and limits that may be advanced to corporate
counterparties by reference to their long term credit ratings.
The table below shows the maximum exposure to credit risk for the components of the statements of financial position.
2016 2015 Financial Assets Cash and cash equivalents (excluding cash on
hand amounting P=0.17 million and P=1.35 million in 2016 and 2015, respectively) P=132,702,931 P=376,809,393
Loans and Receivables Accounts receivable 22,727,946 81,257,437 Accrued interest receivable 79,338,746 70,078,688 Loans receivable 35,000,000 25,833,333
Advances for future stocks subscriptions 4,000,000 44,177,000 Other receivables 3,907,817 8,511,307
Short-term investments 113,413,490 240,420,682 Long-term investment 475,388,639 72,681,045
AFS financial assets Quoted 363,217,249 269,889,469 Unquoted 234,992,200 167,075,200 HTM investments 7,947,632,304 6,297,160,291 P=9,412,321,322 P=7,653,893,845

101
- 55 -
*SGVFS023432*
The credit risk is concentrated on the following:
2016 2015 Related parties P=873,475,406 P=441,841,365 Unrelated parties 8,538,845,917 7,212,052,479 P=9,412,321,323 P=7,653,893,844
The table below provides information regarding the credit risk exposure of the Association by classifying assets according to the Association’s credit ratings of counterparties as of December 31, 2016 and 2015.
2016
Neither Past-Due nor Impaired Past Due and
Impaired
Investment
Grade Non-investment
Grade Total Financial Assets HTM investments P=7,947,632,304 P=– P=– P=7,947,632,304 Cash and cash equivalents 132,874,089 – – 132,874,089 Loans and Receivables Long-term investments 475,388,639 – – 475,388,639 Short-term investments 113,413,490 – – 113,413,490 Accrued interest receivable 79,338,746 – – 79,338,746 Loans receivable 35,000,000 – – 35,000,000 Accounts receivables 20,238,907 – 2,489,039 22,727,946
Advances for future stocks subscription 4,000,000 4,000,000 Other receivables 3,585,276 − 322,542 3,907,818 AFS financial assets Quoted 363,217,249 – – 363,217,249 Unquoted 234,992,200 – – 234,992,200 P=9,409,680,900 P=− P=2,811,581 P=9,412,492,481
2015 Neither Past-Due nor Impaired
Past Due and Impaired
Investment
Grade Non-investment
Grade Total Financial Assets Cash and cash equivalents P=378,155,071 P=– P=– P=378,155,071 HTM investments 6,297,160,291 – – 6,297,160,291 Loans and Receivables Accounts receivables 61,258,920 – 19,998,516 81,257,436 Accrued interest receivable 70,078,688 – – 70,078,688 Loans receivable 25,833,333 – – 25,833,333
Advances for future stocks subscription 44,177,000 44,177,000 Other receivables 6,627,008 1,465,423 418,876 8,511,307 Short-term investments 240,420,682 – – 240,420,682 Long-term investments 72,681,045 – – 72,681,045 AFS financial assets Quoted 269,889,469 – – 269,889,469 Unquoted 167,075,200 – – 167,075,200 P=7,633,356,707 P=1,465,423 P=20,417,392 P=7,655,239,522
The Association uses a credit rating concept based on the borrowers and counterparties’ overall credit worthiness, as follows:
Investment grade - Rating given to borrowers and counterparties who possess strong to
very strong capacity to meet its obligations.
Non-investment grade - Rating given to borrowers and counterparties who possess above average capacity to meet its obligations.

102
- 56 -
*SGVFS023432*
The Association trades only with members who are also members of the related parties. The receivables represent mostly collections of the related parties pertaining to contributions for premiums for life insurance, loan redemption assistance and provident fund unremitted to the Association. Receivables are generally on a 1-30 days terms and are all current. All receivables are neither past due nor impaired.
The Association conducts periodic review of allowance for credit losses each financial year through examining the financial position of the related party and the market in which the related party operates.
Liquidity risk This risk is the risk that an entity will encounter difficulty in meeting obligations associated with financial instruments.
The following policies and procedures are in place to mitigate the Association’s exposure to liquidity risk:
a) The Association’s liquidity risk policy sets out the assessment and determination of what
constitutes liquidity risk for the Association. Compliance with the policy is monitored and exposures and breaches are reported to the management. The policy is regularly reviewed for pertinence and for changes in the risk environment.
b) Set guidelines on asset allocations, portfolio limit structures and maturity profiles of assets, in
order to ensure sufficient funding available to meet insurance and investment contracts obligations.
The following table shows an analysis of assets and liabilities analyzed according to whether they are expected to be recovered or settled within one (1) year and beyond one (1) year from reporting date:
2016
Up to one year 1-3 years 3-5 years Over 5 years No term Total
Financial assets Cash and other cash items P=132,874,089 P=– P=– P=– P=– P=132,874,089 HTM investments 186,059,170 84,277,723 1,595,713,987 6,081,581,424 – 7,947,632,304 Loans and Receivables Accounts receivables 22,011,130 716,816 – – – 22,727,946 Accrued interest receivable 79,338,746 – – – 79,338,746 Loans receivables 25,000,000 10,000,000 – – – 35,000,000 Advances for future stock
subscription 4,000,000 – – – – 4,000,000 Other receivables 3,734,221 173,597 – – – 3,907,818 Short-term investments 113,413,490 – – – 113,413,490 Long-term investments 1,615,075 71,065,970 402,707,594 – – 475,388,639 AFS financial assets – – – – 598,209,449 598,209,449 P=568,045,921 P=166,234,106 P=1,998,421,581 P=6,081,581,424 P=598,209,449 P=9,412,492,481 Financial liabilities Other financial liabilities Accounts payable - CAMIA P=9,200,683 P=– P=– P=– P=– P=9,200,683 Claims payable 54,318,712 − – – – 54,318,712 Collection fee payable 42,163,432 401,825 – – – 42,565,257 Accrued expenses 10,917,469 – – – – 10,917,469 P=116,600,296 P=401,825 P=– P=– P=– P=117,002,121

103
- 57 -
*SGVFS023432*
2015
Up to one year 1-3 years 3-5 years Over 5 years No term Total
Financial assets Cash and other cash items P=378,155,071 P=– P=– P=– P=– P=378,155,071 HTM investments 700,866,660 186,129,439 230,869,105 5,179,295,087 – 6,297,160,291 Loans and Receivables Accounts receivables 70,715,498 10,541,938 – – – 81,257,436 Accrued interest receivable 60,547,766 9,530,922 – – – 70,078,688 Loans receivables 15,833,333 10,000,000 – – – 25,833,333 Advances for future stock
subscription 44,177,000 – – – – 44,177,000 Other receivables 8,345,013 166,294 – – – 8,511,307 Short-term investments 240,420,682 – – – – 240,420,682 Long-term investments – 72,681,045 – – – 72,681,045 AFS financial assets – – – – 436,964,669 436,964,669 P=1,519,061,023 P=289,049,638 P=230,869,105 P=5,179,295,087 P=436,964,669 P=7,655,239,522 Financial liabilities Other financial liabilities Accounts payable - CAMIA P=52,253,642 P=– P=– P=– P=– P=52,253,642 Claims payable 38,652,259 – – – – 38,652,259 Collection fee payable 17,400,471 – – – – 17,400,471 Accounts payable - Alveo 8,589,719 – – – – 8,589,719 Accrued expenses 7,382,000 – – – – 7,382,000 P=124,278,091 P=– P=– P=– P=– P=124,278,091
Market risk Market risk is the risk that the fair value or future cash flows of a financial instrument will fluctuate because of changes in market prices. Market risk comprises three types of risks: foreign exchange rates (currency risk), market interest rates (interest rate risk) and market prices (price risk).
The following policies and procedures are in place to mitigate the Association’s exposure to market risk:
a. The market risk policy sets out the assessment and determination of what constitutes market
risk for the Association. Compliance with the policy is monitored and exposures and breaches are reported to the association risk committee. The policy is reviewed regularly for pertinence and for changes in the risk environment.
b. Set asset allocation and portfolio limit structure, to ensure that assets back specific member
liabilities and that assets are held to deliver income and gains for members which are in line with expectations of the members.
c. Stipulated diversification benchmarks by type of instrument, as the association is exposed to
guaranteed bonuses, cash and annuity options when interest rates falls.
Currency risk The Association’s principal transactions are carried out in Philippine peso and its foreign exchange risk arises primarily with respect to U.S. dollars, in which some of its investments are denominated.

104
- 58 -
*SGVFS023432*
The following table shows the details of the Association’s foreign currency denominated monetary assets and liabilities and their Philippine peso equivalents.
2016 2015
U.S. Dollar(1) Peso
Equivalent U.S. Dollar(1) Peso
Equivalent Cash in bank $10,881 P=541,998 $12,210 P=574,603 Short-term investments 5,540 275,944 5,501 258,877 Total $16,421 P=817,942 $17,711 P=833,480 (1) The exchange rate used was P=49.81 to US$1.00 in 2016 and P=47.06 to US$1.00 in 2015.
Sensitivity analysis The following table demonstrates sensitivity to a reasonably possible change in the Philippine Peso exchange rate, with all other variables held constant, of the Association’s income before income tax (due to changes in the fair value of currency sensitive monetary assets and liabilities).
Currency Increase (decrease) in
Philippine Peso rate Effect on
Profit 2016 USD +0.11 P=29,147 -0.11 (P=29,147) 2015 USD +0.80 P=6,657 -0.80 (P=6,657)
Interest rate risk This interest rate risk is the risk that the value or future cash flows of a financial instrument will fluctuate because of changes in market interest rates.
Floating rate instruments expose the Association to cash flow interest risk, whereas fixed interest rate instruments expose the Association to fair value interest risk. The Association’s interest risk policy requires it to manage interest rate risk by maintaining appropriate mix of fixed and variable rate instruments. The policy also requires it to manage the maturities of interest-bearing financial assets and interest-bearing financial liabilities. Interest on fixed interest rate instruments is priced at inception of the financial instrument and is fixed until the maturity.
The following table shows the information relating to the Association’s financial instruments as of December 31, 2016 and 2015 that are exposed to fair value interest rate risk presented by maturity profile.
2016
Range of interest rate Up to a year Over one (1) year Cash and cash equivalents-regular deposit 0.10% to 2.00% P=56,420,739 P=– Cash and cash equivalents-time deposits 1.75 % to 1.80 % 76,282,192 – Short-term investments 0.75 % to 4.25 % 113,413,490 – Long term investments 4.00% to 6.00% 1,615,075 473,773,564 HTM investments 3.25% to 7.75 % 186,059,170 7,761,573,134 Total financial assets P=433,790,666 P=8,235,346,698

105
- 59 -
*SGVFS023432*
2015 Range of interest rate Up to a year Over one (1) year Cash and cash equivalents-regular deposit 0.13% to 1.50% P=86,869,375 P=– Cash and cash equivalents-time deposits 1.25% to 2% 289,940,018 – Short-term investments 0.75% to 1.83% 240,420,682 – Long term investments 6.00% − 72,681,045 HTM investments 3.25% to 9.13% 700,866,658 5,596,293,633 Total financial assets P=1,318,096,733 P=5,668,974,678
Price risk The Association’s price risk exposure at year-end relates to financial assets whose values will fluctuate as a result of changes in market prices, principally, AFS investments. Such investment securities are subject to price risk due to changes in market values of instruments arising either from factors specific to individual instruments or their issuers or factors affecting all instruments traded in the market.
The Association’s investment policy requires it to manage such risks by setting and monitoring objectives and constraints on investments, diversification plan, and limits on investment in each country, sector and market. Investments in derivatives are also not allowed.
Sensitivity analysis The following table demonstrates sensitivity to a reasonably possible change in the market value of investments in mutual fund companies, with all other variables held constant, of the Association’s equity (due to changes in the net asset value of mutual funds).
Amount
Increase (decrease)
in fair value Impact on
fund balance 2016 P=166,145,575 +10% P=16,809,418 -10% (P=16,809,418) 2015 P=269,889,468 +10% P=26,988,947 -10% (P=26,988,947)
29. Commitment and Contingencies
There were no commitments, guarantees and contingent liabilities that arose in the normal course of the Association’s operations which are not reflected in the Association’s financial statements. As of December 31, 2016 and 2015, management is of the opinion that losses, if any, from these commitments, guarantees and contingent liabilities will not have a material effect on the Association’s financial statements.

106
- 60 -
*SGVFS023432*
30. Appropriated Fund Balance
The Association’s BOT approved the appropriation of the following:
Guaranty fund
(Note 7)
CARD MRI Disaster Relief
Assistance Program
(CDRAP) Experience
Refund Enhancement of IT System Total
At January 1, 2015 P=126,900,679 P=15,679,511 P=− P=− P=142,580,190 Appropriation − 44,320,490 − − 44,320,490 Utilization of appropriation − (27,242,598) − − (27,242,598) At December 31, 2015 P=126,900,679 P=32,757,403 P=− P=− P=159,658,082 Appropriation 12,471,700 37,242,597 33,547,858 10,322,396 93,584,551 Reversal of Appropriation (1,510,678) (39,386,927) − − (40,897,605) Utilization of appropriation − (30,613,073) (32,989,557) − (63,602,630) At December 31, 2016 P=137,861,701 P=− P=558,301 P=10,322,396 P=148,742,398
The Association is required to increase the guaranty fund based on the 5.00% annual gross premium collections until the guaranty fund reaches 12.50% of the minimum paid up capital for domestic life insurance companies or P=125.00 million, whichever is higher.
The Association appropriated P=37.24 million and P=44.32 million in 2016 and 2015, respectively for CDRAP aimed at providing relief assistance to its members and dependents during calamities and other disasters in the form of cash or relief goods. In 2016, reversal and utilization of appropriation amounted to P=39.39 million and P=30.61 million, respectively. These reversals, approved by the BOT, pertain to unused funds at year-end.
The Association also appropriated P=33.55 million for Experience Refund for distribution to the members. While the appropriation of P=10.32 million was set for the enhancement of CARD Microinsurance System.
31. Supplementary Tax Information Required Under Revenue Regulations 15-2010
The Association reported and/or paid the following types of taxes in 2016:
Value added tax (VAT) As a nonstock, not-for-profit and mutual benefit association, the Association was granted tax exemption with respect to income and value-added taxes as provided under the National Internal Revenue Code of 1997 as amended by Republic Act 8424 known as the Comprehensive Tax Reform Program by the Bureau of Internal Revenue (see Note 1).
a. Net Sales/Receipts and Output VAT declared in the Association’s VAT returns follows:
The Association paid Output VAT amounting to P=1.05 million from its rental income and interest earned from loans receivables amounting P=0.85 million and P=0.20 million, respectively.
b. The Association did not incur any Input VAT in 2016.
Information on the Association’s importations
The Association does not undertake importation activities.

107
- 61 -
*SGVFS023432*
Taxes and Licenses This includes all other taxes, local and national, including real estate taxes, license and permit fees lodged under the caption ‘Taxes and Licenses’ under the ‘General and Administrative Expenses’ section in the Association’s statements of income.
Details consist of the following in 2016:
Local tax License and permit fees P=1,509,493 Real property taxes 1,825,429 Professional Fee taxes 125,808 Documentary stamp taxes 32,403 Transfer tax Others 57,284 3,550,417 National tax Registration fees 19,964 P=3,570,381
c. Withholding Taxes
Details consist of the following:
Withholding taxes on compensation and benefits P=2,978,649 Expanded withholding taxes 2,322,903 P=5,301,552
d. Tax Assessments and Cases
The Association has not been involved in any tax case under preliminary investigation, litigation and/or prosecution in courts or bodies outside the Bureau of Internal Revenue.

108 *SGVFS023432*
CENTER FOR AGRICULTURE AND RURAL DEVELOPMENT (CARD) MUTUAL BENEFIT ASSOCIATION, INC. (A Nonstock, Not-for-Profit Association) SUPPLEMENTARY SCHEDULE REQUIRED UNDER SECURITIES REGULATOR CODE RULE 68, AS AMENDED (2011) DECEMBER 31, 2016 PHILIPPINE FINANCIAL REPORTING STANDARDS AND INTERPRETATIONS Effective as of December 31, 2016
Adopted Not Adopted
Not Applicable
Framework for the Preparation and Presentation of Financial Statements Conceptual Framework Phase A: Objectives and qualitative characteristics
PFRSs Practice Statement Management Commentary
Philippine Financial Reporting Standards
PFRS 1 (Revised)
First-time Adoption of Philippine Financial Reporting Standards
Amendments to PFRS 1 and PAS 27: Cost of an Investment in a Subsidiary, Jointly Controlled Entity or Associate
Amendments to PFRS 1: Additional Exemptions for First-time Adopters
Amendment to PFRS 1: Limited Exemption from Comparative PFRS 7 Disclosures for First-time Adopters
Amendments to PFRS 1: Severe Hyperinflation and Removal of Fixed Date for First-time Adopters
Amendments to PFRS 1: Government Loans
Amendments to PFRS 1: Borrowing costs
Amendments to PFRS 1: Meaning of ‘Effective PFRSs’
PFRS 2 Share-based Payment
Amendments to PFRS 2: Vesting Conditions and Cancellations
Amendments to PFRS 2: Group Cash-settled Share-based Payment Transactions
Amendments to PFRS 2: Definition of Vesting Condition
PFRS 3 (Revised)
Business Combinations
Amendments to PFRS 3: Accounting for Contingent Consideration in a Business Combination
Amendments to PFRS 3: Scope Exceptions for Joint Arrangements
PFRS 4 Insurance Contracts
Amendments to PAS 39 and PFRS 4: Financial Guarantee Contracts
Amendments to PFRS 4, Insurance Contracts, Applying PFRS 9, Financial Instruments, with PFRS 4 Not Early Adopted
PFRS 5 Non-current Assets Held for Sale and Discontinued

109
- 2 -
*SGVFS023432*
PHILIPPINE FINANCIAL REPORTING STANDARDS AND INTERPRETATIONS Effective as of December 31, 2016
Adopted Not Adopted
Not Applicable
Operations
Amendments to PFRS 5: Changes in Methods of Disposal
PFRS 6 Exploration for and Evaluation of Mineral Resources
PFRS 7 Financial Instruments: Disclosures
Amendments to PAS 39 and PFRS 7: Reclassification of Financial Assets
Amendments to PAS 39 and PFRS 7: Reclassification of Financial Assets - Effective Date and Transition
Amendments to PFRS 7: Improving Disclosures about Financial Instruments
Amendments to PFRS 7: Disclosures - Transfers of Financial Assets
Amendments to PFRS 7: Disclosures - Offsetting Financial Assets and Financial Liabilities
Amendments to PFRS 7: Mandatory Effective Date of PFRS 9 and Transition Disclosures
Amendments to PFRS 7: Servicing Contracts
Amendments to PFRS 7: Applicability of the Amendments to PFRS 7 to Condensed Interim Financial Statements
Hedge Accounting and amendments to PFRS 9, PFRS 7 and PAS 39 (2013 version) Not Early Adopted
PFRS 8 Operating Segments
Amendments to PFRS 8: Aggregation of Operating Segments and Reconciliation of the Total of the Reportable Segments’ Assets to the Entity’s Assets
PFRS 9 Financial Instruments
Amendments to PFRS 9: Mandatory Effective Date of PFRS 9 and Transition Disclosures
Amendments to PFRS 9: Financial Instruments
Amendments to PFRS 9: Classification and Measurement (2010 version)
Amendments to PFRS 9: Hedge Accounting
PFRS 10 Consolidated Financial Statements
Amendments to PFRS 9: Investment Entities
Amendments to PFRS 10: Sale or Contribution of Assets between an Investor and its Associate or Joint Venture
PFRS 11 Joint Arrangements
Amendments to PFRS 11: Accounting for Acquisitions of Interests in Joint Operations
PFRS 12 Disclosure of Interests in Other Entities

110
- 3 -
*SGVFS023432*
PHILIPPINE FINANCIAL REPORTING STANDARDS AND INTERPRETATIONS Effective as of December 31, 2016
Adopted Not Adopted
Not Applicable
Amendments to PFRS12: Investment Entities
PFRS 13 Fair Value Measurement
Amendments to PFRS 13: Investment Entities
Amendments to PFRS 13: Short-term receivable and payables
Amendments to PFRS 13: Portfolio Exception
PFRS 15 Revenue from Contracts with Customers Not early adopted
PFRS 16 Leases Not early adopted
Philippine Accounting Standards
PAS 1 (Revised)
Presentation of Financial Statements
Amendment to PAS 1: Capital Disclosures
Amendments to PAS 32 and PAS 1: Puttable Financial Instruments and Obligations Arising on Liquidation
Amendments to PAS 1: Presentation of Items of Other Comprehensive Income
Amendments to PAS 1: Clarification of the requirements for comparative information
Amendments to PAS 1: Disclosure Initiatives
PAS 2 Inventories
PAS 7 Statement of Cash Flows
Amendments to PAS 7, Statement of Cash Flows, Disclosure Initiative Not Early Adopted
PAS 8 Accounting Policies, Changes in Accounting Estimates and Errors
PAS 10 Events after the Reporting Period
PAS 11 Construction Contracts
PAS 12 Income Taxes
Amendment to PAS 12 - Deferred Tax: Recovery of Underlying Assets
Amendments to PAS 12, Income Taxes, Recognition of Deferred Tax Assets for Unrealized Losses Not Early Adopted
PAS 16 Property, Plant and Equipment
Amendment to PAS 16: Classification of servicing equipment
Amendment to PAS 16: Revaluation Method - Proportionate Restatement of Accumulated Depreciation
Amendments to PAS 16, Property, Plant and Equipment and PAS 38, Intangible Assets, Clarification of Acceptable Methods of Depreciation and Amortization
Amendments to PAS 16: Bearer Plants

111
- 4 -
*SGVFS023432*
PHILIPPINE FINANCIAL REPORTING STANDARDS AND INTERPRETATIONS Effective as of December 31, 2016
Adopted Not Adopted
Not Applicable
PAS 17 Leases
PAS 18 Revenue
PAS 19 Employee Benefits (Revised)
Amendments to PAS 19: Actuarial Gains and Losses, Group Plans and Disclosures
Amendments to PAS 19: Defined Benefit Plans: Employee Contributions
Amendments to PAS 19: Regional market issue regarding discount rate
PAS 20 Accounting for Government Grants and Disclosure of Government Assistance
PAS 21 The Effects of Changes in Foreign Exchange Rates
Amendment: Net Investment in a Foreign Operation
PAS 23 (Revised)
Borrowing Costs
PAS 24 (Revised)
Related Party Disclosures
Amendments to PAS 24: Key Management Personnel
PAS 26 Accounting and Reporting by Retirement Benefit Plans
PAS 27 (Amended)
Separate Financial Statements
Amendments to PAS 27: Investment Entities
PAS 28 (Amended)
Investments in Associates
Investments in Associates and Joint Ventures
Sale or Contribution of Assets between an Investor and its Associate or Joint Venture
Amendments to PFRS 10, PFRS 12 and PAS 28, Investment Entities: Applying the Consolidation Exception
Amendments to PAS 28, Measuring an Associate or Joint Venture at Fair Value (Part of Annual Improvements to PFRSs 2014 - 2016 Cycle)
Not Early Adopted
PAS 29 Financial Reporting in Hyperinflationary Economies
PAS 31 Interests in Joint Ventures
PAS 32 Financial Instruments: Disclosure and Presentation
Amendments to PAS 32 and PAS 1: Puttable Financial Instruments and Obligations Arising on Liquidation
Amendment to PAS 32: Classification of Rights Issues
Amendments to PAS 32: Tax effect of distribution to holders of equity instruments
Amendments to PAS 32: Offsetting Financial Assets and Financial Liabilities
PAS 33 Earnings per Share

112
- 5 -
*SGVFS023432*
PHILIPPINE FINANCIAL REPORTING STANDARDS AND INTERPRETATIONS Effective as of December 31, 2016
Adopted Not Adopted
Not Applicable
PAS 34 Interim Financial Reporting
Amendments to PAS 34: Interim financial reporting and segment information for total assets and liabilities
Amendments to PAS 34: Disclosure of information ‘elsewhere in the interim financial report’
PAS 36 Impairment of Assets
Amendments to PAS 36: Recoverable Amount Disclosures for Non-Financial Assets
PAS 37 Provisions, Contingent Liabilities and Contingent Assets
PAS 38 Intangible Assets
Amendments to PAS 38: Revaluation Method - Proportionate Restatement of Accumulated Amortization
Amendments to PAS 16, Property, Plant and Equipment and PAS 38, Intangible Assets, Clarification of Acceptable Methods of Depreciation and Amortization
PAS 39 Financial Instruments: Recognition and Measurement
Amendments to PAS 39: Transition and Initial Recognition of Financial Assets and Financial Liabilities
Amendments to PAS 39: Cash Flow Hedge Accounting of Forecast Intragroup Transactions
Amendments to PAS 39: The Fair Value Option
Amendments to PAS 39 and PFRS 4: Financial Guarantee Contracts
Amendments to PAS 39 and PFRS 7: Reclassification of Financial Assets
Amendments to PAS 39 and PFRS 7: Reclassification of Financial Assets - Effective Date and Transition
Amendments to Philippine Interpretation IFRIC 9 and PAS 39: Embedded Derivatives
Amendment to PAS 39: Eligible Hedged Items
Amendment to PAS39: Novation of Derivatives and Continuation of Hedge Accounting
Hedge Accounting and amendments to PFRS 9, PFRS 7 and PAS 39 (2013 version) Not Early Adopted
PAS 40 Investment Property
Amendment to PAS 40: Interrelationship between PFRS 3 and PAS 40
PAS 41 Agriculture
Amendments to PAS 41: Bearer Plants
Amendments to PAS 40, Investment Property, Transfers of Investment Property Not Early Adopted

113
- 6 -
*SGVFS023432*
PHILIPPINE FINANCIAL REPORTING STANDARDS AND INTERPRETATIONS Effective as of December 31, 2016
Adopted Not Adopted
Not Applicable
Philippine Interpretations
IFRIC 1 Changes in Existing Decommissioning, Restoration and Similar Liabilities
IFRIC 2 Members’ Share in Co-operative Entities and Similar Instruments
IFRIC 4 Determining Whether an Arrangement Contains a Lease
IFRIC 5 Rights to Interests arising from Decommissioning, Restoration and Environmental Rehabilitation Funds
IFRIC 6 Liabilities arising from Participating in a Specific Market - Waste Electrical and Electronic Equipment
IFRIC 7 Applying the Restatement Approach under PAS 29 Financial Reporting in Hyperinflationary Economies
IFRIC 8 Scope of PFRS 2
IFRIC 9 Reassessment of Embedded Derivatives
Amendments to Philippine Interpretation IFRIC 9 and PAS 39: Embedded Derivatives
IFRIC 10 Interim Financial Reporting and Impairment
IFRIC 11 PFRS 2 - Group and Treasury Share Transactions
IFRIC 12 Service Concession Arrangements
IFRIC 13 Customer Loyalty Programmes
IFRIC 14 The Limit on a Defined Benefit Asset, Minimum Funding Requirements and their Interaction
Amendments to Philippine Interpretations IFRIC 14, Prepayments of a Minimum Funding Requirement
IFRIC 16 Hedges of a Net Investment in a Foreign Operation
IFRIC 17 Distributions of Non-cash Assets to Owners
IFRIC 18 Transfers of Assets from Customers
IFRIC 19 Extinguishing Financial Liabilities with Equity Instruments
IFRIC 20 Stripping Costs in the Production Phase of a Surface Mine
IFRIC 21 Levies
IFRIC 22 Foreign Currency Transactions and Advance Consideration
SIC-7 Introduction of the Euro
SIC-10 Government Assistance - No Specific Relation to Operating Activities
SIC-12 Consolidation - Special Purpose Entities
Amendment to SIC-12: Scope of SIC-12
SIC-13 Jointly Controlled Entities - Non-Monetary Contributions by Venturers

114
- 7 -
*SGVFS023432*
PHILIPPINE FINANCIAL REPORTING STANDARDS AND INTERPRETATIONS Effective as of December 31, 2016
Adopted Not Adopted
Not Applicable
SIC-15 Operating Leases - Incentives
SIC-25 Income Taxes - Changes in the Tax Status of an Entity or its Shareholders
SIC-27 Evaluating the Substance of Transactions Involving the Legal Form of a Lease
SIC-29 Service Concession Arrangements: Disclosures
SIC-31 Revenue - Barter Transactions Involving Advertising Services
SIC-32 Intangible Assets - Web Site Costs