Table of Contents Appendix B - Florida Department of ... Manual/BMRM...Bridge Maintenance Course...
65
Bridge Maintenance Course Series Reference Manual i Table of Contents – Appendix B Appendix B - References .............................................................................................................. B-1 B.1 Example Inspection Report .................................................................................................... B-1 B.2 Summary of Condition States and Feasible Actions ............................................................ B-14 B.2.1 Reinforced Concrete Bridge Elements ...................................................................... B-16 B.2.2 Steel Substructure Elements ..................................................................................... B-17 B.2.3 Timber Substructure Elements .................................................................................. B-18 B.2.4 Precast Concrete Substructure Elements.................................................................. B-19 B.2.5 “Other” Substructure Elements ................................................................................ B-20 B.3 Comparison of Non-Destructive (NDT) Methods Table ...................................................... B-21 B.4 Summary OF NDT Methods ................................................................................................. B-23 B.4.1 Visual Inspection (VI) ................................................................................................. B-23 B.4.2 Metal Detection in Concrete: Locate reinforcing and post tensioning tendons .. B-25 B.4.3 Sounding: Detection of Delaminations in Concrete ................................................. B-27 B.4.4 Windsor Probe: Uniformity in Concrete Strength and Quality ................................ B-29 B.4.5 Rebound Hammer: Uniformity in Concrete Strength and Quality ........................... B-31 B.4.6 Impact Echo: Voids and Delaminations in Concrete Structures ASTM C1388 ......... B-33 B.4.7 Ground Penetrating Radar (GPR) .............................................................................. B-35 B.4.8 Ultrasonic Pulse Velocity: Evaluation of Concrete Structures ................................. B-37 B.4.9 Infrared (IR): Detection of Near Surface Anomalies................................................. B-39 B.4.10 Petrography: Study of Microscopic Structure of Concrete .................................... B-41 B.4.11 Magnetic Flux Leakage ............................................................................................ B-43 B.4.12 Impulse Response: Evaluation of Concrete Structures .......................................... B-45 B.4.13 Half Cell Testing: Corrosion Potential Measurement ............................................. B-47 B.4.14 Linear Polarization: Rate of Corrosion.................................................................... B-49 B.4.15 Concrete Resistivity ................................................................................................. B-51 B.4.16 Chloride Testing ....................................................................................................... B-53 B.4.17 Other Concrete Properties: Permeability & Alkalinity ............................................ B-55 B.4.18 Ultrasonic Testing (UT): Evaluation of Steel Structures .......................................... B-57 B.4.19 Dye Penetrant Testing ............................................................................................. B-59 B.4.20 Magnetic Particle Testing of Welds: Evaluation of Steel Structures ...................... B-60 B.5 AWPA Tables ........................................................................................................................ B-62
-
Upload
nguyenkien -
Category
Documents
-
view
223 -
download
0
Transcript of Table of Contents Appendix B - Florida Department of ... Manual/BMRM...Bridge Maintenance Course...

Bridge Maintenance Course Series Reference Manual
i
Table of Contents – Appendix B
Appendix B - References .............................................................................................................. B-1
B.1 Example Inspection Report .................................................................................................... B-1
B.2 Summary of Condition States and Feasible Actions ............................................................ B-14
B.2.1 Reinforced Concrete Bridge Elements ...................................................................... B-16
B.2.2 Steel Substructure Elements ..................................................................................... B-17
B.2.3 Timber Substructure Elements .................................................................................. B-18
B.2.4 Precast Concrete Substructure Elements .................................................................. B-19
B.2.5 “Other” Substructure Elements ................................................................................ B-20
B.3 Comparison of Non-Destructive (NDT) Methods Table ...................................................... B-21
B.4 Summary OF NDT Methods ................................................................................................. B-23
B.4.1 Visual Inspection (VI) ................................................................................................. B-23
B.4.2 Metal Detection in Concrete: Locate reinforcing and post tensioning tendons .. B-25
B.4.3 Sounding: Detection of Delaminations in Concrete ................................................. B-27
B.4.4 Windsor Probe: Uniformity in Concrete Strength and Quality ................................ B-29
B.4.5 Rebound Hammer: Uniformity in Concrete Strength and Quality ........................... B-31
B.4.6 Impact Echo: Voids and Delaminations in Concrete Structures ASTM C1388 ......... B-33
B.4.7 Ground Penetrating Radar (GPR) .............................................................................. B-35
B.4.8 Ultrasonic Pulse Velocity: Evaluation of Concrete Structures ................................. B-37
B.4.9 Infrared (IR): Detection of Near Surface Anomalies ................................................. B-39
B.4.10 Petrography: Study of Microscopic Structure of Concrete .................................... B-41
B.4.11 Magnetic Flux Leakage ............................................................................................ B-43
B.4.12 Impulse Response: Evaluation of Concrete Structures .......................................... B-45
B.4.13 Half Cell Testing: Corrosion Potential Measurement ............................................. B-47
B.4.14 Linear Polarization: Rate of Corrosion .................................................................... B-49
B.4.15 Concrete Resistivity ................................................................................................. B-51
B.4.16 Chloride Testing ....................................................................................................... B-53
B.4.17 Other Concrete Properties: Permeability & Alkalinity ............................................ B-55
B.4.18 Ultrasonic Testing (UT): Evaluation of Steel Structures .......................................... B-57
B.4.19 Dye Penetrant Testing ............................................................................................. B-59
B.4.20 Magnetic Particle Testing of Welds: Evaluation of Steel Structures ...................... B-60
B.5 AWPA Tables ........................................................................................................................ B-62

Bridge Maintenance Course Series Reference Manual
ii
List of Figures – Appendix B
Figure B.1 Visual Inspection Examples ....................................................................................... B-24
Figure B.2 Examples of Cover Meter Equipment (left) and Cover Meter Output (right) .......... B-26
Figure B.3 Sounding Examples ................................................................................................... B-28
Figure B.4 Examples of Windsor Probes and Resulting Data ..................................................... B-30
Figure B.5 Rebound Hammer Examples of Equipment and Data Output ................................. B-32
Figure B.6 Impact Echo Schematic, Setup, and Example Output Data ...................................... B-34
Figure B.7 GPR Equipment, Grid, and Output............................................................................ B-36
Figure B.8 Ultrasonic Pulse Velocity Method Schematic (top), Wave Path Examples (left), Equipment (right) ....................................................................................................................... B-38
Figure B.9 IR Figures ................................................................................................................... B-40
Figure B.10 Petrographic Images ............................................................................................... B-42
Figure B.11 Impulse Response Systems (top) and Data (bottom) ............................................. B-46
Figure B.12 Half-Cell Testing Images and Interpretation........................................................... B-48
Figure B.13 Examples of Linear Polarization Equipment ........................................................... B-50
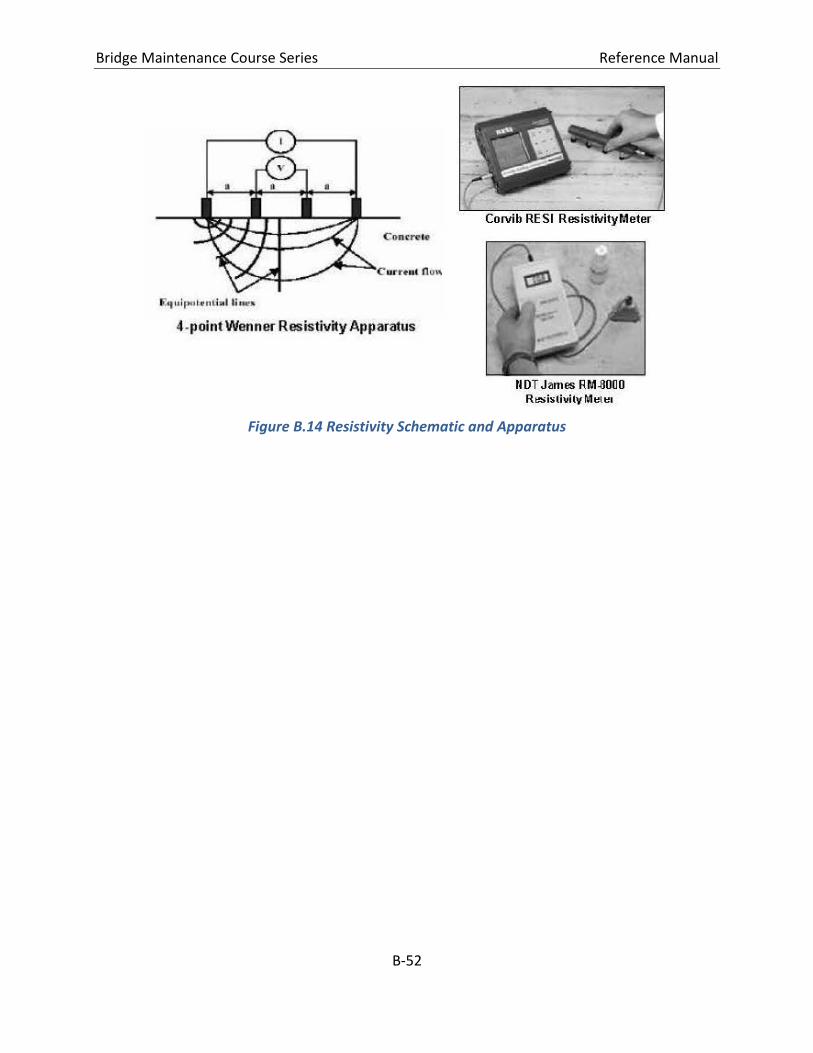
Figure B.14 Resistivity Schematic and Apparatus ...................................................................... B-52
Figure B.15 Chloride Measurement and Example Data ............................................................ B-54
Figure B.16 Interpretation of Permeability Test Results ........................................................... B-55
Figure B.17 Pink (darker) areas have pH > 10. Neutral areas are carbonated. Note carbonation along cracks, which provide some indication of crack age. ....................................................... B-56
Figure B.18 Schematic of UT and Example Output Data ........................................................... B-58
Figure B.19 UT Inspection of Bridge Hanger Pins (left), Bogie Shaft (middle), Sample CJP Weld . B-58
Figure B.20 Examples of Magnetic Fields .................................................................................. B-61
Figure B.21 Magnetic Particle Testing Showing: Magnetic particle yoke and particles in use after primer and paint removal (left); Crack after magnetic particle application (middle); Numerous cracks at a transverse floor beam (right) ................................................................................... B-61
Figure B.22 AWPA Classification Table for Lumber ................................................................... B-62
Figure B.23 AWPA Standard Use Classification System ............................................................. B-63

Bridge Maintenance Course Series Reference Manual
B-1
Appendix B -References
B.1 Example Inspection Report
The following report is an example of what a bridge inspection reportcould look like. State DOT’s have their own formatting for these documents. This report is a generic example. This example is for illustration purposes and may not reflect current requirements of the National Bridge Inventory Standards or AASHTO bridge inspection related manuals.

Bridge Maintenance Course Series Reference Manual
B-2

Bridge Maintenance Course Series Reference Manual
B-3

Bridge Maintenance Course Series Reference Manual
B-4

Bridge Maintenance Course Series Reference Manual
B-5

Bridge Maintenance Course Series Reference Manual
B-6

Bridge Maintenance Course Series Reference Manual
B-7

Bridge Maintenance Course Series Reference Manual
B-8

Bridge Maintenance Course Series Reference Manual
B-9

Bridge Maintenance Course Series Reference Manual
B-10

Bridge Maintenance Course Series Reference Manual
B-11

Bridge Maintenance Course Series Reference Manual
B-12

Bridge Maintenance Course Series Reference Manual
B-13

Bridge Maintenance Course Series Reference Manual
B-14
B.2 Summary of Condition States and Feasible Actions
Bridge condition is reported using a single scale that reflects common process for deterioration and the effect on serviceability. The general pattern for a Bridge Element having four condition states is as follows:
1. Good – No deterioration to minor deterioration 2. Fair – Minor to Moderate deterioration 3. Poor – Moderate to Severe deterioration 4. Severe – Beyond the limits established in condition state 3 and/or warrants a structural
review to determine strength or serviceability of the element or bridge
Each of these levels of deterioration is called a condition state. The condition state methodology provides two steps of information about a bridge element’s deterioration:
• Severity – characterized by precise definition of each condition state
• Extent – the distribution of the total element quantity among condition
The severity is important for selection of a feasible and cost effective preservation treatment, and extent is important for cost estimation.
Assignment of quantities to condition states is determined from element definitions and element commentary for National Bridge Elements. Condition state definitions are guidelines to the bridge inspector for categorization of the severity of the deficiency. Element commentary represents additional considerations for the inspector during the collection of data. From this information, the inspector can complete the element level evaluation. Additionally, element level Smart Flags (Defect Flags) are used to describe a condition which is not included in the National Bridge Element or Bridge Management Element condition state language.
Feasible actions are those that an agency may take to remove the defect. They represent a set of responses that may be taken for an element based upon quantities within a given condition state. They also represent general guidance on agency preservation strategies and can be customized by each agency for each element and condition state.
A summary of feasible actions and associated condition states is given below in Table B.1. Depending on the element, some feasible actions/conditions states may not be available. Other feasible actions, such as “Do Nothing”, are available for all element and condition states. “Do Nothing” can be used for all the elements in condition states since the possibility of nothing that needs to be done due to the condition of the element being good or to be used if the condition of the bridge is so severe, the bridge is closed and or there is a feasible action already taking place.

Bridge Maintenance Course Series Reference Manual
B-15
Table B.1 Feasible Actions Depending on Condition States
Feasible Action Condition
State 1 Condition
State 2 Condition
State 3 Condition
State 4
Do Nothing X X X X
Protect X X X X
Preserve (for other culverts and other railings)
X X
Repair X X X
Rehab X X
Reset (for bearings only) X X
Replace X X
The AASHTO Manual for Bridge Element Inspection, 1st Edition, is useful for developing this information. Some states may provide more detailed information; the following example is from Bridge Element Inspection Manual, published by Illinois Department of Transportation, Springfield, Illinois, 2014.

Bridge Maintenance Course Series Reference Manual
B-16
B.2.1 Reinforced Concrete Bridge Elements
Condition State Condition State Description Feasible Actions
1
The element shows no deterioration. There may be discoloration, efflorescence, and/or superficial cracking but without effect on strength and/or serviceability. No rust stains visible.
Continue preventive maintenance treatments
2
Minor cracks & spalls may be present but there is no exposed main reinforcing or surface evidence of reinforcement corrosion. Minor rust stains visible.
Continue preventive maintenance treatments and seal cracks and perform non-structural patching if necessary
3
Delaminations and/or spalls in the cover concrete may be present and main reinforcing may be exposed. Corrosion of main reinforcement may be present but loss of section is incidental. Working flexural cracks, map cracked areas or leaching cracks, and other miscellaneous cracks with medium rust staining. Minor impact damage may have occurred.
Clean reinforcement and patch, (and/or seal cracks)
Rehabilitate unit
4
Advanced deterioration. Measurable section loss of main reinforcement and/or loss of core concrete section. Internal failures have caused excessive movement. Damages due to vehicular collision that have caused reinforcement to be severed and/or large concrete section loss. Temporary supports may have been installed following structural analysis to allow continued utilization of the structure.
Rehabilitate, strengthen, or replace the element

Bridge Maintenance Course Series Reference Manual
B-17
B.2.2 Steel Substructure Elements
Condition State Condition State Description Feasible Actions
1
• Suspected locations where minor fatigue, out-of-plane bending cracks, tears or perforation could develop in structural elements that should be monitored during future inspections.
Continue preventive maintenance treatments
2
• Minor fatigue, out-of-plane bending cracks, tears, or perforation may be present in structural elements.
• Minor impact damage may have occurred.
• Excessive live load deflection occurs.
• Minor pitting has been cleaned and painted that does not require immediate action. Continue preventive maintenance treatments
Grind cracks or plate, lubricate hinges Straighten or install new section Spot paint
3
• Moderate fatigue, out-of-plane bending cracks, tears, or perforation in structural elements parallel to the direction of stress.
• Hinges may be frozen from corrosion.
• Impact damage has occurred and\or permanent deformations may be evident.
• Section loss up to 1/16” per face has been cleaned and painted
• Straighten or install new section
Grind cracks or plate; lubricate hinges Straighten or install new section
4
• Severe fatigue, out-of-plane bending cracks, impact damage, tears or perforations have occurred that requires repairs.
• Hinges demonstrate uneven alignment horizontally from below or vertically from the deck above.
• Temporary supports may have been installed following structural analysis to allow continued utilization of the structure.
• Section loss greater than 1/16” per face has been cleaned and painted
Install new sections Replace entire unit

Bridge Maintenance Course Series Reference Manual
B-18
B.2.3 Timber Substructure Elements
Condition State Condition State Description Feasible Actions
1
• Investigation indicates no decay
• There may be superficial cracks, splits and checks having no effect on strength or serviceability.
• Preservative is in place and functioning or untreated timber is sheltered from moisture and not in contact with the earth.
Continue preventive maintenance treatments
2
• Decay, insect infestation, splitting, cracking, checking or minor crushing may exist but none is sufficiently advanced to affect serviceability of the element.
• Preservative is in place but demonstrates thinning beyond surface discoloration.
• Minor leaking is occurring on untreated sheltered timbers.
• Fire damage limited to surface scorching with no measurable section loss.
Continue preventive maintenance treatments
Apply preservative where necessary
Review moisture protection
3
• Decay, insect infestation, splitting, cracking or crushing has produced loss of strength of the element but not of a sufficient magnitude to affect the serviceability of the bridge.
• Preservative is ineffective or nonexistent and timber is exposed to the weather or in contact with the earth.
• Fire damage limited to surface charring with minor, measurable section loss.
Apply preservative and/or fumigate
Replace affected members
4
• Advanced deterioration.
• Decay, insect infestation, splits, cracks or crushing has produced loss of strength that affects the serviceability of the bridge.
• Major fire damage which will substantially reduce the load carrying capacity of the member.
Replace affected members
Replace entire unit

Bridge Maintenance Course Series Reference Manual
B-19
B.2.4 Precast Concrete Substructure Elements
Condition State Condition State Description Feasible Actions
1
• The element shows no deterioration. There may be discoloration, efflorescence, and/or superficial cracking but without effect on strength and/or serviceability.
• No rust stains visible.
Continue preventive maintenance treatments
2
• Minor cracks & spalls may be present and there may be exposed reinforcing with no evidence of corrosion.
• There is no exposure of the prestress system.
• Minor rust stains visible.
Continue preventive maintenance treatments
Seal cracks and minor patch
3
• Delaminations and/or spalls may be present.
• There may be minor exposure but no deterioration of the prestress system.
• Corrosion of non-prestressed main reinforcement may be present but loss of section is incidental.
• Minor impact damage may have occurred.
• Working flexural cracks and other miscellaneous cracks with medium rust staining.
Clean steel and patch (and/or seal cracks)
Rehabilitate unit
4
• Delaminations, spalls and corrosion of non-prestressed main reinforcement are prevalent.
• There may also be exposure and deterioration of the prestress system (manifested by loss of bond, broken strands or wire, failed anchorages, etc.).
• Damages due to vehicular collision that may have caused wires to be severed and/or large concrete section loss.
• Rocking of members may be visible with the passage of live load.
• Temporary supports may have been installed following structural analysis to allow continual utilization of the structure.
Rehabilitate unit
Replace unit or entire member

Bridge Maintenance Course Series Reference Manual
B-20
B.2.5 “Other” Substructure Elements
Other substructure elements include: stone, masonry, etc. substructure elements
Condition State Condition State Description Feasible Actions
1 • There is little or no deterioration
• Only surface defects are in evidence
Continue preventive maintenance treatments
2
• There may be minor deterioration, cracking and weathering.
• Mortar in joints may show minor deterioration
Continue preventive maintenance treatments Rehabilitate affected area Minor repair, i.e. tuck point
3 • Moderate to major deterioration and
cracking.
• Major deterioration of joints.
Rehabilitate affected areas Minor repair, i.e., tuck point
4 • Major deterioration, splitting, or cracking Rehabilitate unit Replace unit

Bridge Maintenance Course Series Reference Manual
B-21
B.3 Comparison of Non-Destructive (NDT) Methods Table
The following table compares NDT methods used for different materials. The table also provides information regarding the effectiveness of the method. Information regarding the time required for use, cost of use, and complexity of use is included. This table was recreated from FHWA NHI Course ILT 130099A Bridge Inspection Non-Destructive Evaluation Showcase (BINS).
Note that the following apply for Table B.2:
C: Concrete
S: Steel
T: Timber
A: All
H: High Effectiveness
M: Medium Effectiveness
L: Low Effectiveness

Bridge Maintenance Course Series Reference Manual
B-22
Table B.2 Summary of NDT Methods
Cra
ckin
g
Scal
ing
Spal
ling
Del
amin
atio
n
Rei
nfo
rcem
ent
Co
rro
sio
n
Ch
emic
al A
ttac
k
PS
Stra
nd
C
orr
osi
on
/B
reak
s
Vo
ids
in G
rou
ted
Du
cts
Surf
ace-
Bre
akin
g C
rack
s
Sub
surf
ace
Cra
cks
Inte
rnal
Vo
ids
Po
rosi
ty a
nd
Sla
g in
Wel
ds
Co
rro
sio
n/S
ecti
on
Lo
ss
Surf
ace
Dec
ay
and
Ro
t
Inte
rnal
Dec
ay
and
Vo
ids
Wea
ther
ing
and
Ab
rasi
on
Ch
emic
al A
ttac
k
Dis
tort
ion
/M
ove
men
t
Tim
e to
Use
Co
st o
f U
se
Co
mp
lexi
ty
Material (Concrete, Steel, Timber, All) C C C C C C C C S S S S S T T T T A - - -
Visual Inspection M M M L L - - - M - - - L M - M L H Low Low Low
Hands-On Inspection H H H L L - - - H - - L H M - H L H Med Low Low
Borescope - - - - H - H H - - - - M - H - - H High Med Med
Dye Penetrant - - - - - - - - H - - - - - - - - - High Low Low
Ultrasonic Testing – Straight Beam - - - - - - - - H H H M H - - - - - Med Med Med
Ultrasonic Testing – Angled Beam - - - - - - - - H H H H H - - - - - Med Med Med
Ultrasonic Testing – Phased Array - - - - - - - - H H H H H - - - - - Med High High
Acoustic Emission - - - - - - H - H H - - L - - - - - V. High V. High V. High
Magnetic Particle Testing - - - - - - - - H L L - - - - - - - Med Low Med
Eddy Current - - - - - - - - H L L L - - - - - - Med Low Med
Radiographic Testing – Gamma Ray M - - - - - H H M M H H M - L - - - High V. High High
Radiographic Testing – X-ray M - - - - - H H M M H H M - L - - - High V. High High
Chain Drag and Hammer Sounding - - - M - - - - - - - - - - L - - - Med Low Low
Impact Echo H - - H M L - H - - - - - - L - - - High Med High
Ultrasonic Surface Waves H - - - M L - H - - - - - - - - - - High High High
Ultrasonic Pulse Velocity / Pulse Echo H - - - M L - - - - - - - - H L - - Med Med Med
Pachometer / Covermeter - - - - L - - - - - - - - - - - - - Low Low Low
Magnetic Flux Leakage - - - - L - H L H L L - L - - - - - Med Med Med
Ground Penetrating Radar M - M H - - - M - - - - - - - - - - High High V. High
Infrared Thermography - - H H - - - - - - - - - - - - - - Med High Med
Electrical Continuity and Conductivity - - - - H - M - - - - - - M M - - - Low Low Low
Half Cell Potential - - - - H - - - - - - - H - - - - - Med Low Med
Electrical Resistivity - - - - H - - - - - - - - M M - - - Med Low Med
Galvanostatic Pulse - - - - H - - - - - - - - - - - - - High Med High
Carbonation Testing - - - - L H - - - - - - - - - - - - Med Low Med
Chloride Ion Testing - - - - L H - - - - - - - - - - - - High Med Low
Rebound Hammer Testing - - - M - L - - - - - - - - - - - - Low Low Low
Penetration Testing - - - L - L - - - - - - - H - M M - Med Med Med
Laser Scanning L M M - - - - - L - - - L - - - - H Med Med Med
Optical holography - - - - - - - - - - - - - - - - - H High V. High High
Exploratory (Endoscope, Demolition) - - - - H - H H - - - - M - H - - H High Med Med
Material Sampling - - - H M H - M L L L L H H H H H - High High Med
Laboratory Testing - - - - - H - - - - - - - - - - H - High High High

Bridge Maintenance Course Series Reference Manual
B-23
B.4 Summary OF NDT Methods
This section has been reproduced from NHI course 134062 Bridge Rehabilitation Evaluation & Design Course Participant Workbook, Lesson 4.
B.4.1 Visual Inspection (VI)
Principles
• Visual inspection (VI) includes all unaided inspection/evaluation techniques
that use the five senses with only very basic tools (for example flashlights,
sounding hammers, tape measures, plumb bob, etc.).
• The Aging Aircraft Nondestructive Inspection Validation Center (AANC) defines Visual Inspection as a process of examination and evaluation of systems and
components by use of sensory systems aided only by such mechanical
enhancements to sensory input as magnifiers, probes, and the like. The
inspection process may be done using such behaviors as looking, listening,
feeling, smelling, shaking, and twisting. It includes a cognitive component
wherein observations are correlated with knowledge of the structure and a
general body of information from literature and past experience.
Factors affecting VI
• The accuracy of VI is influenced by four factors: Subject factors, physical factors, environmental factors, and organizational factors. Aspects of each factor are elaborated below.
• Subject Factors: Visual acuity, color vision, eye movement, age, experience, personality, intelligence, training, etc.
• Physical and environmental factors: Lighting, aids (magnifiers, overlays, viewing screen, CCTV, automatic scanner, etc.), background noise, workplace design, etc.
• Task Factors: Inspection time, pace, density of observations, spatial relationship of observations, fault probability, object complexity, etc.
• Organizational Factors: Number of inspectors, instructions, supervision,
training, standards, budget, alertness, social factors, motivation, incentives,
etc.
Advantages
• Visual inspection is inexpensive and easy to execute.
Disadvantages
• A study by FHWA’s NDE Validation Center found that fear of traffic, near visual acuity, color vision, formal bridge inspection training, light intensity, accessibility (heights and use of specialized equipment), structure complexity, wind speed, temperature, and

Bridge Maintenance Course Series Reference Manual
B-24
expected time to complete task were factors that negatively affected visual inspection accuracy.
• Further, visual inspection is not likely to detect and identify specific types of defects for which in-depth inspections are prescribed. For example, inspectors charged with in-depth fatigue inspections are not likely to find small cracks. The NDEVC study found that inspectors don’t always view welds from the proper distance and are not using appropriate enhancement tools such as lights and magnifiers.
Figure B.1 Visual Inspection Examples

Bridge Maintenance Course Series Reference Manual
B-25
B.4.2 Metal Detection in Concrete: Locate reinforcing and post tensioning tendons
Types of Devices to Detect Metal in Concrete
Rebar location devices are frequently referred to as covermeters, R-meters, or pachometers.
These devices operate on the principle of electromagnetic induction. Unlike concrete, steel bars interact strongly with low-frequency electromagnetic waves applied to the surface of the concrete structure, making it easy to identify their location.
Commercial covermeters either operate on the principle of magnetic reluctance or eddy currents.
Principles of Operation
• Reinforcing bar is detected by a covermeter when the bar lies within the zone of influence of the covermeter search head (yoke or coil). The covermeter response is at a maximum when the search head lies directly over the reinforcing bar. When the bar is not positioned directly under the search head, it can still be detected by the covermeter depending on the magnitude of the horizontal offset. The horizontal offset is defined as the horizontal distance from the center of the bar to the center of the search head.
• Discernment of individual reinforcing bars - A covermeter with a small zone of influence can discern individual bars that are closely spaced with its focused search head. However, these “focused” covermeters also have less penetrating ability and are not able to locate bars that are deeply embedded. Therefore, with this tradeoff recognized, it is desirable to use a covermeter with properties tailored for the specific application.
• Detection of the end of rebar - The zone of influence also affects how accurately the end of a reinforcing bar can be detected. A smaller more focused zone of influence will allow more accurate detection of the end, providing a better estimate of its location.
• Directional Characteristics of Search Heads - Some covermeter search heads can have directional characteristics. For magnetic reluctance covermeters, the shape of the yoke makes it directionally dependent compared to the symmetric coil in an eddy-current meter. For the magnetic reluctance covermeters, the maximum response is found when the yoke is aligned with the longitudinal axis of the reinforcing bar. When testing a structure with an orthogonal gridwork of reinforcing bars, using a magnetic reluctance covermeter would be a benefit if the orientation of the bar needs to be known.
Advantages
• Economical
• Minimal training
• Durable equipment
• Can detect bar size and/or cover, if the other is known
Disadvantages
• Does not have good resolution in areas of high rebar concentration
• Requires calibration or physical verification testing if used to detect bar size and/or depth
• Overestimation of capability

Bridge Maintenance Course Series Reference Manual
B-26
Figure B.2 Examples of Cover Meter Equipment (left) and Cover Meter Output (right)

Bridge Maintenance Course Series Reference Manual
B-27
B.4.3 Sounding: Detection of Delaminations in Concrete
Principles of Sounding (ASTM D4580-03)
• When impacted with a sounding device consisting of steel wheels, chain, or
hammer non-delaminated concrete will produce a clear ringing sound. A dull
or hollow sound is emitted when delaminated concrete is encountered.
• Bridge decks should be systematically surveyed by delineating the survey
area into reasonable spaced grids ranging from 15 in. to 3 ft. on center. The
delaminations found within each grid are recorded on scaled drawings of the
bridge deck, and an estimate of the total percentage deck delamination
calculated.
Typical Procedures
• Electro-mechanical sounding devices employ an electric powered tapping device, sonic
receiver, and recorder mounted on a cart to detect delaminations. These devices can
produce printed records of delamination surveys. The tapping device consists of steel
wheels which impact the surface at 33 times/sec and a piezo-electric hydrophone
located in oil filled tires that travel next to the impacting wheels. Calibration of the
device is required.
• Chain drag sounding consists of dragging a chain, or tapping the surface with a hammer
or rod, and listening for a dull or hollow sound, which denotes a delamination. Chains of
1 in. x ½ in. in diameter have proved effective, either supported from a bar or swung
across the deck in longer lengths. Heavier chains may be required under heavy traffic
conditions. Quantity of delaminations is recorded using tape measures or estimates.
• Rotary percussion devices consist of toothed-wheels that are rolled across the surfaces,
emitting a dull or hollow sound when passed over a delamination. This device can be
used on vertical and overhead surfaces.
Advantages
• Easy to perform, with minimal training and at a low cost
• Used to rapidly detect delaminations up to about 5 in. in depth, and more typically in the 1 to 2 in. depth range
• Can be used to detect debonding between PC overlays and deck, but may not differentiate delaminations in substrate.
Disadvantages
• Traffic control is required
• Hearing ability of operator will affect accuracy of soundings
• Not applicable to bridge decks with bituminous overlays
• Traffic noise, fear of traffic, safety of inspector, and time allotted for task each affect accuracy of sounding surveys
• Cannot detect deep or frozen delaminations

Bridge Maintenance Course Series Reference Manual
B-28
Figure B.3 Sounding Examples

Bridge Maintenance Course Series Reference Manual
B-29
B.4.4 Windsor Probe: Uniformity in Concrete Strength and Quality
Principles (ASTM C 803)
• The Windsor Probe uses a powder charge to drive a steel probe into hardened concrete. The depth of penetration is an indication of concrete strength.
• The test has applicability in determining the uniformity in concrete strength and quality. It can be used to obtain an approximate value of compressive strength.
Typical Procedures
The Windsor probe is a penetration test that provides an indication of the compressive strength of a concrete sample. The test consists of driving a .25 in. diameter by 3.125 in. long probe into concrete by means of a precision powder charge. The depth of penetration provides an indication of the compressive strength of the concrete. Although the manufacturer provides calibration charts, the instrument should be calibrated for the type of concrete and the type and size of aggregate used.
Equipment is comprised of a power-actuated gun or driver, hardened alloy probes, loaded cartridges, a depth gauge for measuring penetration of probes, and other related equipment.
Probe test results vary and are not expect to give accurate values of concrete strength. The ability to check the quality and maturity of in-situ concrete is the test’s greatest attribute. It provides a means of assessing strength development with curing.
The method has been estimated to be accurate with 5% +/- when the procedure is properly performed and a correlation to the subject concrete is developed.
Advantages
• Identifies questionable areas of in-situ concrete for further investigation
• Fast and simple method of analysis
• Relative quality indicator
• Moderate cost
• Fairly good correlation with other methods
Disadvantages
• Calibration of probe depth to core sample compression strength is required for reliable results
• Results are approximate to near-surface concrete
• Results are affected by surface conditions and aggregate
• Minimum surface damage

Bridge Maintenance Course Series Reference Manual
B-30
Figure B.4 Examples of Windsor Probes and Resulting Data

Bridge Maintenance Course Series Reference Manual
B-31
B.4.5 Rebound Hammer: Uniformity in Concrete Strength and Quality
Principles (ASTM C 805)
The rebound hammer, typically called Schmidt Hammer, is a surface hardness test method. The rebound principle consists of a spring-driven mass that is driven against the surface of a concrete specimen with known energy. The rebound distance is measured and the “hardness” of the surface is estimated from this value. The energy absorbed by the specimen is related to both its strength and stiffness.
The accuracy of the rebound hammer has been estimated between 15-20% in laboratory testing and +/- 25% in field testing.
Typical Procedures
• Rebound hammer can be used in horizontal, vertical or inclined position.
• Hammer must be perpendicular to surface being tested.
• The surface is impacted with a steel probe and the rebound is measured from 10 to 100. The greater the rebound number the higher the concrete stiffness, and hence, quality.
• Correlation with concrete under investigation is required to validate test results, although a calibration curve is provided with the instrument which can be used to approximate strength.
Advantages
• Easy and economical to use
• Provides rapid means of assessing concrete quality, and identifying areas for further investigation.
Disadvantages
• Provides near surface measurement of concrete properties and consequently may be influenced by surface conditions, such as smoothness, rigidity, moisture content, and density (carbonation).
• Aggregate quality and quantity can influence results.
• Should not be used on early age concrete.
• Requires calibration to core sample tests to validate results.

Bridge Maintenance Course Series Reference Manual
B-32
Figure B.5 Rebound Hammer Examples of Equipment and Data Output

Bridge Maintenance Course Series Reference Manual
B-33
B.4.6 Impact Echo: Voids and Delaminations in Concrete Structures ASTM C1388
Principles of Impact Echo
In the impact-echo method (IE), an impact generates stress waves which propagate in all directions. The duration of the impact is typically less than 100 microseconds. A transducer next to the point of impact monitors surface motion and records the waveforms. The waves are reflected by internal interfaces or external boundaries. When the echoes return to the surface, a transducer with a data-acquisition system records their displacements. The frequency of the surface response is analyzed to determine depth and location of defect. Analysis depends on wave speed in the test specimen. Calibration is required.
Typical Applications
• Determination of thickness of plate-like structures
• Detection of damage (voids, flaws or honeycombs) in slabs and bridge decks with or without overlays.
• Location of voids in beams, columns, grouted tendon ducts and hollow cylindrical members, to assess the quality of the bond in overlays at the asphalt-concrete interface and at reinforcement, and to measure the depth of surface opening cracks.
Wave speed provides an indicator of the quality of the concrete. The average wave speed in concrete is approximately 3660 m/sec (12,000 ft./sec). A wave speed lower than this may indicate poor quality.
Advantages
• Access to one surface is sufficient to determine depth and extent of defect
• Minimal, relatively inexpensive equipment that is practical for use in the field
• Does not damage member being evaluated
Disadvantages
• Data interpretation/analysis by experienced operator required
• Complex waveforms due to stress wave propagation in all directions complicates analysis
• Heavy reinforcement and/or multiple boundary conditions complicates waveforms
• Limited to a depth of about 1 meter
• Expensive for assessment of large areas

Bridge Maintenance Course Series Reference Manual
B-34
Figure B.6 Impact Echo Schematic, Setup, and Example Output Data

Bridge Maintenance Course Series Reference Manual
B-35
B.4.7 Ground Penetrating Radar (GPR)
Radar uses electromagnetic waves to detect subsurface anomalies. An antenna, generally affixed to a vehicle, is used to transmit short pulses of electromagnetic energy into the surveyed material. A portion of the energy is reflected back to the antenna when an interface between materials of dissimilar dielectric properties is encountered. The antenna then generates an output signal that contains information on what was reflected, how quickly the signal traveled, and how much signal was attenuated.
Typical Applications
Radar uses electromagnetic waves to determine concrete thickness, locating voids and rebars, and identifying deterioration.
Advantages
• Assess greater area than other methods, saving time and costs
• Access to only one side required
• Very sensitive to presence of embedded metal objects
• Very sensitive to presence of water
• Can penetrate concrete up to 12 to 16 inches, although resolution decreases with depth
• Provides record of inspection
• Can “see” below overlays
Disadvantages
• Extensive data interpretation/analysis, which requires experience
• Expensive equipment
• Environmental conditions can affect testing
• Congested reinforcement can mask deficiencies
• Difficult to penetrate through wet substrates; wet chlorides can skew results
• Cracks, delaminations, and honeycombing are difficult to detect unless moisture present
• Requires skilled operator and calibration

Bridge Maintenance Course Series Reference Manual
B-36
Figure B.7 GPR Equipment, Grid, and Output

Bridge Maintenance Course Series Reference Manual
B-37
B.4.8 Ultrasonic Pulse Velocity: Evaluation of Concrete Structures
Principles of UPV (ASTM C597)
The ultrasonic through transmission method is commonly known as the Ultrasonic Pulse Velocity (UPV). In this method, a stress pulse of compressive waves travels through the mature concrete, and the travel time is measured for a known path length. The UPV can then be calculated. An ASTM standard has been written detailing pulse velocity testing in concrete, ASTM C 597 “Standard Test Method for Pulse Velocity Through Concrete”.
The pulses of compression waves are generated by an electro-acoustical transducer that is held in contact with one surface of the concrete under test. Waves are received by another transducer, which measures the transit time (T). Transducers with a resonant frequency of 50-kHz are most common.
Typical Procedures
The pulse velocity of ordinary concrete is typically 3660 m/sec (12,000 ft./sec). The speed
depends on the concrete’s density and stiffness. Changes in the speed are apparent in concrete
that has not been uniformly consolidated, cured, or has different materials or mix proportions. Based on these reasons, the factors that affect pulse velocity for a concrete of a given strength
are the aggregate type, aggregate content, moisture content, and the presence of
reinforcement. Different aggregate types have different moduli. An increase in aggregate content means the wave travels through a denser material. The wave also travels faster
through water than air. Steel increases the pulse velocity (1.5 to 2 times higher) when it is in
the path of the pulse. There is no simple correlation between PV and concrete properties, like compressive strength.
When a defect is present, like an air void, the travel time increases, i.e., the velocity decreases. This is shown schematically in Figure B.8. For path 1, the velocity is the fastest. It travels through good quality concrete. For path 2, the velocity decreases as the wave has to travel through inferior concrete. For path 3, the wave has to travel around the crack, and the velocity will be less than it was for path 1. For path 4, the wave cannot be detected by the receiver. The air interferes with its transmission. A comparison of the measured pulse velocities provides an indication of the relative quality of the concrete.
Important Notes
Wave speed provides an indicator of the quality of the concrete. The average wave speed in concrete is approximately 3660 m/sec (12,000 ft./sec). A wave speed lower than this may indicate poor quality.
Advantages
• Relatively fast
• Ability to test long path lengths (up to 60 ft.)
• Relative indicator of material properties
• Can be correlated to strength/elastic properties
Disadvantages

Bridge Maintenance Course Series Reference Manual
B-38
• Two sided access required
• Accurate path length distance must be known
• Signal strength affected by acoustic coupling
• Wave speed can be influenced by concrete properties and steel
Figure B.8 Ultrasonic Pulse Velocity Method Schematic (top), Wave Path Examples (left), Equipment (right)

Bridge Maintenance Course Series Reference Manual
B-39
B.4.9 Infrared (IR): Detection of Near Surface Anomalies
Principles (ASTM D4788)
• Infrared Thermography is based on the principle that subsurface anomalies in a material affect heat flow through that material. Localized differences in surface temperature cause changes in the heat flow, or emitted radiation. By measuring the electromagnet
radiation in the IR spectrum, anomalies can be detected.
• The wavelength of the emitted electromagnetic radiation is proportional to temperature.
• Anomalies associated with poor concrete, namely defects therein, decrease the thermal conductivity of concrete without substantially increasing the convection effects.
• ASTM D 4788 “Method for Detecting Delaminations in Bridge Decks Using Infrared
Thermography”
• A temperature gradient is required to detect defects, which requires approximately 4 hrs. of direct sunlight for bare concrete decks and 6 hrs. of sunlight for asphalt covered
decks.
Typical Applications
• IR is applicable to the detection of delaminations, voids and cracking in bridge elements, including decks.
• IR can be used on decks with and without asphalt.
• IR can be used to detect debonding and delaminations in carbon fiber composites. Advantages
• Generally fast, non-contact method of survey allowing economical collection of data on
large areas
• Works on wide range of materials, including asphalt overlay bridge decks
• Limited to near surface defects
• Skilled operator required
• Good documentation of inspected areas
Disadvantages
• Depth or thickness of defect cannot be determined
• Requires uniform heating, so shade or wind can effect results
• Moisture can affect results
• Requires trained staff for post-processing of data
• As depth of defect increases, detection ability decreases

Bridge Maintenance Course Series Reference Manual
B-40
Figure B.9 IR Figures

Bridge Maintenance Course Series Reference Manual
B-41
B.4.10 Petrography: Study of Microscopic Structure of Concrete
Principles
Petrographic examinations can be made on concrete fragments and cores removed from suspect areas. It is best to subject poor and good quality areas to examination to better diagnose the distressed concrete.
The following information can be gained through petrography studies:
Evaluation
• Mix proportions
• Effectiveness of mixing
• Consolidation
• Curing/carbonation Water content
• Degree of maturity (cement hydration)
• Bonding within concrete matrix
• Discoloration/staining
Detection
• Segregation caused by over vibration
• Course ground cement
• Partially hydrated or old cement
• Retempering
• Supplemental cementitious materials
• Alkali Silica Reactions (ASR)
• Delayed Ettringite Formation (DEF)
• Freezing of plastic concrete
• Freeze thaw distress
• Aggregate soundness
• Sulfate attack
• Contaminants
• Aggregate composition
Determine
• Air content and parameters of air void system
• Water/ Cement Ratio
Advantages
• Provides insight into existing concrete properties related to durability
Disadvantages
• Can be time consuming
• Requires sample removal
• Results are local, not necessarily representative of global situation

Bridge Maintenance Course Series Reference Manual
B-42
Figure B.10 Petrographic Images

Bridge Maintenance Course Series Reference Manual
B-43
B.4.11 Magnetic Flux Leakage
Magnetic Flux Leakage is the measurement of changes in the path of magnetic force lines, or flux, near a ferromagnetic material, such as steel, with discontinuities or defects. In the presence of a magnetic field, ferromagnetic materials align their electric dipoles with the external field. A stronger field yields more aligned dipoles. There is a saturation point where all dipoles are aligned and no further alignment is possible. The amount of the alignment of these dipoles, and subsequently the flux, depends on the intensity of the applied magnetic field. It is therefore possible to increase the intensity of magnetic flux leakage to overcome some of the inherent limitations in terms of sensitivity, signal-to-noise ratio, etc. The applied magnetic field needs to be large enough to overcome problems due to noise, distance between the magnetic source and ferromagnetic field, and the masking effect of the large quantities of steel typically found in prestressed and reinforced concrete members. When an external magnetic field is applied to reinforced or prestressed concrete members, the flux within the steel remains unchanged until it must leave the steel to travel back to the south pole of the magnet. If the flux encounters a flaw, such as corrosion or broken and fractured steel, the flux will “leak” out at these areas and not travel to the south pole of the magnet. The amount of leakage can be measured using Hall-effect sensors. The crystals of the sensors react to the presence of an external magnetic field when excited by developing a voltage difference across the two parallel faces of the crystal, this is known as the “Hall Effect.”
Magnetic flux leakage Magnetic flux leakage (MFL), formerly referred to as magnetic field perturbation testing (MFP), consists of subjecting a magnetically permeable material to a magnetic field. The field strength requirements depend on the permeability of the material and the sensitivity of the test probes. The principles of magneto-statics demonstrate that when a homogeneous magnetically permeable material is immersed in a static, uniform, external magnetic field, the magnetic field within the material approaches the same magnitude as the magnetic field in which it is immersed. These perturbed fields are called leakage fields due to the “leakage” of magnetic flux out of the material and into the air. Leakage is caused by the reduction in cross-sectional area of the magnetic material due to the anomaly. Inspections using magnetic flux leakage techniques The preferred characteristic of the MFL technique is that mechanical contact with the test specimen is not necessary. In many cases, both the exciting coil and the sensing coil may be operated without directly contacting the material. This advantage has particular importance in the structural concrete industry. Another benefit of MFL is that it requires no specific surface preparation other than cleaning. This method is easily automated for high-speed, detailed testing. It is also useful for identifying surface cracks, near-surface inclusions, and nonmagnetic coating thickness on a permeable base, as well as in monitoring physical and mechanical properties that cause changes in magnetic permeability. Sensitivity is limited by ambient noise and magnetic fields. The test specimen must be magnetically saturated, thereby limiting demagnetization concerns. The extreme sensitivity of the method has been utilized to detect surface cracks and subsurface inclusions on the order of 0.3 mm.
The magnetic flux leakage method has been applied to the determination of nonmagnetic coating thickness, the depth of case hardening, and the carbon content of a material.

Bridge Maintenance Course Series Reference Manual
B-44
Another major application has been in testing steel bearing raceways and gear teeth. In its most refined form, MFL is one of the most sensitive methods for the detection of surface and near-surface cracks and flaws in ferromagnetic materials.

Bridge Maintenance Course Series Reference Manual
B-45
B.4.12 Impulse Response: Evaluation of Concrete Structures
Principles of Impulse Response
• Impulse Response is a nondestructive testing technique in which mobility of the test structure is measured. Slab impulse response is used to identify poor support zones below pavements, and to map out the extent of the voids. It is also able to evaluate the effectiveness of repairs to the slab-subgrade, by comparing test results before and after repairs are made. This test was first developed in France to assess the condition of deep pile foundations, but its applications have been expanded to other structures like pavements. The pavements can be either concrete or asphalt, with or without reinforcement.
• To perform an impulse-response test, an operator strikes the surface being tested with an instrumented hammer, generating a stress pulse with a wide range of frequencies. A soft rubber-tipped hammer generates frequencies up to 1000 Hz, and a metal-tipped hammer generates frequencies up to 3000 Hz. The input force is continuously monitored. A geophone (receiver) near the point of impact measures the vibrations of the structure.
Procedures
A plot of the geophone particle velocity divided by the hammer vibration force (v/F), known as mobility, versus frequency is used to assess the condition of the structure. The signals from the hammer and the geophone are sent to a digital oscilloscope and the data is processed in the field using the FFT (Fast Fourier Transform) algorithm.
A test plot can be divided into two portions:
Low frequencies (less than 100 Hz): The initial linear portion of the plot (0 to 50 Hz) yields the slope or the compliance. Its inverse is the dynamic stiffness. This is a property of the structure-soil composite. It can be used to assess the structure on a comparative basis and to establish uniformity.
High frequencies (greater than 100 Hz): When testing piles, this portion of the plot represents their longitudinal resonance and is a function of shaft length and the degree of toe anchorage. The relative amplitude is a function of lateral soil damping. When testing a plate element, the mean mobility (from 100 to 1000 Hz) is related to the density and thickness of the element. Cracking or honeycombing in the element will decrease the stability of the mobility plot from 50 to 1000 Hz, reducing damping of the signal. If delaminations or voids are present, there will be an increase in the ratio of peak mobility to average mobility.
The hammer impact generates only a small amount of energy. Soil damping limits the depth where useful information can be obtained for both piles and pavements. For slabs with a thickness greater than 0.6 m (2 feet), data interpretation becomes difficult. The stiffness of the system is controlled by the pavement and not by the support under the slab. However, even if the high frequency response is not present, the dynamic stiffness can be used to assess the structure.

Bridge Maintenance Course Series Reference Manual
B-46
Figure B.11 Impulse Response Systems (top) and Data (bottom)

Bridge Maintenance Course Series Reference Manual
B-47
B.4.13 Half Cell Testing: Corrosion Potential Measurement
Principles of Half Cell Testing (ASTM C876)
During active corrosion electrons are liberated form iron (anodes), which moves into the
concrete as ferrous ions (Fe2+). This process is called half-cell oxidation, or the anodic reaction,
and is represented as follows:
Fe → Fe2+ + 2e-
The electrons (2e-) move to cathodic sites and combine with water and oxygen present in the
concrete, which is represented as follows:
2H2O + O2 + 4e- → 4OH-
To maintain electrical neutrality, ferrous ions migrate through concrete to cathodic sites where they combine to form hydrated iron oxide, or rust. When the bar is not corroding, there is no flow of electrons or ions.
As ferrous ions move into the surrounding concrete, the electrons left behind in the bar give the bar a negative charge. The half-cell potential method is used to detect this negative charge, and thereby provide an indication of corrosion activity.
During the test, a copper-copper-sulfate (Cu-Cu-SO4) electrode is connected to the steel through a high-impedance voltmeter with negative lead attached to the half-cell. If the bars are corroding, electrons will tend to flow from the bar to the half-cell. These electrons are consumed in a reduction reaction, transforming copper ions in the solution into copper atoms deposited on the copper rod. This process produces a measured voltage at the voltmeter. The more negative the reading, the more electrons flowing from the steel, and the greater the reduction reaction.
The half-cell potential readings are indicative of the probability of corrosion activity, as shown in Figure B.12.
Advantages
• Identification of areas of potential corrosion
• Lightweight, portable equipment
• Inexpensive and quick
Disadvantages
• Requires direct connection to reinforcement
• Electrical continuity of reinforcement in structure is required, hence not applicable to epoxy coated bars
• Concrete needs to be moist
• The following factors can influence the measured potentials: Concrete resistivity, Temperature, Carbonation, Oxygen content, Rebar coatings, and Degree of moisture saturation

Bridge Maintenance Course Series Reference Manual
B-48
Figure B.12 Half-Cell Testing Images and Interpretation

Bridge Maintenance Course Series Reference Manual
B-49
B.4.14 Linear Polarization: Rate of Corrosion
Principles of Linear Polarization (ACI 228.2R98, SHRP S324, S330)
The Linear Polarization Method measures the rate of corrosion in reinforcing steels.
The technique measures the current required to change by a fixed amount the potential difference between the reinforcement and a standard reference electrode. The measured current and voltage allow determination of the polarization resistance, which is related to the rate of corrosion.
For a small perturbation about the open circuit potential, a linear relationship exists between the change in voltage and the change in current per unit area of bar surface. This is the polarization resistance, RP:
RP = ∆E / ∆i
Where ∆E = change in voltage and ∆i = change in current per unit area. There is an established relationship between corrosion rate of the anode and the polarization resistance:
icorr = B / RP
Where icorr = corrosion current density, in units of mA per ft2, B= a constant based on polarization curves (taken as 0.026V for steel in concrete), and RP = Polarization resistance in Ω/ft2.
• If icorr < 0.2 mA/ft2, no corrosion damage is expected
• If 0.2 mA/ft2 < icorr < 10 mA/ft2, corrosion damage is possible with 10 to 15 years
• If icorr > 10 mA/ft2, corrosion damage is expected within 2 to 10 years
Advantages
• Portable and lightweight equipment
• Determines rate of corrosion at the time of testing
Disadvantages
• Requires direct electrical connection to reinforcement and interconnection of reinforcing internally
• Cannot test decks with epoxy coated or galvanized rebar
• Concrete must be uncracked, even, and free of coatings and visible moisture
• Cover depth must be less than 4 in.
• Results can vary widely across a deck
• Requires knowledgeable personnel to interpret the results

Bridge Maintenance Course Series Reference Manual
B-50
Figure B.13 Examples of Linear Polarization Equipment

Bridge Maintenance Course Series Reference Manual
B-51
B.4.15 Concrete Resistivity
Principles of Resistivity (ASTM D3633)
• The rate at which the corrosion reaction can proceed is governed by the amount of oxygen available to the reaction, the alkaline state of the concrete, and the resistivity of the concrete.
• The electrical resistance of concrete, which depends on the microstructure of the paste, moisture content of the concrete and chloride content, affects the ionic current flow between anode and cathode and hence the rate at which corrosion can occur.
• A high concrete resistivity decreases current flow and impedes the corrosion process
• A highly permeable concrete will have a high conductivity and low electrical resistance. Because resistivity is proportional to current flow, the measurement of the electrical resistance of concrete provides a measure of the possible rate of corrosion.
Typical Procedures
The equipment relies on four equally spaced electrodes placed in drilled holes. The outer probes are connected to an alternating current. The inner probes are connected to a voltmeter. The apparent resistivity, ρ, is given by:
ρ = 2πsV / I
Where s = spacing of probes, V = measured voltage between inner electrodes, and I = current between outer electrodes.
Advantages
• In combination with other tests, such as the half-cell test, resistivity measurements may give an indication of corrosion. Concrete with high resistivity may give an indication of corrosion. Concrete with high resistivity, at locations where half-cell results show corrosion, indicates a very slow corrosion rate.
• Resistivity measurements can also be used to assess permeability.
Disadvantages
• There are no generally agreed upon interpretation guidelines. Resistivity equipment suppliers and Bungey (Bungey, J.H. 1989) recommend:
>20 kΩ-cm: Low corrosion rate
10-20 KΩ-cm: Low to moderate corrosion rates
5-10 kΩ-cm: High corrosion rates
<5 kΩ-cm: Very high corrosion rates
• Other researchers (Feliu, S. et al., 1996) and Manning (Manning, D.G. 1985) have recommended alternative guidelines.
• Since carbonation seriously affects surface resistance, measurement on the concrete surface should be avoided.
Bridge Maintenance Course Series Reference Manual
B-52
Figure B.14 Resistivity Schematic and Apparatus

Bridge Maintenance Course Series Reference Manual
B-53
B.4.16 Chloride Testing
Principles
• Laboratory tests to determine chloride content include Acid- Soluble Chloride Determination (ASTM C1152), Water-Soluble Chloride Determination (ASTM C1218) and Sampling and Testing for Chloride Ion in Concrete and Concrete Raw Materials (AASHTO T 260-05).
• Field tests are also available to determine chloride content and utilize a specific ion electrode.
• Chloride sampling should include determination of the chloride profile with depth in the concrete. Chloride samples are collected incrementally from the surface either by taking drillings or sections from cores. The first 0.25 in. is usually discarded as being directly influenced by the immediate environment. For improved statistical accuracy, multiple adjacent drillings are made and the depth increments from each drilling are mixed.
• When powder samples are obtained, drill to depth of 0.5 in. less than desired sample depth. Using a drill bit having 0.25 in. smaller diameter than the initial drill bit, extend hole by 0.5 in. to target depth collecting 10g of powder excavated from hole. Take care not to use contaminated tools, touching side walls, or using hands, which can influence results.
• The chloride extraction methods require that a minimum of 10g of material be obtained and pass through a No. 50 (0.0018 inch) screen. Water or acid is then used to extract chlorides into solution, where they can be measured.
Total (Acid-Soluble) Chloride vs. Water-Soluble Chloride
• Approximately 50% of total chlorides in concrete are tied-up by the cement matrix. Chlorides bound by the matrix are not water soluble, hence acid-soluble test methods are used to provide a better indication of the total chloride content.
• Some aggregates contain chlorides which may become unbound during the pulverization process, and hence are detectable during the water-soluble test.
• Acid soluble testing is more reproducible and less time consuming as compared to the water soluble test method.
• The “threshold” or minimum level of water-soluble chloride contamination in concrete necessary to corrode black bar reinforcing steel is 1.0 to 1.5 lbs. chlorides/yd3, 1 to 2% chloride by weight of cement or 0.02 to 0.03 % chloride by weight of concrete.
• The water-soluble chloride content is about 50% to 80% of the total (acid-soluble) chloride content.
Advantages
• Chloride content results can be used to infer corrosion activity, as well as future corrosion potential if permeability rates are known.
Disadvantages
• Field test methods are not as accurate as laboratory testing, and correction factors are required to calibrate field test methods to laboratory methods.
• Hydroxyls can influence minimum threshold levels for the initiation of corrosion.

Bridge Maintenance Course Series Reference Manual
B-54
• Water soluble test methods do not measure total chloride contents, due to its inability to extract bound chlorides during testing. The detection of bound chlorides, which are freed during aggregate pulverization, can negatively influence test results.
Figure B.15 Chloride Measurement and Example Data

Bridge Maintenance Course Series Reference Manual
B-55
B.4.17 Other Concrete Properties: Permeability & Alkalinity
Permeability
• The permeability of concrete is important in determining the extent to which aggressive substances can attack embedded reinforcement.
• Low permeability concrete generally is of superior strength, and is resistant to water/chloride infiltration. Porous concrete allows water, oxygen, and chlorides to reach rebar, which accelerates corrosion of reinforcing.
• Methods for assessing concrete permeability include Chloride 90-day Ponding Test and Chloride Ion Resistance (Rapid Permeability Test).
• Core samples are removed from the subject structure and returned to the laboratory for testing.
• Permeability testing can be used to measure the relative durability of one concrete verse another, and is generally used during mix design development.
90-Day Ponding Test (AASHTO T-259)
• In this test, water containing a 3 percent sodium chloride solution is ponded on a core sample for a period of 90 days. After 90-days, the concrete is sampled for chloride ion content at various depths.
• Advantage: Test is capable of determining susceptibility of concrete to chloride ion intrusion.
• Disadvantage: Requires a long period to complete the test and analysis.
Rapid Permeability Test (ASTM 1202, AASHTO T-277)
• In this test, an applied voltage (60V for 6 hours) is used to drive a 3 percent sodium chloride solution into the depths of a core sample. The characteristics of the time-current curve give an indication of the permeability of concrete.
• Advantage: Test is capable of determining the susceptibility of concrete to chloride ion intrusion. Total time for testing is approximately one day.
• Disadvantage: Not as accurate as 90-day test.
Figure B.16 Interpretation of Permeability Test Results
Carbonation
• Concrete provides a protective alkaline environment that protects embedded reinforcing from corrosion. This protective environment has a pH of about 12.5.
• Atmospheric gases, CO2, can penetrate concrete and reduce the concrete alkalinity.
• The rate at which concrete carbonates is dependent on concrete quality, depth of rebar, ambient relative humidity, and degree of saturation. Fully saturated and dry concrete

Bridge Maintenance Course Series Reference Manual
B-56
are protected from carbonation, since they provide a barrier to gases or eliminate free water which is needed for the reaction, respectively.
• The depth of carbonation is approximately proportional to the square root of the time exposure.
• Carbonation reduces pH of concrete to 8.5, when fully carbonated.
• Phenolphthalein solution is applied to concrete to detect carbonation. When the surface turns pink, the pH is greater than 10. When the surface remains neutral, the pH has been reduced to less than 10 thereby increasing the likelihood that corrosion will initiate.
Advantages
• Easy and economical test
Disadvantages
• Requires samples of concrete, through core or other means to complete test
Figure B.17 Pink (darker) areas have pH > 10. Neutral areas are carbonated. Note carbonation along cracks, which provide some indication of crack age.

Bridge Maintenance Course Series Reference Manual
B-57
B.4.18 Ultrasonic Testing (UT): Evaluation of Steel Structures
Principles of UT
• Ultrasonic testing (UT) can be used on ferrous and nonferrous materials and often is suited for testing thicker sections accessible from one side only. In general, it can detect finer linear or planar defects than can radiography.
• UT makes use of mechanical vibrations similar to sound waves but of higher frequency. A beam of ultrasonic energy is directed into the object to be tested. This beam travels through the object with insignificant energy loss, except when it is intercepted and reflected by a discontinuity.
• The ultrasonic contact pulse reflection technique is used in UT. This system uses a transducer, which converts electrical energy into voltage that causes a crystal to vibrate mechanically. The crystal probe becomes the source of ultrasonic mechanical vibration. These vibrations are transmitted into the test piece through a coupling fluid, usually a film of oil, called a couplant.
• When the ultrasonic waves pulse strikes a discontinuity in the test piece, it is reflected back to its point of origin. Thus, the energy returns to the transducer. The transducer now serves as a receiver for the reflected energy.
• The initial signal, or main bang; the returned echoes from the discontinuities; and the echo of the rear surface of the test piece all are displayed by a trace on the screen of a cathode-ray oscilloscope. The detection, location, and evaluation of discontinuities become possible because the velocity of sound through a material is nearly constant, making distance measurement possible, and the relative amplitude of a reflected pulse is more or less proportional to the size of the reflector.
• One of the most useful characteristics of UT is its ability to determine the exact position of a discontinuity in a weld. This testing method requires a high level of operator training and competence and depends on establishing and applying suitable testing procedures.
Typical Applications
• Bridge pin inspection
• Penetration welds (plate girder flanges, circumferential welds in pipe, etc.)
• Pipe inspection for corrosion or damage
• Length and thickness measurements
• Plug and slot weld inspection
Advantages
• Nondestructive
• Volumetric
• Absence of hazard
• Versatile
• Single side access is often adequate
• Highly accurate
Disadvantages

Bridge Maintenance Course Series Reference Manual
B-58
• Skill/experience dependent
• Dynamic signal
• Surface condition critical
• Permanent record has limited value
Figure B.18 Schematic of UT and Example Output Data
Figure B.19 UT Inspection of Bridge Hanger Pins (left), Bogie Shaft (middle), Sample CJP Weld (right)

Bridge Maintenance Course Series Reference Manual
B-59
B.4.19 Dye Penetrant Testing
Liquid Penetrant Testing (PT) is a widely used NDE technique. The test material is coated with a visible or fluorescent dye solution. Excess dye is removed from the surface, and then a developer is applied. The developer acts like a blotter and draws penetrant out of imperfections that are open to the surface. With visible dyes, the vivid color contrast between the penetrant and the developer makes the "bleed-out" easy to see. With fluorescent dyes, an ultraviolet lamp is used to make the bleed-out fluorescent, thus allowing the imperfection to be seen readily. Visible and fluorescent liquid penetrant examination reveals surface discontinuities on materials having nonporous qualities. PT consists of portable, economical equipment that can be easily used for inspections. A basic kit consists of a small grinder to remove rust inhibitors, a part cleaner, the dye penetrant, and a developer to facilitate the bleed out of excess dye from a discontinuity. It is fast, simple, and can cover large areas of inspection. Again, this test can only be performed on flaws that are free from debris and open to the surface. This method works well with both ferrous and nonferrous materials.

Bridge Maintenance Course Series Reference Manual
B-60
B.4.20 Magnetic Particle Testing of Welds: Evaluation of Steel Structures
Principles of MT
• Magnetic particle testing (MT) can be used on ferromagnetic materials to detect surface and near-surface linear discontinuities (i.e., cracks). The maximum depth of inspection is approximately 0.1 in.
• MT makes use of permanent or electro magnets for local magnetization of the surface being inspected. The magnets create a magnetic field. The direction of the magnetic field changes when it encounters a discontinuity. The change in magnetic field direction is often called magnetic flux leakage. After magnetizing the object, fine magnetic particles are then applied to the surface being inspected. The particles are attracted to the poles as well as locations of flux leakage resulting in visible indications of the surface of the object being inspected.
• MT equipment for civil engineering structures is generally handheld, runs off of 120 Volts, and can be AC or DC. DC generally provides a stronger magnetic field resulting in the ability to detect near-surface discontinuities. AC generally provides a weaker magnetic field but can produce greater excitation of the fine particles as they are applied to the test surface.
• Magnetic particles vary from 1/8 inch to 60 microns. The particles have high permeability (easily magnetized) and low retentivity (ability to stay magnetized). In other industries, the fine particles are often suspended in oil or paraffin to ensure movement of the particles to the location of flux leakage. However, most civil engineering applications use dry, colored particles.
• Cleaning and/or removal of paint and other debris may be required prior to testing. Cleaning should be performed using mechanical means rather than chemicals, since chemicals may mask some discontinuities.
Typical Applications
• Any welded or bolted connection where cracking is a concern
• Gusset plate inspections in bridges
• Base plate inspection of towers, light poles, signs, and other flexible or dynamically sensitive structures
• Transverse floor beam inspection in bridges
• Longitudinal stiffener plate inspection in bridges
Advantages
• Nondestructive
• Linear discontinuities
• Absence of hazard
• Versatile
• Single side access is often adequate
• Highly accurate
• Quick (excluding surface preparation)
• Requires moderate operator skill

Bridge Maintenance Course Series Reference Manual
B-61
Disadvantages
• Cannot detect subsurface discontinuities
• Magnetic field must intercept the larger dimension of the discontinuity
• Complex geometries can be problematic to inspect
• Skill/ experience dependent
• Surface condition critical
• No permanent record
Figure B.20 Examples of Magnetic Fields
Figure B.21 Magnetic Particle Testing Showing: Magnetic particle yoke and particles in use after primer and paint removal (left); Crack after magnetic particle application (middle);
Numerous cracks at a transverse floor beam (right)

Bridge Maintenance Course Series Reference Manual
B-62
B.5 AWPA Tables
The following tables were developed by the American Wood Preservers’ Association (AWPA). They are used to interpret classification of timber types and timber uses.
Figure B.22 AWPA Classification Table for Lumber
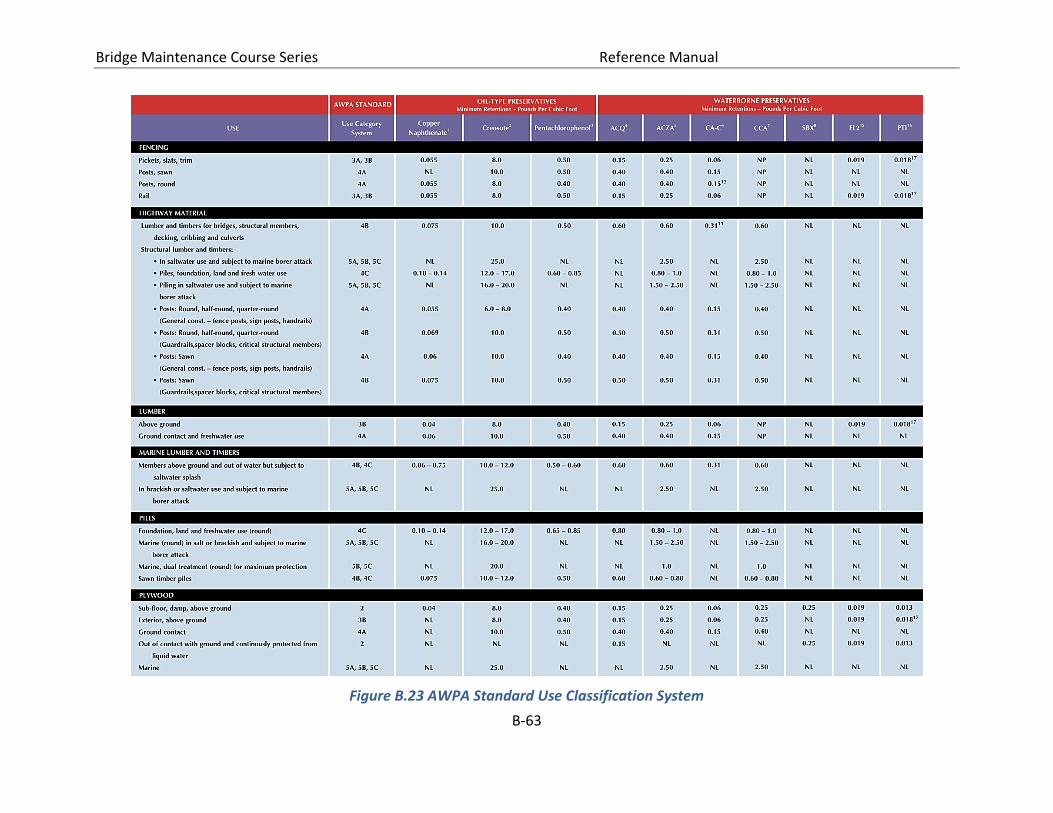
Bridge Maintenance Course Series Reference Manual
B-63
Figure B.23 AWPA Standard Use Classification System