specification Manual... · 1 Table of contents Table of contents Table of contents ...


Table of Contents
Annual Report 2018
2
TABLE OF CONTENTS
TO THE SHAREHOLDERS
7 Letter from the management board
9 Report of the supervisory board
12 Corporate governance statement and report
17 The windeln.de SE share
GROUP MANAGEMENT REPORT
21 Fundamental information about the Group
27 Report on economic position
40 Outlok
41 Opportunities and risk report
45 Internal controls and risk management systems of the Group
financial reporting process
46 Financial risk management and financial instruments
47 Takeover related disclosures
FINANCIAL STATEMENTS
51 Consolidated income statement and other comprehensive
income
52 Consolidated statement of financial position
53 Consolidated statement of cash flows
54 Consolidated statement of changes in equity
55 Notes to the consolidated financial statements
107 Responsibility statement by the management board
108 Independent auditor’s report
SERVICE
113 Glossary
114 Financial calendar 2019
114 Imprint

windeln.de Group at a glance
Annual Report 2018
3
WINDELN.DE GROUP AT A GLANCE
Performance indicators (continuing operations only) 2018 2017 R Change
Site visits 41,362,953 75,807,122 -34,444,169
Mobile visit share (as % of site visits) 72.4% 72.6% -0.2pp
Mobile orders (as % of number of orders) 55.4% 49.8% 5.6pp
Active customers 543,692 859,422 -315,730
Number of orders 1,114,873 1,911,928 -797,055
Average orders per active customer (in number of orders) 2.1 2.2 -0.1
Share of repeat customer orders
(as % of orders of last 12 months) 82.6% 76.6% 6.0pp
Gross order intake (in EUR) 100,858,453 177,554,077 -76,695,624
Average order value (in EUR) 90.47 92.87 -2.40
Returns (as % of gross revenues from orders) 3.6% 3.2% 0.4pp
Adjusted marketing cost ratio (as % of revenues) 4.8% 4.8% -
Adjusted fulfilment cost ratio (as % of revenues) 16.3% 14.9% 1.4pp
Adjusted other SG&A expenses (as % of revenues) 21.6% 17.1% 4.5pp
Earnings position (continuing operations only)
Revenues (in kEUR) 104,818 188,332 -83,814
Gross profit (in kEUR) 25,667 48,126 -22,459
Gross profit (as % of revenues) 24.5% 25.6% -1.1pp
Operating contribution (in kEUR) 3,937 10,975 -7,038
Operating contribution (as % of revenues) 3.8% 5.8% -2.0pp
Adjusted EBIT (in kEUR) -18,530 -21,319 2,789
Adjusted EBIT (as % of revenues) -17.8% -11.3% -6.5pp
Financial position
Cash flow from operating activities (in kEUR) -18,729 -27,963 9,234
Cash flow from investing activities (in kEUR) 1,846 -201 2,047
Cash flow from financing activities (in kEUR) 1,543 3,339 -1,796
Net decrease in cash and cash equivalents -15,340 -24,825 9,485
Cash and cash equivalents at the end of the period (in kEUR) 11,136 26,465 -15,329
Current time deposits (in kEUR) - 2,500 -2,500
Total cash and time deposits (in kEUR) 11,136 28,965 -17,829
Other
Basic earnings per share (in EUR) -1.22 -1.41 0.19
Diluted earnings per shares (in EUR) -1.19 -1.29 0.10
pp = percentage points
All performance indicators and the section earnings position include amounts from continuing operations only. Since end of March 2018,
Feedo Group qualifies as a disposal group and – after its divestiture – was deconsolidated in August 2018. As a result, Feedo Group is presented
as discontinued operation in the consolidated income statement.

Market presence and locations in Europe and China
Annual Report 2018
4
MARKET PRESENCE AND LOCATIONS IN EUROPE AND CHINA
Short profile windeln.de
Since its formation in 2010, windeln.de has developed into one of the leading online retailers of products for babies, toddlers, children and
families with a presence in six European countries. Through its Chinese website and flagship store at TMall Global, the company also operates
a successful e-commerce business with baby, toddler and family products for customers in China.
The broad product range is offered through the German shop windeln.de and the international shops windeln.com.cn, windeln.ch, bebitus.com,
bebitus.fr and bebitus.pt. The assortment ranges from diapers, baby food and drugstore articles to clothing, toys, prams, furniture and security
articles such as car seats for children. Since 2018, the company has also been offering products for older children and parents, i.e. for all family
needs. The range now also includes the categories dietary supplements, cosmetics and partnership.
The customers are key priority at windeln.de. In order to provide them with a good shopping experience, the Group's web shops offer their
customers free shipping from a minimum order value, for example, as well as a variety of community and content offers, such as online
guidebooks, a pregnancy calendar, personal recommendations and competent customer service.
The strategic logistics network consisting of three warehouses in Europe and one in China enables all markets to be served quickly and
efficiently.
windeln.de currently has more than 200 employees in Germany and abroad. Since May 6, 2015 windeln.de is listed in the Prime Standard of
the Frankfurt Stock Exchange.
Shops: www.windeln.de, www.windeln.ch, www.bebitus.es, www.bebitus.pt, www.bebitus.fr and www.windeln.com.cn. windelnde.tmall.hk/

Market presence and locations in Europe and China
Annual Report 2018
5

Annual Report 2018
6
TO THE SHAREHOLDERS

To the shareholders | Letter from the management board
Annual Report 2018
7
LETTER FROM THE MANAGEMENT BOARD
(Dr. Nikolaus Weinberger and Matthias Peuckert)
Ladies and Gentlemen,
Dear Shareholders,
2018 was characterized by change and reorientation. In February 2018, we initiated measures to increase efficiency and profitability, which was
the starting point to reorganize our company in many ways. In our opinion, it was necessary to review the strategy, simplify structures and
significantly reduce costs. In this context, we made significant progress in streamlining our organization and focusing operations on regions
with short and medium-term profitability potential: The local Italian business pannolini.it was closed and the divestiture of the loss-making
Eastern European subsidiary Feedo completed. The number of employees was also reduced, which was not an easy step for us, as layoffs were
also necessary. However, with these measures we were able to significantly reduce selling, general and administrative expenses, which, along
with product margin improvements, is an essential lever to reaching break even.
We have driven forward many projects that focused on improving customer experience. For example, we developed the "Storchenbox" for
expecting and young parents and integrated a pregnancy calendar into our windeln.de app. Through the introduction of new tools in the area
of pricing and shop search, we have not only received positive customer feedback, but also an improved our company’s results.
In Europe, i.e. the DACH region and Bebitus, we focused on extending the customer life cycle by introducing new product categories and
starting to offer products for the whole family, including dietary supplements, cosmetic products and partnership articles. In 2018, an important
part of the restructuring measures was a careful assortment analysis which led to identification and discontinuation of around 15,000 products
with no or only low profitability for the Group. With such assortment analysis, optimized assortment listing rules were introduced at the
European level to ensure continued positive development of the Group's profitability. We also reorganized the organizational setup in Europe
and hired some valuable additions to our teams, contributing longstanding experience with leading global e-commerce companies. Their main
responsibilities include managing the respective country shops.
In China, we faced several challenges in 2018. On the one hand, temporarily tightened border controls in May and June led to delivery delays
for Chinese customers and therefore to cancellations and refunds. Product prices were also under pressure as the market was affected by
product oversupply in the first quarter. In addition, our Chinese customers held back on large orders as product relaunches from the largest
milk powder suppliers were announced for the second half of the year. As a result, revenues in China were significantly lower than in the
previous year. In November, due to the lack of revenues and contribution margin from China, we had to postpone our break even target based
on adjusted EBIT from early 2019 to early 2020.
We have a positive outlook for 2019. We want to increase our revenues clearly and also in a sustainable and profitable manner. We will further
personalize our offerings in Europe and accelerate important processes. In China, we will expand our activities to include other important
distribution channels and expand our product range with additional attractive German brands in the coming months. This will also happen by
cooperating with carefully selected partners who want to use our infrastructure in and to China.

To the shareholders | Letter from the management board
Annual Report 2018
8
We are fully committed aiming to the sustainable success of the company. We would like to thank our shareholders, business partners and
customers for their trust in our company, their loyalty and their good cooperation. We would be delighted if you would continue to accompany
us in 2019.
Last but not least, we would like to express our appreciation to our employees for the achievements of the past year. We would like to thank
them sincerely for their extraordinary commitment. We are proud of our colleagues who, despite extensive changes, support us, believe in the
vision of our company together with us and work every day to realize it.
Munich, March 2019
Matthias Peuckert Dr. Nikolaus Weinberger

To the shareholders | Report of the supervisory board
Annual Report 2018
9
REPORT OF THE SUPERVISORY BOARD
Dear Shareholders,
In the financial year 2018, the supervisory board carried out its duties – as prescribed by law, by the articles of incorporation and by the rules
of procedure and by the German Corporate Governance Code – actively and with great care, regularly advised the management board on
managing the Company and continuously monitored the conduct of business of the Company.
Working with the management board
The supervisory board obtained regular and in-depth reports on the intended business policy, fundamental issues surrounding the financial,
investment and personnel planning, the development of business as well as the profitability and liquidity of the Company. The corresponding
financial key performance indicators were particularly monitored and controlled closely. In case actual business developments deviated from
plans and targets, reasons were explained in detail to the supervisory board and documents were presented which were examined by the
supervisory board. In addition, the management board discussed the Group’s strategic focus with the supervisory board. The supervisory board
was directly involved in all decisions of fundamental importance. Transactions requiring the approval of the supervisory board were explained
by and discussed with the management board before any resolution was passed. These discussions took place at the meetings of the plenum
and its committees as well as in exchange with the management board outside of meetings. The supervisory board was consulted directly and
in due time on all decisions of fundamental importance to the Group. Outside of meetings, the chairperson of the supervisory board was in
regular contact with the management board. Additional audit measures, such as the consultation of documents or the commissioning of
certain subject experts, were not necessary.
Main topics of discussion
A total of 19 supervisory board meetings took place in the financial year 2018, in the months of January, February, March, April, May, June,
July, August, September, October, November and December. Each meeting was attended by all supervisory board members (with the exception
of one appointment in January, March, June, July, August and December, in which one member was not available, as well as one appointment
in April and June, in which two members were not available); six of those meetings were attended in person and 13 of those meetings were
held in conference calls. In addition, nine resolutions were approved by way of circular resolutions.
In a conference call in early January 2018, the Supervisory Board dealt above all with initiatives proposed by the management board relating
to the reduction of costs, alternative scenarios to this proposal and financing options. In a further conference call in mid of January 2018, the
supervisory board dealt – in detail – with restructuring and financing of the company which were further refined by the management board.
In a conference call early February 2018, the supervisory board approved the capital increase using authorized capital, the closure of the Italian
webshop, the beginning of the divestiture process of the Feedo Group and further measures to reduce costs of the company.
At the meeting in March 2018, the supervisory board approved the separate and consolidated financial statements and the respective
management reports for the financial year 2017. The auditor, elected at the annual general meeting, Ernst & Young GmbH
Wirtschaftsprüfungsgesellschaft, Munich, who attended the meeting as well, reported about the results of its audit in detail. Furthermore, the
management board presented the plans for the financial year 2018 and reported the status of cost-cutting and efficiency initiatives. In addition,
the supervisory board approved the appointment of Matthias Peuckert as chair of the management board as of May 1, 2018 and agreed to
the withdrawal of the founders Alexander Brand and Konstantin Urban as of March 31, 2018.
In a conference call in April 2018, the management board informed the supervisory board about the status of the divestiture process of the
Feedo Group. In a further meeting in April 2018, the supervisory board dealt with the financial results of Q1 2018, the development of the
China business, the progress of restructuring and the agenda of the Annual General Meeting 2018.
In a conference call early June 2018, the supervisory board dealt with the progress of the divestiture of the Feedo Group. In further conference
call in June 2018, the supervisory board addressed the financial position of the company and financing options as well as the divestiture of the
Feedo Group. In a meeting at the end of June 2018 following the Annual General Meeting of the company, the newly elected supervisory
board was constituted and elected the chairman and the deputy chairman.
At the beginning of July 2018, the supervisory board dealt with the status of the divestiture of the Feedo Group in a conference call. In a further
conference call in the mid of July 2018, the supervisory board also dealt with and approved the divestiture of the Feedo Group. In a futher
conference call at the end of July 2018, the supervisory board intensively dealt with the development of the business and the financial position
of the company.
In a conference call early August 2018, the supervisory board addressed strategic and financing options, a risk analysis related to the plan for
further business performance and the half year report 2018.

To the shareholders | Report of the supervisory board
Annual Report 2018
10
In a conference call in September 2018, the supervisory board discussed the current business and financial position of the company. In a
meeting at the end of September 2018, the supervisory board intensively dealt with initiatives to increase revenues of the company and with
the development of the share price of the company.
In a conference call in October 2018, the supervisory board dealt with the current business performance, further measures of cost reduction
and financing options.
In a meeting at the beginning of November 2018, the supervisory board intensively dealt with the financial position of the company, measures
to improve the financial position and several financing options. In a conference call in the mid of November 2018, the supervisory board dealt
with available financing options and their potential implementation.
In a meeting in December 2018, the supervisory board addressed the planned Extraordinary General Meeting, the planned capital increase,
the planning for business year 2019 and a possible program for key employee participation and retention.
Supervisory Board committees and their work
In order to carry out its tasks efficiently, the supervisory board set up an audit committee and a nomination committee.
During the financial year 2018, the audit committee consisted of Dr. Lange as committee chairman, Dr. Braun as deputy committee chairman
and Mr. Schwerdtle. In the reporting year, the audit committee had seven meetings. The chairman of the audit committee also discussed audit-
related topics with the auditor outside of meetings and without the attendance of the management board.
The focus of the meeting in March 2018 was the discussion of the consolidated and separate financial statements of the Group respectively
the Company, the recommendation of the approval of the annual financial statements and the proposal for the election of Ernst & Young
GmbH Wirtschaftsprüfungsgesellschaft, Munich, as auditor and Group auditor of financial year 2018. Furthermore, the ongoing business
development, the risk management report and the result of the audit performed by the German Financial Reporting Enforcement Panel
(Deutsche Prüfstelle für Rechnungslegung (DPR)) were discussed.
At the meeting in May 2018, the focus was on the financials of Q1 2018, the annual audit of Feedo and the planned liquidation of the companies
windeln.ch AG and pannolini.it srl.
In a constituting meeting in June 2018 following the Annual General Meeting 2018, the committee elected the chairman and the deputy
chairman.
In a meeting in July 2018, the committee discussed the financial and liquidity position and the resulting obligations for the management and
supervisory board as well as priority areas of the company in the upcoming months.
In September 2018, the committee discussed several accounting topics and the progress of risk reducing measures identified in the risk
management report.
In a meeting in mid of November 2018, the financials of Q3 2018 were discussed. In addition, further financing of the company and a possible
change of the auditor for the business year 2019 and thereafter were discussed. In a further meeting at the end of November 2019, the audit
of the financial statements 2018, the status of the preparations of the capital decrease and increase as well as the liquidity plan were discussed.
After each audit committee meeting, the chairman of the audit committee briefed the full supervisory board in detail about the topics of
deliberation and the conclusions of the audit committee meetings.
Until the Annual General Meeting 2018, the nomination committee consisted of Mr. Schwerdtle, Dr. Braun as his deputy and Dr. Lange. After
the Annual General Meeting 2018, the nomination committee consisted of Dr. Braun (chairman), Mr. Schwerdtle (deputy chairman) and Mr.
Jakopitsch. The nomination committee met four times in the reporting year 2018.
At the first meeting of the year, in March 2018, the nomination committee addressed the bonuses of the management board for 2017, a
possible adjustment of the LTIP program due to a changed company strategy and a proposal to grant share options and RSUs in LTIP. In
addition, the committee addressed the development of employee numbers and the coming election of members of the supervisory board at
the Annual General Meeting 2018. In a further meeting in March 2018, the committee dealt with the proposal of the committee to the
supervisory board regarding the coming election of members of the supervisory board.
In a constituting meeting in June 2018 following the Annual General Meeting 2018, the nomination committee dealt with the termination
agreement with member of the management board Jürgen Vedie.

To the shareholders | Report of the supervisory board
Annual Report 2018
11
Corporate Governance
The supervisory and management boards act in awareness that good corporate governance is in line with the interest of the shareholders and
capital markets constitutes an important basis for the success of the Group.
In June 2018, the supervisory and management boards issued a joint declaration of conformity regarding the recommendations of the
Government Commission pursuant to Sec. 161 German Stock Corporation Act (AktG) and made it permanently available on the website of the
Group (www.corporate.windeln.de). The implementation of the German Corporate Governance Code is reported separately in this Annual
Report.
In the reporting year, there were no conflicts of interest involving management or supervisory board members that would require immediate
disclosure to the supervisory board and disclosure to the annual general meeting.
Audit of the separate and consolidated financial statements
During the meetings of the audit committee and the supervisory board on March 15, 2019, the annual financial statements and audit reports,
in particular the separate annual financial statement of windeln.de SE pursuant to German statutory regulations for financial year 2018 as well
as the consolidated annual financial statement of the Group pursuant to International Financial Reporting Standards (IFRS) for fiscal year 2018
as well as the respective management reports for financial year 2018 were discussed in detail. The auditor’s reports, windeln.de SE’s annual
financial statements for the financial year 2018, the Group’s annual financial statements for the financial year 2018 and the respective
management reports, in each case in the version as prepared by the management board, had been submitted to the audit committee and the
supervisory board in due time and were duly examined by both. The auditor, Ernst & Young GmbH Wirtschaftsprüfungsgesellschaft, Munich,
had audited the annual financial statements together with the bookkeeping system. There are no concerns about the independency of the
auditor. The auditor has concluded that the separate financial statements of windeln.de SE and the consolidated financial statements of Group
in accordance with the accounting rules and regulations present a true and fair view of the net assets, financial position, results of operations,
and cash-flows of windeln.de SE and the Group. The auditor has issued the final conclusions of the audits with unqualified opinions. As part
of assessing the risk management system, the auditor also concluded that the management board has taken the steps required by Sec. 91 (2)
AktG to identify, at an early stage, developments jeopardizing the continuation of the Group. When the audit committee and supervisory
board deliberated the separate and consolidated financial statements, representatives of the auditor were present who reported on the
significant findings of the audit and were available to take the supervisory board’s questions.
Based on the final conclusions of the audit committee’s examination and based on the supervisory board’s own examination, the supervisory
board concurred with the auditor’s final conclusions and determined that no objections are to be raised. The supervisory board approved the
separate and consolidated financial statements and the respective management report for the financial year 2018 by means of a circular
resolution on March 15, 2019. The financial statements of windeln.de SE are thus ratified.
Changes in the management and supervisory board
The composition of the management board changed in the financial year 2018 as follows: As of March 31, 2018, the members of the
management board Mr. Alexander Brand and Mr. Konstantin Urban retired from the management board of the company. As of May 1, 2018,
Mr. Matthias Peuckert was appointed as a member and the chairman of the management board. Finally, Mr. Jürgen Vedie retired from the
management Board as of September 30, 2018
The composition of the supervisory board of the Company changed in the financial year 2018 as the term of all the members of the supervisory
board expired with the termination of the Annual General Meeting on June 25, 2018. Mrs. Petra Schäfer and Mr. Nenad Marovac did not stand
for election again; Mrs. Hanna Eisinger and Mr. Clemens Jakopitsch were newly elected to the supervisory board.
On behalf of the supervisory board, I would like to sincerely thank the management board and all the employees of the windeln.de Group for
their immense personal dedication and their contribution to the financial year 2018.
Munich, March 2019
On behalf of the supervisory board
Willi Schwerdtle, chairman of the supervisory board

To the shareholders | Corporate governance statement and report
Annual Report 2018
12
COPRORATE GOVERNANCE STATEMENT AND REPORT
windeln.de is convinced that good and transparent corporate governance that meets national and international standards is a key factor in
the Company’s long-term success. Corporate governance is therefore part of windeln.de’s philosophy and a requirement for all operating
segments. The management board and supervisory board consider themselves obliged to using a responsible and long-term corporate
governance system in order to safeguard the existence of the Company and provide sustainable added value. In this report, the management
board reports –at the same time for the supervisory board – on the management of the Company pursuant to no. 3.10 of the German Corporate
Governance Code (GCGC) as well as pursuant to Secs. 289a, 315 (5) German Commercial Code (HGB).
1. Declaration by the management board and supervisory board of on the “Government
Commission German Corporate Governance Code” pursuant to Sec. 161 German Stock
Corporation Act (AktG)
windeln.de aims to confirm the trust placed in it by investors, financial markets, business partners, employees and the public and enhance
corporate governance in the Group. The management board and supervisory board focused extensively on meeting the requirements of the
German Corporate Governance Code (GCGC) in financial year 2018. The following declaration of conformity was issued in March 2019:
The last declaration of conformity pursuant to section 161 AktG regarding the recommendations of the “Government Commission German
Corporate Governance Code” (hereinafter the “Code”) was made in June 2018. The following declaration is based on the Code in its version of
February 7, 2017 as published in the official section of the Federal Gazette (Bundesanzeiger) on April 27, 2017.
The management board and the supervisory board of windeln.de SE declare that windeln.de SE has, since the publication of the last annual
declaration of conformity in June 2018, acted in conformity with the recommendations of the “Government Commission German Corporate
Governance Code” and here after will act in conformity with it, in each case with the following exceptions:
• Nos. 4.2.4 and 4.2.5: According to the Code’s recommendations, the compensation of the members of the management board shall be
disclosed by name, divided into fixed and variable components as well as fringe benefits. These recommendations are not complied with
because the shareholders’ meeting of the Company held on April 21, 2015 resolved that the compensation of the members of the
management board shall not be disclosed by name in the annual consolidated financial statements of the Company to be prepared for
the fiscal years 2015 up to (and including) 2019 in accordance with Sections 286 para. 5, 314 para. 2 sentence 2, 315a para. 1 of the
German Commercial Code (Handelsgesetzbuch - HGB). For the duration of this ‘‘opt-out’’ resolution, the Company will abstain from
including the disclosures recommended under No. 4.2.5 para. 3 of the Code in the Company’s compensation report.
• No. 5.4.6 para. 3: According to the Codes recommendation, the remuneration of supervisory board members as well as possible
remuneration for services rendered personally by supervisory board members shall be disclosed individually in the notes to the financial
statements or the management report, classified by remuneration components. This was and is not complied with. The remuneration of
the supervisory board resolved upon by the General Meeting and the expenditure for the fiscal year are disclosed in the compensation
report as part of the consolidated annual report aggregated and not separately on an individual basis and not classified by remuneration
components. The management board as well as the supervisory board think that the information provided fulfil the legal requirements
and convey a sufficiently detailed picture.
Pursuant to Sec. 161 (2) German Stock Corporation Act (AktG), the declaration of conformity is permanently available to shareholders and all
other interested parties under the section Corporate Governance on the Company’s website.
2. Disclosures on coprorate governance practice
The efficient structures and processes in the windeln.de Group guarantee responsible management that is geared towards adding sustainable
added value and is focused on shareholder rights. Openness and transparency are always the top priorities in corporate communication. This
is a key requirement in maintaining and increasing the trust placed in windeln.de by our investors, our employees and the public. As windeln.de
SE is a European online company with registered office in Munich, the German stock corporation, co-determination and capital market law,
the articles of incorporation and bylaws and the corporate governance code implemented to meet the individual needs of the Company are
the foundations for establishing the management and monitoring structure in the Group. These principles are also applied in the remaining
group companies in addition to applicable local regulations.
The social and ethical responsibility of the windeln.de Group is defined – amongst others - in the code of conduct, which applies to all
employees of the Group. windeln.de has established a risk management system – applied in the parent company of the Group as well as in
the remaining Group companies - to identify, control and monitor risks and opportunities at an early stage. The continuous improvement of
the instruments used in the risk management system aims to ensure that risks and opportunities (including potential compliance risks) are
identified and managed in a uniform way throughout the Group. All employees of the windeln.de Group are obliged to act risk-aware and
To the shareholders | Corporate governance statement and report
Annual Report 2018
13
avoid any risks that could endanger the ability of the Company to continue as a going concern. In addition, communication lines – with the
option of anonymity – are in place to report any assumed breaches of compliance. The management board is responsible overall for the
functioning of the risk management system at windeln.de SE and the Group, while the supervisory board is responsible for monitoring its
effectiveness.
The declaration including disclosures on corporate governance practices is available on the Company’s website (https://corporate.windeln.de).
3. Working practices of the management board and supervisory board
The management structure of windeln.de is primarily determined by the corporate law requirements environment. In addition, windeln.de SE
as a European stock corporation, is subject to the special European SE regulations as well as the German SE implementation act. Choosing the
dual management and control structure (management board and supervisory board), key elements of German corporations are also applicable
to windeln.de SE. The management board is responsible for managing the Company at its own responsibility. The supervisory board advises
the management board and monitors its management activities.
The management board and supervisory board work closely together in the interests of the Company. Their mutual aim is to sustainably
increase its corporate value. The management board regularly reports to the supervisory board in a timely manner and in detail on issues of
relevance for the Company concerning strategy, planning, the development of business, the risk position, risk management and compliance.
Deviations from objectives and planning are explained to the supervisory board and its committees. The Group’s strategic focus and direction
is also coordinated and discussed with the supervisory board.
The management board of windeln.de SE
As of December 31, 2018, the management board of windeln.de SE consisted of two management board members (thereof one chairman)
They each have their own management board function, which comprise the individual executive portfolios.
The windeln.de Group is managed by the management board of the parent company, windeln.de SE. All management functions are bundled
here. One of the main tasks of the management board is to define the Company’s strategy, responsibilities and risk management. The
management board is also responsible for preparing the separate, consolidated and interim financial statements as well as for establishing
and monitoring a risk management system.
All members of the management board hold joint responsibility for the management of the Company and keep each other informed of any
significant event and transaction. The management board’s rules of procedure govern the allocation of duties among the management board
members as well as the resolution procedure. Specifically, the catalogue of information and disclosure requirements are defined as well as the
matters that require the approval of the supervisory board.
The supervisory board of windeln.de SE
As of December 31, 2018, the supervisory board was made up of the following six members, all of whom were elected by the general meeting:
Mr. Willi Schwerdtle (chairman), Dr. Christoph Braun (deputy chairman), Dr. Edgar Carlos Lange, Mr. Tomasz Czechowicz, Mrs. Hanna Eisinger
and Mr. Clemens Jakopitsch. At the annual general meeting on June 25, 2018, Mrs. Hanna Eisinger and Mr. Clemens Jakopitsch were elected
as successors of Mrs. Petra Schäfer and Mr. Nenad Marovac. Mrs. Schäfer and Mr. Marovac did not participate in the elections at their own
request. The supervisory board as a whole has excellent knowledge of the e-commerce business. The supervisory board considers all members
of the supervisory board to be independent according to No. 5.4.2sentence 2 of the code.
All supervisory board members have the same terms of office that end with the 2021 annual general meeting.
The supervisory board monitors and advises the management board on the conduct of its business. It reviews the financial statements, the
management report and the proposal for the appropriation of net retained profit as well as the consolidated financial statements and group
management report. Taking into account the audit reports of the auditors of the financial statements, it ratifies the financial statements of
windeln.de SE and approves the consolidated financial statements as well as the management reports. The supervisory board is also responsible
for appointing the members of the management board and preparing and concluding contracts of employment with members of the
management board. The supervisory board discusses the development of business and planning with the management board, as well as the
corporate strategy and its implementation, at regular intervals. In the context of the strategic evaluation of the Company, the risk management
and the reporting system, the management board communicates with the entire supervisory board, and not just with the chair of the
supervisory board, as this would be less efficient.
The supervisory board has set its own rules of procedure. These define the tasks, obligations and internal order of the supervisory board and
also include more detailed regulations on the duty of confidentiality, on dealing with conflicts of interest as well as the formation and work of
the committees. The supervisory board holds at least two meetings per six-month period. Resolutions of the supervisory board may also be
passed outside meetings, specifically in writing, by fax or by e-mail.

To the shareholders | Corporate governance statement and report
Annual Report 2018
14
In order for the supervisory board to be able to perform its tasks in an optimal way, the supervisory board’s rules of procedure provide for two
standing committees. The work of the committees is regularly reported to the supervisory board.
The main task of the audit committee is to support the supervisory board in meeting its control obligation in terms of the correctness of the
separate and consolidated financial statements, the work of the auditor as well as the internal control functions, especially risk management.
The audit committee included Dr. Lange (committee chairman), Dr. Braun (deputy committee chairman) and Mr. Schwerdtle in the reporting
year. In his role as financial expert, the chairman of the audit committee holding the position in the reporting period, Dr. Lange, meets the
requirements in terms of his independence and knowledge of the areas of financial reporting and auditing.
The nomination committee prepares suggestions for the nomination of supervisory board members to be presented to the general meeting;
it also examines the remuneration structure of the management board and other management positions at windeln.de in accordance with the
mandate given by the supervisory board. Until the Annual General Meeting on June 25, 2018, the nomination committee was made up of Dr.
Braun (committee chairman), Mr. Schwerdtle (deputy committee chairman) and Mr. Lange. Afterwards, the nomination committee was made
up of Dr. Braun (committee chairman), Mr. Schwerdtle (deputy committee chairman) and Mr. Clemens Jakopitsch.
Committees of the supervisory board as of December 31, 2018
Audit committee: Dr. Edgar Carlos Lange (committee chairman)
Dr. Christoph Braun (deputy committee chairman)
Mr. Willi Schwerdtle
Nomination committee: Dr. Christoph Braun (committee chairman)
Mr. Willi Schwerdtle (deputy committee chairman)
Mr. Clemens Jakopitsch
Considering the German Corporate Governance Code, the supervisory board set targets relating to its composition. The supervisory board
aims at a composition which considers the special needs of the Company and ensures that the management board is supervised, monitored
and advised in a competent and qualified manner. The nominees proposed for election to the supervisory board should – on basis of their
knowledge, skills and professional experience – be able to carry out the tasks entrusted to them properly. In addition, every member ensures
available time sufficient to fulfil their duties. The supervisory board set the following material objective targets: The members of the supervisory
board may not assume mandates in boards of or advising activities to competitors of the Company; considering the international focus of the
Company, it shall be made sure that four board members have extensive international experience; the supervisory board shall especially ensure
diversity when proposing new members; the supervisory board shall comprise at least one female member; the supervisory board shall consist
of at least three independent members; members of the supervisory board shall generally not serve on the board for more than 12 consecutive
years; not more than two former members of the management board of windeln.de SE shall be members of the supervisory board; candidates
for the supervisory board should generally not be older than 72 years at the time of their election by the general meeting; the most important
criterion for the appointment to the supervisory point is the qualification of the nominee. These targets relating to the composition of the
supervisory board are fully achieved.
Regulations in accordance with Sec. 76 (4) and Sec. 115 (5) AktG
The “law on gender equality in managerial positions in the private and public sector” dated April 24, 2015 and which came into effect as of
May 1, 2015 requires windeln.de SE to define targets for the female representation quota in the supervisory board and management board
and in the two management levels below the management board. The targets are defined by the supervisory board for the supervisory board
and management board, and by the management board for the two management levels below the management board.
In 2017, the supervisory board (relating to the composition of the supervisory board and management board in accordance with Sec. 111 (5)
AktG) and the management board (relating to the composition of the other management levels in accordance with Sec. 76 (4) AktG) set new
targets for the quota for female representation in the respective boards, committees and management levels with an implementation deadline
by June 30, 2022:
Level Quota
Supervisory board 20%
Management board 20%
First management level 30%
Second management level 30%
The Company is also aiming for women to join the management board in the medium term.

To the shareholders | Corporate governance statement and report
Annual Report 2018
15
4. Additional disclosures on corporate governance
Shareholders and general meeting
Shareholders may exercise their rights at the general meeting and exercise their voting rights there. Each share carries one vote. There are no
shares with multiple voting rights or preferential voting rights or maximum voting rights. The annual general meeting, where the management
board and supervisory board give account on the past financial year, is held once a year. The shareholders have the opportunity to exercise
their voting rights at the general meeting in person or by a proxy of their choice or by a proxy appointed by the Company who is bound to
follow instructions.
The management board presents the separate and consolidated financial statements to the general meeting. The general meeting decides on
the appropriation of any net retained profit and resolves on the exoneration of the management board and supervisory board as well as the
election of the auditors. Where necessary, the general meeting resolves on amendments to the Company’s articles of incorporation and bylaws,
elects the members of the supervisory board and resolves on other items in the agenda requiring resolutions.
Systematic risk management
Thanks to its established internal control system, the Company is able to recognize any business and financial risks at an early stage in order
to be able to take corresponding countermeasures. This control system is designed in such a way that risks can be promptly monitored and it
can be ensured that all business transactions are correctly accounted for; this system is also designed in such a manner that there is always
reliable data on the financial situation of the Company.
Transparency
Shareholders, financial analysts, shareholders’ associations, the media and the interested public are given regular timely updates on the
situation of the Company as well as on significant changes to the business. This guarantees the greatest possible level of transparency. The
objective is to further expand the trust placed by investors in the value potential of windeln.de SE. Relevant events are disclosed on an ongoing,
timely and reliable basis. Insider information that directly affects the Company is published without delay by the Company in accordance with
the statutory requirements. Discussions are held regularly with private and institutional investors at the general meeting and capital market
events such as roadshows and conferences. In line with the principle of fair disclosure, all shareholders and key target groups are treated the
same in terms of information relevant for valuation. Information on significant new circumstances are made available to the broader public
without delay.
The Company’s website, http://corporate.windeln.de, serves as a central platform for publishing current information about the Company.
Financial reports, presentations from analysts and investor conferences as well as press releases and ad hoc announcements about the
Company are also available there. Dates of key annual publications and events (for example, annual report, interim reports, general meeting,
etc.) are released with sufficient notice. Notifications of securities transactions that must be reported by members of the management board
and supervisory board of windeln.de SE as well as by related parties (directors’ dealings) can also be found on the website
http://corporate.windeln.de, which are published immediately after the corresponding notification is received. The same applies for voting
rights announcements submitted in accordance with Sec. 21 et seq. WpHG.
Financial reporting and annual audit
Financial reporting is performed at group level in accordance with the International Financial Reporting Standards (IFRS) and the separate
financial statements in accordance with local GAAP (HGB). Reporting follows the statutory and stock exchange obligations with the separate
and consolidated financial statements as well as an interim report for the first half of the year and quarterly statements for the first and third
quarter of the year. The annual report and internet presence are – in line with international standards – also available in English; the annual
report and interim reports can be found on the Company website http://corporate.windeln.de. The consolidated financial statements are
prepared by the management board and audited by the auditor as well as the supervisory board. The auditor was Ernst & Young GmbH
Wirtschaftsprüfungsgesellschaft, appointed by the Annual General Meeting on June 25, 2018. The auditor issued a declaration of independence
to prove to the supervisory board its independence. The auditor took part in the both the meetings of the audit committee and the supervisory
board on March 15, 2019 to discuss the 2018 separate and consolidated financial statements; in particular, the auditor reported to the audit
committee and supervisory board the results of the audit of the separate financial statements and management report of windeln.de SE as of
December 31, 2018 (HGB) as well as the consolidated financial statements and group management report of windeln.de SE as of December 31,
2018 (IFRS). It was agreed with the auditor of windeln.de SE that the chair of the supervisory board would be informed without delay of any
reasons for disqualification or any factors affecting impartiality if they arise during the audit, unless they are remedied immediately.
Relationships to shareholders that qualify as related parties as defined by the underlying accounting provisions are explained in the
consolidated financial statements.
Remuneration of the management board and the supervisory board
The basics of remuneration of members of the management board and supervisory board are explained in detail in the remuneration report.
The remuneration of members of the management board is presented according to the statutory requirements, especially broken down into
non-performance-based (fixed salaries and fringe benefits) and performance-based components (variable annual bonus) as well as

To the shareholders | Corporate governance statement and report
Annual Report 2018
16
components with long-term incentives. The remuneration of the supervisory board was defined by the general meeting and is also presented
in the remuneration report. The remuneration report is part of the notes to the consolidated financial statements and is published in the annual
financial report.
Stock option plans and securities based incentive systems
A remuneration structure was introduced for selected senior management employees for the first time in financial year 2011, which includes
a long-term, performance-based variable remuneration component in the form of virtual stock options that were converted into physical stock
options during the IPO. In addition, a long-term, performance-based variable remuneration component based on the long-term incentive
program (“LTIP”) of windeln.de SE was launched in financial year 2015. The performance-based variable remuneration component was
extended in 2017 and adjusted to the amended strategy of the company in 2018. The details of this can be found in the notes to the
consolidated financial statements of the windeln.de SE Group.
Directors‘ Dealings and shareholdings of members of the management board and supervisory board
Art. 19 of the market abuse regulation (“Marktmissbrauchsverordnung”; “MAR”) requires key management personnel at windeln.de SE as well
as closely related parties to announce any transactions with shares in windeln.de SE or related financial instruments within three business days.
In 2018, following transactions were reported to windeln.de SE:
Company / Person
Financial
instrument
Transaction
type
Price
(in EUR)
Volume
(in EUR) Date
Gut Vermögensverwaltungs
GmbH / Konstantin Urban
Share
DE000WNDL1J7 Purchase 1.98 49,998.96 February 6, 2018
Dr. Nikolaus Weinberger Share
DE000WNDL1J7 Purchase 1.98 33,333.30
February 6, 2018
ABrand Management GmbH /
Alexander Brand
Share
DE000WNDL1J7 Purchase 1.98 9,999.00
February 6, 2018
Jürgen Vedie Share
DE000WNDL1J7 Purchase 1.98 33,333.30
February 6, 2018

To the shareholders | The windeln.de SE share
Annual Report 2018
17
THE WINDLEN.DE SE SHARE
Capital market environment
After the outstanding year of 2017, the international stock markets continued their rally in the new year for some time and ensured a successful
stock market launch. Worries about interest rates brought an abrupt end to the record rally in February and led to a wave of profit-taking. A
brief recovery phase on the financial markets was slowed throughout the year by negative issues. The focus was repeatedly on the ongoing
trade dispute between the USA and China, followed by political issues such as the Syrian crisis, the elections in Italy and the government crisis
in Spain. Here, too, the debate on asylum policy temporarily dampened the interest to buy. Comments by ECB President Mario Draghi that
growth in Europe may have seen its peak weighed on the euro. The economic data showed a mixed picture overall, but became increasingly
cloudy towards the end of the year.
The downward trend accelerated again towards the end of the year. The continuing tightening of the monetary policy of the major central
banks, the worldwide clouding of sentiment indicators and the quarterly reports of companies with cautious outlooks, worried investors. In
addition, the budget dispute between the EU and Italy and the unresolved Brexit issue weighed on the mood of the stock markets. Growing
economic sceptic of many market participants, as well as statements by central banks, had recently led to doubts being expressed about the
interest rate signals from the Fed and the ECB for 2019. The balance of the major indices for 2018 was also sobering. The SDAX came last with
a loss of 20%, closely followed by the DAX with a minus of 18.26% and the MDAX with a minus of 17.61%. Technology stocks did not survive
their rally until the end of the year and finally had to bow to the bad mood on the stock markets. The balance sheet of the TecDAX was also
disappointing with a minus of 3.12% over the year.
Especially small and medium-sized companies are suffering more from an economic downturn than large, more diversified companies.
The windeln.de share
The share of windeln.de SE has been traded on Frankfurt Stock Exchange in the Prime Standard since May 6, 2015. On the first trading day of
the of the past financial year, the closing price was EUR 1.92 (figures based on XETRA). The year high was reached at EUR 2.70 in the first
quarter on January 11, 2018. The lowest price was observed December 18, 2018 at a price of EUR 0.15. Towards the last trading day of the year
the price closed at EUR 0.17 on December 28, 2018.
Basis data (as of December 31, 2018)
WKN WNDL11
ISIN DE000WNDL110
Stock exchange abbreviation WDL-DE
Industry E-Commerce
Trading segment Regulated Market (Prime Standard)
Designated Sponsor Pareto Securities
Initial listing May 6, 2015
Type of share No-par value bearer shares
Number of shares as of January 1, 2018 28,472,420
Number of shares as of December 31, 2018 31,136,470
Share price as of January 2, 2018* EUR 1.92
High for the period on January 11, 2018 EUR 2.70
Low for the period on December 18, 2018 EUR 0.15
Share price as of December 28, 2018* EUR 0.17
* XETRA-Closing price
Research Analysts
Institute Analyst
Montega AG Frank Laser

To the shareholders | The windeln.de SE share
Annual Report 2018
18
Capital measures and market capitalization
The number of windeln.de SE shares at the beginning of 2017 was 28,472,420.
On February 10, 2018 a capital increase was registered, which increased the share capital of windeln.de SE by EUR 2,628,323.00 to a total of
EUR 31,100,743.00. The shares were placed at a price of EUR 1.98, so that the Company received gross proceeds of approximately
EUR 5,204,080 from the issue. This capital measure is attributable to a capital increase with the exclusion of subscription rights from the
authorized capital.
With the entry in the commercial register on June 28, 2018 the share capital of windeln.de SE was increased by a further EUR 35,727.00 to a
total of EUR 31,136,470.00. This capital measure is due to a capital increase with exclusion of the subscription rights from the authorized capital.
35,727 subscription rights from the stock option programs VSOP 1 and 2 were exercised at an issue price of EUR 1.05 per share.
On the basis of the 31,136,470 shares outstanding, the market capitalization as at 31 December 2018 was EUR 5.3 million.
Shareholder structure and free float
As of December 31, 2018
Disclaimer: The shareholder structure pictured above is based on the published voting rights announcements and company information.
windeln.de SE assumes no responsibility for the correctness, completeness or currentness of the figures. Total number of shares: 31,136,470
*Free float according to the definition of Deutsche Börse: 31.6%
** Aggregate shareholding of the founders Alexander Brand & Konstantin Urban
Investor Relations (IR)
The management of windeln.de SE sets high priority to an intensive dialogue with the capital market and attaches great importance to regular
and transparent communication with the shareholders and stakeholders of the company. It is the ultimate goal to communicate the latest
Company development in a timely manner. To ensure this, windeln.de relies on the regular publication of Company-relevant reports,
comprehensive financial reporting, and especially on the permanent personal contact with investors, analysts, journalists and the interested
public.
In the past year, a regular exchange between investors and management board took place in the context of roadshows, capital market
conferences, individual meetings and numerous telephone conferences. The investor meetings carried out in 2018 led the management of the
Company to Frankfurt, Hamburg, London and Munich. windeln.de also participated in numerous investor conferences: Goldman Sachs Small-
and Mid-Cap Symposium, DVFA Spring Conference, Commerzbank Sector Conference, Zürcher Capital Market Conference, German Corporate
Conference and the Equity Forum of Deutsche Börse.
In addition, in October 2018, research analysts and other relevant capital market participants had the opportunity to better get to know
windeln.de at a Capital Markets Day in the Company´s headquarter in Munich. On the occasion of the publication of annual and quarterly
results, telephone conferences and webcasts were held for shareholders, research analysts and other capital market participants. The

To the shareholders | The windeln.de SE share
Annual Report 2018
19
corresponding presentations and recordings of the webcasts are available on the Company´s website in the Investor Relations section. The
management and the Investor Relations department were available to interested parties for questions and personal discussions.
For investors, analysts and the interested public, the website https://corporate.windeln.de/ provides further information that is constantly
updated. In addition to the financial reports, mandatory reports and corporate news, visitors to the website will find the latest version of the
Company presentation as well. Further, there is the possibility to register for an electronic mailing list in order to be supplied promptly and
directly with important corporate news.
Financial calendar
Publication of full year 2018 results March 20, 2019
Publication of first quarter results 2019 May 8, 2019
DVFA Spring Conference (Small- & Mid Cap) May 2019
Annual General Meeting 2019 June 6, 2019
Publication of first quarter results 2019 August 8, 2019
Publication of nine months results 2019 November 13, 2019
Investor Relations Contact
Sophia Kursawe
E-Mail: [email protected]

Annual Report 2018
20
GROUP MANAGEMENT REPORT AS OF DECEMBER 31, 2018

Group management report
Annual Report 2018
21
1. Fundamental information about the Group
1.1. Group business model
Since its formation, the windeln.de SE Group (“windeln.de” or the “Group”) has become one of Europe’s leading online retailers for baby,
toddler and children products. The parent company, windeln.de SE, was founded in 2010 and has its registered office in Munich, Germany.
The Group works with around 450 suppliers in order to offer its clients a large selection of products through the webshops windeln.de,
windeln.ch and our shops in Southern Europe, bebitus.com, bebitus.pt and bebitus.fr, which they can order from the comfort of their homes.
Products range from diapers, baby nutrition and drugstore products to clothing, toys, strollers, furniture and safety products, such as car seats.
Since 2018, products are offered for older children and parents, i. e. for general family needs. Meanwhile, the assortment also comprises the
categories dietary supplements, cosmetics and partnership.
windeln.de also serves customers in China through its website “windeln.com.cn”. Furthermore, through a flagship store, the Group has been
present on the Chinese online platform Tmall Global (”windelnde.tmall.hk”) since 2016.
In August 2018, windeln.de sold its shares of Feedo Group that had operated the webshops feedo.cz, feedo.pl and feedo.sk.
Currently, windeln.de supplies its customers from five warehouses (Großbeeren near Berlin/Germany; Uster/Switzerland; Barcelona/Spain;
Frankfurt am Main/Germany and Guangzhou/China). This fulfilment network offers the possibility to serve all markets efficiently. Furthermore,
the Group runs a retail shop in Grünwald near Munich/Germany. Additionally, Feedo Group had operated an own warehouse in Prague/Czech
Republic.
The customers are the top priority for windeln.de. To be able to guarantee a positive shopping experience, the Group’s webshops offer
customers free delivery with a certain minimum order as well as a range of community and content offers, e. g. online advice, a pregnancy
calendar, personal recommendations and a competent customer service.
1.1.1. International development
Europe
After the success in Germany, windeln.de started its deliveries to European countries in 2011. In 2013, the online shop "www.windeln.ch" went
live. The web shops kindertraum.ch and toys.ch were also acquired at the end of 2013. In 2015, Italy was established as a market in Southern
Europe by founding the pannolini.it S.r.l. The acquisition of Bebitus Retail S.L. in 2015 (now Bebitus Retail S.L.U.; hereinafter referred to as
"Bebitus") added the Spanish, Portuguese and French markets. In 2015, Feedo Sp o.o. and its subsidiaries (hereinafter referred to as the "Feedo
Group") were also acquired in Eastern Europe, covering the Czech Republic, Poland and Slovakia.
As part of the efficiency and profitability measures initiated in February 2018, the management board decided to close the loss-making Italian
pannolini.it business in February 2018. Italian customers will continue to be able to order via our German webshop and will thus continue to
be supplied as customers. At the same time, the management board decided to sell the loss-making Eastern European Feedo Group. The
divestiture process was completed in August 2018.
In the remaining six European shops (Germany, Austria, Switzerland, Spain, Portugal and France), windeln.de offers country-specific websites
and a local product range to meet the specific needs of each region.
The webshops kindertraum.ch and toys.ch were closed in 2018 in order to achieve a uniform brand presence in Switzerland and to leverage
efficiency potential. Customers are directed to our webshop windeln.ch, which offers the same product portfolio.
There is substantial growth potential in the existing international markets due to the lower market share of the Group compared to Germany
and the lower online share of the baby, children's and family products market.
China
Since 2012, windeln.de has also been active in the Chinese cross-border e-commerce market, where foreign baby products are also sold to
customers in China. Scandals in the past about contaminated milk powder produced in China have led to great mistrust in domestic Chinese
products. As a result, German products particularly from this category gained in importance in China, which makes the offer of windeln.de very
attractive for Chinese customers. In recent years, windeln.de has managed to continuously expand its customer base in China.
In order to make shopping as convenient as possible, Alipay, the payment method frequently used in China, has been offered since 2013. In
2017, the popular payment method China UnionPay was introduced for Chinese customers. In addition, there was a Chinese version of the
"windeln.de" website since 2014, which was replaced by the "windeln.com.cn" webshop at the end of 2016. Direct delivery to China is possible
since 2015, offering customers a more cost-effective and convenient alternative to delivery via freight forwarders. Delivery via freight

Group management report
Annual Report 2018
22
forwarders is not available since the end of 2017. Since 2016, Chinese customers have been able to select both duty unpaid and duty paid
shipment of their goods in the webshop. Here, the applicable cross-border e-commerce tax on the goods is levied at checkout and transferred
directly to customs by a logistics partner. This enables fast and efficient customs clearance.
An important step was the opening of a flagship store on Tmall Global, the Alibaba Group's digital marketplace for foreign brands. Alibaba's
digital marketplace provides access to over 400 million active customers per month.
The Chinese webshop "windeln.com.cn" runs on a Group-wide uniform technology platform, which enables responsive design and displays
the website content to customers on all end devices in high resolution. This is of major importance for the above-average number of purchases
made in China via mobile devices. In addition, a server in China was put into operation in 2017, which significantly shortened the loading times
of the Chinese website. In addition, the website was equipped with a certificate which promotes the confidence of Chinese customers in the
platform, as the identity of the operators of the website is established.
In addition, various activities in several Chinese forums and communities as well as a Chinese-speaking customer service contribute to customer
loyalty and prompt customer communication. To further develop the Chinese market, the service company Windeln Management Consulting
(Shanghai) Co., Ltd. was founded in 2017.
In June 2018, the bonded warehouse for the windeln.de Tmall flagship store went into operation after several test rounds. The customers, who
buy via Tmall, now have the choice between the delivery from the bonded warehouse in the South of China - so they can be delivered within
two to three days - or from Germany. The Group sees strong approval rates for the new and faster delivery service.
In 2018 preparations have also begun for the second bonded warehouse, which will be able to deliver orders from the webshop windeln.com.cn
and other platforms from the beginning of the second quarter of 2019. In 2018, the project team conducted an intensive pitch process with
various suppliers to finally select an experienced warehouse partner in Ningbo (near Shanghai). In the future, the website customer will be
offered three delivery options: the fastest delivery from the bonded warehouse and two additional options from the German warehouse by air
freight.
Since the end of 2018, windeln.de in China has expanded its offer with further high-quality European products, including handbags, cosmetic
products and dietary supplements.
Business in China was challenging for windeln.de in 2018 due to various effects. On the one hand, temporarily tightened customs controls in
May and June 2018 led to delivery delays of four to eight weeks for Chinese customers. This led to cancellations and refunds of orders. In
addition, product prices were strongly under pressure as the market was affected by overstocking of baby food from the first quarter. In
addition, Chinese customers were reluctant to place orders because major suppliers had announced product relaunches (new formulations
and new packaging) for the second half of the year and Chinese customers are generally less willing to stock old products. As a result, revenues
in China in 2018 were significantly lower than in the previous year.
In 2018, around 54% of Group sales were generated with Chinese customers.
1.1.2. Product mix
The Group offers its customers a comprehensive range of carefully selected products to meet the needs of families with young children.
Especially through the continuous optimization of the product portfolio, windeln.de increases its attractiveness for both new and existing
customers.
The range of daily needed consumer goods like diapers, baby nutrition and drugstore products up to durables such as strollers, car seats,
clothes, toys and children's furniture makes windeln.de a central contact point for the purchases surrounding the needs of baby, child and
family. By continuously adding popular product groups such as dietary supplements, cosmetics and partnership articles to the product portfolio
in 2018, the Group is able to increase its attractiveness and become an integrated provider for the needs of families.
The selection of product ranges, strategic purchasing activities and scheduling are carried out within uniform Group-wide structures. Following
the integration of Bebitus in fiscal year 2017 and the sale of Feedo in August 2018, there is now only one purchasing organization Group-wide
that intensively maintains relationships with around 450 suppliers and promotes pan-European negotiations. An important part of the
restructuring measures in 2018 was a careful product range analysis in the course of which around 15,000 products with no or only low
profitability for the Group were identified and discontinued. Together with the assortment analysis, optimized listing rules were introduced at
the European level, which ensure a continued positive development of the Group's profitability under strict consideration of profitability figures
and provide the purchasing team with an important decision-making aid for the listing of new products. The dynamic process of assortment
optimization will be continued on an ongoing basis and supplemented by an increased inventory turnover rate and a reduction in inventory
ranges.
The Group consistently pursues the further development of its private label business. In 2018, this was also marked by a consolidation process
in connection with the product range analysis, the aim of which was to reduce the private label portfolio from five to two brands. The product

Group management report
Annual Report 2018
23
range is now focused on a small number of product areas with high sales and margin potential and is being continually expanded on this
basis.
1.1.3. Fulfilment/operations
windeln.de SE currently has a total of five logistics centers, which are used for time- and cost-efficient delivery. In order to achieve optimal
logistics results for all target markets, windeln.de relies on the locations Großbeeren near Berlin (Germany), Barcelona (Spain), Uster
(Switzerland), Frankfurt am Main (Germany) and Guangzhou (Chinese bonded warehouse). The Group continues to pursue its asset-light
strategy, defined by the operational operation of all logistics centers by external service providers.
The warehouse of the Feedo Group, which was sold in August 2018, is operated internally. After the Uster logistics center (Switzerland) was
largely dissolved in 2017, the Group continued to use it to a limited extent in 2018 via an external service provider.
In 2018, a contract was concluded for a second bonded warehouse, from which Chinese customers who buy in the Chinese web shop
"windeln.com.cn" can be supplied more cost-effectively and time-efficiently as an alternative to shipping from Germany as of 2019.
The dropshipment method which was introduced in 2017 was also used in 2018. This method allows the Group to ship goods directly from
the manufacturer to the customer without having to resort to its own logistics centers. This enables the Group to save storage capacity while
simultaneously increasing its product portfolio.
Despite the operational outsourcing of logistics, all key fulfilment processes are controlled centrally by Group employees and thus represent
an essential know-how of the Group. The Group has its own team for the coordination and further development of procurement and
distribution structures. Optimized flows of goods, packing efficiency and quality, as well as delivery speed are decisive levers for the Group to
improve cost efficiency and maximize customer satisfaction.
A particular cost factor in logistics is the returns ratio, which averaged 3.6% for the Group in 2018, well below the industry average of around
15%.1 This is due to the very low rate of returns of both daily consumer goods and consumables. Furthermore, the good advisory service in
the shop means that products are comparatively rarely returned.
The multilingual customer service, aiming at international customers, offers customers competent advice and a free point of contact for their
concerns regarding ordering in the web shops. This service is made possible by a total of four customer service centers, of which two are
located in Europe and two in Asia, which are operated both internally and in collaboration with external service providers.
To ensure the best possible shopping experience, the Group has a large, constantly evolving portfolio of payment options, which is an essential
building block for repurchase rates and customer satisfaction. By commissioning new service providers in 2018, it was also possible to achieve
improvements in creditworthiness checks and to drive forward the ongoing development of credit card processing.
In 2018, supply chain management increasingly relied on internally developed statistical models to determine optimum order quantities. These
precise algorithms enabled the Group to significantly reduce inventories without compromising inventory and delivery reliability.
1.1.4. Technology infrastructure
As a company focused on technology, ongoing innovation through investments in technology is a core part of windeln.de’s business.
windeln.de has a highly scalable, internally developed technology platform that serves as the basis for a convenient and inspiring shopping
experience for its customers.
windeln.de develops central components of the e-commerce platforms used in the Group itself. This ensures that the software is optimally
adapted to the operational processes and requirements of the specialist departments. In particular, the shop platforms are operated as self-
developed software. windeln.de SE relies on the use of modern, open-source-based standard software and libraries. The almost exclusively
internally developed IT architecture is centralized for all business areas and thus creates efficient synergies. If necessary, tailor-made
technologies are supplemented by selected third-party solutions. Since the sale of the Feedo Group in 2018, all online shops have been running
on the same Group-wide shop system. The uniform technological basis with a flexible shop and content management system makes it possible
to respond even better to customer wishes, realize synergies and optimize IT resources.
windeln.de maintains sophisticated systems for the collection of large amounts of data on the browsing and shopping behaviour of customers.
Through the analysis of this data, the needs of the customers can be met very well, e. g. by personalized recommendations based on childhood
can be given. At the same time, compliance with the European data protection standard is a matter of course.
1 New Business Verlag GmbH & Co. KG; http://www.markenartikel-magazin.de/no_cache/unternehmen-marken/artikel/details/10016070-e-commerce-durchschnittliche-retourenquote-
liegt-bei-15/; retrieved February 13, 2019

Group management report
Annual Report 2018
24
The rapid development of mobile commerce offers great potential for the Group. In fiscal year 2018, around 72% of website traffic and 55%
of orders were generated from mobile devices. The Group is continuously working on optimizing its mobile offerings for websites and apps.
On mobile devices such as smartphones and tablets, purchases in the shops are made much easier thanks to optimized alignment and a more
user-friendly display. The advantages for IT are that features can be implemented much faster and scaled across shops thanks to the modern
IT architecture based on micro-services and standardized and optimized processes.
The most important technical developments in 2018 were:
Enhancement of the windeln.de App
In June 2018, the windeln.de App was enhanced by the section “pregnancy”. Expecting parents can enter the expected date of birth. This is
used as a basis to provide information on the prenatal development of the baby and the mother in the various stages of pregnancy. The App
offers useful tips and checklists. Furthermore, products are being presented in this section that may meet the mothers’ interests. Since August
2018, this functionality is also available in the windeln.ch App, and – since December 2018 – in the Spanish Bebitus App.
China iOS App
Since August 1, 2018, our China iOS App is available in the Chinese app store. The app is customized to the needs of Chinese customers,
special category navigation trees, sorting functions and promotion functionalities were implemented. The app offers new buttons for express
purchases and expanded customer service functionalities.
PDP Product Detail Page
New navigation functions on the product detail pages (PDP) aim at offering better presentation of product information to customers, and a
more structured way to present different types of information (product description, technical details, customer ratings, recommendations).
The optimization of loading behavior of product images improves the shopping experience and increases retention rates.
New search functions
In November 2018, we introduced a completely new search technology based on a parallel algorithm that is language independent. This
method recognizes phonetic similarities in combination with the so-called Fuzzy Logic (fuzzy search terms that finds similar words). This way,
the algorithm is tolerant to faults and provides satisfactory search results in case of typing or spelling errors, or regional spelling deviations.
Due to an extensive analysis functionality, the search results are being optimized on a regular basis. Customers are led more easily to their
desired products, and the number of inconclusive search requests is reduced.
Checkout 2.0
End of the 2018, a new Checkout function with improved usability and speed was launched for the majority of windeln.de shops. It is designed
as Single Page Application and does not require page reload throughout whole checkout process. Microservices-based backend Architecture
of the new checkout allows the IT-team to increase productivity and reduce time-to-market for the new functionality, as well as ensures
technical scalability and easier code maintenance.
1.1.5. Marketing and customer acquisition
New customers are acquired through various paid and unpaid marketing channels. These include search engine marketing (SEA and SEO),
content marketing (windeln.de online magazines and windeln.de app), product data marketing on price comparisons, affiliate marketing, re-
targeting, recommendation marketing and social media. The focus is on online marketing in order to reach customers where they have access
to the windeln.de webshop.
2018 was characterized by the internationalization of the windeln.de magazine and the increased use of influencer marketing on popular social
media platforms. The new function of in-app-shopping, offered by the service Instagram, has been used since its introduction and is constantly
being expanded. This enables to use advertising images on the above platform to be linked directly to the Group's shops. This simplifies the
purchasing process for the customer. Furthermore, the implementation of the pregnancy calendar into the windeln.de app triggered a
customer loyalty management process, which was characterized by the multiplication of the download rate and an 5.6pp increase in mobile
purchases.
The business model of windeln.de relies on the one-time acquisition of customers, who are inspired by the wide range of products in
combination with the segment-specific customer relationship management campaigns over a longer period of time to multiple purchases and
repeated interaction on the websites of windeln.de and thus become regular customers of the Group.
Generally, the most effective form of marketing is to continuously improve customer experience, as satisfied customers not only make repeat
purchases at windeln.de, but also recommend the websites to friends and family members. These "Word-of-Mouth" recommendations are
supported by a customer recommendation program of windeln.de, which was extended in 2018 by the possibility of recommendation through
the messenger service WeChat, popular in the Chinese market. The share of repeat customers in fiscal year 2018 was 82.6%.

Group management report
Annual Report 2018
25
1.1.6. Employees
Our employees form the basis of the success of the Group. The dynamic and growing business environment in which windeln.de operates,
calls for engaged and motivated employees. As of December 31, 2018, the Group had 224 employees. The significant decline of 199 employees
is attributable to the divestiture of the Feedo Group, the closure of pannolini as well as the restructuring measures at the offices in Munich
and in Barcelona in 2018.
Since 2017, human resources (HR) have been managed for almost all locations (except for Feedo Group) from Munich. The HR software was
further developed in 2018 and offers accelerated processes for both the HR department and the employees and contributes to greater
transparency. For example, employees of the HR department can access all relevant documents digitally, regardless of where they are, while,
for example, the employees of windeln.de SE receive the monthly pay slips online via the tool access.
The consolidation of processes and standardization of regulations in all companies are as much a focus as the continuous increase in efficiency
in existing processes.
Different cultures, ideas, perspectives, strengths and experiences lead to best results for windeln.de The diversity of the employees is very
important to the Group. At the end of 2018, windeln.de Group-wide employed people from 27 countries. Women make up to 60% of the
Group’s workforce. The average age of the workforce 2018 was 34 years, whereby the age of the experienced management board clearly lies
above this number.
windeln.de lives an open, trustworthy and transparent corporate and communication culture, which supports the team spirit and commitment.
Short ways, quick decisions and flat hierarchies are very important elements of the corporate culture. Thus, the windeln.de Rules of Success
were developed, which offer company values for daily orientation, behaviour and decisions of employees. Interdepartmental events are offered
to all employees at regular intervals. Information events organized by the management board, which provide information on developments,
current projects and outlook, supplement this.
One of the most important visions of the Group is to support the development of employees’ skills. windeln.de has therefore decided to
support its employees with its individual career goals and to offer training accordingly. This includes the development of young professionals
into leading positions through professional trainings. Since mid 2018, a mentoring program has been offered for the third management level,
which promotes interdisciplinary exchange within the company and at the same time serves as an instrument for personnel development.
Through cooperations with universities, the program “employees-promote-employees”, a revised, modern career website and numerous other
initiatives, the Group addresses new, potential candidates. A standardized semi-annual review process ensures that there is close exchange
and feedback between supervisors and employees.
Since mid 2018, payroll accounting for all Group companies has been carried out by external local specialists to ensure compliance with local
laws.
1.2. Group structure
Legal form
windeln.de SE is a European stock corporation (Societas Europaea; short SE).
Management and control
windeln.de Group is managed by the parent company, windeln.de SE, based in Munich, Germany. All management functions are bundled here.
As a European stock corporation, windeln.de SE chose a dual management and control structure. The management board is responsible for
the Group’s strategy and its management, the supervisory board advises the management board and monitors its management activities.
Apart from windeln.de SE, the Group is currently made up of five fully consolidated subsidiaries, which operate as service entities. All
subsidiaries are directly controlled by windeln.de SE and are 100% owned by the Group.
Group segments
The segment structure in 2018 is unchanged to the prior year. Due to the technical integration of the webshops and the
disciplinary organization of corporate employees in central departments, the Group is managed by the central headquarter. As a result,
windeln.de operates a one-segment Group since the second half of 2017. Please refer to note 4 in the notes to the consolidated financial
statements for further information.

Group management report
Annual Report 2018
26
1.3. Group stratety and competitive position
Strategy
The Group set itself the objective of becoming the leading online retailer for the needs of families with babies and children in Europe and
China, and achieving a sustainable profitability. Against this background, the following strategies are pursued:
• Focusing on the existing markets of windeln.de in Europe and China by expanding the customer base, enhancing the product offering
and expanding distribution channels.
• Improvement of operational processes in order to improve the shopping experience of our customers as well as to increase sustainable
profitability.
Please refer to section 3 “Outlook” for further information on the strategy in 2019.
Competitive position
Competitors of windeln.de are other online retailers that focus exclusively on the sale of products for babies, toddlers and children (“pure
online retailers for baby and children products”) as well as general online retailers with a broader range of products. Certain offline retailers,
e. g. traditional providers of baby products, drugstores and supermarkets, are also competitors of windeln.de.
windeln.de stands out from the offline and online competition thanks to its numerous competitive advantages. As a pure online retailer that
specializes on the needs of families, windeln.de is one of the leading suppliers in Europe and built up a strong business selling primarily baby
food products to customers on the Chinese market.
This success is based on the following core drivers:
• Loyal customer base, which is primarily made up of mothers
• Focus on products for babies and children and an increasing range of family products with the associated specialist knowledge
• Broad and inspired selection of products
• Scalable IT and fulfilment infrastructure focused on future growth
• Economies of scale and efficiency advantages on account of size and market share
• High level of brand awareness as provider of “German quality products” on the Chinese market
• Strategically close and long-term relationships with manufacturers and suppliers
1.4. Management system
The most important performance indicators for the Group’s management are revenues, operating contribution as percentage of revenues,
adjusted earnings before interest and taxes as percentage of revenues (adjusted EBIT as percentage of revenues) and the Group’s cash flow.
For the purposes of managing the Group, earnings before interest and taxes (EBIT) are adjusted for expenses and income in connection with
share-based compensation, reorganization measures, impairments of intangible assets and income and expenses of the closed shop
pannolini.it. In 2017, also expenses for the integration of subsidiaries were adjusted.
The management board manages at Group level.
In addition to the listed financial key figures, a number of non-financial performance indicators, which take influence on the order volume, are
also used to steer the group:
• Number of active customers
Each customer that has submitted an order within the last year (based on the reporting date) is considered to be active.
• Average orders per active customer
The orders submitted by active customers within the last 12 months are included in the calculation of the average number of orders.
• Average order value
The number of orders as well as the average size of the shopping cart have a direct influence on the Group’s revenue. This figure is also a key
indicator to measure the customers’ trust in the Group
• Share of repeat customer orders
The share of repeat customer orders is the relationship of orders made by repeat customers compared to the total number of customers. This
measure also reveals the loyalty of our customers.
The non-financial performance indicators are managed by the management board at shop level. The management system used in the Group
is – compared to the previous year – unchanged.

Group management report
Annual Report 2018
27
The revenue contribution per customer over time (customer lifetime revenue), the contribution margin per customer in relation to customer
acquisition costs (customer lifetime value) and the liquidity situation of the Group are also considered to be key performance indicators.
1.5. Research and development
windeln.de internally develops central components of the e-commerce platforms used in the Group. This ensures that the software is aligned
with the operating processes and the needs of the departments in the best possible way. Thereby, windeln.de uses modern, open source based
standard software and libraries. If necessary, tailor-made technologies are supplemented by selected third-party solutions. The capitalization
quota of the Group’s development services is 10%.
The most important technical developments in 2018 comprise the enhancement of the windeln.de App, the launch of our China iOS App, PDP
improvements (Product Detail Page), the introduction of a new search function and the launch of Checkout 2.0 . Details are outlined in
note 1.1.4 “Technology infrastructure”.
The software development constitutes a structured and personnel-intensive part of the implementation of customer features in the shop,
improvements to systems, development of components as well as the expansion and customization of the functionalities of the ERP system.
The development teams are divided into sub-areas of the customer purchase process and work in agile, organized teams: Product, content,
checkout, and service teams. Back office tools (product information system, customer care, SEO) are being developed at the location Sibiu in
Romania. A quality assurance (QA) team in Sibiu supports the development teams and performs manual and automated test runs. ERP
development takes place in a further specialized team. The automation of IT operations and the operation of infrastructure services are
performed by the IT team. Thereby, the automation of software development processes and the server management could be fully achieved.
The Group does not perform any research activities.
2. Report on economic position
2.1. Macroeconomic conditions
In 2018, retail sales in Germany amounted to around EUR 525 billion, which corresponds to growth of 2.3% compared to the previous year.
Retail sales increased in 2018 for the ninth time in a row. In the past eight years, sales grew by around 22%. This shows that the retail sector is
making a sustainable profit from the consumer-friendly environment of recent years.2 Expectations for retail growth in 2019 are around 2%,
which corresponds to a forecasted turnover of EUR 535.5 billion.3 The gross domestic product (GDP) rose by 1.4% in 2018 (previous year:
2.2%).4 Retail made a significant contribution to this growth.5; 6
However, the development of the individual sectors is very diverse. Online trading continues to be an above-average successful industry,
generating total revenues of EUR 65.1 billion in 2018 (growth of around 11% compared to 2017). Thus, in 2018, around 12% of retail sales
were generated in e-commerce. Revenue growth of 10% to EUR 71.9 billion is forecasted for 2019.7 Clothing and telecommunications articles
were particularly popular with consumers. The e-food subgroup recorded the strongest growth compared to 2017 with 20.3%.8
Sales also increased in Europe. The retail volume for 2018 increased by 1.5% year-on-year in the euro zone and by 2% in the EU-28.9 In 2018,
European online trading generated sales of around EUR 313 billion.10
Retail sales in China grew by around 9% year-on-year in 2018.11 In e-commerce, a volume of EUR 576 billion was recorded in 2018, representing
growth of over 16%. The Group expects further significant annual growth of around 10% until 2022.12
2 Statista; https://de.statista.com/statistik/daten/studie/70190/umfrage/umsatz-im-deutschen-einzelhandel-zeitreihe/; retrieved on February 4, 2019 3 HDE Handelsverband Deutschland; https://einzelhandel.de/presse/aktuellemeldungen/11902-jahresprognose-einzelhandel-hde-erwartet-2019-zwei-prozent-umsatzwachstum; retrieved
on February 4, 2019 4 Statista; https://de.statista.com/statistik/daten/studie/2112/umfrage/veraenderung-des-bruttoinlandprodukts-im-vergleich-zum-vorjahr/; retrieved on February 4, 2019 5 Tagesschau; https://www.tagesschau.de/wirtschaft/deutsche-wirtschaft-2018-101.html; retrieved on February 14, 2019 6 HDE Handelsverband Deutschland; https://einzelhandel.de/presse/aktuellemeldungen/10965-online-handel-bleibt-wachstumstreiber-hde-prognose-fuer-2018-umsatzplus-von-zwei-
prozent; retrieved on February 4, 2019; E-Commerce Magazin; https://www.e-commerce-magazin.de/online-handel-waechst-um-111-prozent; retrieved on February 15, 2019 7 Statista; https://de.statista.com/statistik/daten/studie/71568/umfrage/online-umsatz-mit-waren-seit-2000/; https://www.handelsdaten.de/branchen/e-commerce-und-versandhandel
retrieved on February 4, 2019 8 EHI Retail Institute; https://www.handelsdaten.de/branchen/e-commerce-und-versandhandel; retrieved on February 4, 2019 9 Eurostat; https://ec.europa.eu/eurostat/statistics-explained/index.php/Retail_trade_volume_index_overview#Turnover_for_retail_and_wholesale_trade;
http://appsso.eurostat.ec.europa.eu/nui/show.do?query=BOOKMARK_DS-075757_QID_355F7732_UID_-
3F171EB0&layout=TIME,C,X,0;GEO,L,Y,0;INDIC_BT,L,Z,0;NACE_R2,L,Z,1;S_ADJ,L,Z,2;UNIT,L,Z,3;INDICATORS,C,Z,4;&zSelection=DS-075757INDIC_BT,TOVV;DS-075757NACE_R2,G47;DS-
075757UNIT,I15;DS-075757INDICATORS,OBS_FLAG;DS-075757S_ADJ,SCA;&rankName1=UNIT_1_2_-1_2&rankName2=INDIC-BT_1_2_-1_2&rankName3=INDICATORS_1_2_-
1_2&rankName4=S-ADJ_1_2_-1_2&rankName5=NACE-R2_1_2_-1_2&rankName6=TIME_1_0_0_0&rankName7=GEO_1_2_0_1&sortC=ASC_-
1_FIRST&rStp=&cStp=&rDCh=&cDCh=&rDM=true&cDM=true&footnes=false&empty=false&wai=false&time_mode=NONE&time_most_recent=false&lang=EN&cfo=%23%23%23%2C%
23%23%23.%23%23%23; retrieved on February 15, 2019 10 Statista; https://de.statista.com/outlook/243/102/ecommerce/europa; retrieved on February 15, 2019 11 Statista; https://www.statista.com/statistics/277912/china-change-in-trade-revenue-of-consumer-goods-by-month/; retrieved on February 4, 2019 12 Statista; https://de.statista.com/outlook/243/117/ecommerce/china; retrieved on February 4, 2019

Group management report
Annual Report 2018
28
Due to the continued positive growth figures of the online trade and the toy and baby product segments, the Group sees further growing
market opportunities for the business model of trading products for babies, children and families.
The withdrawal of the United Kingdom from the European Union ('Brexit') has no direct impact on the Group. In the financial year 2018,
windeln.de SE delivered only a very insignificant number of products to the United Kingdom or procured products from it. There are no plans
to expand the business there in the future either.
According to eMarketer, the effects of the trade dispute between the US and China also have no negative effects for Europe with regard to
the cross-border e-commerce market in China, as the increasing demand for high-quality products of the growing Chinese middle class in the
ongoing trade dispute between the US and China can be increasingly supplied by Europe and Australia.13
2.2. Sector-specific environment – market for products for babies, toddlers and children
German and European market
The online trade in Germany increased last year by around 11% to EUR 65.1 billion. Also in 2019, the significant growth of more than 10% is
expected to bring an increase to EUR 71.9 billion.14 According to internal Group estimations, last year's value of the e-commerce market for
baby and toddler supplies in Germany was around EUR 2 billion and is expected to grow by an average of 3.5% annually until 2023.15 Since
2012, a strong positive birth trend has been observed in Germany. In 2016, around 792,000 children were born. A slight decline of 0.9% was
recorded in 2017 with 785,000 births, also because the number of births in the previous years had increased significantly.16 With a birth rate
of 1.59 children per woman, the positive trend observed since 2012 is continuing. From the Group's perspective, steady growth is very likely.17
From the Group's perspective, medium-term growth of the entire market for baby and toddler products is therefore highly probable.
According to Group forecasts, last year's sales in the baby, toddler and children's supplies segment in Europe amounted to approximately
EUR 11.2 billion, which corresponds to a year-on-year difference of +8%. Average annual growth of 6.4% is expected up to 2023. The Group
also expects rising consumer spending in Europe, especially in the areas of clothing, household and health care.18
The online channel is generally a good way to sell consumer goods for babies and children, as these products are similar to other product
categories which are already sold online to a significant extent, such as consumer electronics, appliances and fashion (with clothes and shoes).
Products for babies, toddlers and children are typically branded, non-perishable and purchased at high frequency. This offers a significant
opportunity for the growth of the online share. In addition, demand with little need for individualisation is highly predictable. Furthermore,
the ability to shop anytime, anywhere with convenient home delivery is a significant convenience compared to traditional offline shopping.
By offering a wider range of drugstore and healthcare products, the Group is strengthening its presence in a positively forecasted market with
an average annual growth rate of around 6% in Germany until 2023. In 2018, the market recorded sales of EUR 2.5 billion, an increase of almost
10% over its prior-year level.19 The special attractiveness of the market is also characterised by an average growth rate that is higher than that
of the baby and toddler needs segment.
According to Group estimations, last year's sales in the drugstore and health segment in Europe amounted to EUR 15.9 billion, which
corresponds to an increase of around 11% over the previous year. For the next five years, average annual growth of 8% is expected in this
segment.20
Mobile devices
The constant rise of the use of smartphones and tablets is one of the main reasons for the increasing online penetration in Europe. Smartphones
and tablets offer customers a convenient way to shop at any time and from anywhere. This is a major advantage especially in the sale of baby
and toddler products. In addition, online marketing via mobile devices (e.g. push notifications) offers a new opportunity to increase daily
interaction with customers. The Group is continuously working to improve the mobile shopping experience for its customers and introduced
a new app in 2018, among other things. The share of mobile page views at windeln.de amounted to 72% in 2018 (the share of mobile orders
amounted to 55%).
13 eMarketer; https://retail.emarketer.com/article/trade-war-will-have-little-effect-on-cross-border-ecommerce/5be3322cb979f10520fef8a4 ; retrieved on February 7, 2019 14 Statista; https://de.statista.com/statistik/daten/studie/71568/umfrage/online-umsatz-mit-waren-seit-2000/; HDE; https://www.handelsdaten.de/branchen/e-commerce-und-
versandhandel retrieved on February 4, .2019 15 Statista; https://de.statista.com/statistik/daten/studie/497188/umfrage/prognose-der-umsaetze-im-e-commerce-spielzeug-und-baby-deutschland/;
https://www.handelsdaten.de/branchen/e-commerce-und-versandhandel; retrieved on February 5, 2019 16 Statista; https://de.statista.com/infografik/14691/geburtenzahl-in-deutschland/; retrieved on February 5, 2019 17 Zeit ONLINE; https://www.zeit.de/wissen/2018-07/geburten-deutschland-anstieg-2018; retrieved on February 5, 2019 18 Statista; https://de.statista.com/outlook/257/102/spielzeug-baby/europa#market-marketDriver; retrieved on February 5, 2019 19 Statista; https://de.statista.com/outlook/254/137/drogerie-gesundheit/deutschland; retrieved on February 5, 2019 20 Statista; https://de.statista.com/outlook/254/102/drogerie-gesundheit/europa; retrieved on February 5, 2019

Group management report
Annual Report 2018
29
A representative survey of rc-research & consulting GmbH shows that windeln.de is on the right track. Almost half of parents (46%) use mobile
devices such as smartphones for their shopping, mainly because of time savings compared to shopping at the computers (44%). The
smartphone is not only used on the go (25%), but also at home (85%).21
Cross-border e-commerce market in China
windeln.de is also active in the Chinese cross-border e-commerce market. Chinese customers buy directly from foreign online merchants in
this market segment. The volume of Chinese cross-border e-commerce amounted to USD 121.6 billion last year, which corresponds to growth
of around 21.4% year-on-year. It is estimated that further steady growth in the range of just under 13% per annum on average will be achieved
until 2023. In 2018, the number of users of the cross-border e-commerce market rose by more than 13%. According to eMarketer, every fourth
user of Chinese e-commerce will have completed a cross-border purchase by 2020.22
With the rising disposable income of the Chinese population and a strongly growing middle class, the demand for high-quality products from
Europe is also growing, and thus from Germany.23 The main product categories purchased are cosmetics and healthcare products, as well as
products for mothers and children.24; 25
The growth of the Chinese cross-border e-commerce market is stimulated by the following drivers:
• An increase in the annual restriction on cross-border e-commerce purchases from RMB 20,000 to RMB 26,000 per capita as of January 1,
2019, benefits the Group's business activities. In addition, the limit on the value of goods in individual transactions was increased from
RMB 2,000 to RMB 5,000.26
• Since September 2018, China's customs administration has been working on new methods to optimize and accelerate customs
clearance.27
• A reduction in the taxation of incoming mail from 30% to 25% for personal items (clothing and fashion items) and from 60% to 50% for
cosmetic products represents a growth-promoting development.28
• The market is also strengthened by the fact that more and more babies are being fed milk substitutes instead of breast milk. A total of
800 thousand tonnes of milk powder are expected to have been imported in 2016. Imports are expected to rise to 1.2 million tonnes until
2025.29 The growth in demand for foreign quality products is additionally strengthened by past scandals with local milk substitutes. As in
previous years, Aptamil milk powder was named as one of the top five products sold on Tmall Global on Single´s Day, 11 November
2018.30
• In addition, the purchasing power of the middle class in China is growing at a rate of around 9% per capita from 2017 to 2022.31 According
to McKinsey, by 2022 the middle class is expected to reach 630 million people, particularly driving the demand for authentic, high-quality
foreign products.32 For these reasons, the Group believes that the overall market for baby products in China will continue to grow
substantially in the coming years.33
Despite the structural attractiveness of the Chinese market, demand is volatile as it reacts to market changes such as new legal or regulatory
regulations, product changes or temporarily tightened customs controls. It should also be noted that due to the attractiveness of the Chinese
market, competition and thus price pressure will tend to increase in the future.
21 Etailment, http://etailment.de/news/stories/eltern-kinder-studie-
21088?utm_source=%2Fmeta%2Fnewsletter%2Flongread&utm_medium=newsletter&utm_campaign=nl1270&utm_term=19d68f6ca8cc5e2a52ade5516d359e52; retrieved on February 12,
2019 22 eMarketer; https://retail.emarketer.com/article/trade-war-will-have-little-effect-on-cross-border-ecommerce/5be3322cb979f10520fef8a4; retrieved on February 6, 2019 23 eMarketer; https://retail.emarketer.com/article/trade-war-will-have-little-effect-on-cross-border-ecommerce/5be3322cb979f10520fef8a4; retrieved on February 6, 2019 24 Gatti, Elena; https://locationinsider.de/5-trends-fuer-cross-border-e-commerce-in-china-im-jahr-2019/; retrieved on February 6, 2019 25 China Daily; http://www.chinadaily.com.cn/business/2017-10/30/content_33890583.htm; retrieved on February 6, 2019 26 State Council of the People’s Republic of China; http://english.gov.cn/news/top_news/2018/11/30/content_281476413209449.htm; retrieved on February 7, 2019 27 State Council of the People’s Republic of China; http://english.gov.cn/news/top_news/2018/11/30/content_281476413209449.htm; retrieved on February 6, 2019 28 Herlar; https://jingdaily.com/cross-border-predictions/; retrieved on February 7, 2019 29 Agrar Heute; https://www.agrarheute.com/tier/rind/milchprodukte-china-will-import-um-70-prozent-steigern-522743; retrieved on February 6, 2019 30 Technode; https://technode.com/2017/11/11/alibaba-records-rmb-168-2-billion-in-singles-day-sales/ ;retrieved on February 12, 2019 31 Statista; ; https://www.statista.com/statistics/263775/gross-domestic-product-gdp-per-capita-in-china/; retrieved on February 26, 2019 32 China Daily; http://www.chinadaily.com.cn/business/tech/2017-02/16/content_28218209.htm; retrieved on February 12, 2019 33 Seattle Times; https://www.seattletimes.com/opinion/400-million-strong-and-growing-chinas-massive-middle-class-is-its-secret-weapon/; retrieved on February 14, 2019

Group management report
Annual Report 2018
30
2.3. Course of busines
Set of measures to improve efficiency and cost-cutting
As part of the meanwhile completed change of CEO, the management board and supervisory board of windeln.de SE authorized several
measures to improve efficiency and profitability on February 6, 2018. These measures were implemented in the current year in order to achieve
break even (on basis of adjusted EBIT). On November 22, 2018, windeln.de delayed the expected break even (on basis of adjusted EBIT) from
early 2019 to early 2020.
Closure of local Italian business
In Q1 2018, the local Italian business was closed, including the dissolution of the local warehouse and office. Customers visiting the website
pannolini.it are routed to our shop windeln.de and can still receive shipments in Italy. The employees of the local company pannolini.it S.r.l.
left the Group in Q1 2018. As a result of a high share of consumable products and a high cost base, pannolini.it’s operating results and cash
flows were highly negative.
Divestiture of the Feedo Group
On July 20, 2018, windeln.de signed an agreement about the divestiture of Feedo Group. The contract partner is Dětská galaxie s.r.o., a
subsidiary of AGS 92 s.r.o. The sale of Feedo Group is structured as a share deal and includes several closing conditions, amongst others the
conversion of loans granted to Feedo Group into equity. windeln.de receives a purchase price of EUR 400k. The purchase price is due for
payment two years after the closing conditions are met, and it is interest-bearing.
All closing conditions were fulfilled on August 24, 2018. On that day, windeln.de Group’s control over Feedo Group ended, resulting in the
deconsolidation of all assets and liabilities of the disposal group. The deconsolidation lead to a loss of EUR 7,758k.
In addition, Feedo Group meets the requirement of a discontinued operation in accordance with IFRS 5. As a result, Feedo’s operating losses,
expenses from remeasurement of the disposal group and the loss from divestiture are presented in the separate position “Profit or loss after
taxes from discontinued operations“ in the consolidated income statement.
Reorganization and reduction of costs of the Group
In the first six months 2018, the number of employees was reduced in all sales and administrative departments in the German headquarter
and in the Spanish offices, and some of the departments were reorganized. This resulted in a reduction in active full time equivalents (FTE’s)
of 107 FTE’s. A further decrease of 74 FTE’s resulted from the divestiture of Feedo Group, leading to a Group FTE number of 212 as of
December 31, 2018.
Optimization of assortment and reduction of marketing costs
The assortment of products in the shops was further optimized in order to improve margins. Marketing spent was also further lowered in all
the shops in H1 2018 and managed on a more profit-focused basis.
Capital increase
On February 6, 2018, windeln.de SE successfully completed a capital increase. A total of 2,628,323 shares were issued. As a result, share capital
increased by EUR 2,628,323. The shares were offered at a price of EUR 1.98, leading to gross issuing proceeds of EUR 5,204,080. Shareholders‘
subscription rights were excluded. The new shares are entitled to dividend payments from January 1, 2018, onwards.
China – Tmall Global Award
On February 6, 2018, windeln.de was again awarded at the „Annual Forum“ of Tmall Global (TMG). TMG honored six companies, each in a
different category, for their role to build up the most popular products on its e-commerce platform in 2017. windeln.de received the award in
the category “mother & baby” for driving the growth of popular German baby milk powder brands.
Change in credit card payment provider
Since the end of H1 2018, all incoming credit card payment transactions are processed by the payment provider Worldpay. As a last step, the
payment provider was implemented in our windeln.de shop; all other shops were already migrated to Worldpay in 2017. The migration to a
single provider allows to optimize processes and achieve synergies. The migration also allows to further decrease credit card payment fees in
future.
Office relocation of windeln.ro labs Srl.
In H1 2018, windeln.ro labs Srl. moved to new office spaces in Sibiu, Romania. The new office will the basis for an expansion of activities in
Romania. The positive pay level drives the expansion of the location. windeln.ro labs Srl. is rendering IT development and product data services
within the windeln.de Group.

Group management report
Annual Report 2018
31
Final settlement agreement with the founders of Feedo Group
In H1 2018, windeln.de and the two founders of Feedo Group agreed on a final settlement about windeln.de’s claims from seller guarantees
and potential subsequent purchase prices. The main results of the settlement agreement are outlined as follows:
• The founders of Feedo Group agreed to settle the claims from seller guarantees by immediate payment in the amount of EUR 365k and
a further payment of EUR 70k in 2019.
• The founders waive their claims from subsequent purchase price payments for the year 2018.
• In return, windeln.de waives its claims from seller guarantees of EUR 145k.
As a result of the settlement agreement, the Group received cash payment of EUR 365k in June 2018.
Annual General Meeting of windeln.de SE
On June 25, 2018, the Annual General Meeting of windeln.de SE was held. 71.28% of the voting share capital was present. The Annual General
Meeting elected Dr. Hanna Eisinger and Clemens Jakopitsch as new members of the supervisory board. The previous members Petra Schäfer
and Nenad Marovac were not available for re-election. All resolutions submitted in the invitation were approved.
Additionally, the Annual General Meeting approved changes to Authorized and Conditional Capital. We refer to note 7 in the management
report.
Management board
Konstantin Urban and Alexander Brand, both members of the management board, retired from their positions on March 31, 2018. Their
successor as CEO is Matthias Peuckert since May 1, 2018.
As of September 30, 2018, Jürgen Vedie retired from his position as member of the management board. His responsibilities are assumed by
CEO Matthias Peuckert and CFO Dr. Nikolaus Weinberger since October 1, 2018.
Thus, the management board has been reduced to only two members as of December 31, 2018. This change is going to impact administrative
expenses in a positive way.
Dr. Guillem Sanz, founder and former CEO of Bebitus Retail S.L.U., left the company and transferred his management responsibilities for the
Southern European activities of windeln.de Group. The management change within the Group was planned since Q4 2017. The transition phase
started in April 2018, and is now finalized by the leave of Dr. Sanz.
Launch of the next generation Aptamil Profutura and Pronutra Advance in China and the GSA region
On September 19, 2018, the new generation of the Aptamil infant and children’s milk products were officially launched. windeln.de’s Chinese
webshop and Tmall shop are the first certified partners of Milupa to offer these new products to customers in China. Simultaneously, the new
products are offered in the German webshop.
Liquidation of subsidiaries
Along with the closure of our Italian office in Q1 2018, the service entity pannolini.it S.r.l. was deregistered as of December 31, 2018. After
transferring local Swiss functions to the headquarter in 2017, the service entity windeln.ch AG was filed for liquidation in August 2018, however,
the deregistration will be completed only in 2019.

Group management report
Annual Report 2018
32
2.4. Net assets, financial position and results of operations of windeln.de Group
2.4.1. Results of operations
Konzern Gewinn- und Verlustrechnung
Change
kEUR 2018 2017 R
absolute
in kEUR
relative
in %
Continuing operations
Revenues 104,818 188,332 -83,514 -44%
Cost of sales -79,151 -140,206 61,055 -44%
Gross profit 25,667 48,126 -22,459 -47%
Selling and distribution expenses -44,751 -62,089 17,338 -28%
Administrative expenses -8,626 -20,377 11,751 -58%
Other operating income 954 708 246 35%
Other operating expenses -806 -649 -157 24%
Earnings before interest and taxes (EBIT) -27,562 -34,281 6,719 -20%
Financial income 26 1,135 -1,109 -98%
Financial expenses -29 -54 25 -46%
Financial result -3 1,081 -1,084 -100%
Earnings before taxes (EBT) -27,565 -33,200 5,635 -17%
Income taxes 446 2,954 -2,508 -85%
Profit or loss from continuing operations -27,119 -30,246 3,127 -10%
Profit or loss from discontinued operations -10,573 -7,573 -3,000 40%
PROFIT OR LOSS FOR THE PERIOD -37,692 -37,819 127 0%
Unless stated otherwise, the following explanations relate solely to continuing operations, i. e. without Feedo Group. Feedo Group was sold as
of August 24, 2018; its results of operations is presented in the line “profit or loss form discontinued” operations” and comprises the period
from January 1 to August 24, 2018.
In 2018, the Group generated revenues of EUR 104,818k, a decrease of 44% compared to the prior year. The decrease stems mainly from the
GSA region (-45%) and China (-46%), the decrease in the region “rest of Europe” was merely lower with -38%.
Revenue reductions in the regions GSA and Europe are primarily results of the strategy changes implemented in 2018:
• Focusing on the existing markets by expanding the customer base, enhancing the product offering and increasing order volume.
• Improvement of operational processes in order to improve the shopping experience of our customers as well as to increase sustainable
profitability.
In this context, the Italian webshop www.pannolini.it was closed in Q1 2018; and the number of countries of delivery was reduced. Additionally,
the assortment was reduced by low-margin products with direct impact on revenues.
Other than in Europe, the revenue reduction in China was driven by external factors on which windeln.de had only little influence. Since mid
of February 2018, an excess supply of milk powdered products in the Chinese market made leading suppliers change their products and recipe
formulas. Additionally, in Q2 2018 Chinese customs authorities have increased their inspections temporarily at one customs point. Therefore,
delivery times for direct shipments have increased by four to eight weeks which made many Chinese customers cancel their orders. Both events
lead to a general uncertainty in the Chinese market with direct impact on revenues in the region.
The margin (gross profit as % of revenues) decreased in 2018 by 1.1pp to 24.5%, which results mainly from the above mentioned
cancellations of Chinese orders. The cancelled orders – mainly milk formula products – had already left our warehouse and therefore had to
be scrapped as they had become unsellable after shipping. The margin development throughout the year was very volatile. It dropped from
24.0% in the first quarter to 22.2% in the third quarter, while increasing to 27.7% in the fourth quarter. We see this development as a result of
the implemented strategy changes and focus on margins, that materializes with a time delay and is going to positively continue in the future.
The product portfolio was gradually expanded by the high-profit categories dietary supplement, cosmetics and partnership. The Group aims
at increasing its popularity to become a provider for all family needs.

Group management report
Annual Report 2018
33
Selling and distribution expenses decreased in 2018 by EUR 17,338k or 28%. Major savings were achieved in logistics (decrease by
EUR 10,127k or 41%) and marketing (decrease by EUR 3,975k or 44%). The savings almost fully correspond to the decreased order volume. In
relation to revenues, marketing costs are almost unchanged to the prior year; logistics however have increased slightly because the Group
could not decrease its partially fixed cost base (e. g. warehouse expenses) after the unplanned drop in Chinese order volume. The
implementation of a Chinese warehouse had positive impacts on the logistics expenses. The majority of Tmall orders were delivered out of
that bonded warehouse. Furthermore, expenses for payment providers decreased by EUR 1,171k or 43%, also a result of the lower order
volume.
External service – mainly for IT development – have decreased by EUR 1,019k or 48%, which is a consequence of the general cost savings and
“insourcing” of development services. Personnel expenses within selling and distribution expenses decreased by 8%, in 2018 they include on-
time costs from severances and continued pay from the lay-off of employees.
The increase in depreciation expenses within selling and distribution expenses by EUR 1,871k or 32% results from impairments of domains,
and is a one-time effect. The annual impairment test performed on November 30, 2018, lead to an impairment expense within selling and
distribution expenses of EUR 6,571k, thereof EUR 4,681k for the domains bebitus.com/es and EUR 1,890k for the domain bebitus.fr. Another
impairment was recorded for the goodwill Bebitus that is recognized within administrative expenses. The impairments reflect the current
strategy change with focus on profitable markets but lower growth expectations.
Administrative expenses have decreased in 2018 by EUR 11,751k or 58%. This results mainly from share-based compensation expenses from
acquisitions which amounted to EUR 7,819k in 2017, but had no comparative expense in 2018. Disregarding that one-time effect, administrative
expenses decreased by 31% in almost each sub-category in this function. Personnel expenses (without the above mentioned one-time effect)
decreased by EUR 2,713k (38%), legal and consulting expenses by EUR 559k (40%) and recruiting expenses by EUR 359k (94%). Impairment of
goodwill Bebitus amounts to EUR 420k and is also recognized within administrative expenses.
Other operating income increased in 2018 by EUR 246k or 35% to EUR 954k. The main position is foreign exchange income, which increased
by EUR 193k. For the first time, we had revenues from the sale of packaging material to vendors of EUR 77k, which are not part of our ordinary
business and were therefore recognized as other operating income. Other operating expense increased in 2018 by EUR 157k or 24%. This
line items includes expenses from the sale of packaging material to vendors in the amount of EUR 68k.
As a result of the above mentioned developments, Earnings before interest and taxes (EBIT) changed in 2018 by EUR 6,719k or 20% to
minus EUR 27,562k. The significant cost savings achieved in selling and administrative functions could not fully set off reductions in revenues,
therefore EBIT as % of revenues decreased by 8.1pp to -26.3%
The financial result amounts to EUR 3k and comprises interest and other financial expenses. The prior year had one-time effects from the
remeasurement of derivates from the acquisition of Bebitus.
The tax benefit of EUR 446 results mainly from the release of deferred tax liabilities in connection with domain impairments.
The result of Feedo Group is recognized as discontinued operation as a separate line item in the income statement. During the period
January 1 to August 24, 2018, Feedo Group had incurred operating losses of EUR 2,816k. The divestiture lead to an additional loss of
EUR 7,758k that comprises following positions:
• Derecognition of the disposal group’s carrying amount EUR 9,518k
• Derecognition of accumulated foreign exchange differences EUR 252k
• Sales price (income) EUR 400k
• Tax benefit from release of deferred taxes EUR 1,612k
Financial key performance indicators
As described in note 1.4 “Management system”, the financial key performance indicators of the Group consist of revenues, operating
contribution as percentage of revenues, adjusted EBIT as percentage of revenues and Group cash flow. The development of revenues is
described in the paragraph above. The development of operating contribution as percentage of revenues is described in note 2.5 “Other
financial performance indicators”. The Group cash flow is decribed in note 2.4.2 "Financial position”.
For the purposes of managing the Group, earnings before interest and taxes (EBIT) are adjusted for expenses and income in connection with
share-based compensation, reorganization measures, impairments of intangible assets and income and expenses of the closed shop
pannolini.it. In 2017, expenses for the integration of subsidiaries were adjusted.

Group management report
Annual Report 2018
34
Change
kEUR 2018 2017 R
absolute
in kEUR
relative
in %
Earnings before interest and taxes (EBIT) -27,562 -34,281 6,719 -20%
adjusted for costs of acquisition, integration and expansion - 90 -90 -100%
adjusted for share-based compensation -321 8,231 -8,552 <-100%
adjusted for costs of reorganization 1,584 94 1,490 >100%
adjusted for closure of pannolini.it 778 - 778 -
adjusted for impairments of intangible assets 6,991 4,547 2,444 54%
Adjusted EBIT -18,530 -21,319 2,789 -13%
Adjusted EBIT improved from minus EUR 21,319k to minus EUR 18,530k, which results mainly from revenue reductions. Adjusted EBIT as
percentage of revenues feel from -11.3% in 2017 to -17.8% in 2018. This stems from lower gross margins caused by one-time effects in China,
and proportionally higher administrative and selling expenses, because the Group could not decrease its partially fixed cost base (e. g.
warehouse expenses) after the unplanned drop in Chinese order volume.
In the Annual Report 2017, revenues were forecasted to growth on the level of 2017, which – disregarding Feedo Group – was 7%. This target
was not achieved with an actual revenue decrease of 77%
Additionally, in the Annual Report 2017, the Group had forecasted a clear improvement of operating contribution and adjusted EBIT in
percentage of revenues. As a result of the above mentioned revenue decreases and margin deterioration, this forecast was not achieved.
Non-financial key performance indicators
The non-financial key performance indicators comprise the number of active customers, average number of orders per active customer,
average order value and the share of repeat customer orders.
For the average order value, management had forecasted a significant increase in its Annual Report 2017. The share of repeat customers was
forecasted at the same level as 2017. Actually, the share of repeat customers increased from 76.6% to 82.2% which reflects the current strategy
change to profitable repeat customers. However, the average order value decreased by EUR 2.40 or 2% to EUR 90.47; the outlook was not met.
Two non-financial performance indicators, number of active customers and number of orders per active customers, are not planned as these
performance indicators are reactive. Historical data is only evaluated for these performance indicators in order to derive responses based on
specific developments. Therefore, no outlook was provided in 2017.
Regional results of operations
Change
kEUR 2018 2017 R
absolute
in kEUR
relative
in %
Revenues from continuing operations 104,818 188,332 -83,514 -44%
Germany, Switzerland, Austria (GSA) 24,212 44,187 -19,975 -45%
China 56,737 105,628 -48,891 -46%
Other / Rest of Europe 23,869 38,517 -14,648 -38%
The development of revenues per region can be found in the explanations on revenues.
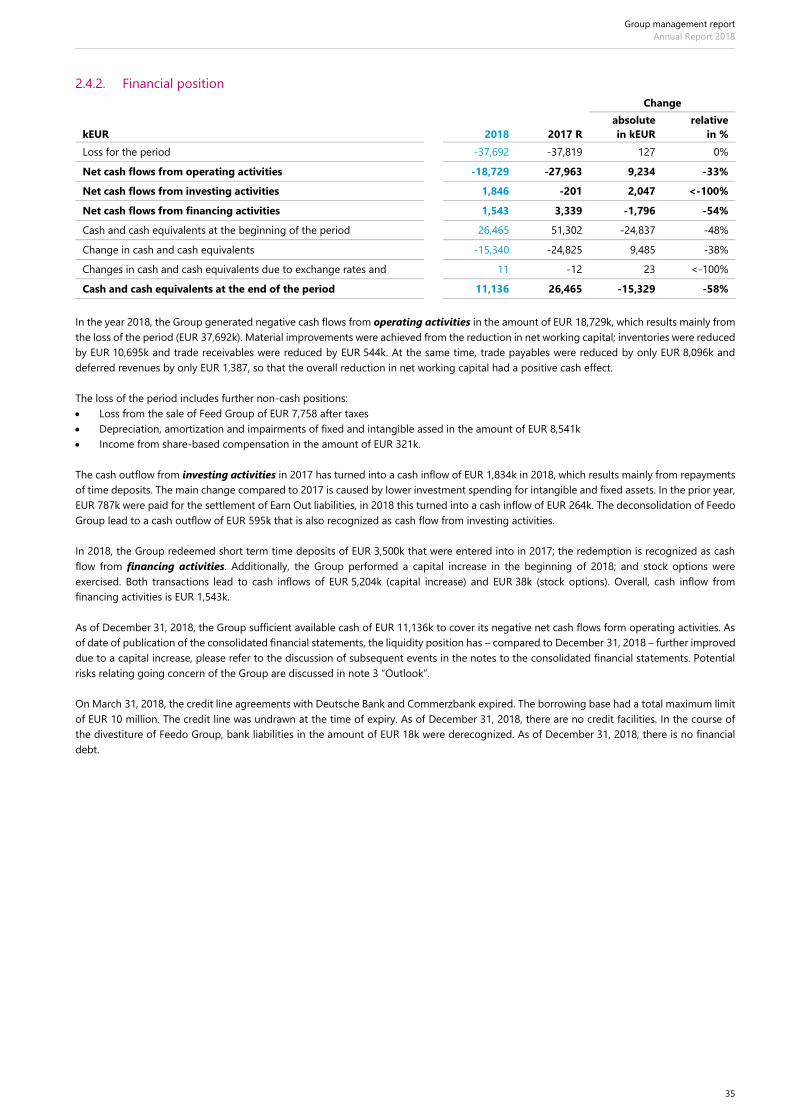
Group management report
Annual Report 2018
35
2.4.2. Financial position
Change
kEUR 2018 2017 R
absolute
in kEUR
relative
in %
Loss for the period -37,692 -37,819 127 0%
Net cash flows from operating activities -18,729 -27,963 9,234 -33%
Net cash flows from investing activities 1,846 -201 2,047 <-100%
Net cash flows from financing activities 1,543 3,339 -1,796 -54%
Cash and cash equivalents at the beginning of the period 26,465 51,302 -24,837 -48%
Change in cash and cash equivalents -15,340 -24,825 9,485 -38%
Changes in cash and cash equivalents due to exchange rates and 11 -12 23 <-100%
Cash and cash equivalents at the end of the period 11,136 26,465 -15,329 -58%
In the year 2018, the Group generated negative cash flows from operating activities in the amount of EUR 18,729k, which results mainly from
the loss of the period (EUR 37,692k). Material improvements were achieved from the reduction in net working capital; inventories were reduced
by EUR 10,695k and trade receivables were reduced by EUR 544k. At the same time, trade payables were reduced by only EUR 8,096k and
deferred revenues by only EUR 1,387, so that the overall reduction in net working capital had a positive cash effect.
The loss of the period includes further non-cash positions:
• Loss from the sale of Feed Group of EUR 7,758 after taxes
• Depreciation, amortization and impairments of fixed and intangible assed in the amount of EUR 8,541k
• Income from share-based compensation in the amount of EUR 321k.
The cash outflow from investing activities in 2017 has turned into a cash inflow of EUR 1,834k in 2018, which results mainly from repayments
of time deposits. The main change compared to 2017 is caused by lower investment spending for intangible and fixed assets. In the prior year,
EUR 787k were paid for the settlement of Earn Out liabilities, in 2018 this turned into a cash inflow of EUR 264k. The deconsolidation of Feedo
Group lead to a cash outflow of EUR 595k that is also recognized as cash flow from investing activities.
In 2018, the Group redeemed short term time deposits of EUR 3,500k that were entered into in 2017; the redemption is recognized as cash
flow from financing activities. Additionally, the Group performed a capital increase in the beginning of 2018; and stock options were
exercised. Both transactions lead to cash inflows of EUR 5,204k (capital increase) and EUR 38k (stock options). Overall, cash inflow from
financing activities is EUR 1,543k.
As of December 31, 2018, the Group sufficient available cash of EUR 11,136k to cover its negative net cash flows form operating activities. As
of date of publication of the consolidated financial statements, the liquidity position has – compared to December 31, 2018 – further improved
due to a capital increase, please refer to the discussion of subsequent events in the notes to the consolidated financial statements. Potential
risks relating going concern of the Group are discussed in note 3 “Outlook”.
On March 31, 2018, the credit line agreements with Deutsche Bank and Commerzbank expired. The borrowing base had a total maximum limit
of EUR 10 million. The credit line was undrawn at the time of expiry. As of December 31, 2018, there are no credit facilities. In the course of
the divestiture of Feedo Group, bank liabilities in the amount of EUR 18k were derecognized. As of December 31, 2018, there is no financial
debt.
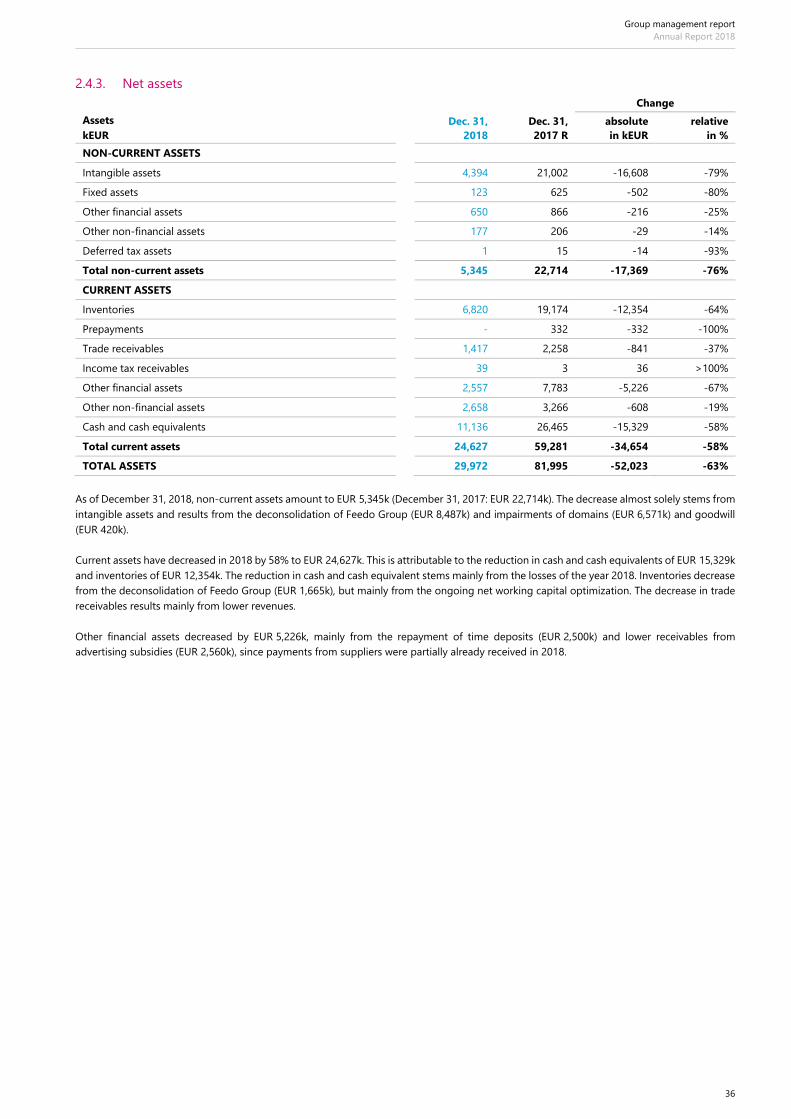
Group management report
Annual Report 2018
36
2.4.3. Net assets
Change
Assets
kEUR
Dec. 31,
2018
Dec. 31,
2017 R
absolute
in kEUR
relative
in %
NON-CURRENT ASSETS
Intangible assets 4,394 21,002 -16,608 -79%
Fixed assets 123 625 -502 -80%
Other financial assets 650 866 -216 -25%
Other non-financial assets 177 206 -29 -14%
Deferred tax assets 1 15 -14 -93%
Total non-current assets 5,345 22,714 -17,369 -76%
CURRENT ASSETS
Inventories 6,820 19,174 -12,354 -64%
Prepayments - 332 -332 -100%
Trade receivables 1,417 2,258 -841 -37%
Income tax receivables 39 3 36 >100%
Other financial assets 2,557 7,783 -5,226 -67%
Other non-financial assets 2,658 3,266 -608 -19%
Cash and cash equivalents 11,136 26,465 -15,329 -58%
Total current assets 24,627 59,281 -34,654 -58%
TOTAL ASSETS 29,972 81,995 -52,023 -63%
As of December 31, 2018, non-current assets amount to EUR 5,345k (December 31, 2017: EUR 22,714k). The decrease almost solely stems from
intangible assets and results from the deconsolidation of Feedo Group (EUR 8,487k) and impairments of domains (EUR 6,571k) and goodwill
(EUR 420k).
Current assets have decreased in 2018 by 58% to EUR 24,627k. This is attributable to the reduction in cash and cash equivalents of EUR 15,329k
and inventories of EUR 12,354k. The reduction in cash and cash equivalent stems mainly from the losses of the year 2018. Inventories decrease
from the deconsolidation of Feedo Group (EUR 1,665k), but mainly from the ongoing net working capital optimization. The decrease in trade
receivables results mainly from lower revenues.
Other financial assets decreased by EUR 5,226k, mainly from the repayment of time deposits (EUR 2,500k) and lower receivables from
advertising subsidies (EUR 2,560k), since payments from suppliers were partially already received in 2018.

Group management report
Annual Report 2018
37
Change
Equity and liabilities
kEUR
Dec. 31,
2018
Dec. 31,
2017 R
absolute
in kEUR
relative
in %
EQUITY
Issued capital 31,136 28,472 2,664 9%
Share premium 170,391 168,486 1,905 1%
Accumulated loss -181,119 -143,427 -37,692 26%
Cumulated other comprehensive income 186 -298 484 <-100%
Total equity 20,594 53,223 -32,639 -61%
NON-CURRENT LIABILITIES
Defined benefit obligations and other accrued employee benefits - 51 -51 -100%
Other provisions 2 5 -3 -60%
Financial liabilities 15 59 -44 -75%
Other financial liabilities 21 59 -38 -64%
Deferred tax liabilities - 2,115 -2,115 -100%
Total non-current liabilities 38 2,289 -2,251 -98%
CURRENT LIABILITIES
Other provisions 235 315 -80 -25%
Financial liabilities 39 3,575 -3,536 -99%
Trade payables 4,573 14,779 -10,206 -69%
Deferred revenues 1,581 3,057 -1,476 -48%
Income tax payables 2 2 - -
Other financial liabilities 2,335 3,055 -720 -24%
Other non-financial liabilities 575 1,690 -1,115 -66%
Total current liabilities 9,340 26,473 -17,133 -65%
TOTAL EQUITY AND LIABILITIES 29,972 81,995 -52,023 -63%
The equity position has decreased by EUR 32,639k, mainly from the loss of the period. In Q1 2018, a capital increase was performed leading
to an equity increase of EUR 5,204k. In Q2 2018, stock options were exercised leading to an equity increase of EUR 37k. For both transactions,
expenses of EUR 164k were recognized in equity. The equity quota increased from 64.9% as of December 31, 2017, to 68.7% as of December 31,
2018. The main reason is the fully redemption of financial debt that amounted to EUR 3,528k in the prior year.
Non-current liabilities have become immaterial; in the prior year they almost solely comprised deferred tax liabilities on domains and customer
bases of Feedo (EUR 1,641) and on domains of Bebitus (EUR 474). Deferred taxes relating to Feedo were deconsolidated as of August 24, 2018;
deferred taxes relating to Bebitus were derecognized in the course of impairments of the underlying domains.
Current liabilities have decreased by EUR 17,333k. The details are:
• As of December 31, 2017, financial liabilities included short-term money market loans of EUR 3,500k that were fully redeemed in early
2018. Another EUR 9k of financial debt of Feedo Group were deconsolidated. As of December 31, 2018, financial liabilities (short-term
and long-term) solely consist of finance lease liabilities. With the adoption of the new leasing standard IFRS 16, this position will increase
by EUR 1,110k (thereof EUR 618k current financial liabilities).
• From total trade payables, a number of EUR 2,067k was deconsolidated for Feedo Group. The remaining reduction results from lower
purchase volumes and the general optimization of the product mix.
• Deferred revenues contain mainly delivery obligations to customers whose parcels have not yet arrived at their destination on the closing
day December 31, 2018. Along with the overall revenue reduction in 2018, this position decreases accordingly.
• Non-financial liabilities decrease for social security liabilities (EUR 342k) as a consequence of lower headcount as of year-end 2018.
Additionally, VAT liabilities have decreased (EUR 773k) along with the overall revenue reduction.

Group management report
Annual Report 2018
38
2.4.4. Net overall statement
The business year 2018 was coined by extensive restructuring measures in order to increase efficiency, decrease costs and improve margins.
This comprises the streamlining of organizational structures, cost savings at the headquarter in Germany and focusing of international activities
on regions with short-term and mid-term profitability potential. In this context we have closed our webshop pannolini.it and our Italian office
in Q1 2018. The divestiture of Feedo Group was finalized in August 2018. Furthermore, cost cutting measures were implemented that will show
their partial or full effects only in future. The strategy was adjusted and aims at an even stronger focus on profitability. In order to achieve that
target, revenue reductions were unavoidable. Operating contribution and adjusted EBIT as percentage of revenues show clear improvements
compared to the prior year. Also, cash outflows and the amount of net working capital could be successfully reduced.
Overall, the business year 2018 was not satisfactory. Although selling and administrative expenses could by reduced significantly and margins
in the European business were notably improved, revenues targets – especially in the Chinese market – could not be met due to one-time
effects.
Therefore, a capital increase was performed in February 2019 that was completed on March 14, 2019 by registration in the commercial register,
and had a gross proceed of EUR 10.1m.
2.5. Other financial performance indicators
2018 2017 R Change
Adjusted marketing cost ratio (as % of revenues) 4.8% 4.8% -
Adjusted fulfilment cost ratio (as % of revenues) 16.3% 14.9% 1.4pp
Adjusted other SG&A expenses (as % of revenues) 21.6% 17.1% 4.4pp
Operating contribution (as % of revenues) 3.8% 5.8% -2.0pp
In the consolidated income statement, marketing costs are recognized within selling and distribution expenses. Marketing costs mainly consist
of advertising expenses, including search engine marketing, online display and other marketing channel expenses, as well as costs for the
marketing tools of the Group. Marketing expenses incurred in the shop pannolini.it are adjusted until the shop’s closure. In 2018, adjusted
marketing costs amounted to EUR 4,964k (2017: EUR 9,026k). We define adjusted marketing cost ratio as adjusted marketing costs divided by
revenues for the measurement period. The adjusted marketing cost ratio is unchanged to the prior year.
Fulfilment costs consist of logistics and warehouse rental expenses which are recognized within selling and distribution expenses in the
consolidated income statement. Fulfilment expenses incurred in the shop pannolini.it are adjusted until the shop’s closure. In 2017, costs
related to the closure of the Swiss location and income from the release of provisions for onerous contracts are adjusted. We define adjusted
fulfilment cost ratio as adjusted fulfilment costs divided by revenues.
Change
kEUR 2018 2017 R
absolute
in kEUR
relative
in %
Logistics 14,473 24,600 -10,127 -41%
Warehouse rent 2,645 3,443 -798 -23%
Fulfilment costs 17,118 28,043 -11,925 -39%
Adjustments -173 95 -268 <-100%
Adjusted fulfilment costs 16,945 28,138 -11,193 -40%
Adjusted fulfilment cost ratio (as % of revenues) 16.3% 14.9%
Adjusted fulfilment cost ration amounts to 16.3% in the business year 2018 compared to 14.9% in 2017. This results partially from the fact that
the Group could not decrease its partially fixed cost base (e. g. warehouse expenses) after the unplanned drop in Chinese order volume.
Other selling, general and administration expenses (other SG&A expenses) consist of selling and distribution expenses, excluding marketing
costs and fulfilment costs, and administrative expenses as well as other operating income and expenses. Adjusted other SG&A expenses
exclude expenses from share-based compensation, reorganization measures, impairments of intangible assets and income and expenses
incurred in the shop pannolini.it until the shop’s closure. Furthermore, expenses for the integration of subsidiaries were adjusted in the business
year 2017. We define adjusted other SG&A Expenses (in % of revenues) as adjusted other SG&A expenses divided by revenues.

Group management report
Annual Report 2018
39
Change
kEUR 2018 2017 R
absolute
in kEUR
relative
in %
Selling and distribution expenses (w/o marketing and fulfilment costs) 22.582 25,020 -2.438 -10%
Administrative expenses 8.626 20,377 -11.751 -58%
Other operating income -954 -708 -246 35%
Other operating expenses 806 649 157 24%
Other SG&A expenses 31.060 45,338 -14.278 -31%
Adjustments -8.593 -13,044 4.451 -34%
Adjusted other SG&A expenses 22.467 32,294 -9.827 -30%
Adjusted other SG&A expenses (as % of revenues) 21,6% 17.1%
Adjusted other SG&A expenses as percentage of revenue amount to 21.6% compared 17.1% in the prior year. Although expenses could be
reduced in absolute numbers by EUR 9,8247k or 30% (mainly personnel expenses EUR 4,528k, external services EUR 1,269k, payment service
providers EUR 1,171k), other SG&A expenses did not decrease to the same extent as revenues.
We define operating contribution as adjusted gross profit excluding marketing costs and adjusted fulfilment costs. The adjustments of gross
profit relate to income and expenses of the shop pannolini.it until the shop’s closure, and expenses for share-based compensation.
Change
kEUR 2018 2017 R
absolute
in kEUR
relative
in %
Gross profit 25,667 48,126 -22,459 -47%
Adjustments 179 13 166 >100%
Adjusted gross profit 25,846 48,139 -22,293 -46%
Marketing costs -4,964 -9,026 4,062 -45%
Adjusted fulfilment costs -16,945 -28,138 11,193 -40%
Operating contribution 3,937 10,975 -7,038 -64%
Operating contribution (as % of revenues) 3.8% 5.8%
Operating contribution in the year 2018 is EUR 3,937k or 3.8% of revenues, and thus decreased both in absolute numbers and as percentage
of revenues. This results from the overall revenue decrease. The reason for the decrease of operating contribution as percentage of revenues
are cancellations in the Chinese business (with impact on gross margin) and higher proportional fulfilment costs that could not be decreased
to the same extent as revenues.
2.6. Other non-financial performance indicators
2018 2017 R Change
Site visits 41,362,953 75,807,122 -34,444,169
Mobile visit share (as % of site visits) 72.4% 72.6% -0.2pp
Mobile orders (as % of number of orders) 55.4% 49.8% 5.6pp
Number of orders 1,114,873 1,911,928 -797,055
Gross order intake (in EUR) 100,858,453 177,554,077 -76,695,264
Returns (as % of gross revenues from orders) 3.6% 3.2% 0.4pp
The number of site visits decreased by 45% compared to the prior year and is in line with the overall revenue decrease that is described in the
paragraphs above. Number of orders decreased had a lower decrease of 42% which results from an improved conversion rate. Gross order
intake decreases by 43%, slightly more than the number of orders. One of the reasons is a decrease in the average order value.

Group management report
Annual Report 2018
40
3. Outlook
The positive development in online retail is expected to progress further in the future. The turnover in online retail in Europe is expected to
reach approximately EUR 343bn in 2019 and until 2023, a predicted compound annual growth rate of 6.3% is expected.34 The total market
volume of the strongly growing Chinese cross-border e-commerce market is expected to reach approximately EUR 670bn in 2019 and until
2023, a predicted compound annual growth rate of 10.1% is expected.35 The online retail for products for babies and toddlers, and also
products in the categories of beauty culture and dietary supplement, is an important growth segment in these markets.
The restructuring measurements executed in 2018 shall be consequently monitored in 2019 and, if necessary, shall be implemented further in
order to improve efficiency of the organization and thereby realize profitable and sustainable growth.
After the restructuring year 2018, focus will be on the Group’s long-term performance in financial year 2019. Furthermore, focus points will be
profitable revenue growth and optimization of margin. It will be specifically invested in the Chinese market. In addition, new product categories
shall be developed in order to position windeln.de as global “family business” in Europe and China.
Management expects a clear revenue increase compared to 2018. Management expects a stable average order value compared to 2018. The
repeat customer share will likely decrease below the level of 2018 because of new customer growth. Two non-financial performance indicators,
number of active customers and number of orders per active customer, are not planned anymore as these performance indicators are reactive
measurement drivers. Historical data is only evaluated for these performance indicators in order to derive responses based on specific
developments.
Special focus of the Group is on achieving profitability and the securing sufficient liquidity. Therefore, management expects a clear
improvement of the operating contribution margin in % of revenues. Adjusted EBIT in % of revenues shall be further improved in 2019. Also,
cash-outflow shall be clearly reduced compared to 2018. For 2019, a moderate increase of net working capital is planned in order to enable
growth of Chinese business. Achieving break even on basis of adjusted EBIT is expected at the beginning of 2020.
Risks relating going concern of the Group
As of December 31, 2018, the Group shows EUR 11,136k cash and therefore sufficient cash is available to cover the net operating cash outflow.
As of the date of the preparation of the consolidated financial statements, the position of liquidity has further improved compared to
December 31, 2018, through the executed capital increase (refer to explanations in subsequent events in the notes to the consolidated financial
statements). With the capital increase, the Group has realized gross proceeds in the amount of EUR 10.1m; and thus could significantly
strengthen its liquidation position.
The Group is subject to material uncertainties regarding the achievement of planned increases in revenues and margins as well as further
planned cost decreases whose occurrence is mandatorily necessary to ensure the achievement of a positive net cashflow. In the area of revenue
increase, further growth is planned in China. Among other things it is planned to develop new channel of distributions and to expand the
product assortment. Uncertainty exists relating to planned projects which might be delayed in time, which might not be realized in the planned
scope, or which might not happen at all. Margin increases are planned basically in the European business. Therefore, different measurements
are planned, among other things further improved supplier conditions, an improved automated pricing tool (which is mostly already
implemented), an improved product mix as well as the expansion of the private label business with in average higher margins. Uncertainty
exists relating to the enforcement of improved supplier conditions, the impact of the pricing tool as well as the enforceability of the private
label strategy. Additional liquidity is planned by the refund of German value added tax for deliveries via freight forwarders to China (refer to
explanations in the opportunities and risk report). Management evaluates the refund as highly probable, however, there is uncertainty on the
timing of the refund. A big driver related to cost decreases is the opening of a second warehouse in China from which our Chinese webshop
shall be served amongst other. A contract with an external warehouse provider is signed already, but uncertainty exists regarding possible
timing delays of the project.
The management board addresses the described uncertainties with various measurements in the previous paragraph. Thus, a dedicated project
management is implemented to regularly monitor, to control and, if necessary, to initiate countermeasures for all envisaged projects and
measurements. As outlined above, in the first quarter 2019 a capital increase was successfully executed. In the context of the capital increase,
two new Asian investors, from whom the management expects positive effects in relation to the Chinese business, have joined the owners of
the Group. In this regard, first discussions are ongoing. Last but not least, management expects to improve supplier conditions through the
continuous dialog with credit insurers. In addition, management invests in relationship to debt providers.
Above that, in order to proactively manage the net working capital, management intensively focuses to further continue the measurements
regarding the improvement of the net working capital, which already took positive effects in 2018.
34 Destatis Statistisches Bundesamt: https://de.statista.com/outlook/243/102/ecommerce/europa; retrieved on February 16, 2019 35 Destatis Statistisches Bundesamt: https://de.statista.com/outlook/243/117/ecommerce/china; retrieved on February 16, 2019

Group management report
Annual Report 2018
41
Achieving break even on basis of adjusted EBIT is planned for the beginning of 2020. In case the planned projects and restructuring
measurements cannot be implemented in the full extend or do not lead to the expected outcome, the solvency of the Group and the
continuation of operations depends – until a positive net cashflow is achieved in 2020 – on the Group’s ability to collect further liquidity funds,
e. g. via a further equity financing round or via raise of borrowed capital.
4. Opportunities and risk report
The risk management system of the windeln.de Group has been implemented in order to identify and evaluate opportunities and risks at the
earliest possible date. The objective of the risk management system is to proactively manage risks and thereby limit economic losses as well
as to recognize and utilize potential opportunities by using improved corporate decision-making.
4.1. Risk management process
Organization and responsibility
The risk management process is based on a lean organizational structure with clear roles and responsibilities.
• Pursuant to Sec. 91 (2) German Stock Corporations Act (AktG), the management board of windeln.de SE installed a group-wide risk
management system. The management board sets the Group’s risk strategy and approves the corresponding risk management structures
and processes.
• The supervisory board ensures the effectiveness of the risk management system in place as part of its role to supervise the management
board.
• The management board is supported by the risk management committee. This committee consists of the heads of the individual business
divisions and functions and is responsible for enhancing and adapting the risk management system.
• Risks and opportunities are identified and evaluated locally in each business unit by the heads of the individual business divisions and
functions. However, each employee is obliged to report any potential risks to the respective head of division.
• The identified risks and opportunities are reviewed as to whether they are still up-to-date on a biannual basis and are then reported to
the risk management officer who is part of the group controlling division. The risk management officer prepares a risk portfolio, which is
then submitted to the risk management committee and the management board. The risk management officer is also responsible for the
central coordination of the risk management process and supports the heads of each division with the evaluation of their respective risks.
• The installation and adequacy of the risk early warning system is checked by the external auditor. No material findings were made in this
respect.
Instruments
• The Group wide risk policy, which has been defined by the management board of windeln.de SE and is available to all employees of the
Group, serves as a guideline for dealing with risks and opportunities within the Group. Besides of information about the individual steps
of the risk management process, the policy also includes information about roles and responsibilities in risk management process. The
contents of the guideline are reviewed regularly and changed as necessary to guarantee it remains up-to-date on account of the rapidly
changing environment.
• A catalog with various risk categories has been drawn up and shall help to identify all possible risks.
• A standardized report file is used in order to guarantee consistent capture and evaluation of the individual risks and opportunities.
Furthermore, corresponding countermeasures which reduce the individual risks are mentioned in this file as well.
• The opportunities and risks of each department and business unit are reviewed as to whether they are still up-to-date on a biannual basis
and newly identified opportunities and risks are added to the report file. Risks are quantified using a rolling evaluation for the following
36 months from the time of remeasurement, although the given period for assessing the extent of damage and the probability of
occurrence is 12 months.
• Each risk is assessed in a gross assessment and in a net assessment. In the net assessment the already implemented countermeasures of
each risk are considered and reduce the extent of damage and the occurrence probability of the respective gross risk.
• The identified risks are subsequently reported to the management board in full detail. However, new risks with a certain extent of damage
are reported directly to the management board using a standard file as an immediate report.
• A workshop is held on a regular basis under the direction of the risk management officer and with all responsible heads of division in
order to perform an in-depth evaluation of whether all captured risks are up-to-date and to identify any risks that have not yet been
recognized.

Group management report
Annual Report 2018
42
4.2. Overview of risks
Any event that may negatively influence the Group’s ability to achieve its operational or strategic objectives is classified as a risk. By contrast,
any opportunity is anything that represents a positive deviation from the planned operational and strategic objectives.
Differentiation is made between event and planning risks so as to be able to appropriately capture and measure the risks of the windeln.de
Group. Event risks are stated with both their extent of damage and their probability of occurrence, as this type of risk generally relates to non-
recurring risks with a low occurrence probability. On the other hand, planning risks result from extremely volatile budget items and therefore
have a high probability of occurrence. As a result of this, the focus when evaluating these risks is exclusively on their extent of damage. The
strong volatility may, however, also mean that a planning risk results in a positive deviation from the target and therefore represents an
opportunity for the Group.
Risks are broken down using the following classes in the risk matrix:
Classes for probability of occurrence for event risk
Class Probability of occurrence Description
1 0% - 4.9% Occurrence possible once in 100 to 20 years
2 5% - 19.9% Occurrence possible once in 20 to 5 years
3 20% - 29.9% Occurrence possible once in 5 to 3 years
4 30% - 49.9% Occurrence possible once in 3 to 2 years
5 50% - 100% Occurrence possible at least once in 2 years
The extent of damage describes the worst-case scenario each risk could have on the Group’s earnings before interest and taxes. EBIT is a
significant factor for the cash requirements of the Group. Therefore, the following risk assessment is also a significant indicator for the liquidity
risk of the Group. Please refer to section 6.4 “Liquidity risk” for further information.
Classes for extent of damage for event and planning risks
Class Extent of damage Description
1 EUR 0.05m - EUR 0.5 m low impact
2 > EUR 0.5 m - EUR 1.0 m medium impact
3 > EUR 1.0 m - EUR 2.0 m high impact
4 > EUR 2.0m critical impact

Group management report
Annual Report 2018
43
The following risk matrices are the result of the aforementioned classes for probability of occurrence, which is only relevant for event risks,
and extent of damage in the net assessment:
4.3. Overall assessment of the risk and opportunities situation in the Group
The Group sees significant risks, in particular with regard to macroeconomic development in the People’s Republic of China and with regard
to the development of the competitive situation in the Chinese market.
In this context, risks related to the planned offering of new distribution channels for Chinese customers and the Group’s dependency on key
suppliers for milk formula products is one of the biggest risks for the Group. By establishing a strong partnership with its key suppliers, the
Group seeks to reduce this risk. However, a deterioration of supplier conditions could have a strong negative impact on the Group’s result.
With the postponed break even outlook announced in 2018, liquidity risks have significantly increased. The Group has set up various measures
in 2018, and plans to take further measures in 2019, such as obtaining liquidity funds through equity or debt instruments.
Liquidity risks are detailed in section 6.4 ”Liquidity risk”, and the corresponding risks relating the going concern of the Group are discussed in
section 3 “Outlook”.
4.3.1. Strategic risk
Macroeconomic risks
The Group’s development greatly depends on the general economic situation in Europe and the People’s Republic of China. A period of
economic recession could negatively impact purchasing behavior in several product categories and result in revenue losses and higher stock
levels. In particular, a deterioration of the Chinese economy could have negative consequences on account of the great significance of the
Chinese sales market for windeln.de Group. However, it is assumed that demand for products for babies and toddlers will continue, even in
the event of a recession.
New laws for exports of baby food could also significantly harm the business in China. As possible changes in the Chinese law are difficult to
predict and due to the high importance of Chinese market for the Group, the risk is regarded as high.
A continuous monitoring of these risks as well as offering new sales channels such as the Tmall shop, where the Chinese customers can buy in
local currency, contribute to a reduction of the aforementioned risks. The Group is constantly working on identifying further countermeasures
in order to actively steer those risks. Nevertheless, the Group expects an increased extent of damage if the risk would occur and hence, the
risk is deemed to be high.

Group management report
Annual Report 2018
44
Competitive risks
The Group is exposed to fierce competition. New competitors in the market may cause a decline in the price level as well as higher costs for
online marketing. These would have a negative effect on revenue and even more on margins. Consequently, a decreasing demand could
impact the Group’s earnings and liquidity and might also lead to overstocks in the warehouses. By establishing a strong partnership with its
suppliers the Group tries to offer its customers an ideal range of baby and toddler products and in this way reduces the potential risk resulting
from competition. Moreover, the Group is also expanding its sales and distribution channels and has established an own Chinese warehouse
(Bonded Warehouse) to further invest in the Chinese market. Compared to the previous year, the risk assessment remains unchanged and is
deemed to be high.
Risks resulting from expansion activities
After the divestiture of Feed Group in 2018 and the full integration of the Bebitus business end of 2017, risks from expansion activities are
assessed as low.
4.3.2. Opportunities and risks from operations
Supplier and product quality risks
As the Group is dependent on a limited number of suppliers, in particular for baby nutrition and diapers, it is subject to the risk that suppliers
default or offer their products under deteriorate conditions. This would have a negative effect on revenues and in particular on product
margins. If the Group is able to purchase goods from its suppliers at particularly favorable conditions, this would have a positive influence on
the business result and consequently, will lead to an opportunity for the Group. The Group attempts to minimize the aforementioned risk by
establishing long-term and strong business relationships with reliable and well established suppliers. In case of a risk occurrence, the Group
expects an unchanged extent of damage compared to previous year. Due to the low occurrence probability the risk is deemed to be medium.
A failure in the estimation of order quantities is another risk for the Group. This could either lead to a high proportion of sold out products or
to overstocks in the warehouse. If the overstock consists of difficult to sell products this could lead to a higher inventory valuation allowance
which would have a negative impact on the operating result. Overall, the risk is assessed as low. However, if the inventory valuation allowance
could be reduced in the future due to new developments such as an improved inventory management, this would have a positive effect on
the Group’s result. Thus, a potential reduction of the inventory valuation allowance might also represent a great opportunity for the Group.
IT risks
If the Group is no longer able to operate, maintain, integrate and scale the mobile and network infrastructure and other technology, this could
have a substantial negative impact on the business as well as on the financial performance and position. In particular, the stability and
availability of online platforms as well as IT security with regard to customer data but also confidential corporate data could have negative
consequences for the business. The continuous functionality of internal technical systems and databases also plays a significant role for this
risk. The Group reduces this risk by investing in different systems and processes. Overall, the Group sees a medium risk.
Logistic and payment risks
The Group’s own warehouse and the warehouse locations managed by contractual partners are exposed to the danger of being destroyed by
catastrophes such as fire or natural disasters. In addition to the loss of inventories and potential harm to employees, this would also lead to a
substantial interruption of business activities. If planned logistic projects cannot be realized or are delayed this could be a high risk for the
Group. The Group reduces this risk by detailed project management and ongoing identification of potential savings in the currently existing
logistic processes. Compared to the previous year the risk has increased and is estimated as a medium to high risk.
Personnel related risks
The Group depends on key employees in management. Losing one of these employees would have correspondingly negative effects on the
economic success. The Group counters this risk by installing remuneration models with a long-term focus. Furthermore, a higher than expected
employee illness and turnover rate could lead to additional costs. After the developments in the past year, the occurrence probability has
increased, and the risk is deemed to be high.
4.3.3. Financial risks
As an international company, the Group is subject to various tax and customs regulations. The risk relates to delivery of products to other
countries and the corresponding country-specific VAT calculation using the local VAT rates. If this is calculated incorrectly or wrong customs
duties are declared, additional late payment penalties and fines may be issued. By implementing new data management processes in the
respective systems (ERP system, product management system) the Group was already able to significantly reduce the risk. The risk is deemed
to be low.

Group management report
Annual Report 2018
45
A high chance may arise from possible VAT corrections for deliveries to China that were made through so-called freight forwarders.
windeln.de SE has declared and paid VAT for those transactions. Based on delivery documents, a classification as tax-free export delivery and
a VAT refund are possible.
After the impairment expenses recognized in 2018 for goodwill and domains, potential future impairments represent a minor risk to the Group.
Under some circumstancesc a potential write-brack of the domains could also be a opportunity for the Group.
Last year’s risks from increased subsequent purchase price payments do not exist as of December 31, 2018. However, there is a risk that the
agreed purchase price for the divestiture of Feedo Group of EUR 400k may not be paid. The Group assesses that risk as low.
4.3.4. Legal and organizational risks
The Group is exposed to various national and international legislation and requirements at various levels as a result of the international
expansion and the IPO in 2015. This primarily relates to consumer protection law and competition law. In order to meet all requirements and
obligations, individuals have been made responsible and corresponding processes have been established to monitor all relevant developments
in the Group. Overall, the legal and organizational risks are estimated to be a medium risk which have increased compared to the previous
year due to new data protection guidelines.
The Group is subject to various risks in direct connection with the IPO. As a result of this, windeln.de SE took out the corresponding insurance
during the IPO. This risk is classified as medium on account of the critical extent of damage but the very low probability of occurrence.
Due to the necessary cost savings in human resources, the Group is continuously faced with the challenge to implement and improve internal
processes.
5. Internal controls and risk management systems of the Group financial reporting process
The objective of the internal control system and the risk management system in terms of the group financial reporting process is to identify,
evaluate and control any risks that could influence the correct preparation of the consolidated financial statements. As a core component of
the group financial reporting process, the internal control system comprises preventive, monitoring and detective security and control
measures that ensure a proper financial reporting process in group accounting and operating functions.
The Group sets itself apart through its clear organizational structure. There are coordinated planning, reporting and early warning systems and
processes throughout the Group that enable overarching analysis and management of risk factors of relevance to the results of operations
and going concern risks. The functions throughout the group financial reporting process are distinctly allocated.
The IFRS consolidated financial statements and group management report are prepared centrally using a uniform reporting format at the
group headquarters in Munich. A standard software that is protected from unauthorized access has been implemented across the Group. The
methods provided by the system to limit access rights are used to map the various responsibilities. The group headquarters defines binding
reporting calendars and issues uniform reporting structures that generally serve to safeguard completeness and comparability. There is a
standardized group chart of accounts which aims to ensure that the same issues are presented consistently. Currency translation, the
consolidation of income and expenses and the elimination of intercompany balances are performed automatically. Any offsetting differences
are automatically posted in the system, but checked manually and adjusted if necessary. The automatic validation processes in place and the
additional analytical plausibility checks, which are performed regularly, guarantee the correctness and completeness of the consolidated
financial statements of windeln.de SE. Corporate issues are analyzed, assessed and recorded for accounting purposes by the local finance
teams as well as by employees in group accounting department and therefore included in external financial reporting. External accounting
specialists are consulted if necessary. The exercise of accounting and measurement options is coordinated by the local finance entities with
the group accounting in order to ensure a uniform and proper financial reporting in accordance with IFRSs throughout the Group. The
allocation of sufficient personnel and material resources to group accounting form the basis for the efficiency of the divisions and personnel
working on the financial reporting.
A Group-wide risk management system that corresponds to the legal requirements is in place and is reviewed on an ongoing basis in terms
of its functionality and adapted to current developments if necessary. Its purpose is to identify and evaluate risks at an early stage, and
communicate them appropriately. This ensures that users of the report receive relevant and reliable information without delay.
The review mechanisms clearly defined within the areas assigned to group accounting as well as the inspection by the internal controlling
division and the risk management system’s early recognition of risk aim to ensure error-free group financial reporting.
The Group places a strong emphasis on employing highly qualified and experienced employees in the key accounting and risk management
positions. The lingua franca of the Group is English, to ensure there are no translation or communication difficulties between entities in different
countries.

Group management report
Annual Report 2018
46
On account of the small size and low level of complexity, the Group has not had a separate internal audit department to date and makes use
of internal employees for review purposes.
The supervisory board concerns itself with material accounting, risk management, audit engagement and audit focus questions, among other
things.
There were no changes to the financial reporting internal control system or risk management system between the end of the reporting period
and the date of preparing the group management report.
6. Financial risk management and financial instruments
6.1. Risks from the use of financial instruments
The Group is exposed to various financial risks (the market price risk, comprising currency and interest rate risk, the credit risk and the liquidity
risk) on account of its business activities. The Group’s risk management system focuses on the unpredictability of developments on financial
markets and aims at minimizing potential adverse effects on the financial position of the Group.
Risk management is performed by the corporate finance department. As in the prior year, a Risk Coordinator assumes that function as part of
Group Controlling department. Additionally, a function of treasury management has been set up. Both the Risk Coordinator and the Head of
Treasury identify and assess financial risks in close cooperation with the Group’s operating units. The management board prescribes the
principles for Group-wide risk management. Additionally, the board decides on policies for certain risks, such as foreign currency, interest rate
and credit risks, and for the use of equity or debt instruments and the use of derivative and non-derivative financial instruments.
In 2017, Feedo Group concluded derivatives in the form of forward exchange transactions for the first time to minimize currency risks. Since
the divestiture of Feedo Group in 2018, the Group has not had transactions with derivative financial instruments.
6.2. Market risk
Market risk is the risk that the fair value of future cash flows of a financial instrument will fluctuate because of changes in market prices. Market
risks include interest rates, currency and other price risks.
Currency risk
The Group’s international activities expose it to foreign currency risks. The risk mainly relates to revenue generated in foreign currency as well
as goods purchased in foreign currency. For example, if a devaluation is performed on the functional currency, the acquisition cost for goods
purchased in foreign currency increase, and the revenue translated into the functional currency generally also increases at the same time. The
two effects counterbalance each other, meaning that there is only a currency risk if goods are purchased in one currency and sold in another.
This is particularly relevant for sales in the webshops windeln.ch (in CHF) and our Tmall shop (in CNY). Along with the centralization of
procurement, logistics, marketing and administrative functions of the Group, cost of sales and operating expenses for those shops are incurred
mainly in EUR. Foreign exchange risks arising from that setup are currently not hedged. However, an upvaluation of the functional currencies
may lead to a chance from currency risks.
On account of exchange rate fluctuations when translating the local separate financial statements into the group currency, a currency risk can
also arise if there are changes to items in the statement of financial position and income statement of a subsidiary. The changes caused by
currency fluctuations are presented in equity. The windeln.de Group is currently exposed to such a risk at three of its subsidiaries, it is estimated
to be low.
Interest rate risk
Interest rate fluctuations may have a negative or positive impact on the business result, equity and the future cash flows. Interest rate risks
from financial instruments can be incurred particularly in connection with borrowings.
6.3. Credit risk
Credit risk, otherwise known as default risk, is the risk that a counterparty will not meet its obligations under a financial instrument or customer
contract, leading to a financial loss. The credit risk comprises the total of trade receivables, other financial assets and cash and cash equivalents.
The risk is particularly relevant in terms of a potential default of trade receivables. For this reason, credit limits are established for all customers
based on internal rating criteria. Trade receivables arising in connection with the “buy on account” transactions are sold to a third party as they
arise; therefore the Group has no default risk for those transactions. All outstanding receivables are monitored on a regular basis and are

Group management report
Annual Report 2018
47
subject to a three-tier dunning procedure. In order to reduce the risk, specific bad debt allowances and allowance for expected credit losses
are recognized, based on the age structure of the trade receivables. Overdue and unsuccessfully dunned receivables are submitted to a service
provider. Uncollectible amounts are fully derecognized with an effect on income.
In addition, there is a default risk for cash and cash equivalents and for time deposits if banks can no longer meet their obligations. This credit
risk is mitigated by spreading deposits between a number of banks with good credit ratings. The windeln.de Group considers the overall risk
to be very low.
6.4. Liquidity risk
Liquidity risk is the risk that the Group will potentially not be able to settle its financial liabilities when they fall due. An efficient liquidity
management system is therefore used to guarantee that the Group is solvent at all times. The Group monitors the risk of liquidity bottlenecks
continuously using liquidity planning prepared at group level.
As of December 31, 2018 and as of the publication date of the consolidated financial statement, there is no liquidity shortfall for the Group. A
delay of the strategic measures initiated in 2018, the occurrence of risk factors as presented in opportunities and risks report as well as a
deviation from the business plan in 2018 could result in a material deterioration of the liquidity situation of the Group. Depending on the
course of business, the Group may require to take up additional liquidity funds until the achievement of positive cash flows, e. g. through
equity or debt instruments in order to ensure solvency and to have a sufficient liquidity buffer. We refer to section 3 “Outlook” with its
descriptions about risks relating going concern of the Group.
7. Takeover related disclosures pursuant to Secs. 289a (1) and 315a (1)
7.1. Composition of issued capital
The Company’s capital stock came to EUR 31,136,470 as of December 31, 2018. The capital stock is divided into 31,136,470 no-par value bearer
shares with an imputed share in the capital stock of EUR 1.00 per share. The shares are fully paid in. All shares have the same rights and duties
attached. Every share has one vote.
7.2. Participations in the capital, which exceed 10% of the voting rights
As of the end of the financial year 2018, there were the following direct and indirect participations in the capital of windeln.de SE that exceeded
the threshold of 10% of the voting rights:
Direct investments
Acton GmbH & Co Heureka KG Munich Germany
MCI.PrivateVentures Fundusz Inwestycyjny Zamkniety Warsaw Poland
Indirect investments
DN Capital (UK) LLP London United Kingdom
DN CAPITAL - GLOBAL VENTURE CAPITAL II LP St. Helier Jersey, Channel Islands
DN CAPITAL - GLOBAL VENTURE CAPITAL III LP St. Helier Jersey, Channel Islands
DN CAPITAL - GVC GP LP St. Helier Jersey, Channel Islands
DN CAPITAL - GVC II GENERAL PARTNER (JERSEY) LIMITED St. Helier Jersey, Channel Islands
DN CAPITAL - GVC III GENERAL PARTNER LIMITED St. Helier Jersey, Channel Islands
DN CAPITAL - GVC III GP LP St. Helier Jersey, Channel Islands
Acton Capital Partners GmbH Munich Germany
MCI Capital Towarzystwo Funduszy Inwestycyjnych Spolka Akcyjna Warsaw Poland
Private Equity Managers Spółka Akcyjna Warsaw Poland
Group management report
Annual Report 2018
48
7.3. Statutory regulations and provisions of the articles of incorporation and bylaws concerning the
appointment and removal from office of management board members, and concerning modifications to
the articles of incorporation and bylaws
The supervisory board appoints the members of the management board on the basis of Art. 9 (1) and Art. 46 of the SE regulation (SE-
Verordnung), Secs. 84 and 85 AktG and Sec. 6 (3) of the articles of incorporation and bylaws for a term of office of maximum five years. In
accordance with Art. 6 (1) of the articles of incorporation and bylaws, the management board comprises one or more persons, otherwise the
supervisory board determines the number of members of the management board.
The general meeting adopts resolutions on changes to the articles of incorporation and bylaws. The amendments to the articles of
incorporation and bylaws are made pursuant to Secs. 179 and 133 AktG. According to Sec. 10 (5) of the articles of incorporation and bylaws,
the supervisory board is entitled to make changes and additions to the articles of incorporation and bylaws that only relate to the wording.
Pursuant to Sec. 4 (2) and (3) of the articles of incorporation and bylaws, the supervisory board is also entitled to change and rewrite Sec. 4 of
the articles of incorporation and bylaws (capital stock) as necessary depending on the utilization of authorized or contingent capital.
7.4. Authority of the management board to issue shares or acquire treasury shares
Repurchase of treasury shares
By resolution of the General Meeting on April 21, 2015, and confirmation of continued validity after the change of legal structure to a SE by
the annual general meeting as of June 17, 2016, the management board was authorized, subject to the approval of the supervisory board, to
acquire treasury shares for any permissible purpose up until April 20, 2020 in a scope of up to 10% of the capital stock existing either as of the
date on which the resolution is passed or as of the date on which the authorization is exercised, whichever is lower. The shares acquired may
not at any time amount to more than 10% of capital stock when taken together with other treasury shares held by the Company or allocable
to the Company in accordance with Secs. 71d, 71e AktG. The authorizations can be granted once or several times, in whole or in partial
amounts, in pursuit of one or several objectives by the Company, but also by Group entities or by third parties on behalf of the Company or
Group entities. Among other things, the purchase of treasury shares is permissible for the following purposes: for withdrawal purposes, to
offer to third parties in the course of business combinations or acquisitions and to be used as a component of variable remuneration and/or
in connection with share-based payment or stock option programs of the Company or entities affiliated to it.
The management board was also authorized, subject to the approval of the supervisory board, to use certain derivatives to acquire windeln.de
shares by April 20, 2020. All acquisitions of shares using these derivatives are limited to shares representing no more than 5% of the capital
stock existing as of the date on which the resolution is passed by the General Meeting, although the 10% limit of the aforementioned
authorization to purchase treasury shares applies to acquisitions of shares using derivatives. The term of a derivative has to be defined that
the shares are not acquired using the derivative after April 20, 2020.
Authorized Capital 2018/1
The management board is authorized, subject to the approval of the supervisory board, to raise the capital stock once or several times up until
June 24, 2023 by up to a total of EUR 15,500,000 by issuing new no-par value bearer shares in return for cash or non-cash contributions and,
subject to the approval of the supervisory board, to preclude the shareholders’ subscription rights under certain conditions and within defined
limits (authorized capital 2018). In the German commercial register, the authorized capital as of June 25, 2018, is named Authorized capital
2018/I.
Conditional Capital 2016/I
By resolution of the general meeting dated April 21, 2015, and confirmation of continued validity after the change of legal structure to a SE
by the annual general meeting as of June 17, 2016, the management board was authorized, subject to the approval of the supervisory board,
to issue by April 20, 2020 once or several times bearer convertible bonds and/or options, profit participation rights and/or bonds or a
combination of these instruments with a total nominal amount of up to EUR 300,000,000 and grant the owners and creditors of these bonds
with options and conversion rights on (also with conversion or option obligation) into new bearer shares in the Company with an imputed
share in the capital stock of up to EUR 7,997,804 in accordance with the conditions of the bonds. Among other things, the management board
was also authorized, subject to the approval of the supervisory board, to preclude the shareholders’ subscription rights to bonds with
convertible or warrant bonds into shares in windeln.de SE under certain conditions and within defined limits. The capital stock was contingently
increased accordingly by up to EUR 7,997,804 (conditional capital 2015/I). This authorization to issue bonds has not yet been exercised. In the
German commercial register, the conditional capital as of June 17, 2016, is named conditional capital 2016/I.
Conditional Capital 2016/II
The Company’s capital stock has been increased contingently by up to EUR 555,206 by the issue of up to 555,206 new shares (contingent
capital 2015/II). The contingent capital increase will only be conducted to a limited extent and serves exclusively to fulfil options that are issued
on account of the General Meeting dated April 21, 2015 (confirmation of continued validity after the change of legal structure to a SE by the

Group management report
Annual Report 2018
49
Annual General Meeting as of June 17, 2016) that authorized the granting of stock options to members of the management board and
employees of the Company in accordance with the long-term incentive program 2015. In the German commercial register, the conditional
capital as of June 17, 2016, is named conditional capital 2016/II.
Conditional capital 2018/I
The Company’s capital stock has been increased contingently by up to EUR 1,200,000 by the issue of up to 1,200,000 new shares (contingent
capital 2018). The contingent capital increase will only be conducted to a limited extent and serves exclusively to fulfil options that are issued
on account of the general meeting dated June 25, 2018 that authorized the granting of stock options to members of the management board
and employees of the Company in accordance with the long-term incentive program 2018. In the German commercial register, the conditional
capital as of June 25, 2018, is named conditional capital 2018/I.
7.5. Significant agreements of the Company that are subject to a change of control
None of the significant agreements of the Company are subject to a condition of a change of control of the Company.
Company compensation agreements that have been entered into with management board members or employees for the event of
change of control following a takeover bid
The supervisory board and/or management board are entitled under the Long-Term Incentive Programme (LTIP) granted to certain members
of the management board and of other management staff to demand the pro rata reversal of the outstanding options earned in accordance
with the change of control event of the share purchased by the purchaser in return for a payment by the Company. In relation to the stock
options not yet earned as of the date of the change of control, the supervisory board is authorized at its own discretion to grant different
performance-based remuneration of the same economic value in return for reversal of the stock options of the LTIP (including share
appreciation rights, phantom stocks or other stock options).
8. Corporate governance statement
The corporate governance statement pursuant to Sec. 289f HGB is available on the Company’s website (https://corporate.windeln.de) in the
Investor Relations tab. It is also part of the corporate governance report, which is part of the annual report.
9. Remuneration report
Please refer to section 13.3 Remuneration report of the notes for further information on the remuneration of the management board and the
supervisory board according to Sec. 315a (2) German Commercial Code (HGB).
Munich, March 15, 2019
windeln.de SE
Management board
Matthias Peuckert Dr. Nikolaus Weinberger

Annual Report 2018
50
FINANCIAL STATEMENTS

Financial statements
Annual Report 2018
51
CONSOLIDATED INCOME STATEMENT AND OTHER COMPREHENSIVE INCOME
kEUR Notes 2018 2017 R
Continuing operations
Revenues 9.1 104,818 188,332
Cost of sales 9.2 -79,151 -140,206
Gross profit 25,667 48,126
Selling and distribution expenses 9.2 -44,751 -62,089
Administrative expenses 9.2 -8,626 -20,377
Other operating income 9.1 954 708
Other operating expenses 9.2 -806 -649
Earnings before interest and taxes (EBIT) -27,562 -34,281
Financial income 9.3 26 1,135
Financial expenses 9.3 -29 -54
Financial result -3 1,081
Earnings before taxes (EBT) -27,565 -33,200
Income taxes 8.12 446 2,954
Profit or loss from continuing operations -27,119 -30,246
Profit or loss after taxes from discontinued operations 3.4 -10,573 -7,573
PROFIT OR LOSS FOR THE PERIOD -37,692 -37,819
Other comprehensive income that will not be reclassified to profit or loss in subsequent
periods:
Actuarial gains or losses from remeasurement of defined benefit plans 8.8 - -11
Other comprehensive income that may be reclassified to profit or loss in subsequent periods:
Exchange differences on translation of foreign operations 11.1 484 -54
OTHER COMPREHENSIVE INCOME OR LOSS, NET OF TAX 484 -65
TOTAL COMPREHENSIVE INCOME OR LOSS, NET OF TAX -37,208 -37,844
Basic earnings per share (in EUR) 9.4 -1.22 -1.41
Basic earnings per share from continuing operations (in EUR) 9.4 -0.88 -1.13
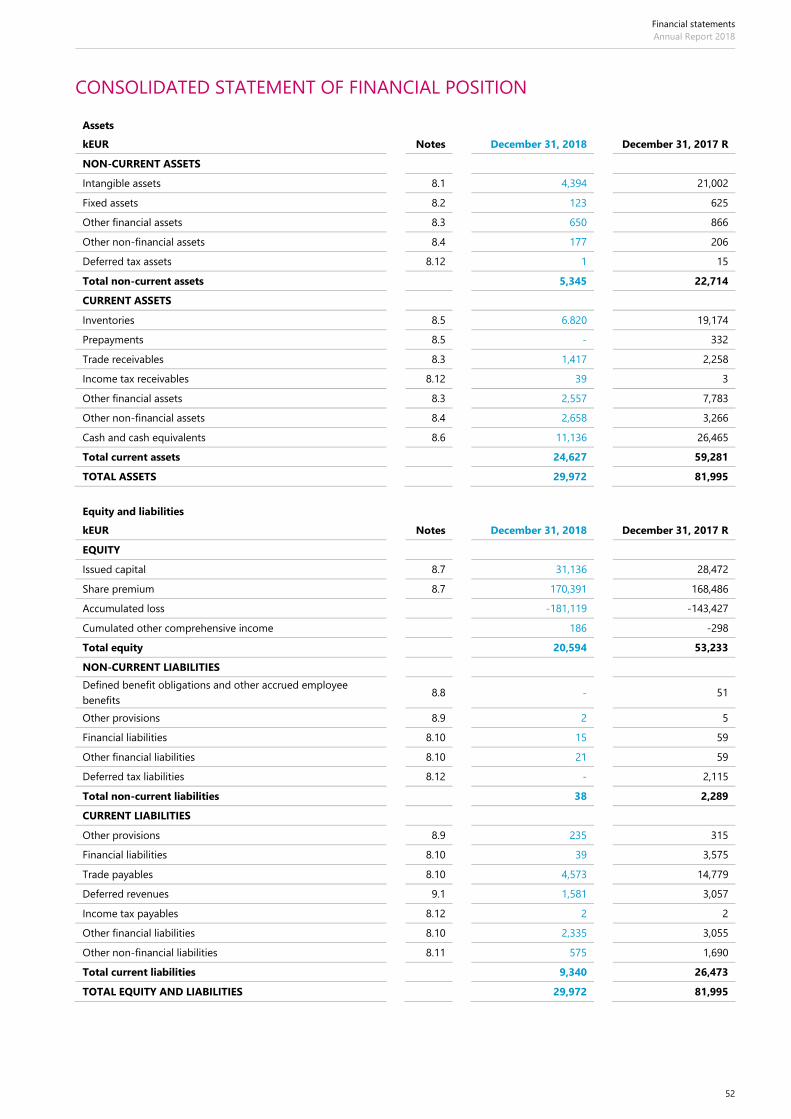
Financial statements
Annual Report 2018
52
CONSOLIDATED STATEMENT OF FINANCIAL POSITION
Assets
kEUR Notes December 31, 2018 December 31, 2017 R
NON-CURRENT ASSETS
Intangible assets 8.1 4,394 21,002
Fixed assets 8.2 123 625
Other financial assets 8.3 650 866
Other non-financial assets 8.4 177 206
Deferred tax assets 8.12 1 15
Total non-current assets 5,345 22,714
CURRENT ASSETS
Inventories 8.5 6.820 19,174
Prepayments 8.5 - 332
Trade receivables 8.3 1,417 2,258
Income tax receivables 8.12 39 3
Other financial assets 8.3 2,557 7,783
Other non-financial assets 8.4 2,658 3,266
Cash and cash equivalents 8.6 11,136 26,465
Total current assets 24,627 59,281
TOTAL ASSETS 29,972 81,995
Equity and liabilities
kEUR Notes December 31, 2018 December 31, 2017 R
EQUITY
Issued capital 8.7 31,136 28,472
Share premium 8.7 170,391 168,486
Accumulated loss -181,119 -143,427
Cumulated other comprehensive income 186 -298
Total equity 20,594 53,233
NON-CURRENT LIABILITIES
Defined benefit obligations and other accrued employee
benefits 8.8 - 51
Other provisions 8.9 2 5
Financial liabilities 8.10 15 59
Other financial liabilities 8.10 21 59
Deferred tax liabilities 8.12 - 2,115
Total non-current liabilities 38 2,289
CURRENT LIABILITIES
Other provisions 8.9 235 315
Financial liabilities 8.10 39 3,575
Trade payables 8.10 4,573 14,779
Deferred revenues 9.1 1,581 3,057
Income tax payables 8.12 2 2
Other financial liabilities 8.10 2,335 3,055
Other non-financial liabilities 8.11 575 1,690
Total current liabilities 9,340 26,473
TOTAL EQUITY AND LIABILITIES 29,972 81,995

Financial statements
Annual Report 2018
53
CONSOLIDATED STATEMENT OF CASH FLOWS
kEUR Notes 2018 2017 R
Profit or loss for the period -37,692 -37,819
Amortization (+) / impairment (+) of intangible assets 8.1 8,289 11,738
Depreciation (+) / impairment (+) of fixed assets 8.2 252 427
Payments (-) from share-based payment obligations 6 - -176
Increase (+) / decrease (-) in other provisions 8.9 -83 -189
Non-cash expenses (+) from employee benefits 8.8 -458 7,794
Other non-cash expense (+) / income (-) items 8,451 -227
Increase (-) / decrease (+) in inventories 8.5 10,695 2,575
Increase (-) / decrease (+) in prepayments 8.5 323 43
Increase (-) / decrease (+) in trade receivables 8.3 544 133
Increase (-) / decrease (+) in other assets 8.3, 8.4 2,523 117
Increase (+) / decrease (-) in trade payables 8.10 -8,096 -3,058
Increase (+) / decrease (-) in deferred revenues 9.1 -1,387 -1,506
Increase (+) / decrease (-) in other liabilities 8.10, 8.11 -1,557 -3,785
Gain (-) / loss (+) from disposal of intangible and fixed assets 8.1, 8.2 -34 36
Interest expenses (+) / income (-) 9.3 1 0
Income tax expenses (+) / income (-) 8.12 -453 -4,055
Income tax paid (-) / received (+) 8.12 -47 -11
Net cash flows from / used in operating activities -18,729 -27,963
Proceeds (+) from sales of intangible and fixed assets 8.1, 8.2 25 63
Purchase (-) of intangible assets 8.1 -285 -1,119
Purchase (-) of fixed assets 8.2 -86 -239
Purchase (-) or proceeds (+) from financial investments 8.3 2,500 1,875
Payments (-) or refunds (+) from acquisition of subsidiaries 6, 8.7 264 -787
Cash flows from divestiture of subsidiaries 3.4 -595 -
Interest received (+) 9.3 23 6
Net cash flows from / used in investing activities 1,846 -201
Proceeds (+) from issue of shares 8.7 5,242 -
Transaction cost (-) on issue of shares 8.7 -114 -96
Repayment (-) of finance lease liabilities 8.6, 10 -51 -66
Proceeds (+) from financial liabilities 8.6, 8.10 - 3,519
Repayment (-) of financial liabilities 8.6, 8.10 -3,509 -12
Interest paid (-) 9.3 -25 -6
Net cash flows from / used in financing activities 1,543 3,339
Cash and cash equivalents at the beginning of the period 8.6 26,465 51,302
Net increase / decrease in cash and cash equivalents -15,340 -24,825
Change in cash and cash equivalents due to foreign exchange rates 11 -12
Cash and cash equivalents at the end of the period 8.6 11,136 26,465

Financial statements
Annual Report 2018
54
CONSOLIDATED STATEMENT OF CHANGES IN EQUITY
kEUR Notes Issued capital Share premium Treasury shares
Accumulated
loss
Actuarial gains
or losses from
remeasurement
of defined
benefit pension
plans
Exchange
differences on
translation of
foreign
operations
Other
comprehensive
income or loss Total equity
As at January 1, 2018 R 28,472 168,486 - -143,427 3 -301 -298 53,233
Total comprehensive income or
loss of the period - - - -37,692 - 484 484 -37,208
Issue of share capital 8.7 2,664 2,577 - - - - - 5,241
Transfer of own shares - - - - - - - -
Transaction costs 8.7 - -164 - - - - - -164
Share-based payments 6, 8.8 - -508 - - - - - -508
As at December 31, 2018 31,136 170,391 - -181,119 3 183 186 20,594
As at January 1, 2017 R 26,318 159,993 -370 -105,608 14 -247 -233 80,100
Total comprehensive income or
loss of the period - - - -37,819 -11 -54 -65 -37,884
Issue of share capital 8.7 2,154 1,141 - - - - - 3,295
Transfer of own shares 8.7 - -370 370 - - - - -
Transaction costs 8.7 - -46 - - - - - -46
Share-based payments 6, 8.8 - 7,768 - - - - - 7,768
As at December 31, 2017 R 28,472 168,486 - -143,427 3 -301 -298 53,233

Financial statements
Annual Report 2018
55
NOTES TO THE CONSOLIDATED FINANCIAL STATEMENTS FOR THE FINANCIAL
YEAR FROM JANAURY 1 TO DECEMBER 31 2018
1. Corporate information
windeln.de SE (the “Company”) is a stock corporation under European law whose shares are publicly traded on the regulated market (Prime
Standard) of the Frankfurt Stock Exchange since May 6, 2015. The Company is entered in the commercial register at Munich local court under
HRB 228000. The registered offices of the Company are located at Hofmannstr. 51 in 81379 Munich, Germany.
windeln.de SE is the parent of the windeln.de Group (“windeln.de” or the “Group”). windeln.de SE and its subsidiaries are online retailers for
baby and toddler products with operations in Germany and other European countries as well as in China. Business activities are transacted
through the internet as well as a retail shop in Germany.
2. General principles
windeln.de SE is a parent company as defined by Sec. 290 German Commercial Code (HGB). Due to the issue of equity securities on the capital
market, windeln.de SE is obliged pursuant to Sec. 315e (1) HGB in conjunction with Article 4 of the Regulation of the European Parliament of
July 19, 2002, to prepare the Company’s consolidated financial statements in accordance with the International Financial Reporting Standards
(IFRS) as adopted in the EU. These consolidated financial statements for the financial year 2018 were prepared in accordance with the IFRSs
and Interpretations of the IFRS IC as well as the supplementary provisions of Sec. 315e (1) HGB.
The consolidated financial statements take into account all IFRSs endorsed as of the end of the reporting period and whose adoption is
mandatory in the European Union. Compliance with the standards and interpretations gives a true and fair view of the financial performance
and position of windeln.de.
The management board prepared the consolidated financial statements on March 15, 2019, and thus approved them for publication as defined
by IAS 10. The consolidated financial statements and the group management report are submitted to and published in the Bundesanzeiger
(German Federal Gazette). The Company’s supervisory board has the authority to amend the consolidated financial statements.
3. Basic accounting policies
3.1 Basis of presentation
The consolidated financial statements are prepared on the assumption of the entity’s ability to continue as a going concern. Material
uncertainties related to events or conditions that may cast significant doubt upon the entity’s ability to continue as a going concern are
disclosed in note 3 “Outlook” in the Group Management Report. The consolidated financial statements are generally prepared on the basis of
accounting for assets and liabilities at amortized cost, with certain financial assets and financial liabilities measured at fair value through profit
or loss. Assets and liabilities are accounted for using the disclosure and measurement rules in the relevant IAS or IFRS, which are explained in
detail in notes 8 through 10.
The statement of comprehensive income was prepared using the function of expense method and is presented in two related statements.
The statement of financial position is classified based on the maturities of assets and liabilities. Assets that are sold, used in normal operations
or settled within twelve months are classified as current. Liabilities are current if they have to be settled within twelve months of the end of
the reporting period. Assets and liabilities with a maturity of more than one year are classified as non-current. Deferred tax assets and liabilities
are classified as non-current assets and liabilities pursuant to IAS 1.56.
The consolidated financial statements are prepared in Euro (EUR), which is both the functional currency and the reporting currency of
windeln.de SE. Unless otherwise indicated, all values in the notes to the consolidated financial statements are rounded to the nearest thousand
Euro (EUR k) in accordance with commercial practice.
Apart from abbreviated financial years due to the date of founding of the respective entity, the financial year corresponds to a calendar year
for all group entities.

Financial statements
Annual Report 2018
56
3.2 New accounting standards issued by the IASB
Pursuant to Regulation (EC) No. 1606/2002, the financial reporting standards issued by the IASB and endorsed by the European Commission
for adoption in the European Union are the basis for IFRS accounting. The new or revised IFRSs published by the IASB are subject to mandatory
application in the EU only after a corresponding decision has been made by the Commission in the endorsement procedure.
IFRS 9 Financial instruments
The standard was adopted in fiscal year 2018 under the full retrospective method with following impacts on the applied accounting policies:
Impairment of financial assets
Trade receivables of the windeln.de Group have no significant financing component and can therefore be assessed under the simplified
impairment model in IFRS 9, where the expected credit losses are recognized over the cumulated runtime. Expected impairments on trade
receivables are recognized when the original claim is incurred, and not when the claim actually becomes overdue.
The Group measures the expected credit loss upon a future expected aging and historic default quotas. All supportable information for a
retrospective remeasurement is available without undue cost and effort and without the use of hindsight. Therefore, windeln.de applies IFRS 9
retrospectively (see note 3.5).
Classification of financial assets
Until December 31, 2017, windeln.de categorized its debt instruments as loans and receivables (LaR) or as held-to-maturity investments (htm)
that are all measured at amortized cost. These debt instruments are measured at amortized cost under IFRS 9 because they are held with the
intention to generate contractual cash flows, that solely represent redemption and interest payments.
windeln.de sells receivables from customers to third parties on a regular basis. The derecognition of the original receivable and the recognition
of the new receivable from third parties happens simultaneously at the time of origination. Therefore, at no balance sheet date, there are trade
receivables designated for sale to third parties. The business model to sell customer receivables to third parties (factoring) has no impact on
the cash flow conditions introduced by IFRS 9.
Equity instruments are of immaterial amount. Until December 31, 2017, they were categorized as available-for-sale financial assets (afs) but
recognized at cost because they cannot be reliably measured. Also under IFRS 9, a measurement at fair value would be required, but continues
to be practically not possible. The FVOCI option is not be applied.
Until December 31, 2017, derivatives were of immaterial amount and – if they had a positive value as of the balance sheet date – were
categorized as assets held for trading (hft) as they were not designated as a hedging instrument in effective hedging relationships. Derivatives
do not fulfil the cash flow conditions introduced in IFRS 9, therefore they continue to be recognized at fair value through profit or loss under
IFRS 9.
New regulations on measurement of financial liabilities and accounting of hedging instruments are not applicable at windeln.de.
IFRS 2 Classification and Measurement of Share-based Payment Transactions
Additionally, the Group has adopted IFRS 2 “Classification and Measurement of Share-based Payment Transactions” which had no impact on
the Group’s net assets, financial position and results of operations.
The following standards and interpretations issued by the IASB have not yet been adopted because they have not yet been endorsed by the
EU and/or are not yet subject to mandatory application.
IFRS 16 Leases
Required effective date: January 1, 2019
Implementation progress and expected impacts on the consolidated financial statements are as follows:
The application of the new standard will affect leased items such as office and warehouse spaces and leased company cars if they exceed
terms of twelve months or quantitative threshold (net future lease payments) of EUR 5,000. Their recognition as “right-of-use” (formerly finance
lease) will result in a capitalization of that right of use, and simultaneously a capitalization of financial liabilities. windeln.de Group opts to
continue to recognize short-term and low-value lease agreements as “service leases” (formerly operating lease).

Financial statements
Annual Report 2018
57
The new standard will be adopted on January 1, 2019, using the retrospective modified method that allows to recognize all lease agreements
under IAS 17 as right-of-use assets in the sense of IFRS 16, irrespective of whether they had been previously classified as finance leases or
operating leases. windeln.de will apply the practical expedients and
• apply a single discount rate to a portfolio of leases, and
• exclude short-term and low-value lease agreements from capitalization.
The analysis of the Group’s lease agreements and their accounting treatment as of the effective date and for future periods has been
completed. Comparative periods are not restated; an adjustment to the opening balance is recognized instead. The adoption of IFRS 16 will
lead to following adjustments of the opening balances as of January 1, 2019:
kEUR
Measurement
pursuant to
IAS 17 as of
Dec. 31, 2018
Adoption of
IFRS 16
Measurement
pursuant to
IFRS 16 as of
Jan. 1, 2019
Fixed assets 123 1,057 1,180
Non-current financial liabilities 15 492 507
Current financial liabilities 39 618 657
Other non-current financial liabilities 21 -21 -
Other current financial liabilities 2,335 -32 2,303
The adoption of IFRS 16 will lead to additional net expenses of EUR 19k in fiscal year 2019, compared to the measurement pursuant to IAS 17;
the financial result will be impacted by additional expenses of EUR 69k, whereas earnings before interest and taxes (EBIT) will see cost
reductions of EUR 50k.
Annual improvements to IFRSs (2015-2017 cycle)
Required effective date: January 1, 2019
The application has no impact on the consolidated financial statements.
IFRIC 23 Uncertainty over Income Tax Treatment
Required effective date: January 1, 2019
The application has no impact on the consolidated financial statements.
3.3 Significant accounting judgements and estimates
The preparation of the consolidated financial statements requires management to make judgments, estimates and assumptions that affect the
reported amounts of income, expenses, assets and liabilities, and the disclosure of contingent liabilities, at the end of the reporting period.
The assumptions and estimates are based on premises that reflect the respective knowledge available at the time. The anticipated future
business development was assessed by reference to the circumstances prevailing at the time of preparing the consolidated financial statements
and the realistically assumed future development of the environment.
Uncertainty about these assumptions and estimates and the development of the framework conditions, which cannot be influenced by
management, could result in outcomes that require adjustments to the carrying amount of the asset or liability affected in future periods.
The key assumptions concerning the future and other key sources of estimation uncertainty at the end of the reporting period that have a
significant risk of causing a material adjustment to the carrying amounts of assets and liabilities within the next reporting period are described
in notes 8 through 10.

Financial statements
Annual Report 2018
58
3.4 Discontinued operations
Accounting policy
A discontinued operation is a component of the entity that has been disposed of or is classified as held for sale and that represents a separate
major line of business or geographical area of operations, is part of a single co-ordinated plan to dispose of such a line of business or area of
operations, or is a subsidiary acquired exclusively with a view to resale. The results of discontinued operations are presented separately in the
statement of comprehensive income.
Non-current assets (or disposal groups) are classified as held for sale if their carrying amount will be recovered principally through a sale
transaction rather than through continuing use and a sale is considered highly probable. They are measured at the lower of their carrying
amount and fair value less costs to sell, except for assets such as deferred tax assets, assets arising from employee benefits and financial assets.
An impairment loss is recognized for any initial or subsequent write-down of the asset (or disposal group) to fair value less costs to sell. A gain
is recognized for any subsequent increases in fair value less costs to sell of an asset (or disposal group), but not in excess of any cumulative
impairment loss previously recognized. A gain or loss not previously recognized by the date of the sale of the non-current asset (or disposal
group) is recognized at the date of derecognition.
Non-current assets (including those that are part of a disposal group) are not depreciated or amortized while they are classified as held for
sale. Interest and other expenses attributable to the liabilities of a disposal group classified as held for sale continue to be recognized.
Non-current assets classified as held for sale and the assets of a disposal group classified as held for sale are presented separately from the
other assets in the balance sheet. The liabilities of a disposal group classified as held for sale are presented separately from other liabilities in
the balance sheet.
Recognition in group financial statements
On July 20, 2018, windeln.de signed an agreement about the divestiture of Feedo Group – comprising the legal entities Feedo Sp. z o.o. located
in Warsaw, Poland, and MyMedia s.r.o. located in Prague, Czech Republic – with all assets (including domains) and liabilities to Dětská galaxie
s.r.o., a subsidiary of AGS 92 s.r.o. The agreement became effective on August 24, 2018. windeln.de receives a sales price of EUR 400k. The
sales price is due for payment two years after the closing conditions are met, and it is interest-bearing.
All closing conditions were fulfilled on August 24, 2018. On that day, windeln.de Group’s control over Feedo Group ended, resulting in the
deconsolidation of all assets and liabilities of the disposal group.
In addition, Feedo Group meets the requirement of a discontinued operation in accordance with IFRS 5. As a result, profit or loss of the Feedo
Group is presented in the separate position “Profit or loss after taxes from discontinued operations“ in the consolidated income statement.
Comparative periods were restated (also refer to note 3.5). The results of operations and financial position of discontinued operations are
outlined as follows:
kEUR 2018 2017
Discontinued operations
Revenues 14,103 23,567
Operating expenses -16,919 -32,774
Earnings before interest and taxes (EBIT) -2,816 -9,207
Profit or loss after interest and taxes -2,815 -7,573
Loss from divestiture of the disposal group before taxes -9,370 -
Attributable tax benefit 1,612 -
Profit or loss after taxes from discontinued operations -10,573 -7,573
Basic earnings per share from discontinued operations (EUR) -0.34 -0.28
Net cash flows:
Net cash flows used in operating activities -3,674 -3,254
Net cash flows used in investing activities -42 -94
Net cash flows from / used in financing activities -13 1

Financial statements
Annual Report 2018
59
The loss from divestiture of the disposal group calculates follows:
kEUR 2018 2017
Sales price 400 -
Carrying amount of the disposal group -9,518 -
Derecognition of cumulated foreign exchange differences -252 -
Loss from divestiture of the disposal group -9,370 -
The carrying amount of the disposal group as of the date of divestiture comprises:
kEUR
August 24,
2018
Intangible and fixed assets 8,802
Inventories and prepayments 1,665
Trade receivables 295
Other financial and non-financial assets 649
Cash and cash equivalents 595
Assets of the disposal group 12,006
Trade payables 2,067
Other financial and non-financial liabilities 421
Liabilities of the disposal group 2,488
Carrying amount of the disposal group 9,518
3.5 Restatements
In connection with the adoption of IFRS 9 (outlined in note 3.2), impairments of trade receivables were restated. The impact on the consolidated
statement of financial position is as follows:
kEUR
As presented
December 31,
2017
Adoption of
IFRS 9
Adjusted
December 31,
2017 R
Trade receivables 2,298 -40 2,258
Accumulated loss -143,387 -40 -143,427
Balance sheet total 82,035 -40 81,995
kEUR
As presented
January 1, 2017
Adoption of
IFRS 9
Adjusted
January 1,
2017 R
Trade receivables 2,508 -135 2,373
Accumulated loss -105,473 -135 -105,608
Balance sheet total 121,675 -135 121,540

Financial statements
Annual Report 2018
60
Due to the adoption of IFRS 9 and the discontinued operation (outlined in note 3.4), the consolidated income statement and other
comprehensive income of the year 2017 is restated as follows:
kEUR
As
presented
2017
Adoption of
IFRS 9
Discontinued
operations
Adjusted
2017 R
Revenues 211,899 - -23,567 188,332
Cost of sales -159,564 - 19,358 -140,206
Gross profit 52,335 - -4,209 48,126
Selling and distribution expenses -75,021 95 12,837 -62,089
Administrative expenses -21,421 - 1,044 -20,377
Other operating income 1,306 - -598 708
Other operating expenses -782 - 133 -649
Earnings before interest and taxes (EBIT) -43,583 95 9,207 -34,281
Financial income 1,673 - -538 1,135
Financial expenses -57 - 3 -54
Financial result 1,616 - -535 1,081
Earnings before taxes (EBT) -41,967 95 8,672 -33,200
Income taxes 4,053 - -1,099 2,954
Profit or loss from continuing operations -37,914 95 7,573 -30,246
Profit or loss after taxes from discontinued
operations - - -7,573 -7,573
PROFIT OR LOSS FOR THE PERIOD -37,914 95 - -37,819
OTHER COMPREHENSIVE INCOME OR LOSS,
NET OF TAX -65 - - -65
TOTAL COMPREHENSIVE INCOME OR LOSS,
NET OF TAX -37,979 95 - -37,884
Basic earnings per share (in EUR) -1.41 -1.41
Basic earnings per share from continuing
operations (in EUR) -1.41 -1.13
The tables in the presented consolidated financial statements are marked with “R” if the disclosed numbers were restated compared to the
last published consolidated financial statements as of December 31, 2017.
4. Segment reporting
An operating segment as defined by IFRS 8 is a component of an entity that engages in business activities from which it may earn revenues
and incur expenses, whose operating results are regularly reviewed by the entity’s chief operating decision maker to make decisions about
resources to be allocated to the segment and to assess its performance, and for which discrete financial information is available.
windeln.de Group sells baby, toddler and children’s products as an E-Commerce retailer. The product portfolio is homogenous in all sales
market. As an e-commerce retailer, the Group offers its products on the Internet regardless of the customer’s geographic location. Since the
abandonment of the Shopping Club business, a single Group-wide Ready to Ship business model is pursued. All shop are run on a uniform
technical platform, and all shops operated by the legal entity windeln.de SE. Essential management functions of the Group are centralized,
such as logistics, category management, operating procurement, marketing, customer service and administrative functions.
Since 2017, windeln.de is managed as a One-Segment-Group.
There are no individual customers with whom more than 10% of total revenue is recorded. The breakdown of revenue by country and product
group is explained in note 9.1.
Non-current assets in Germany amount to EUR 3,966k (December 31, 2017: EUR 11,437k), mainly domains in the amount of EUR 2,159k
(December 31, 2017: EUR 8,730k)
As of December 31, 2017, the Group held domains in the amount of EUR 8,620k in Poland. These assets were derecognized with the
deconsolidation of Feedo Group in 2018.
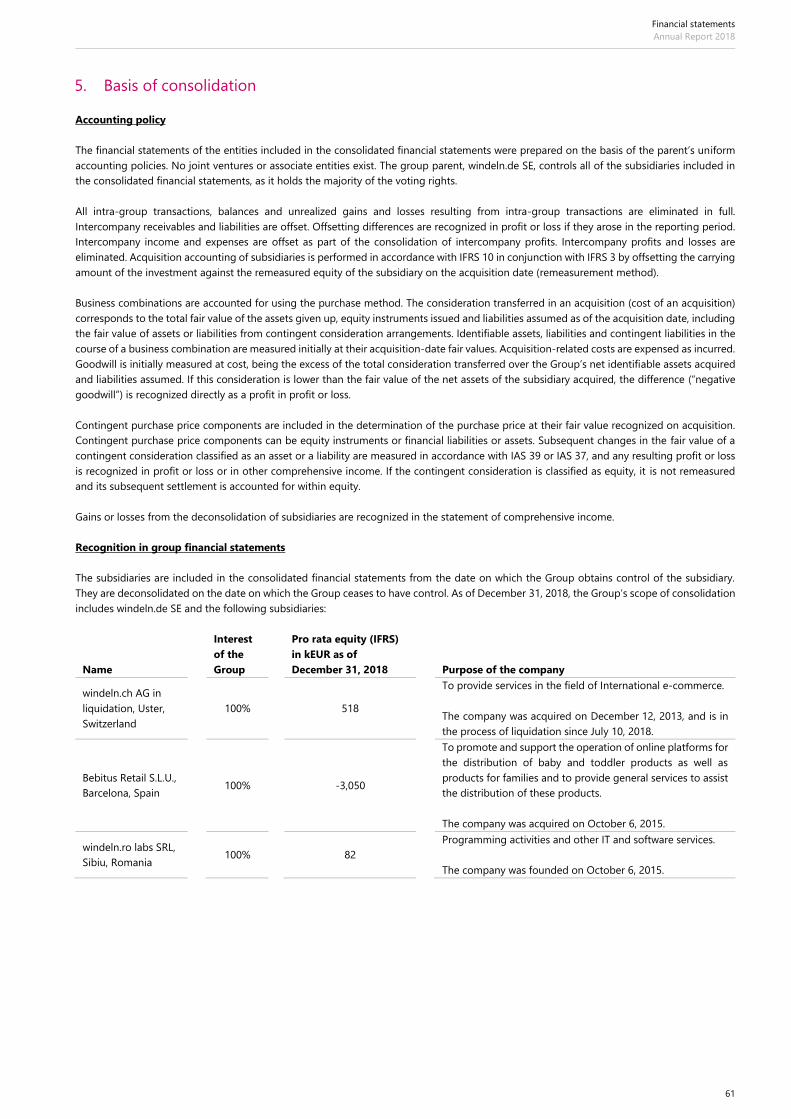
Financial statements
Annual Report 2018
61
5. Basis of consolidation
Accounting policy
The financial statements of the entities included in the consolidated financial statements were prepared on the basis of the parent’s uniform
accounting policies. No joint ventures or associate entities exist. The group parent, windeln.de SE, controls all of the subsidiaries included in
the consolidated financial statements, as it holds the majority of the voting rights.
All intra-group transactions, balances and unrealized gains and losses resulting from intra-group transactions are eliminated in full.
Intercompany receivables and liabilities are offset. Offsetting differences are recognized in profit or loss if they arose in the reporting period.
Intercompany income and expenses are offset as part of the consolidation of intercompany profits. Intercompany profits and losses are
eliminated. Acquisition accounting of subsidiaries is performed in accordance with IFRS 10 in conjunction with IFRS 3 by offsetting the carrying
amount of the investment against the remeasured equity of the subsidiary on the acquisition date (remeasurement method).
Business combinations are accounted for using the purchase method. The consideration transferred in an acquisition (cost of an acquisition)
corresponds to the total fair value of the assets given up, equity instruments issued and liabilities assumed as of the acquisition date, including
the fair value of assets or liabilities from contingent consideration arrangements. Identifiable assets, liabilities and contingent liabilities in the
course of a business combination are measured initially at their acquisition-date fair values. Acquisition-related costs are expensed as incurred.
Goodwill is initially measured at cost, being the excess of the total consideration transferred over the Group’s net identifiable assets acquired
and liabilities assumed. If this consideration is lower than the fair value of the net assets of the subsidiary acquired, the difference (“negative
goodwill”) is recognized directly as a profit in profit or loss.
Contingent purchase price components are included in the determination of the purchase price at their fair value recognized on acquisition.
Contingent purchase price components can be equity instruments or financial liabilities or assets. Subsequent changes in the fair value of a
contingent consideration classified as an asset or a liability are measured in accordance with IAS 39 or IAS 37, and any resulting profit or loss
is recognized in profit or loss or in other comprehensive income. If the contingent consideration is classified as equity, it is not remeasured
and its subsequent settlement is accounted for within equity.
Gains or losses from the deconsolidation of subsidiaries are recognized in the statement of comprehensive income.
Recognition in group financial statements
The subsidiaries are included in the consolidated financial statements from the date on which the Group obtains control of the subsidiary.
They are deconsolidated on the date on which the Group ceases to have control. As of December 31, 2018, the Group’s scope of consolidation
includes windeln.de SE and the following subsidiaries:
Name
Interest
of the
Group
Pro rata equity (IFRS)
in kEUR as of
December 31, 2018
Purpose of the company
windeln.ch AG in
liquidation, Uster,
Switzerland
100%
518
To provide services in the field of International e-commerce.
The company was acquired on December 12, 2013, and is in
the process of liquidation since July 10, 2018.
Bebitus Retail S.L.U.,
Barcelona, Spain
100%
-3,050
To promote and support the operation of online platforms for
the distribution of baby and toddler products as well as
products for families and to provide general services to assist
the distribution of these products.
The company was acquired on October 6, 2015.
windeln.ro labs SRL,
Sibiu, Romania
100%
82
Programming activities and other IT and software services.
The company was founded on October 6, 2015.

Financial statements
Annual Report 2018
62
Name
Interest
of the
Group
Pro rata equity (IFRS)
in kEUR as of
December 31, 2018
Purpose of the company
Cunina GmbH,
München,
Deutschland
100% -145
Retail and wholesale of baby and toddler products and of a
complementary product range.
The company was founded by means of a shareholders’
agreement effective January 11, 2016, and by registration in
the commercial register on April 6, 2016.
windeln
Management
Consulting
(Shanghai) Co., Ltd.,
Shanghai, China
100%
153
Service company in the Chinese market for marketing
activities and for the development of further distribution
channels.
The company was founded on February 21, 2017.
The wholly-owned subsidiary Feedo Sp. z o.o, Warsaw, Poland, and its wholly-owned subsidiary MyMedia s.r.o., Prague, Czech Republic, were
sold on August 24, 2018. Due to the divestiture of all shares and the loss of control, these entities ceased to be included in the Group’s financial
statements and were deconsolidated. Refer to note 3.4
The wholly-owned subsidiary pannoilini.it S.r.l., Milan, Italy, was liquidated on December 31, 2018. Due to the closure of the Italian office, the
service entity was no longer needed.
Significant accounting judgments and estimates
Acquisition accounting for a business combination involves reporting all identifiable assets, liabilities and contingent liabilities at fair value at
the acquisition date. One of the key estimates relates to determining the respective fair values of those assets and liabilities as well as of
contingent considerations at the acquisition date.
If intangible assets are identified, depending on the type of intangible asset and the complexity of determining its fair value, either an
independent report from an external valuation expert is used or the fair value is calculated internally using appropriate valuation techniques,
which are usually based on the forecast of total expected future cash flows. These valuations are closely linked to assumptions made by
management with regard to how the values of the respective assets will develop as well as to the assumed changes in the discount rate
applicable.
In the course of the acquisition of subsidiaries, liabilities and assets may arise that are subject to estimates. As of December 31, 2018, there
were not liabilities or assets from acquisitions, that were based on estimates.
6. Notes on the subsequent measurement of acquisitions
Accounting policy
Contingent considerations (Earn Out) and claim assets from acquisitions are measured at their respective fair values; fair value changes are
recognized in profit or loss.
6.1 Subsequent accounting for the acquisition of Feedo Sp. z o.o.
As of July 3, 2015, 100% of the shares in Feedo Sp. z o.o. and its subsidiaries (hereinafter referred to as “Feedo Group” or “Feedo”) were
purchased. The consideration transferred for the acquisition comprises cash payments, shares in windeln.de AG (now windeln.de SE) as well as
contingent considerations (Earn Out) that can be satisfied with either cash or with shares. Following a review of the sellers’ guarantees,
windeln.de and both of the founders and one investor agreed in 2016 to adjust the subsequent purchase price. The agreement resulted in a
retrospective adjustment of the purchase price, and the recognition of a claim asset that will be offset against subsequent purchase price
payments. For detailed information, reference is made to the Annual Report 2016.
In 2017, one of the founders of the Feedo Group voluntarily left the company. Pursuant to the purchase agreement, this qualifies as a leaver
event. Additionally, windeln.de and three of the sellers of the Feedo Group agreed on a second amendment of the purchase agreement about
(1) the unsettled subsequent purchase price payments for 2015 and 2016 and (2) the mutual claims from the leaver event. The main
components of the contract amendment are detailed in the Annual Report 2017.

Financial statements
Annual Report 2018
63
In H1 2018, windeln.de and the two founders of Feedo Group agreed on a final settlement relating to claims by windeln.de and subsequent
purchase price payments for the year 2018. The main results of the settlement agreement are outlined as follows:
• The founders of Feedo Group agreed to settle the claim from seller guarantees by immediate payment to windeln.de in the amount of
EUR 365k and a further payment of EUR 70k in 2019.
• The founders waive their claims from subsequent purchase price payments for the year 2018.
• In return, windeln.de waives its claims from seller guarantees of EUR 145k.
Irrespective of the settlement agreement, an obligation about subsequent purchase price payments for 2018 and a claim asset from seller
guarantees in the amount of EUR 28k exist with another seller. The claim asset of EUR 365k was received in June 2018.
The amount of subsequent purchase price payments for the years 2017 and 2018 is based on revenue growth of the Feedo webshops. Based
on the annual revenue growth realized, a contractually agreed revenue multiplier will be calculated which forms the basis for the future
valuation. The revenue multiplier is additionally impacted by the development of the SDAX performance index. The beneficiary receives one
part each of the subsequent purchase price for their parts based on 10% of the previously calculated valuation. If actual IFRS earnings before
taxes (EBIT) of the Feedo Group fall below a contractually fixed amount, subsequent purchase prices are reduced by the shortfall, applying a
multiplier. If additional funding requirements exceed the EBIT shortfall, the subsequent purchase prices will also be reduced by this amount.
The subsequent purchase prices calculated under this method are then netted against the purchase price refund. The issuance of shares in
windeln.de SE is to be settled by a cash contribution of the nominal value of EUR 1.00, however, the cash contribution of EUR 1.00 per share
can be netted against the subsequent purchase price payment. The number of shares is determined based on the amount of the respective
subsequent purchase price (after netting with the claim asset) and the applicable unweighted average closing price of the windeln.de share in
the month of March that follows the corresponding year. As outlined, the number of shares may decrease. The subsequent purchase price will
be settled at the earliest in April of the following year at the share price of the windeln.de share applicable at that time. However, windeln.de SE
is also entitled to settle the amount in cash.
The fair value of the subsequent purchase price payments for the year 2018 is measured by actual amounts. Therefore,
no Monte Carlo simulation was required in order to assess the future development of the SDAX performance index. As of December 31, 2018,
the fair value of the subsequent purchase price payments for the years 2018 amounts to a total of EUR 0.00.
Share-based payments and short-term employee benefits
On July 3, 2015, the founders of the Feedo Group have received a fixed amount of shares in windeln.de SE. Taking into account the share price
of windeln.de SE on July 3, 2015, of EUR 11.74, the fair value of those shares as of the acquisition date is EUR 576k.
This part of the consideration as well as a part of the subsequent purchase price to the founders resemble employee compensation, as the
two founders have to be employed in the Group over a period of 42 months from July 3, 2015 (vesting period), in order to receive the full
amount of the commitment. If they leave the Group within the 42-months period, they must sell 1/42nd of the shares received up to that date
to windeln.de SE for each month of the vesting period that has not been served. The redemption price depends on the reason why the founders
leave the Group and is expressed as a percentage of the share price applicable at the time. The subsequent purchase price outstanding after
leaving the Group is also reduced, depending on the reason for and/or the timing of leaving the Group. In the renegotiations of 2016, the
original vesting period of 36 months from July 3, 2015, was prolonged by six months to 42 months from July 3, 2015. Since the prolongation
is unfavorable, it is not considered pursuant to IFRS 2.27, and a 36 months period is continued to be used as a vesting period.
This results in a share-based payment that has to be reported separately pursuant to IFRS 2, as real equity instruments are granted in return
for work. Together with the subsequent purchase price payments for the years 2015 and 2016, one of the founders received another
prepayment in shares, because this portion of the payment was not yet fully vested. The fair value of that payment was EUR 240k. Both
prepayments are recognized as non-financial assets. As of December 31, 2017, the non-financial asset had a carrying amount of EUR 179k.
The prepayment was reduced by EUR 179k in 2018, recognized as personnel expense within administrative expenses.
The fair value of the share-based payment obligations amounts to EUR 1,370k as of December 31, 2018. In relation to the share-based payment
issued in the course of the subsequent purchase price, the factor “revenue growth” must be classified as a vesting condition in the form of a
performance condition that is not dependent on market development, as it was worded in combination with a service condition. Pursuant to
IFRS 2.19, performance conditions that are not dependent on market development are not taken into account when estimating the fair value
of the stock options at the measurement date. Instead, vesting conditions must be taken into account by adjusting the number of equity
instruments included in the measurement of the transaction amount. This means that, despite their classification as equity-settled share-based
payments, the structure of the share options may lead to a potential change in the distributable total fair value of the stock options granted
at the end of any reporting period. Ultimately this amounts to remeasurement of the fair value at the end of each reporting period. The
corresponding personnel expense is recognized ratably over the vesting period of 36 months on a straight-line basis. It is still planned to settle
the subsequent purchase in real equity instruments (shares). Therefore, they are recognized within share premium, pursuant to IFRS 2. EBIT
adjustments, funding requirements and the development of the SDAX performance index do also qualify as performance condition that is not
dependent on market development.
The total amount recognized in share premium amounts to EUR 1,370k as of December 31, 2017, and is unchanged to the prior year. The
share-based payment obligations for the years 2015 and 2016 were already recognized as share premium as of December 31, 2017. An increase
for the years 2017 and 2018 was not necessary as the fair value of the share-based payment obligations of those years amounts to EUR 0.00.

Financial statements
Annual Report 2018
64
For the same reason, the founders’ waiver of subsequent purchase price payments for the year 2018 does not result in an increase due to a
cancellation pursuant to IFRS 2.28.
Earn Out
As the recognized fair value of the founders’ contingent purchase prices amounts to EUR 0.00 as of the date of the final settlement agreement,
the derecognition of the financial liabilities had no impact on the result. The same accounting treatment was applied for the contingent
purchase price to the investor for 2017: the payment obligation is valued at EUR 0.00, equal to the recognized fair value at that time. The fair
value of the contingent purchase price for 2018 to the investor is unchanged at an amount of EUR 0.00 as of December 31, 2018..
Claims from the purchase price amendment
In the course of renegotiations with one of the investors and two founders of the Feedo Group, a purchase price refund of EUR 2,128k was
agreed. Since the purchase price refund is to be netted with subsequent purchase price payments, the claim is recognized as other financial
asset. As the claim is not interest-bearing, the amount was discounted. The final settlement agreement had significant impacts on the claim
from the purchase price amendment. As a consequence, the historic claims were derecognized, pursuant to IFRS 9, and a new claim was
recognized based on the final settlement agreement. The difference was recognized as other operating expense. Overall, the total claim from
purchase price refunds decreased in 2018 from EUR 576k as of December 31, 2017 to EUR 41k as of December 31, 2018. The reduction results
from following transactions:
• Derecognition of the historic claim from purchase price refunds of EUR 576k;
• Recognition of a new claim from purchase price refunds of EUR 463k;
• Payment of EUR 365k received; and
• Expected credit loss of EUR 57k, pursuant to IFRS 9.
Sensitivity analysis
A sensitivity analysis for the subsequent accounting of the acquisition of Feedo Group is not required, because the fair values recognized as
of December 31, 2018, are not subject to assumptions.
6.2 Subsequent accounting of the acquisition of Bebitus Retail S.L.U.
As of October 6, 2015, 100% of the shares in Bebitus Retail S.L.U. (hereinafter referred to as “Bebitus”) were purchased. The consideration
transferred for the acquisition comprises cash payments, shares in windeln.de AG (now windeln.de SE) and – for the two founders – subsequent
purchase price payments. Purchase price payments must be settled partially in cash, and partially in either cash or equity instruments.
In 2016 and 2017, windeln.de and the two founders of Bebitus were in discussions about the existence of guarantee claims from the share
purchase agreement and about potential reductions of subsequent purchase prices. On July 19, 2017, windeln.de and the founders concluded
a settlement agreement.
As a result of the settlement agreement, the founders of Bebitus received a final payment of EUR 101k in 2018.
Subsequent purchase prices
From an economic perspective, the subsequent purchase price is composed of contingent purchase price payments (Earn Outs), short-term
employee benefits (2015) and share-based payment obligations that can be settled in either cash or with equity instruments (2016 and 2017).
In connection with the settlement agreement signed in 2017, the subsequent purchase price payments for the years 2015 and 2016 were fixed
amount to EUR 8,412k. Thereof, EUR 1,700k were settled in cash and EUR 6,712k are settled with 1,906,695 shares in 2017. Cash settlement
was explicitly designated for the subsequent purchase price for 2015. Equity settlement is designated for the subsequent purchase price for
2015 and 2016.
For the subsequent purchase price payment for the year, 2017, the contractual baseline value was fixed as EUR 4,869k in the settlement
agreement. A calculatory cash contribution of EUR 1,00 per share is deducted from the baseline value. The number of shares and the cash
contribution is measured based on the unweighted 30-day average stock price before August 31, 2018. The optional settlement in cash or in
shares was not affected by the agreement. The subsequent purchase price for the year 2017 amounts to EUR 101k and was transferred to the
founders in October 2018 in cash.
Thus, the subsequent purchase prices for the years 2015, 2016 and 2017 are fully settled.
The accounting implication of the settlement agreement on the respective parts of the subsequent purchase price payments are outlined in
the paragraphs below.

Financial statements
Annual Report 2018
65
Share-based payments
The final purchase price payment for the year 2017 qualify as an employee compensation in the form of a share-based payments pursuant to
IFRS 2, because labor services are rewarded with true equity instruments. However, the company had the option the settle subsequent purchase
prices for the years 2016 and 2017 in cash.
Overall, the share-based payment obligation for the two founders – after the final settlement agreement and after the payment of the
subsequent purchase price for 2017 – amounts to EUR 13,562k as of December 31, 2018 (December 31, 2017: EUR 13,663k). The change equals
the payment made in 2018 to both of the founders. windeln.de had an option to settle in either cash or shares. The payment was made in
cash. According to IFRS 2, this qualifies as a settlement. Therefore, the payment is recognized as reduction in equity as of the settlement date.
Sensitivity analysis
A sensitivity analysis for the subsequent accounting of the acquisition of Bebitus is not required, because the fair values recognized as of
December 31, 2018, are not subject to assumptions.
7. Fair value hierarchy
Accounting policy
Fair value is the price that would be received to sell an asset or paid to transfer a liability in an orderly transaction between market participants
at the measurement date.
When measuring fair value, it is assumed that the transaction in the course of which the asset is sold or the liability is transferred is taking
place either on the principal market for the asset or the liability or on the most advantageous market for the asset or the liability (if no principal
market exists). The Group must have access to the principal market or the most advantageous market.
The fair value of an asset or liability is measured based on the assumptions that market participants would make when setting the price for
the asset or liability. It is assumed here that the market participants are acting in their best economic interest.
The Group uses valuation techniques that are appropriate in the circumstances and for which sufficient data are available to measure fair value.
In the process, observable market inputs are preferred to non-observable inputs.
All assets and liabilities measured at fair value or presented in the financial statements are classified on the basis of the following fair value
hierarchy:
• Level 1: Quoted prices (unadjusted) in active markets for identical assets or liabilities;
• Level 2: Inputs other than quoted prices included within Level 1 that are observable for the asset or liability, either directly or indirectly;
• Level 3: Unobservable inputs for the asset or liability.
For assets or liabilities that are recorded in the financial statements on a recurring basis at Group level, it is determined on a quarterly basis
whether reclassification has taken place between the levels of the hierarchy by examining the classification at the end of each reporting period,
based on the input parameters of the lowest level that is material to the overall fair value measurement.
For financial instruments traded in an active market, the fair value is determined based on the market price at the end of the reporting period.
A market is an active market if quoted prices on exchange markets, dealer markets, brokered markets, from an industry group, a price
calculation service or a supervisory authority are available easily and on an ongoing basis and these prices represent current and regularly
occurring market transactions made on an arm’s length basis. For assets held by the Group, the appropriate quoted market price corresponds
to the bid price offered by the purchaser.
The fair value of financial instruments not traded on an active market is determined using a valuation technique. Fair value is thus estimated
on the basis of the results of a valuation technique that makes maximum use of market inputs, and relies as little as possible on entity-specific
inputs. If all data needed for fair value are observable, the instrument is classified as Level 2. If significant data is/are not based on observable
market data, the instrument is classified as Level 3.
If a financial instrument is to be classified as Level 3, the management board decides on which measurement method is to be used. To help
with this decision, the Company’s internal valuation unit presents the management board with a number of measurement options. Once one
of the methods has been chosen, it is then applied consistently for this financial instrument. The fair value is calculated and recognized at least
once a quarter.
Specific valuation techniques used to measure financial instruments include among others net present value models based on market data
applicable on the reporting date.

Financial statements
Annual Report 2018
66
Recognition in group financial statements
The following table shows the liabilities measured at fair value, categorized in accordance with the fair value hierarchy:
kEUR Valuation date Level 1 Level 2 Level 3
Derivative financial instruments December 31, 2018 - - -
Contingent consideration December 31, 2018 - - -
Derivative financial instruments December 31, 2017 0 - -
Contingent consideration December 31, 2017 - - 0
As of December 31, 2017, derivative financial instruments comprise forward agreements to hedge foreign exchange risk exposures. They are
measured at quoted prices in active markets and are therefore classified as Level 1. As of December 31, 2018, no such instruments were in
place.
As of December 31, 2017, contingent considerations relate to the acquisition of the Feedo Group. The fair values are calculated on a quarterly
basis. The accounting policies are explained in note 6 and were applied consistently throughout the reporting period. In the prior year, the
financial instruments are to be classified as Level 3, because the fair values are calculated on the basis of the estimated future performance of
the acquires companies. As of December 31, 2018, the final Earn Out obligation is based on actual values. According to the latest calculation,
there is no subsequent purchase price obligation resulting in derecognition. Changes in the fair value are recognized in the statement of
comprehensive income as financial income or financial expenses. See note 9.3.
No assets were measured at fair value. There were no reclassifications between the different levels in the reporting period.
8. Notes to the consolidated statement of financial position
8.1 Intangible assets
Accounting policy
Software licenses
Purchased software licenses are capitalized based on the costs incurred to acquire the software and prepare it for its intended use. These are
amortized on a straight-line basis over an estimated useful life of five years (for ERP software) or three years (other software than ERP). The
residual values, economic useful lives and amortization methods are reviewed at the end of each reporting period and adjusted prospectively
if necessary. Pursuant to IAS 36, an impairment loss is recognized on the carrying amount of an asset as soon as the estimated recoverable
amount of the asset falls below the carrying amount. A reversal of impairment loss to amortized cost takes place if the reason for the
impairment loss no longer exists.
Internally developed software
With the exception of capitalizable development costs, the cost of internally generated intangible assets is reflected in the income statement
in the period in which the expenditure is incurred. Development costs for an individual project are recognized as an intangible asset if, and
only if, the following criteria pursuant to IAS 38 are met:
• The newly developed software can be clearly identified.
• Completion of the software product is technically feasible.
• Management intends to complete and use the software product.
• It can be demonstrated that the software product will generate probable future economic benefits.
• Adequate technical, financial and other resources are available to complete the development and to use the software product.
• The expenditure attributable to the software product during its development can be measured reliably.
The costs directly attributable to the software product include the personnel expenses for employees involved in development, an appropriate
portion of the corresponding overheads as well as costs for any external resources used.
Subsequent cost is only recognized in the cost of the asset or as a separate asset if it is probable that future economic benefits resulting from
these will flow to the Group and the cost of the asset can be reliably measured.
Development costs that have already been expensed are not recognized in a subsequent period.
Capitalized software development costs are amortized on a straight-line basis over their estimated useful life (generally three years).
Amortization begins when development is complete and the asset is available for use. The residual values, economic useful lives and

Financial statements
Annual Report 2018
67
amortization methods are reviewed at the end of each reporting period and adjusted prospectively if necessary. Pursuant to IAS 36, an
impairment loss is recognized on the carrying amount of an asset as soon as the estimated recoverable amount of the asset falls below the
carrying amount. A reversal of impairment loss to amortized cost takes place if the reason for the impairment loss no longer exists.
Development projects that have not yet been completed and the software from which is not yet in use are reviewed for impairment as of the
end of the reporting period.
Internet domains
These are purchased intangible assets with an indefinite useful life that are not amortized. An indefinite useful life is applied, because internet
domains are not subject to technical, technological or commercial obsolescence. The useful life of each individual domain is reviewed annually
to determine whether the assessment of the indefinite useful life continues to be supportable. If not, the change in assessment of the useful
life from indefinite to finite is made on a prospective basis.
Domains are tested for impairment if whenever there is an indication that a domain may be impaired. Additionally, once a year as of
November 30, each individual domain is tested for impairment, either on the level of the separate asset, or on the level of the respective cash-
generating unit. Pursuant to IAS 36, an impairment loss is recognized on the carrying amount of a domain as soon as the estimated fair value
of the asset (less cost of disposal) falls below its carrying amount of the asset, or when the carrying amount of the respective cash-generating
unit falls below value in use of the cash- generating unit. A reversal of impairment loss to amortized cost takes place if the reason for the
impairment loss no longer exists.
Intangible assets acquired in business combinations
The cost of intangible assets acquired in a business combination is their fair value at the date of acquisition.
The Group has acquired several domains in the course of acquisitions and recognized these at their respective fair value on the acquisition
date. These are intangible assets with an indefinite useful life. See above under “Internet domains” for details on subsequent measurement.
Goodwill
Goodwill is not amortized systematically, but is subject to an impairment test pursuant to the rules in IAS 36 (impairment-only approach).
Goodwill is allocated to cash-generating units (CGUs) for the purpose of impairment testing. It is allocated to those CGUs or groups of CGUs
which is expected to benefit from the combination out of which the goodwill arose. Each unit or group of units to which the goodwill has been
thus allocated represents the lowest level in the Group at which goodwill can be monitored for internal management purposes.
Impairment testing of goodwill takes place once a year as of 30 November. Additionally, impairment testing is also carried out ad hoc if there
are indications of potential impairment. The carrying amount of the goodwill is compared with its recoverable amount, i. e., with the higher of
the two amounts of fair value less costs to sell and value in use. An impairment loss is expensed immediately and is not reversed in subsequent
periods.

Financial statements
Annual Report 2018
68
Recognition in group financial statements
kEUR Goodwill
Software,
licenses
and
similar
assets
Software
from
finance
leases
Capitalized
software
development
costs
Internet
domains
Customer
bases
Assets
under
construction Total
Cost as of
January 1, 2018 923 1,461 56 3,489 27,610 318 19 33,876
Currency
differences 19 - - - -321 8 - -294
Additions - - - 280 - - 5 285
Reclassifications - 24 - - - - -24 -
Derecognition of
the disposal group
(change in scope of
consolidation)
- -7 - - -14,092 -82 - -14,181
Other disposals - - -2 - - - - -2
as of
December 31,
2018
942 1,478 54 3,769 13,197 244 - 19,684
Accumulated
amortization and
impairment as of
January 1, 2018
- 577 5 1,728 10,260 304 - 12,874
Currency
differences - - - - -187 8 - -179
Additions
(amortization) - 297 18 969 - 14 - -1,298
Additions
(impairment losses) 420 - - - 6,571 - - 6,991
Derecognition of
the disposal group
(change in scope of
consolidation)
- -6 - - -5,606 -82 - -5,694
Other disposals - - - - - - - -
as of
December 31,
2018
420 868 23 2,697 11,038 244 - 15,290
Carrying amount
as of December 31,
2017 923 884 51 1,761 17,350 14 19 21,002
as of
December 31,
2018
522 610 31 1,072 2,159 - - 4,394

Financial statements
Annual Report 2018
69
kEUR Goodwill
Software,
licenses
and
similar
assets
Software
from
finance
leases
Capitalized
software
development
costs
Internet
domains
Customer
bases
Assets
under
construction Total
Cost as of
January 1, 2017 969 1,469 - 3,008 26,994 334 15 32,798
Currency differences -46 0 - - 616 -16 - 554
Additions - 34 56 913 0 - 45 1,048
Reclassifications - 41 - - - - -41 -
Derecognition of the
disposal group
(change in scope of
consolidation)
- - - - - - - -
Other disposals - -83 - -432 - - - -515
as of December 31,
2017 923 1,461 56 3,489 27,610 318 19 33,876
Accumulated
amortization and
impairment as of
January 1, 2017
- 290 - 1,142 - 188 - 1,620
Currency differences - 0 - - 22 -14 - 8
Additions
(amortization) - 354 5 1,011 - 74 - 1,444
Additions
(impairment losses) - - - - 10,238 56 - 10,294
Derecognition of the
disposal group
(change in scope of
consolidation)
- - - - - - - -
Other disposals - -67 - -425 - - - -492
as of December 31,
2017 - 577 5 1,728 10,260 304 - 12,874
Carrying amount
as of December 31,
2016 969 1,179 - 1,866 26,994 146 15 31,169
as of December 31,
2017 923 884 51 1,761 17,350 14 19 21,002
Own work capitalized in the reporting period 2018 of EUR 242k (2017: EUR 379k) relates to capitalized development costs. This position
includes in-progress development projects of EUR 113k as of the end of the reporting period (December 31, 2017: EUR 231k). Additionally,
development costs of EUR 2,523k were recognized as expense in the fiscal year 2018 (2017: EUR 3,209k).
In 2018, following impairments were made:
• For the CGU France, the annual impairment test lead to an impairment expense of EUR 1,890k. Thus, the carrying amount of the domain
is fully impaired. The impairment is based on the negative value in use of the CGU. The underlying pre-tax discount rate is 15.9%.
• For the CGU Spain, the annual impairment test lead to an impairment expense of EUR 4,681k that is fully attributed to the domain value.
The impairment is based on the CGU’s value in use of EUR 1,415k. The underlying pre-tax discount rate is 15.1%.
• The impairment of the above mentioned CGUs impacts the goodwill Bebitus, that was tested for impairment on the level of a group of
three CGUs and that group’s value in use. The goodwill in the amount of EUR 420k was fully impaired. The underlying value in use is
EUR 2,859, the pre-tax discount rate is 15.1%.

Financial statements
Annual Report 2018
70
The amortization and impairments of intangible assets are recognized in the consolidated income statement as follows:
kEUR 2018 2017 R
Cost of sales from continuing operations 34 28
Selling and distribution expenses from continuing operations 7,607 5,659
Administrative expenses from continuing operations 634 275
Profit or loss from discontinued operations 14 5,776
Amortization and impairment of intangible assets 8,289 11,738
There are no restrictions on rights of disposal of intangible assets. None of the capitalized intangible assets were pledged as collateral for
liabilities.
Significant accounting judgments and estimates
Intangible assets with definite useful life
At the end of each reporting period, the Group must assess whether there are indications that the carrying amount of an intangible asset item
could be impaired. This assessment requires an estimate of the recoverable amount of the asset in question. The recoverable amount is the
higher of fair value less costs to sell and value in use. To determine the value in use, the discounted future cash flows of the asset in question
must be determined. Estimating the discounted future cash flows involves key assumptions such as in particular assumptions concerning the
future selling prices and selling volumes, the costs and the discount rates. Although management assumes that the estimates of the relevant
expected useful lives, the assumptions concerning the economic framework conditions and the development of the online mail order trade as
well as the estimate of the discounted future cash flows are appropriate, a change in the assumptions or circumstances could necessitate a
change in the analysis. This could result in additional impairment losses or reversals of impairment losses in the future if the trends identified
by management reverse or the assumptions and estimates prove incorrect.
Intangible assets with indefinite useful life
Determining the value in use (goodwill) or fair value (domains) involves making adjustments and estimates regarding the forecast and
discounting of future cash flows. The cash flow forecast on the basis of these estimates is influenced by factors such as the successful
integration of acquired entities, volatility on the capital markets, interest rate developments, fluctuations in exchange rates and the expected
economic development. The discounted cash flows are based on five-year forecasts that in turn are based on financial plans. The cash flows
forecast takes into account past experience and is based on the management board’s best estimate of future developments. Cash flows outside
of the planning period are extrapolated using individual growth rates. The most important assumptions underlying the determination of fair
value less costs to sell and value in use are the estimated growth rates, weighted average cost of capital, royalty rates, and tax rates. These
estimates and the underlying method can have a material impact on the respective values and ultimately on the amount of a possible goodwill
or domain impairment. Although management presumes that the assumptions used to calculate the recoverable amount are appropriate, any
unforeseeable changes in these assumptions could lead to an impairment loss that could have a material negative impact on the financial
performance and position.
Notes on the annual impairment tests
The cash-generating units Switzerland, Spain, France and Portugal require impairment testing. The CGU Switzerland comprises a goodwill and
the domain windeln.ch. Bebitus is established on the Spanish market and also has operations in France and Portugal. It bears the domains
bebitus.com/es, bebitus.fr and bebitus.pt.
The carrying amounts of the intangible assets requiring impairment testing are summarized as follows (before write-down):
kEUR
windeln.ch
(with CGU Switzerland)
Bebitus
(with CGUs Spain,
France, Portugal)
Carrying amount of the domains 123 8,390
Goodwill 522 420
The Group performed its annual impairment test as of November 30, 2018. In a first step, the fair value less costs of disposal of domains is
determined, using an income approach valuation method. If the carrying amount of the assets exceed its fair value, or if other indicators for
impairment exist, domains are tested on the level of their CGU.
For the test of domains on CGU-level and for the test of goodwills, the recoverable amount of the individual CGU or Groups of CGUs was
determined by calculating the value in use, which is based on the projected cash flows of the webshops. The cash flow projections stem from
the financial plans for the period of five years as approved by the management board and the supervisory board. As the management plans
show that the CGUs have not yet reached their steady state as of the end of the period, the reconciliation to the steady state was planned

Financial statements
Annual Report 2018
71
using a two-year transition period with falling growth rates and increasing EBITDA margins. This state was extrapolated using a perpetual
growth rate of 1.3%.
The key assumptions for the calculation of fair values or values in use are as follows:
windeln.ch Bebitus
expected EBITDA margin 16.3% 10.6%
average growth rate in the forecast period 15.6% 4.9%
eternal growth rate 1.3% 1.3%
discount rate 13.2% 15.1% - 15.9%
The assumed growth rates are based on experience and past values as well as expectations concerning future market developments in the
individual countries. In order to assume growth rates, overall market expectations were combined with expected market shares of the
windeln.de Group, that eventually resulted in the expected market development of the individual countries. In addition to market growth, the
expected EBITDA margin is a significant assumption; it is based on historic experience and on economies of scale from the Group growth. The
EBITDA margin is mainly affected by the operating contribution (gross margin reduced by fulfilment costs and marketing costs). The forecasts
are reviewed for their budget adherence. Overruns or shortfalls of the actual values compared to the previously planned values are considered
in the current planning process which is the basis for the latest impairment test.
The average growth rates in perpetual annuity correspond to the customary market assessments. The discount rates used are pre-tax interest
rates and reflect the market-specific risks of the individual CGUs. The calculation of discount rates is derived from weighted average cost of
capital (WACC) for the industry. When deriving the discount rates for the
CGUs and domains, the respective country-specific risks were also taken into account in the calculation.
Based on the expectations and findings presented, all domains were tested on CGU level, even if the determination of the asset’s fair value did
not trigger further testing.
The key assumptions for calculating values in use of in-progress development projects comprise the discount rate and the benefit generated.
The discount rate equals the Group’s weighted average cost of capital rate. The generated benefit stems from avoided costs for a third-party
software solution.
Sensitivities
In the annual impairment test, indicators for impairment were identified, leading to an impairment of intangible assets of EUR 6,991k. The
results of that test are based chiefly on the management assumptions presented. To validate these results, the assumptions made were
subjected to sensitivity analyses where the impact of a change in parameters on the values was calculated. The table below shows the impacts
on the carrying amounts of intangible assets with indefinite useful lives und the hypothetical assumption of
• a reduction in the average growth rate for the extrapolation of cash flows outside of the planning period from 1.3% to 0.0% (1),
• a 1.0% increase in pre-tax interest rates (2), and
• a 1.0% reduction of the EBITDA margin (3)
Increased impairment in case of
kEUR
reduction in average
growth rate (1)
increase in pre-tax
interest rates (2)
reduction of the
EBITDA margin (3)
Goodwill windeln.ch - - -
Domain windeln.ch - - -
Domain bebitus.com/es 392 410 544
Domain bebitus.pt - - -
In-progress development projects 6 7 -

Financial statements
Annual Report 2018
72
8.2 Fixed assets
Accounting policy
All fixed assets are stated at cost, net of any accumulated depreciation and/or accumulated impairment losses. The cost of fixed assets includes
all expenses directly attributable to the acquisition that were incurred in making the asset ready for use. Purchase price reductions such as
rebates, bonuses and trade discounts are deducted from the purchase price.
All non-capitalizable subsequent costs as well as maintenance and repair costs are recognized in income in the period incurred. Cost does not
contain any borrowing costs, as no capitalizable borrowing costs pursuant to IAS 23 were incurred.
Prepayments for fixed assets not yet delivered or not yet accepted are recognized as assets under construction.
Fixed assets are depreciated to the residual value on a straight-line basis over the expected economic useful life. The following useful lives are
expected:
• Furniture and fixtures 3 to 7 years
• Technical equipment 10 years
• Leased items of fixed assets expected lease term (2 to 6 years)
• Leasehold improvements expected lease term (5 years)
The residual values, economic useful lives and depreciation methods are reviewed at the end of each reporting period and adjusted
prospectively if necessary. Pursuant to IAS 36, an impairment loss is recognized on the carrying amount of an asset as soon as the estimated
recoverable amount of the asset falls below the carrying amount. A reversal of impairment loss to amortized cost takes place if the reason for
the impairment loss no longer exists.
An item of fixed assets is derecognized either upon disposal or when no future economic benefits are expected from its use or disposal.
Gains and losses from the disposals of fixed assets are calculated as the difference between the net realizable values and the residual values
of fixed assets and are recognized in other operating income and other operating expenses in the period in which the asset is derecognized.

Financial statements
Annual Report 2018
73
Recognition in group financial statements
kEUR
Leasehold
improvements
Technical
equipment
and
machinery
Furniture
and fixtures
Furniture
and fixtures
from finance
leases
Assets under
construction Total
Cost as of January 1, 2018 10 452 1,152 196 4 1,814
Currency differences - -3 -3 - - -6
Additions - 28 43 - - 71
Reclassifications - - - - - -
Derecognition of the
disposal group (change in
scope of consolidation)
- -408 -103 -15 -4 -530
Other disposals -4 -57 -94 -33 - -188
as of December 31, 2018 6 12 995 148 - 1,161
Accumulated depreciation
as of January 1, 2018 4 133 936 116 - 1,189
Currency differences - -3 -3 - - -6
Additions 3 57 151 41 - 252
Reclassifications - - - - - -
Derecognition of the
disposal group (change in
scope of consolidation)
- -118 -83 -14 - -215
Other disposals -4 -57 -88 -33 - -182
as of December 31, 2018 3 12 913 110 - 1,038
Carrying amount
as of December 31, 2017 6 319 216 80 4 625
as of December 31, 2018 3 - 82 38 - 123

Financial statements
Annual Report 2018
74
kEUR
Leasehold
improvements
Technical
equipment
and
machinery
Furniture
and fixtures
Furniture
and fixtures
from finance
leases
Assets under
construction Total
Cost as of January 1, 2016 95 448 1,209 279 4 2,035
Currency differences -3 22 2 1 0 22
Additions - 27 206 9 - 242
Reclassifications - 40 -40 - - -
Derecognition of the
disposal group (change in
scope of consolidation)
- - - - - -
Other disposals -82 -85 -225 -93 - -485
as of December 31, 2016 10 452 1,152 196 4 1,814
Accumulated depreciation
as of January 1, 2016 48 126 862 134 - 1,170
Currency differences -1 5 3 0 - 7
Additions 34 84 257 52 - 427
Reclassifications - -3 3 - - -
Derecognition of the
disposal group (change in
scope of consolidation)
- - - - - -
Other disposals -77 -79 -189 -70 - -415
as of December 31, 2016 4 133 936 116 - 1,189
Carrying amount
as of December 31, 2015 47 322 347 145 4 865
as of December 31, 2016 6 319 216 80 4 625
Depreciation of fixed assets is recognized in the consolidated income statement as follows:
kEUR 2018 2017 R
Cost of sales from continuing operations 2 4
Selling and distribution expenses from continuing operations 76 153
Administrative expenses from continuing operations 101 136
Profit or loss from discontinued operations 73 134
Depreciation of fixed assets 252 427
As of December 31, 2018 and December 31, 2017, there are no contractual commitments for the acquisition of fixed assets. There were no
indications of impairment pursuant to IAS 36 on the date of preparing the financial statements.
8.3 Financial assets
Accounting policy
Initial recognition and measurement
Financial assets are classified, at initial recognition, as subsequently measured at amortized cost, fair value through other comprehensive
income , and fair value through profit or loss.
The classification of financial assets at initial recognition depends on the financial asset’s contractual cash flow characteristics and the Group’s
business model for managing them. With the exception of trade receivables that do not contain a significant financing component, the Group
initially measures a financial asset at its fair value plus, in the case of a financial asset not at fair value through profit or loss, transaction costs.
Trade receivables that do not contain a significant financing component or for which the Group has applied the practical expedient are
measured at the transaction price determined under IFRS 15. Refer to the accounting policies in note 9.1.
In order for a financial asset to be classified and measured at amortized cost or fair value through OCI, it needs to give rise to cash flows that
are solely payments of principal and interest on the principal amount outstanding.
Financial statements
Annual Report 2018
75
The Group’s business model for managing financial assets refers to how it manages its financial assets in order to generate cash flows. The
business model determines whether cash flows will result from collecting contractual cash flows, selling the financial assets, or both.
Purchases or sales of financial assets that require delivery of assets within a time frame established by regulation or convention in the market
place (regular way trades) are recognized on the trade date, i. e., the date that the Group commits to purchase or sell the asset.
Subsequent measurement
For purposes of subsequent measurement, financial assets are classified in four categories:
(1) Financial assets at amortized cost (debt instruments)
(2) Financial assets at fair value through OCI with recycling of cumulative gains and losses (debt instruments)
(3) Financial assets designated at fair value through OCI with no recycling of cumulative gains and losses upon derecognition (equity
instruments)
(4) Financial assets at fair value through profit or loss
(1) Financial assets at amortized cost (debt instruments)
The Group measures financial assets at amortized cost if both of the following conditions are met:
• The financial asset is held within a business model with the objective to hold financial assets in order to collect contractual cash flows,
and
• The contractual terms of the financial asset give rise on specified dates to cash flows that are solely payments of principal and interest
on the principal amount outstanding
Financial assets at amortized cost are subsequently measured using the effective interest method and are subject to impairment. Gains and
losses are recognized in profit or loss when the asset is derecognized, modified or impaired.
This category is the most relevant to the Group.
(2) Financial assets at fair value through OCI (debt instruments)
The Group measures debt instruments at fair value through OCI if both of the following conditions are met:
• The financial asset is held within a business model with the objective of both holding to collect contractual cash flows and selling, and
• The contractual terms of the financial asset give rise on specified dates to cash flows that are solely payments of principal and interest
on the principal amount outstanding.
For debt instruments at fair value through OCI, interest income, foreign exchange revaluation and impairment losses or reversals are recognized
in the income statement and computed in the same manner as for financial assets measured at amortized cost. The remaining fair value
changes are recognized in OCI. Upon derecognition, the cumulative fair value change recognised in OCI is recycled to profit or loss.
Currently, no financial instruments of the Group fall into this measurement category.
(3) Financial assets designated at fair value through OCI (equity instruments)
Upon initial recognition, the Group can elect to classify irrevocably its equity investments as equity instruments designated at fair value through
OCI when they meet the definition of equity under IAS 32 Financial Instruments: Presentation and are not held for trading. The classification is
determined on an instrument-by-instrument basis.
Gains and losses on these financial assets are never recycled to profit or loss. Dividends are recognized as other income in the income statement
when the right of payment has been established, except when the Group benefits from such proceeds as a recovery of part of the cost of the
financial asset, in which case, such gains are recorded in OCI. Equity instruments designated at fair value through OCI are not subject to
impairment assessment.
Currently, no financial instruments of the Group fall into this measurement category.
(4) Financial assets at fair value through profit or loss
Financial assets at fair value through profit or loss include financial assets held for trading, financial assets designated upon initial recognition
at fair value through profit or loss, or financial assets mandatorily required to be measured at fair value. Financial assets are classified as held
for trading if they are acquired for the purpose of selling or repurchasing in the near term. Derivatives, including separated embedded
derivatives, are also classified as held for trading unless they are designated as effective hedging instruments. Financial assets with cash flows
that are not solely payments of principal and interest are classified and measured at fair value through profit or loss, irrespective of the business
model. Notwithstanding the criteria for debt instruments to be classified at amortized cost or at fair value through OCI, as described above,
debt instruments may be designated at fair value through profit or loss on initial recognition if doing so eliminates, or significantly reduces,
an accounting mismatch.
Financial assets at fair value through profit or loss are carried in the statement of financial position at fair value with net changes in fair value
recognized in the income statement.
Financial statements
Annual Report 2018
76
This category includes derivative instruments and listed equity investments which the Group had not irrevocably elected to classify at fair value
through OCI. Dividends on listed equity investments are also recognized as other income in the statement of profit or loss when the right of
payment has been established.
A derivative embedded in a hybrid contract, with a financial liability or non-financial host, is separated from the host and accounted for as a
separate derivative if the economic characteristics and risks are not closely related to the host; a separate instrument with the same terms as
the embedded derivative would meet the definition of a derivative; and the hybrid contract is not measured at fair value through profit or loss.
Embedded derivatives are measured at fair value with changes in fair value recognized in profit or loss. Reassessment only occurs if there is
either a change in the terms of the contract that significantly modifies the cash flows that would otherwise be required or a reclassification of
a financial asset out of the fair value through profit or loss category.
A derivative embedded within a hybrid contract containing a financial asset host is not accounted for separately. The financial asset host
together with the embedded derivative is required to be classified in its entirety as a financial asset at fair value through profit or loss.
Derecognition
A financial asset is primarily derecognized when:
• The rights to receive cash flows from the asset have expired.
• The Group has transferred its rights to receive cash flows from the asset or has assumed an obligation to pay the received cash flows in
full without material delay to a third party under a ‘pass-through’ arrangement; and either (a) the Group has transferred substantially all
the risks and rewards of the asset, or (b) the Group has neither transferred nor retained substantially all the risks and rewards of the asset,
but has transferred control of the asset.
When the Group has transferred its rights to receive cash flows from an asset or has entered into a pass-through arrangement, it evaluates if,
and to what extent, it has retained the risks and rewards of ownership. When it has neither transferred nor retained substantially all of the risks
and rewards of the asset, nor transferred control of the asset, the Group continues to recognize the transferred asset to the extent of its
continuing involvement. In that case, the Group also recognizes an associated liability. The transferred asset and the associated liability are
measured on a basis that reflects the rights and obligations that the Group has retained.
Continuing involvement that takes the form of a guarantee over the transferred asset is measured at the lower of the original carrying amount
of the asset and the maximum amount of consideration that the Group could be required to repay.
Impairment of financial assets
The Group recognizes an allowance for expected credit losses (ECLs) for all debt instruments not held at fair value through profit or loss. ECLs
are based on the difference between the contractual cash flows due in accordance with the contract and all the cash flows that the Group
expects to receive, discounted at an approximation of the original effective interest rate. The expected cash flows will include cash flows from
the sale of collateral held or other credit enhancements that are integral to the contractual terms.
ECLs are recognized in two stages. For credit exposures for which there has not been a significant increase in credit risk since initial recognition,
ECLs are provided for credit losses that result from default events that are possible within the next 12-months (a 12-month ECL). For those
credit exposures for which there has been a significant increase in credit risk since initial recognition, a loss allowance is required for credit
losses expected over the remaining life of the exposure, irrespective of the timing of the default (a lifetime ECL).
For trade receivables and contract assets, the Group applies a simplified approach in calculating ECLs. Therefore, the Group does not track
changes in credit risk, but instead recognises a loss allowance based on lifetime ECLs at each reporting date. The Group has established a
provision matrix that is based on its historical credit loss experience, adjusted for forward-looking factors specific to the debtors and the
economic environment.

Financial statements
Annual Report 2018
77
Recognition in group financial statements
Trade receivables
As of December 31, 2018, trade receivables exist mainly from customers of windeln.de SE. As of December 31, 2017, additional trade
receivables existed from customers of MyMedia s.r.o. All trade receivables are due in less than one year and are not subject to interest.
Receivables are generally due for immediate repayment. End customers are granted a payment term of 14 days for goods purchased on
account. If customer payment transactions are made with payment service suppliers, the maximum payment term is 21 days from the order
date. There are no restrictions on rights of disposal. As of December 31, 2018 and 2017, trade receivables were as follows:
kEUR December 31, 2018 December 31, 2017 R
Cost 3,695 5,044
Impairment loss -2,278 -2,786
1,417 2,258
As of December 31, 2018, impairment charges of EUR 641k were recognized due to default risks (December 31, 2017: EUR 782k). With regards
to receivables that are not past due and not impaired, there are no indications that the debtors will not settle their payment obligations.
As of December 31, 2017, an impairment loss of EUR 2,746k was measured pursuant to IAS 39. With the adoption of IFRS 9, impairment losses
were restated by EUR 40k that relate solely to debt instruments measured at amortized cost. Considering the restatement, the account for
impairment losses developed as follows:
kEUR 2018 2017 R
As of January 1 2,786 2,067
Addition 641 782
Utilization -1,135 -63
Reversal -14 -
As of December 31 2,278 2,786
The write-downs due to uncollectible receivables amount to EUR 1,135k in the 2018 reporting period (2017: EUR 433k).
On a regular basis, receivables not yet past due and not yet impaired are sold to third parties, leading to derecognition from the statement of
financial position. In the course of selling these receivables, the Group retains immaterial duties; these include first and foremost the provision
of settlement services in relation to the merchandise sold, such as responding to general customer inquiries and processing returns and
complaints. Regardless of the sale of receivables, risks in connection with these duties remaining with the Group are taken into consideration
in the consolidated financial statements.
Overdue receivables are collected by a collection service provider. The impaired receivable remains in the Group’s books until the receivable
is either collected or finally deemed irrecoverable and derecognized from the Group’s books.

Financial statements
Annual Report 2018
78
Other financial assets
kEUR December 31, 2018 December 31, 2017
Compensation from seller guarantees - 576
Purchase price receivables from divestiture of subsidiaries 403 -
Restricted cash 226 226
Lease and other deposits 21 64
Other non-current financial assets 650 866
Accrued advertising contributions and supplier rebates 1,715 4,275
Time deposits - 2,500
Creditors with debit balances 90 267
Lease and other deposits 625 635
Compensation from seller guarantees 41 -
Sundry 86 106
Other current financial assets 2,557 7,783
Other financial assets 3,207 8,649
Compensation from seller guarantees stems from a review process of the issued seller guarantees in the course of which windeln.de SE and
the sellers of the Feedo Group agreed on a compensation payment. See details in note 6.
Accrued advertising contributions and supplier rebates relate to claims from suppliers due to advertising and marketing campaigns carried
out in the reporting period as well as bonuses dependent on purchase volumes.
Creditors with debit balances relate to refund claims from suppliers and service providers, e.g., due to overpayment, insufficient deliveries etc.
Additional information on financial instruments
The following table shows the carrying amounts and fair values of the financial assets (except for cash and cash equivalents) and the allocation
of financial statement positions to the measurement categories:
Decembe 31, 2018 December 31, 2017 R
TEUR
Carrying
amount Fair value
Carrying
amount Fair value
Debt instruments at amortized cost:
Trade receivables 1,417 1,417 2,258 2,258
Other financial assets 3,207 3,207 8,649 8,649
Debt instruments at fair value through OCI:
--- - - - -
Equity instruments at fair value through OCI:
--- - - - -
Financial assets at fair value through profit or loss:
--- - - - -
Financial assets 4,624 4,624 10,907 10,907
current 3,974 3,974 10,041 10,041
non-current 650 650 866 866
Due to the short-term maturities of cash and cash equivalent, trade receivables and other current financial assets, the fair values less impairment
for these items are assumed to be equal to the carrying amounts.
Other current financial assets include cooperative shares of EUR 14k (December 31, 2017: EUR 14k). Those assets qualify as “equity instruments
at fair value through OCI” but are recognized at cost because they cannot be measured at fair value and because of their immaterial amount.
Significant accounting judgments and estimates
The portfolio-based allowance for trade receivables requires a definition of the maturity bands of the age structure, which is an accounting
estimate. The applied write-down percentage is estimated based upon historical default quotas.

Financial statements
Annual Report 2018
79
8.4 Non-financial assets
kEUR December 31, 2018 December 31, 2017
Prepaid expenses 177 206
Non-current non-financial assets 177 206
VAT receivables 2,105 2,330
Prepaid expenses 402 526
Right to recover possession of goods 147 213
Prepayment for share-based payments - 179
Sundry 4 18
Current non-financial assets 2,658 3,266
Non-financial assets 2,835 3,427
The prepayment for share-based payment, recognized in the prior year, results from the acquisition of the Feedo Group. See note 6.
The right to recover possession of goods concerns the estimated returns after the end of the reporting period. See note 9.1.
The items contained in prepaid expenses involve payments made for services that will not be provided until after the end of the reporting
period, as well as prepaid transaction fees for future equity transactions. See note 8.7.
As of December 31, 2018 and December 31, 2017, the Group did not hold any securities.
8.5 Inventories and prepayments
Accounting policy
Purchased merchandise reported as inventories are measured at the lower of cost and net realizable value in accordance with IAS 2. The costs
of purchase are calculated using the average purchase costs and comprise the acquisition cost plus any directly attributable incidental purchase
costs incurred less purchase price reductions; they do not contain any borrowing costs. Net realizable value is the estimated selling price in
the ordinary course of business less the estimated costs necessary to make the sale. Appropriate allowance is made for inventory risks
associated with slow-moving stocks, reduced salability or similar matters. If the reasons for impairment losses recognized in earlier periods no
longer exist, reversals of the impairment losses are recognized up to the amount of the original cost.
Recognition in group financial statements
kEUR December 31, 2018 December 31, 2017
Gross merchandise 7,564 20,364
Impairment of merchandise -744 -1,190
Inventories 6,820 19,174
Inventories are impaired due to a decline in net realizable values and to slow-moving stock. In the prior year, inventories of EUR 9,993k were
pledged as collateral to secure credit lines.
As of December 31, 2018, no prepayments were recognized. Prepayments of EUR 332k recognized as of December 31, 2017, were made for
upcoming deliveries of merchandise.
Significant accounting judgments and estimates
Management assesses the recoverability of inventories at the end of each reporting period. Among other things, this involves assumptions
regarding the future realizable selling price and the necessary selling and distribution expenses.

Financial statements
Annual Report 2018
80
8.6 Cash and cash equivalents
Accounting policy
Cash and cash equivalents include cash, demand deposits and other highly liquid current financial assets with an original term to maturity of
no more than three months, that are subject to insignificant risks of change in value. They are measured at nominal value. Any interest incurred
on debit bank balances are reported in administrative expenses, see note 9.2.
Utilized overdraft facilities are reported as liabilities to banks under “current financial liabilities” in the statement of financial position. Time
deposits qualify as cash equivalents if they can be cancelled within three months, and if they are subject to an insignificant risk of change in
value. Otherwise, they are recognized under “other current financial assets” or “other non-current financial assets”.
If access to cash positions held by the Group is restricted and the restriction expires within three months, those cash positions are recognized
within cash. Otherwise, they are recognized as restricted cash within “other current financial assets” or “other noncurrent financial assets”.
Recognition in group financial statements
kEUR December 31, 2018 December 31, 2017
Cash at banks 11,112 26,445
Restricted cash 10 -
Cash on hand 14 20
Cash and cash equivalents 11,136 26,465
Most of the bank balances are interest free or earn low levels of interest. Bank balances subject to interest bear floating interest rates for
demand deposits.
In the prior year, further cash deposits were held with banks, namely time deposits that are not recognized as cash and cash equivalents, but
as other financial assets due to their maturity. The total cash position and bank deposits breaks down as follows:
kEUR December 31, 2018 December 31, 2017
Cash and cash equivalents 11,136 26,465
Current time deposits (<3 months) - 625
Current time deposits (3-12 months) - 1,875
Total cash available 11,136 28,965
Notes on the statement of cash flows
The statement of cash flows was prepared in accordance with IAS 7 Statement of Cash Flows and shows how the Group’s cash and cash
equivalents have changed over the reporting period as a result of cash received and paid.
In accordance with IAS 7, cash flows from operating, investing and financing activities are separated according to their origin and utilization.
The cash inflows and outflows from operating activities are derived indirectly on the basis of the Group’s net loss for the year. Cash inflows
and outflows from investing and financing activities are derived directly. The amount of cash in the statement of cash flows is equal to the
value of cash and cash equivalents reported in the statement of financial position.
The negative cash flow from operating activities is attributable to the net loss for the year adjusted for non-cash effects. The main non-
cash effects in 2018 are:
• Losses from the divestiture of the disposal group in the amount of EUR 7,758k after taxes
• Depreciation, amortization and impairment of fixed and intangible assets in the amount of EUR 8,541k
• Income of share-based compensation of EUR 321k
The positive cash flow from investing activities is primarily attributable to repaid time deposits of EUR 2,500k. Additionally, the founders of
Feedo Group paid EUR 365k to windeln.de as stipulated in the final settlement agreement. Cash outflows resulted from the deconsolidation
of Feedo Group (EUR 595k) and the purchase of fixed and intangible assets (EUR 371k).

Financial statements
Annual Report 2018
81
Positive cash flows from financing activities result mainly from the capital increases in Q1 2018 (EUR 5,204k) and Q2 2018 (EUR 38k). The
Group had cash outflows of EUR 3,500k from the repayment of short-term money market loans. The reconciliation of cash flows from financing
activities to the development of financial liabilities breaks down as follows:
kEUR
Money
market
loans
Liabilities from
finance lease
Other
financial
debt
Total financial
liabilities
As at January 1, 2017 - 164 19 183
Currency differences (non-cash) - 0 2 2
Additions (cash-effective) 3,500 - 19 3,519
Additions (non-cash) - 22 - 22
Repayment (cash-effective) - -66 -12 -78
Other non-cash changes (interest, derecognition) - -14 - -14
As at December 31, 2017 3,500 106 28 3,634
Currency differences (non-cash) - -1 -1 -2
Additions (cash-effective) - - - -
Additions (non-cash) - - - -
Repayment (cash-effective) -3,500 -51 -9 -3,560
Derecognition of the disposal group (change in
scope of consolidation) - - -18 -18
Other non-cash changes (interest, derecognition) - - - -
As at December 31, 2018 - 54 - 54
8.7 Equity
Accounting policy
Treasury shares
Own equity instruments that are reacquired (treasury shares) are recognized at cost and deducted from equity. No gain or loss is recognized
in profit or loss on the purchase, sale, issue or cancellation of the Group’s own equity instruments. Any difference between the carrying amount
and the consideration, if reissued, is recognized in the share premium.
Accounting for transaction costs in equity transactions
Pursuant to IAS 32.37, the directly attributable costs in connection with acquiring equity must be accounted for as a deduction from the
additional equity (reduction of the share premium), taking any tax effects into account (IAS 12.61A(b)). If the transaction costs incurred are tax
deductible and thus reduce the assessment base, the transaction costs to be taken into account in equity are reduced by the tax saving, and
a corresponding tax receivable is recognized if requirements of IAS 12 are met. Pursuant to IAS 32.37, only external costs that are directly
attributable to the equity transaction and that otherwise would have been avoided are recognized directly in equity. Indirect costs, for example
internal administrative expenses and pro rata personnel expenses, do not fall under directly attributable transaction costs and are thus
expensed as incurred.
Prepaid transaction fees are accrued as non-financial asset, and reclassified to equity as of the date of the equity transaction.
Recognition in group financial statements
Capital increases
On February 6, 2018, windeln.de SE successfully completed a capital increase. A total of 2,628,323 shares were issued out of Authorized Capital
2016. The shares were offered at a price of EUR 1.98, leading to gross issuing proceeds of EUR 5,204,080. Shareholders‘ subscription rights
were excluded. The new shares are entitled to dividend payments from January 1, 2018, onwards.
In May and June 2018, 35,727 subscription rights from the stock option programs VSOP 1 and 2 were exercised at an exercise price of EUR 1.05.
The capital increase was recorded in the commercial register on June 28, 2018. The new shares were issued out of Authorized Capital 2016.
At the Annual General Meeting held on June 25, 2018, the remaining Authorized Capital 2016 in the amount of EUR 6,955,296 was cancelled
and replaced by the new Authorized Capital 2018 in the amount of EUR 15,000,000. The management board has authorization – after approval
by the supervisory board – to increase the share capital by EUR 15,000,000 by means of issuance of no-par value bearer shares against cash

Financial statements
Annual Report 2018
82
or in-kind contribution on one or several occasions. Shareholders are generally granted a subscription right. The changes became effective on
July 27, 2018, the date of the entry in the commercial register.
Additionally, at the Annual General Meeting held on June 25, 2018, the Conditional Capital 2017 in the amount of EUR 1,200,000 was cancelled
and replaced by the Conditional Capital 2018 in the amount of EUR 1,200,000. The previous authorization to grant subscription rights under
the Long Term Incentive Program 2018-2020 from June 2, 2017, was revoked, and a new authorization for a new Long Term Incentive Program
2018-2020 – with amended performance condition and other amendments – was given. The changes became effective on July 27, 2018, the
date of the entry in the commercial register.
The Conditional Capital 2016/I and 2016/II stand unchanged to the prior year at EUR 7,997,804 and EUR 555,206.
Issued capital
As of December 31, 2018, the issued capital of the Group parent amounts to EUR 31,136k (December 31, 2018: EUR 28,472k). It has been fully
paid in and comprises 31,136,470 no-par value bearer shares. As of December 31, 2017, the number of shares amounted to 28,472,420, and
was increased by capital transactions – as described above – by 2,664,050 to a total number of 31,136,470.
Share premium
As of December 31, 2018, the share premium amounts to EUR 170,391k (December 31, 2017: EUR 168,486k) and breaks down as follows:
kEUR December 31, 2018 December 31, 2017
Premium from financing rounds and/or IPO 167,916 165,341
Capital increases from company funds -25,232 -25,232
Contributions in kind 4,465 4,465
Costs of equity transactions -5,674 -5,510
Share-based payments 28,876 29,384
Premium from exercise of stock options 40 38
Share premium 170,391 168,486
Accumulated loss
The accumulated loss results from losses carried forward from prior periods and the result for the current reporting period.
8.8 Employee benefits
8.8.1 Share-based payments
Share-based compensation as component of employee remuneration
Accounting policy
Selected executives and members of the management board and/or of local management receive share-based payment for their work in the
form of equity or cash. Pursuant to IFRS 2, equity-settled share-based payment transactions are measured once at the fair value on the grant
date, while cash-settled share-based payment transactions are measured at the fair value at the end of the reporting period. The Group uses
the Monte Carlo simulation for this purpose. The fair value is recognized in profit or loss over the period in which the service is provided by
the eligible persons, referred to as the vesting period, by recognizing a corresponding item in the share premium for equity-settled share-
based payment transactions and by recognizing a corresponding liability for cash-settled share-based payment transactions. In the case of
cash-settled share-based payment transactions, the liability is remeasured at the end of each reporting period and at the date of settlement
until the liability is settled with changes in fair value recognized in the income statement.
To motivate and retain key employees, windeln.de SE introduced a total of four programs relating to share-based payment obligations. This
gives the employees the opportunity to participate in future increases in the Group’s business value. The programs are described below.
Description of VSOP 1 and 2
As part of the Virtual Stock Option Program (VSOP 1), cash-settled share-based payment arrangements were made with employees of the
Group up to and including 2014. The beneficiaries obtain vested rights to the options granted in 48 sub-tranches over a period of four years
from the allocation date determined by the Company. In the event of an exit, the stock options of four employees immediately qualify as
accumulated in full, provided that the beneficiary is in a current service or employment relationship with the Company. Sub-tranches not yet
accumulated in full are forfeited if the service or employment relationship ends before the exit event. Fully accumulated options are forfeited

Financial statements
Annual Report 2018
83
if the service or employment relationship ends due to termination or dismissal for due cause before the exit event. The options lapse no later
than 15 years after the allocation date. Amongst others, a stock exchange listing of the company (IPO exit) qualifies as an exit event.
The payment entitlement of the option holder is calculated for each option granted as the difference between the exit proceeds per share and
the basic price for the option.
In the first quarter of 2015, all existing share-based payment arrangements were modified on account of the imminent IPO. Pursuant to IFRS 2,
the modified agreements will subsequently be treated as equity-settled share-based payments. The incremental fair value of all modified
options amounts to EUR 15.064 (EUR 0.02 per option) on the modification date. The market input parameters were selected unchanged both
before and after modification.
In addition to the share-based payment arrangements already in existence as of December 31, 2014, further share-based payment
arrangements (VSOP 2) were made with employees of the Group in the first quarter of 2015. The beneficiaries obtain vested rights to the
options granted in 48 sub-tranches over a period of four years from the allocation date determined by the Company. By analogy to the existing
modified agreements, the stock options are treated as equity-settled share-based payments.
Description of VSOP 3
In the second quarter of 2015, the Company launched a new stock option program (VSOP 3) and entered into corresponding agreements with
employees of windeln.de SE. The beneficiaries obtain vested rights to the options granted in 48 sub-tranches over a period of four years from
the allocation date determined by the Company. Provided that specified revenue growth targets are met for the Group (performance
condition), the stock options will be settled in cash after the end of the four-year vesting period. If the specified revenue growth targets are
not met, no payment will be made. These stock options are remeasured at the end of each reporting period in accordance with IFRS 2.
Description of LTIP 2015-2017 – SO and RSU
In 2015, the Company launched a long-term incentive plan (LTIP 2015-2017) and from 2015 to 2017, entered into corresponding agreements
with employees of the Group. As part of this plan, both equity-settled stock options (SO) and restricted stock units (RSU) will be issued. The
RSUs entitle holders to purchase shares in windeln.de SE at the respective applicable share price without payment of a strike price by the
beneficiary. After a six-month cliff period from an allocation date set by the Company, the participants have obtained a vested right to 6/48
of the options granted; thereafter they obtain a vested right to the options in 42 further sub-tranches over a period of three and a half years.
Provided that specified revenue growth targets are met for the Group (performance condition), the stock options can be exercised after the
end of the four-year vesting period. If the specified revenue growth targets are not met, the stock options cannot be exercised. There is no
performance condition for the RSUs. The Company has an option with respect to settlement of the RSUs. Because the Company provides for
settlement in the form of real equity instruments, the contract component is recognized as equity-settled share-based payment. Both for the
stock options and the RSUs, the number of shares to be issued is capped. In accordance with IFRS 2, both the stock options and the RSUs are
measured only on the date of issue or grant date.
Description of LTIP 2018-2020 – SO and RSU
In 2018, the Company launched another long-term incentive plan (LTIP 2012-2020) and entered into corresponding agreements with
employees of the Group. As part of this plan, both equity-settled stock options (SO) and restricted stock units (RSU) will be issued. The RSUs
entitle holders to purchase shares in windeln.de SE at the respective applicable share price without payment of a strike price by the beneficiary.
After a six-month cliff period from an allocation date set by the Company, the participants have obtained a vested right to 1/48 of the options
granted, beginning with the calendear year in which the options were granted; thereafter they obtain a vested right of 1/48 per month over a
total period of four years, beginning with the calendar year in which the options were granted. Provided that specified revenue growth targets
are met for the Group (performance condition), the stock options can be exercised after the end of the four-year vesting period. If the specified
revenue growth targets are not met, the stock options cannot be exercised. There is no performance condition for the RSUs. The Company
has an option with respect to settlement of the RSUs. Because the Company provides for settlement in the form of real equity instruments,
the contract component is recognized as equity-settled share-based payment. Both for the stock options and the RSUs, the number of shares
to be issued is capped. In accordance with IFRS 2, both the stock options and the RSUs are measured only on the date of issue or grant date.
Measurement of the programs
The same measurement method is used for all programs, and the fair value of the stock options and restricted stock units is determined using
a Monte Carlo simulation.
The Monte Carlo simulation involves simulating the stochastic process, which describes the development of the market price, through a large
number of repetitions. The process takes the form of a geometric Brownian motion, for which the current share price is the initial value. The
volatility was determined as the historical volatility (over a period similar to the life of the options) of comparable public companies (peer
group) over the respective remaining term. The expected volatility taken into account reflects the assumption that the historical volatility is
indicative of future trends, and may also not necessarily be the actual outcome. The expected dividend yield is based on market assessments
for the amount of the expected dividend of the windeln.de share. The risk-free interest rates were determined based on the interest on German
government bonds over a similar period. The drift corresponds to the risk-free interest rate. The random component comprises a Wiener

Financial statements
Annual Report 2018
84
process, which can be simulated with the help of random numbers. Once a large number of paths of the geometric Brownian motion have
been simulated, it is possible to make reliable statements about the probability of interesting parameters. This applies in particular to the value
of the option, i.e., the size max(share price on exercise date - exercise price,0). Asymptotically (with a sufficiently large number of repetitions),
the expected value for this parameter based on the distribution simulated with Monte Carlo corresponds to the value using the Black-Scholes-
Merton formula. However, with Monte Carlo it is possible to make many more statements; in this way a statement concerning probability can
be made for each possible value of the option. In this way, in particular uncertainties in the projection can be estimated better.
The following input parameters were used in the Monte Carlo simulation in 2018, for VSOP 1-2, LTIP 2015-2017-RSU, LTIP 2015-2017-SO, LTIP
2018-2020-RSU and LTIP2018-2020-SO at the grant date, and for VSOP 3 at the reporting date December 31, 2018:
LTIP 2015-2017 LTIP 2018-2020
VSOP 1-2 VSOP 3 RSU SO RSU SO
Expected volatility (%) 37.46% -
40.80%
39.88% -
44.91%
38.14% -
43.93%
38.28% -
41.91% 45.80% 44.51%
Risk-free interest rate (%) 0.00% 0.00% 0.00% 0.00% 0.00% 0.00%
Expected dividend yield (%) 0.00% 0.00% 0.00% 0.00% 0.00% 0.00%
Expected life of options (years) 0.25 - 4 0.25 – 0.58 4 4 – 4.5 4 4.67
Average share price on the
measurement date
(in EUR)
13.25 0.17 3.19 –
14.69
3.19 –
10.63 1.26 1.26
The subscription rights recognized in equity changed as follows:
LTIP 2015-2017 LTIP 2012-2020
VSOP 1 - 2 RSU SO RSU SO
Outstanding at the beginning of the reporting
period (January 1, 2018) 177,666 77,138 181,470 - -
Expired during the reporting period - - - - -
Forfeited during the reporting period - 6,270 18,808 - -
Exercised during the reporting period 35,727 - - - -
Granted during the reporting period 5,399 31,670 79,216 22,108 66,322
Outstanding at the end of the reporting period
(December 31, 2018) 147,338 102,538 241,878* 22,108 66,322
Exercisable at the end of the reporting period
(December 31, 2018) 147,338 - - - -
* For the interim financial reporting as of June 30, 2018, management has estimated that the performance target relating to the average
revenue growth during the vesting period will most likely not be met. This estimation is unchanged on December 31, 28. Therefore,
management concludes that all issued stock options (SO) including that specific performance target, are not fully vested. Pursuant to IFRS 2,
this assumption was incorporated into the quantity of the stock option plan. This resulted in an income of EUR 429k.
The weighted average remaining contractual life for the stock options outstanding as of December 31, 2018, is 1.1 years. The weighted average
fair value of the stock options granted in 2018 was EUR 0.98. The exercise price range for the equity-settled stock options outstanding as of
December 31, 2018, is EUR 1.37 to EUR 18.50, if an exercise price has been set.
Presentation of the impact on profit or loss
Due to the above mentioned CAGR estimation and the resulting adjustment of the quantity of the stock option plan, a total income of EUR 321k
was recognized for share-based payment obligations (2017: EUR 415k expense). This amount fully relates to equity-settled share-based
payments (2017: EUR 417k expense). In the prior year, an income of EUR 2k for cash-settled share-based payments was recognized.
As of December 31, 2018, and 2017, the carrying amount of the liability from these cash-settled share-based payment obligations is EUR -.
The obligation is recognized under non-current liabilities.
As of December 31, 2018, a figure of EUR 11,942k is reported in the share premium from these equity-settled share-based payment obligations
(December 31, 2017: EUR 12,266k).

Financial statements
Annual Report 2018
85
Significant accounting judgments and estimates
The Group measures the cost of equity-settled or cash-settled share-based payment to executives and management board members and/or
local management at fair value on the grant date in the case of equity-settled share-based payment transactions and at fair value at the end
of the reporting period in the case of cash-settled share-based payment transactions. To estimate fair value for share-based payment
obligations, the most appropriate valuation method must be determined. The valuation method chosen depends on the conditions of granting.
This estimate also requires determination of the most appropriate inputs to the valuation model, including in particular the expected life of
the stock option, volatility and risk-free interest rate and making assumptions about them.
Additionally, management assumptions on the occurrence probability of defined performance targets impact the quantity of the stock option
plan. Regular budget analyses and forecast updates are used to assess the probability.
Share-based payment commitments in the course of acquisitions
In addition, as part of the acquisition of Feedo Group, shares with contingent return obligations were issued that fall within the scope of IFRS 2.
Parts of contingent considerations in connection with the acquisition of Feedo Group and Bebitus also fall within the scope of IFRS 2 and/or
IAS 19. See note 6 for further details.
8.8.2 Pension obligations
In the prior year, obligations from defined benefit plans were recognized for employees in Switzerland, according to IAS 19. During the year
2018, all Swiss employees left the Group; and therefore windeln.de’s subordinate liability for the fulfilment of the pension plan has lapsed. The
pension liability of EUR 4k, recognized as non-current provision for employee benefits as of December 31, 2017, was released through profit
or loss in 2018.
8.8.3 Termination benefits and other post-employment benefits
In the prior year, provisions for statutory severance payments for employees in Italy were recognized in accordance with IAS 19. During the
year 2018, all Italian employees left the Group and all severances were paid. The termination obligation of EUR 47k, recognized as non-current
provision for employee benefits as of December 31, 2017, was derecognized in 2018.
8.8.4 Bonus plans
Accounting policy
For bonus payments after the end of the reporting period for the prior reporting period, a provision is recognized in the consolidated financial
statements and the corresponding expense is reported under personnel expenses. The amount of the provision is calculated individually for
each employee for whom either a contractual obligation to pay a bonus exists or for whom a constructive obligation exists based on past
company practice.
Recognition in group financial statements
Bonus liabilities are recognized within other current financial liabilities. See quantitative disclosures note 8.10.
8.9 Provsions
Accounting policy
According to IAS 37, provisions should be recognized if all of the following criteria are met:
• The Group has a present legal or constructive obligation.
• The obligation is the result of a past event.
• It is probable (more likely than not) that an outflow of resources embodying economic benefits will be required to settle the obligation.
• A reliable estimate can be made of the amount of the provision.
Provisions are not recognized for future operating losses.
A best estimate is made of the amount of the provisions taking into consideration all the discernible risks arising from the obligation. This
refers to the amount that is most likely needed to settle the liability. A cash outflow from current provisions is expected in the following

Financial statements
Annual Report 2018
86
financial year. Non-current provisions with a term of more than one year are discounted to the end of the reporting period. A pre-tax discount
rate is used that reflects current market assessments of the time value of money and risks specific to the given obligation.
Increases in provisions purely relating to additions to reflect the passage of time are posted to the statement of comprehensive income as
financial expenses.
If there are a number of similar obligations, the likelihood of an outflow of resources is estimated for the group of obligations. Provisions are
recognized even if the likelihood of an outflow of resources in connection with an individual obligation contained in this group is small.
Recognition in group financial statements
Non-current provisions
kEUR
Current
provisions
Pensions and
termination
benefits Other Total
As of January 1, 2018 315 51 5 371
Addition 184 - - 184
Reversal -32 -4 - -36
Utilization -232 -47 -3 -282
As of December 31, 2018 235 - 2 237
As of December 31, 2018, current provisions were mainly recognized for a legal dispute, see details below, for losses from rebate obligations
to customers, and for accrued onerous expenses of a closed warehouse location.
Other financial obligations
Obligations
As of December 31, 2018, future obligations from goods ordered but not yet delivered amounted to EUR 5,460k (December 31, 2017:
EUR 5,226k).
Litigation, guarantees and contingent liabilities
Two employees of Bebitus Retail S.L.U. have participated on the purchase price (incl. Earn Outs) of the legal entity through an Incentice Plan
amounting to 0.5% each. In 2018, the last Earn Out tranche – based on the final settlement agreement – was paid. End of 2018, these two
employees have sued the Group for unfair treatment from the final settlement agreement which resulted in a lower purchase price. The Group
counters the risk through recognition of a provision in the amount of the difference between actually paid purchase price and the historic
purchase price without purchase price adjustments.
Except for the legal dispute described above, there are no legal disputes as of December 31, 2018 and 2017. As of December 31, 2018 and
2017, no guarantees have been provided, and there were no contingent liabilities.
Significant accounting judgments and estimates
Provisions are determined on the basis of estimates to a large extent. As a result, it can be necessary to adjust the amount of a provision on
account of new developments and changes to the estimates. Changes in estimates and assumptions over time can have a material impact on
future earnings. It is possible that the Group may incur further expenses in addition to the provisions recognized which may have a material
impact on the financial performance and position of the Group.

Financial statements
Annual Report 2018
87
8.10 Financial liabilities
Accounting policy
Initial recognition and measurement
Financial liabilities are classified, at initial recognition, as financial liabilities at fair value through profit or loss, loans and borrowings, payables,
or as derivatives designated as hedging instruments in an effective hedge, as appropriate. All financial liabilities are recognized initially at fair
value and, in the case of loans and borrowings and payables, net of directly attributable transaction costs. Currently, there are no liabilities or
derivatives in windeln.de Group that are designated as hedging instruments
Subsequent measurement
The measurement of financial liabilities depends on their classification, as described below:
(1) Financial liabilities at fair value through profit or loss
Financial liabilities at fair value through profit or loss include financial liabilities held for trading and financial liabilities designated upon initial
recognition as at fair value through profit or loss.
Financial liabilities are classified as held for trading if they are incurred for the purpose of repurchasing in the near term. This category also
includes derivative financial instruments entered into by the Group that are not designated as hedging instruments in hedge relationships as
defined by IFRS 9. Separated embedded derivatives are also classified as held for trading unless they are designated as effective hedging
instruments.
Gains or losses on liabilities held for trading are recognized in the income statement. Financial liabilities designated upon initial recognition at
fair value through profit or loss are designated at the initial date of recognition, and only if the criteria in IFRS 9 are satisfied.
(2) Loans and borrowings
After initial recognition, interest-bearing loans and borrowings are subsequently measured at amortized cost using the Effective-Interest-Rate
(EIR) method. Gains and losses are recognized in profit or loss when the liabilities are derecognized as well as through the EIR amortization
process.
Amortized cost is calculated by taking into account any discount or premium on acquisition and fees or costs that are an integral part of the
EIR. The EIR amortization is included as finance costs in the income statement. This category generally applies to interest-bearing loans and
borrowings.
Derecognition
A financial liability is derecognized when the obligation under the liability is discharged or cancelled or expires. When an existing financial
liability is replaced by another from the same lender on substantially different terms, or the terms of an existing liability are substantially
modified, such an exchange or modification is treated as the derecognition of the original liability and the recognition of a new liability. The
difference in the respective carrying amounts is recognized in the income statement.
Offsetting of financial instruments
Financial assets and financial liabilities are offset and the net amount is reported in the consolidated statement of financial position if there is
a currently enforceable legal right to offset the recognized amounts and there is an intention to settle on a net basis, to realize the assets and
settle the liabilities simultaneously.
Recognition in group financial statements
Trade payables
As of December 31, 2018, trade payables amount to EUR 4,573k (December 31, 2017: EUR 14,779k), they are due within one year, and they are
non-interest bearing. This item also includes outstanding invoices for goods and services accrued as of the reporting date. Trade payables are
generally due in 0 to 90 days.

Financial statements
Annual Report 2018
88
Financial liabilities
kEUR December 31, 2018 December 31, 2017
Finance lease liabilities 15 43
Other financial debt - 16
Non-current financial liabilities 15 59
Money market loans - 3,500
Finance lease liabilities 39 63
Other financial debt - 12
Current financial liabilities 39 3,575
Financial liabilities 54 3,634
The existing credit line agreements with Commerzbank AG of EUR 5,000k and Deutsche Bank AG of EUR 5,000k expired on March 31, 2018.
As of December 31, 2017, the credit line was used through money market loans of EUR 3,500k that were repaid in early 2018.
Finance lease liabilities are measured at the present value of the future minimum lease payments. See note 10.
Other financial debt as of December 31, 2017, of EUR 28k relate to two bank loans of Feedo Group to finance fixed assets.
Other financial liabilities
kEUR December 31, 2018 December 31, 2017
Accrued rent-free period 21 59
Other non-current financial liabilities 21 59
Contingent consideration Feedo Group - 0
Debtors with credit balances 778 878
Other personnel-related liabilities 551 708
Bonus liabilities 346 403
Liabilities for supervisory board 229 268
Liabilities for other advisors 145 415
Audit of financial statements and tax advisory services 123 180
Expected refund obligations for returns 91 144
Sundry 72 59
Other current financial liabilities 2,335 3,055
Other financial liabilities 2,356 3,114
Contingent liabilities are described in note 6. Debtors with credit balances relate to customer credits due to overpayment or filed returns.
Expected refund obligations for returns are described in note 9.1. Other current liabilities do not bear interest.
In 2017, the Czech National Bank gave up its exchange rate peg between Czech Koruna and Euro. In order hedge the resulting foreign exchange
risks, the Group entered into a foreign exchange forward agreement that was accounted for as a Fair Value Hedge. The agreement comprised
18 separate tranches with maturity dates between January 5 and June 20, 2018. From this transaction, a gain of EUR 1k was realized, recognized
within profit or loss from discontinued operations.

Financial statements
Annual Report 2018
89
Additional information on financial instruments
The following table shows the carrying amounts and fair value of all financial liabilities and the allocation of financial statement positions to
the measurement categories:
December 31, 2018 December 31, 2017
kEUR
Carrying
amount Fair value
Carrying
amount Fair value
Financial liabilities at amortized cost:
Finance lease liabilities 54 54 106 106
Money market loans and other financial debt - - 3,528 3,528
Trade payables 4,573 4,573 14,779 14,779
Other financial liabilities 2,356 2,356 3,114 3,114
Financial liabilities at fair value through profit or loss:
Derivative financial instruments - - 0 0
Contingent consideration - - 0 0
Total financial liabilities 6,983 6,983 21,527 21,527
current 6,947 6,947 21,409 21,409
non-current 36 36 118 118
Due to the short-term maturities of trade payables and other current financial liabilities, the fair values for these items are assumed to be equal
to the carrying amounts.
Disclosures on capital management
The Group’s capital management targets are mainly related to maintaining the short-term and mid-term liquidity and financing of the
Company. The main focuses are on providing sufficient cash balances until the achievement of a positive free cash flow and an active
management of net working capital. The applicable measures comprise financing activities through equity or debt instruments, improvements
in the expenditure structure, optimization of inventories and management of supplier conditions.
windeln.de SE is not subject to any capital requirements under its articles of incorporation and bylaws.
The Group manages its capital structure by means of detailed liquidity plans as of each balance sheet date, and, triggered by changes in
economic environment, makes adjustments in each separate liquidity position.
8.11 Non-financial liabilities
Non-current non-financial liabilities do not exist. Current non-financial liabilities break down as follows:
kEUR December 31, 2018 December 31, 2017
VAT liabilities 71 905
Liabilities from social security 281 562
Liabilities from customs authorities 210 220
Other 13 3
Current non-financial liabilities 575 1.690

Financial statements
Annual Report 2018
90
8.12 Income taxes and deferred taxes
Accounting policy
The tax expense for the period comprises current and deferred taxes. Taxes are recognized in the statement of comprehensive income unless
they relate to items recognized directly in equity or in other comprehensive income, in which case the taxes are recognized in equity or in
other comprehensive income.
The current tax expense is calculated using the tax laws of the countries in which the legal entities operate and generate taxable income
effective as of the end of the reporting period. Management regularly reviews the tax declarations, above all as regards matters open to
interpretation and, where appropriate, recognizes provisions based on the amounts that are expected to be payable to the tax authorities.
Deferred tax is measured using the tax rates (and tax laws) that have been enacted or substantively enacted by the end of the reporting period
and that are expected to apply to the period when the asset is realized or the liability is settled.
Deferred tax is recognized for all temporary differences between the tax base of the assets and liabilities and their carrying amounts in the
IFRS financial statements as well as for unused tax losses (liability method).
If, however, deferred tax arises from the initial recognition of an asset or liability as part of a transaction other than a business combination,
which as of the date of the transaction has no effect on the accounting or taxable profit or loss, a deferred tax item is not recognized on the
date of initial recognition or subsequently. In addition, no deferred tax liabilities are reported upon initial recognition of goodwill. Deferred
tax liabilities for taxable temporary differences associated with investments in subsidiaries are recognized unless the timing of the reversal of
the temporary differences can be controlled by the Group and it is probable that the temporary differences will not reverse in the foreseeable
future. Deferred tax assets are only recognized on temporary differences or unused tax losses if there is reasonable assurance that they will be
realized in the near future.
The carrying amount of deferred tax assets is reviewed at the end of each reporting period and reduced to the extent that it is no longer
probable that sufficient taxable profit will be available to allow all or part of the deferred tax asset to be utilized. Unrecognized deferred tax
assets are reassessed at the end of each reporting period and are recognized to the extent that it has become probable that future taxable
profit will allow the deferred tax asset to be recovered.
Deferred tax assets and deferred tax liabilities are offset if a legally enforceable right exists to set off the recognized amounts and the deferred
tax assets and liabilities relate to income taxes levied by the same tax authority and either relate to the same taxable entity or different taxable
entities which intend to settle on a net basis.
Interest on arrears and/or late payment penalties on delayed income tax payments or income tax backpayments that are not deductible are
reported in the tax result.
The expected Group tax rate is calculated for each year using a mixed calculation of the individual tax rates of all companies included in the
consolidated financial statements.
Recognition in group financial statements
The major components of income tax expense and benefits for the financial years 2018 and 2017 are:
kEUR 2018 2017
Current income taxes 15 7
Actual income taxes 15 7
Deferred taxes from temporary differences -2.078 -4,071
Deferred taxes from tax losses 2 11
Deferred taxes -2,076 -4,060
Income tax benefit (-) and expense (+) -2,061 -4,053
thereof from continuing operations -446 -2,954
thereof from discontinued operations -1,615 -1,099
Current taxes in Germany are calculated by applying a uniform corporate income tax rate including solidarity surcharge of 15.83% (2017:
15.83%) to distributed and retained profits. In addition to corporate income tax, trade tax is levied on profits generated in Germany. Taking
into account the non-deductibility of trade tax as a business expense, the average rate for trade tax is 17.06% (2017: 17.10%), resulting in an
overall tax rate in Germany of 32.89% (2017: 32.93%). windeln.de SE’s deferred tax assets and liabilities were measured using the aggregate
tax rate of 32.89% (December 31, 2017: 32.93%).

Financial statements
Annual Report 2018
91
To calculate current taxes and deferred tax assets and liabilities in other countries, the following tax rates are applied:
Italy – 27.9%
Poland – 19.0%
Romania – 16.0%
Switzerland – 20.67%
Spain – 25.0%
Czech Republic – 19.0%
China – 10.0%
A reconciliation of income tax expense and the result of multiplying the result for the year with the effective tax rate of the Group for the
financial years 2018 and 2017 is as follows:
kEUR 2018 2017 R
Earnings before income taxes from continuing operations -27,565 -33,200
Earnings before income taxes from discontinued operations -12,188 -8,672
Earnings before income taxes -39,753 -41,872
Expected income tax benefit (-) and expense (+) -11,423 -11,745
Unused tax losses without deferred tax assets 9,084 5,556
Unrecognized deferred tax assets arising on temporary differences 43 52
Unrecognized deferred tax liabilities arising on permanent differences 105 -
Unrecognized deferred tax assets arising on transaction costs in equity -37 -15
Non-deductible operating expenses 202 2,479
Non-taxable expense / income - -418
Tax-free foreign dividends 17 -
Other effects -52 38
Effective tax benefit (-) and expense (+) -2,061 -4,053
Expected tax rate (in %) 28.73% 28.05%
Effective tax rate (in %) 5.19% 9.68%

Financial statements
Annual Report 2018
92
Deferred taxes break down as follows as of the reporting date:
kEUR December 31, 2018 December 31, 2017 R
Tax-loss carry-forwards 44,351 38,560
Inventories 150 266
Other current provisions 6 298
Other non-current provisions 123 2
Other current financial liabilities 18 30
Defined benefit obligations and other accrued employee benefits - 5
Trade receivables 35 26
Intangible assets 99 -
Other 39 21
Deferred tax assets 44,821 39,208
Intangible assets 480 2,696
Other 45 26
Deferred tax liabilities 525 2,722
After netting:
Deferred tax assets (total) 44,296 38,601
Deferred tax liabilities (total) - 2,115
Thereof recognized in the statement of financial position (deferred tax
assets) 1 15
Thereof recognized in the statement of financial position (deferred tax
liabilities) - 2,115
German loss carry-forwards for corporate income tax totaled EUR 132,729k (December 31, 2017: EUR 112,642k), German loss carry-forwards
for trade tax totaled EUR 129,975k (December 31, 2017: EUR 110,335k), and foreign tax-loss carry-forwards totaled EUR 4,641k (December 31,
2016: EUR 14,367k).
Deferred tax assets on German loss carry-forwards only have to be recognized in the amount in which deferred tax liabilities are recognized,
because windeln.de SE and Cunina GmbH have no profit history. Deferred tax assets on German tax-loss carryforwards of EUR 43,135k
(December 31, 2017: EUR 35,585k) were not recognized as of December 31, 2018. German tax-loss carryforwards can be used for an unlimited
period and do not expire. Due to the positive earnings trend based on the future business plans and the existing loss carryforward options,
management expects it will be possible to use the German loss carryforwards in full.
No deferred tax assets were recognized on foreign tax-loss carry-forwards in Spain due to the loss histories of Bebitus Retail S.L.U. Tax-loss
carry-forwards in Spain can be used for an unlimited period. Due to the existing cost-plus-agreement, carry-forwards can be utilized gradually.
Unrecognized deferred tax assets on tax-loss carry-forwards as of December 31, 2018 amounted to EUR 1,159k in Spain (December 31, 2017:
EUR 1,019k in Spain).
Due to the liquidation process of windeln.ch AG, all deferred taxes on tax-loss carry-forwards were derecognized (December 31, 2017: EUR 2k).
As in the prior year, there are no loss carry-forwards in Italy, Romania and China.
As of December 31, 2018 and 2017, no deferred tax liabilities were recognized on temporary differences associated with
investments in subsidiaries. If recognized, deferred tax liabilities would have amounted to EUR 324k as of December 31, 2018 (December 31,
2017: EUR 248k).
Significant accounting judgments and estimates
Deferred tax assets are recognized for all unused tax losses to the extent that it is more probable than not that taxable profit will be available
against which the losses can be utilized. Significant management judgment is required to determine the amount of deferred tax assets that
can be recognized, based upon the likely timing and the level of future taxable profits together with future tax planning strategies. If the actual
results were to differ from management’s expectations, this could have an adverse effect on financial performance, financial position and cash
flows.
Financial statements
Annual Report 2018
93
9. Notes to the consolidated statement of comprehensive income
9.1 Revenues and other operating income
Accounting policy
Revenue and other operating income are recognized when the performance obligations of the customer contract are satisfied, in accordance
with the provisions of IFRS 15. A performance obligation is satisfied when the customer obtains control of the promised goods or the promised
service. Revenue from the sale of goods is recognized when the goods have been delivered and the risks of ownership of the goods have been
transferred to the buyer. Revenue from the rendering of services is recognized over the period in which the services are rendered. For the
Group’s services, this mainly involves parcel inserts and marketing campaigns and/or online advertising (using banners) for which consideration
is paid.
Revenue is recognized in the amount of the transaction price of the customer contract, excluding taxes and other duties. Revenue is recorded
net of sales deductions and expected returns. The transaction price is allocated to the single performance obligations of the customer contract.
Receivables from customers are generally due for immediate repayment. End customers are granted a payment term of 14 days for goods
purchased on account. If customer payment transactions are made with payment service suppliers, the maximum payment term is 21 days
from the order date. Receivables from customers do not include financing components, they are not variable.
Management has analyzed its business relationships to determine if the Group is acting as a principal or an agent. Management has concluded
that the Group is acting as a principal in all of its revenue arrangements.
Expected returns
Customers are generally granted a 14 to 30-day right of return for sales transactions. The expected return of goods after the end of the
reporting period is shown on a gross basis in the statement of comprehensive income, with revenue reduced by the amount of expected
returned revenue estimated on the basis of historical return rates. The outflow of goods recognized in profit or loss upon dispatch of the
goods is corrected by the estimated amount of returns. A right to recover from the customer possession of the goods delivered is recognized
in other current non-financial assets, and a refund obligation to the customer for the amount of the purchase price is recognized in other
current financial liabilities.
Irrespective of the right of return, windeln.de meets statutory warranty obligations. No guarantees are granted beyond the minimum statutory
requirements. Warranty claims from customers are refunded by windeln.de, and then recharged to the original equipment manufacturer.
Loyalty bonus programs
windeln.de Group offers loyalty bonus programs that allow customers to collect loyalty points each time they shopped or each time they made
a successful referral. Additionally, loyalty points are granted for reasons of goodwill. The loyalty points collected can be used to obtain rebates
on future purchases within 24 months. Feedo Group – until August 2018 part of the windeln.de Group – offered customers loyalty points for
each purchase, that could be redeemed for a gift in a future purchase. Unredeemed loyalty points qualify as an unsatisfied performance
obligation, that no revenue is recognized for.
The transaction price of the customer contract is allocated between the products sold and the loyalty points issued, with the transaction price
allocated to the points equal to their relative stand-alone selling price. The relative stand-alone selling price of the points is calculated based
on the rebates granted when redeeming the loyalty points, or on the value of the gift, taking historical redemption rates into account. The
relative stand-alone selling price of the points issued is deferred, thus reducing revenue, and recognized as revenue when the points are
redeemed or when they expire.
Savings and customer benefit plans
windeln.de SE gives its customers the option of purchasing a “Pampers savings plan” for a fixed amount in order to get a certain discount
(percentage of the normal sales price) on future purchases of Pampers nappies and/or, depending on the version, of Pampers wet wipes,
fashion and toys over a contractually agreed period.
A baby starter box (“Storchenbox”) contains basic equipment for babies and additionally two vouchers that can be redeemed in a future
purchase with a discount.
The upfront fees generated from the sale of the savings and customer benefit plans qualify as an unsatisfied performance obligation. They are
deferred within deferred revenues, and recognized as revenues ratably over the validity period of the individual savings plans or as a one-time
revenue on the day of the voucher redemption.
Financial statements
Annual Report 2018
94
Recognition in group financial statements
Revenues
The Group’s revenue is mainly generated through the sale of baby and toddler products in Germany, China and other European countries.
kEUR 2018 2017R
Revenues from continuing operations by type
Revenue from the sale of merchandise 104,536 187,751
Revenue from other services 282 581
104,818 188,332
Revenues from continuing operations by region
Germany, Austria, Switzerland (GSA) 24,212 44,187
China 56,737 105,628
Other/rest of Europe 23,869 38,517
104,818 188,332
Contract assets as conditional right to consideration for the transfer of goods do not exist. Refund obligations for returns are recognized within
other current financial liabilities and amount to EUR 91k as of December 31, 2018, (December 31, 2017: EUR 144k). The corresponding right to
recover possession of goods is recognized within current non-financial assets and amounts to EUR 147k as of December 31, 2018,
(December 31, 2017: EUR 213k).
Contract liabilities are summarized within deferred revenues that represent the Group’s unsatisfied performance obligations to customers.
They stem from customer credits due to prepayments for outstanding shipments, purchased vouchers, loyalty bonuses and prepaid but
unfulfilled performance obligations from savings and customer benefit plans. Contract liabilities developed as follows:
Deferred revenues
kEUR
for
outstanding
shipments
for
purchased
vouchers
for
loyalty
bonuses
for savings
and
customer
benefit
plans
As of January 1, 2017 2,941 327 1,238 49
thereof recognized as revenue from continuing
operations in 2017 2,911 309 877 42
thereof recognized as revenue from discontinued
operations in 2017 30 - 63 -
As of December 31, 2017 2,268 279 488 22
thereof recognized as revenue from continuing
operations in 2018 2,167 124 281 16
thereof recognized as revenue from discontinued
operations in 2018 101 - 7 -
As of December 31, 2018 1,111 248 195 27
As an additional contract liability, accrued losses from rebate obligations to customers in the amount of EUR 29k are recognized within
provisions (see note 8.9).
The satisfaction of performance obligations from outstanding shipments happens within few days after the balance sheet date. Performance
obligations from purchased vouchers are satisfied within the statutory period of limitation. For loyalty bonuses and savings plans, performance
obligations exist for a maximum of 24 months, for customer benefit plans for a maximum of 36 months. The transaction price of the respective
performance obligations is the prepaid fee from customers. The transaction price of performance obligations from loyalty bonuses is
furthermore determined upon historical redemption rates.
There are no unsatisfied performance obligations, that are not included in the transaction prices. The practical expedient of IFRS 15.121 is not
applied.

Financial statements
Annual Report 2018
95
Other operating income
kEUR 2018 2017 R
Gains from currency differences 538 345
Time-barred customer overpayments or liabilities to suppliers 203 176
Income from sales to suppliers 77 -
Income from subleases 29 97
Other 107 90
Other operating income from continuing operations 954 708
Gains from currency differences mainly contains exchange rate gains between the date of origin and the date of payment of foreign exchange
receivables and liabilities.
Significant accounting judgments and estimates
The obligations from the loyalty points program are measured based on various estimates and assumptions. Pursuant to IFRS 15 “Revenue
from Contracts with Customers”, loyalty points issued and not yet redeemed are recognized at the relative stand-alone selling price. The
relative stand-alone selling price of a loyalty point is calculated based on the selling prices of the respective bonus products. Loyalty points
likely to expire are not deferred. The estimate of loyalty points likely to expire is based on the redemption rates observed to date, taking into
account the rules for taking part in loyalty points program.
To estimate the expected returns after the end of the reporting period, the revenue recorded in the period of the right of return was calculated
and measured taking into account the historical return rates.
For the recognition of revenues from savings and customer benefit plans, judgement was made that all customers use the saving plan ratably
over the validity period.

Financial statements
Annual Report 2018
96
9.2 Operating expenses
Accounting policy
Operating expenses are recognized in profit or loss when the purchased item is received or when a service is rendered.
Recognition in group financial statements
kEUR 2018 2017 R
Cost of sales from continuing operations
Cost of materials 77,863 137,731
Personnel expenses 835 1,164
Handling fees 301 1,140
Amortization, depreciation and impairments 36 32
Other cost of sales 116 139
79,151 140,206
Selling and distribution expenses from continuing operations
Logistics expenses 14,473 24,600
Personnel expenses 9,985 10,911
Amortization, depreciation and impairments 7,683 5,812
Marketing 5,051 9,026
Rental expenses 3,249 4,036
thereof warehouse rent 2,645 3,443
Payment processing 1,576 2,747
External services 1,126 2,145
Bad debts / valuation allowances 530 1,154
Sales commissions 361 447
Other selling and distribution expenses 717 1,211
44,751 62,089
Administrative expenses from continuing operations
Personnel expenses 4,488 15,020
IT environment 870 977
Legal and consulting costs 848 1,407
Amortization, depreciation and impairments 735 411
Rental expenses 297 289
Closing expenses and audit fees 259 308
Insurance 210 173
Supervisory board remuneration including out-of pocket expenses 202 203
Travel expenses 48 141
External services 36 281
Recruiting 22 381
Payment transactions 19 23
Other administrative expenses 592 763
8,626 20,377
Other operating expenses from continuing operations
Losses from currency differences 648 597
Expenses from sales to suppliers 68 -
Losses from the disposal of non-current assets 5 47
Other 85 5
806 649

Financial statements
Annual Report 2018
97
Losses from currency differences mainly contains exchange rate losses between the date of origin and the date of payment of foreign exchange
receivables and liabilities.
Expenses for defined benefit obligations and other accrued employee benefits
kEUR 2018 2017
Wages and salaries 14,470 17,501
Share-based payments -321 412
Share-based payments in connection with acquisitions 179 7,716
Social security expenses 2,309 2,994
Personnel expenses 16,637 28,623
thereof from continuing operations 15,308 27,095
thereof from discontinued operations 1,329 1,528
In 2018, the Group had an average of 297 permanent employees (2017: 430) and 15 working students (2017: 34). The contributions to the
statutory pension insurance schemes amount to EUR 1,180k (2017: EUR 1,708k).
In the past the Company issued virtual stock options, stock options, and restricted stock units to various employees as remuneration
components, see note 8.8.
9.3 Financial result
Accounting policy
Using the effective interest method, interest is recognized as an income or expense in the period in which it is incurred.
Recognition in group financial statements
kEUR 2018 2017 R
Interest and similar income 26 6
Other financial income - 1,129
Financial income from continuing operations 26 1,135
Interest and similar expenses 20 5
Other financial expenses 9 49
Financial expenses from continuing operations 29 54
Financial result from continuing operations -3 1,081
Other financial income in 2017 results mainly from changes in fair values of derivatives from the acquisition of Bebitus.
9.4 Earnings per share
Accounting policy
Basic earnings per share is the Group’s net profit for the period attributable to the shareholders divided by the weighted average number of
shares in circulation during the reporting period. Treasury shares do not qualify as shares in circulation and are therefore excluded from the
weighted average number of shares during the period, in which they are held by the company.
The diluted earnings per share is calculated by dividing the net profit for the period attributable to shareholders by the weighted average
number of shares in circulation during the reporting period plus the share equivalents that result in dilution.
Potential ordinary shares are antidilutive when their conversion to ordinary shares would increase earnings per share or loss per share from
continuing operations.

Financial statements
Annual Report 2018
98
Recognition in group financial statements
Basic earnings per share 2018 2017 R
Profit or loss from continuing operations (kEUR) -27,119 -30,246
Profit or loss from discontinued operations (kEUR) -10,573 -7,573
Profit or loss for the period (kEUR) -37,692 -37,819
Basic weighted average number of shares (thousands) 30,838 26,868
Earnings per share from continuing operations (EUR) -0.88 -1.13
Earnings per share from discontinued operations (EUR) -0.34 -0.28
Earnings per share (EUR)) -1.22 -1.41
As per IAS 33, the impact potential ordinary shares were not considered in the determination of diluted earnings per share if they were
antidilutive. Therefore, diluted earnings per share equal basic earnings per share.
10. Leasing
Accounting policy
The determination of whether an arrangement is, or contains, a lease is based on the substance of the arrangement at the inception date. It
requires an assessment of whether fulfillment of the arrangement is dependent on the use of a specific asset or assets or the arrangement
conveys a right to use the asset or assets, even if that right is not explicitly specified in an arrangement.
A lease is classified as a finance lease if all risks and rewards incidental to ownership are transferred to the lessee, and if the present value of
the leased asset exceeds a threshold EUR 5,000. All other leases are classified as operating leases.
Leased assets constituting purchases of assets with long-term financing are classified as finance leases. They are recognized at the inception
of the lease at the fair value of the leased asset or, if lower, at the present value of the minimum lease payments. The corresponding liability
is recorded as a lease liability under financial liabilities in the statement of financial position.
Assets leased under operating leases are not recognized. Instead, the lease payments are expensed on a straight-line basis over the term of
the lease.
Recognition in group financial statements
Operating lease commitments
The Group has concluded lease agreements for office spaces, various vehicles and furniture and fixtures. These leases have an average term
of between one and five years. Some of the lease agreements renew automatically, if not cancelled within a certain cancellation term. The
Group is not subject to any limitations by the leasing agreements.
The expenses recognized in the reporting period from operating leases amount to EUR 987k (2017: EUR 1,445k). Thereof, EUR 850k (2017:
EUR 1,135k) are recognized within continuing operations.
For continuing operations, future minimum lease obligations from non-cancellable operating leases as of December 31 are as follows:
kEUR 2018 2017 R
Less than one year 731 778
More than one year and up to five years 432 1,223
More than five years - -
Total 1,163 2,001
For discontinued operations, future minimum lease obligations as of December 31, 2017, were EUR 447. Due to the divestiture of the disposal
group, there is no comparable obligation as of December 31, 2018.
As of December 31, 2018, the Company had future minimum lease payments receivable under uncancellable operating leases for sublet office
and warehouse spaces of EUR 51k (December 31, 2017: EUR 3k), that are due within one year.

Financial statements
Annual Report 2018
99
Finance lease commitments
The Group has concluded various lease contracts for software, furniture, fixtures and office equipment, the design of such lease agreements
requires a recognition as finance leases. The agreements do not contain renewal options, purchase options or escalation clauses. Future
minimum lease payments under finance leases and lease-purchase contracts together with the present value of the net minimum lease
payments are as follows:
December 31, 2018 December 31, 2017
kEUR
Minimum
lease
payments
Present
value of
minimum
lease
payments
Minimum
lease
payments
Present
value of
minimum
lease
payments
Less than one year 40 39 68 63
More than one year and up to five years 16 15 45 43
More than five years - - - -
Total minimum lease payments 56 54 113 106
Less finance charges -2 - -7 -
Present value of minimum lease payments 54 54 106 106
11. Financial risk management
The Group is exposed to various financial risks (market risks comprising currency and interest rate risk, credit risk and liquidity risk) on account
of its business activities. The Group’s risk management system focuses on the unpredictability of developments on financial markets and aims
at minimizing potential adverse effects on the financial position of the Group.
Risk management is performed by the corporate finance department. As in the prior year, a Risk Coordinator assumes that function as part of
Group finance department and the function of treasury management. Both the Risk Coordinator and the Head of Treasury identify and assess
financial risks in close cooperation with the Group’s operating units. The management board prescribes the principles for Group-wide risk
management. Additionally, the management board prescribes policies for certain risks, such as financing activities with equity and debt
instruments, measures on hedging risks from foreign currencies, interest rate and credit risks; and the use of derivative and non-derivative
financial instruments.
The main financial liabilities used by the Group comprise interest-bearing financial debt, trade payables and other financial liabilities. The main
purpose of these financial liabilities is to finance the Group’s operations and to provide guarantees to support its operations. The Group has
trade receivables and other financial receivables as well as cash and cash equivalents resulting directly from its operating activities, from cash
received from shareholders in financing rounds, and from the IPO.
11.1 Market risk
Market risk is the risk that the fair value of future cash flows of a financial instrument will fluctuate because of changes in market prices. Market
risks include interest rates, currency and other price risks.
11.1.1 Currency risk
Accounting policy
The Group entities each prepare their financial statements in the currency of the primary economic environment in which the respective entity
operates (functional currency). Transactions in foreign currencies are initially translated to the functional currency using the respective spot
rate prevailing on the date of the transaction. Monetary assets and liabilities in foreign currencies are translated to the functional currency as
of the end of each reporting period using the respective spot rate. The related translation differences are recognized in profit or loss. In
addition, non-monetary items measured at fair value are translated using the spot rate on the date of measurement at fair value.
For the purpose of preparing the consolidated financial statements, the assets and liabilities of subsidiaries whose functional currency is not
the Euro are translated to Euro at the spot rate prevailing as of the end of the reporting period. Items in the statement of comprehensive
income are translated to Euro using the average rate for the respective financial year. The equity of the subsidiaries is translated at the
corresponding historical rates. The currency differences resulting from currency translation are reported as an adjustment item from the
translation of foreign currency financial statements within accumulated income and expenses directly in equity.

Financial statements
Annual Report 2018
100
The exchange rates of the main currencies relevant for currency translation developed as follows:
Average rate
(1 EUR = 1 CU FC)
Closing rate
(1 EUR = 1 CU FC)
Country Currency 2018 2017
Dec. 31,
2018
Dec. 31,
2017
Switzerland CHF 1.1550 1.1117 1.1269 1.1702
Poland PLN 4.2428 4.2570 4.3014 4.1770
Czech Republich CZK 25.5698 26.3258 25.7240 25.5350
People’s Republich of China CNY 7.8081 7.6290 7.8751 7.8044
Recognition in group financial statements
The currency risk can be broken down into two types of risk – the transaction risk and the translation risk.
The translation risk describes the risk of changes in the items in the statement of financial position and income statement of a subsidiary due
to exchange rate changes when translating the local separate financial statements into the Group’s currency. The changes caused by currency
fluctuations from the translation of items in the statement of financial position are presented in equity. The windeln.de Group is currently
exposed to such a risk at three of its subsidiaries, although the risk to the Group is classified as low on account of the size of these entities.
These four entities are merely service companies without their own external revenues. Currently, this risk is not hedged.
The transaction risk relates to the fact that exchange rate fluctuations can lead to changes in value of future foreign currency payments. The
Group has international operations and as a result is exposed to a currency risk based on the exchange rate changes of various foreign
currencies.
Since July 2016, windeln.de SE generates revenues in China through the Chinese Tmall platform (https://windelnde.tmall.hk). Transactions are
concluded in Renminbi Yuan (CNY). Receivables from customers arise in CNY, incoming customer payments are converted to EUR by the
payment provider, so that the company does not hold cash deposits in CNY. Due to the short payment terms and the low amount of CNY
receivables, currency risks are low, and they are currently not hedged. Sales to Chinese customers via the “www.windeln.cn.com” shop are
transacted exclusively in EUR.
Furthermore, in the “www.windeln.ch,” shop, windeln.de SE generates revenues in Swiss francs (CHF). As a result of the consolidation of
purchasing, logistics, marketing and administrational functions in the Group, cost of sales and operating expenses are primarily incurred in
EUR. The arising foreign exchange risks are currently not hedged.
Until the divestiture of Feedo Group in August 2018, the Group generated revenues Czech koruna (CZK) and in Polish Zloty (PLN), operative
expenses of the Feedo Group were primarily in CZK and PLN. To hedge the EUR foreign exchange risk, the company has entered into foreign
exchange forward agreements. See note 8.10.
The windeln.de Group also currently undertakes procurement in other currencies. The Group uses regular analyses to monitor the volume of
these purchases.
For the presentation of market risks from financial instruments, IFRS 7 requires sensitivity analyses that show the impact of hypothetical
changes in relevant risk variables on profit or loss for the period and on equity. The following analysis is one-dimensional and does not take
tax effects into account. The table shows the positive and negative effects if the Euro were to gain or lose 10% in value against the currencies
shown, if all other variables were to remain constant. Currency gains and losses on trade receivables and trade payables denominated in
foreign currencies affect net profit, which is then reflected in the same way in equity. Apart from these currency effects, there are no other
effects on equity with regard to financial instruments.
Currency
FX rate as per
December 31, 2018
(1 EUR = 1 CU FC)
Effect on net profit 2018
at +10% (in kEUR)
Effect on net profit
2018 at -10% (in kEUR)
CHF 1.1269 -15 18
CNY 7.8751 -7 10
The Group’s risk from exchange rate fluctuations for all other currencies not presented here is of no material significance.
Since forward exchange contracts to hedge cash flows or net investments in foreign subsidiaries do not exist, there are no related earnings
effects on equity based on the sensitivity analysis.

Financial statements
Annual Report 2018
101
11.1.2 Interest rate risk
The interest rate risk involves the influence of positive or negative changes in interest on the earnings, equity or cash flow for the current or
future reporting period. Interest rate risks from financial instruments may arise in the windeln.de Group mainly in connection with financial
debt and financial investments.
Until March 31, 2018, the parent company of the Group had concluded credit lines with variable interest rates and as such was exposed to an
interest rate risk in relation to the financial debts. The credit lines were only used for ca. one month. As of December 31, 2018, there is no
interest-bearing financial debt.
Additionally, cash and cash equivalents are exposed to risks from declining or negative interest rates on bank deposits; however, due to the
cash amount as of December 31, 2018, the risk is regarded insignificant.
11.2 Credit risk
Credit risk, otherwise known as default risk, is the risk that a counterparty will not meet its obligations under a financial instrument or customer
contract, leading to a financial loss. The scope of the credit risk of the windeln.de Group equals the sum of the trade receivables, other financial
assets, and cash and cash equivalents. The maximum credit risk in the event of default by a counterparty is the carrying amount of all these
named classes of financial asset as of the respective reporting date. There are no material concentration risks for the windeln.de Group.
Default risks for the windeln.de Group mainly relate to trade receivables from end customers. Credit limits are established for all end customers
based on internal rating criteria. In order to reduce default risks, safe payment methods are applied, e. g. credit card transactions with 3D
Secure or PayPal transactions with seller protection. Direct debit transactions are only offered to customers that meet certain solvency criteria.
Trade receivables arising in connection with the “buy on account” transactions are sold to a third party as they arise. Outstanding receivables
from customers are monitored on a regular basis and go through a three-stage dunning process. In addition, a framework agreement with a
collection service provider has been concluded. To reduce the credit risk, flatrate specific bad debt allowances are recognized for overdue
receivables, and expected credit losses are recognized for unduereceivables. Overdue receivables that have still not been paid after dunning
are derecognized in full and expensed.
In addition, there is a credit risk for cash and cash equivalents that banks can no longer meet their obligations. This credit risk is mitigated by
spreading deposits between a number of banks with good credit ratings.
11.3 Liquidity risk
The liquidity risk is the risk that the Group may not be in a position to settle its financial liabilities when they fall due. For this reason, the main
objective of liquidity management is to ensure the Group’s ability to pay at all times. The Group continually monitors its risk of a shortage of
funds using liquidity planning. This takes into consideration cash received and paid for financial assets and financial liabilities as well as
expected cash flows from operating activities. Cash flow forecasts are prepared at Group level. Momentarily, sufficient cash deposits are
available in order to cover net cash outflows from operating activities. Depending on the business development, the Group may need further
financial funding until the achievement of positive cash flows; either in form of equity instruments or debt instruments in order to secure the
Group’s solvency and to have a liquidity buffer.
The following table shows the Group’s financial liabilities broken down by maturities based on the remaining term as of the respective reporting
date and the contractually agreed undiscounted cash flows. All on-demand financial liabilities are always allocated to the earliest possible date.
Any variable interest payments from the financial instruments are calculated using the interest rates which were last fixed before the respective
reporting date.
kEUR
Less than 3
months
3 months up
to 1 year
More than 1
year
As of December 31, 2018 6,647 300 36
Financial liabilities 11 28 15
Trade payables 4,572 1 -
Other financial liabilities 2,064 271 21

Financial statements
Annual Report 2018
102
12. Related party disclosure
Related parties are all persons and companies that control the Group or exercise significant influence over it. This includes the Group’s key
management personnel, companies that are under the control or significant influence of such persons, close family members of such persons,
and major shareholders of windeln.de SE.
Pursuant to the principles in IAS 24, the members of the management board and the supervisory board of windeln.de SE are classified as key
management personnel. No shareholder of windeln.de SE has a direct or indirect significant influence on the Group. A significant influence is
assumed if more than 20% of the voting rights are held directly or indirectly.
Information about the Group’s structure and subsidiaries are presented under note Fehler! Verweisquelle konnte nicht gefunden werden..
windeln.de SE is the ultimate parent company.
Terms and conditions of transactions with related parties
The sales to and purchases from related parties are made at terms equivalent to those that prevail in arm’s length transactions. If outstanding
balances exist at the year-end, those are unsecured, interest free and settlement is made in cash. There have been no guarantees provided or
received for any related party receivables or payables. No impairment losses were recognized on receivables from related parties in the financial
years 2018 and 2017.
Transactions with key management personnel
The members of windeln.de SE’s management board and supervisory board were identified as related parties. The composition of the
management board and the supervisory board as well as the benefits granted are described under note 13.
Furthermore, in 2018 key management personnel have purchased goods in the amount of EUR 1k in the regular course of business. In 2017,
there were no comparable transactions. As of December 31, 2018 and 2017, there were no outstanding receivables from the sale of goods to
key management personnel.
The former management board members Konstantin Urban and Alexander Brand used their company cars after their retirement for a period
of four or seven months; fees for the company cars were recharged. This way, the Group could reduce its cost for cars that would have not
been used otherwise.
Transactions with other related parties
In 2018, no goods were sold close family members of key management personnel. In the prior year, goods of EUR 1k were sold to close family
members in the normal course of business.
In the financial years 2018 and 2017, there were no loans from or to related parties.
13. Corporate boards andremuneration
13.1 Management board
Name Professioin External mandates
Dr. Nikolaus Weinberger CFO of windeln.de SE and responsible
for Finance & Controlling, Corporate
Communication, Legal Affairs, Human
Resources, Technology, Product
Management, Business Intelligence and
Facility Management units
None
Matthias Peuckert
(since May 1, 2018)
CEO of windeln.de SE and responsible
for Marketing, Category Management,
Logistics, Customer Service,
Procurement, Strategy and Projects units
None

Financial statements
Annual Report 2018
103
Former management board members:
Name Profession at the day of resignation External mandates
Alexander Brand
Co-CEO until March 31, 2018, and
responsible for Strategy & Acquisitions,
Technology and Business Intelligence
units
- ABrand Management GmbH (managing
director)
- Packlink SL (member of the supervisory
board)
Konstantin Urban
Co-CEO until March 31, 2018, and
responsible for Marketing, Product
Management and Category
Management units
- Gut Vermögensverwaltung GmbH (managing
director)
- YORXS AG (chairman of the supervisory
board)
Jürgen Vedie
COO until September 30, 2018, and
responsible for Logistics, Customer
Service and Procurement units
None
13.2 Supervisory board
Name Profession External mandates
Willi Schwerdtle,
Chairman
Independent business
consultant, Partner at WP
Force Solutions GmbH
- adidas AG (deputy chairman of the
supervisory board)
- Eckes AG (member of the supervisory board)
-
Dr. Christoph Braun,
Deputy chairman
Managing Director of Acton
Capital Partners GmbH
- Grandview GmbH (managing director)
- Momox GmbH (chairman of the advisory
board)
- Sofatutor GmbH (chairman of the advisory
board)
- Cluno GmbH (chairman of the advisory oard)
- Vimcar GmbH (member of the advisory
board)
- Oetker Digital GmbH (member of the
advisory board)
Dr. Edgar Carlos Lange CFO at Lekkerland AG & Co.
KG
- Lekkerland Group (managing director and
supervisory board member in various entities
of the Group)
- Comsol AG (member of the supervisory
board)
- Conway – The Convenience Company S.A.
(member of the advisory board)
- shop and more AG (member of the
administrative board)
Petra Schäfer
(until June 25, 2018)
General Manager at Globus Warenhaus
Holding GmbH & Co. KG
GS1 Germany GmbH (member of the supervisory
board)

Financial statements
Annual Report 2018
104
Name Profession External mandates
Nenad Marovac
(until June 25, 2018)
CEO of DN Capital Limited
and Managing Partner of DN
Capital (UK) LLP
- DN Capital Gruppe (mandates in various
entities of the Group)
- Mister Spex GmbH (member of the
supervisory board)
- Shazam Entertainment Ltd. (member of the
board of directors)
- Happn S.A. (member of the board of
directors)
- Book a Tiger: BAT Household Services GmbH
(member of the supervisory board)
- Dojo Madness GmbH (member of the
supervisory board)
- Flying Jamon Ltd. (member of the board of
directors)
- HomeToGo GmbH (member of the advisory
board)
- X24 Factory GmbH (member of the
supervisory board)
- Joblift GmbH (member of the supervisory
board)
- Tourlane GmbH (member of the supervisory
board)
Dr. Hanna Eisinger
(since June 25, 2018)
Managing director of Get2trade GmbH None
Clemens Jakopitsch
(since June 25, 2018)
Independent business
consultant
- mybet Holding SE (deputy chairman of the
supervisory board)
- United Mobility Technology AG (deputy
chairman of the supervisory board)
- Nanorepo AG (member of the supervisory
board)
Tomasz Czechowicz Chief Executive Officer at MCI Capital
S.A., MCI Capital TFI S.A. and Private
Equity Managers S.A.
- MCI Venture Projects Sp. z o.o. VI S.K.A.
(member of the management board)
- MCI Venture Projects Sp. z o.o. VIII S.K.A.
(liquidator)
- MCI Venture Projects Sp. z o.o. IX S.K.A.
(member of the management board)
- MCI Venture Projects Sp. z o.o. X S.K.A.
(member of the management board)
- MCI Venture Projects Sp. z o.o. (Chief
Executive Officer)
- MCI Fund Management Sp. z o.o. (Chief
Executive Officer)
- Frisco S.A. (member of the supervisory board)
- ABC Data S.A. (member of the supervisory
board)
- Mobiltek S.A. (member of the supervisory
board)
- Eurokoncept Sp. z o.o. (chairman of the
supervisory board)
- Indeks Bilgisayar Sistemleri Mühendislik
Sanayi ve Ticaret A.S. (member of the board
of directors)
- Wearco Sp. z o.o. (member of the supervisory
board)
- PEM Asset Management Sp. z o.o. (Chief
Executive Officer)
- ABCD Management Sp. z o.o. (member of the
management board)
The profession describes the main occupation of the supervisory board member as of December 31, 2018, or at the day of resignation.

Financial statements
Annual Report 2018
105
External mandates comprise memberships in supervisory boards and other controlling bodies as of December 31, 2018, pursuant to Sec. 285
No. 10 German Commercial Code (HGB) and Sec. 125 No. 1 Stock Corporation Act (AktG). Additionally, they include active positions as board
members or managing directors as of December 31, 2018. Non-voting positions as board observers are not disclosed as external mandates.
13.3 Remuneration report
Outline of management board compensation
The Company does not present a breakdown of remuneration by individual management board members. As per Sec. 314 No. 3 and 286 No.
8 HGB, the management board was exempted from the disclosures pursuant to Secs. 285 No. 9 a) sentence 5 to 8, 314 (1) No. 6a sentence 5
to 8 HGB by way of a resolution of the extraordinary shareholder meeting on April 21, 2015.
Total compensation comprises fixed and variable components, and a long-term stock option plan.
The system of management board compensation at windeln.de is set up to provide an incentive for successful, long-term corporate growth.
The level of compensation is appropriate to the tasks and performance of the management board. Once a year, the supervisory board reviews
the appropriateness of management board compensation in consideration of the following criteria: the economic situation, the success and
future development of the company, and the tasks of the individual members of the management board and their personal performance. The
industry environment and the salary structure for the rest of the Company also play a role.
Fixed, non-performance-related compensation components
Management board members receive fixed compensation through their annual salary paid in equal monthly installments and benefits in kind.
Variable, performance-related compensation components
The variable compensation component rewards the performance of the management board for the last financial year in line with the
development of the Company and annual targets set by the supervisory board.
Three quarters of the variable bonus depend on the achievement of certain company targets (revenues, adjusted earnings before interest and
taxes, Free Cash Flow). Based on target achievement of 100% (target bonus), the maximum of this bonus component is EUR 176k for the year
2018 for those board members that were appointed as of December 31, 2018.
The remaining quarter of the bonus is granted by the supervisory board at its own discretion on the basis of an overall assessment of all
circumstances depending on the individual performance of each individual management board member. In the event of target achievement
of 100%, the maximum of both bonus elements together stands at EUR 235k for the year 2018 for those board members that were appointed
as of December 31, 2018. The bonus for each member of the management board is capped at 200%.
Share-based payment transactions
The issuing of entitlements to share-based payment is intended to compensate the long-term performance of the management in line with
the business plans.
For one member of the management board, two share-based payment commitments were made in 2015, one cash-settled (stock options)
and one equity-settled (restricted stock units, RSUs). For two members of the management board, in 2016 a portion of their prior year bonus
was compensated through the issuance of RSUs in accordance with the Long Term Incentive Program. All board members that were employed
as of the grant date, received stock options and RSUs in 2016 and 2017. Details on the prior years are available in the prior year’s publications.
In July 2018, 150,00 stock options and 50,00 RSUs were granted to the then active members of the management board. The fair values as of
the grant date and the reporting date for commitments made in 2018, that are all planned to be settled in real equity instruments (shares),
amount to EUR 117k. The fair value of the stock options granted in prior years and the RSUs that are to be settled in real equity instruments
(shares) is unchanged to the fair value at the grant date. Therefore, reference is made to the prior years’ publications. The fair value of stock
options granted in 2015 and settled in cash, amounts to EUR - as of December 31, 2018 (December 31, 2016: EUR -). Details of the respective
programs are outlined in note 8.8.1.
The share-based compensation expense (including the above mentioned adjustment in the quantity of the stock option program and the
CAGS summption), recognized in the comprehensive income statement in 2018, amounts to EUR 151k. As of December 31, 2018, no provision
was recognized for the cash-settled share-based payment obligation. For the equity-settled share-based payment obligations, an amount of
EUR 746k was recognized in the share premium as of December 31, 2018.
Benefits in kind
Benefits in kind received by the management board comprise the use of company cars.

Financial statements
Annual Report 2018
106
Below, the expense recognized in the financial years 2018 and 2017 is broken down by type of compensation:
kEUR 2018 2017
Fixed salary components 829 840
Variable salary components 117 298
Expenses for share-based payments 151 255
Expenses for vacation accruals 8 1
Benefits in kind and social security expenses 57 93
Total 1,162 1,487
The expense for 2018 comprises management remuneration for all board member during their employment at windeln.de. Fixed salary
component include continued pay of EUR 73k for one board member after his resignation. Variable salary components include EUR 9k for that
board member after his resignation.
The Group also grants the management board members adequate insurance coverage, in particular a D&O insurance policy with a deductible
in accordance with the provisions of the German Stock Corporation Act (AktG).
Supervisory board remuneration
Supervisory board compensation was amended by the Annual General Meeting held on June 25, 2018, and comprises defined, non-
performance-based annual payments. It is based on the responsibility and scope of activities of each supervisory board member. Supervisory
board members, who only exercise their office as a supervisory board member or chairman for part of the financial year, receive a
corresponding percentage of the compensation. The compensation for the supervisory board members falls due after the shareholder meeting
that takes receipt of or decides on the approval of the consolidated financial statements for the financial year for which the compensation is
being paid.
The annual supervisory board remuneration amounts to EUR 25k or EUR 60k in the case of the chairman. Committee members receive an
additional annual payment of EUR 5k, the chairman of a committee receives twice that amount. In addition to the aforementioned
compensation, appropriate out-of-pocket expenses incurred in connection with supervisory board activities are refunded, as well as VAT on
the compensation and the outof-pocket expenses if incurred by foreigners who are not liable to German tax. A total expense of EUR 202k was
recognized for supervisory board compensation for the financial year 2018 (2017: EUR 203k). One member of the supervisory board waived
its compensation in 2018.
The supervisory board members are covered by a Group D&O insurance policy.
14. Audit fees
The expense for the auditor’s fees, Ernst & Young GmbH Wirtschaftsprüfungsgesellschaft, including out-of-pocket-expenses, breaks down as
follows:
kEUR 2018 2017
Audit services 142 128
thereof relating to prior year 12 -2
Other assurance services - -
Tax advisory services - -
Other services - -
Total fee 142 128
15. Corporate governance declaration
windeln.de SE has submitted the declaration of compliance with the German Corporate Governance Code required by Sec. 161 AktG and made
it available to its shareholders on the website http://corporate.windeln.de.

Financial statements
Annual Report 2018
107
16. Events after the reportingdate
Accounting policy
Transactions announced after the end of the reporting period but which took place in substance prior to the end of the reporting period are
taken into account in the consolidated financial statements. Significant transactions that took place in substance after the end of the reporting
period are explained.
Transactions after the reporting date
Extraordinary General Meeting
At an Extraordinary General Meeting on January 9, 2019, it was resolved to reduce the share capital of windeln.de SE by way of an ordinary
capital reduction by a reverse stock split at a ratio of 10 : 1 from EUR 31,136,470 to EUR 3,113,647. This measure was intended to give the
Company the opportunity to raise capital on the capital market by issuing new shares. The merger of the shares reduces the number of shares
in the Company without affecting the assets of the Company.
Furthermore, it was resolved to increase the share capital of the Company by up to EUR 9,000,000 to EUR 12,113,647. The opportunity to
implement a capital increase was used for a capital increase against cash contributions while respecting the subscription rights of the
shareholders.
Capital Increase
With entry in the commercial register on March 14, 2019, windeln.de successfully completed the subscription rights capital increase resolved
by the Extraordinary General Meeting on January 9, 2019. The share capital was increased by issuing a total of 6,850,023 no-par value bearer
shares, each with a nominal value of EUR 1.00 and with a dividend entitlement from January 1, 2018, against cash contribution of EUR 6,850,023
from EUR 3,113,647 to EUR 9,963,670. Based on the fixed subscription price of EUR 1.48 per share, this results in gross issue proceeds of around
EUR 10.1m.
Munich, March 15, 2019
Matthias Peuckert Dr. Nikolaus Weinberger
RESPONSIBILITY STATEMENT BY THE MANAGEMENT BOARD
To the best of our knowledge, and in accordance with the applicable reporting principles, the consolidated financial statements give a true
and fair view of the net assets, financial position and results of operations of the Group, and the group management report includes a fair
review of the development and performance of the business and the position of the Group, together with a description of the material
opportunities and risks associated with the expected development of the Group.
Munich, March 15, 2019
Matthias Peuckert Dr. Nikolaus Weinberger

Financial statements
Annual Report 2018
108
INDEPENDENT AUDITOR’S REPORT
Copy of the audit opinion
We issued the following auditor’s report on the consolidated financial statements and the group management report:
Independent auditor’s report
Report on the audit of the consolidated financial statements and of the group management report
Opinions
We have audited the consolidated financial statements of windeln.de, Munich, its subsidiaries (the Group), which comprise the consolidated
statement of financial position as of 31 December 2018, the consolidated statement of comprehensive income for the fiscal year from 1 January
to 31 December 2018, the consolidated statement of cash flows and the consolidated statement of changes in equity for the fiscal year ending
on 31 December 2018, and the notes to the consolidated financial statements, including a summary of significant accounting policies. In
addition, we have audited the group management report of the Company for the fiscal year from 1 January 2018 to 31 December 2018.
In our opinion, on the basis of the knowledge obtained in the audit,
• the accompanying consolidated financial statements comply, in all material respects, with the International Financial Reporting Standards
(IFRS) as adopted by the EU, and the additional requirements of German commercial law pursuant to Sec. 315e (1) HGB, and in compliance
with these requirements, give a true and fair view of the assets, liabilities, and financial position of the Group as at 31 December 2018,
and of its financial performance for the fiscal year from 1 January 2018 to 31 December 2018, and
• the accompanying group management report as a whole provides an appropriate view of the Group’s position. In all material respects,
this group management report is consistent with the consolidated financial statements, complies with German legal requirements and
appropriately presents the opportunities and risks of future development.
Pursuant to Sec. 322 (3) Sentence 1 HGB, we declare that our audit has not led to any reservations relating to the legal compliance of the
consolidated financial statements and of the group management report.
Basis for the opinions
We conducted our audit of the consolidated financial statements and of the group management report in accordance with Sec. 317 HGB and
the EU Audit Regulation (No 537/2014, referred to subsequently as ”EU Audit Regulation”) and in compliance with German Generally Accepted
Standards for Financial Statement Audits promulgated by the Institut der Wirtschaftsprüfer [Institute of Public Auditors in Germany] (IDW). We
also considered the International Standards on Auditing (ISA) when conducting our audit. Our responsibilities under those laws, rules and
standards are further described in the section ”Auditor’s responsibilities for the audit of the consolidated financial statements and the group
management report” of our audit opinion. We are independent of the group entities in accordance with the requirements of European law
and German commercial and professional law, and we have fulfilled our other German professional responsibilities in accordance with these
requirements. In addition, in accordance with Art. 10 (2) f) of the EU Audit Regulation, we declare that we have not provided non-audit services
prohibited under Art. 5 (1) of the EU Audit Regulation. We believe that the audit evidence we have obtained is sufficient and appropriate to
provide a basis for our opinions on the consolidated financial statements and on the group management report.
Material uncertainty about the Company’s ability to continue as a going concern
Please refer to section 3.1 "Basis of presentation" in the notes to the consolidated financial statements and to section 3 "Outlook" of the group
management report, in which the management board states that the Group is exposed to significant uncertainties with respect to the
achievement of planned increases in revenues and margins as well as further planned cost reductions, whose occurrence is mandatorily
necessary to ensure the achievement of a positive net cash flow. The Group warns that if planned projects and restructuring measurements
cannot be implemented in the full extend or do not lead to the expected outcome, the solvency of the Group and thus its ability to continue
as going concern, until a positive net cash flow is achieved in 2020, will depend on its ability to collect further liquidity funds, e.g. through a
further equity financing or through borrowed capital, in order to maintain its solvency.
As stated in section 3 “Outlook” of the management report, these events or conditions, along with other matters as set forth, indicate that a
material uncertainty exists that may cast significant doubt on the Company’s ability to continue as a going concern and that represents a going
concern risk pursuant to Sec. 322 (2) Sentence 3 HGB.
Our opinions are not modified in respect of this matter.

Financial statements
Annual Report 2018
109
Key audit matters in the audit of the consolidated financial statements
Key audit matters are those matters that, in our professional judgment, were of most significance in our audit of the consolidated financial
statements for the fiscal year from 1 January 2018 to 31 December 2018. These matters were addressed in the context of our audit of the
consolidated financial statements as a whole, and in forming our opinion thereon; we do not provide a separate opinion on these matters.
In addition to the matters described in the section “Material uncertainty about the Company’s ability to continue as a going concern”, we
describe what we consider to be the key audit matters:
Cut off of Revenue recognition
Reasons why the matter was determined to be a key audit matter:
The business activity of the group consists of the online sale of items for babies and toddlers, primarily to private end customers. The revenue
and other operating income is recognized at the time when the performance obligations from the customer agreement is fulfilled. Revenues
are reduced by the expected returns. This estimate is based on historical return rates. Recognizing revenue is an area that carries significant
risk of material misstatement and is thus a key audit matter as there are a large number of these transactions and revenue is a financial
performance indicator.
Auditor’s response:
In the course of our audit, we examined the methods and procedures for revenue recognition set by the Company as well as the application
of accounting policies for sales and returns of goods (estimated returns). We assessed the design and appropriateness of the accounting-
related internal control system by process assessments as well as by substantive audit procedures.
As part of our substantive audit procedures, we evaluated the estimates and assumptions of the management sample-based and assessed the
underlying assumptions of the estimates.
Based on a random selection of samples we checked whether the prerequisites for the realization of revenues are in place and that the risk
has been transferred to the buyer. We analyzed the accuracy of the estimates of expected returns using the actual return rates of the past. Our
audit procedures did not lead to any reservations with regard to the cut-off of revenues.
Reference to related disclosures:
For information about the accounting policies used for revenue recognition, we refer to the disclosures in the notes to the consolidated
financial statements in the notes on the consolidated statement of comprehensive income in section 9.1. Revenue
Impairment testing of goodwill and intangible assets with indefinite useful lives
Reasons why the matter was determined to be a key audit matter:
Testing goodwill and intangible assets with indefinite useful lives for potential impairment was a key audit matter as the valuations depend
heavily on the estimate of future cash flows and the discount rate used, both have a material effect on the consolidated financial statements.
Auditor’s response:
To assess the appropriateness of the fair values determined by the management board we examined the underlying processes used to
determine fair values and we executed substantive audit procedures on the underlying assumptions. We also consulted valuation specialists
whether the budgets reflect general and industry-specific market expectations. We compared the valuation parameters used for the estimates
of the fair values - in particular the estimated growth rates, the weighted average cost of capital rates and the tax rates – with publicly available
market data and compared those parameters with changes on significant assumptions. We assured the methodical correctness of the model.
In order to assess the adherence to budgets, we also performed a comparison with historical planning data and the actual results on a spot
check basis.
To be able to assess a possible impairment risk in one of the main assumptions changed, we also carried out sensitivity analyses.
From our audit procedures we have no reservations regarding the recoverability of goodwill and intangible assets with indefinite useful lives.
Reference to related disclosures:
For information about the accounting policies used in connection with the impairment testing of goodwill and intangible assets with indefinite
useful lives, we refer to the disclosures in the notes to the financial statements in the section Notes on the consolidated statement of financial
position - intangible assets in No. 8.1.

Financial statements
Annual Report 2018
110
Other information
The executive directors are responsible for the other information:
• Declaration of the legal representatives and
• Corporate Governance of the annual report 2018
• Corporate Governance statement.
The supervisory board is responsible for the following other information:
• The report of the supervisory board 2018.
Our opinions on the consolidated financial statements and on the group management report do not cover the other information, and
consequently we do not express an opinion or any other form of assurance conclusion thereon.
In connection with our audit, our responsibility is to read the other information and, in so doing, to consider whether the other information
• is materially inconsistent with the consolidated financial statements, with the group management report or our knowledge obtained in
the audit, or
• otherwise appears to be materially misstated.
If, based on the work we have performed, we conclude that there is a material misstatement of this other information, we are required to
report that fact. We have nothing to report in this regard.
Responsibilities of the executive directors and the supervisory board for the consolidated financial statements and the group
management report
The executive directors are responsible for the preparation of the consolidated financial statements that comply, in all material respects, with
IFRSs as adopted by the EU and the additional requirements of German commercial law pursuant to Sec. 315e (1) HGB, and the IFRSs as a
whole as published by the International Accounting Standards Board (IASB) and that the consolidated financial statements, in compliance with
these requirements, give a true and fair view of the assets, liabilities, financial position, and financial performance of the Group. In addition,
the executive directors are responsible for such internal control as they have determined necessary to enable the preparation of consolidated
financial statements that are free from material misstatement, whether due to fraud or error.
In preparing the consolidated financial statements, the executive directors are responsible for assessing the Group’s ability to continue as a
going concern. They also have the responsibility for disclosing, as applicable, matters related to going concern. In addition, they are responsible
for financial reporting based on the going concern basis of accounting unless there is an intention to liquidate the Group or to cease operations,
or there is no realistic alternative but to do so.
Furthermore, the executive directors are responsible for the preparation of the group management report that, as a whole, provides an
appropriate view of the Group’s position and is, in all material respects, consistent with the consolidated financial statements, complies with
German legal requirements, and appropriately presents the opportunities and risks of future development. In addition, the executive directors
are responsible for such arrangements and measures (systems) as they have considered necessary to enable the preparation of a group
management report that is in accordance with the German legal requirements, and to be able to provide sufficient appropriate evidence for
the assertions in the group management report.
The supervisory board is responsible for overseeing the Group’s financial reporting process for the preparation of the consolidated financial
statements and of the group management report.
Auditor’s responsibilities for the audit of the consolidated financial statements and of the group management report
Our objectives are to obtain reasonable assurance about whether the consolidated financial statements as a whole are free from material
misstatement, whether due to fraud or error, and whether the group management report as a whole provides an appropriate view of the
Group’s position and, in all material respects, is consistent with the consolidated financial statements and the knowledge obtained in the audit,
complies with the German legal requirements and appropriately presents the opportunities and risks of future development, as well as to issue
an auditor’s report that includes our opinions on the consolidated financial statements and on the group management report.
Reasonable assurance is a high level of assurance, but is not a guarantee that an audit conducted in accordance with Sec. 317 HGB and the
EU Audit Regulation and in compliance with German Generally Accepted Standards for Financial Statement Audits promulgated by the Institut
der Wirtschaftsprüfer (IDW) and in addition observing the ISA will always detect a material misstatement. Misstatements can arise from fraud
or error and are considered material if, individually or in the aggregate, they could reasonably be expected to influence the economic decisions
of users taken on the basis of these consolidated financial statements and this group management report.

Financial statements
Annual Report 2018
111
We exercise professional judgment and maintain professional skepticism throughout the audit. We also:
• Identify and assess the risks of material misstatement of the consolidated financial statements and of the group management report,
whether due to fraud or error, design and perform audit procedures responsive to those risks, and obtain audit evidence that is sufficient
and appropriate to a basis for our opinions. The risk of not detecting a material misstatement resulting from fraud is higher than for one
resulting from error, as fraud may involve collusion, forgery, intentional omissions, misrepresentations, as the case may be the override
of internal control;
• obtain an understanding of internal control relevant to the audit of the consolidated financial statements and of arrangements and
measures (systems) relevant to the audit of the group management report in order to design audit procedures that are appropriate in
the circumstances, but not for the purpose of expressing an opinion on the effectiveness of these systems;
• evaluate the appropriateness of accounting policies used by the executive directors and the reasonableness of estimates made by the
executive directors and related disclosures;
• conclude on the appropriateness of the executive directors’ use of the going concern basis of accounting and, based on the audit evidence
obtained, whether a material uncertainty exists related to events or conditions that may cast significant doubt on the Group’s ability to
continue as a going concern. If we conclude that a material uncertainty exists, we are required to draw attention in the auditor’s report
to the related disclosures in the consolidated financial statements and in the group management report or, if such disclosures are
inadequate, to modify our respective opinions. Our conclusions are based on the audit evidence obtained up to the date of our auditor’s
report. However, future events or conditions may cause the Group to cease to be able to continue as a going concern.
• evaluate the overall presentation, structure and content of the consolidated financial statements, including the disclosures, and whether
the consolidated financial statements present the underlying transactions and events in a manner that the consolidated financial
statements give a true and fair view of the assets liabilities, financial position and financial performance of the Group in compliance with
IFRSs as adopted by the EU and the additional requirements of German commercial law pursuant to Sec. 315e (1) HGB;
• obtain sufficient appropriate audit evidence regarding the financial information of the entities or business activities within the Group to
express opinions on the consolidated financial statements and on the group management report. We are responsible for the direction,
supervision and performance of the group audit. We remain solely responsible for our audit opinions;
• evaluate the consistency of the group management report with the consolidated financial statements, its conformity with [German] law,
and the view of the Group’s position it provides;
• perform audit procedures on the prospective information presented by the management board in the group management report. On
the basis of sufficient appropriate audit evidence we evaluate, in particular, the significant assumptions used by the executive directors
as a basis for the prospective information, and evaluate the proper derivation of the prospective information from these assumptions.
We do not express a separate opinion on the prospective information and on the assumptions used as a basis. There is a substantial
unavoidable risk that future events will differ materially from the prospective information.
We communicate with those charged with governance regarding, among other matters, the planned scope and timing of the audit and
significant audit findings, including any significant deficiencies in internal control that we identify during our audit.
We also provide those charged with governance with a statement that we have complied with the relevant independence requirements, and
communicate with them all relationships and other matters that may reasonably be thought to bear on our independence and where
applicable, the related safeguards.
From the matters communicated with those charged with governance, we determine those matters that were of most significance in the audit
of the consolidated financial statements of the current period and are therefore the key audit matters. We describe these matters in our
auditor’s report unless law or regulation precludes public disclosure about the matter.
Other legal and regulatory requirements
Further information pursuant to Art. 10 of the EU Audit Regulation
We were elected as auditor by the Annual General Meeting on 2 June 2017. We were engaged by the Supervisory Board on 24 August 2017.
We have been the group auditor of windeln.de SE without interruption since fiscal year 2012.
We declare that the opinions expressed in this auditor’s report are consistent with the additional report to the audit committee pursuant to
Art. 11 of the EU Audit Regulation (long-form audit report).
German Public Auditor responsible for the engagement
The German Public Auditor responsible for the engagement is Ralf Bostedt.”
Munich, 15 March 2019
Ernst & Young GmbH
Wirtschaftsprüfungsgesellschaft
Bostedt Dr. Burger-Disselkamp
Wirtschaftsprüfer Wirtschaftsprüferin
[German Public Auditor] [German Public Auditor]

Annual Report 2018
112
SERVICE

Service
Annual Report 2018
113
GLOSSARY
Site visits
We define site visits as the number of series of page requests from the same device and source in the measurement period and include visits
to our online magazine. A visit is considered ended when no requests have been recorded in more than 30 minutes. The number of site visits
depends on a number of factors including the availability of the offered products, the effectiveness of our marketing campaigns and the
popularity of our online shops. Measured by Google Analytics.
Mobile visit share
We define mobile visit share (as % of site visits) as the number of visits via mobile devices (smartphones and tablets) to our mobile optimized
websites and mobile apps divided by the total number of site visits in the measurement period. Site visits of our online magazine are excluded.
Additionally, we excluded visits from China until end of 2016, because the most common online translation services on which most of our
customers who order for delivery to China rely to translate our website content are not able to do so from their mobile devices. Therefore,
only few Chinese customers ordered via their mobile devices. Due to the launch of our website in Chinese language in December 2016, site
visits from China are included since Q1 2017. Measured by Google Analytics.
Mobile orders
We define mobile orders (as % of number of orders) as the number of orders via mobile devices to our mobile optimized websites and mobile
apps divided by the total number of orders in the measurement period. Since Q1 2017, orders from China are included. Measured by Google
Analytics.
Active customers
We define active customers as the number of unique customers placing at least one order in one of our shops in the 12 months preceding the
end of the measurement period, irrespective of returns.
Number of orders
We define number of orders as the number of customer orders placed in the measurement period irrespective of returns. An order is counted
on the day the customer places the order. Orders placed and orders delivered may differ due to orders that are in transit at the end of the
measurement period or have been cancelled. Every order which has been placed, but for which the products in the order have not been
shipped (e. g., the products are not available or the customer cancels the order), is considered ‘‘cancelled’’. Cancellations are deducted from
the number of orders.
Average orders per active customer
We define average orders per active customer as number of orders divided by the number of active customers in the last 12 months.
Share of repeat customer orders
We define orders from repeat customers as the number of orders from customers who have placed at least one previous order, irrespective
of returns. The share of repeat customer orders represents the number of orders from repeat customers in the last twelve months divided by
the number of orders in the last twelve months.
Gross order intake
We define gross order intake as the aggregate Euro amount of customer orders placed in the measurement period minus cancellations. The
Euro amount includes value added tax and excludes marketing rebates.
Average order value
We define average order value as gross order intake divided by the number of orders in the measurement period.
Returns (as % of gross revenues from orders)
We define returns (as % of gross revenues from orders) as the returned amount in Euro divided by gross revenues from orders in the
measurement period. Since Q2 2016 including Bebitus returns. Gross revenues from orders are defined as the total aggregated Euro amount
spent by our customers minus cancellations but irrespective of returns. The Euro amount does not include value added tax.
Until Q1 2017 returns were calculated in relation to the net merchandise value. As the gross revenues from orders do not exclude returns and
include all marketing discounts, it is more reasonable to use this KPI for the return rate calculation than the net merchandise value. The change
of the calculation logic has no material impact on the reported return rate. The new calculation method is applied from Q2 2017 onwards.
Adjusted marketing cost ratio
We define marketing cost ratio as marketing costs divided by revenues in the measurement period. Marketing costs, which are recognized
within selling and distribution expenses in the consolidated income statement, mainly consist of advertising expenses, including search engine
marketing, online display and other marketing channel expenses, as well as costs for the marketing tools of the Group. Marketing expenses
incurred in 2018 in the shop pannolini.it are adjusted until the shop’s closure.

Service
Annual Report 2018
114
Adjusted fulfilment cost ratio
We define adjusted fulfilment cost ratio as adjusted fulfilment costs divided by revenues for the measurement period. Fulfilment costs consist
of logistics and warehouse rental expenses which are recognized within selling and distribution expenses in the consolidated income statement.
Adjusted fulfilment costs exclude costs and income in connection with the reorganization or closure of warehouse locations.
Adjusted other SG&A expenses (as % of revenues)
We define adjusted other SG&A expenses as adjusted other SG&A expenses divided by revenues. The other SG&A expenses comprise selling
and distribution expenses, excluding marketing costs and fulfilment costs, and administrative expenses as well as other operating income and
expenses. Adjusted other SG&A expenses exclude expenses and income in connection with share-based compensation, expansion,
reorganization, and impairment expenses for purchased intangible assets. In 2016, also expenses for company-law restructuring and ERP
system change were adjusted.
Operating contribution
We define operating contribution as adjusted gross profit reduced by adjusted marketing costs and adjusted fulfilment costs. The adjustments
of gross profit relate to expenses for share-based compensation. In 2018, income and expenses of the shop pannolini.it are adjusted until the
shop’s closure.
FINANCIAL CALENDAR 2019
Publication of full year 2018 results March 20, 2019
Publication of first quarter results 2019 May 8, 2019
DVFA Spring Conference (Small- & Mid Cap) May 2019
Annual General Meeting 2019 June 6, 2019
Publication of first quarter results 2019 August 8, 2019
Publication of nine months results 2019 November 13, 2019
IMPRINT
Editorial team and contact
windeln.de SE
Hofmannstrasse 51
81379 Munich, Germany
corporate.windeln.de
Corporate Communications
Sophia Kursawe
E-Mail: [email protected]
Concept, text, layout and design
windeln.de SE
Picture credits
Fotolia, iStock
Disclaimer
This annual report contains forward-looking statements, which are based on assumptions and estimates of the management of windeln.de SE.
Even if the company management is of the opinion that these assumptions and estimates are correct, the future actual development and the
future actual results may differ considerably from these assumptions and estimates due to various factors. These factors include, among others,
those mentioned in the Risk Report on pages 41 to 47. These factors may also include, for example, changes in the macroeconomic situation,
the legal and regulatory framework in Germany and the EU, and changes in the industry.
windeln.de SE does not assume any guarantee or liability that the future development and the actual results achieved in the future will
correspond with the assumptions and estimates expressed in this annual report. Windeln.de SE neither intends nor assumes any separate
obligation to update forward-looking statements in order to adapt them to events or developments after the date of this report.
The Annual Report is also available in German and can be downloaded in both languages from the Internet at corporate.windeln.de. In the
event of deviations, the German version of the annual report takes precedence over the English translation.