TABLE OF CONTENTS · 2013-02-10 · Theories of aging process Factors affecting aging Definition of...
103
An-Najah National University Faculty of Graduate Studies Nutrition of Elderly in the City of Nablus Prepared By Abeer Hasan Saeed Khwaireh Supervisor Dr. Samar Ghazal Submitted in Partial Fulfillment of the Requirements for the Degree of Master of Public Health, Faculty of Graduate Studies, at An-Najah National University Nablus, Palestine 2003
Transcript of TABLE OF CONTENTS · 2013-02-10 · Theories of aging process Factors affecting aging Definition of...

An-Najah National University
Faculty of Graduate Studies
Nutrition of Elderly in the City of Nablus
Prepared By
Abeer Hasan Saeed Khwaireh
Supervisor
Dr. Samar Ghazal
Submitted in Partial Fulfillment of the Requirements for the Degree of
Master of Public Health, Faculty of Graduate Studies, at An-Najah
National University Nablus, Palestine
2003

ii
Nutrition of Elderly in the City of Nablus
Prepared By
Abeer Hasan Saeed Khwaireh
This thesis was defended successfully on 16/5/2004 and approved by
Committee Members Signature
1- Dr. Samar Ghazal ----------------------
2- Dr. Suleiman Khalil ----------------------
3 - Dr. Jamal Alaul ----------------------

iii
Dedication
This study is dedicated to the pure soul that is the first cause behind it. Who
advised encouraged and urged me to go after the M.Sc. To my father, hope
you rest in peace
Your daughter

iv
Acknowledgment
I would like to expire my profound gratitude and appreciation to my
adviser Dr. Samar Chazal for her support, guidance and efforts that
contributed to the completion of this study.
My special thanks for my mother; sister, my family and community
service center (CSC) An-Najah University.

v
Table of Contents
Page Subject
iii
iv
v
vii
x
xi
xii
Dedication
Acknowledgments
Table of contents
List of tables
List of figures
Glossary
Abstract
1 Chapter One Introduction 2
2
2
3
4
4
5
5
7
8
8
9
9
10
10
10
11
11
11
12
12
13
13
14
14
14
14
14
15
15
Aging process
What does aging mean?
Theories of aging process
Factors affecting aging
Definition of elderly people
Classifications of elderly people
Changes in health status & organ functions that take
place during aging
Physical changes observed during aging
Cellular changes with aging
Specific nutritional needs of older persons
Elderly diet and fiber
Elderly People and Calorie Needs
Foods to Include for Optimum Health
Factors affecting the intake of food
Physical factors
Loss of teeth.
Loss of neuromuscular coordination
Physical discomfort
Impaired hearing & vision
Physiological factors :
Body composition
Diminished sense of taste & smell
Anorexia
Social factors
Economic considerations
Nutrition misinformation
Psychological factors
Living alone
Depression
Anxiety
1.1
1.1.1
1.1.2
1.1.3
1.2
1.3
1.4
1.4.1
1.4.2
1.5
1.5.1
1.5.2
1.5.3
1.6
1.6.1
1.6.1
1.6.1.2
1.6.1.3
1.6.1.4
1.6.2
1.6.2.1
1.6.2.2
1.6.2.3
1.6.3
1.6.3.1
1.6.3.2
1.6.4
1.6.4.1
1.6.4.2
1.6.4.3

vi
15
16
16
16
17
17
18
19
19
19
Other factors that may indirectly affect food
consumption in elderly
Elderly statistics
General statistics
Female statistics
World wide (aging statistics)
The population percent of elderly people in Palestine
The population percent of elderly people in the city of
Nablus
Aim of the study
Research hypothesis
1.7
1.8
1.8.1
1.8.2
1.8.3
1.8.4
1.8.5
1.9
1.10
20 Chapter Two Methodology 21
21
22
22
23
23
23
23
Population of study (sample )
Data Collection
Tools
Procedure
Data analysis
Analysis of descriptive studies
2Analysis of medical – Nutrition studies
Analysis of relationships
2.1
2.2
2.2.1
2.3
2.4
2.4.1
2.4.2
2.4.3
24 Chapter Three Results 25
25
27
28
28
29
29
30
30
31
31
32
32
35
39
41
45
48
52
54
57
Rofile of the study population
Social and demographic profile
Health profile
Risk factors profile
Denture
Vision and hearing
Food taste
Smoking
Physical activity
Kind of food consumption
Body mass index measurements
Relationship results
Age
place of living
Gender
Income
Educational level
BMI categorized
Constipation
Chronic medical diseases
Chronic medication use
3.1
3.1.1
3.1.2
3.1.2
3.1.3.1
3.1.3.2
3.1.3.3
3.1.3.4
3.1.3.5
3.1.3.6
3.2
3.3
3.3.1
3.3.2
3.3.3
3.3.4
3.3.5
3.3.6
3.3.7
3.3.8
3.3.9

vii
59 Chapter Four Discussion 60
60
60
61
61
61
63
63
64
65
65
65
66
67
67
68
68
68
69
70
70
71
72
72
72
74
77
82
�
Social profile
Gender
Age
Residence
Education of the study sample
Income
Health profile
Chronic diseases in elderly people
Medication use
Risk factors profile
Denture
Smoking
Physical activity
Kind of food
Relationships
Social factors and nutrition
Socioeconomic status and milk consumption
Place of living and nutrition in elderly
Age and food difficulties
4.4.2 BMI relationships
1 BMI and kind of food
BMI and physical activity
Chronic diseases and food consumption
Medications and food consumption
Conclusion
Recommendations
References
Questionnaire
Abstract in Arabic
4.1
4.1.1
4.1.2
4.1.3
4.1.4
4.1.5
4.2
4.2.1
4.2.2
4.3
4.3.1
4.3.2
4.3.3
4.3.4
4.4
4.4.1
4.4.1.1
4.4.1.2
4.4.1.3
4.4.2
4.4.2.1
4.4.2.2
4.4.3
4.4.4
4.5
4.6

viii
List of Tables
Title Page
Table 1 Average calorie needs throughout life 9
Table 2 Gender, age, residence & religion profile of the
study population.
25
Table 3 Education, income & wages of the study sample
population.
26
Table 4 Chronic diseases distribution . 27
Table 5 Medications & Number of medicines taken daily. 27
Table 6 Denture profile of the study population. 28
Table 7 Vision and hearing of the study population. 29
Table 8 Food taste of the study population. 29
Table 9 Smoking profile of the study population. 30
Table 10 Physical activity profile of the study population. 30
Table 11 Food consumption of the study population. 31
Table 12 BMI of the study population. 31
Table 13 Age & Food Difficulty. 32
Table 14 Age & bone problems. 33
Table 15 Age & current Sport Practice. 34
Table 16 Place Of Living & Milk consumption . 35
Table 17 Place of Living & vegetables and fruits. 36
Table 18 Place Of Living & Sport Practice. 37
Table 19 Place Of Living & Fats and Sweets consumption. 38
Table 20 Gender & Smoking. 39
Table 21 Gender & Past Sport practice. 40
Table 22 Income & Smoking. 41
Table 23 Income & milk consumption. 42
Table 24 Income & past sports practice. 43
Table 25 Income & sport practice. 44
Table 26 Educational level & milk consumption. 45
Table 27 Education Level & Bones & Joints problems . 46
Table 28 Educational level & past sport practice. 47

ix
Table 29 BMI Categorized & smoking. 48
Table 30 BMI Categorized & Vegetables and fruits. 49
Table 31 BMI Categorized & Current Sport practice. 50
Table 32 BMI Categorized & Fats and Sweets consumption. 51
Table 33 Constipation & Vegetables and Fruits consumption. 52
Table 34 Constipation & Fats and sweets consumption. 53
Table 35 Chronic diseases & vegetables and fruit
consumption.
54
Table 36 Chronic diseases & Fats and Sweets consumption. 56
Table 37 Medication use & Vegetables and Fruits
consumption.
57
Table 38 Medication use & Fats and Sweets consumption. 58

x
List of Figures
Page Title
5 Physiological changes noticed during aging. Fig.1
12 Changes in body composition with age. Fig.2
33 Age & Food Difficulty. Fig.3
34 Age & Bone problems. Fig.4
35 Age & current sport practice. Fig.5
36 Place of living & milk taking. Fig.6
37 Place of living & vegetables and fruits. Fig.7
38 Place of living & sport practice. Fig.8
39 Place of living & fats-sweet. Fig.9
40 Gender & smoking. Fig.10
41 Gender & past sport practice. Fig.11
42 Income & smoking. Fig.12
43 Income & milk consumption. Fig.13
44 Income & past sport practice. Fig.14
45 Income & current sport practice. Fig.15
46 Education level & milk consumption. Fig.16
47 Education level & bones and joints problems. Fig.17
48 Education level & past sport practice. Fig.18
49 BMI categorized &smoking. Fig.19
50 BMI categorized & vegetables and fruit. Fig.20
51 BMI categorized & current sport practice. Fig.21
52 BMI categorized & fats and sweets consumption. Fig.22
53 Constipation & vegetables and fruit consumption. Fig.23
54 Constipation & fats and sweets consumption. Fig.24
55 Chronic diseases & vegetables and fruit consumption. Fig.25
56 Chronic diseases & fats and sweets consumption. Fig.26
57 Medication use & Vegetables and Fruits consumption. Fig.27
58 Medication use & fats and sweet consumption. Fig.28
xi
Glossary:
1- BMI (Body mass index).
2- WHO (World health organization).
3- FAO (Food and agriculture organization).
4- PCBS (Palestinian Central Bureau of Statistics).
xii
Nutrition Of Elderly In the city of Nablus
Prepared By
Abeer Hasan Saeed Khwaireh
Supervisor
Dr. Samar Ghazal
Abstract
The challenge of meeting the nutritional needs of elder population is
compounded by the lack of research in this area, This challenge is
augmented by the interaction of current and past social, economic, and
psychologic factors, a wide range of individual differences in the biologic
process of aging.
Nutritional requirements should, at least in part, be based on biologic
changes caused by aging as well as requirements of disease processes
prevalent in aging, such as cardiovascular disease.
The goal of our study, the first of its kind in Palestine is to find out
the nutrition status and it’s risk factors in elderly people in Palestine
represented by elderly in Nablus.
The study sample consisted of 223 elderly from the city of Nablus, who
were randomly chosen. They were asked to answer a questionnaire about
their social profile, health profile and risk factors affecting nutrition, also
Body Mass Index (BMI) was measured. All data were analyzed using
Statistical Package for Social Studies (SPSS version 10).
Although some results were inconsistent with our expectation,
especially those related to BMI and its relation with risk factors, we had
very important positive results.

xiii
There was an over all poor knowledge about nutrition among elderly
that necessitates public education about nutrition facts.
Our results highlight the need for more attention from the health
policy makers to the relationship of nutrition and disease.
More important role of professional nutrition specialists in the health
system is called for.

Chapter one
Introduction

٢
1. Introduction:
1.1 Aging process
1.1.1 What does aging mean?
Aging is a process in which there is a reduced capacity to replace
worn out cells .It is a continuous process that occurs throughout life cycle,
resulting in procreative body changes. Aging is individual and it’s a part of
a total life process. Susceptibility to disease increases with age, since there
is a reduced capacity to handle physical stresses. (Harrick, 1982).
1.1.2 Theories of aging process:
Many theories have been advanced to explain the biochemical and
physiological bases of the aging process, the following are of importance :
1. “ The clinker “ theory ; which attributes the loss of cell function
with aging to the accumulation of waste in the body.
2. The wear and tear theory, which attributes aging to the chemical and
mechanical exhaustion of the cells.
3. The somatic mutation theory, which suggests that somatic cells are
inactivated.
4. The auto immune theory, which suggests that, with aging,
antibodies that usually attack bacteria and foreign cells start to attack
normal body cells (Guthrie, 1986).
٣
1.1.3 Factors affecting aging:
There are many factors that influence the aging process and the effects on
different people. These include:
• Genetics; the tendencies inherited from our parents ؛
• Wear and tear; the wearing out of body tissues ؛
• Life styles; the habits people adopt during their lives and the work they
do؛
• Illness; developing at any stage of life ؛
• Social factors; stress, relationships, culture ؛
• Occupation; different occupations may be more likely to increase wear
and tear and also cause some illnesses.(Irving ,Munday, Rowlands, 2001)
1.2 Definition of elderly people
The definition of an older or elderly person is dependent upon a
multitude of issues and many definitions can be correctly applied. In
1875, in Britain, the Friendly Societies Act, enacted the definition of old
age as, "any age after 50" (Roebuck, 1979).
The selection of age of 65 years, which has been most common, is
attributed to Otto von Bismarck, who arbitrarily chose that age in
establishing Germany’s social security program in the 1880s, and for
century that age level has persisted (Beal, 1980).Yet pension schemes
mostly used age 60 or 65 years for eligibility. (Roebuck, 1979).

٤
At the moment, there is no United Nations standard numerical criterion,
but the United Nation agreed that the cutoff is 60+ years to refer to the
older population (Harare MDS Workshop, 2001)
1.3 Classifications of elderly people
Age classification varies between countries and over time, reflecting
in many instances the social class differences or functional ability related to
the workforce, but more often it is a reflection of the current political and
economic situation. (Thane, 1978).
Elders may be placed in one of three categories based on biologic
characteristics:
1. Successful agers, who have little or no loss in functioning (Kahn RL,
1987)
2. Usual agers , who have a variety of chronic medical conditions and
disabilities but live independently (FeldmanJJ,1991)
3. Accelerated agers, who carry a heavy burden of chronic diseases and
disabilities(Wielen RPJ,1995).
Another classification refers to age:
1. The young old: are people aged 60 to ٧٥ years and
2. The old old: are people over 75 years. The old old is often referred to
as the vulnerable old in that they are especially at risk of physical,
psychological and social traumas .(Irving, Munday, Rowlands, 2001)
One of the more vulnerable groups among the aging elderly is the so-
called "frail elderly." There is no operational definition for "frailty," and

٥
definitions vary. Often, frailty is described broadly, such as "a chronic
disease threatening life expectancy" (MacAdam M, 1989)
1.4 Changes in health status & organ functions that take place during
aging :
1.4.1 Physical changes observed during aging:
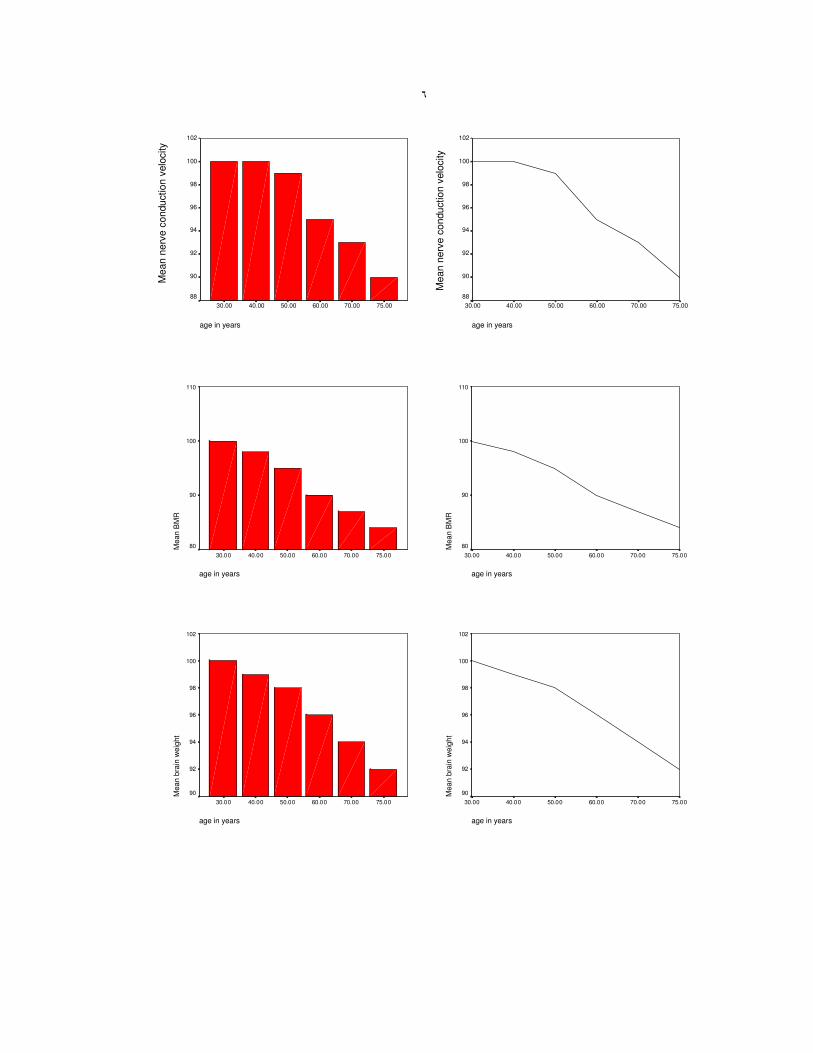
The average ages at which various physiological changes
occur are shown in the following figures: (Qnawi,1998)
age in years
75.0070.0060.0050.0040.0030.00
Me
an
CA
RD
IAC
OU
TP
UT
AT
RE
ST
110
100
90
80
70
60
age in years
75.0070.0060.0050.0040.0030.00
Me
an
CA
RD
IAC
OU
TP
UT
AT
RE
ST
110
100
90
80
70
60
age in years
75.00 70.00 60.00 50.00 40.00 30.00
110
100
90
80
70
60
age in years
75.00 70.00 60.00 50.00 40.00 30.00
110
100
90
80
70
60 Mean filt
ration r
ate
of kid
neys
Mean filt
ration r
ate
of kid
neys
٦
age in years
75.0070.0060.0050.0040.0030.00
Mean B
MR
110
100
90
80
age in years
75.0070.0060.0050.0040.0030.00
Mean B
MR
110
100
90
80
age in years
75.0070.0060.0050.0040.0030.00
Mean b
rain
weig
ht
102
100
98
96
94
92
90
age in years
75.0070.0060.0050.0040.0030.00
Mean b
rain
weig
ht
102
100
98
96
94
92
90
age in years
75.00 70.00 60.00 50.00 40.00 30.00
102
100
98
96
94
92
90
88
age in years
75.00 70.00 60.00 50.00 40.00 30.00
102
100
98
96
94
92
90
88
Mean n
erv
e c
onduction v
elo
city
Mean n
erv
e c
onduction v
elo
city
٧
age in years
75.0070.0060.0050.0040.0030.00
Mean b
reath
ing c
apacity
110
100
90
80
70
60
50
40
30
age in years
75.0070.0060.0050.0040.0030.00
Mean b
reath
ing c
apacity
110
100
90
80
70
60
50
40
30
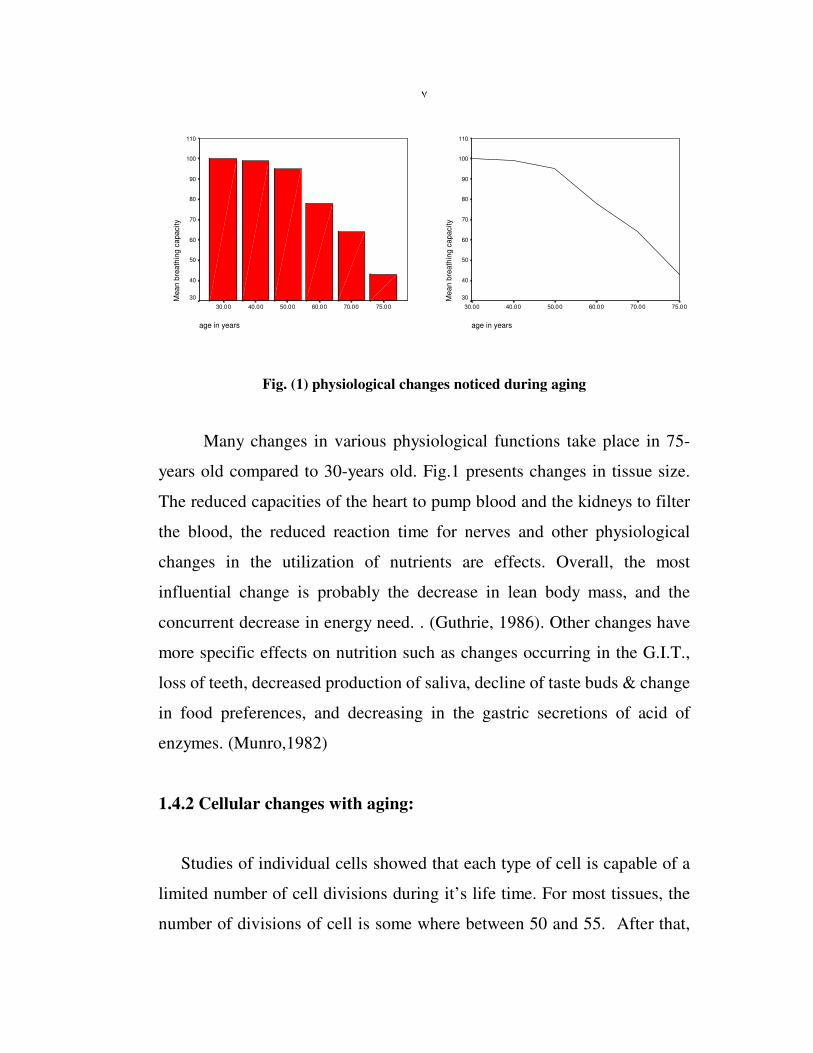
Fig. (1) physiological changes noticed during aging
Many changes in various physiological functions take place in 75-
years old compared to 30-years old. Fig.1 presents changes in tissue size.
The reduced capacities of the heart to pump blood and the kidneys to filter
the blood, the reduced reaction time for nerves and other physiological
changes in the utilization of nutrients are effects. Overall, the most
influential change is probably the decrease in lean body mass, and the
concurrent decrease in energy need. . (Guthrie, 1986). Other changes have
more specific effects on nutrition such as changes occurring in the G.I.T.,
loss of teeth, decreased production of saliva, decline of taste buds & change
in food preferences, and decreasing in the gastric secretions of acid of
enzymes. (Munro,1982)
1.4.2 Cellular changes with aging:
Studies of individual cells showed that each type of cell is capable of a
limited number of cell divisions during it’s life time. For most tissues, the
number of divisions of cell is some where between 50 and 55. After that,

٨
the cell type is incapable of any further divisions and therefore is unable to
repair or replace itself. (Guthrie, 1986)
The age at which a cell reaches this stage is determined by great many
factors such as socioeconomic status, ethnicity, education, health status,
perception of health status, functional ability, access to health / nutrition
care, food security, and food choices. (McBean, 2001)
1.5 Specific nutritional needs of older persons
Elderly people are particularly vulnerable to malnutrition. Moreover,
attempts to provide them with adequate nutrition encounter many practical
problems. Their nutritional requirements are not well defined. Since both
lean body mass and basal metabolic rate decline with age, an elderly person
energy requirement per kilogram of body weight is also reduced .The
challenge of meeting the nutritional needs of older population is
compounded by the lack of research in this area, the interaction of current
and past social, economic, and psychological factors, and the wide range of
individual differences in the biologic process of aging (Williams 1985)
1.5.1 Elderly Diet and Fiber:
As the body ages, the gastrointestinal tract changes and people tend
to develop more problems with constipation. A high-fiber diet and Cooked
or baked vegetables, fresh fruit and high-fiber breakfast cereals can prevent
that (Remig2002)

٩
1.5.2 Elderly People and Calorie Needs
Table 1 Average Calorie Needs Throughout Life
Age Group 1-3 4-6 7-10 11-14 15-18 19-59 60-74 75+
Calorie Needs
(Male)
1230
1715
1970
2220
2755
2550
2350
2100
Calorie Needs
(Femal)
1165
1545
1740
1845
2110
1940
1900
1810
Table 1 describes the average values only. Heavier or more active
people may need more. (Remig, 2002).
FAO/WHO recommends a decrease of 10%in energy from ages
60to 69, and additional 10% after age 70. Since both lean body mass and
basal metabolic rate decline with age, an elderly person’s energy
requirement per kilogram of body weight is also reduced. (GUTHRIE,
1986).
1.5.3 Foods to Include for Optimum Health
A balanced diet must contain a mixture of important food groups
daily. The following food groups have special importance for optimum
health.
•••• Fruit In particular those rich in Vitamin C like blackberries,
strawberries, blackcurrants, citrus fruit etc.
• Vegetables In particular vegetables high in Vitamin A (beta-carotene)
and Vitamin C., like Carrots, squash, sweet potato, tomatoes, spinach,
kale, collard greens etc.
• Protein Eggs, white fish, milk, cheese, yogurt, lean meat, chicken etc.
١٠
• Pulses and Grains for Fiber Including lentils, chickpeas, brown rice,
whole wheat bread, whole wheat cereals, whole wheat crackers.
(Remig2002)
1.6 Factors affecting the intake of food:
• As with any age- group, the adequate nutrition for elderly’s diet is the
result of a variety of factors that determine dietary intake, the utilization
of nutrients, and finally the nutrient requirements.
• Both nutrient intake and nutrient needs are determined by biological and
social /psychological factors (Guthrie,1986)
1.6.1 Physical factors:
1.6.1. 1 Loss of teeth.
The longer people live, the more likely they are to lose their teeth. Some
dental problems are attributed to the periodontal disease(Disease in tissue
surrounding the teeth). Causes of periodontal disease include a low
calcium/phosphorous ratio in the diet, and low vitamin D intake.
Regardless of the cause, the absence of a satisfactory method of chewing
food leads a person without teeth to many modifications in eating patterns.
When foods high in cellulose (such as fruit & vegetables) are eliminated
from the diet, dietary bulk is reduced, with a resulting decrease in gastro -
intestinal motility and more problems of elimination. A reduced intake of
meat- one of the best sources of available iron- will possibly result in
impaired iron status, which in turn may influence behavior, particularly
activity.

١١
If fluoridation of the water supply, by reducing tooth decay, decreases
the number of edentulous senior citizens (those without teeth), its benefits
may be as great in later yeas as in childhood. (Guthrie, 1986)
1.6.1. 2 Loss of neuromuscular coordination:
The ability to maintain fine neuromuscular coordination declines
with age, frequently slowing up in the ability to manipulate eating utensils
In order to avoid the embarrassment that comes with spilling food or the
inability to cut meat, or eat soup, the elderly people often avoid such food.
This may lead to significant dietary changes & frequent nutritional
inadequacy. (Irving, Munday, Rowlands, 2001)
1.6.1. 3 Physical discomfort
Older people have more discomfort associated with eating certain
foods. Some foods may cause heartburn; others may cause gastric
distension. Still others, many elderly believe, are incompletely digested.
Efforts to avoid the offending foods may lead to the exclusion of nutritious
foods from the diet.
1.6.1. 4 Impaired hearing & vision
The loss of visual & auditory acuity has many implications on food
selection. Someone who is unable to read labels or identify foods that are
not at eye level will have trouble selecting foods. Inability to read label
directions decrease interest in trying new products, and poor hearing may
lead to an older person’s not asking for information for fear of hearing
embarrassed. (Beal,1980)

١٢
1.6.2 Physiological factors:
1.6.2. 1 Body composition
The changes in body composition that occur throughout adult life
assume greater importance in later years. The decline of over 5% in lean
body mass during each decade and its replacement with body fat account in
part for the decline in basal metabolic rate.
The following figure shows the changes in body composition with age.
(Qnawi, 1998)
age 20fat 15%
muscle
24%
others
61%
muscle
20%
fat19%
others
61%
age40
age 60
others
60%muscle
17%
fat
23%
age 70
others
60% muscle
13%
fat 27%
Fig (2) changes in body composition with age
Fig.2 depicts the change in body composition with age ,it shows the
gradual decrease in lean body mass with increasing fat . An observed slow
increase in body weight is not necessarily bad. Similarly, nutrient uptake by

١٣
cells may decrease by as much as 40% leading to cellular malnutrition even
when adequate nutrients are available. This helps to explain why older
people do not respond as well as might be expected to nutrient
supplementation. (Qnawi, 1998)
1.6.2.2 Diminished sense of taste & smell
The decline in the number of taste buds at age 70 to 36% of those at
age 30 explains decreased interest in food. With fewer and less sensitive
taste buds, it is understandable that the pleasure of eating is diminished. A
zinc deficiency may be involved; it too is a cause of hypogeusia (decreased
taste sensitivity) hyposmia (a loss of the sense of smell). The ability to taste
salt declines, whereas sensitivity to sweat tastes is not diminished. Many
older people complain of unpleasant taste in their mouth that reduces their
enjoyment of food. (williams,1985)
1.6.2. 3 Anorexia
The basis for the loss of appetite, or anorexia, may be either
physiological or psychological. On a physiological level, depressed
appetite may reflect an absolute or relative thiamine or zinc deficiency.
Psychologically, it may be a manifestation of loneliness, anxiety, or
unhappiness. Sometimes the use of appetizers such as light soups will
stimulate eating and improvement in the physical or social environment as
well as frequent and smaller meals may also improve appetite.
(Guthrie,1986)
١٤
1.6.3 Social factors:
1.6.3.1 Economic considerations
Economic pressures play an important role in determining dietary
adequacy. Because many people over 65 years of age are living on fixed
income; they have a limited food budget. This will force many older people
to choose the least expensive foods that provide them with energy and
satisfy their hunger. This, frequently means substituting relatively
inexpansive carbohydrate foods such as bread and cereal products
(williams, 1986).
1.6.3.2 Nutrition misinformation:
Many elder people suffer from a fear that they may become ill and be
unable to look after themselves, or handle the cost of medical care. This
makes them ready prey for the food faddist or promoter of natural food and
food supplements, who promises them excellent health, eternal youth, and
increased vitality and assures them that they will avoid the debilitating
diseases so feared in old age. (Beal, 1980).
1.6.4 Psychological factors:
1.6.4.1 Living alone:
For people who live alone, the lack of motivation to cook regular
meals leads to the use of snack foods, at irregular times, resulting in
poorly balanced meal. It is not usual for older people to have a very erratic
eating pattern a day of nibbling for example, followed by a day of
overeating. Not surprisingly, it has been found that many older people eat
more food with greater pleasure when they have company (Guthrie,1986).

١٥
1.6.4. 2 Depression:
Sometimes, depression takes the form of overeating, food is seen as
a pleasant and always available experience- away of compensation
emotional poverty. Compulsive eating comes with it the problem of
resulting obesity. On the other hand, depression can also lead to rejection
of food. (Beal, 1980).
1.6.4.3 Anxiety:
Conditions of emotional stress or deprivation often lead to modifications
both in attitude towards food and food habits, and changes in utilization of
nutrients. People who are anxious or concerned frequently experience the
loss of appetite, and hormonal changes associated with anxiety lead to a
depressed flow of digestive juices with resulting inefficiencies in the
absorption of food. (williams, 1985).
1.7 Other factors may indirectly affect food consumption in elderly
such as:
•••• Memory
The brain is made up of billions of brain cells or neurons and is
responsible for all of the body's activities. After the age of about 25 years,
some of these brain cells die every day and are not replaced. With most
functions this does not seem to have any effect, but it does seem to impair
short-term memory. The result is that many older people can remember
clearly events that happened in the distant past, but not what happened
yesterday. Genetics seem to play an important part in the age at which this

١٦
occurs, and there is no real treatment for this condition. (Irving, Munday,
Rowlands, 2001).
•••• Dementia
Dementia is a general decline in all areas of mental ability, with
decreasing intellectual ability being the most obvious feature.
(Irving,Munday,Rowlands,2001).
•••• Alzheimer's disease
Injuries or treatable illnesses cause about 10 per cent of dementia cases,
but the majority of cases are due to Alzheimer’s disease. Alzheimer's is
currently completely irreversible, as there is gradual loss of brain cells and
shrinkage of the brain substance. (Irving,Munday,Rowlands,2001).
1.8 Elderly statistics
1.8.1 General statistics
In 1900, 3 million people (4% of the population in the United States)
were over 65 years of age. Between1900 and 1960 the total population
doubled, but the numbers were over 65 quadrupled. In 1985, 24 million
people (11% of the population in the United States) were over 65 years of
age. (Guthrie, 1986). In 2001 one in 8 Americans, or about 13% of U.S
population, is 65 years of age or older (WJ, 1997).
Today there are an estimated 580 million elderly people in the world,
about 350 million (61%) of whom live in developing countries. By 2020,

١٧
the figure is expected to rise to 1000 million elderly people, with 710
million (71%) living in developing countries. (WHO, 2003).
1.8.2 Female statistics
Women comprise the majority of the older population in virtually all
countries, largely because globally women live longer than men do. 2025
project the number of older women in Asia projected to soar from the
current 107 to 248 million, and in Africa from 13 to 33 million. (WHO,
2003).
Most aging women are living in the developing regions of the world.
Currently, more than half of the world’s women aged 60 years and over is
living in developing regions, 198 million compared with 135 million in the
developed regions. (Fact sheet, WHO 2000).
1.8.3 World wide (aging statistic)
The percentages of population for elderly people in all the world in
mid-2001:
The percent of population of age over 65 in all over the world is 7%
(14% of this population in developed countries, 5% in less developed, 4%
in less developed (excluding China).
The population percent of elderly people in Africa:
In North Africa Tunisia was the highest percent (6%), in Western Africa
the highest percent was Cape Verde (7%), in Eastern Africa the highest
percent was Rwanda (8%), in Middle Africa the highest percent was Gabon
(6%) and in Southern Africa the highest percent was South Africa (5%).

١٨
The population percent of elderly people in North America is 13% in
both Canada and US.
The population percent of elderly people in Southern America is 6%,
the highest percent was in Uruguay (13%).
The population percent of elderly people in Asia:
In Western Asia the highest percent was in Israel and Cyprus both was
10%, in East Asia the percent is 8%, the highest percent was in Japan
(17%).
The population percent of elderly people in Europe:
In Northern Europe the highest percent was in Sweden (17%), in
Western Europe the highest percent was in Monaco (23%), in Southern
Europe the highest percent was in Italy (18%) ,and in Eastern Europe the
highest percent was in Bulgaria (16%) (2002 world population data sheet).
1.8.4 The population percent of elderly people in Palestine:
For people over 65 years old in the West Bank, the total males were
27592 and the total females were 33645 leading to an elderly percent of
3.8%. In Gaza Strip, for males the total was 12493 and for females it was
16489 with elderly percent of 2.9%. The over all percentage in Palestinian
Territories for male was 40085 and for female was 50134 with over all
elderly percent of 3.5% (2002 world population data sheet).

١٩
1.8.5 The population percent of elderly people in the city of Nablus
For people over 65 years old in the city of Nablus, males were 1742
and females were 2042 with over all elderly percent of 3.8% (PCBS, 1997).
1.9 Aim of the study:
• Studying different factors that affect the intake of food and nutrition
status in our community in elderly people.
• Studying nutrition status of elderly individuals from different parts of
the community.
1.10 Research hypothesis:
• Knowledge about proper nutrition affects heath.
• Positive attitude affects nutrition in elderly.
• Social condition affects nutrition in elderly.
• Medical condition affects nutrition in elderly.
• Overall nutrition affects health in elderly.

Chapter Tow
Methodology

٢٠
2. Methodology:
This chapter describes the population and the subject of the study,
data collection, the measuring instrument, tool & the analysis method .
2.1 Population of study (sample)
- The study population was chosen from different categories of
elderly people in the city of Nablus; those are the elders at the
nursing home, those residing with their families and those living
alone
- The total of the study sample was 223 elder, every resident in the
nursing home was included, while in other areas individuals in the
samples were randomly chosen.
- The age of study sample was from 60 to above 80 years old,
divided into three groups; the first between 60-70, the second 70-80
and the third over 80 age
2.2 Data Collection
Data was collected between the 1st of April 2003 and the 1
st of
September 2003 using structured interview and body weight and height
measurements.
2.2.1 Tools
The questionnaire used in the interview has been evaluated and
reviewed carefully .It consisted of questions focusing on four parts :
- The first part is about the social and demographic status including
age, sex, residence, economic status, educational standards and
religion .
- The second part is about questions related to nutrition, nutritious
problems & food habits (Q from 1-17 )
- The third part is about medical information that includes questions
about diseases related to nutrition problems “i.e. D.M, digestive
٢١
system disease, osteoporosis, coronary diseases. ”This information
also includes questions about kind and quantity of medication
used (Q 18 and 19).
- A measurement of Body Mass Index (B.M.I), (Q20).
2.3 Procedure
The data was collected through personal interviews for each sample.
First each elder was interviewed and the researcher filled the questionnaire.
B.M.I. was calculated after measuring body weight, each subject's weight
was measured on manual (ordinary) scale , after a 12- to 14-hour fast.
Standing height was measured with a wall-mounted stadiometer. Body
mass index (BMI) was calculated according the formula (B.M.I= weight
(kg)/height2) (Guthrie, 1986). Some of participants couldn't stand up at all
so we couldn't register their body weight.
2.4 Data analysis:
All data were entered and results were computed using SPSS software
version 10 and applying the following statistical methods:
2.4.1 Analysis of descriptive studies
Tables containing descriptive studies were obtained, such as sex,
age, residence, monthly income, B.M.I. and educational status of the
sample study .
2.4.2 Analysis of medical – Nutrition studies
Tables for medical – nutrition obtained, such as B.M.I
measurements, history of chronic diseases and daily medication .
2.4.3 Analysis of relationships
Relationships between factors that affect nutrition of elderly people
and age, sex, residence, educational standard, monthly income, B.M.I and
any other risk factors were obtained applying contingency coefficient with
significance at P≤0.05.

Chapter Three
Results

٢٥
3. Results:
The results of the study includes three main categories:
• Profile of the study population: social, health &risk factors profile.
• BMI measurements.
• Relationships.
3.1 Profile of the study population:
3.1.1 Social and demographic profile:
Table 2 Gender, age, residence & religion profile of the study population Gender Frequency Percent
Male ٤٠�٤ ٩٠
Female ٥٩�٢ ١٣٢
Missing ٠�٤ ١
Total ١٠٠�٠ ٢٢٣
Age Frequency Percent
60-70 ٤٢�٢ ٩٤
70-80 ٣٩�٥ ٨٨
more than80 ١٨�٤ ٤١
Total ١٠٠�٠ ٢٢٣
Residence Frequency Percent
Nursing house ١٧�٥ ٣٩
with family ٥٩�٦ ١٣٣
alone at home ٢٢�٤ ٥٠
Missing ٠�٤ ١
Total ١٠٠�٠ ٢٢٣
Religion Frequency Percent
Muslim ٨٥�٧ ١٩١
Christian ١٣�٩ ٣١
Missing ٠�٤ ١
Total ١٠٠�٠ ٢٢٣
Table 2 shows the distribution of samples as follows:
• 40.٤٠% of the study sample were males, 59.2 % were females.

٢٦
• ٤٢�٢%of the study sample were in 60-70 years old, 39.5 % were in 70-
80 years old & 18.4 % were more than 80.
• ١٧�٥% of the study sample live in nursing home,59.6 % live with their
family, & 22.4% live alone at their homes.
• 85.7% of the study population are Muslims while, 13.9% are
Christians.
Table 3 Education, income & wages of the study sample population Educational level Frequency Percent
No education ٤٨�٩ ١٠٩
Basic ٣٣�٢ ٧٤
High education ١٧�٥ ٣٩
Missing ٠�٤ ١
Total ١٠٠�٠ ٢٢٣
Income Frequency Percent
Yes ٧٦�٧ ١٧١
No ٢٢�٠ ٤٩
Missing ١�٣ ٣
Total ١٠٠�٠ ٢٢٣
Wages Frequency Percent
more than 400 JD ٢�٢ ٥
٢٠٠-٤٠٠ JD 33 14.8
100-200 JD 133 59.6
No income 49 22
Missing 3 1.3
Total 223 100%
Table 3 describes the education, income and wages of study sample as
follows:
• 48.9% of the study population had no education, the percentage of
basic education level was 33.2%, while high education level
percentage was 17.5%.
• 76.7%of the study population had income, while 22% has no income .
• 2.2%of the study population had monthly income more than
400JD,14.8% had 200-400JD,59.6% had 100-200JD, while ٢٢% had
no income.
٢٧
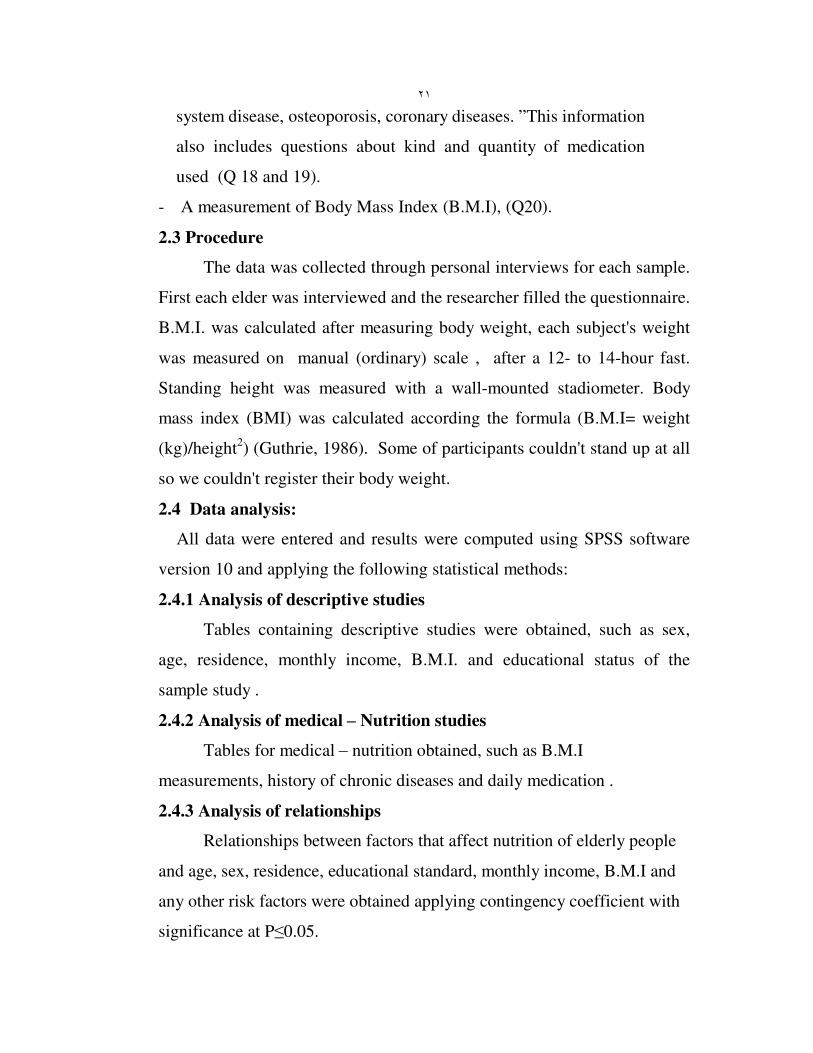
٣�١�٢ Health profile:
The health profile of the study population included chronic diseases
affected by nutrition; medications taken that may interfere with nutrition
and number of medications taken daily.
Table 4 Chronic diseases distribution
Disease
Frequency Percent
Hypertension ٥�٤ ١٢
D.M ٧�٦ ١٧
Heart diseases ١�٣ ٣
Digestive system diseases ٥�٤ ١٢
Breathing diseases ١�٣ ٣
Osteoporosis ٤�٠ ٩
More than one diseases ٥٦�١ ١٢٥
Total 181 81.1
Table 4 shows the distribution and frequency of chronic diseases
among the study sample as follows:
• Total 181 assuming that 181(81.1%) had one or more chronic disease,
and table 4 show this.
• 5.4% of the study sample had hypertension, 7.6% had D.M,1.3% had
heart diseases, 5.4% had digestive disorders, 1.3% had breathing
diseases, 4% had osteoporosis, and 56.1% of the study sample had
more than one disease.
Table 5 Medication use & Number taken daily Medication taken Frequency Percent
No ٢٦�٩ ٦٠
Yes ٧٣�١ ١٦٣
Total 223 100
Number of medicine Frequency Percent
1-2 ٢٩�٦ ٦٦
3-5 ٣٠�٩ ٦٩
5-8 ١٠�٣ ٢٣
More than 8 5 2.2
Total 163 73
٢٨
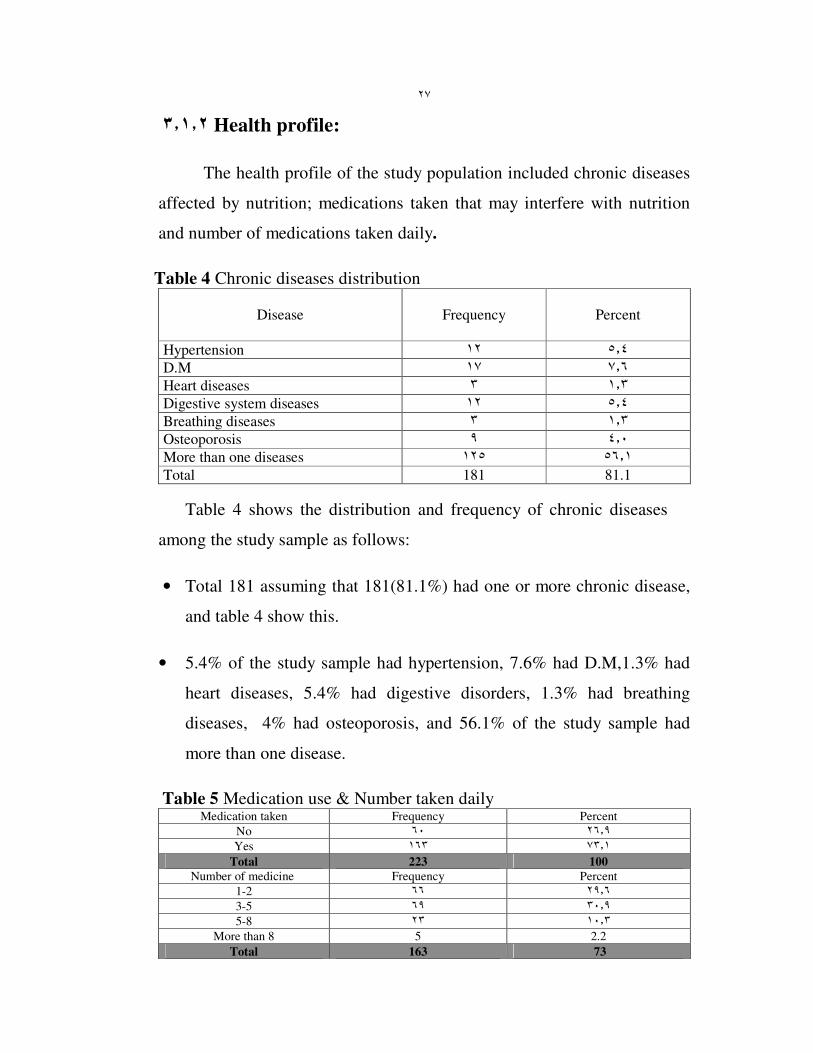
Table 5 shows the frequency of medication use and number of medications
taken daily the study sample as follows:
• 26.9% of the study sample stated that they don’t take medication, while
73.1 % did take medications.
• 29.6% of the study population take 1-2 kinds of medicine daily, 30.9%
take 3-5, 10.3% take 5-8, and 2.2 % take more than 8 medicines daily.
٣�١�٣ Risk factors profile:
٣�١�٣�١ Denture :
Table 6 Denture profile of the study population Denture use Frequency Percent
No ٥٨�٧ ١٣١
Yes ٤٠�٨ ٩١
Missing 1 .5
Total 223 100
Difficulties of denture Frequency percent
No ٣٨�٥ ٣٥
Yes ٦١�٥ ٥٦
Total 91 100
Kind of food Frequency percent
Meat ١٢�١ ٢٧
bread and rice ١�٨ ٤
Other ١�٣ ٣
all of the food ٦�٧ ١٥
Total 49 21.9
Chewing &swallowing
difficulties
Frequency Percent
No ٦٢�٨ ١٤٠
Yes 82 36.8
Total 222 99.6
Table 6 describes the frequency of denture use and denture problems
in the study population as follows:
• 58.7%of the study population don’t use denture, while 40.8 %are using
it.

٢٩
• 61.5 % of the study population that using denture are facing difficulties
when using it, while 38.5% are not.
• 12.1% of these cases of the study population with using denture had
difficulties in eating meat, 1.8% with bread and rice, 1.3% with other
kinds of food, and 6.7%experience difficulties with all of the food.
• 62.8% of the study sample had no problems in chewing and
swallowing, while 36.8% had problems.
3.1.3.2 Vision and hearing :
Table 7 Vision and hearing of the study population Impaired vision & hearing Frequency Percent
No ٥٤�٧ ١٢٢
Yes ٤٥�٣ ١٠١
Total 223 100
Table 7 describes the frequency of vision and hearing problem in the
study sample as follows:
• 54.7% of the study population had no problem in their vision and
hearing , while 45.3% had some problems.
3.1.3.3 Food taste:
Table 8 Food taste of the study population Taste impaired Frequency Percent
No ٨١�٢ ١٨١
Yes ١٨�٨ ٤٢
Total 223 100
Table 8 describes the frequency of food taste impairment in the study
sample as follows:
• 81.2% of the study population had no problems with their food taste,
while only 18.8% had taste problems.

٣٠
٣�١�٣�٤ Smoking:
Table 9 Smoking profile of the study population Cigarette Frequency Percent
No ٨١�٢ ١٨١
Yes ١٨�٨ ٤٢
Total 223 100
Narghile Frequency Percent
No ٨١�٢ ١٨١
Yes ١٨�٨ ٤٢
Total 223 100
Breathing difficulties Frequency Percent
No ٧١�٧ ١٦٠
Yes ٢٧�٨ ٦٢
Total *222 99.5
*1 missing
• 81.2% of the study population were not smokers neither cigarettes nor
Narghile at the same percentage , while 18.8 %were smokers, whether
cigarettes or Narghile at the same percentage.
٣�١�٣�٥ Physical activity:
Table 10 Physical activity profile of the study population Past sport practice Frequency Percent
No ٦٨�٦ ١٥٣
Yes ٣٠�٥ ٦٨
Total *221 99.1
Current Sport practice
(walking)
Frequency Percent
No ٤٧�٥ ١٠٥
Yes ٥٢ ١١٧
Total **222 99.5
*2 missing **1 missing
• 68.6% of the study population had no past sport practices while 30.5%
had past sport practices.
• 47.5% of the study population don’t practice any sport currently (at
least walking) ,and 52.5 % do some sport practices (walking).
٣١
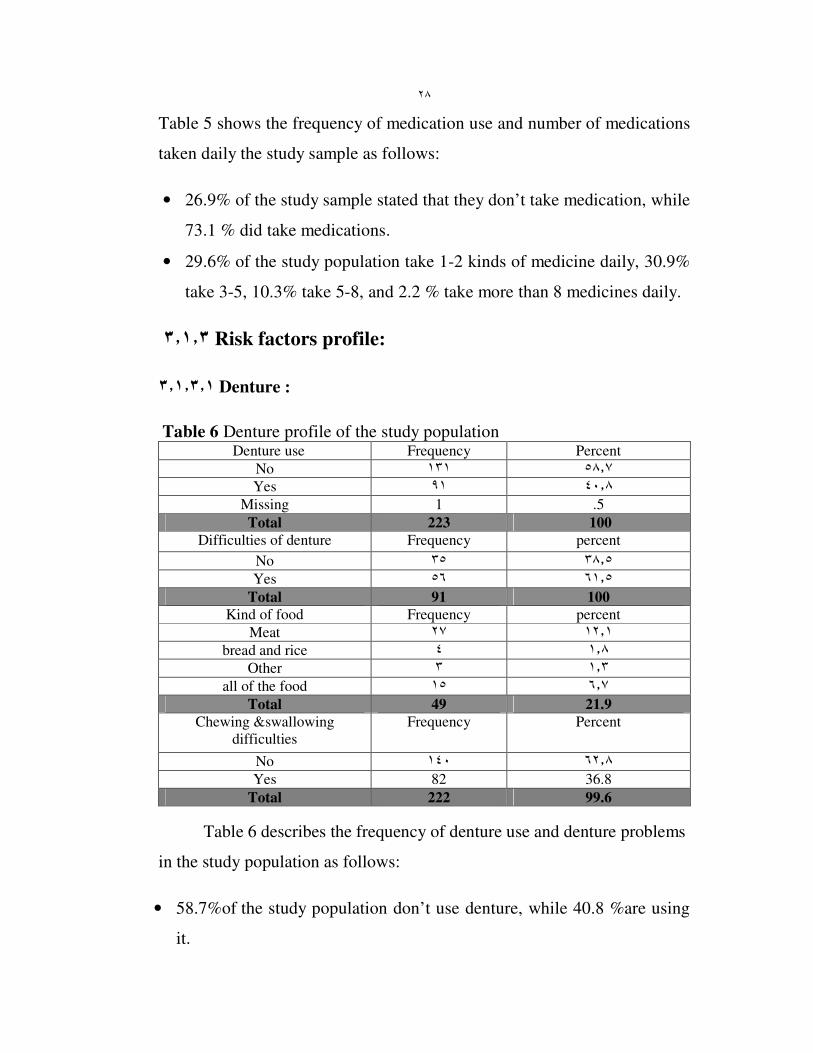
٦ ٣�١�٣. Kind of food consumption:
Table 11 Food consumption of the study population Kind of food Frequency Percent
Milk
No ٥٤�٣ ١٢١
Yes ٤٤�٨ ١٠٠
Total *221 99.1
Veg. & fruit
No ١٦�١ ٣٦
Yes ٨٣�٤ ١٨٦
Total **222 99.5
Fat & Sweet
No ٣٧�٢ ٨٣
Yes ٦١�٩ ١٣٨
Total *221 99.1
*2 missing **1missing
In response to the type of food consumed, 54.3% of study sample
was not taking milk, while 44.8% was consuming milk daily.
• 16.1 % of the study sample had low consumption of vegetable and fruit,
while 83.4% had high consumption.
• 37.2% of the study population had low consumption of fat and Sweet ,
while 61.9% had high consumption.
3.2 Body mass index measurements:
Table 12 B.M.I of the study population B.M.I categorized Frequency Percent
Under weight
(less than 20)
1 0.4
Normal weight
20-24.5
23 10.3
Over weight
25-29.5
61 27.4
Clearly over weight
30-40
33 14.8
Obese (more than 40) 8 3.6
Total *126 56.5
Table 12 shows B.M.I frequency of the study population as follows:
٣٢
• Not all study sample individuals were able to stand up, therefore we
were unable to measure their weight and height. Only (56.5%) of
individuals had their BMI measured. Most residents of nursing home
didn't have BMI measured.
• 0.4% of the study sample are under weight , 10.3% are normal weight ,
27.4% are over weight, 14.8 %are high over weight, and 3.6% are
obese.
3.3 Relationship Results:
3.3.1 Age:
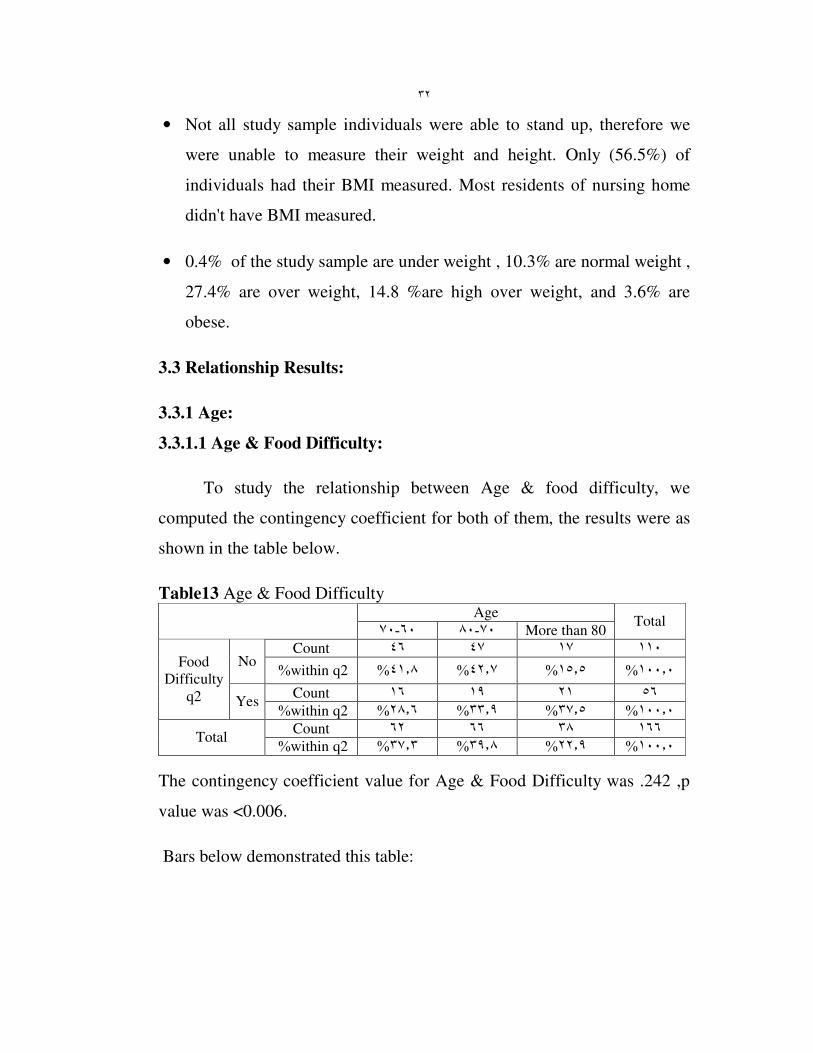
3.3.1.1 Age & Food Difficulty:
To study the relationship between Age & food difficulty, we
computed the contingency coefficient for both of them, the results were as
shown in the table below.
Table13 Age & Food Difficulty Age
٧٠-٦٠ ٨٠-٧٠ More than 80 Total
Count ١١٠ ١٧ ٤٧ ٤٦ No
%within q2 ٤١�٨% ٤٢�٧% ١٥�٥% ١٠٠�٠%
Count ٥٦ ٢١ ١٩ ١٦
Food
Difficulty
q2 Yes %within q2 ٢٨�٦% ٣٣�٩% ٣٧�٥% ١٠٠�٠%
Count ١٦٦ ٣٨ ٦٦ ٦٢ Total
%within q2 ٣٧�٣% ٣٩�٨% ٢٢�٩% ١٠٠�٠%
The contingency coefficient value for Age & Food Difficulty was .242 ,p
value was <0.006.
Bars below demonstrated this table:

٣٣
q2
yes no
Count
50
40
30
20
10
age
60-70
70-80
More than 80
Fig ( 3) Age & Food Difficulty
٣�٣�١�٢Age & bone problems:
To study the relationship between Age, and Bone & Joint problems,
we computed the contingency coefficient for both of them ,the results were
as shown in the table below.
Table14 Age & bones problems age
٧٠- ٦٠ ٨٠- ٧٠ more than 80
Total
Count ٦٣ ٧ ١٨ ٣٨ No
%within Q11 ٦٠�٣% ٢٨�٦% ١١�١% ١٠٠�٠%
Count ٩٠ ١٤ ٤٢ ٣٤ Some
times %within Q11 ٣٧�٨% ٤٦�٧% ١٥�٦% ١٠٠�٠%
Count ٦٨ ٢٠ ٢٦ ٢٢
Bone
problems Q11
Daily %within Q11 ٣٢�٤% ٣٨�٢% ٢٩�٤% ١٠٠�٠%
Count ٢٢١ ٤١ ٨٦ ٩٤ Total
%within Q11 ٤٢�٥% ٣٨�٩% ١٨�٦% ١٠٠�٠%
The contingency coefficient value for Age & Bone Joints was .264, p value
was <0.002.
Bars below demonstrated this table:

٣٤
Q11
Daily
sometimes no
Count
50
40
30
20
10
0
age
60-70
70-80
more than 80
Fig (4 ) Age & Bones problems
٣�٣�١�١ Age & current Sport Practice:
To study the relationship between Age & sport practice ,we
computed the contingency coefficient for both of them ,the results were as
shown in the table below.
Table15 Age & current Sport Practice Age
٧٠- ٦٠ ٨٠- ٧٠ more than 80 Total
Count ١٠٥ ٢٩ ٤٣ ٣٣ No
%within Q14 ٣١�٤% ٤١�٠% ٢٧�٦% ١٠٠�٠%
Count ١١٧ ١٢ ٤٤ ٦١
Current Sport
practiceQ14 Yes
%within Q14 ٥٢�١% ٣٧�٦% ١٠�٣% ١٠٠�٠%
Count ٢٢٢ ٤١ ٨٧ ٩٤ Total
%within Q14 ٤٢�٣% ٣٩�٢% ١٨�٥% ١٠٠�٠%
The contingency coefficient value for Age & current sport practice was
.250 ,p value was <0.001.
Bars below demonstrated this table:

٣٥
Q14
yes no
Count
70
60
50
40
30
20
10
0
age
60-70
70-80
more than 80
Fig ) ٥ ( Age & current sport practice
٣�٣�٢Place Of Living:
٣�٣�٢�١Place Of Living & Milk consumption:
To study the relationship between Place Of Living & Milk
consumption, we computed the contingency coefficient for both of them,
the results were as shown in the table below.
Table16 Place Of Living & Milk consumption place of living
nursing
house
with
family
alone in
home
Total
Count ١٢٠ ٣٥ ٧٥ ١٠ No
%within Q10 ٨�٣% ٦٢�٥% ٢٩�٢% ١٠٠�٠%
Count ١٠٠ ١٤ ٥٨ ٢٨
Milk
Consumption
Q10
Yes
%within Q10 ٢٨�٠% ٥٨�٠% ١٤�٠% ١٠٠�٠%
Count ٢٢٠ ٤٩ ١٣٣ ٣٨ Total
%within Q10 ١٧�٣% ٦٠�٥% ٢٢�٣% ١٠٠�٠%
The contingency coefficient value for place of living & milk consumption
was .275 ,p value was <0.000.

٣٦
Bars below demonstrated this table:
Q10
yes no
Count
80
60
40
20
0
place of living
Nursing house
with family
Alone at home
Fig (6) place of living & milk consumption
٣�٣�٢�٢ Place Of Living & Vegetable and fruit consumption:
To study the relationship between place of living & vegetable and
fruit consumption, we compute the contingency coefficient for both of
them, the results were as shown in the table below.
Table17 Place of Living & vegetable and fruit consumption place of living
nursing
house with family
alone in
home
Total
Count ٣٦ ١٤ ١٨ ٤ no
%within Q12 ١١�١% ٥٠�٠% ٣٨�٩% ١٠٠�٠%
Count ١٨٥ ٣٦ ١١٥ ٣٤
Vegetable
&fruit
consumption
Q12 yes
%within Q12 ١٨�٤% ٦٢�٢% ١٩�٥% ١٠٠�٠%
Count ٢٢١ ٥٠ ١٣٣ ٣٨ Total
%within Q12 ١٠٠�٠ %٢٢�٦ %٦٠�٢ %١٧�٢%
The contingency coefficient value for place of living & vegetable
and fruit consumption was .171, p value was <0.035.
٣٧
Bars below demonstrated this table:
Q12
yes no
Count
140
120
100
80
60
40
20
0
place of living
Nursing house
with family
Alone at home
Alone at home
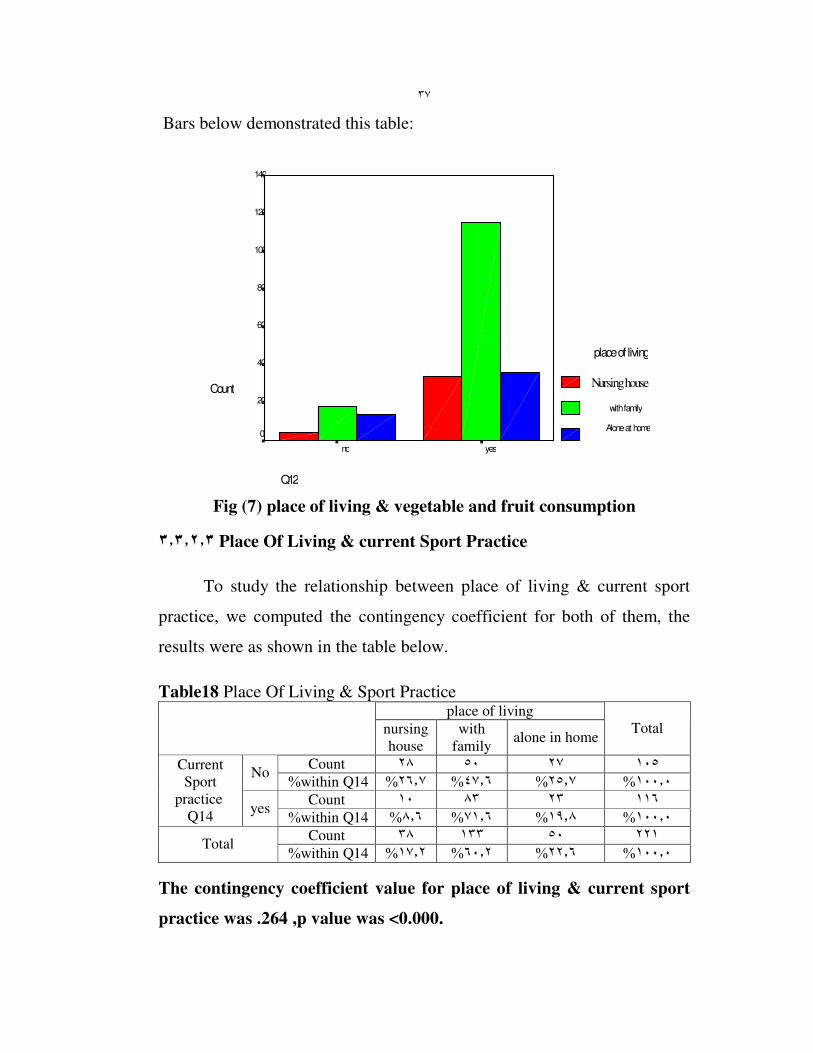
Fig (7) place of living & vegetable and fruit consumption
٣�٣�٢�٣ Place Of Living & current Sport Practice
To study the relationship between place of living & current sport
practice, we computed the contingency coefficient for both of them, the
results were as shown in the table below.
Table18 Place Of Living & Sport Practice place of living
nursing
house
with
family alone in home
Total
Count ١٠٥ ٢٧ ٥٠ ٢٨ No
%within Q14 ٢٦�٧% ٤٧�٦% ٢٥�٧% ١٠٠�٠%
Count ١١٦ ٢٣ ٨٣ ١٠
Current
Sport
practice Q14
yes %within Q14 ٨�٦% ٧١�٦% ١٩�٨% ١٠٠�٠%
Count ٢٢١ ٥٠ ١٣٣ ٣٨ Total
%within Q14 ١٧�٢% ٦٠�٢% ٢٢�٦% ١٠٠�٠%
The contingency coefficient value for place of living & current sport
practice was .264 ,p value was <0.000.

٣٨
Bars below demonstrated this table:
Q14
yes no
count
100
80
60
40
20
0
place of living
Nursing house
with family
Alone at home
Fig (8) place of living & sport practice
٣�٣�٢�٤ Place Of Living & Fat and Sweet consumption:
To study the relationship between place of living & fat and sweet
consumption, we computed the contingency coefficient for both of them,
the results were as shown in the table below.
Table19 Place Of Living & Fat and sweet consumption place of living
nursing
house with family
alone in
home
Total
Count ٨٢ ٢٣ ٥٥ ٤ no
%within Q17 ٤�٩% ٦٧�١% ٢٨�٠% ١٠٠�٠%
Count ١٣٨ ٢٧ ٧٧ ٣٤
Fat and
sweet consumption
Q17 yes
%within Q17 ٢٤�٦% ٥٥�٨% ١٩�٦% ١٠٠�٠%
Count ٢٢٠ ٥٠ ١٣٢ ٣٨ Total
%within Q17 ١٧�٣% ٦٠�٠% ٢٢�٧% ١٠٠�٠%
The contingency coefficient value for place of living & fat and
sweet consumption was .247 ,p value was <0.001.
٣٩
Bars below demonstrated this table:
Q17
yes no
count
100
80
60
40
20
0
place of living
Nursing house
with family
alone at home
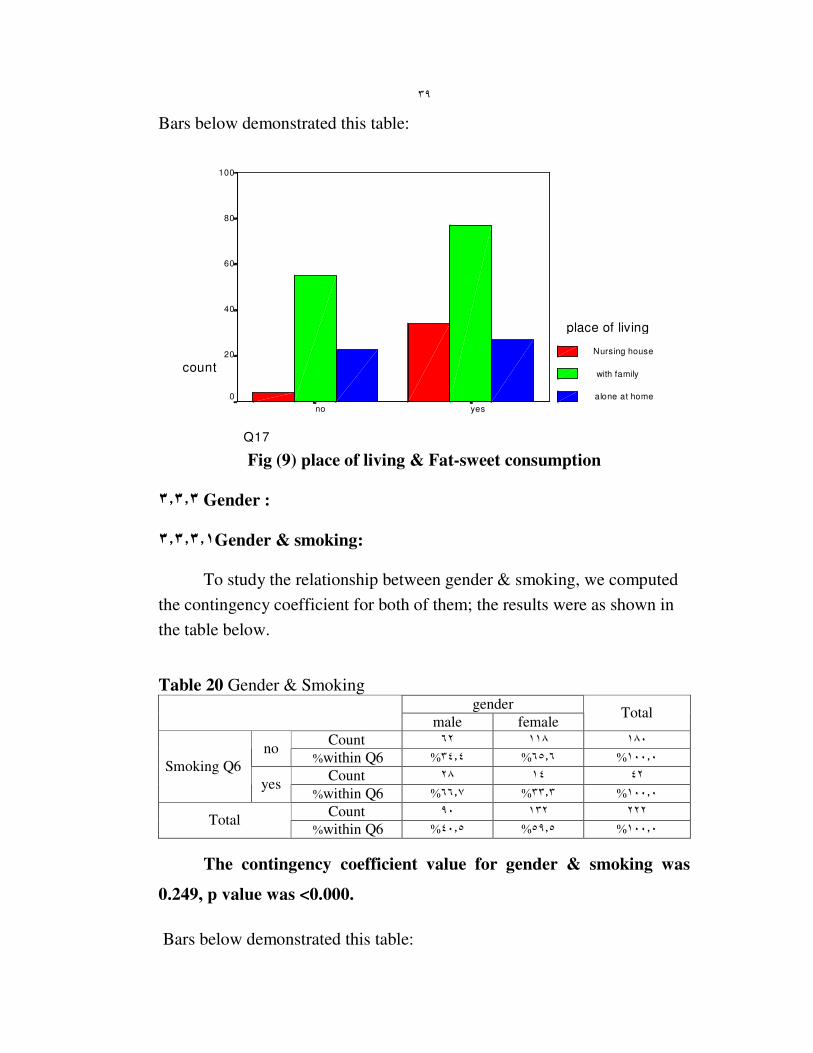
Fig (9) place of living & Fat-sweet consumption
٣�٣�٣ Gender :
٣�٣�٣�١Gender & smoking:
To study the relationship between gender & smoking, we computed
the contingency coefficient for both of them; the results were as shown in
the table below.
Table 20 Gender & Smoking gender
male female Total
Count ١٨٠ ١١٨ ٦٢ no
%within Q6 ٣٤�٤% ٦٥�٦% ١٠٠�٠%
Count ٤٢ ١٤ ٢٨ Smoking Q6
yes %within Q6 ٦٦�٧% ٣٣�٣% ١٠٠�٠%
Count ٢٢٢ ١٣٢ ٩٠ Total
%within Q6 ٤٠�٥% ٥٩�٥% ١٠٠�٠%
The contingency coefficient value for gender & smoking was
0.249, p value was <0.000.
Bars below demonstrated this table:

٤٠
Q6
yesno
Count
140
120
100
80
60
40
20
0
gender
male
female
Fig (10) gender & smoking
٣�٣�٣�٢ Gender & Past Sports practice:
To study the relationship between gender & past sport practice, we
computed the contingency coefficient for both of them; the results were as
shown in the table below.
Table21 Gender & Past Sport practice
Gender
male female Total
Count ١٥٢ ٩٩ ٥٣ no
%within Q13 ٣٤�٩% ٦٥�١% ١٠٠�٠%
Count ٦٨ ٣١ ٣٧
Past Sport practice
Q13 yes
%within Q13 ٥٤�٤% ٤٥�٦% ١٠٠�٠%
Count ٢٢٠ ١٣٠ ٩٠ Total
%within Q13 ١٠٠�٠ %٥٩�١ %٤٠�٩%
The contingency coefficient value for gender & past sport practice
was 0.181 ,p value was <0.006.
Bars below demonstrated this table:
٤١
Q13
yes no
Count
120
100
80
60
40
20
gender
male
female
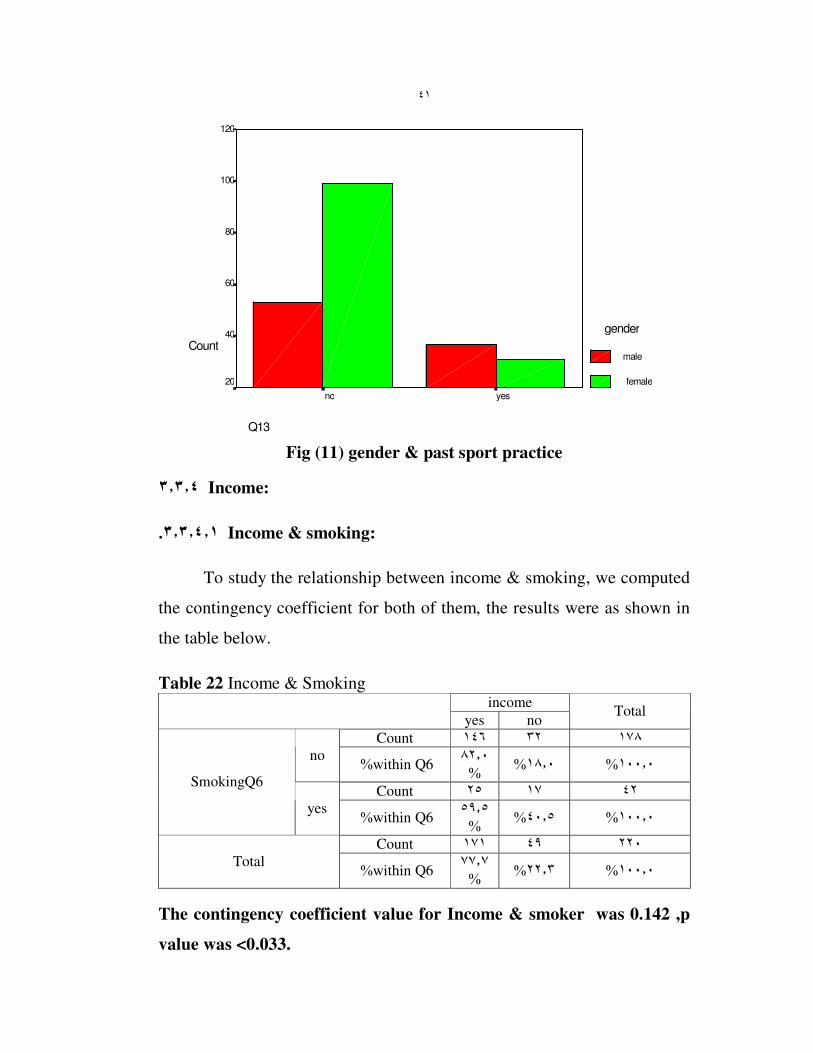
Fig (11) gender & past sport practice
٣�٣�٤ Income:
٣�٣�٤�١. Income & smoking:
To study the relationship between income & smoking, we computed
the contingency coefficient for both of them, the results were as shown in
the table below.
Table 22 Income & Smoking income
yes no Total
Count ١٧٨ ٣٢ ١٤٦
no %within Q6
٨٢�٠%
١٨�٠% ١٠٠�٠%
Count ٤٢ ١٧ ٢٥ SmokingQ6
yes %within Q6
٥٩�٥%
٤٠�٥% ١٠٠�٠%
Count ٢٢٠ ٤٩ ١٧١
Total %within Q6
٧٧�٧%
٢٢�٣% ١٠٠�٠%
The contingency coefficient value for Income & smoker was 0.142 ,p
value was <0.033.

٤٢
Bars below demonstrated this table:
Q6
yesno
Co
un
t
160
140
120
100
80
60
40
20
0
income
yes
no
Fig (12) income & smoking
٣�٣�٤�٢. Income & Milk Consumption:
To study the relationship between income & milk consumption ,we
computed the contingency coefficient for both of them ,the results were as
shown in the table below.
Table23 Income & milk consumption income
Yes no Total
Count ١٢٠ ١٣ ١٠٧ No
%within Q10 ٨٩�٢% ١٠�٨% ١٠٠�٠%
Count ٩٨ ٣٥ ٦٣
milk
consumption
Q10 yes %within Q10 ٦٤�٣% ٣٥�٧% ١٠٠�٠%
Count ٢١٨ ٤٨ ١٧٠ Total
%within Q10 ٧٨�٠% ٢٢�٠% ١٠٠�٠%
The contingency coefficient value for Income & milk consumption was
0.286, p value was <0.000.
Bars below demonstrated this table:

٤٣
Q10
yesno
Count
120
100
80
60
40
20
0
income
yes
no
Fig (13) income & milk consumption
٣�٤�٣. ٣ Income & Past Sport practice:
To study the relationship between income & past sport practice, we
computed the contingency coefficient for both of them, the results were as
shown in the table below.
Table24 Income & past sport practice Income
Yes no Total
Count ١٥١ ١٥ ١٣٦ No
%within Q13 ٩٠�١% ٩�٩% ١٠٠�٠%
Count ٦٧ ٣٣ ٣٤
Past sport
practice
Q13 Yes %within Q13 ٥٠�٧% ٤٩�٣% ١٠٠�٠%
Count ٢١٨ ٤٨ ١٧٠ Total
%within Q13 ٧٨�٠% ٢٢�٠% ١٠٠�٠%
The contingency coefficient value for Income & past sport practice was
0.401, p value was <0.000.
Bars below demonstrated this table:

٤٤
Q13
yes no
C o u n t
160
140
120
100
80
60
40
20
0
I n c o m e
yes
no
Fig (14) income & past sport practice
٣�٣�٤�٤ Income & current Sport Practice:
To study the relationship between income & sport practice ,we
computed the contingency coefficient for both of them ,the results were as
shown in the table below.
Table25 Income & sport practice income
Yes no Total
Count ١٠٣ ١٣ ٩٠ No
%within Q14 ٨٧�٤% ١٢�٦% ١٠٠�٠%
Count ١١٦ ٣٦ ٨٠
Current Sport
practice
Q14 Yes %within Q14 ٦٩�٠% ٣١�٠% ١٠٠�٠%
Count ٢١٩ ٤٩ ١٧٠ Total
%within Q14 ٧٧�٦% ٢٢�٤% ١٠٠�٠%
The contingency coefficient value for Income & current sport practice
was 0.215 ,p value was <0.001.
Bars below demonstrated this table:

٤٥
Q14
yesno
Co
un
t
100
80
60
40
20
0
income
yes
no
Fig (15) income & sport practice
٣�٣�٥ Education level:
٣�٣�٥�١ Education level & Milk consumption:
To study the relationship between education level & milk
consumption, we computed the contingency coefficient for both of them,
the results were as shown in the table below.
Table26 Educational level & milk consumption Education level
No
education basic
high
education
Total
Count ١٢٠ ٨ ٣٩ ٧٣ no
%within Q10 ٦٠�٨% ٣٢�٥% ٦�٧% ١٠٠�٠%
Count ١٠٠ ٣٠ ٣٥ ٣٥
Milk
consumption
Q10 yes %within Q10 ٣٥�٠% ٣٥�٠% ٣٠�٠% ١٠٠�٠%
Count ٢٢٠ ٣٨ ٧٤ ١٠٨ Total
%within Q10 ٤٩�١% ٣٣�٦% ١٧�٣% ١٠٠�٠%
The contingency coefficient value for education level & milk
consumption was 0.318,p value was <0.000.

٤٦
Bars below demonstrated this table:
Q10
yes no
Count
80
60
40
20
0
education level
No education
basic
high education
Fig (16) Education level & milk consumption
٣�٣�٥�٢ Education level & Bone and Joint problems:
To study the relationship between education level & bone and joint
problems, we computed the contingency coefficient for both of them, the
results were as shown in the table below.
Table27 Education Level & Bone & Joint problems education level
No
education basic
high
education
Total
Count ٦٣ ٢٢ ٢٣ ١٨ No
%within Q11 ٢٨�٦% ٣٦�٥% ٣٤�٩% ١٠٠�٠%
Count ٨٩ ١١ ٣٠ ٤٨ Someti
mes %within Q11 ٥٣�٩% ٣٣�٧% ١٢�٤% ١٠٠�٠%
Count ٦٨ ٦ ٢١ ٤١
Bones &
Joints
problems
Q11 Daily
%within Q11 ٦٠�٣% ٣٠�٩% ٨�٨% ١٠٠�٠%
Count ٢٢٠ ٣٩ ٧٤ ١٠٧ Total
%within Q11 ٤٨�٦% ٣٣�٦% ١٧�٧% ١٠٠�٠%
The contingency coefficient value for education level & bones joints
was 0.307, p value was <0.000.

٤٧
Bars below demonstrated this table:
Q11
daily sometimes no
Count
60
50
40
30
20
10
0
education level
No education
basic
high education
Fig (17) education level & bones and joints problems
٣�٣�٥�٣ Education level & Past Sport practice:
To study the relationship between education level & past sport
practice, we computed the contingency coefficient for both of them, the
results were as shown in the table below.
Table28 Educational level & past sport practice education level
No
education basic
high
education
Total
Count ١٥٢ ١٠ ٥٣ ٨٩ no
%within Q13 ٥٨�٦% ٣٤�٩% ٦�٦% ١٠٠�٠%
Count ٦٨ ٢٩ ٢١ ١٨
Past
sport
practice
Q13 yes
%within Q13 ٢٦�٥% ٣٠�٩% ٤٢�٦% ١٠٠�٠%
Count ٢٢٠ ٣٩ ٧٤ ١٠٧ Total
%within Q13 ٤٨�٦% ٣٣�٦% ١٧�٧% ١٠٠�٠%
The contingency coefficient value for education level & past sport
practice was 0.411 ,p value was <0.000
Bars below demonstrated this table:

٤٨
Q13
yes no
Count
100
80
60
40
20
0
education level no education
basic
high education
Fig (18) education level & past sport practice
٣�٣�٦ B.M.I Categorized:
٣�٣�٦�١ B.M.I Categorized & smoking:
To study the relationship between B.M.I categorized & smoker we
computed the contingency coefficient for both of them, the results were as
shown in the table below.
Table29 B.M.I Categorized & smoking B.M.I categorized
Under
weight
less than
20
normal
weight
20-24.9
over
weight
25-29.9
clearly
over
weight(3
0-40)
Obese
more
than 40
Total
Count ١٠٢ ٧ ٢٥ ٥٥ ١٤ ١ no
%within Q6 ١�٠% ١٣�٧% ٥٣�٩% ٢٤�٥% ٦�٩% ١٠٠�٠%
Count ٢٤ ١ ٨ ٦ ٩ smoker
Q6 yes
%within Q6
٣٧�٥% ٢٥�٠% ٣٣�٣% ٤�٢% ١٠٠�٠%
Count ١٢٦ ٨ ٣٣ ٦١ ٢٣ ١ Total
%within Q6 0.8% ١٨�٣% ٤٨�٤% ٢٦�٢% ٦�٣% ١٠٠�٠%
The contingency coefficient value for B.M.I categorized &smoking
was 0.276 ,p value was <0.024.

٤٩
Bars below demonstrated this table:
Q12
No yes
Count
60
50
40
30
20
10
0
BMI categorized
Under weight (less than 20 )
Normal weight (20-24.9)
Over weight (25-29.9)
Clearly overweight (30-40)
Obese (more than 40)
Fig (19) B.M.I categorized &smoking
٣�٣�٦�٢ B.M.I Categorized & Vegetable and fruit consumption:
To study the relationship between B.M.I categorized & vegetable
and fruit consumption, we computed the contingency coefficient for both of
them, the results were as shown in the table below.
Table30 B.M.I Categorized & Vegetable and fruit consumption B.M.I categorized
Under
weight
less
than 20
normal
weight
٢٠ -٢٤�٩
over
weight
٢٥ -٢٩�٩
clearly
over
weight
٤٠- ٣٠(
Obese
more
than 40
Total
Count
٢٢ ٢ ٦ ١٠ ٤
no
%within Q12
١٨�٢% ٤٥�٥% ٢٧�٣% ٩�١% ١٠٠�٠%
Count ١٠٤ ٦ ٢٧ ٥١ ١٩ ١
Vegetable
and fruit
Q12
yes %within Q12 ١�٠% ١٨�٣% ٤٩�٠% ٢٦�٠% ٥�٨% ١٠٠�٠%
Count ١٢٦ ٨ ٣٣ ٦١ ٢٣ ١ Total
%within Q12 0.8% ١٨�٣% ٤٨�٤% ٢٦�٢% ٦�٣% ١٠٠�٠%
The contingency coefficient value for B.M.I categorized & vegetable
and fruit consumption was 0.068 ,p value was>0.964.
Bars below demonstrated this table:

٥٠
Q12
yes no
Count
60
50
40
30
20
10
0
B M I categorized
Under weight (less than 20 )
Normal weight (20-24.9)
Over weight (25-29.9)
Clearly overweight (30-40)
Obese (more than 40)
Fig (20) B.M.I categorized & vegetable and fruit consumption
٣�٣�٦�٣ B.M.I Categorized & current Sport Practice:
To study the relationship between B.M.I categorized & current sport
practice we computed the contingency coefficient for both of them ,the
results were as shown in the table below.
Table31 B.M.I Categorized & Sport practice B.M.I categorized
Under
weight
less
than 20
normal
weight
)٢٠-٢٤�٩(
over
weight
)٢٥-٢٩�٩)
clearly
over
weight
)٤٠-٣٠(
obese
more
than 40
Total
Count
٤٤ ٤ ١١ ٢٣ ٦
no %within
Q14
١٣�٦% ٥٢�٣% ٢٥�٠% ٩�١%
١٠٠�٠%
Count ٨٢ ٤ ٢٢ ٣٨ ١٧ ١
Current
Sport
practice
Q14 yes %within
Q14 ١�٢% ٢٠�٧% ٤٦�٣% ٢٦�٨% ٤�٩%
١٠٠�٠%
Count ١٢٦ ٨ ٣٣ ٦١ ٢٣ ١
Total %within
Q14 .٨% ١٨�٣% ٤٨�٤% ٢٦�٢% ٦�٣%
١٠٠�٠%
The contingency coefficient value for B.M.I categorized & sport
practice was 0.136 ,p value was>0.668.

٥١
Bars below demonstrated this table:
Q14
yes no
Count
40
30
20
10
0
B M I categorized
under weight less than 20
normal weight 20 -24.9
Over weight 25 -29.9
Clearly over weight 30-40
obese more than 40
Fig (21) B.M.I categorized & current sport practice
3.3.6.4 B.M.I Categorized & Fat and Sweet consumption:
To study the relationship between B.M.I categorized & fat and
sweet consumption we computed the contingency coefficient for both of
them ,the results were as shown in the table below.
Table32 B.M.I Categorized & Fat and sweet consumption B.M.I categorized
Under
weight
less
than 20
normal
weight
20-24.9
over
weight
25-29.9
clearly
over
weight
30-40
Obese
more
than 40
Total
Count
٥٣ ١ ١٥ ٢٥ ١٢
no %within
Q17
٢٢�٦% ٤٧�٢% ٢٨�٣% ١�٩% ١٠٠�٠%
Count ٧٣ ٧ ١٨ ٣٦ ١١ ١
Fat and
sweet
Q17
yes %within
Q17 ١�٤% ١٥�١% ٤٩�٣% ٢٤�٧% ٩�٦% ١٠٠�٠%
Count ١٢٦ ٨ ٣٣ ٦١ ٢٣ ١
Total %within
Q17 0.8% ١٨�٣% ٤٨�٤% ٢٦�٢% ٦�٣% ١٠٠�٠%
The contingency coefficient value for B.M.I categorized fat and sweet
was 0.190 ,p value was>0.315.
Bars below demonstrated this table:
٥٢
Q17
yes no
Count
40
30
20
10
0
BMI categorized
Under weight less than 20
Normal weight 20-24.9
Over weight 25-29.9
Clearly over weight 30-40
Obese more than 40
Fig (22) B.M.I categorized & fat and sweet consumption
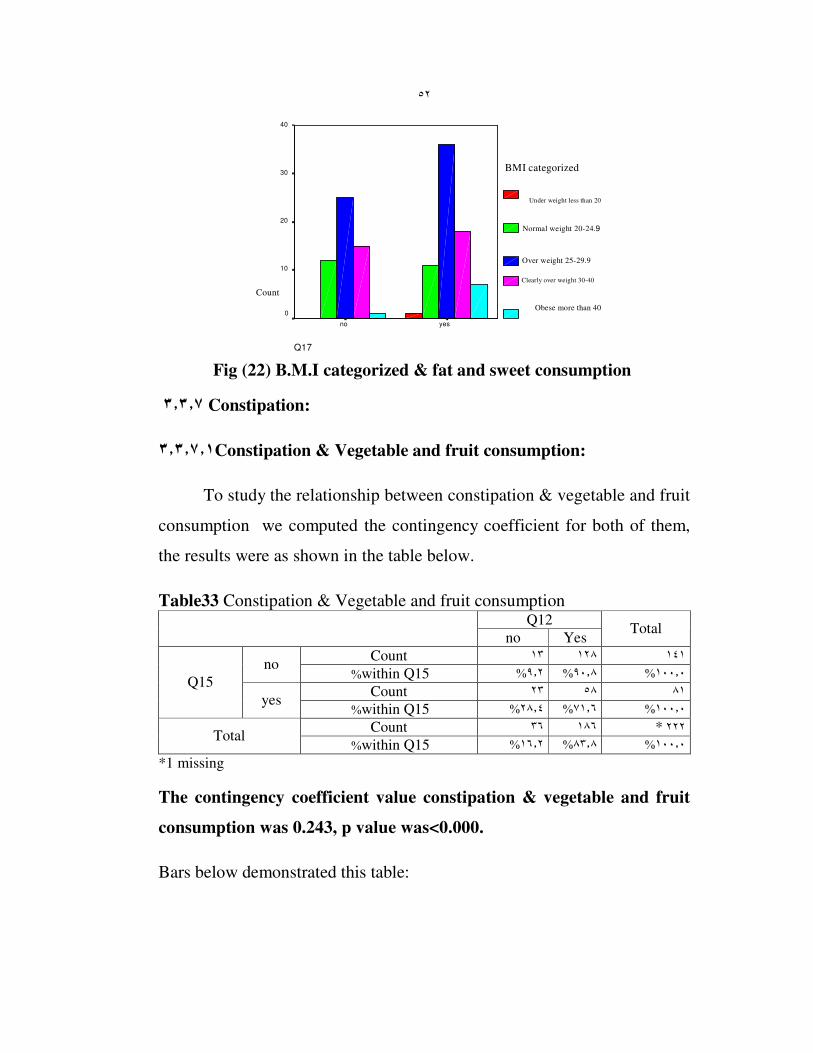
٣�٣�٧ Constipation:
٣�٣�٧�١Constipation & Vegetable and fruit consumption:
To study the relationship between constipation & vegetable and fruit
consumption we computed the contingency coefficient for both of them,
the results were as shown in the table below.
Table33 Constipation & Vegetable and fruit consumption Q12
no Yes Total
Count ١٤١ ١٢٨ ١٣ no
%within Q15 ١٠٠�٠ %٩٠�٨ %٩�٢%
Count ٨١ ٥٨ ٢٣ Q15
yes %within Q15 ١٠٠�٠ %٧١�٦ %٢٨�٤%
Count ١٨٦ ٣٦ * ٢٢٢ Total
%within Q15 ١٠٠�٠ %٨٣�٨ %١٦�٢%
*1 missing
The contingency coefficient value constipation & vegetable and fruit
consumption was 0.243, p value was<0.000.
Bars below demonstrated this table:
٥٣
Q15
yes no
Count
140
120
100
80
60
40
20
0
Q12
N o
yes
Fig (23) constipation & vegetable and fruit consumption
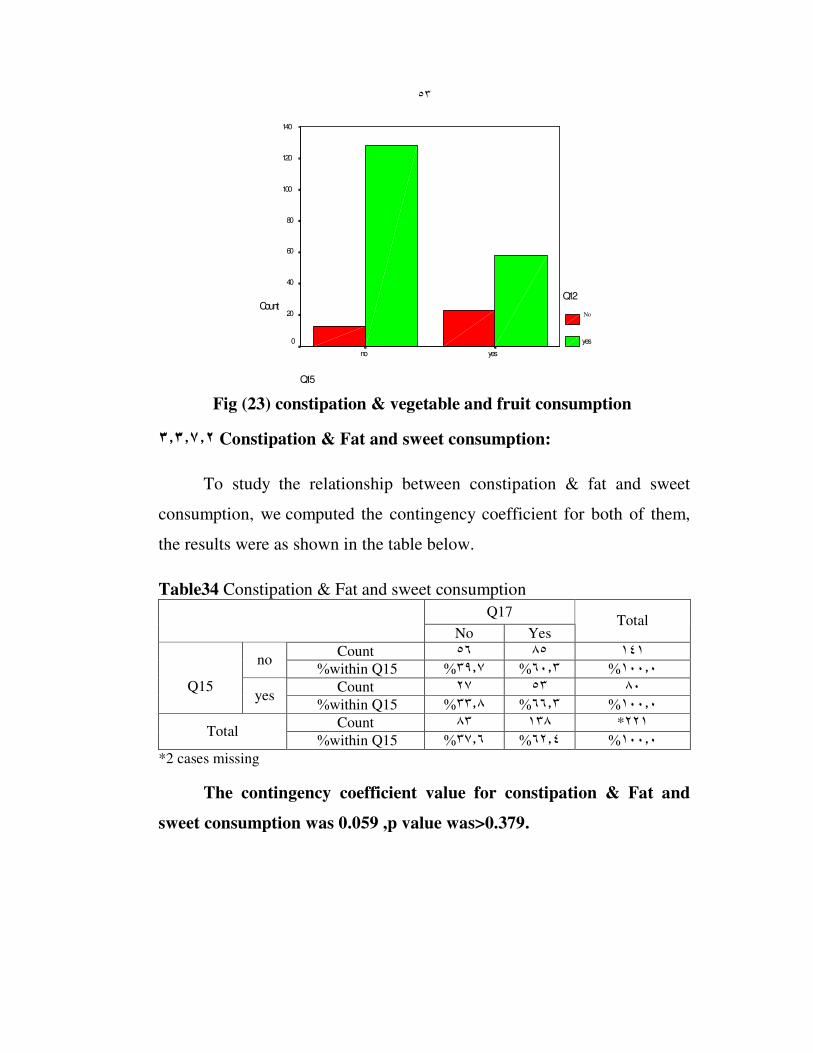
٣�٣�٧�٢ Constipation & Fat and sweet consumption:
To study the relationship between constipation & fat and sweet
consumption, we computed the contingency coefficient for both of them,
the results were as shown in the table below.
Table34 Constipation & Fat and sweet consumption
Q17
No Yes Total
Count ١٤١ ٨٥ ٥٦ no
%within Q15 ٣٩�٧% ٦٠�٣% ١٠٠�٠%
Count ٨٠ ٥٣ ٢٧
Q15 yes
%within Q15 ٣٣�٨% ٦٦�٣% ١٠٠�٠%
Count ٢٢١* ١٣٨ ٨٣ Total
%within Q15 ٣٧�٦% ٦٢�٤% ١٠٠�٠%
*2 cases missing
The contingency coefficient value for constipation & Fat and
sweet consumption was 0.059 ,p value was>0.379.
٥٤
Bars below demonstrated this table:
Q15
yesno
Co
un
t
90
80
70
60
50
40
30
20
Q17
no
yes
Fig (24) constipation & fat and sweet consumption
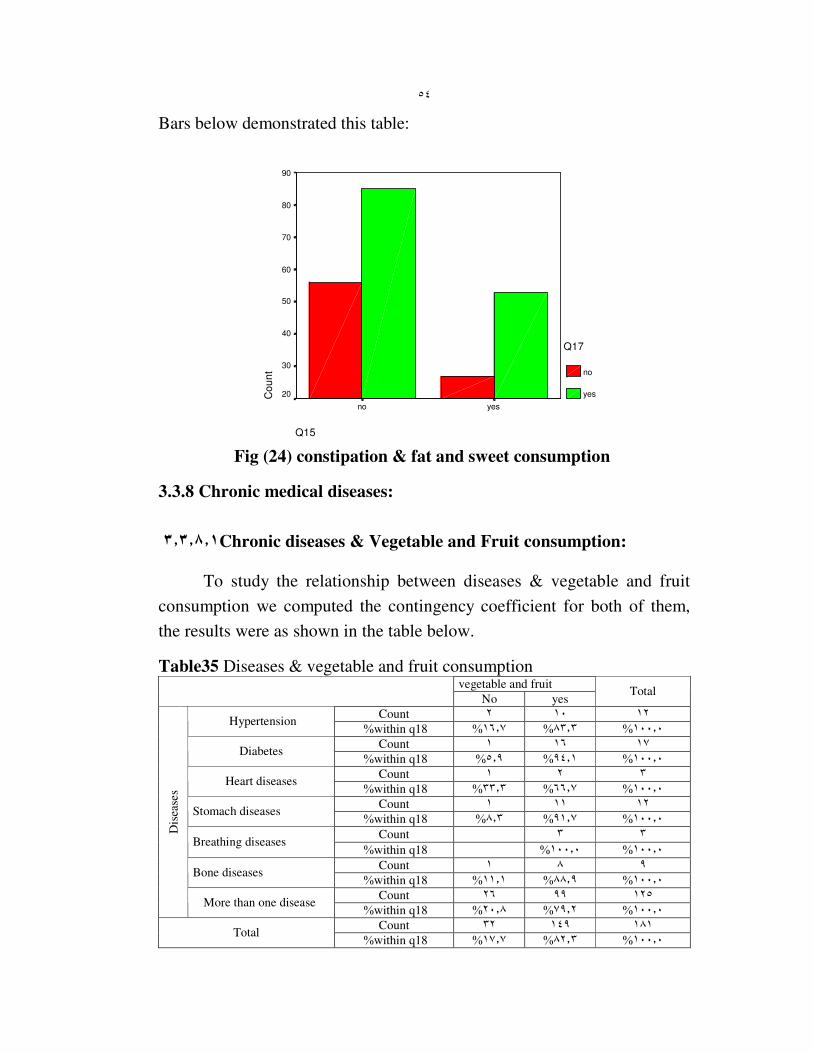
3.3.8 Chronic medical diseases:
٣�٣�٨�١ Chronic diseases & Vegetable and Fruit consumption:
To study the relationship between diseases & vegetable and fruit
consumption we computed the contingency coefficient for both of them,
the results were as shown in the table below.
Table35 Diseases & vegetable and fruit consumption vegetable and fruit
No yes Total
Count ١٢ ١٠ ٢ Hypertension
%within q18 ١٦�٧% ٨٣�٣% ١٠٠�٠%
Count ١٧ ١٦ ١ Diabetes
%within q18 ٥�٩% ٩٤�١% ١٠٠�٠%
Count ٣ ٢ ١ Heart diseases
%within q18 ٣٣�٣% ٦٦�٧% ١٠٠�٠%
Count ١٢ ١١ ١ Stomach diseases
%within q18 ٨�٣% ٩١�٧% ١٠٠�٠%
Count ٣ ٣ Breathing diseases
%within q18 ١٠٠�٠% ١٠٠�٠%
Count ٩ ٨ ١ Bone diseases
%within q18 ١١�١% ٨٨�٩% ١٠٠�٠%
Count ١٢٥ ٩٩ ٢٦
Dis
ease
s
More than one disease %within q18 ٢٠�٨% ٧٩�٢% ١٠٠�٠%
Count ١٨١ ١٤٩ ٣٢ Total
%within q18 ١٧�٧% ٨٢�٣% ١٠٠�٠%
٥٥
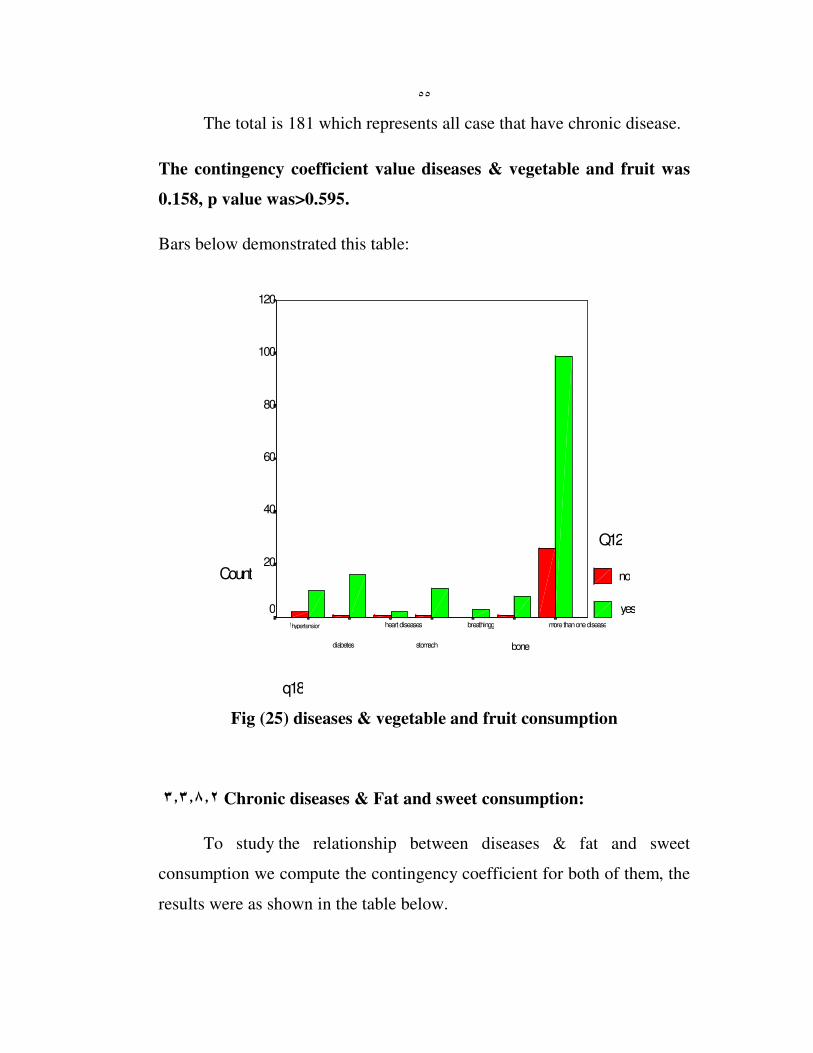
The total is 181 which represents all case that have chronic disease.
The contingency coefficient value diseases & vegetable and fruit was
0.158, p value was>0.595.
Bars below demonstrated this table:
q18
more than one disease
bone
breathingg
stomach
heart diseases
diabetes
hypertensionا
Count
120
100
80
60
40
20
0
Q12
no
yes
Fig (25) diseases & vegetable and fruit consumption
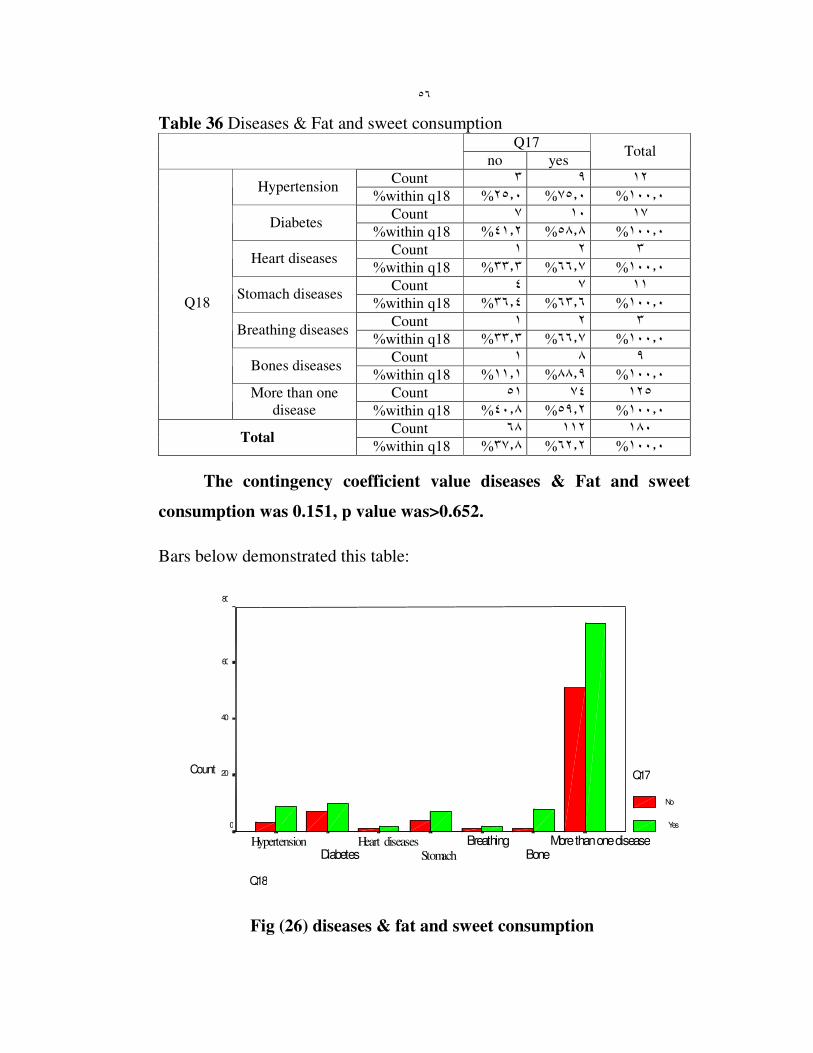
٣�٣�٨�٢ Chronic diseases & Fat and sweet consumption:
To study the relationship between diseases & fat and sweet
consumption we compute the contingency coefficient for both of them, the
results were as shown in the table below.
٥٦
Table 36 Diseases & Fat and sweet consumption Q17
no yes Total
Count ١٢ ٩ ٣ Hypertension
%within q18 ١٠٠�٠ %٧٥�٠ %٢٥�٠%
Count ١٧ ١٠ ٧ Diabetes
%within q18 ١٠٠�٠ %٥٨�٨ %٤١�٢%
Count ٣ ٢ ١ Heart diseases
%within q18 ١٠٠�٠ %٦٦�٧ %٣٣�٣%
Count ١١ ٧ ٤ Stomach diseases
%within q18 ١٠٠�٠ %٦٣�٦ %٣٦�٤%
Count ٣ ٢ ١ Breathing diseases
%within q18 ١٠٠�٠ %٦٦�٧ %٣٣�٣%
Count ٩ ٨ ١ Bones diseases
%within q18 ١٠٠�٠ %٨٨�٩ %١١�١%
Count ١٢٥ ٧٤ ٥١
Q18
More than one
disease %within q18 ١٠٠�٠ %٥٩�٢ %٤٠�٨%
Count ١٨٠ ١١٢ ٦٨ Total
%within q18 ١٠٠�٠ %٦٢�٢ %٣٧�٨%
The contingency coefficient value diseases & Fat and sweet
consumption was 0.151, p value was>0.652.
Bars below demonstrated this table:
Q18
More than one disease Bone
Breathing Stomach
Heart diseases Diabetes
Hypertension
Count
80
60
40
20
0
Q17
No
Yes
Fig (26) diseases & fat and sweet consumption
٥٧
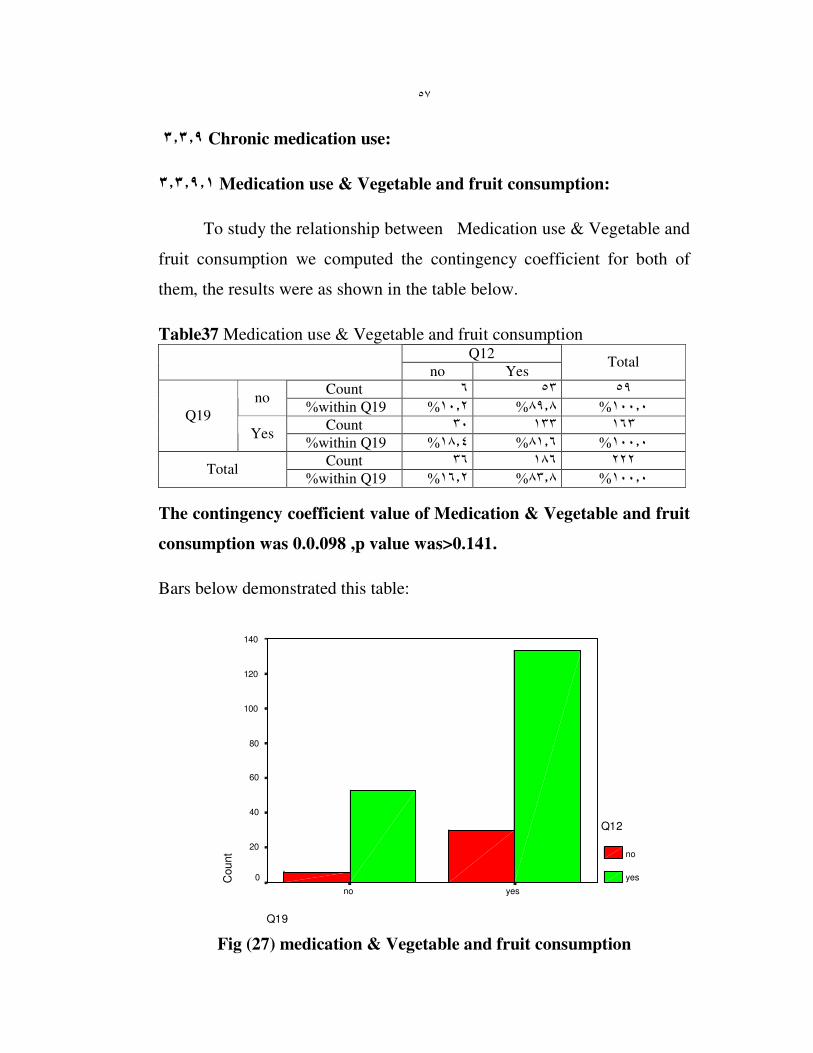
٣�٣�٩ Chronic medication use:
٣�٣�٩�١ Medication use & Vegetable and fruit consumption:
To study the relationship between Medication use & Vegetable and
fruit consumption we computed the contingency coefficient for both of
them, the results were as shown in the table below.
Table37 Medication use & Vegetable and fruit consumption Q12
no Yes Total
Count ٥٩ ٥٣ ٦ no
%within Q19 ١٠٠�٠ %٨٩�٨ %١٠�٢%
Count ١٦٣ ١٣٣ ٣٠ Q19
Yes %within Q19 ١٠٠�٠ %٨١�٦ %١٨�٤%
Count ٢٢٢ ١٨٦ ٣٦ Total
%within Q19 ١٠٠�٠ %٨٣�٨ %١٦�٢%
The contingency coefficient value of Medication & Vegetable and fruit
consumption was 0.0.098 ,p value was>0.141.
Bars below demonstrated this table:
Q19
yesno
Count
140
120
100
80
60
40
20
0
Q12
no
yes
Fig (27) medication & Vegetable and fruit consumption
٥٨
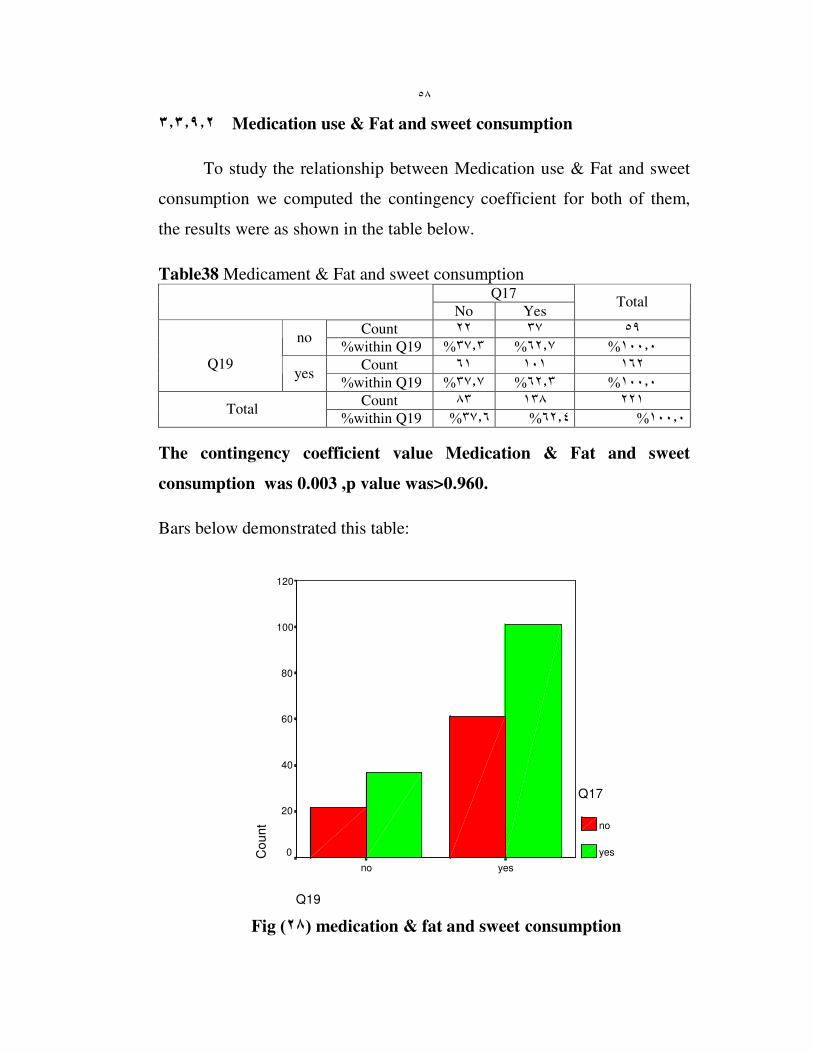
٣�٣�٩�٢ Medication use & Fat and sweet consumption
To study the relationship between Medication use & Fat and sweet
consumption we computed the contingency coefficient for both of them,
the results were as shown in the table below.
Table38 Medicament & Fat and sweet consumption Q17
No Yes Total
Count ٥٩ ٣٧ ٢٢ no
%within Q19 ٣٧�٣% ٦٢�٧% ١٠٠�٠%
Count ١٦٢ ١٠١ ٦١
Q19 yes
%within Q19 ٣٧�٧% ٦٢�٣% ١٠٠�٠%
Count ٢٢١ ١٣٨ ٨٣ Total
%within Q19 ١٠٠�٠ %٦٢�٤ %٣٧�٦%
The contingency coefficient value Medication & Fat and sweet
consumption was 0.003 ,p value was>0.960.
Bars below demonstrated this table:
Q19
yesno
Co
un
t
120
100
80
60
40
20
0
Q17
no
yes
Fig ) ٢٨ ( medication & fat and sweet consumption

Chapter Four
Discussion

��
4. Discussion
This study was conducted to know the nutrition status and the possible
risk factors that may affect it among Nablus city elderly people.
4.1 Social profile:
The results of the first part of the questionnaire showed the social
and demographic profile of the study sample in terms of gender, age,
residence, education, and income. Analyzing our results and comparing
them with relevant literature shows the following:
4.1.1 Gender:
In our study the percentage of females were alittle bit more than males
(59.2 % were females), this may be explained by the significant differences
in life expectancy of women and men. In the developed nations of the
world, women live on average six to eight years longer than men do. (Fact
sheet, WHO 2000).The over all percentage of elderly in Palestinian
Territories was 40085 for males and 50134 for females (2002 world
population data sheet).
4.1.2 Age:
Most of the elders in the study sample were in 60-70 years of age
(42.2%) �followed by 70-80 years group (39.5%) and finally those who
were more than 80 (18.4%). This result reflects the life expectancy at birth
(years) in the world for male which is 65 and for females which is 69(world
population data sheet, 2002)

��
4.1.3 Residence
The lowest percent of the elders in the study sample was for those who
live in the nursing home (17.5%), and the highest percent was for those
who live with their families (59.6%). This reflects our traditional and
religious values that emphasize the importance of home elderly care.
4.1.4 Education of the study sample
We found that almost half of study sample (48.9 %) had no
education, followed by basic education level (33.2%) and the lowest
percent had high education (17.5%). This is a sample that reflects the
opportunities of education in the past where most of old people either
didn’t have education or had only basic education level.
4.1.5 Income
Majority of study sample (76.7%) had some kind of income, but the
wages differ from one to another.We found that only 2.2% of the study
population had monthly income more than 400JD, 23.3% had 200-400JD,
28.3%had less than 200JD, while 31.4% had less than 100JD, and worst of
all (22% of the sample were without any basic income).This reflects the
poverty of elders in Palestine.
According to PCBS The average household’s monthly expenditure in
the West Bank is (JD 576), of which (JD 236) are spent on food, in North
West Bank (JD 492), of which (JD 195) are spent on food, and the average
household’s monthly consumption in the West Bank is (JD 634), of which

��
(JD 246) are spent on food, in North West Bank (JD 545), of which (JD
206) are spent on food.(PCBS,1998)
Also according to PCBS report about the poverty in Palestine,we see
that the elderly are the most vulnerable; Of the total heads of households
aged 65 and above, 16.1% in deep poverty “deep (absolute) poverty line,”
was calculated to reflect a budget for food, clothing and housing, and
25.2% are poor “relative poverty line” adds other necessities including
health care, education, transportation, personal care, and housekeeping
supplies, indicating that the elderly are the most vulnerable relative to other
age strata (PCBS, 1998).
The effect of income on elderly health and their nutritional status
was highlighted by a study done by Michelle B. Pierce, University of
Connecticut.
In this study, the most common concern of women was that "food
costs too much ".Cost constraints overlapped and overshadowed all other
concerns. Most women agreed that the "end of the month" was the most
difficult time period.
Of particular interest in this study was the emphasis on rising costs,
rather than limited or inadequate income. Towards the end of the month,
the women in the study appeared to redefine what constitutes as "adequate
diet" with fluctuations in their financial status. They seemed to alter their
definition of "needed food" to fewer items and foods of lower quality. (M
Pierce, N Sheehan and A Ferris, 2002).

�
The elders in our study sample also had similar concerns.
Since most of our elderly people have a limited income or don’t have at all,
their priorities were to spend their money on medication, rents and so on,
leaving the least percentage for good quality food. The following statement
was heard frequently while answering the questionnaire "I eat any thing
available".
4.2 Health profile:
4.2.1 Chronic diseases in elderly people:
More than half of study sample had more than one chronic disease �
diabetes was most frequent one (7.6% had D.M), followed by hypertension
and digestive diseases (5.4%), then osteoporosis (4%), of note that all these
diseases have nutritional component resulting from bad nutritional habits
and can be controlled by good nutritional behaviors.
The importance and effect of diet on chronic diseases in elderly was
highlighted by WHO report, 2003
The report states that many elderly patients with chronic diseases
currently receive nursing care in their own homes. In Sweden, as in other
countries, this care may be provided by district nurses or nurses' aids.
Chronic disease, low levels of physical activity, poor dental hygiene, and
swallowing difficulties are common causes of malnutrition in this
population.

�
The main diagnoses in this group were congestive heart failure,
post-stroke, type 2 diabetes mellitus, and chronic obstructive pulmonary
disease. (A. Saletti, L. Johansson and T. Cederholm, 1999)
According to WHO report 2003 many of the diseases suffered by the
elderly are the result of dietary factors, some of which have been operating
since infancy. These factors are then compounded by changes that naturally
occur with the aging process.
Dietary fat seems to be associated with cancer of the colon, pancreas
and prostate. Degenerative diseases such as cardiovascular and
cerebrovascular disease, diabetes, osteoporosis and cancer, which are
among the most common diseases affecting the elderly, are all diet-
affected. Increasingly in the diet/disease debate, the role that micronutrients
play in promoting health and preventing non-communicable disease is
receiving considerable attention. Micronutrient deficiencies are often
common in elderly people due to a number of factors such as their reduced
food intake and a lack of variety in the foods they eat. (WHO, 2003)
4.2.2 Medication use:
Majority of the study sample (73.1%) stated that they take
medications regularly, 30.9% of study sample take 3-5 medications daily,
29.6% take 1-2 medications daily, and just 2.2% had more than 8
medications daily.

��
Investigation of medication use patterns in a population (or
pharmaco-epidemiology) is useful for describing variations in medication
use and potentially detecting overuse or underuse of medications (BL
Strom, 1994)
The results of a study done on older people in North Carolina, USA
showed that the most frequently used therapeutic classes of medications
were, in rank order: cardiovascular, analgesic, gastrointestinal, nutritional
and central nervous system (TP Semla, D Cohen and G Paveza, 1993)
In a study of older people of different races at home in the
southeastern USA, there was an average use of 3.4 medications per person.
(Rozzini R, Ferrucci L, Losonczy K, Havlik RJ and Guralnik JM. 1996)
4.3 Risk factors profile
4.3.1 Denture
More than half of the study population (58.7%) don’t use denture.
According to the results of a survey released by the National Institute of
Dental and Craniofacial Research, the rate of tooth lessness dropped 60
percent since 1960 for persons aged 55 to 64. Today, older adults are
keeping their natural teeth longer because of scientific developments and
the preventive emphasis in dentistry. (Waugh Scott, 2002)
4.3.2 Smoking
��
Majority of the our study population (81.2%) were non-
smokers, and only (18.8 %) were smokers. In our study 71.1% had no
breathing difficulties because most of our sample were non-smokers.
The effect of smoking on health in aging people has been studied
heavily in the literature Smoking has aging effects, as well as contributing
to the development of diseases such as Cancer, Heart and lung disease, and
Gastric problems.
People who smoke also tend to show earlier aging skin than other
non-smokers do . Breathlessness, is a very important consequence of
smoking. Smoking also causes a little interest in food that might affect
elder’s nutrition.(Irving, Munday and Rowlands,2002)
4.3.3 Physical activity
In our study people were equally divided regarding their physical
activity practice (47.1% with no physical activity)
The amount of exercise needed depends on the person, but in general,
people need to step up their activity as they get older. Elderly people often
do the opposite, because of bad knees or arthritis. Instead of becoming
guarded, they need to walk, bicycle, swim, and garden and find other ways
to stay on the move. (Remig, 2003)
Most of the health benefits can be gained from regular physical activity
of moderate intensity. Health and wellbeing at older ages is modifiable, and

��
substantial gains could be made by promoting health and fitness
throughout life (Powell KE, Thompson PD, Caspersen CJ and Kendrick JS.
1987)
The most substantial body of evidence for achieving healthy active aging
relates to the beneficial effects of regular exercise. Increased physical
activity is associated with a reduced incidence of coronary heart disease,
hypertension, non-insulin dependent diabetes mellitus, colon cancer, and
depression and anxiety. (Abdellah FG and Moore SR.1988)
4.3.4 Kind of food
Almost 70% of study population reported high consumption of fat and
sweets, on the other hand there was a high consumption of vegetables and
fruit (84.4%)
Consuming a wide variety of foods is considered one of the key
components of dietary adequacy. The 2000 Dietary Guidelines for
Americans includes two messages about variety: "Eat a variety of grains
daily, especially whole grains "and "Eat a variety of fruits and vegetables
daily" (Dietary Guidelines for Americans, 2000)
In addition, the Recommended Dietary Allowances (RDAs) provide the
amounts of nutrients that should be consumed through a variety of foods
from diverse food groups as part of a normal diet (National Research
Council, 1989 )
4.4 Relationships

�
The relation between nutrition in elderly and all possible risk factors
was analyzed and assessed .
4.4.1 Social factors and nutrition
4.4.1.1 Socioeconomic status and milk consumption
The results showed a great relation between milk consumption and
income this relation was statistically significant, (p =0.000).
These results emphasize the effect of income on quality food
consumption of elders.
Researchers from Leeds Metropolitan University conducted a study
to determine how health and social factors affect the nutritional intake of
the aging population.
The findings showed an inadequate intake of fluid, fruits, vegetables,
and non-starch polysaccharides by the subjects. Hot or cooked meals were
consumed infrequently. The researchers identified health and social factors
impacting intake to be inadequate amounts of money, poor or inaccessible
food storage facilities, physical disabilities affecting food preparation,
limited access to shops, type of cooking facilities available, as well as
loneliness and bereavement. (Wylie, Copeman and Kirk, 1999)
4.4.1.2 Place of living and nutrition in elderly
��
The results showed a significant positive relation between place of
living and milk, fruit and vegetables consumption and sweet and fat
consumption (p<0.000,0.035and 0.001 respectively).
The consumption of food varied according to the place of living,
with better consumption found to be among those living with their families.
The family is one of leverage point we consider. It is a primary
source of nutrition-related attitudes, beliefs, and behaviors during the
nutrition and health/illness cycle. Unfortunately, health practitioners do
not routinely consider it. However, different dimensions and levels of
family life have clear implications for health practice.( Ross, Mirowsky,
Goldsteen. 1990).
Family structure provides a foundation for individual health and
offers additional resources for health. Marriage, particularly in dual-earner
families, increases the household earnings of both partners and may modify
intra-household choices and opportunities related to dietary practices
(Umberson, 1987). For those who are unable to remain in their own homes
the social services may provide some residential homes .These homes
present services for elderly people including food and care about their
nutrition.
The most suffering group is elderly who live alone.
4.4.1.3 Age and food difficulties
��
The results showed a significant relation between age and food
difficulties (p<0.006) with increasing difficulties as people get older.
A Sweden study showed that sixty-two percent of the subjects assessed
were found to be at risk for malnutrition .In Sweden, as in other countries,
poor dental hygiene and swallowing difficulties are common causes of
malnutrition in this population. These results suggest that the nutritional
status of patients receiving home nursing care in Sweden is less than
satisfactory. (Saletti, Johansson and Cederholm, 1999)
Also, patients in this age group require special consideration because
reduced mobility and dexterity may make daily oral hygiene difficult. In
addition, medical conditions and impairment are factors that dentists take
into account for certain patients. Sometimes the lack of awareness about
available treatment and techniques leads older patients to make false
assumptions about their dental health.
This lack of awareness causes tolerance of conditions such as
toothaches, bleeding gums and clicking dentures causing difficulty in food
swallowing and chewing (Dr. Scott, Waugh, ODA president)
4.4.2 BMI relationships
4.4.2.1 B.M.I and kind of food
In comparing the BMI with type of food consumed by elders our study
found no statistically significant relationship between vegetables & fruits
(p=0.964), and fat & sweets (p=0.315).

��
But when we analyzed the results we found that the percentage
of people within normal weight (BMI 20-24.9) who consumed fat and
sweet was 15.1% and those with no or low consumption of fat and sweets
was 22.6%, in other words, people who are over weight (BMI 25-29.9)
who consumed fat and sweet were (49.3% ) and those with no or low
consumption of fat and sweets were (47.2%).
4.4.2.2 BMI and physical activity
Although the relationship in our findings between physical activity
and BMI was not statistically significant (p= 0.668), after analyzing the
results we found that over weight percentage for people without any sport
practice (at least walking) was 52.3% and for people with moderate
physical activity was 46.3%.
These two relations of BMI explained the relation between food
consumption and physical activity, elderly diet should be combined with
exercise .Weight status alone can create differences in a person's food
intake, activity level, and physical/emotional well being. (Richards, Adams
and Hunt, 2000).
In general it is advised to use simple and inexpensive methods to
screen people at risk. Although there are many instruments, which are
inexpensive, such as caliper (instrument used to measure skin fold
thickness) these instruments were not available.
In our study we were measuring BMI using anthropometric
measurements (height and weight) to determine variety factors associated
��
with measures of nutritional status, health, and dependency. A standard
technique (biochemical measures), with fasting blood samples would be a
better technique to enhance these results. However in our study we used
anthropometric measurements due to unavailable biochemical measures.

�
4.4.3 Chronic diseases and food consumption
There was no statistically significant relationship between food
consumption and chronic diseases.p=0.595 for fruit & vegetables, and
p=0.652 for fat & sweet consumption
Variety assessment offers an alternative model to explore the
relationship between food consumption and various aspects of health and
nutrition-related diseases. (Fanelli, Stevenhagen. 1985).
4.4.4 Medications and food consumption
There was no statistically significant relationship between food
consumption and medications.(p=0.141) for fruit & vegetables, and
(p=0.960 )for fat & sweet consumption
For elderly people according to Ola Aker study about chronic disease
(Hypertension and DM), the compliance of medications was strongly
affected by age with decreasing compliance in older ages. Also compliance
was found to be strongly affected by the number of medications taken daily
(Aker, 2003).
4.5 Conclusion
This is the first study regarding the nutrition status in elderly people
and the risk factors that affect their health in Palestine, this study
represented by a study sample of elderly in the city of Nablus

�
The following statements are important study results:
� Although the percentage of elderly people in our community is low
compared to developed countries, they comprise important percent
(3.5%) and this percentage is on the rise.
� Nutrition problems increase with age.
� Positive association between social factors and nutritional situation in
elderly.
� We have noticed that vegetable and fruit consumption is relatively high
which reflects the awareness of importance of taking vegetables and
fruit, however the consumption of fat and sweet was found to be high
too.
� It was revealed by the BMI results that the percentage of obesity among
the elderly is high
� Significant positive association between nutrition and gender, age,
place of living, socioeconomic factors, however there was no
significance between health profile and BMI profile.
� Although there's satisfactory profile about food consumption in elderly,
there is a need to increase the awareness about healthy food practice
among them.

��
4.6 Recommendations:
Although Palestinian Society consists of young age group
in large, the elderly are important part of this society. At this time
elderly form only 3.5% of Palestinian society but this percent is
on the rise. Health care, and nutritional care of elderly deserves
our attention.
During this study, we highlighted the need to study nutrition
and it’s risk factors in elderly, which is considered to be a
neglected group of the Palestinian society. Further studies are
needed regarding nutrition of elderly.
These are some recommendations and suggestions for
further evaluation, we hope to take them into consideration.
� Diet is an important aspect of development. It is essential that all
people have a regular, well – balanced diet containing all the essential
foods, such as vegetables and fruits, protein, minerals and vitamins.
These days it is generally accepted that intake of sugars and fats should
be limited, as should salt .
� There are many different factors involved in the process of ageing. The
one that most people have control over is lifestyle, the way we live our
lives. Therefore each of us can have some control over the ageing
��
process in our own bodies, the most important factors are
smoking, diet �and exercise .
� There are a great many Voluntary organizations set up to help with the
care of elderly people. Some offer direct care, help or advice, while
others campaign for elderly people in order to get better provision for
them.
� As the numbers of elderly people have increased, the private sector has
emerged as an important supplier of care. The main provision is in the
residential care setting.
� Action program for health education to raise awareness about good
nutrition, problems and disease affected by nutrition in elderly.
� The need for routine check up for elderly people for early detection of
any disease that may can controlled by nutrition.
� Control body weight with awareness for such risk factors related to
nutrition such as tooth, bone and kind of food should be consumed to
improve health should be taken considered .
� The use of full time nutritionists at long term care facilities to improve
the nutritional status of the elderly.
� Developing education programs such as weight management.
� Improving social and economic factors of elderly.
� Participant of all community, in all groups regardless of their age, in
improving nutrition of elderly.

References
��
References:
A. aletti, L. Johansson, T. Cederholm, "Mini Nutritional Asses-sment in
Elderly Subjects Receiving Home Nursing Care", Journal of
Human Nutrition and Dietetics 12: 381-387 (November 1999).
Abdellah FG, Moore SR, eds. Surgeon general's workshop: "health
promotion and aging—proceedings". Washington, DC: Office of the
Surgeon General, Public Health Service, 1988.
Aker, Ola, (2003). Chronic Diseases (Hypertension and Diabetes
Mellitus) in Nablus District. Unpublished Master's Thesis, An-
Najah National university. Nabluse. Palestine. P.40.
Brubaker TH, Powers EA. The stereotype of "old". A review and
alternative approach. Journal of Gerontology.1976; 31(4)441-7.
C. Wylie, J. Copeman, S. Kirk, "Health and Social Factors Affecting the
Food Choice and Nutritional Intake of Elderly People with Restricted
Mobility", Journal of Human Nutrition and Dietetics 12 375-389
(November 1999) [Correspondence: June Copeman, Faculty of
Health and Environment, Leeds Metropolitan University, Calverly
St., Leeds LS1 3HE, UK].
Characterizing consumption patterns by food frequency methods: Core
foods and variety of foods in diets of older Americans. J Am Diet
Assoc. 1985;85:1570-1576.
Eileen Kennedy, Susan E. Offutt. "Healthy Lifestyles For Healthy
Americans": Report On Usda's Year 2000 Behavioral Nutrition
Roundtable.Issue: May, 2000.
Fact Sheet N°252.June 2000: [email protected] Freund AM; Smith J.
Self-definition in old age. (German, abstract). Zeitschrift fur
Sozialpsychologie. 1997;28(1-2);44:59.
Functional status and emotional well-being, dietary intake, and physical
activity of severely obese subjects. Journal of the American
Dietetic Association, Jan, 2000, by Fanelli MT, Stevenhagen KJ.
Gelman, D. Growing old, feeling young, news week c(18):56, 1982
Glascock AP, Feinman SL. A holocultural analysis of old age.
Comparative Social Research. 1980;3:311-32.
��
Gorman M. Development and the rights of older people. In: Randel J, et
al., eds. The ageing and development report: poverty, independence
and the world's older people. London, Earthscan Publications
Ltd.,1999:3-21.
Gray R Andrews,Care of older people: promoting health and function
in an ageing population.2001.
Hall WJ. Update in geriatrics. Ann Intern Med 1997; 127: 557-564.
Harrick, E.J, and Sultan,P.E.: work force of the future : the problems and
opportunities of maturity, personnel 59:27, July/Aug.1982.
Harris TB, Feldman JJ. Implications of health status in analysis of risk in
older persons. Journal of Aging and Health. 1991; 3: 262-284.
Helen A. Guthrie. Introductory nutrition, Times Mirror/Mosby college
publishing,1986.
John E. Gray Ph.D. “Diet, Nutrition And The Prevention Of Chronic
Diseases”(28.3.02)Secretary General IAG Jegray @Shaw.Ca,2003.
Judith Irving, Susan Munday, Ashley Rowlands. pathways into caring.
Stanley Thorns (publishers ) Ltd, 2002.
Lois D. Mcbean, Susan M. Groziak, Gregory D. Miller, Judith K. Jarvis
Healthy Eating in Later years.
M Pierce, N Sheehan, A Ferris. Nutrition Concepts of Low-Income Elderly
Women and Related Social Support. J Nutr Elderly 21(3):37-52
(2002).
MacAdam M, et.al,. Case management for frail elders: the Robert Wood
Johnson Foundation's Program for Hospital Initiatives in Long-Term Care. Gerontologist. 1989;29:737-744.
Munro, H.N.: nutritional requirements in the elderly, Hosp. Pract.
10:143, Aug. 1982.
National Research Council. Recommended Dietary Allowances. 10th ed.
Washington, DC: National Academy Press; 1989.
Nelissa A. Bernstein, et.al, "Higher dietary variety is associated with better
nutritional status in frail elderly people". Journal of the American
Dietetic Association, August, 2002.
��
New Report On Medical Nutrition Therapy Issued. Issue: Jan, 2000. (WHO
Report).
Nynke De Jong. Sensible Aging: Using Nutrient-Dense Foods and
Physical Exercise With the Elderly .
Oklahoma Dental Association (ODA), The 10 Most Frequently Asked
Questions About Older Adults and Oral Health.
PR Newswire, Oct 9, 2002.
Palestinian Central Bureau of Statistics, Expenditure and Consumption
Levels: Final Report (January-December, 1998).
Palestinian Central Bureau of Statistics, Population by Age Groups in
Years, Region and Sex,1997.
Palestinian Central Bureau of Statistics, Poverty in Palestine
(January-December,1998).
Palestinian Central Bureau of Statistics,Palestinian Population by
Locality, Sex and Age Groups in Years,1997.
Position of the American Dietetic Association: Nutrition, aging and the
continuum of care. J Am Diet Assoc. 2000;100 :580-595.
Powell KE, Thompson PD, Caspersen CJ, Kendrick JS. Physical activity
and the incidence of coronary heart disease. Ann Rev Public
Health 1987;8:253-87.
Pulska T, Pahkala K, Laippala P, Kivela S-LK. Six-year survival of
depressed elderly Finns: a community study. Int J Geriatr
Psychiatry 1997;12:942-50.
Roebuck J. When does old age begin?: the evolution of the English
definition. Journal of Social History. 1979;12(3):416-28.
Roger M. Oskvig. Special Problems in the Elderly, Issue: May, 1999.
Ross CE, Mirowsky J, Goldsteen K. The impact of the family on health:
The decade in review. Journal of Marriage & the Family.
1990;52:1059-1078.
Rowe JW, Kahn RL. Human aging: usual and successful. Science.
1987;237:143-149.

��
Rozzini R, Ferrucci L, Losonczy K, Havlik RJ, Guralnik JM. Protective
effect of chronic NSAID use on cognitive decline in older persons. J Am Geriatr Soc 1996; 44: 1025-29.
Semla TP, Cohen D, Paveza G et al. Drug use patterns of persons with
Alzheimer's disease and related disorders living in the
community. J Am Geriatr Soc 1993; 41: 408-13. issue: July, 2001.
Thane P. History and the sociology of ageing. Social History of Medicine.
1989;2 (1):93-96.
Thane P. The muddled history of retiring at 60 and 65. New Society.
1978;45(826):234-236.
The 2000 Dietary Guidelines for Americans. www.usda.gov/cnpp/dietgd.
pdf.
The work of WHO in the E.M region:Annual report of the regional
director. Food, Nutrition and Health Programs,1 January – 31
December 2002.
Togunu- Bickersteth F. Chronological definitions and expectations of old
age among young adults in Nigeria. Journal of Aging Studies.
1987;1(2);113-24.
Togunu- Bickersteth F. Perception of old age among Yoruba aged. Journal
of Comparative Family Studies. 1988;19(1):113-23.
Umberson D. Family status and health behaviors: Social control as a
dimension of social integration. J Health Soc Behav. 1987;28: 306-
319.
Valentina Remig, Assistant Professor of Human Nutrition at Kansas State
University.Diet for the elderly people, National Institutes of
Health, 2002. www.niddk.nih.gov/
Van der Wielen RPJ. Vitamin intake and status in elderly Europeans.
Netherlands: Wageningen Agricultural University; 1995:1-167.
Virginia A.Beal. Nutrition in the life span. John Wiley And sons, 1980.
WHO 2003 “Ageing and nutrition: a growing global challenge”.
Appendix

��
Appendix
������ ���� �� ������� � �� ���� ���� ��� ����� �� �� ���� � ��!� �"#
$����� � %� � �� ��� � & ��� ��"���� $�� ����� $� ������� '���� ��� �� ����
�&���� ��&( )�� *�+,��
����:
� ./01/ � 1/02/ � $� 3��2/
%����
�&"�4+�� �
�5!� &
��6��� ������7��� 8 �5� � ��9� $:� �� �5� �
�����5!� �����
�� ;��� $+ � + $<� ���� =�6� ��� � !
�+&� $<���>//=�)( ���� � � >//0?//���� � $5�
?// ���� �
���+�� ������
��� ���� ����� ����� ! �
��� �@� ! �
��� ��6 ������ ! �
������ ��7�!� 6 � �!� A����:
B. D ��� ��� 8E� $#
� ����!
D 4� "� ��� �"�
/? ����� ; � ��"F!� G���� �� $&� �� ���� $#
� ��� �!
G���� =@ ��� �"�� ������ � :�!� � : <�� � #��F
/H D 8� �� � IE�� �� � ��� ���� $#
� ��� �!
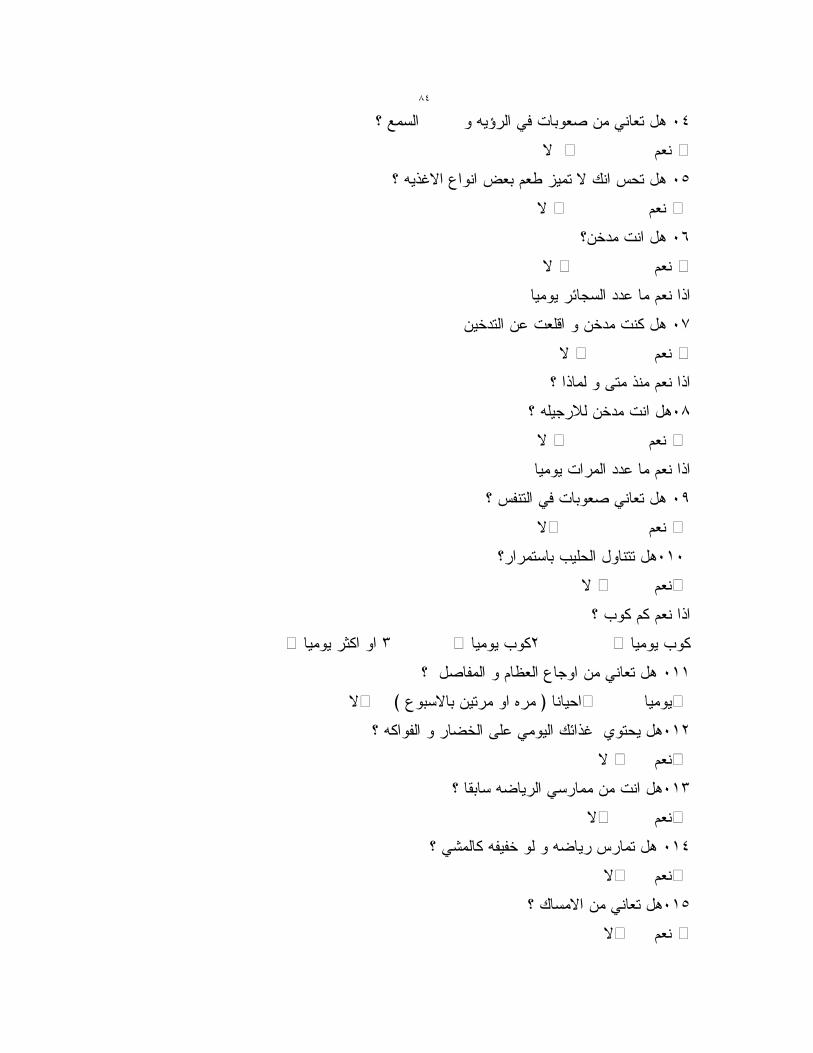
��
/> � ��,��� �� � ��� ���� $# D 8���
� ��� �!
/J D ��"F!� G���� �� ��� :�� ! K�� %�� $#
� ��� �!
/. D <� ��� $#
� ����!
��� �7���� ��6 ��� �"�
/1 �<���� 6 ���5� � <� ��& $#
� ��� � !
D �"� � 4� "� ��� �"�
/2 D �����L� <� ��� $#
� ��� �!
��� ����� ��6 ��� �"�
/M D %9���� �� � ��� ���� $#
� ��� �!
/B/D����� ;����� $���� $#
� ���� !
D ;�& �& ��� �"�
��� ;�&� ? ��� ;�&� H ��� �+&� �� �
/BBD $�9�� � �N��� G��� ���� $#
� ������� � ) G� �! ��� �� *� (� !
/B? D �&��9�� � �E<�� 4�6 ����� K7�"F =���� $#
� ���� !
/BHD � � �E���� ��� ��� $#
� ���� !
/B>D �(�& �9�9< �� � �E�� %�� $#
� ���� !
/BJ D K�!� ���� $#
� ��� � !

��
/B.D ���� =@ $���� $#
� ��� � !
D ��6�� �� ���� � �# $# ��� �"�
/B1 D ������� � ���#��� 4�6 ����� K7�"F =���� $#
� ���� !
/B2 D ������ ���!� ��� ���� $#
�� ��E� ��� � !
=�&�� ��� �!
;���� ����� ��� �!
�E)�� :)��� ����� ���� !
��9���� :)��� ����� ����!
�N6 �((#� ����!
/BMD ��� $&( �� A��� $���� $#
� ���� ! D �# ��� �"�
��� )����� ���� ����!� ��6 �&
�B0? � H0J � J02 � �+&� 2
/?/ ��� 6 � �!� A���� :
����� :��� :
$����:
$� $L< )����� ���� ��"F!� G���� 8�� �&" 4��� ����� $����� ��)?> ( �6� 8 �� ���
)��& �&"
��7�"��� *��� ��� ��&��
�&(�� $�:� �&� �
Conclusion
This is the first study regarding the nutrition status in elderly people and
the risk factors that affect their health in Palestine, this study represented
by a study sample of elderly in Nablus
The following statements are important study results:
• Although the percentage of elderly people in our community is
low compared to developed countries, they comprise important
percent (3.5%) and this percentage is on the rise.
• Nutrition problems increase with age.
• Positive association between social factors and nutritional
situation in elderly.
• We have noticed that vegetable and fruit consumption is
relatively high which reflects the awareness of the importance of
taking vegetables and fruit, however the consumption of fat and sweet
was found to be high too.
• It was revealed by the BMI results that the percentage of obesity
among the elderly are high
• Significant positive association between nutrition and gender ,
age , place of living , socioeconomic factors however there was no
significance between health profile and BMI profile.
Recommendation
Palestine is one of the developing countries, so there is a little
caring in this category of people but lately there is an increase
importance on elderly people in general but not nutrition of elderly
During this study, we highlighted the need to study nutrition and it’s
risk factors in elderly, which is considered to be a neglected group of
the Palestinian society. Further studies are needed regarding nutrition
of elderly
These are some recommendations and suggestions for further
evaluation, we hope to take them into consideration.
• Diet is an important aspect of development. It is essential that all
people have a regular, well – balanced diet containing all the essential
foods, such as vegetables and fruits, protein, minerals and vitamins.
These days it is generally accepted that intake of sugars and fats
should be limited, as should salt .
� There are many different factors involved in the process of
ageing. The one that most people have control over is lifestyle, the
way we live our lives. Therefore each of us can have some control
over the ageing process in our own bodies, the most important
factors are smoking, diet �and exercise .
• There are a great many Voluntary organizations set up to help
with the care of elderly people. Some offer direct care, help or advice,
while others campaign for elderly people in order to get better
provision for them.
• As the numbers of elderly people have increased, the private
sector has emerged as an important supplier of care. The main
provision is in the residential care setting,
• Action program for health education to raise awareness about
good nutrition , problems and disease affected by nutrition in elderly

• The need for routinely check up for elderly people for early
detection of any disease that may can controlled by nutrition
• Control body weight with awareness for such risk factors related
to nutrition such as tooth , bone and kind of food should be consumed
to improve health should be taken considered
• The use of full time nutritionists at long term care facilities
Improving the nutritional status of the elderly
• Developing education programs such as weight management
• Improving social and economic factors of elderly
• Participant of all community , in all groups regardless of their
age , in improving nutrition of elderly

������ ����� � ���
������ ������ ��� ������ �������� ���
����� ��� �� ���� ���� ��� ������ ��� !
"���# ���� ��� ���
$��%!
&�'( �� )�������
�������� ���� ���� �*�� �� �������� ��� ������� +,����� ����-� "�. ��/
�� ������������ 0����� �� ������ ������ ��� .
2334�
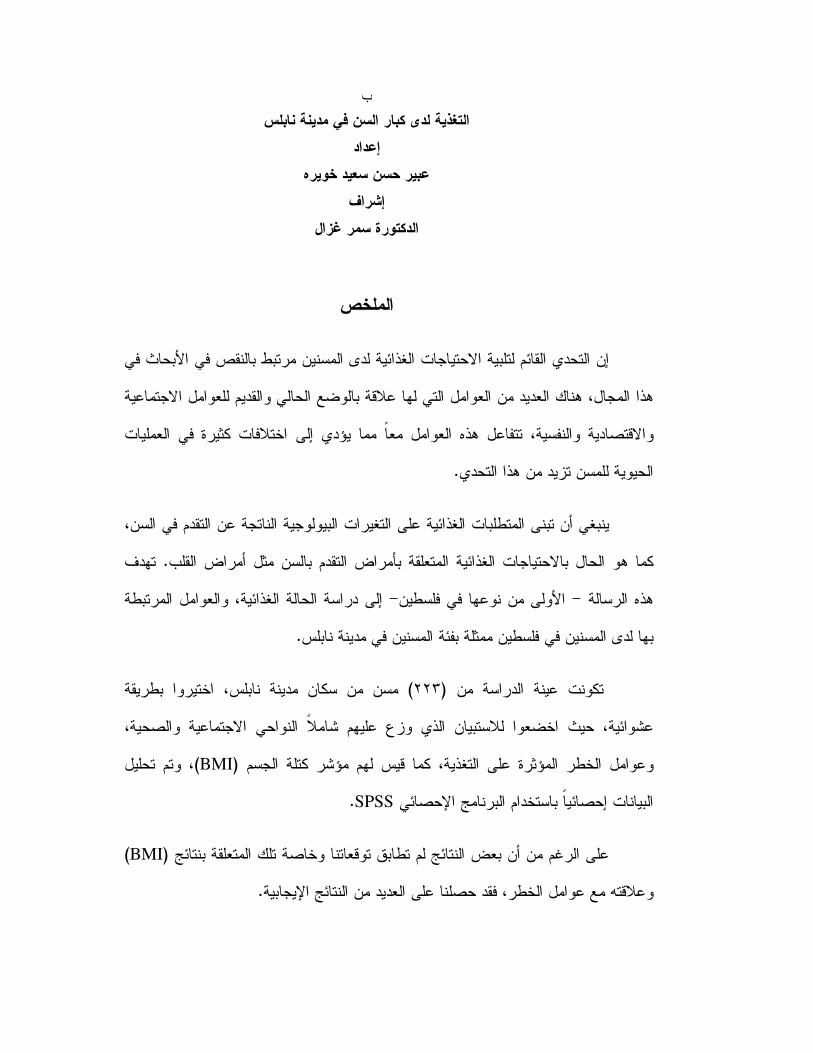
ب
����� ��� �� ���� ���� ��� ������
��� !
"���# ���� ��� ���
$��%!
&�'( �� )�������
5#���
� ������ �� �� ������ �� ������ �� ������ ����� ������ ��� ������� �� ����!�
"� ��� ��#$# %�� � ���%�� &��������' ������ ()'��� *+, �-� ���� "��'� �,��� !� "��'%
'�.���' ���/�*!�$�0�%� "��'%�� 1�# ",�.�� 2�� ��3� ��� ��� �%�� �� 4��56 ���+�7�
�'������ ������� ��# � ��8� .
2��� : ����� ������ , ����� � '�'���� �������� 2 , ������� ��� ����� $��� ��
��6 '# ;���<� � %���� ������� �� ����!�� "����= ��� ;���: "5� ���� ������ .� >�-
1�# ������?��� � �� �-,'� � 2�'�� ? 2�� ������� "��'%��' $������� ����� ����
� 5�� ��� � �� ������ ��� �-@ ��� ���� �� ������ �.� .
� ������ ��, ��'6�)BBC ( ����� �'���7� $@ ��� ���� �6� � ��
��� $���'E,�-� , F8' ���� �����+� �'%)7� $��/��' �,��� !� ���'��� 0+��E
�� �� �6 �E3� �-� @�* ��6 $������ 2 , 4�53��� ��7�� "��',')BMI( "� �� ��' $
�� ���7���� 0����/�� �������� ���/�G� H�����SPSS .
��� �� H������ ;%� : � �I��� 2 ,���%*'� J� H����� � %���� & � /�7' �)BMI (
$��7�� "��', (� K�*+,'���� �G� H������ � ���%�� 2 , �� /� ��.

ج
�L�+� "+7� * &��# : ��� ' ������' %��� �� ��M� M������� � %����
',�� ��� $���������� � %���� ���'� � ��, >��5�� �� 2�� ��� .
� H������ 1�# "�M � �M� ������M�� �%)�'� ����� ���� 2 , N')�� 2�
���,: ���'� 2�� ��)G�� $�-� ������� ;�����' ������� ����#!� � ��8�� �/��
//7���� � ��6:�� �-� �'���� �'���� ���� � ������ "� � �� ���/�� ��L��� .