TABLE B1. by industry and selected natures of injury or ...
84
TABLE B1. Percent distribution of nonfatal occupational injuries and illnesses involving days away from work 1 by industry and selected natures of injury or illness 2 , 2006 Industry 3 NAICS code 4 Total cases Percent of industry case total involving — Sprains, strains Fractures Cuts, punctures Bruises Heat burns Chemical burns Amputa- tions Private industry 6 ........................... 1,183,500 39.9 8.0 9.7 8.6 1.5 0.6 0.7 Goods producing 6 ............................ 380,440 33.9 9.9 13.3 7.7 1.4 .8 1.4 Natural resources and mining 6,7 ......... 26,290 31.3 13.0 9.3 11.3 1.7 .6 1.2 Agriculture, forestry, fishing and hunting 6 ................................................... 11 16,890 30.4 10.4 10.1 10.8 1.1 .5 1.0 Crop production 6 ............................................ 111 6,760 36.4 7.4 9.5 9.8 1.2 .6 .9 Oilseed and grain farming 6 ......................... 1111 70 28.6 – – – – – – Vegetable and melon farming 6 ................... 1112 1,470 38.1 8.8 9.5 8.8 1.4 – 1.4 Fruit and tree nut farming 6 .......................... 1113 2,370 33.8 6.3 11.4 13.1 – – 1.3 Greenhouse, nursery, and floriculture production 6 ............................................... 1114 2,120 35.4 9.4 8.0 8.0 2.8 – – Other crop farming 6 .................................... 1119 730 43.8 2.7 8.2 5.5 – – – Animal production 6 ......................................... 112 3,900 26.2 14.6 7.7 14.6 1.8 .5 .8 Cattle ranching and farming 6 ...................... 1121 2,380 22.7 19.7 6.3 17.6 – – .8 Beef cattle ranching and farming, including feedlots 6 ................................ 11211 740 35.1 17.6 2.7 8.1 – – – Dairy cattle and milk production 6 ............ 11212 1,640 17.1 20.7 7.9 22.0 – – 1.2 Hog and pig farming 6 .................................. 1122 560 30.4 3.6 8.9 10.7 8.9 – – Poultry and egg production 6 ....................... 1123 590 32.2 6.8 10.2 8.5 – – – Animal aquaculture 6 ................................... 1125 120 50.0 25.0 – – – – – Other animal production 6 ............................ 1129 250 24.0 – 16.0 12.0 – – – Forestry and logging ....................................... 113 1,370 23.4 12.4 8.0 6.6 – – – Timber tract operations .............................. 1131 20 – – – – – – – Forest nurseries and gathering of forest products .................................................... 1132 30 – – – – – – – Logging ....................................................... 1133 1,320 22.7 12.9 8.3 6.8 – – – Fishing, hunting and trapping ......................... 114 170 23.5 – – – – – – Fishing ........................................................ 1141 60 66.7 – – – – – – Support activities for agriculture and forestry 115 4,680 27.6 9.4 13.2 10.7 .4 .4 1.5 Support activities for crop production ......... 1151 3,770 26.3 6.9 13.5 10.6 .5 .5 1.9 Support activities for crop production ..... 11511 3,770 26.3 6.9 13.5 10.6 .5 .5 1.9 Cotton ginning .................................... 115111 260 11.5 – 30.8 15.4 – – 7.7 Soil preparation, planting, and cultivating ......................................... 115112 320 21.9 – 15.6 – – – – Postharvest crop activities (except cotton ginning) .................................. 115114 1,300 25.4 7.7 10.8 10.8 – – 2.3 Farm labor contractors and crew leaders .............................................. 115115 1,420 29.6 7.7 15.5 4.9 – – – Farm management services ............... 115116 330 36.4 – – 45.5 – – – Support activities for animal production ..... 1152 670 29.9 20.9 10.4 13.4 – – – See footnotes at end of table. Page 1
Transcript of TABLE B1. by industry and selected natures of injury or ...

TABLE B1. Percent distribution of nonfatal occupational injuries and illnesses involving days away from work1 by industry and selectednatures of injury or illness2, 2006
Industry3 NAICScode4
Totalcases
Percent of industry case total involving —
Sprains,strains Fractures Cuts,
punctures Bruises Heatburns
Chemicalburns
Amputa-tions
Private industry6 ........................... 1,183,500 39.9 8.0 9.7 8.6 1.5 0.6 0.7
Goods producing6 ............................ 380,440 33.9 9.9 13.3 7.7 1.4 .8 1.4
Natural resources and mining6,7 ......... 26,290 31.3 13.0 9.3 11.3 1.7 .6 1.2
Agriculture, forestry, fishing andhunting6 ................................................... 11 16,890 30.4 10.4 10.1 10.8 1.1 .5 1.0
Crop production6 ............................................ 111 6,760 36.4 7.4 9.5 9.8 1.2 .6 .9Oilseed and grain farming6 ......................... 1111 70 28.6 – – – – – –Vegetable and melon farming6 ................... 1112 1,470 38.1 8.8 9.5 8.8 1.4 – 1.4Fruit and tree nut farming6 .......................... 1113 2,370 33.8 6.3 11.4 13.1 – – 1.3Greenhouse, nursery, and floriculture
production6 ............................................... 1114 2,120 35.4 9.4 8.0 8.0 2.8 – –Other crop farming6 .................................... 1119 730 43.8 2.7 8.2 5.5 – – –
Animal production6 ......................................... 112 3,900 26.2 14.6 7.7 14.6 1.8 .5 .8Cattle ranching and farming6 ...................... 1121 2,380 22.7 19.7 6.3 17.6 – – .8
Beef cattle ranching and farming,including feedlots6 ................................ 11211 740 35.1 17.6 2.7 8.1 – – –
Dairy cattle and milk production6 ............ 11212 1,640 17.1 20.7 7.9 22.0 – – 1.2Hog and pig farming6 .................................. 1122 560 30.4 3.6 8.9 10.7 8.9 – –Poultry and egg production6 ....................... 1123 590 32.2 6.8 10.2 8.5 – – –Animal aquaculture6 ................................... 1125 120 50.0 25.0 – – – – –Other animal production6 ............................ 1129 250 24.0 – 16.0 12.0 – – –
Forestry and logging ....................................... 113 1,370 23.4 12.4 8.0 6.6 – – –Timber tract operations .............................. 1131 20 – – – – – – –Forest nurseries and gathering of forest
products .................................................... 1132 30 – – – – – – –Logging ....................................................... 1133 1,320 22.7 12.9 8.3 6.8 – – –
Fishing, hunting and trapping ......................... 114 170 23.5 – – – – – –Fishing ........................................................ 1141 60 66.7 – – – – – –
Support activities for agriculture and forestry 115 4,680 27.6 9.4 13.2 10.7 .4 .4 1.5Support activities for crop production ......... 1151 3,770 26.3 6.9 13.5 10.6 .5 .5 1.9
Support activities for crop production ..... 11511 3,770 26.3 6.9 13.5 10.6 .5 .5 1.9Cotton ginning .................................... 115111 260 11.5 – 30.8 15.4 – – 7.7Soil preparation, planting, and
cultivating ......................................... 115112 320 21.9 – 15.6 – – – –Postharvest crop activities (except
cotton ginning) .................................. 115114 1,300 25.4 7.7 10.8 10.8 – – 2.3Farm labor contractors and crew
leaders .............................................. 115115 1,420 29.6 7.7 15.5 4.9 – – –Farm management services ............... 115116 330 36.4 – – 45.5 – – –
Support activities for animal production ..... 1152 670 29.9 20.9 10.4 13.4 – – –
See footnotes at end of table.
Page 1

TABLE B1. Percent distribution of nonfatal occupational injuries and illnesses involving days away from work1 by industry andselected natures of injury or illness2, 2006 — Continued
Industry3
Percent of industry case total involving —
Carpaltunnel
syndrome
Tendon-itis
Multiple traumatic injuries anddisorders
Back pain and pain,except back
Allother
natures5Total
Withfractures,
burns,and
otherinjuries
Withsprains
andbruises
Total
Backpain,hurt
back only
Private industry6 ........................... 1.1 0.4 3.9 0.9 1.5 8.9 3.0 16.8
Goods producing6 ............................ 1.6 .5 3.7 1.1 1.1 7.4 2.4 18.4
Natural resources and mining6,7 ......... .2 .3 4.2 1.2 1.3 6.1 2.1 20.8
Agriculture, forestry, fishing andhunting6 ................................................... .4 .5 4.9 1.5 1.8 7.6 2.2 22.5
Crop production6 ............................................ – 1.0 3.6 .9 1.5 7.2 1.8 22.6Oilseed and grain farming6 ......................... – – – – – – – 42.9Vegetable and melon farming6 ................... – – 5.4 2.0 – 4.1 2.0 20.4Fruit and tree nut farming6 .......................... – 2.1 3.4 – 2.5 5.5 2.1 23.2Greenhouse, nursery, and floricultureproduction6 ............................................... – – 2.8 – 1.4 7.1 1.9 25.0
Other crop farming6 .................................... – – – – – 20.5 – 16.4Animal production6 ......................................... .5 – 4.1 2.3 1.0 9.5 3.8 19.2
Cattle ranching and farming6 ...................... – – 5.0 3.4 .8 6.7 1.3 19.7Beef cattle ranching and farming,including feedlots6 ................................ – – 6.8 4.1 – 5.4 – 23.0
Dairy cattle and milk production6 ............ – – 4.3 2.4 1.2 7.3 1.8 18.3Hog and pig farming6 .................................. – – 3.6 – – 12.5 10.7 17.9Poultry and egg production6 ....................... – – 3.4 – – 6.8 3.4 23.7Animal aquaculture6 ................................... – – – – – – – –Other animal production6 ............................ – – – – – 28.0 12.0 12.0
Forestry and logging ....................................... 1.5 – 13.1 4.4 5.1 7.3 – 26.3Timber tract operations .............................. – – – – – – – –Forest nurseries and gathering of forestproducts .................................................... – – – – – – – –
Logging ....................................................... 1.5 – 13.6 4.5 5.3 6.8 – 26.5Fishing, hunting and trapping ......................... – – – – – – – –
Fishing ........................................................ – – – – – – – –Support activities for agriculture and forestry – – 5.1 1.1 1.9 6.8 2.1 24.4
Support activities for crop production ......... – – 5.3 1.3 1.6 7.7 2.4 26.5Support activities for crop production ..... – – 5.3 1.3 1.6 7.7 2.4 26.5
Cotton ginning .................................... – – – – – – – 11.5Soil preparation, planting, andcultivating ......................................... – – – – – – – 46.9
Postharvest crop activities (exceptcotton ginning) .................................. – – 3.1 – 2.3 6.2 4.6 32.3
Farm labor contractors and crewleaders .............................................. – – 7.7 – 1.4 8.5 1.4 25.4
Farm management services ............... – – – – – – – –Support activities for animal production ..... – – 6.0 – 4.5 3.0 – 13.4
See footnotes at end of table.
Page 2
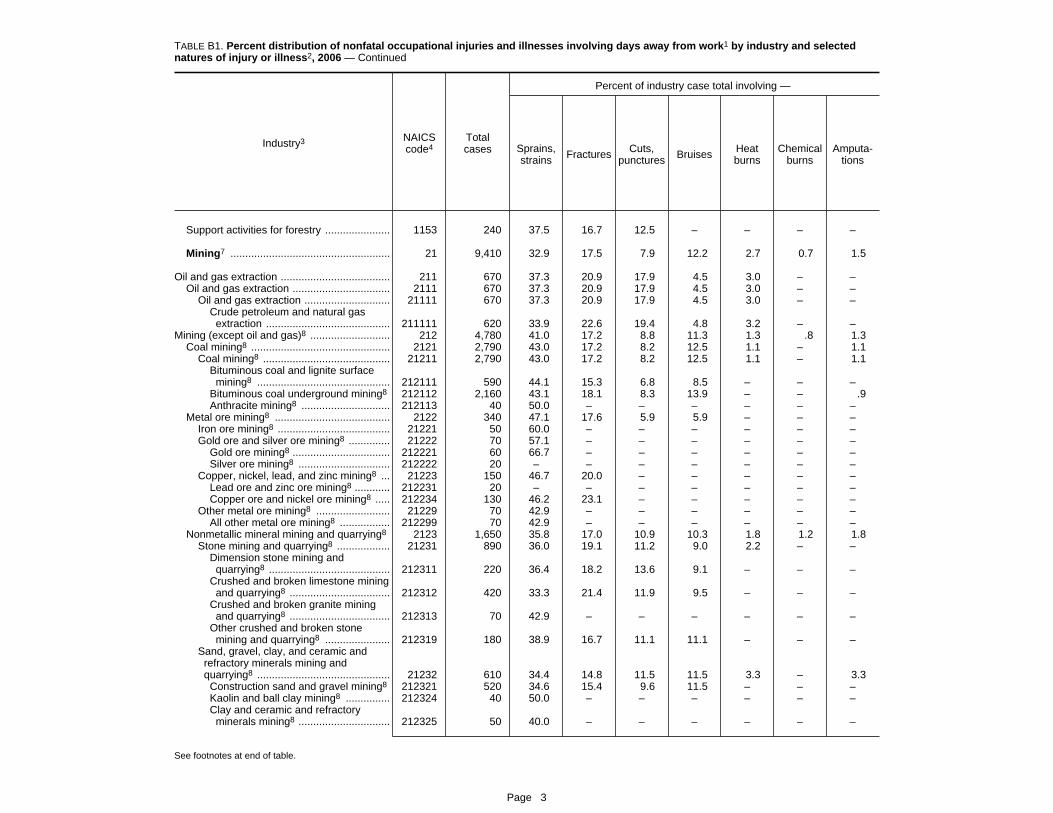
TABLE B1. Percent distribution of nonfatal occupational injuries and illnesses involving days away from work1 by industry and selectednatures of injury or illness2, 2006 — Continued
Industry3 NAICScode4
Totalcases
Percent of industry case total involving —
Sprains,strains Fractures Cuts,
punctures Bruises Heatburns
Chemicalburns
Amputa-tions
Support activities for forestry ...................... 1153 240 37.5 16.7 12.5 – – – –
Mining7 ...................................................... 21 9,410 32.9 17.5 7.9 12.2 2.7 0.7 1.5
Oil and gas extraction ..................................... 211 670 37.3 20.9 17.9 4.5 3.0 – –Oil and gas extraction ................................. 2111 670 37.3 20.9 17.9 4.5 3.0 – –
Oil and gas extraction ............................. 21111 670 37.3 20.9 17.9 4.5 3.0 – –Crude petroleum and natural gas
extraction .......................................... 211111 620 33.9 22.6 19.4 4.8 3.2 – –Mining (except oil and gas)8 ........................... 212 4,780 41.0 17.2 8.8 11.3 1.3 .8 1.3
Coal mining8 ............................................... 2121 2,790 43.0 17.2 8.2 12.5 1.1 – 1.1Coal mining8 ........................................... 21211 2,790 43.0 17.2 8.2 12.5 1.1 – 1.1
Bituminous coal and lignite surfacemining8 ............................................. 212111 590 44.1 15.3 6.8 8.5 – – –
Bituminous coal underground mining8 212112 2,160 43.1 18.1 8.3 13.9 – – .9Anthracite mining8 .............................. 212113 40 50.0 – – – – – –
Metal ore mining8 ....................................... 2122 340 47.1 17.6 5.9 5.9 – – –Iron ore mining8 ...................................... 21221 50 60.0 – – – – – –Gold ore and silver ore mining8 .............. 21222 70 57.1 – – – – – –
Gold ore mining8 ................................. 212221 60 66.7 – – – – – –Silver ore mining8 ............................... 212222 20 – – – – – – –
Copper, nickel, lead, and zinc mining8 ... 21223 150 46.7 20.0 – – – – –Lead ore and zinc ore mining8 ............ 212231 20 – – – – – – –Copper ore and nickel ore mining8 ..... 212234 130 46.2 23.1 – – – – –
Other metal ore mining8 ......................... 21229 70 42.9 – – – – – –All other metal ore mining8 ................. 212299 70 42.9 – – – – – –
Nonmetallic mineral mining and quarrying8 2123 1,650 35.8 17.0 10.9 10.3 1.8 1.2 1.8Stone mining and quarrying8 .................. 21231 890 36.0 19.1 11.2 9.0 2.2 – –
Dimension stone mining andquarrying8 ......................................... 212311 220 36.4 18.2 13.6 9.1 – – –
Crushed and broken limestone miningand quarrying8 .................................. 212312 420 33.3 21.4 11.9 9.5 – – –
Crushed and broken granite miningand quarrying8 .................................. 212313 70 42.9 – – – – – –
Other crushed and broken stonemining and quarrying8 ...................... 212319 180 38.9 16.7 11.1 11.1 – – –
Sand, gravel, clay, and ceramic andrefractory minerals mining andquarrying8 ............................................. 21232 610 34.4 14.8 11.5 11.5 3.3 – 3.3Construction sand and gravel mining8 212321 520 34.6 15.4 9.6 11.5 – – –Kaolin and ball clay mining8 ............... 212324 40 50.0 – – – – – –Clay and ceramic and refractory
minerals mining8 ............................... 212325 50 40.0 – – – – – –
See footnotes at end of table.
Page 3

TABLE B1. Percent distribution of nonfatal occupational injuries and illnesses involving days away from work1 by industry andselected natures of injury or illness2, 2006 — Continued
Industry3
Percent of industry case total involving —
Carpaltunnel
syndrome
Tendon-itis
Multiple traumatic injuries anddisorders
Back pain and pain,except back
Allother
natures5Total
Withfractures,
burns,and
otherinjuries
Withsprains
andbruises
Total
Backpain,hurt
back only
Support activities for forestry ...................... – – – – – – – 20.8
Mining7 ...................................................... – – 3.1 0.6 0.5 3.6 1.7 17.7
Oil and gas extraction ..................................... – – 3.0 – – 3.0 – 11.9Oil and gas extraction ................................. – – 3.0 – – 3.0 – 11.9
Oil and gas extraction ............................. – – 3.0 – – 3.0 – 11.9Crude petroleum and natural gasextraction .......................................... – – 3.2 – – – – 11.3
Mining (except oil and gas)8 ........................... – – 2.5 – – 2.9 1.5 13.0Coal mining8 ............................................... – – 2.2 – – 2.5 1.1 11.8
Coal mining8 ........................................... – – 2.2 – – 2.5 1.1 11.8Bituminous coal and lignite surfacemining8 ............................................. – – 3.4 – – 5.1 – 15.3
Bituminous coal underground mining8 – – 1.9 – – 2.3 .9 10.6Anthracite mining8 .............................. – – – – – – – –
Metal ore mining8 ....................................... – – – – – – – 14.7Iron ore mining8 ...................................... – – – – – – – –Gold ore and silver ore mining8 .............. – – – – – – – –
Gold ore mining8 ................................. – – – – – – – –Silver ore mining8 ............................... – – – – – – – –
Copper, nickel, lead, and zinc mining8 ... – – – – – – – 13.3Lead ore and zinc ore mining8 ............ – – – – – – – –Copper ore and nickel ore mining8 ..... – – – – – – – 15.4
Other metal ore mining8 ......................... – – – – – – – –All other metal ore mining8 ................. – – – – – – – –
Nonmetallic mineral mining and quarrying8 – – 3.0 – – 3.6 1.8 14.5Stone mining and quarrying8 .................. – – 3.4 – – 3.4 2.2 13.5
Dimension stone mining andquarrying8 ......................................... – – – – – – – 9.1
Crushed and broken limestone miningand quarrying8 .................................. – – – – – 4.8 – 14.3
Crushed and broken granite miningand quarrying8 .................................. – – – – – – – 28.6
Other crushed and broken stonemining and quarrying8 ...................... – – – – – – – 16.7
Sand, gravel, clay, and ceramic andrefractory minerals mining andquarrying8 ............................................. – – 3.3 – – 4.9 3.3 14.8
Construction sand and gravel mining8 – – 3.8 – – 5.8 – 15.4Kaolin and ball clay mining8 ............... – – – – – – – –Clay and ceramic and refractoryminerals mining8 ............................... – – – – – – – –
See footnotes at end of table.
Page 4
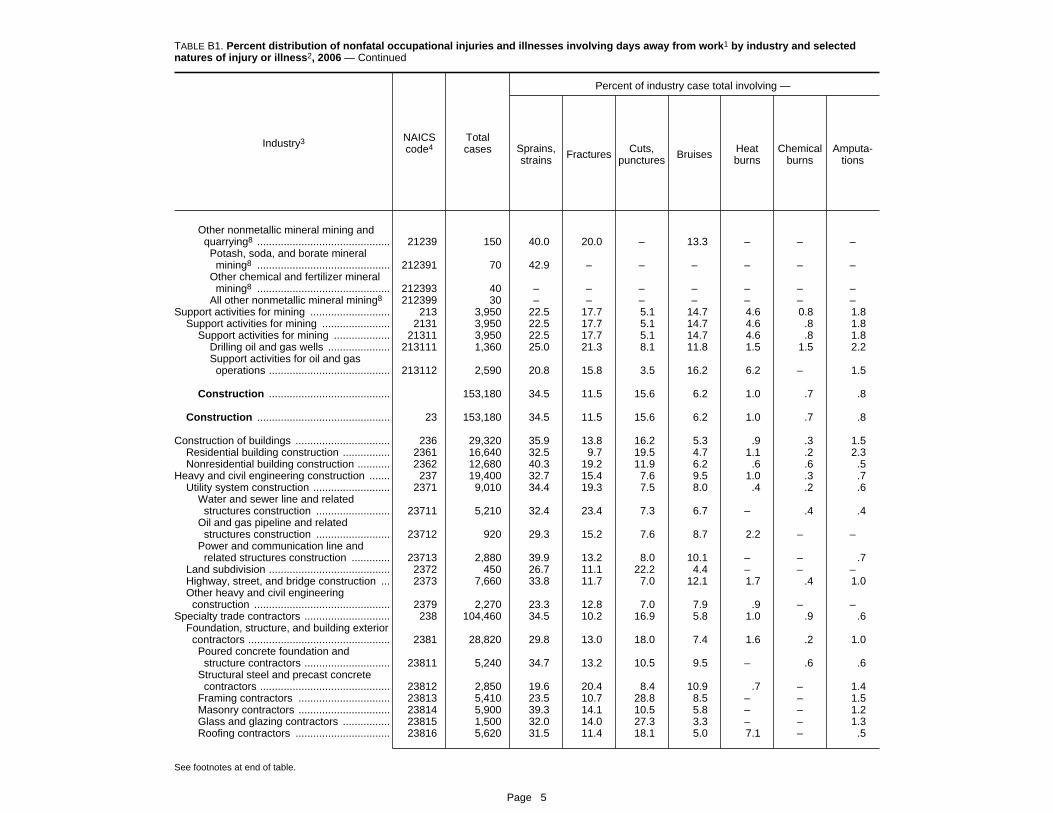
TABLE B1. Percent distribution of nonfatal occupational injuries and illnesses involving days away from work1 by industry and selectednatures of injury or illness2, 2006 — Continued
Industry3 NAICScode4
Totalcases
Percent of industry case total involving —
Sprains,strains Fractures Cuts,
punctures Bruises Heatburns
Chemicalburns
Amputa-tions
Other nonmetallic mineral mining andquarrying8 ............................................. 21239 150 40.0 20.0 – 13.3 – – –Potash, soda, and borate mineral
mining8 ............................................. 212391 70 42.9 – – – – – –Other chemical and fertilizer mineral
mining8 ............................................. 212393 40 – – – – – – –All other nonmetallic mineral mining8 212399 30 – – – – – – –
Support activities for mining ........................... 213 3,950 22.5 17.7 5.1 14.7 4.6 0.8 1.8Support activities for mining ....................... 2131 3,950 22.5 17.7 5.1 14.7 4.6 .8 1.8
Support activities for mining ................... 21311 3,950 22.5 17.7 5.1 14.7 4.6 .8 1.8Drilling oil and gas wells ..................... 213111 1,360 25.0 21.3 8.1 11.8 1.5 1.5 2.2Support activities for oil and gas
operations ......................................... 213112 2,590 20.8 15.8 3.5 16.2 6.2 – 1.5
Construction ......................................... 153,180 34.5 11.5 15.6 6.2 1.0 .7 .8
Construction ............................................. 23 153,180 34.5 11.5 15.6 6.2 1.0 .7 .8
Construction of buildings ................................ 236 29,320 35.9 13.8 16.2 5.3 .9 .3 1.5Residential building construction ................ 2361 16,640 32.5 9.7 19.5 4.7 1.1 .2 2.3Nonresidential building construction ........... 2362 12,680 40.3 19.2 11.9 6.2 .6 .6 .5
Heavy and civil engineering construction ....... 237 19,400 32.7 15.4 7.6 9.5 1.0 .3 .7Utility system construction .......................... 2371 9,010 34.4 19.3 7.5 8.0 .4 .2 .6
Water and sewer line and relatedstructures construction ......................... 23711 5,210 32.4 23.4 7.3 6.7 – .4 .4
Oil and gas pipeline and relatedstructures construction ......................... 23712 920 29.3 15.2 7.6 8.7 2.2 – –
Power and communication line andrelated structures construction ............. 23713 2,880 39.9 13.2 8.0 10.1 – – .7
Land subdivision ......................................... 2372 450 26.7 11.1 22.2 4.4 – – –Highway, street, and bridge construction ... 2373 7,660 33.8 11.7 7.0 12.1 1.7 .4 1.0Other heavy and civil engineering
construction .............................................. 2379 2,270 23.3 12.8 7.0 7.9 .9 – –Specialty trade contractors ............................. 238 104,460 34.5 10.2 16.9 5.8 1.0 .9 .6
Foundation, structure, and building exteriorcontractors ................................................ 2381 28,820 29.8 13.0 18.0 7.4 1.6 .2 1.0Poured concrete foundation and
structure contractors ............................. 23811 5,240 34.7 13.2 10.5 9.5 – .6 .6Structural steel and precast concrete
contractors ............................................ 23812 2,850 19.6 20.4 8.4 10.9 .7 – 1.4Framing contractors ............................... 23813 5,410 23.5 10.7 28.8 8.5 – – 1.5Masonry contractors ............................... 23814 5,900 39.3 14.1 10.5 5.8 – – 1.2Glass and glazing contractors ................ 23815 1,500 32.0 14.0 27.3 3.3 – – 1.3Roofing contractors ................................ 23816 5,620 31.5 11.4 18.1 5.0 7.1 – .5
See footnotes at end of table.
Page 5

TABLE B1. Percent distribution of nonfatal occupational injuries and illnesses involving days away from work1 by industry andselected natures of injury or illness2, 2006 — Continued
Industry3
Percent of industry case total involving —
Carpaltunnel
syndrome
Tendon-itis
Multiple traumatic injuries anddisorders
Back pain and pain,except back
Allother
natures5Total
Withfractures,
burns,and
otherinjuries
Withsprains
andbruises
Total
Backpain,hurt
back only
Other nonmetallic mineral mining andquarrying8 ............................................. – – – – – – – 13.3
Potash, soda, and borate mineralmining8 ............................................. – – – – – – – –
Other chemical and fertilizer mineralmining8 ............................................. – – – – – – – –
All other nonmetallic mineral mining8 – – – – – – – –Support activities for mining ........................... – – 3.8 1.3 1.3 4.6 2.5 24.6
Support activities for mining ....................... – – 3.8 1.3 1.3 4.6 2.5 24.6Support activities for mining ................... – – 3.8 1.3 1.3 4.6 2.5 24.6
Drilling oil and gas wells ..................... – – 7.4 3.7 1.5 2.9 – 18.4Support activities for oil and gasoperations ......................................... – – 1.9 – 1.2 5.4 3.1 27.8
Construction ......................................... 0.6 0.1 3.7 1.1 1.3 7.9 2.6 17.4
Construction ............................................. .6 .1 3.7 1.1 1.3 7.9 2.6 17.4
Construction of buildings ................................ .2 .1 2.5 .5 1.2 5.6 2.0 17.6Residential building construction ................ .3 – 2.3 .3 1.4 7.0 2.5 20.2Nonresidential building construction ........... .2 .2 2.8 .8 .9 3.6 1.4 14.1
Heavy and civil engineering construction ....... .3 – 4.1 1.3 1.6 8.8 2.4 19.6Utility system construction .......................... .3 – 5.3 1.7 2.0 6.7 1.9 17.1
Water and sewer line and relatedstructures construction ......................... – – 4.6 1.5 1.9 6.9 2.3 17.3
Oil and gas pipeline and relatedstructures construction ......................... – – 9.8 2.2 6.5 8.7 – 17.4
Power and communication line andrelated structures construction ............. – – 5.2 1.7 1.0 5.6 1.7 17.0
Land subdivision ......................................... – – – – – 13.3 4.4 20.0Highway, street, and bridge construction ... .3 – 3.4 1.0 1.4 8.2 2.6 20.2Other heavy and civil engineeringconstruction .............................................. – – 2.2 .9 .9 18.1 4.0 27.3
Specialty trade contractors ............................. .7 .2 4.0 1.3 1.3 8.3 2.9 16.9Foundation, structure, and building exteriorcontractors ................................................ .1 .2 4.1 1.4 1.2 6.7 2.3 17.9
Poured concrete foundation andstructure contractors ............................. – – 5.5 2.5 1.0 7.1 3.1 17.9
Structural steel and precast concretecontractors ............................................ – – 4.2 3.2 – 6.3 1.4 28.1
Framing contractors ............................... – – 6.3 1.5 2.0 5.2 .9 15.3Masonry contractors ............................... – – 3.6 .5 1.9 4.6 2.2 20.3Glass and glazing contractors ................ – – 2.0 1.3 – 5.3 2.7 13.3Roofing contractors ................................ – – 3.2 .5 1.1 8.4 1.6 14.8
See footnotes at end of table.
Page 6
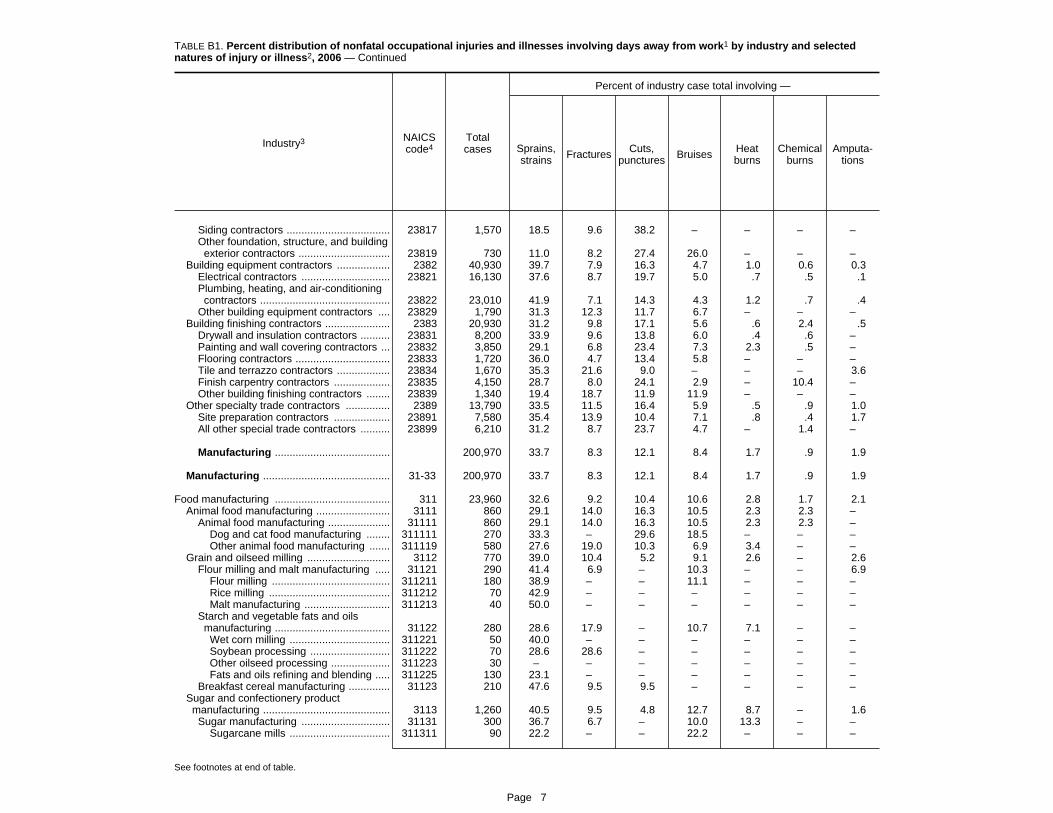
TABLE B1. Percent distribution of nonfatal occupational injuries and illnesses involving days away from work1 by industry and selectednatures of injury or illness2, 2006 — Continued
Industry3 NAICScode4
Totalcases
Percent of industry case total involving —
Sprains,strains Fractures Cuts,
punctures Bruises Heatburns
Chemicalburns
Amputa-tions
Siding contractors ................................... 23817 1,570 18.5 9.6 38.2 – – – –Other foundation, structure, and building
exterior contractors ............................... 23819 730 11.0 8.2 27.4 26.0 – – –Building equipment contractors .................. 2382 40,930 39.7 7.9 16.3 4.7 1.0 0.6 0.3
Electrical contractors .............................. 23821 16,130 37.6 8.7 19.7 5.0 .7 .5 .1Plumbing, heating, and air-conditioning
contractors ............................................ 23822 23,010 41.9 7.1 14.3 4.3 1.2 .7 .4Other building equipment contractors .... 23829 1,790 31.3 12.3 11.7 6.7 – – –
Building finishing contractors ...................... 2383 20,930 31.2 9.8 17.1 5.6 .6 2.4 .5Drywall and insulation contractors .......... 23831 8,200 33.9 9.6 13.8 6.0 .4 .6 –Painting and wall covering contractors ... 23832 3,850 29.1 6.8 23.4 7.3 2.3 .5 –Flooring contractors ................................ 23833 1,720 36.0 4.7 13.4 5.8 – – –Tile and terrazzo contractors .................. 23834 1,670 35.3 21.6 9.0 – – – 3.6Finish carpentry contractors ................... 23835 4,150 28.7 8.0 24.1 2.9 – 10.4 –Other building finishing contractors ........ 23839 1,340 19.4 18.7 11.9 11.9 – – –
Other specialty trade contractors ............... 2389 13,790 33.5 11.5 16.4 5.9 .5 .9 1.0Site preparation contractors ................... 23891 7,580 35.4 13.9 10.4 7.1 .8 .4 1.7All other special trade contractors .......... 23899 6,210 31.2 8.7 23.7 4.7 – 1.4 –
Manufacturing ....................................... 200,970 33.7 8.3 12.1 8.4 1.7 .9 1.9
Manufacturing ........................................... 31-33 200,970 33.7 8.3 12.1 8.4 1.7 .9 1.9
Food manufacturing ....................................... 311 23,960 32.6 9.2 10.4 10.6 2.8 1.7 2.1Animal food manufacturing ......................... 3111 860 29.1 14.0 16.3 10.5 2.3 2.3 –
Animal food manufacturing ..................... 31111 860 29.1 14.0 16.3 10.5 2.3 2.3 –Dog and cat food manufacturing ........ 311111 270 33.3 – 29.6 18.5 – – –Other animal food manufacturing ....... 311119 580 27.6 19.0 10.3 6.9 3.4 – –
Grain and oilseed milling ............................ 3112 770 39.0 10.4 5.2 9.1 2.6 – 2.6Flour milling and malt manufacturing ..... 31121 290 41.4 6.9 – 10.3 – – 6.9
Flour milling ........................................ 311211 180 38.9 – – 11.1 – – –Rice milling ......................................... 311212 70 42.9 – – – – – –Malt manufacturing ............................. 311213 40 50.0 – – – – – –
Starch and vegetable fats and oilsmanufacturing ....................................... 31122 280 28.6 17.9 – 10.7 7.1 – –Wet corn milling .................................. 311221 50 40.0 – – – – – –Soybean processing ........................... 311222 70 28.6 28.6 – – – – –Other oilseed processing .................... 311223 30 – – – – – – –Fats and oils refining and blending ..... 311225 130 23.1 – – – – – –
Breakfast cereal manufacturing .............. 31123 210 47.6 9.5 9.5 – – – –Sugar and confectionery product
manufacturing ........................................... 3113 1,260 40.5 9.5 4.8 12.7 8.7 – 1.6Sugar manufacturing .............................. 31131 300 36.7 6.7 – 10.0 13.3 – –
Sugarcane mills .................................. 311311 90 22.2 – – 22.2 – – –
See footnotes at end of table.
Page 7

TABLE B1. Percent distribution of nonfatal occupational injuries and illnesses involving days away from work1 by industry andselected natures of injury or illness2, 2006 — Continued
Industry3
Percent of industry case total involving —
Carpaltunnel
syndrome
Tendon-itis
Multiple traumatic injuries anddisorders
Back pain and pain,except back
Allother
natures5Total
Withfractures,
burns,and
otherinjuries
Withsprains
andbruises
Total
Backpain,hurt
back only
Siding contractors ................................... – – – – – 14.0 8.3 15.3Other foundation, structure, and buildingexterior contractors ............................... – – 2.7 – – 9.6 – 13.7
Building equipment contractors .................. 1.4 0.2 3.3 1.3 1.1 9.6 3.5 15.0Electrical contractors .............................. .2 – 3.3 1.5 1.2 9.5 4.3 14.7Plumbing, heating, and air-conditioningcontractors ............................................ 2.4 .3 3.3 1.2 1.1 9.1 2.7 15.1
Other building equipment contractors .... – – 2.8 1.7 – 17.9 7.3 16.2Building finishing contractors ...................... .6 .2 4.3 1.1 1.3 8.3 2.5 19.3
Drywall and insulation contractors .......... .4 .2 4.0 .9 1.7 9.0 3.2 22.0Painting and wall covering contractors ... – – 11.7 3.6 1.3 6.5 1.3 12.2Flooring contractors ................................ 1.2 – – – – 14.0 5.8 23.8Tile and terrazzo contractors .................. – – – – – 8.4 2.4 21.0Finish carpentry contractors ................... 1.9 – 2.4 – 1.9 3.9 .7 17.1Other building finishing contractors ........ – – 1.5 – – 14.9 2.2 20.9
Other specialty trade contractors ............... – – 5.1 1.3 1.7 7.9 2.8 17.1Site preparation contractors ................... – – 3.7 1.3 .8 8.4 4.0 18.3All other special trade contractors .......... – – 6.9 1.3 2.9 7.2 1.3 15.6
Manufacturing ....................................... 2.5 .8 3.5 1.0 1.0 7.1 2.3 18.9
Manufacturing ........................................... 2.5 .8 3.5 1.0 1.0 7.1 2.3 18.9
Food manufacturing ....................................... 2.1 .8 4.3 1.2 1.3 6.6 2.3 17.0Animal food manufacturing ......................... 3.5 – 5.8 – – 4.7 – 10.5
Animal food manufacturing ..................... 3.5 – 5.8 – – 4.7 – 10.5Dog and cat food manufacturing ........ – – – – – – – 7.4Other animal food manufacturing ....... 5.2 – 6.9 – – 5.2 – 12.1
Grain and oilseed milling ............................ – – 2.6 – – 10.4 2.6 15.6Flour milling and malt manufacturing ..... – – – – – 6.9 – 17.2
Flour milling ........................................ – – – – – – – 22.2Rice milling ......................................... – – – – – – – –Malt manufacturing ............................. – – – – – – – –
Starch and vegetable fats and oilsmanufacturing ....................................... – – – – – 14.3 – 14.3
Wet corn milling .................................. – – – – – – – –Soybean processing ........................... – – – – – – – –Other oilseed processing .................... – – – – – – – –Fats and oils refining and blending ..... – – – – – 30.8 – 15.4
Breakfast cereal manufacturing .............. – – – – – 9.5 – 14.3Sugar and confectionery productmanufacturing ........................................... 1.6 – 5.6 – 3.2 4.0 1.6 9.5
Sugar manufacturing .............................. – – 6.7 – – 6.7 – 13.3Sugarcane mills .................................. – – 22.2 – – – – –
See footnotes at end of table.
Page 8

TABLE B1. Percent distribution of nonfatal occupational injuries and illnesses involving days away from work1 by industry and selectednatures of injury or illness2, 2006 — Continued
Industry3 NAICScode4
Totalcases
Percent of industry case total involving —
Sprains,strains Fractures Cuts,
punctures Bruises Heatburns
Chemicalburns
Amputa-tions
Cane sugar refining ............................ 311312 50 – – – – – – –Beet sugar manufacturing .................. 311313 160 43.8 – – – 12.5 – –
Chocolate and confectionerymanufacturing from cacao beans ......... 31132 130 38.5 15.4 – – – – –
Confectionery manufacturing frompurchased chocolate ............................ 31133 500 52.0 8.0 4.0 14.0 – – –
Nonchocolate confectionerymanufacturing ....................................... 31134 330 27.3 15.2 – 12.1 15.2 – –
Fruit and vegetable preserving andspecialty food manufacturing .................... 3114 2,590 32.8 7.7 9.3 9.7 3.9 1.9 1.9Frozen food manufacturing .................... 31141 1,110 31.5 8.1 10.8 9.0 2.7 1.8 1.8
Frozen fruit, juice, and vegetablemanufacturing ................................... 311411 520 36.5 7.7 9.6 9.6 3.8 – –
Frozen specialty food manufacturing 311412 600 26.7 8.3 11.7 10.0 3.3 3.3 –Fruit and vegetable canning, pickling,
and drying ............................................. 31142 1,470 34.0 7.5 8.8 10.2 4.8 2.0 1.4Fruit and vegetable canning ............... 311421 1,080 32.4 7.4 9.3 11.1 4.6 1.9 –Dried and dehydrated food
manufacturing ................................... 311423 270 37.0 7.4 7.4 7.4 – – –Dairy product manufacturing ...................... 3115 3,190 45.1 8.2 5.0 8.8 2.2 2.8 .6
Dairy product (except frozen)manufacturing ....................................... 31151 2,880 45.5 8.0 5.2 9.0 2.4 3.1 .7Fluid milk manufacturing .................... 311511 1,870 48.7 8.6 4.8 9.6 1.6 2.1 –Cheese manufacturing ....................... 311513 750 41.3 8.0 5.3 8.0 2.7 5.3 –Dry, condensed, and evaporated
dairy product manufacturing ............. 311514 230 39.1 8.7 – – – – –Ice cream and frozen dessert
manufacturing ....................................... 31152 300 43.3 6.7 – 6.7 – – –Animal slaughtering and processing .......... 3116 6,950 23.0 9.2 15.1 11.7 1.7 2.0 3.0
Animal slaughtering and processing ...... 31161 6,950 23.0 9.2 15.1 11.7 1.7 2.0 3.0Animal (except poultry) slaughtering .. 311611 2,190 19.6 6.8 16.0 7.3 1.4 1.4 3.2Meat processed from carcasses ........ 311612 2,470 23.9 8.5 18.6 15.8 1.2 2.0 3.2Rendering and meat byproduct
processing ........................................ 311613 340 29.4 8.8 8.8 11.8 11.8 – –Poultry processing .............................. 311615 1,950 24.1 13.3 10.8 11.3 1.0 2.6 3.1
Seafood product preparation andpackaging ................................................. 3117 1,180 33.1 5.1 11.9 14.4 1.7 – –Seafood product preparation and
packaging ............................................. 31171 1,180 33.1 5.1 11.9 14.4 1.7 – –Seafood canning ................................ 311711 160 31.2 – 12.5 18.8 – – –Fresh and frozen seafood processing 311712 1,020 33.3 4.9 11.8 13.7 – – –
Bakeries and tortilla manufacturing ............ 3118 4,580 35.6 10.5 9.6 10.3 1.5 .4 2.2Bread and bakery product
manufacturing ....................................... 31181 3,360 36.9 8.0 10.1 10.7 1.5 – 1.8
See footnotes at end of table.
Page 9

TABLE B1. Percent distribution of nonfatal occupational injuries and illnesses involving days away from work1 by industry andselected natures of injury or illness2, 2006 — Continued
Industry3
Percent of industry case total involving —
Carpaltunnel
syndrome
Tendon-itis
Multiple traumatic injuries anddisorders
Back pain and pain,except back
Allother
natures5Total
Withfractures,
burns,and
otherinjuries
Withsprains
andbruises
Total
Backpain,hurt
back only
Cane sugar refining ............................ – – – – – – – –Beet sugar manufacturing .................. – – – – – – – 12.5
Chocolate and confectionerymanufacturing from cacao beans ......... – – – – – – – 15.4
Confectionery manufacturing frompurchased chocolate ............................ – – 8.0 – 4.0 – – 8.0
Nonchocolate confectionerymanufacturing ....................................... – – – – – 6.1 6.1 9.1
Fruit and vegetable preserving andspecialty food manufacturing .................... 0.8 – 4.6 1.2 1.2 7.3 2.3 18.9
Frozen food manufacturing .................... – – 6.3 – 1.8 8.1 2.7 17.1Frozen fruit, juice, and vegetablemanufacturing ................................... – – 5.8 – – 5.8 – 17.3
Frozen specialty food manufacturing – – 5.0 – – 11.7 3.3 16.7Fruit and vegetable canning, pickling,and drying ............................................. – – 3.4 1.4 – 6.8 2.7 20.4
Fruit and vegetable canning ............... – – 3.7 1.9 – 6.5 2.8 19.4Dried and dehydrated foodmanufacturing ................................... – – – – – 7.4 – 25.9
Dairy product manufacturing ...................... 1.6 0.6 3.8 .6 1.3 4.7 1.6 16.9Dairy product (except frozen)manufacturing ....................................... 1.7 .7 3.8 .7 1.4 4.2 1.4 15.6
Fluid milk manufacturing .................... 1.1 – 3.2 – 1.6 4.8 1.1 15.0Cheese manufacturing ....................... 2.7 – 5.3 – – 4.0 2.7 16.0Dry, condensed, and evaporateddairy product manufacturing ............. – – – – – – – 21.7
Ice cream and frozen dessertmanufacturing ....................................... – – – – – 10.0 – 26.7
Animal slaughtering and processing .......... 2.3 1.4 3.9 1.3 1.2 7.6 2.0 19.1Animal slaughtering and processing ...... 2.3 1.4 3.9 1.3 1.2 7.6 2.0 19.1
Animal (except poultry) slaughtering .. 2.3 1.8 5.0 1.8 1.4 10.5 2.7 24.2Meat processed from carcasses ........ 1.2 1.2 2.8 .8 1.2 6.5 1.2 15.0Rendering and meat byproductprocessing ........................................ – – – – – – – 20.6
Poultry processing .............................. 3.6 1.5 4.1 1.5 1.0 6.2 2.1 18.5Seafood product preparation andpackaging ................................................. 2.5 1.7 4.2 – – 5.1 1.7 18.6
Seafood product preparation andpackaging ............................................. 2.5 1.7 4.2 – – 5.1 1.7 18.6
Seafood canning ................................ – – – – – – – 25.0Fresh and frozen seafood processing 2.9 2.0 3.9 – – 4.9 – 18.6
Bakeries and tortilla manufacturing ............ 3.3 .4 4.1 1.1 1.7 7.6 4.1 14.6Bread and bakery productmanufacturing ....................................... 3.9 – 3.3 .6 1.5 8.9 5.1 13.7
See footnotes at end of table.
Page 10

TABLE B1. Percent distribution of nonfatal occupational injuries and illnesses involving days away from work1 by industry and selectednatures of injury or illness2, 2006 — Continued
Industry3 NAICScode4
Totalcases
Percent of industry case total involving —
Sprains,strains Fractures Cuts,
punctures Bruises Heatburns
Chemicalburns
Amputa-tions
Retail bakeries .................................... 311811 360 44.4 – 25.0 11.1 – – –Commercial bakeries .......................... 311812 2,880 35.8 9.0 8.3 11.1 1.4 – 1.7
Cookie, cracker, and pastamanufacturing ....................................... 31182 910 36.3 9.9 7.7 9.9 – – 5.5Cookie and cracker manufacturing ..... 311821 480 35.4 10.4 4.2 10.4 – – 6.2Flour mixes and dough manufacturing
from purchased flour ........................ 311822 300 33.3 10.0 10.0 6.7 – – 6.7Dry pasta manufacturing .................... 311823 130 38.5 – 15.4 – – – –
Tortilla manufacturing ............................. 31183 320 18.8 37.5 9.4 6.2 – – –Other food manufacturing ........................... 3119 2,590 32.0 9.3 8.5 10.0 4.6 1.5 1.9
Snack food manufacturing ...................... 31191 640 34.4 10.9 10.9 9.4 – – 3.1Roasted nuts and peanut butter
manufacturing ................................... 311911 130 30.8 23.1 – – – – –Other snack food manufacturing ........ 311919 520 34.6 7.7 11.5 9.6 – – 3.8
Coffee and tea manufacturing ................ 31192 220 50.0 13.6 – – – – –Flavoring syrup and concentrate
manufacturing ....................................... 31193 150 26.7 – – – – – –Seasoning and dressing manufacturing 31194 450 31.1 6.7 6.7 8.9 11.1 – 4.4
Mayonnaise, dressing, and otherprepared sauce manufacturing ......... 311941 260 30.8 7.7 7.7 – 15.4 – –
Spice and extract manufacturing ........ 311942 190 31.6 – – 15.8 – – –All other food manufacturing .................. 31199 1,120 28.6 9.8 9.8 12.5 3.6 1.8 –
Perishable prepared foodmanufacturing ................................... 311991 700 28.6 7.1 10.0 15.7 2.9 – –
All other miscellaneous foodmanufacturing ................................... 311999 430 27.9 14.0 9.3 7.0 – – –
Beverage and tobacco product manufacturing 312 4,350 51.7 5.5 6.4 11.0 1.1 .5 .5Beverage manufacturing ............................ 3121 4,070 52.3 5.4 5.9 11.1 1.2 .5 –
Soft drink and ice manufacturing ............ 31211 3,240 54.6 5.2 4.0 10.8 .9 .6 –Soft drink manufacturing .................... 312111 2,690 56.1 5.6 3.3 11.5 1.1 – –Bottled water manufacturing ............... 312112 420 52.4 – 7.1 7.1 – – –Ice manufacturing ............................... 312113 130 30.8 – 15.4 15.4 – – –
Breweries ............................................... 31212 270 40.7 7.4 18.5 18.5 – – –Wineries ................................................. 31213 460 47.8 4.3 8.7 8.7 – – –Distilleries ............................................... 31214 90 33.3 – 22.2 – – – –
Tobacco manufacturing .............................. 3122 280 42.9 7.1 17.9 7.1 – – –Tobacco product manufacturing ............. 31222 240 45.8 8.3 16.7 8.3 – – –
Cigarette manufacturing ..................... 312221 170 47.1 – 17.6 – – – –Other tobacco product manufacturing 312229 70 42.9 – – – – – –
Textile mills ..................................................... 313 1,720 34.9 9.3 10.5 8.7 1.7 – 1.2Fiber, yarn, and thread mills ....................... 3131 250 24.0 8.0 8.0 8.0 – – –
Fiber, yarn, and thread mills ................... 31311 250 24.0 8.0 8.0 8.0 – – –Yarn spinning mills ............................. 313111 160 31.2 – – 12.5 – – –
See footnotes at end of table.
Page 11

TABLE B1. Percent distribution of nonfatal occupational injuries and illnesses involving days away from work1 by industry andselected natures of injury or illness2, 2006 — Continued
Industry3
Percent of industry case total involving —
Carpaltunnel
syndrome
Tendon-itis
Multiple traumatic injuries anddisorders
Back pain and pain,except back
Allother
natures5Total
Withfractures,
burns,and
otherinjuries
Withsprains
andbruises
Total
Backpain,hurt
back only
Retail bakeries .................................... – – – – – 8.3 – 5.6Commercial bakeries .......................... 4.5 – 3.8 0.7 1.7 9.4 5.9 14.9
Cookie, cracker, and pastamanufacturing ....................................... 2.2 – 7.7 3.3 2.2 3.3 – 16.5
Cookie and cracker manufacturing ..... – – 6.2 – – 4.2 – 20.8Flour mixes and dough manufacturingfrom purchased flour ........................ – – – – – – – 16.7
Dry pasta manufacturing .................... – – 23.1 15.4 – – – –Tortilla manufacturing ............................. – – – – – 6.2 6.2 15.6
Other food manufacturing ........................... .8 0.8 5.8 1.9 1.2 5.8 1.5 18.9Snack food manufacturing ...................... – – 9.4 – – – – 17.2
Roasted nuts and peanut buttermanufacturing ................................... – – – – – – – 15.4
Other snack food manufacturing ........ – – 9.6 – – – – 17.3Coffee and tea manufacturing ................ – – – – – – – 13.6Flavoring syrup and concentratemanufacturing ....................................... – – – – – 20.0 – 13.3
Seasoning and dressing manufacturing – – 6.7 4.4 – 4.4 – 17.8Mayonnaise, dressing, and otherprepared sauce manufacturing ......... – – – – – – – 15.4
Spice and extract manufacturing ........ – – – – – 10.5 – 21.1All other food manufacturing .................. – – 3.6 – – 7.1 3.6 22.3
Perishable prepared foodmanufacturing ................................... – – – – – 8.6 – 21.4
All other miscellaneous foodmanufacturing ................................... – – 7.0 – – 4.7 4.7 23.3
Beverage and tobacco product manufacturing .5 – 3.9 .7 2.1 5.3 1.6 13.3Beverage manufacturing ............................ .5 – 3.9 .7 2.0 5.4 1.7 13.5
Soft drink and ice manufacturing ............ – – 3.7 – 2.2 5.9 1.9 13.0Soft drink manufacturing .................... – – 3.7 – 2.2 5.2 1.5 12.3Bottled water manufacturing ............... – – – – – 7.1 – 19.0Ice manufacturing ............................... – – – – – 15.4 – 15.4
Breweries ............................................... – – – – – – – 7.4Wineries ................................................. – – 6.5 – – – – 21.7Distilleries ............................................... – – – – – – – –
Tobacco manufacturing .............................. – – – – – 7.1 – 10.7Tobacco product manufacturing ............. – – – – – – – 8.3
Cigarette manufacturing ..................... – – – – – – – 11.8Other tobacco product manufacturing – – – – – – – –
Textile mills ..................................................... 1.7 – 2.3 – – 9.9 2.3 18.0Fiber, yarn, and thread mills ....................... – – – – – 16.0 – 20.0
Fiber, yarn, and thread mills ................... – – – – – 16.0 – 20.0Yarn spinning mills ............................. – – – – – 12.5 – 18.8
See footnotes at end of table.
Page 12

TABLE B1. Percent distribution of nonfatal occupational injuries and illnesses involving days away from work1 by industry and selectednatures of injury or illness2, 2006 — Continued
Industry3 NAICScode4
Totalcases
Percent of industry case total involving —
Sprains,strains Fractures Cuts,
punctures Bruises Heatburns
Chemicalburns
Amputa-tions
Yarn texturizing, throwing, andtwisting mills ..................................... 313112 50 – – – – – – –
Thread mills ........................................ 313113 30 – – – – – – –Fabric mills ................................................. 3132 780 33.3 11.5 11.5 10.3 – – –
Broadwoven fabric mills ......................... 31321 330 27.3 9.1 12.1 6.1 – – –Narrow fabric mills and schiffli machine
embroidery ........................................... 31322 170 29.4 11.8 11.8 17.6 – – –Narrow fabric mills .............................. 313221 160 31.2 12.5 12.5 18.8 – – –
Nonwoven fabric mills ............................ 31323 160 37.5 12.5 12.5 – – – –Knit fabric mills ....................................... 31324 130 38.5 – – 15.4 – – –
Weft knit fabric mills ........................... 313241 60 50.0 – – – – – –Other knit fabric and lace mills ........... 313249 70 28.6 – – – – – –
Textile and fabric finishing and fabriccoating mills .............................................. 3133 690 39.1 7.2 10.1 7.2 2.9 – –Textile and fabric finishing mills .............. 31331 490 36.7 4.1 12.2 8.2 – – –
Broadwoven fabric finishing mills ....... 313311 210 38.1 – 9.5 14.3 – – –Textile and fabric finishing (except
broadwoven fabric) mills ................... 313312 280 35.7 7.1 17.9 – – – –Fabric coating mills ................................. 31332 200 50.0 15.0 – – – – –
Textile product mills ........................................ 314 1,400 30.0 10.7 15.0 7.9 – – 2.1Textile furnishings mills .............................. 3141 680 33.8 13.2 13.2 5.9 – – 2.9
Carpet and rug mills ............................... 31411 350 25.7 20.0 11.4 5.7 – – –Curtain and linen mills ............................ 31412 330 42.4 6.1 15.2 6.1 – – –
Curtain and drapery mills ................... 314121 130 46.2 – – 15.4 – – –Other household textile product mills 314129 210 38.1 9.5 19.0 – – – –
Other textile product mills ........................... 3149 720 26.4 8.3 16.7 8.3 – – –Textile bag and canvas mills .................. 31491 400 30.0 5.0 15.0 10.0 – – –
Textile bag mills .................................. 314911 110 18.2 – 18.2 27.3 – – –Canvas and related product mills ....... 314912 290 34.5 – 13.8 – – – –
All other textile product mills ................... 31499 320 18.8 12.5 18.8 6.2 – – –Rope, cordage, and twine mills .......... 314991 40 – – – – – – –Tire cord and tire fabric mills .............. 314992 30 – – – – – – –All other miscellaneous textile product
mills .................................................. 314999 240 20.8 8.3 20.8 – – – –Apparel manufacturing ................................... 315 1,500 30.0 5.3 13.3 8.0 1.3 – –
Apparel knitting mills .................................. 3151 170 23.5 – – – – – –Hosiery and sock mills ............................ 31511 120 25.0 – – – – – –
Sheer hosiery mills ............................. 315111 20 – – – – – – –Other hosiery and sock mills .............. 315119 110 27.3 – – – – – –Outerwear knitting mills ...................... 315191 50 – – – – – – –
Cut and sew apparel manufacturing ........... 3152 1,080 32.4 3.7 13.9 9.3 1.9 – –Men’s and boys’ cut and sew apparel
contractors ........................................ 315211 130 30.8 – – – – – –
See footnotes at end of table.
Page 13
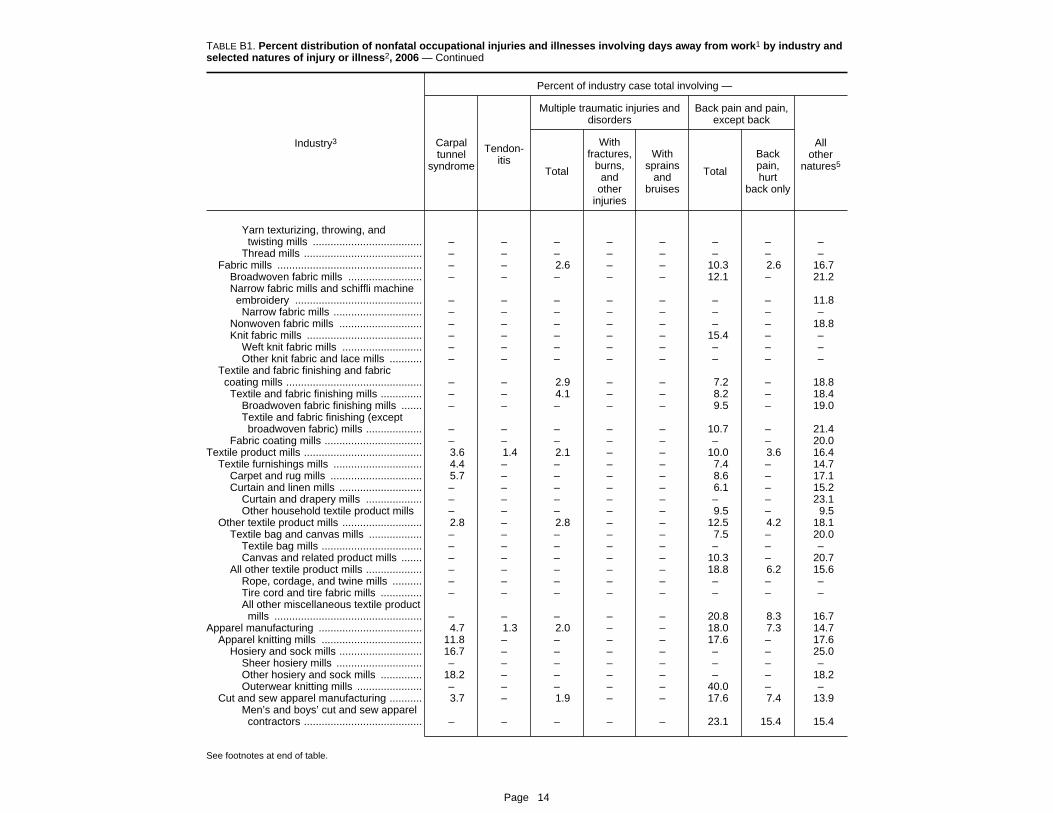
TABLE B1. Percent distribution of nonfatal occupational injuries and illnesses involving days away from work1 by industry andselected natures of injury or illness2, 2006 — Continued
Industry3
Percent of industry case total involving —
Carpaltunnel
syndrome
Tendon-itis
Multiple traumatic injuries anddisorders
Back pain and pain,except back
Allother
natures5Total
Withfractures,
burns,and
otherinjuries
Withsprains
andbruises
Total
Backpain,hurt
back only
Yarn texturizing, throwing, andtwisting mills ..................................... – – – – – – – –
Thread mills ........................................ – – – – – – – –Fabric mills ................................................. – – 2.6 – – 10.3 2.6 16.7
Broadwoven fabric mills ......................... – – – – – 12.1 – 21.2Narrow fabric mills and schiffli machineembroidery ........................................... – – – – – – – 11.8
Narrow fabric mills .............................. – – – – – – – –Nonwoven fabric mills ............................ – – – – – – – 18.8Knit fabric mills ....................................... – – – – – 15.4 – –
Weft knit fabric mills ........................... – – – – – – – –Other knit fabric and lace mills ........... – – – – – – – –
Textile and fabric finishing and fabriccoating mills .............................................. – – 2.9 – – 7.2 – 18.8
Textile and fabric finishing mills .............. – – 4.1 – – 8.2 – 18.4Broadwoven fabric finishing mills ....... – – – – – 9.5 – 19.0Textile and fabric finishing (exceptbroadwoven fabric) mills ................... – – – – – 10.7 – 21.4
Fabric coating mills ................................. – – – – – – – 20.0Textile product mills ........................................ 3.6 1.4 2.1 – – 10.0 3.6 16.4
Textile furnishings mills .............................. 4.4 – – – – 7.4 – 14.7Carpet and rug mills ............................... 5.7 – – – – 8.6 – 17.1Curtain and linen mills ............................ – – – – – 6.1 – 15.2
Curtain and drapery mills ................... – – – – – – – 23.1Other household textile product mills – – – – – 9.5 – 9.5
Other textile product mills ........................... 2.8 – 2.8 – – 12.5 4.2 18.1Textile bag and canvas mills .................. – – – – – 7.5 – 20.0
Textile bag mills .................................. – – – – – – – –Canvas and related product mills ....... – – – – – 10.3 – 20.7
All other textile product mills ................... – – – – – 18.8 6.2 15.6Rope, cordage, and twine mills .......... – – – – – – – –Tire cord and tire fabric mills .............. – – – – – – – –All other miscellaneous textile productmills .................................................. – – – – – 20.8 8.3 16.7
Apparel manufacturing ................................... 4.7 1.3 2.0 – – 18.0 7.3 14.7Apparel knitting mills .................................. 11.8 – – – – 17.6 – 17.6
Hosiery and sock mills ............................ 16.7 – – – – – – 25.0Sheer hosiery mills ............................. – – – – – – – –Other hosiery and sock mills .............. 18.2 – – – – – – 18.2Outerwear knitting mills ...................... – – – – – 40.0 – –
Cut and sew apparel manufacturing ........... 3.7 – 1.9 – – 17.6 7.4 13.9Men’s and boys’ cut and sew apparelcontractors ........................................ – – – – – 23.1 15.4 15.4
See footnotes at end of table.
Page 14

TABLE B1. Percent distribution of nonfatal occupational injuries and illnesses involving days away from work1 by industry and selectednatures of injury or illness2, 2006 — Continued
Industry3 NAICScode4
Totalcases
Percent of industry case total involving —
Sprains,strains Fractures Cuts,
punctures Bruises Heatburns
Chemicalburns
Amputa-tions
Men’s and boys’ cut and sew apparelmanufacturing ....................................... 31522 420 28.6 7.1 11.9 11.9 – – –Men’s and boys’ cut and sew suit,
coat, and overcoat manufacturing .... 315222 110 45.5 – – – – – –Men’s and boys’ cut and sew shirt
(except work shirt) manufacturing .... 315223 100 20.0 – – 30.0 – – –Men’s and boys’ cut and sew trouser,
slack, and jean manufacturing .......... 315224 40 – – – – – – –Men’s and boys’ cut and sew work
clothing manufacturing ..................... 315225 120 16.7 – 16.7 – – – –Men’s and boys’ cut and sew other
outerwear manufacturing .................. 315228 40 – – – – – – –Women’s and girls’ cut and sew apparel
manufacturing ....................................... 31523 130 46.2 – – 15.4 – – –Women’s and girls’ cut and sew dress
manufacturing ................................... 315233 20 – – – – – – –Women’s and girls’ cut and sew suit,
coat, tailored jacket, and skirtmanufacturing ................................... 315234 20 – – – – – – –
Women’s and girls’ cut and sew otherouterwear manufacturing .................. 315239 70 57.1 – – 28.6 – – –
Other cut and sew apparelmanufacturing ....................................... 31529 100 30.0 – 20.0 – – – –All other cut and sew apparel
manufacturing ................................... 315299 90 33.3 – – – – – –Apparel accessories and other apparel
manufacturing ........................................... 3159 250 24.0 8.0 16.0 – – – –Apparel accessories and other apparel
manufacturing ....................................... 31599 250 24.0 8.0 16.0 – – – –Hat, cap, and millinery manufacturing 315991 40 – – – – – – –Glove and mitten manufacturing ........ 315992 90 33.3 – 22.2 – – – –Other apparel accessories and other
apparel manufacturing ...................... 315999 100 20.0 – – – – – –Leather and allied product manufacturing ...... 316 410 19.5 4.9 22.0 7.3 – – –
Leather and hide tanning and finishing ...... 3161 100 20.0 – 30.0 – – – –Footwear manufacturing ............................. 3162 170 23.5 – 17.6 11.8 – – –
Footwear manufacturing ......................... 31621 170 23.5 – 17.6 11.8 – – –Men’s footwear (except athletic)
manufacturing ................................... 316213 90 22.2 – 22.2 – – – –Women’s footwear (except athletic)
manufacturing ................................... 316214 30 – – – – – – –Other footwear manufacturing ............ 316219 40 – – – – – – –
Other leather and allied productmanufacturing ........................................... 3169 140 14.3 – 28.6 – – – –
See footnotes at end of table.
Page 15

TABLE B1. Percent distribution of nonfatal occupational injuries and illnesses involving days away from work1 by industry andselected natures of injury or illness2, 2006 — Continued
Industry3
Percent of industry case total involving —
Carpaltunnel
syndrome
Tendon-itis
Multiple traumatic injuries anddisorders
Back pain and pain,except back
Allother
natures5Total
Withfractures,
burns,and
otherinjuries
Withsprains
andbruises
Total
Backpain,hurt
back only
Men’s and boys’ cut and sew apparelmanufacturing ....................................... 4.8 – – – – 14.3 7.1 14.3
Men’s and boys’ cut and sew suit,coat, and overcoat manufacturing .... – – – – – 18.2 – –
Men’s and boys’ cut and sew shirt(except work shirt) manufacturing .... – – – – – 20.0 – 20.0
Men’s and boys’ cut and sew trouser,slack, and jean manufacturing .......... – – – – – – – –
Men’s and boys’ cut and sew workclothing manufacturing ..................... – – – – – – – 25.0
Men’s and boys’ cut and sew otherouterwear manufacturing .................. – – – – – – – –
Women’s and girls’ cut and sew apparelmanufacturing ....................................... – – – – – – – 23.1
Women’s and girls’ cut and sew dressmanufacturing ................................... – – – – – – – –
Women’s and girls’ cut and sew suit,coat, tailored jacket, and skirtmanufacturing ................................... – – – – – – – –
Women’s and girls’ cut and sew otherouterwear manufacturing .................. – – – – – – – –
Other cut and sew apparelmanufacturing ....................................... – – – – – – – 20.0
All other cut and sew apparelmanufacturing ................................... – – – – – – – –
Apparel accessories and other apparelmanufacturing ........................................... – – – – – 20.0 8.0 16.0
Apparel accessories and other apparelmanufacturing ....................................... – – – – – 20.0 8.0 16.0
Hat, cap, and millinery manufacturing – – – – – – – –Glove and mitten manufacturing ........ – – – – – 33.3 – –Other apparel accessories and otherapparel manufacturing ...................... – – – – – 20.0 – –
Leather and allied product manufacturing ...... 7.3 – 7.3 – – 9.8 – 17.1Leather and hide tanning and finishing ...... – – 20.0 – – – – –Footwear manufacturing ............................. 11.8 – – – – – – 17.6
Footwear manufacturing ......................... 11.8 – – – – – – 17.6Men’s footwear (except athletic)manufacturing ................................... – – – – – – – 22.2
Women’s footwear (except athletic)manufacturing ................................... – – – – – – – –
Other footwear manufacturing ............ – – – – – – – –Other leather and allied productmanufacturing ........................................... – – – – – 14.3 – 14.3
See footnotes at end of table.
Page 16
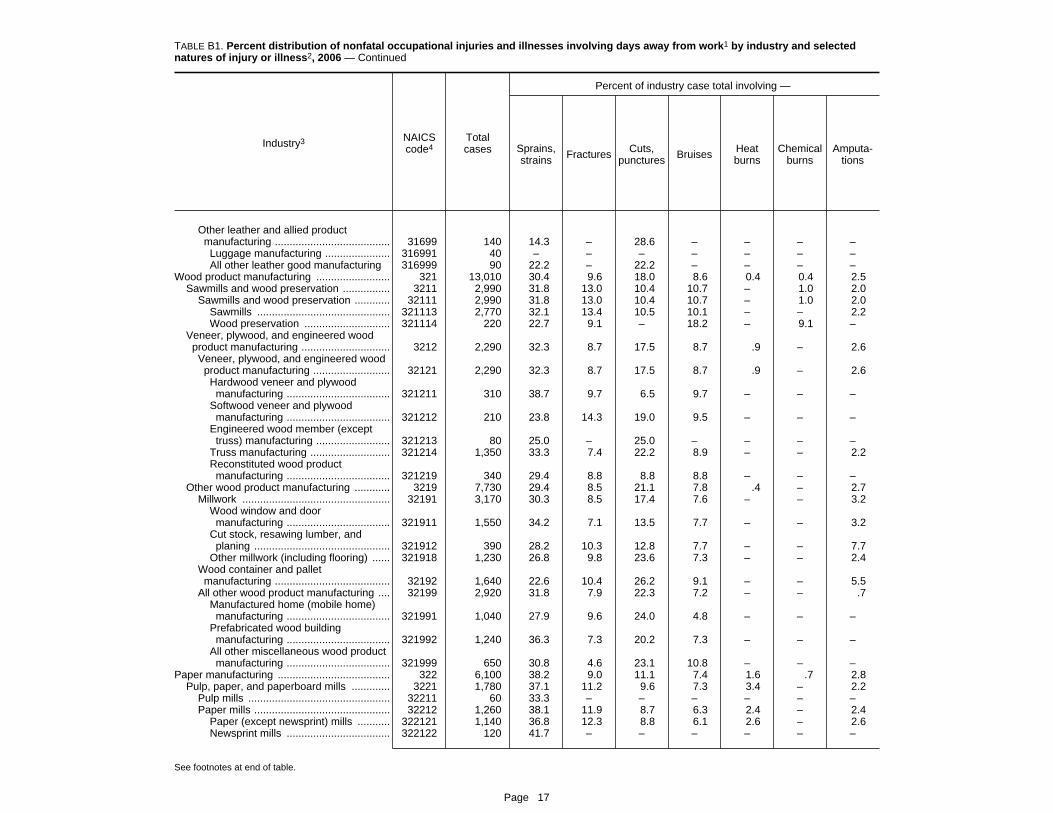
TABLE B1. Percent distribution of nonfatal occupational injuries and illnesses involving days away from work1 by industry and selectednatures of injury or illness2, 2006 — Continued
Industry3 NAICScode4
Totalcases
Percent of industry case total involving —
Sprains,strains Fractures Cuts,
punctures Bruises Heatburns
Chemicalburns
Amputa-tions
Other leather and allied productmanufacturing ....................................... 31699 140 14.3 – 28.6 – – – –Luggage manufacturing ...................... 316991 40 – – – – – – –All other leather good manufacturing 316999 90 22.2 – 22.2 – – – –
Wood product manufacturing ......................... 321 13,010 30.4 9.6 18.0 8.6 0.4 0.4 2.5Sawmills and wood preservation ................ 3211 2,990 31.8 13.0 10.4 10.7 – 1.0 2.0
Sawmills and wood preservation ............ 32111 2,990 31.8 13.0 10.4 10.7 – 1.0 2.0Sawmills ............................................. 321113 2,770 32.1 13.4 10.5 10.1 – – 2.2Wood preservation ............................. 321114 220 22.7 9.1 – 18.2 – 9.1 –
Veneer, plywood, and engineered woodproduct manufacturing .............................. 3212 2,290 32.3 8.7 17.5 8.7 .9 – 2.6Veneer, plywood, and engineered wood
product manufacturing .......................... 32121 2,290 32.3 8.7 17.5 8.7 .9 – 2.6Hardwood veneer and plywood
manufacturing ................................... 321211 310 38.7 9.7 6.5 9.7 – – –Softwood veneer and plywood
manufacturing ................................... 321212 210 23.8 14.3 19.0 9.5 – – –Engineered wood member (except
truss) manufacturing ......................... 321213 80 25.0 – 25.0 – – – –Truss manufacturing ........................... 321214 1,350 33.3 7.4 22.2 8.9 – – 2.2Reconstituted wood product
manufacturing ................................... 321219 340 29.4 8.8 8.8 8.8 – – –Other wood product manufacturing ............ 3219 7,730 29.4 8.5 21.1 7.8 .4 – 2.7
Millwork .................................................. 32191 3,170 30.3 8.5 17.4 7.6 – – 3.2Wood window and door
manufacturing ................................... 321911 1,550 34.2 7.1 13.5 7.7 – – 3.2Cut stock, resawing lumber, and
planing .............................................. 321912 390 28.2 10.3 12.8 7.7 – – 7.7Other millwork (including flooring) ...... 321918 1,230 26.8 9.8 23.6 7.3 – – 2.4
Wood container and palletmanufacturing ....................................... 32192 1,640 22.6 10.4 26.2 9.1 – – 5.5
All other wood product manufacturing .... 32199 2,920 31.8 7.9 22.3 7.2 – – .7Manufactured home (mobile home)
manufacturing ................................... 321991 1,040 27.9 9.6 24.0 4.8 – – –Prefabricated wood building
manufacturing ................................... 321992 1,240 36.3 7.3 20.2 7.3 – – –All other miscellaneous wood product
manufacturing ................................... 321999 650 30.8 4.6 23.1 10.8 – – –Paper manufacturing ...................................... 322 6,100 38.2 9.0 11.1 7.4 1.6 .7 2.8
Pulp, paper, and paperboard mills ............. 3221 1,780 37.1 11.2 9.6 7.3 3.4 – 2.2Pulp mills ................................................ 32211 60 33.3 – – – – – –Paper mills .............................................. 32212 1,260 38.1 11.9 8.7 6.3 2.4 – 2.4
Paper (except newsprint) mills ........... 322121 1,140 36.8 12.3 8.8 6.1 2.6 – 2.6Newsprint mills ................................... 322122 120 41.7 – – – – – –
See footnotes at end of table.
Page 17

TABLE B1. Percent distribution of nonfatal occupational injuries and illnesses involving days away from work1 by industry andselected natures of injury or illness2, 2006 — Continued
Industry3
Percent of industry case total involving —
Carpaltunnel
syndrome
Tendon-itis
Multiple traumatic injuries anddisorders
Back pain and pain,except back
Allother
natures5Total
Withfractures,
burns,and
otherinjuries
Withsprains
andbruises
Total
Backpain,hurt
back only
Other leather and allied productmanufacturing ....................................... – – – – – 14.3 – 14.3
Luggage manufacturing ...................... – – – – – – – –All other leather good manufacturing – – – – – – – –
Wood product manufacturing ......................... 1.5 0.3 3.5 1.3 0.8 6.3 2.2 18.4Sawmills and wood preservation ................ .7 – 3.3 1.7 .7 5.7 1.7 21.1
Sawmills and wood preservation ............ .7 – 3.3 1.7 .7 5.7 1.7 21.1Sawmills ............................................. .7 – 3.2 1.8 .7 5.4 1.4 21.7Wood preservation ............................. – – – – – 9.1 – 13.6
Veneer, plywood, and engineered woodproduct manufacturing .............................. 1.3 – 3.1 1.3 .9 6.1 2.2 17.5
Veneer, plywood, and engineered woodproduct manufacturing .......................... 1.3 – 3.1 1.3 .9 6.1 2.2 17.5
Hardwood veneer and plywoodmanufacturing ................................... 6.5 – – – – 6.5 – 16.1
Softwood veneer and plywoodmanufacturing ................................... – – – – – 9.5 – 19.0
Engineered wood member (excepttruss) manufacturing ......................... – – – – – – – 25.0
Truss manufacturing ........................... – – 4.4 1.5 – 6.7 2.2 14.1Reconstituted wood productmanufacturing ................................... – – – – – – – 32.4
Other wood product manufacturing ............ 1.8 .3 3.6 1.2 .8 6.6 2.3 17.9Millwork .................................................. 2.2 .6 4.4 1.9 .6 5.0 2.5 20.5
Wood window and doormanufacturing ................................... 2.6 – 1.9 – – 5.2 2.6 21.9
Cut stock, resawing lumber, andplaning .............................................. – – – – – 5.1 – 25.6
Other millwork (including flooring) ...... 1.6 – 7.3 4.1 1.6 4.9 1.6 16.3Wood container and palletmanufacturing ....................................... 1.2 – 3.0 – – 5.5 – 15.9
All other wood product manufacturing .... 2.1 – 3.1 1.0 1.0 8.6 3.1 15.8Manufactured home (mobile home)manufacturing ................................... 1.9 – 2.9 – – 10.6 1.9 16.3
Prefabricated wood buildingmanufacturing ................................... 1.6 – 2.4 – – 4.0 3.2 18.5
All other miscellaneous wood productmanufacturing ................................... 3.1 – 4.6 – – 12.3 4.6 10.8
Paper manufacturing ...................................... 1.8 1.0 4.3 1.0 1.3 6.2 2.5 15.9Pulp, paper, and paperboard mills ............. 1.1 – 4.5 1.7 1.7 6.7 2.8 15.2
Pulp mills ................................................ – – – – – – – –Paper mills .............................................. 1.6 – 4.8 1.6 1.6 7.9 4.0 15.9
Paper (except newsprint) mills ........... – – 5.3 1.8 1.8 7.9 4.4 15.8Newsprint mills ................................... – – – – – – – 16.7
See footnotes at end of table.
Page 18

TABLE B1. Percent distribution of nonfatal occupational injuries and illnesses involving days away from work1 by industry and selectednatures of injury or illness2, 2006 — Continued
Industry3 NAICScode4
Totalcases
Percent of industry case total involving —
Sprains,strains Fractures Cuts,
punctures Bruises Heatburns
Chemicalburns
Amputa-tions
Paperboard mills .................................... 32213 460 34.8 10.9 13.0 8.7 4.3 – –Converted paper product manufacturing .... 3222 4,320 38.7 8.1 11.8 7.4 .7 0.7 3.0
Paperboard container manufacturing ..... 32221 2,010 44.8 8.5 9.0 7.5 – – 4.0Corrugated and solid fiber box
manufacturing ................................... 322211 1,190 42.9 8.4 8.4 7.6 – – 3.4Folding paperboard box
manufacturing ................................... 322212 490 51.0 8.2 10.2 6.1 – – –Setup paperboard box manufacturing 322213 80 25.0 – – – – – –Fiber can, tube, drum, and similar
products manufacturing .................... 322214 140 50.0 – – – – – –Nonfolding sanitary food container
manufacturing ................................... 322215 110 36.4 – – – – – –Paper bag and coated and treated paper
manufacturing ....................................... 32222 1,210 33.1 6.6 14.9 8.3 1.7 1.7 1.7Coated and laminated packaging
paper and plastics filmmanufacturing ................................... 322221 220 36.4 9.1 9.1 9.1 – – –
Coated and laminated papermanufacturing ................................... 322222 550 30.9 5.5 18.2 5.5 – 3.6 –
Uncoated paper and multiwall bagmanufacturing ................................... 322224 260 34.6 7.7 11.5 7.7 – – –
Laminated aluminum foilmanufacturing for flexible packaginguses .................................................. 322225 20 – – – – – – –
Surface-coated paperboardmanufacturing ................................... 322226 40 – – 50.0 – – – –
Stationery product manufacturing .......... 32223 440 38.6 4.5 15.9 9.1 – – –Die-cut paper and paperboard office
supplies manufacturing .................... 322231 160 31.2 – 25.0 12.5 – – –Envelope manufacturing ..................... 322232 230 47.8 – 8.7 8.7 – – –Stationery, tablet, and related product
manufacturing ................................... 322233 50 – – – – – – –Other converted paper product
manufacturing ....................................... 32229 660 30.3 12.1 13.6 4.5 – – 4.5Sanitary paper product manufacturing 322291 350 34.3 8.6 14.3 5.7 – – –All other converted paper product
manufacturing ................................... 322299 300 26.7 16.7 13.3 – – – 6.7Printing and related support activities ............ 323 7,400 33.6 6.5 11.2 10.5 .4 .5 3.1
Printing and related support activities ........ 3231 7,400 33.6 6.5 11.2 10.5 .4 .5 3.1Printing ................................................... 32311 6,990 33.2 6.4 11.0 10.6 .4 .6 3.1
Commercial lithographic printing ........ 323110 3,280 36.0 5.8 11.9 7.6 – .6 1.2Commercial gravure printing .............. 323111 180 27.8 16.7 11.1 – – – –Commercial flexographic printing ....... 323112 540 27.8 3.7 7.4 – – – 22.2Commercial screen printing ................ 323113 740 18.9 2.7 10.8 39.2 – – –
See footnotes at end of table.
Page 19

TABLE B1. Percent distribution of nonfatal occupational injuries and illnesses involving days away from work1 by industry andselected natures of injury or illness2, 2006 — Continued
Industry3
Percent of industry case total involving —
Carpaltunnel
syndrome
Tendon-itis
Multiple traumatic injuries anddisorders
Back pain and pain,except back
Allother
natures5Total
Withfractures,
burns,and
otherinjuries
Withsprains
andbruises
Total
Backpain,hurt
back only
Paperboard mills .................................... – – 6.5 – – 4.3 – 10.9Converted paper product manufacturing .... 2.1 1.2 3.9 0.7 1.2 6.0 2.1 16.4
Paperboard container manufacturing ..... 1.5 1.0 5.5 1.0 – 6.0 1.5 12.9Corrugated and solid fiber boxmanufacturing ................................... – – 7.6 1.7 – 5.9 1.7 15.1
Folding paperboard boxmanufacturing ................................... 4.1 – – – – 6.1 – 12.2
Setup paperboard box manufacturing – – – – – 25.0 – –Fiber can, tube, drum, and similarproducts manufacturing .................... – – – – – – – –
Nonfolding sanitary food containermanufacturing ................................... – – – – – – – 18.2
Paper bag and coated and treated papermanufacturing ....................................... 2.5 – 3.3 – 1.7 7.4 3.3 19.0
Coated and laminated packagingpaper and plastics filmmanufacturing ................................... – – – – – 9.1 – 18.2
Coated and laminated papermanufacturing ................................... 5.5 – – – – 3.6 – 23.6
Uncoated paper and multiwall bagmanufacturing ................................... – – – – – 15.4 7.7 15.4
Laminated aluminum foilmanufacturing for flexible packaginguses .................................................. – – – – – – – –
Surface-coated paperboardmanufacturing ................................... – – – – – – – –
Stationery product manufacturing .......... – – – – – 4.5 – 15.9Die-cut paper and paperboard officesupplies manufacturing .................... – – – – – – – 18.8
Envelope manufacturing ..................... – – – – – – – 17.4Stationery, tablet, and related productmanufacturing ................................... – – – – – – – –
Other converted paper productmanufacturing ....................................... – – 3.0 – 3.0 6.1 – 21.2
Sanitary paper product manufacturing – – – – – 5.7 – 20.0All other converted paper productmanufacturing ................................... – – – – – – – 23.3
Printing and related support activities ............ 2.3 1.1 4.5 1.6 .8 8.6 2.0 17.6Printing and related support activities ........ 2.3 1.1 4.5 1.6 .8 8.6 2.0 17.6
Printing ................................................... 2.3 .9 4.7 1.7 .9 8.7 2.0 17.7Commercial lithographic printing ........ 2.7 1.2 6.1 2.1 1.2 10.1 2.1 16.2Commercial gravure printing .............. – – – – – – – 22.2Commercial flexographic printing ....... – – – – – 18.5 – 18.5Commercial screen printing ................ – – 5.4 2.7 – 4.1 – 16.2
See footnotes at end of table.
Page 20

TABLE B1. Percent distribution of nonfatal occupational injuries and illnesses involving days away from work1 by industry and selectednatures of injury or illness2, 2006 — Continued
Industry3 NAICScode4
Totalcases
Percent of industry case total involving —
Sprains,strains Fractures Cuts,
punctures Bruises Heatburns
Chemicalburns
Amputa-tions
Quick printing ..................................... 323114 520 30.8 17.3 5.8 7.7 – – 9.6Digital printing ..................................... 323115 110 27.3 – – 27.3 – – –Manifold business forms printing ........ 323116 520 38.5 5.8 9.6 9.6 – – –Books printing ..................................... 323117 400 45.0 5.0 10.0 7.5 – – –Blankbook, looseleaf binders, and
devices manufacturing ..................... 323118 60 – – 66.7 – – – –Other commercial printing .................. 323119 630 34.9 4.8 11.1 4.8 – – –
Support activities for printing .................. 32312 410 39.0 7.3 12.2 7.3 – – –Tradebinding and related work ........... 323121 250 44.0 – 12.0 8.0 – – –Prepress services ............................... 323122 160 31.2 12.5 12.5 12.5 – – –
Petroleum and coal products manufacturing .. 324 1,070 38.3 14.0 3.7 5.6 11.2 1.9 1.9Petroleum and coal products
manufacturing ........................................... 3241 1,070 38.3 14.0 3.7 5.6 11.2 1.9 1.9Petroleum refineries ............................... 32411 370 40.5 21.6 – – 18.9 – –Asphalt paving, roofing, and saturated
materials manufacturing ....................... 32412 480 41.7 8.3 6.2 8.3 8.3 – –Asphalt paving mixture and block
manufacturing ................................... 324121 310 41.9 6.5 – 6.5 9.7 – –Asphalt shingle and coating materials
manufacturing ................................... 324122 170 41.2 11.8 – 11.8 – – –Other petroleum and coal products
manufacturing ....................................... 32419 220 27.3 13.6 – 9.1 – – –Petroleum lubricating oil and grease
manufacturing ................................... 324191 140 – 14.3 – – – – –All other petroleum and coal products
manufacturing ................................... 324199 80 62.5 – – – – – –Chemical manufacturing ................................. 325 6,580 36.2 8.5 8.1 7.3 3.6 4.7 .8
Basic chemical manufacturing .................... 3251 940 37.2 9.6 6.4 5.3 8.5 10.6 –Petrochemical manufacturing ................. 32511 90 33.3 – – – – – –Synthetic dye and pigment
manufacturing ....................................... 32513 150 66.7 – – – – – –Inorganic dye and pigment
manufacturing ................................... 325131 110 72.7 – – – – – –Synthetic organic dye and pigment
manufacturing ................................... 325132 40 75.0 – – – – – –Other basic inorganic chemical
manufacturing ....................................... 32518 320 28.1 12.5 6.2 – 9.4 18.8 –All other basic inorganic chemical
manufacturing ................................... 325188 260 26.9 11.5 7.7 – 11.5 23.1 –Other basic organic chemical
manufacturing ....................................... 32519 330 33.3 9.1 9.1 12.1 – – –Gum and wood chemical
manufacturing ................................... 325191 50 60.0 – – – – – –
See footnotes at end of table.
Page 21

TABLE B1. Percent distribution of nonfatal occupational injuries and illnesses involving days away from work1 by industry andselected natures of injury or illness2, 2006 — Continued
Industry3
Percent of industry case total involving —
Carpaltunnel
syndrome
Tendon-itis
Multiple traumatic injuries anddisorders
Back pain and pain,except back
Allother
natures5Total
Withfractures,
burns,and
otherinjuries
Withsprains
andbruises
Total
Backpain,hurt
back only
Quick printing ..................................... – – – – – – – 15.4Digital printing ..................................... – – – – – – – –Manifold business forms printing ........ 5.8 – – – – 7.7 3.8 19.2Books printing ..................................... – – 5.0 – – 5.0 – 22.5Blankbook, looseleaf binders, anddevices manufacturing ..................... – – – – – – – –
Other commercial printing .................. 3.2 – 3.2 3.2 – 6.3 3.2 28.6Support activities for printing .................. – 4.9 – – – 7.3 – 14.6
Tradebinding and related work ........... – 8.0 – – – – – 24.0Prepress services ............................... – – – – – 12.5 – –
Petroleum and coal products manufacturing .. – – 3.7 – 1.9 5.6 1.9 14.0Petroleum and coal productsmanufacturing ........................................... – – 3.7 – 1.9 5.6 1.9 14.0
Petroleum refineries ............................... – – – – – – – 5.4Asphalt paving, roofing, and saturatedmaterials manufacturing ....................... – – 6.2 – – 6.2 – 12.5
Asphalt paving mixture and blockmanufacturing ................................... – – – – – 6.5 – 16.1
Asphalt shingle and coating materialsmanufacturing ................................... – – – – – 11.8 – –
Other petroleum and coal productsmanufacturing ....................................... – – – – – – – 27.3
Petroleum lubricating oil and greasemanufacturing ................................... – – – – – – – 35.7
All other petroleum and coal productsmanufacturing ................................... – – – – – – – –
Chemical manufacturing ................................. 2.3 .5 3.2 .8 1.2 7.6 2.4 17.3Basic chemical manufacturing .................... 2.1 – 3.2 – – 4.3 – 13.8
Petrochemical manufacturing ................. – – – – – – – –Synthetic dye and pigmentmanufacturing ....................................... – – – – – – – 13.3
Inorganic dye and pigmentmanufacturing ................................... – – – – – – – –
Synthetic organic dye and pigmentmanufacturing ................................... – – – – – – – –
Other basic inorganic chemicalmanufacturing ....................................... – – 6.2 – – – – 12.5
All other basic inorganic chemicalmanufacturing ................................... – – – – – – – 11.5
Other basic organic chemicalmanufacturing ....................................... – – – – – 9.1 – 15.2
Gum and wood chemicalmanufacturing ................................... – – – – – – – –
See footnotes at end of table.
Page 22

TABLE B1. Percent distribution of nonfatal occupational injuries and illnesses involving days away from work1 by industry and selectednatures of injury or illness2, 2006 — Continued
Industry3 NAICScode4
Totalcases
Percent of industry case total involving —
Sprains,strains Fractures Cuts,
punctures Bruises Heatburns
Chemicalburns
Amputa-tions
Cyclic crude and intermediatemanufacturing ................................... 325192 20 – – – – – – –
Ethyl alcohol manufacturing ............... 325193 30 – – – – – – –All other basic organic chemical
manufacturing ................................... 325199 220 31.8 9.1 9.1 9.1 – – –Resin, synthetic rubber, and artificial and
synthetic fibers and filamentsmanufacturing ........................................... 3252 790 36.7 11.4 6.3 6.3 3.8 5.1 –Resin and synthetic rubber
manufacturing ....................................... 32521 630 38.1 11.1 7.9 3.2 3.2 3.2 –Plastics material and resin
manufacturing ................................... 325211 440 38.6 11.4 4.5 4.5 – – –Synthetic rubber manufacturing ......... 325212 190 36.8 10.5 15.8 – – – –
Artificial and synthetic fibers andfilaments manufacturing ....................... 32522 160 31.2 12.5 – 18.8 – 12.5 –Cellulosic organic fiber manufacturing 325221 40 – – – 50.0 – – –Noncellulosic organic fiber
manufacturing ................................... 325222 120 33.3 16.7 – – – 16.7 –Pesticide, fertilizer, and other agricultural
chemical manufacturing ........................... 3253 290 31.0 13.8 10.3 – – 13.8 –Fertilizer manufacturing .......................... 32531 210 23.8 19.0 14.3 – – 14.3 –
Nitrogenous fertilizer manufacturing ... 325311 40 – – – – – – –Phosphatic fertilizer manufacturing .... 325312 50 60.0 – – – – – –Fertilizer (mixing only) manufacturing 325314 110 – 27.3 18.2 – – – –
Pesticide and other agricultural chemicalmanufacturing ....................................... 32532 80 62.5 – – – – – –
Pharmaceutical and medicinemanufacturing ........................................... 3254 1,770 36.2 9.0 7.3 9.0 2.3 1.1 –Pharmaceutical and medicine
manufacturing ....................................... 32541 1,770 36.2 9.0 7.3 9.0 2.3 1.1 –Medicinal and botanical
manufacturing ................................... 325411 160 37.5 12.5 12.5 12.5 – – –Pharmaceutical preparation
manufacturing ................................... 325412 1,430 35.7 9.1 7.0 9.8 1.4 1.4 –In-vitro diagnostic substance
manufacturing ................................... 325413 70 28.6 – – – 28.6 – –Biological product (except diagnostic)
manufacturing ................................... 325414 110 45.5 – – – – – –Paint, coating, and adhesive
manufacturing ........................................... 3255 740 39.2 5.4 8.1 6.8 4.1 5.4 –Paint and coating manufacturing ............ 32551 520 40.4 3.8 9.6 5.8 – 5.8 –Adhesive manufacturing ......................... 32552 220 36.4 9.1 – 9.1 9.1 9.1 –
Soap, cleaning compound, and toiletpreparation manufacturing ....................... 3256 1,020 31.4 6.9 7.8 9.8 – 4.9 –
See footnotes at end of table.
Page 23

TABLE B1. Percent distribution of nonfatal occupational injuries and illnesses involving days away from work1 by industry andselected natures of injury or illness2, 2006 — Continued
Industry3
Percent of industry case total involving —
Carpaltunnel
syndrome
Tendon-itis
Multiple traumatic injuries anddisorders
Back pain and pain,except back
Allother
natures5Total
Withfractures,
burns,and
otherinjuries
Withsprains
andbruises
Total
Backpain,hurt
back only
Cyclic crude and intermediatemanufacturing ................................... – – – – – – – –
Ethyl alcohol manufacturing ............... – – – – – – – –All other basic organic chemicalmanufacturing ................................... – – – – – 13.6 – 18.2
Resin, synthetic rubber, and artificial andsynthetic fibers and filamentsmanufacturing ........................................... 3.8 – 2.5 – – 8.9 2.5 13.9
Resin and synthetic rubbermanufacturing ....................................... 4.8 – 3.2 – – 9.5 3.2 14.3
Plastics material and resinmanufacturing ................................... 4.5 – 4.5 – – 11.4 4.5 15.9
Synthetic rubber manufacturing ......... – – – – – 10.5 – 10.5Artificial and synthetic fibers andfilaments manufacturing ....................... – – – – – – – –
Cellulosic organic fiber manufacturing – – – – – – – –Noncellulosic organic fibermanufacturing ................................... – – – – – – – –
Pesticide, fertilizer, and other agriculturalchemical manufacturing ........................... – – 6.9 – – – – 10.3
Fertilizer manufacturing .......................... – – 9.5 – – – – 9.5Nitrogenous fertilizer manufacturing ... – – – – – – – –Phosphatic fertilizer manufacturing .... – – – – – – – –Fertilizer (mixing only) manufacturing – – – – – – – –
Pesticide and other agricultural chemicalmanufacturing ....................................... – – – – – – – –
Pharmaceutical and medicinemanufacturing ........................................... 2.3 – 3.4 – 2.3 7.3 3.4 19.8
Pharmaceutical and medicinemanufacturing ....................................... 2.3 – 3.4 – 2.3 7.3 3.4 19.8
Medicinal and botanicalmanufacturing ................................... – – – – – – – 18.8
Pharmaceutical preparationmanufacturing ................................... 1.4 – 3.5 – 2.1 8.4 3.5 21.0
In-vitro diagnostic substancemanufacturing ................................... – – – – – – – –
Biological product (except diagnostic)manufacturing ................................... – – – – – – – 18.2
Paint, coating, and adhesivemanufacturing ........................................... – – – – – 8.1 – 20.3
Paint and coating manufacturing ............ – – – – – 9.6 – 21.2Adhesive manufacturing ......................... – – – – – 9.1 – 18.2
Soap, cleaning compound, and toiletpreparation manufacturing ....................... 2.0 – 3.9 – 2.0 6.9 2.0 23.5
See footnotes at end of table.
Page 24

TABLE B1. Percent distribution of nonfatal occupational injuries and illnesses involving days away from work1 by industry and selectednatures of injury or illness2, 2006 — Continued
Industry3 NAICScode4
Totalcases
Percent of industry case total involving —
Sprains,strains Fractures Cuts,
punctures Bruises Heatburns
Chemicalburns
Amputa-tions
Soap and cleaning compoundmanufacturing ....................................... 32561 560 28.6 7.1 7.1 8.9 – 8.9 –Soap and other detergent
manufacturing ................................... 325611 210 28.6 9.5 – – – 9.5 –Polish and other sanitation good
manufacturing ................................... 325612 290 20.7 6.9 6.9 13.8 – 10.3 –Surface active agent manufacturing ... 325613 60 66.7 – – – – – –
Toilet preparation manufacturing ............ 32562 460 34.8 6.5 8.7 10.9 – – –Other chemical product and preparation
manufacturing ........................................... 3259 1,030 37.9 7.8 11.7 4.9 4.9 1.9 –Printing ink manufacturing ...................... 32591 120 33.3 16.7 – – – – –Explosives manufacturing ...................... 32592 80 25.0 – – – – – –All other chemical product and
preparation manufacturing ................... 32599 830 39.8 6.0 14.5 4.8 4.8 – –Custom compounding of purchased
resins ................................................ 325991 230 30.4 13.0 21.7 – 8.7 – –All other miscellaneous chemical
product and preparationmanufacturing ................................... 325998 310 38.7 – 12.9 9.7 – – –
Plastics and rubber products manufacturing .. 326 12,690 35.1 7.5 11.9 8.5 1.9 1.3 2.0Plastics product manufacturing .................. 3261 9,900 33.4 7.4 12.5 8.7 2.1 1.5 1.8
Unsupported plastics film, sheet, andbag manufacturing ................................ 32611 1,490 31.5 9.4 10.7 8.7 2.0 1.3 1.3Unsupported plastics bag
manufacturing ................................... 326111 310 32.3 12.9 9.7 6.5 – – –Unsupported plastics film and sheet
(except packaging) manufacturing ... 326113 980 33.7 7.1 11.2 8.2 2.0 2.0 –Plastics pipe, pipe fitting, and
unsupported profile shapemanufacturing ....................................... 32612 1,080 37.0 8.3 13.0 10.2 1.9 – 1.9Unsupported plastics profile shape
manufacturing ................................... 326121 500 36.0 6.0 16.0 8.0 – – –Plastics pipe and pipe fitting
manufacturing ................................... 326122 580 36.2 10.3 10.3 10.3 3.4 – –Laminated plastics plate, sheet, and
shape manufacturing ............................ 32613 300 36.7 – 13.3 – – – 6.7Polystyrene foam product manufacturing 32614 370 45.9 – 10.8 8.1 – – –Urethane and other foam product
(except polystyrene) manufacturing ..... 32615 630 31.7 6.3 14.3 6.3 – – 3.2Plastics bottle manufacturing ................. 32616 380 28.9 13.2 7.9 10.5 – – –Other plastics product manufacturing ..... 32619 5,650 32.7 6.9 13.1 9.0 2.5 2.3 1.6
Plastics plumbing fixturemanufacturing ................................... 326191 250 44.0 8.0 8.0 – – – –
See footnotes at end of table.
Page 25
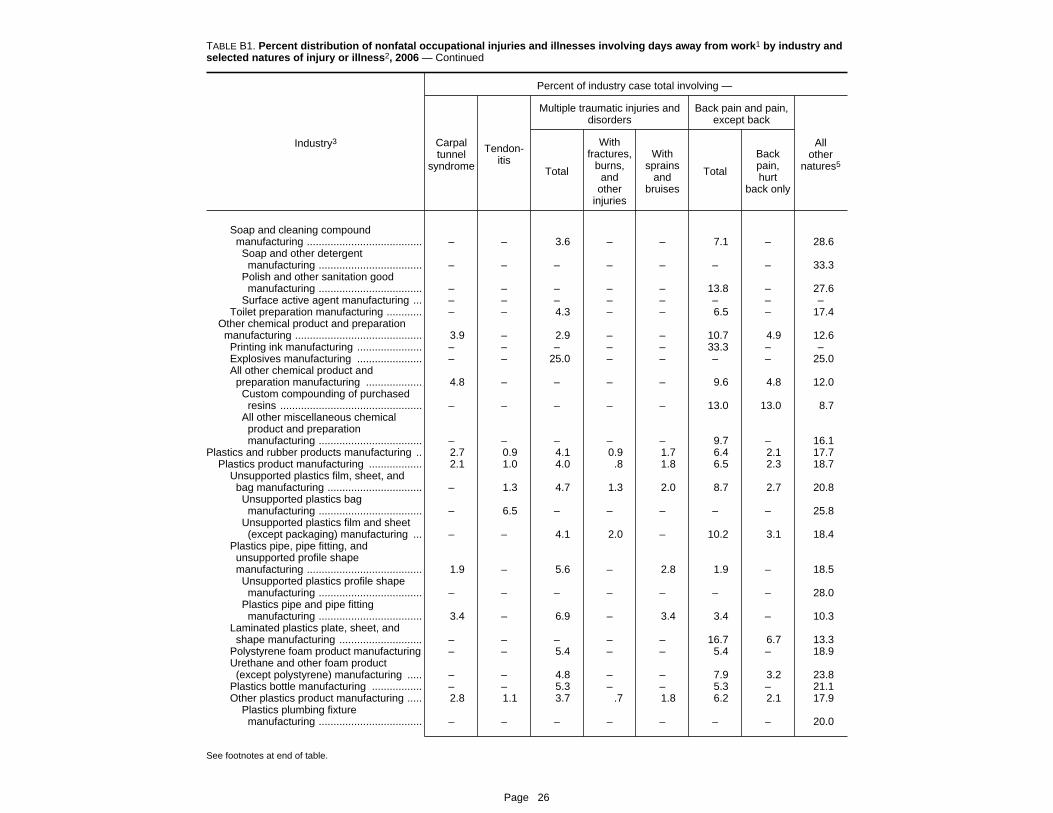
TABLE B1. Percent distribution of nonfatal occupational injuries and illnesses involving days away from work1 by industry andselected natures of injury or illness2, 2006 — Continued
Industry3
Percent of industry case total involving —
Carpaltunnel
syndrome
Tendon-itis
Multiple traumatic injuries anddisorders
Back pain and pain,except back
Allother
natures5Total
Withfractures,
burns,and
otherinjuries
Withsprains
andbruises
Total
Backpain,hurt
back only
Soap and cleaning compoundmanufacturing ....................................... – – 3.6 – – 7.1 – 28.6
Soap and other detergentmanufacturing ................................... – – – – – – – 33.3
Polish and other sanitation goodmanufacturing ................................... – – – – – 13.8 – 27.6
Surface active agent manufacturing ... – – – – – – – –Toilet preparation manufacturing ............ – – 4.3 – – 6.5 – 17.4
Other chemical product and preparationmanufacturing ........................................... 3.9 – 2.9 – – 10.7 4.9 12.6
Printing ink manufacturing ...................... – – – – – 33.3 – –Explosives manufacturing ...................... – – 25.0 – – – – 25.0All other chemical product andpreparation manufacturing ................... 4.8 – – – – 9.6 4.8 12.0
Custom compounding of purchasedresins ................................................ – – – – – 13.0 13.0 8.7
All other miscellaneous chemicalproduct and preparationmanufacturing ................................... – – – – – 9.7 – 16.1
Plastics and rubber products manufacturing .. 2.7 0.9 4.1 0.9 1.7 6.4 2.1 17.7Plastics product manufacturing .................. 2.1 1.0 4.0 .8 1.8 6.5 2.3 18.7
Unsupported plastics film, sheet, andbag manufacturing ................................ – 1.3 4.7 1.3 2.0 8.7 2.7 20.8
Unsupported plastics bagmanufacturing ................................... – 6.5 – – – – – 25.8
Unsupported plastics film and sheet(except packaging) manufacturing ... – – 4.1 2.0 – 10.2 3.1 18.4
Plastics pipe, pipe fitting, andunsupported profile shapemanufacturing ....................................... 1.9 – 5.6 – 2.8 1.9 – 18.5
Unsupported plastics profile shapemanufacturing ................................... – – – – – – – 28.0
Plastics pipe and pipe fittingmanufacturing ................................... 3.4 – 6.9 – 3.4 3.4 – 10.3
Laminated plastics plate, sheet, andshape manufacturing ............................ – – – – – 16.7 6.7 13.3
Polystyrene foam product manufacturing – – 5.4 – – 5.4 – 18.9Urethane and other foam product(except polystyrene) manufacturing ..... – – 4.8 – – 7.9 3.2 23.8
Plastics bottle manufacturing ................. – – 5.3 – – 5.3 – 21.1Other plastics product manufacturing ..... 2.8 1.1 3.7 .7 1.8 6.2 2.1 17.9
Plastics plumbing fixturemanufacturing ................................... – – – – – – – 20.0
See footnotes at end of table.
Page 26

TABLE B1. Percent distribution of nonfatal occupational injuries and illnesses involving days away from work1 by industry and selectednatures of injury or illness2, 2006 — Continued
Industry3 NAICScode4
Totalcases
Percent of industry case total involving —
Sprains,strains Fractures Cuts,
punctures Bruises Heatburns
Chemicalburns
Amputa-tions
All other plastics productmanufacturing ................................... 326199 5,360 32.3 6.7 13.4 9.1 2.4 2.2 1.5
Rubber product manufacturing ................... 3262 2,790 41.2 8.2 9.3 7.5 .7 .7 2.9Tire manufacturing ................................. 32621 1,030 47.6 6.8 5.8 7.8 – – –
Tire manufacturing (exceptretreading) ........................................ 326211 920 48.9 7.6 6.5 8.7 – – –
Tire retreading .................................... 326212 110 36.4 – – – – – –Rubber and plastics hoses and belting
manufacturing ....................................... 32622 440 36.4 9.1 13.6 6.8 – – 4.5Other rubber product manufacturing ...... 32629 1,320 37.9 8.3 10.6 7.6 – – 3.8
Rubber product manufacturing formechanical use ................................ 326291 800 36.2 10.0 5.0 7.5 – – 5.0
All other rubber productmanufacturing ................................... 326299 520 38.5 7.7 19.2 7.7 – – –
Nonmetallic mineral product manufacturing ... 327 10,470 37.8 8.7 11.1 7.3 1.0 .7 1.1Clay product and refractory manufacturing 3271 790 39.2 8.9 11.4 6.3 – – 2.5
Pottery, ceramics, and plumbing fixturemanufacturing ....................................... 32711 330 48.5 – 9.1 6.1 – – –Vitreous china plumbing fixture and
china and earthenware bathroomaccessories manufacturing ............... 327111 40 50.0 – – – – – –
Vitreous china, fine earthenware, andother pottery product manufacturing 327112 140 57.1 – – – – – –
Clay building material and refractoriesmanufacturing ....................................... 32712 450 33.3 13.3 11.1 6.7 – – –Brick and structural clay tile
manufacturing ................................... 327121 160 25.0 12.5 18.8 – – – –Ceramic wall and floor tile
manufacturing ................................... 327122 140 28.6 14.3 14.3 – – – –Other structural clay product
manufacturing ................................... 327123 20 – – – – – – –Clay refractory manufacturing ............ 327124 30 – – – – – – –Nonclay refractory manufacturing ...... 327125 110 45.5 – – – – – –
Glass and glass product manufacturing ..... 3272 1,570 35.0 5.7 19.7 6.4 2.5 – –Glass and glass product manufacturing 32721 1,570 35.0 5.7 19.7 6.4 2.5 – –
Flat glass manufacturing .................... 327211 210 28.6 – 28.6 – – – –Other pressed and blown glass and
glassware manufacturing ................. 327212 290 31.0 – 17.2 6.9 6.9 – –Glass container manufacturing ........... 327213 270 40.7 11.1 7.4 – – – –Glass product manufacturing made of
purchased glass ............................... 327215 810 34.6 4.9 22.2 7.4 – – –Cement and concrete product
manufacturing ........................................... 3273 6,440 39.8 9.8 8.4 7.1 .6 .5 1.1Ready-mix concrete manufacturing ........ 32732 3,610 44.3 7.5 5.8 8.3 – .6 –
See footnotes at end of table.
Page 27

TABLE B1. Percent distribution of nonfatal occupational injuries and illnesses involving days away from work1 by industry andselected natures of injury or illness2, 2006 — Continued
Industry3
Percent of industry case total involving —
Carpaltunnel
syndrome
Tendon-itis
Multiple traumatic injuries anddisorders
Back pain and pain,except back
Allother
natures5Total
Withfractures,
burns,and
otherinjuries
Withsprains
andbruises
Total
Backpain,hurt
back only
All other plastics productmanufacturing ................................... 3.0 1.1 3.7 0.7 1.9 6.3 2.2 17.9
Rubber product manufacturing ................... 4.7 – 4.3 1.1 1.4 6.1 1.4 14.0Tire manufacturing ................................. 4.9 – 2.9 – – 7.8 1.9 12.6
Tire manufacturing (exceptretreading) ........................................ 5.4 – 2.2 – – 6.5 – 12.0
Tire retreading .................................... – – – – – 18.2 18.2 18.2Rubber and plastics hoses and beltingmanufacturing ....................................... – – 4.5 – – 6.8 – 13.6
Other rubber product manufacturing ...... 4.5 – 5.3 – 2.3 4.5 1.5 15.2Rubber product manufacturing formechanical use ................................ 2.5 – 6.2 – 3.8 5.0 2.5 17.5
All other rubber productmanufacturing ................................... 9.6 – – – – 3.8 – 9.6
Nonmetallic mineral product manufacturing ... 1.0 .5 4.5 .9 1.2 7.9 2.6 18.6Clay product and refractory manufacturing – – 2.5 – – 6.3 – 19.0
Pottery, ceramics, and plumbing fixturemanufacturing ....................................... – – – – – 9.1 – 18.2
Vitreous china plumbing fixture andchina and earthenware bathroomaccessories manufacturing ............... – – – – – – – –
Vitreous china, fine earthenware, andother pottery product manufacturing – – – – – – – 14.3
Clay building material and refractoriesmanufacturing ....................................... – – – – – 4.4 – 20.0
Brick and structural clay tilemanufacturing ................................... – – – – – – – 18.8
Ceramic wall and floor tilemanufacturing ................................... – – – – – – – 14.3
Other structural clay productmanufacturing ................................... – – – – – – – –
Clay refractory manufacturing ............ – – – – – – – –Nonclay refractory manufacturing ...... – – – – – – – 27.3
Glass and glass product manufacturing ..... 4.5 1.3 3.8 1.3 1.3 4.5 1.3 14.6Glass and glass product manufacturing 4.5 1.3 3.8 1.3 1.3 4.5 1.3 14.6
Flat glass manufacturing .................... – – – – – – – 19.0Other pressed and blown glass andglassware manufacturing ................. 6.9 – – – – 6.9 – 13.8
Glass container manufacturing ........... – – – – – – – 18.5Glass product manufacturing made ofpurchased glass ............................... 4.9 2.5 3.7 – – 4.9 – 13.6
Cement and concrete productmanufacturing ........................................... .5 .3 5.4 .9 1.6 8.7 3.3 17.9
Ready-mix concrete manufacturing ........ – – 6.6 .6 1.7 10.0 3.9 16.3
See footnotes at end of table.
Page 28

TABLE B1. Percent distribution of nonfatal occupational injuries and illnesses involving days away from work1 by industry and selectednatures of injury or illness2, 2006 — Continued
Industry3 NAICScode4
Totalcases
Percent of industry case total involving —
Sprains,strains Fractures Cuts,
punctures Bruises Heatburns
Chemicalburns
Amputa-tions
Concrete pipe, brick, and blockmanufacturing ....................................... 32733 940 34.0 12.8 7.4 6.4 – – 2.1Concrete block and brick
manufacturing ................................... 327331 640 39.1 9.4 7.8 6.2 – – –Concrete pipe manufacturing ............. 327332 300 23.3 20.0 – 6.7 – – –
Other concrete product manufacturing ... 32739 1,620 35.2 14.2 16.0 4.3 – – 1.9Lime and gypsum product manufacturing .. 3274 160 12.5 – – 12.5 – – –
Gypsum product manufacturing ............. 32742 60 – – – – – – –Other nonmetallic mineral product
manufacturing ........................................... 3279 1,520 34.2 7.2 13.2 8.6 – 1.3 –Abrasive product manufacturing ............. 32791 100 40.0 – – – – – –All other nonmetallic mineral product
manufacturing ....................................... 32799 1,410 34.0 7.1 13.5 8.5 – 1.4 –Cut stone and stone product
manufacturing ................................... 327991 810 33.3 7.4 18.5 12.3 – – –Ground or treated mineral and earth
manufacturing ................................... 327992 80 37.5 – – – – – –Mineral wool manufacturing ............... 327993 290 34.5 6.9 10.3 – – – –All other miscellaneous nonmetallic
mineral product manufacturing ......... 327999 240 33.3 – – – – 8.3 –Primary metal manufacturing ......................... 331 10,440 35.5 9.7 8.4 8.0 6.0 .6 2.0
Iron and steel mills and ferroalloymanufacturing ........................................... 3311 1,790 43.0 16.2 4.5 6.7 6.1 1.1 1.7Iron and steel mills and ferroalloy
manufacturing ....................................... 33111 1,790 43.0 16.2 4.5 6.7 6.1 1.1 1.7Iron and steel mills ............................. 331111 1,750 43.4 16.6 4.6 6.9 6.3 1.1 1.7Electrometallurgical ferroalloy product
manufacturing ................................... 331112 40 50.0 – – – – – –Steel product manufacturing from
purchased steel ........................................ 3312 1,470 37.4 7.5 12.2 11.6 2.0 – 1.4Iron and steel pipe and tube
manufacturing from purchased steel .... 33121 630 39.7 7.9 9.5 7.9 – – –Rolling and drawing of purchased steel 33122 840 34.5 8.3 14.3 13.1 2.4 – –
Rolled steel shape manufacturing ...... 331221 520 32.7 9.6 13.5 13.5 3.8 – –Steel wire drawing .............................. 331222 330 36.4 6.1 15.2 12.1 – – –
Alumina and aluminum production andprocessing ................................................ 3313 1,210 34.7 8.3 9.1 7.4 4.1 – 1.7Alumina and aluminum production and
processing ............................................ 33131 1,210 34.7 8.3 9.1 7.4 4.1 – 1.7Primary aluminum production ............. 331312 220 36.4 – – 9.1 – – –Secondary smelting and alloying of
aluminum .......................................... 331314 260 26.9 11.5 11.5 7.7 11.5 – –Aluminum sheet, plate, and foil
manufacturing ................................... 331315 100 40.0 30.0 – – – – –
See footnotes at end of table.
Page 29

TABLE B1. Percent distribution of nonfatal occupational injuries and illnesses involving days away from work1 by industry andselected natures of injury or illness2, 2006 — Continued
Industry3
Percent of industry case total involving —
Carpaltunnel
syndrome
Tendon-itis
Multiple traumatic injuries anddisorders
Back pain and pain,except back
Allother
natures5Total
Withfractures,
burns,and
otherinjuries
Withsprains
andbruises
Total
Backpain,hurt
back only
Concrete pipe, brick, and blockmanufacturing ....................................... – – 5.3 – – 8.5 2.1 21.3
Concrete block and brickmanufacturing ................................... – – 4.7 – – 7.8 – 23.4
Concrete pipe manufacturing ............. – – 6.7 – – 10.0 – 13.3Other concrete product manufacturing ... – – 2.5 – – 7.4 3.1 16.0
Lime and gypsum product manufacturing .. – – – – – – – 56.2Gypsum product manufacturing ............. – – – – – – – 50.0
Other nonmetallic mineral productmanufacturing ........................................... – – 2.6 – – 9.9 2.0 21.7
Abrasive product manufacturing ............. – – – – – – – 30.0All other nonmetallic mineral productmanufacturing ....................................... – – 2.8 – – 9.9 2.1 20.6
Cut stone and stone productmanufacturing ................................... – – – – – 16.0 2.5 9.9
Ground or treated mineral and earthmanufacturing ................................... – – – – – – – –
Mineral wool manufacturing ............... – – – – – – – 34.5All other miscellaneous nonmetallicmineral product manufacturing ......... – – – – – – – 41.7
Primary metal manufacturing ......................... 1.8 0.7 3.7 1.4 0.6 5.0 1.8 18.5Iron and steel mills and ferroalloymanufacturing ........................................... 1.7 – 3.9 1.1 1.7 2.2 – 11.7
Iron and steel mills and ferroalloymanufacturing ....................................... 1.7 – 3.9 1.1 1.7 2.2 – 11.7
Iron and steel mills ............................. 1.7 – 4.0 1.1 1.7 1.7 – 11.4Electrometallurgical ferroalloy productmanufacturing ................................... – – – – – – – –
Steel product manufacturing frompurchased steel ........................................ – – 3.4 2.0 – 8.2 3.4 14.3
Iron and steel pipe and tubemanufacturing from purchased steel .... – – 3.2 – – 9.5 3.2 15.9
Rolling and drawing of purchased steel – – 3.6 – – 7.1 3.6 13.1Rolled steel shape manufacturing ...... – – 3.8 – – – – 15.4Steel wire drawing .............................. – – – – – 12.1 6.1 6.1
Alumina and aluminum production andprocessing ................................................ 1.7 – 5.0 2.5 – 5.8 2.5 19.8
Alumina and aluminum production andprocessing ............................................ 1.7 – 5.0 2.5 – 5.8 2.5 19.8
Primary aluminum production ............. – – 13.6 – – 9.1 – 22.7Secondary smelting and alloying ofaluminum .......................................... – – – – – – – 19.2
Aluminum sheet, plate, and foilmanufacturing ................................... – – – – – – – –
See footnotes at end of table.
Page 30

TABLE B1. Percent distribution of nonfatal occupational injuries and illnesses involving days away from work1 by industry and selectednatures of injury or illness2, 2006 — Continued
Industry3 NAICScode4
Totalcases
Percent of industry case total involving —
Sprains,strains Fractures Cuts,
punctures Bruises Heatburns
Chemicalburns
Amputa-tions
Aluminum extruded productmanufacturing ................................... 331316 510 37.3 3.9 11.8 7.8 – – –
Other aluminum rolling and drawing ... 331319 110 36.4 18.2 – – – – –Nonferrous metal (except aluminum)
production and processing ....................... 3314 1,620 40.7 9.3 7.4 7.4 3.1 – 3.7Nonferrous metal (except aluminum)
smelting and refining ............................ 33141 90 33.3 22.2 – – – – –Primary smelting and refining of
copper .............................................. 331411 30 – – – – – – –Primary smelting and refining of
nonferrous metal (except copper andaluminum) ......................................... 331419 60 33.3 – – – – – –
Copper rolling, drawing, extruding, andalloying ................................................. 33142 1,170 41.0 9.4 7.7 8.5 1.7 – 3.4Copper rolling, drawing, and extruding 331421 540 42.6 9.3 5.6 9.3 3.7 – –
Nonferrous metal (except copper andaluminum) rolling, drawing, extruding,and alloying .......................................... 33149 360 41.7 8.3 5.6 – 5.6 – 5.6Nonferrous metal (except copper and
aluminum) rolling, drawing, andextruding ........................................... 331491 200 30.0 – – – – – 10.0
Secondary smelting, refining, andalloying of nonferrous metal (exceptcopper and aluminum) ...................... 331492 160 56.2 – – – – – –
Foundries ................................................... 3315 4,350 29.9 8.0 9.2 7.4 9.2 – 1.8Ferrous metal foundries ......................... 33151 2,690 30.5 8.9 7.1 7.8 7.8 – 1.9
Iron foundries ..................................... 331511 1,800 32.2 8.9 6.1 7.2 7.8 – 2.2Steel investment foundries ................. 331512 250 24.0 – 8.0 – 8.0 – –Steel foundries (except investment) ... 331513 640 28.1 10.9 7.8 9.4 7.8 – –
Nonferrous metal foundries .................... 33152 1,660 28.9 6.6 12.7 7.2 11.4 – 1.8Aluminum die-casting foundries ......... 331521 550 27.3 7.3 10.9 5.5 9.1 – –Nonferrous (except aluminum)
die-casting foundries ........................ 331522 200 30.0 – 15.0 10.0 – – –Aluminum foundries (except
die-casting) ....................................... 331524 610 31.1 4.9 9.8 9.8 11.5 – 3.3Copper foundries (except die-casting) 331525 180 22.2 – 27.8 – 27.8 – –Other nonferrous foundries (except
die-casting) ....................................... 331528 120 33.3 16.7 16.7 – – – –Fabricated metal product manufacturing ........ 332 28,720 28.3 9.0 14.6 7.6 1.5 0.7 3.0
Forging and stamping ................................. 3321 2,700 26.3 6.7 21.9 7.0 2.2 – 3.0Forging and stamping ............................. 33211 2,700 26.3 6.7 21.9 7.0 2.2 – 3.0
Iron and steel forging .......................... 332111 820 32.9 8.5 9.8 6.1 3.7 – –Custom roll forming ............................ 332114 110 27.3 – 18.2 – – – –Crown and closure manufacturing ...... 332115 40 – – – – – – –
See footnotes at end of table.
Page 31

TABLE B1. Percent distribution of nonfatal occupational injuries and illnesses involving days away from work1 by industry andselected natures of injury or illness2, 2006 — Continued
Industry3
Percent of industry case total involving —
Carpaltunnel
syndrome
Tendon-itis
Multiple traumatic injuries anddisorders
Back pain and pain,except back
Allother
natures5Total
Withfractures,
burns,and
otherinjuries
Withsprains
andbruises
Total
Backpain,hurt
back only
Aluminum extruded productmanufacturing ................................... 3.9 – 3.9 – – 3.9 – 21.6
Other aluminum rolling and drawing ... – – – – – – – 18.2Nonferrous metal (except aluminum)production and processing ....................... 2.5 1.2 3.1 1.2 – 6.2 1.9 14.2
Nonferrous metal (except aluminum)smelting and refining ............................ – – – – – – – –
Primary smelting and refining ofcopper .............................................. – – – – – – – –
Primary smelting and refining ofnonferrous metal (except copper andaluminum) ......................................... – – – – – – – –
Copper rolling, drawing, extruding, andalloying ................................................. 2.6 1.7 3.4 1.7 – 6.8 2.6 13.7
Copper rolling, drawing, and extruding 3.7 – 3.7 – – 7.4 – 14.8Nonferrous metal (except copper andaluminum) rolling, drawing, extruding,and alloying .......................................... – – – – – – – 16.7
Nonferrous metal (except copper andaluminum) rolling, drawing, andextruding ........................................... – – – – – – – 15.0
Secondary smelting, refining, andalloying of nonferrous metal (exceptcopper and aluminum) ...................... – – – – – – – 18.8
Foundries ................................................... 2.1 .9 3.4 1.4 – 4.4 1.4 23.7Ferrous metal foundries ......................... 1.5 .7 3.7 1.9 – 4.1 1.1 26.0
Iron foundries ..................................... 1.7 – 3.9 2.2 – 2.2 – 26.7Steel investment foundries ................. – – – – – 12.0 – 28.0Steel foundries (except investment) ... – – 4.7 – – 6.2 3.1 23.4
Nonferrous metal foundries .................... 2.4 – 2.4 – – 5.4 1.8 19.9Aluminum die-casting foundries ......... 3.6 – – – – 7.3 – 23.6Nonferrous (except aluminum)die-casting foundries ........................ – – – – – – – 25.0
Aluminum foundries (exceptdie-casting) ....................................... – – 4.9 – – 4.9 – 18.0
Copper foundries (except die-casting) – – – – – – – 11.1Other nonferrous foundries (exceptdie-casting) ....................................... – – – – – – – 16.7
Fabricated metal product manufacturing ........ 2.1 .6 3.5 1.2 0.6 6.1 2.0 23.0Forging and stamping ................................. 3.0 – 3.0 1.5 – 7.0 3.7 19.3
Forging and stamping ............................. 3.0 – 3.0 1.5 – 7.0 3.7 19.3Iron and steel forging .......................... – – – – – 12.2 9.8 22.0Custom roll forming ............................ – – – – – – – 18.2Crown and closure manufacturing ...... – – – – – – – –
See footnotes at end of table.
Page 32

TABLE B1. Percent distribution of nonfatal occupational injuries and illnesses involving days away from work1 by industry and selectednatures of injury or illness2, 2006 — Continued
Industry3 NAICScode4
Totalcases
Percent of industry case total involving —
Sprains,strains Fractures Cuts,
punctures Bruises Heatburns
Chemicalburns
Amputa-tions
Metal stamping ................................... 332116 1,300 19.2 5.4 33.8 5.4 1.5 – 5.4Powder metallurgy part manufacturing 332117 220 31.8 – 9.1 13.6 – – –
Cutlery and handtool manufacturing .......... 3322 950 30.5 3.2 18.9 4.2 2.1 – 2.1Cutlery and handtool manufacturing ...... 33221 950 30.5 3.2 18.9 4.2 2.1 – 2.1
Cutlery and flatware (except precious)manufacturing ................................... 332211 190 36.8 – – – – – –
Hand and edge tool manufacturing .... 332212 480 27.1 4.2 18.8 4.2 4.2 – –Saw blade and handsaw
manufacturing ................................... 332213 130 38.5 – 23.1 – – – –Kitchen utensil, pot, and pan
manufacturing ................................... 332214 140 28.6 – 35.7 – – – –Architectural and structural metals
manufacturing ........................................... 3323 9,040 27.7 11.5 14.9 7.4 2.0 0.3 1.4Plate work and fabricated structural
product manufacturing .......................... 33231 5,230 26.0 11.7 14.9 8.0 2.3 – 1.9Prefabricated metal building and
component manufacturing ................ 332311 690 33.3 14.5 14.5 8.7 – – –Fabricated structural metal
manufacturing ................................... 332312 3,260 24.8 11.0 16.3 8.0 2.8 – .6Plate work manufacturing ................... 332313 1,280 24.2 12.5 11.7 7.8 2.3 – 6.2
Ornamental and architectural metalproducts manufacturing ........................ 33232 3,810 29.9 11.3 15.0 6.6 1.3 .5 .8Metal window and door manufacturing 332321 1,110 34.2 9.0 16.2 7.2 1.8 – –Sheet metal work manufacturing ........ 332322 1,820 29.7 12.6 15.9 4.9 – – –Ornamental and architectural metal
work manufacturing .......................... 332323 890 24.7 12.4 11.2 9.0 2.2 – –Boiler, tank, and shipping container
manufacturing ........................................... 3324 1,990 29.6 10.6 10.1 9.0 1.0 – 6.0Power boiler and heat exchanger
manufacturing ....................................... 33241 320 37.5 9.4 6.2 6.2 – – –Metal tank (heavy gauge) manufacturing 33242 810 25.9 7.4 9.9 11.1 – – 11.1Metal can, box, and other metal
container (light gauge) manufacturing .. 33243 850 30.6 14.1 11.8 8.2 – – 2.4Metal can manufacturing .................... 332431 290 44.8 6.9 6.9 10.3 – – –Other metal container manufacturing 332439 560 23.2 19.6 14.3 7.1 – – 3.6
Hardware manufacturing ............................ 3325 400 35.0 10.0 12.5 5.0 – – 5.0Spring and wire product manufacturing ...... 3326 1,350 30.4 6.7 11.1 8.9 1.5 1.5 1.5
Spring and wire product manufacturing .. 33261 1,350 30.4 6.7 11.1 8.9 1.5 1.5 1.5Spring (light gauge) manufacturing .... 332612 320 25.0 – 18.8 – – – –Other fabricated wire product
manufacturing ................................... 332618 1,020 32.4 8.8 8.8 10.8 2.0 – –Machine shops; turned product; and screw,
nut, and bolt manufacturing ...................... 3327 5,670 26.3 9.0 17.6 6.5 1.2 .4 5.3Machine shops ....................................... 33271 4,240 23.6 10.6 18.9 7.1 .7 – 6.1
See footnotes at end of table.
Page 33

TABLE B1. Percent distribution of nonfatal occupational injuries and illnesses involving days away from work1 by industry andselected natures of injury or illness2, 2006 — Continued
Industry3
Percent of industry case total involving —
Carpaltunnel
syndrome
Tendon-itis
Multiple traumatic injuries anddisorders
Back pain and pain,except back
Allother
natures5Total
Withfractures,
burns,and
otherinjuries
Withsprains
andbruises
Total
Backpain,hurt
back only
Metal stamping ................................... 4.6 – 1.5 – – 3.8 – 18.5Powder metallurgy part manufacturing – – 9.1 9.1 – 13.6 – –
Cutlery and handtool manufacturing .......... 3.2 – 2.1 – – 15.8 6.3 14.7Cutlery and handtool manufacturing ...... 3.2 – 2.1 – – 15.8 6.3 14.7
Cutlery and flatware (except precious)manufacturing ................................... – – – – – 31.6 – 10.5
Hand and edge tool manufacturing .... 4.2 – – – – 16.7 10.4 14.6Saw blade and handsawmanufacturing ................................... – – – – – – – 15.4
Kitchen utensil, pot, and panmanufacturing ................................... – – – – – – – 21.4
Architectural and structural metalsmanufacturing ........................................... 1.1 0.3 3.7 1.1 0.6 4.9 1.2 24.8
Plate work and fabricated structuralproduct manufacturing .......................... .8 – 2.5 .4 .6 3.3 .4 28.5
Prefabricated metal building andcomponent manufacturing ................ – – – – – 5.8 – 20.3
Fabricated structural metalmanufacturing ................................... – – 2.5 – .6 3.1 – 30.7
Plate work manufacturing ................... 1.6 – 3.1 – – 3.1 – 27.3Ornamental and architectural metalproducts manufacturing ........................ 1.6 .8 5.5 2.4 .5 7.1 2.4 19.7
Metal window and door manufacturing 3.6 1.8 5.4 2.7 – 7.2 4.5 11.7Sheet metal work manufacturing ........ – – 3.3 – – 6.6 2.2 23.6Ornamental and architectural metalwork manufacturing .......................... – – 9.0 5.6 – 6.7 – 20.2
Boiler, tank, and shipping containermanufacturing ........................................... 2.0 – 3.5 2.0 – 5.0 1.0 22.1
Power boiler and heat exchangermanufacturing ....................................... – – – – – 9.4 6.2 21.9
Metal tank (heavy gauge) manufacturing 2.5 – 2.5 2.5 – 3.7 – 25.9Metal can, box, and other metalcontainer (light gauge) manufacturing .. – – 4.7 – – 5.9 – 20.0
Metal can manufacturing .................... – – – – – 6.9 – 17.2Other metal container manufacturing – – 5.4 – – 5.4 – 21.4
Hardware manufacturing ............................ 5.0 – – – – 7.5 – 17.5Spring and wire product manufacturing ...... 8.1 – 3.7 – – 7.4 – 19.3
Spring and wire product manufacturing .. 8.1 – 3.7 – – 7.4 – 19.3Spring (light gauge) manufacturing .... 15.6 – 6.2 – – 9.4 – 15.6Other fabricated wire productmanufacturing ................................... 4.9 – 2.9 – – 6.9 – 20.6
Machine shops; turned product; and screw,nut, and bolt manufacturing ...................... 1.4 .7 3.2 1.4 .5 6.5 2.5 21.7
Machine shops ....................................... .7 – 2.8 1.2 – 6.6 2.6 22.9
See footnotes at end of table.
Page 34

TABLE B1. Percent distribution of nonfatal occupational injuries and illnesses involving days away from work1 by industry and selectednatures of injury or illness2, 2006 — Continued
Industry3 NAICScode4
Totalcases
Percent of industry case total involving —
Sprains,strains Fractures Cuts,
punctures Bruises Heatburns
Chemicalburns
Amputa-tions
Turned product and screw, nut, and boltmanufacturing ....................................... 33272 1,430 35.0 4.9 14.0 4.9 2.8 1.4 2.8Precision turned product
manufacturing ................................... 332721 800 40.0 5.0 12.5 3.8 – – 3.8Bolt, nut, screw, rivet, and washer
manufacturing ................................... 332722 630 28.6 4.8 15.9 6.3 6.3 3.2 –Coating, engraving, heat treating, and
allied activities .......................................... 3328 2,330 24.9 7.7 6.9 10.7 1.3 3.9 2.1Coating, engraving, heat treating, and
allied activities ...................................... 33281 2,330 24.9 7.7 6.9 10.7 1.3 3.9 2.1Metal heat treating .............................. 332811 310 32.3 6.5 9.7 16.1 – – –Metal coating, engraving (except
jewelry and silverware), and alliedservices to manufacturers ................ 332812 900 21.1 6.7 7.8 12.2 – 2.2 –
Electroplating, plating, polishing,anodizing, and coloring .................... 332813 1,120 26.8 8.9 5.4 8.9 1.8 6.2 2.7
Other fabricated metal productmanufacturing ........................................... 3329 4,300 32.6 7.0 11.9 8.1 1.2 .7 2.6Metal valve manufacturing ..................... 33291 1,110 34.2 9.9 11.7 8.1 – – –
Industrial valve manufacturing ............ 332911 340 26.5 17.6 5.9 8.8 – – –Fluid power valve and hose fitting
manufacturing ................................... 332912 330 36.4 6.1 9.1 9.1 – – –Plumbing fixture fitting and trim
manufacturing ................................... 332913 120 50.0 – – – – – –Other metal valve and pipe fitting
manufacturing ................................... 332919 310 32.3 9.7 19.4 6.5 – – –All other fabricated metal product
manufacturing ....................................... 33299 3,190 32.0 6.0 12.2 8.2 1.3 .6 3.1Ball and roller bearing manufacturing 332991 390 35.9 7.7 12.8 10.3 – – –Small arms ammunition
manufacturing ................................... 332992 140 21.4 – 14.3 – – – –Ammunition (except small arms)
manufacturing ................................... 332993 40 – – – – – – –Small arms manufacturing .................. 332994 140 35.7 – 14.3 – – – –Fabricated pipe and pipe fitting
manufacturing ................................... 332996 600 26.7 8.3 13.3 5.0 – – 3.3Industrial pattern manufacturing ......... 332997 120 58.3 – – – – – –Enameled iron and metal sanitary
ware manufacturing .......................... 332998 140 50.0 – 21.4 – – – –All other miscellaneous fabricated
metal product manufacturing ............ 332999 1,590 30.8 5.0 11.9 10.1 1.3 – 4.4Machinery manufacturing ............................... 333 16,650 31.7 8.3 13.8 7.1 1.3 .4 1.9
Agriculture, construction, and miningmachinery manufacturing ......................... 3331 4,130 33.9 9.4 11.1 5.6 1.9 – 1.9
See footnotes at end of table.
Page 35

TABLE B1. Percent distribution of nonfatal occupational injuries and illnesses involving days away from work1 by industry andselected natures of injury or illness2, 2006 — Continued
Industry3
Percent of industry case total involving —
Carpaltunnel
syndrome
Tendon-itis
Multiple traumatic injuries anddisorders
Back pain and pain,except back
Allother
natures5Total
Withfractures,
burns,and
otherinjuries
Withsprains
andbruises
Total
Backpain,hurt
back only
Turned product and screw, nut, and boltmanufacturing ....................................... 3.5 2.1 4.9 2.1 1.4 6.3 1.4 18.2
Precision turned productmanufacturing ................................... 3.8 – 2.5 2.5 – 8.8 2.5 18.8
Bolt, nut, screw, rivet, and washermanufacturing ................................... 3.2 – 6.3 – 3.2 3.2 – 17.5
Coating, engraving, heat treating, andallied activities .......................................... 2.6 .9 2.6 .9 .9 5.6 2.1 30.9
Coating, engraving, heat treating, andallied activities ...................................... 2.6 .9 2.6 .9 .9 5.6 2.1 30.9
Metal heat treating .............................. – – – – – – – 25.8Metal coating, engraving (exceptjewelry and silverware), and alliedservices to manufacturers ................ – – 2.2 – – 8.9 3.3 34.4
Electroplating, plating, polishing,anodizing, and coloring .................... 5.4 – 1.8 – – 3.6 1.8 29.5
Other fabricated metal productmanufacturing ........................................... 2.3 .9 4.9 1.2 1.2 5.3 1.6 22.8
Metal valve manufacturing ..................... 3.6 1.8 3.6 – – 3.6 2.7 20.7Industrial valve manufacturing ............ – – 8.8 – – 5.9 5.9 23.5Fluid power valve and hose fittingmanufacturing ................................... – – – – – – – 24.2
Plumbing fixture fitting and trimmanufacturing ................................... – – – – – – – 16.7
Other metal valve and pipe fittingmanufacturing ................................... – – – – – – – 19.4
All other fabricated metal productmanufacturing ....................................... 1.9 .6 5.0 1.3 1.3 6.0 1.3 23.2
Ball and roller bearing manufacturing 5.1 – 5.1 – – 5.1 – 15.4Small arms ammunitionmanufacturing ................................... – – – – – 14.3 – 14.3
Ammunition (except small arms)manufacturing ................................... – – – – – – – –
Small arms manufacturing .................. – – – – – – – 21.4Fabricated pipe and pipe fittingmanufacturing ................................... – – 8.3 – 3.3 11.7 – 23.3
Industrial pattern manufacturing ......... – – – – – – – 33.3Enameled iron and metal sanitaryware manufacturing .......................... – – – – – – – –
All other miscellaneous fabricatedmetal product manufacturing ............ 1.3 – 5.0 1.3 – 3.8 1.3 27.0
Machinery manufacturing ............................... 2.9 .7 3.8 1.3 .5 5.7 1.6 22.3Agriculture, construction, and miningmachinery manufacturing ......................... 2.2 – 2.7 .5 – 4.4 1.0 26.9
See footnotes at end of table.
Page 36

TABLE B1. Percent distribution of nonfatal occupational injuries and illnesses involving days away from work1 by industry and selectednatures of injury or illness2, 2006 — Continued
Industry3 NAICScode4
Totalcases
Percent of industry case total involving —
Sprains,strains Fractures Cuts,
punctures Bruises Heatburns
Chemicalburns
Amputa-tions
Agricultural implement manufacturing .... 33311 1,630 33.7 3.1 12.3 4.9 2.5 – 2.5Farm machinery and equipment
manufacturing ................................... 333111 1,360 32.4 2.9 11.8 3.7 2.9 – 1.5Lawn and garden tractor and home
lawn and garden equipmentmanufacturing ................................... 333112 270 40.7 – 14.8 11.1 – – 7.4
Construction machinery manufacturing .. 33312 1,640 35.4 15.2 7.3 6.7 1.8 – 1.2Mining and oil and gas field machinery
manufacturing ....................................... 33313 860 31.4 10.5 16.3 4.7 2.3 – 2.3Mining machinery and equipment
manufacturing ................................... 333131 280 32.1 7.1 10.7 7.1 – – –Oil and gas field machinery and
equipment manufacturing ................. 333132 580 29.3 12.1 19.0 3.4 – – 3.4Industrial machinery manufacturing ........... 3332 1,580 29.7 7.0 13.3 11.4 – 1.3 –
Sawmill and woodworking machinerymanufacturing ....................................... 33321 110 36.4 – – – – – –
Plastics and rubber industry machinerymanufacturing ....................................... 33322 370 32.4 – 10.8 18.9 – – –
Other industrial machinerymanufacturing ....................................... 33329 1,100 29.1 8.2 13.6 9.1 – 1.8 –Paper industry machinery
manufacturing ................................... 333291 140 21.4 – 14.3 – – – –Textile machinery manufacturing ....... 333292 80 37.5 – – – – – –Printing machinery and equipment
manufacturing ................................... 333293 110 27.3 – 18.2 – – – –Food product machinery
manufacturing ................................... 333294 250 28.0 8.0 12.0 12.0 – – –Semiconductor machinery
manufacturing ................................... 333295 150 40.0 13.3 – – – – –All other industrial machinery
manufacturing ................................... 333298 370 24.3 10.8 21.6 10.8 – – –Commercial and service industry
machinery manufacturing ......................... 3333 1,140 26.3 7.9 14.9 7.0 – – 4.4Commercial and service industry
machinery manufacturing ..................... 33331 1,140 26.3 7.9 14.9 7.0 – – 4.4Automatic vending machine
manufacturing ................................... 333311 60 33.3 – – – – – –Commercial laundry, drycleaning, and
pressing machine manufacturing ..... 333312 80 25.0 – – – – – –Optical instrument and lens
manufacturing ................................... 333314 160 12.5 – 25.0 12.5 – – –Photographic and photocopying
equipment manufacturing ................. 333315 70 28.6 28.6 – – – – –
See footnotes at end of table.
Page 37

TABLE B1. Percent distribution of nonfatal occupational injuries and illnesses involving days away from work1 by industry andselected natures of injury or illness2, 2006 — Continued
Industry3
Percent of industry case total involving —
Carpaltunnel
syndrome
Tendon-itis
Multiple traumatic injuries anddisorders
Back pain and pain,except back
Allother
natures5Total
Withfractures,
burns,and
otherinjuries
Withsprains
andbruises
Total
Backpain,hurt
back only
Agricultural implement manufacturing .... 3.1 – 3.1 – – 4.3 1.2 30.7Farm machinery and equipmentmanufacturing ................................... 2.9 – 3.7 – – 3.7 – 33.8
Lawn and garden tractor and homelawn and garden equipmentmanufacturing ................................... – – – – – 7.4 – 11.1
Construction machinery manufacturing .. 1.8 – 1.8 – – 4.9 1.2 23.8Mining and oil and gas field machinerymanufacturing ....................................... – – 2.3 – – 3.5 – 25.6
Mining machinery and equipmentmanufacturing ................................... – – – – – – – 28.6
Oil and gas field machinery andequipment manufacturing ................. – – – – – 3.4 – 24.1
Industrial machinery manufacturing ........... 3.2 1.3 5.1 2.5 – 5.7 1.9 20.9Sawmill and woodworking machinerymanufacturing ....................................... 18.2 – – – – – – 27.3
Plastics and rubber industry machinerymanufacturing ....................................... – – – – – 8.1 – 24.3
Other industrial machinerymanufacturing ....................................... 2.7 – 7.3 3.6 – 5.5 1.8 19.1
Paper industry machinerymanufacturing ................................... – – – – – – – 14.3
Textile machinery manufacturing ....... – – – – – 25.0 – 25.0Printing machinery and equipmentmanufacturing ................................... – – – – – – – 27.3
Food product machinerymanufacturing ................................... – – – – – – – 20.0
Semiconductor machinerymanufacturing ................................... – – 20.0 20.0 – – – –
All other industrial machinerymanufacturing ................................... – – – – – 5.4 – 21.6
Commercial and service industrymachinery manufacturing ......................... 5.3 – 3.5 1.8 – 7.0 – 20.2
Commercial and service industrymachinery manufacturing ..................... 5.3 – 3.5 1.8 – 7.0 – 20.2
Automatic vending machinemanufacturing ................................... – – – – – – – –
Commercial laundry, drycleaning, andpressing machine manufacturing ..... – – – – – – – 25.0
Optical instrument and lensmanufacturing ................................... – – – – – 18.8 – 25.0
Photographic and photocopyingequipment manufacturing ................. – – – – – – – 28.6
See footnotes at end of table.
Page 38

TABLE B1. Percent distribution of nonfatal occupational injuries and illnesses involving days away from work1 by industry and selectednatures of injury or illness2, 2006 — Continued
Industry3 NAICScode4
Totalcases
Percent of industry case total involving —
Sprains,strains Fractures Cuts,
punctures Bruises Heatburns
Chemicalburns
Amputa-tions
Other commercial and serviceindustry machinery manufacturing ... 333319 650 29.2 7.7 15.4 7.7 – – 4.6
Ventilation, heating, air-conditioning, andcommercial refrigeration equipmentmanufacturing ........................................... 3334 2,100 31.0 10.0 16.2 8.1 1.0 – 1.4Ventilation, heating, air-conditioning,
and commercial refrigerationequipment manufacturing ..................... 33341 2,100 31.0 10.0 16.2 8.1 1.0 – 1.4Air purification equipment
manufacturing ................................... 333411 280 28.6 14.3 14.3 7.1 – – –Industrial and commercial fan and
blower manufacturing ....................... 333412 230 21.7 8.7 30.4 – – – –Heating equipment (except warm air
furnaces) manufacturing ................... 333414 300 26.7 16.7 13.3 – – – –Air-conditioning and warm air heating
equipment and commercial andindustrial refrigeration equipmentmanufacturing ................................... 333415 1,280 34.4 7.8 14.1 10.2 1.6 – 1.6
Metalworking machinery manufacturing ..... 3335 2,710 29.2 7.4 21.0 6.6 1.8 – 2.2Metalworking machinery manufacturing 33351 2,710 29.2 7.4 21.0 6.6 1.8 – 2.2
Industrial mold manufacturing ............ 333511 620 25.8 11.3 17.7 8.1 – – 3.2Machine tool (metal cutting types)
manufacturing ................................... 333512 310 41.9 – 12.9 9.7 – – –Machine tool (metal forming types)
manufacturing ................................... 333513 240 25.0 16.7 29.2 – – – –Special die and tool, die set, jig, and
fixture manufacturing ........................ 333514 850 28.2 4.7 22.4 10.6 3.5 – 2.4Cutting tool and machine tool
accessory manufacturing ................. 333515 400 27.5 5.0 22.5 – – – 5.0Rolling mill machinery and equipment
manufacturing ................................... 333516 90 22.2 22.2 55.6 – – – –Other metalworking machinery
manufacturing ................................... 333518 200 40.0 – – – – – –Engine, turbine, and power transmission
equipment manufacturing ......................... 3336 1,170 40.2 6.8 7.7 8.5 – – –Engine, turbine, and power transmission
equipment manufacturing ..................... 33361 1,170 40.2 6.8 7.7 8.5 – – –Turbine and turbine generator set
units manufacturing .......................... 333611 150 40.0 – – – – – –Speed changer, industrial high-speed
drive, and gear manufacturing .......... 333612 240 37.5 8.3 8.3 8.3 – – –Mechanical power transmission
equipment manufacturing ................. 333613 280 39.3 – 7.1 7.1 – – –
See footnotes at end of table.
Page 39

TABLE B1. Percent distribution of nonfatal occupational injuries and illnesses involving days away from work1 by industry andselected natures of injury or illness2, 2006 — Continued
Industry3
Percent of industry case total involving —
Carpaltunnel
syndrome
Tendon-itis
Multiple traumatic injuries anddisorders
Back pain and pain,except back
Allother
natures5Total
Withfractures,
burns,and
otherinjuries
Withsprains
andbruises
Total
Backpain,hurt
back only
Other commercial and serviceindustry machinery manufacturing ... 3.1 – 3.1 – – 6.2 – 21.5
Ventilation, heating, air-conditioning, andcommercial refrigeration equipmentmanufacturing ........................................... 3.3 – 3.3 1.4 1.0 6.7 1.9 18.1
Ventilation, heating, air-conditioning,and commercial refrigerationequipment manufacturing ..................... 3.3 – 3.3 1.4 1.0 6.7 1.9 18.1
Air purification equipmentmanufacturing ................................... – – – – – – – 21.4
Industrial and commercial fan andblower manufacturing ....................... – – – – – – – 17.4
Heating equipment (except warm airfurnaces) manufacturing ................... – – 6.7 – – 6.7 – 23.3
Air-conditioning and warm air heatingequipment and commercial andindustrial refrigeration equipmentmanufacturing ................................... 3.9 – 3.1 – – 7.0 2.3 15.6
Metalworking machinery manufacturing ..... 1.5 – 6.6 1.8 – 4.4 1.8 18.8Metalworking machinery manufacturing 1.5 – 6.6 1.8 – 4.4 1.8 18.8
Industrial mold manufacturing ............ – – 4.8 3.2 – 6.5 – 21.0Machine tool (metal cutting types)manufacturing ................................... – – 6.5 – – – – 16.1
Machine tool (metal forming types)manufacturing ................................... – – – – – – – 20.8
Special die and tool, die set, jig, andfixture manufacturing ........................ – – 7.1 2.4 – 4.7 – 17.6
Cutting tool and machine toolaccessory manufacturing ................. 5.0 – 5.0 – – – – 27.5
Rolling mill machinery and equipmentmanufacturing ................................... – – – – – – – –
Other metalworking machinerymanufacturing ................................... – – 30.0 – – – – –
Engine, turbine, and power transmissionequipment manufacturing ......................... 2.6 – 3.4 – – 9.4 2.6 18.8
Engine, turbine, and power transmissionequipment manufacturing ..................... 2.6 – 3.4 – – 9.4 2.6 18.8
Turbine and turbine generator setunits manufacturing .......................... – – – – – 13.3 – 20.0
Speed changer, industrial high-speeddrive, and gear manufacturing .......... – – 8.3 – – 8.3 – 20.8
Mechanical power transmissionequipment manufacturing ................. – – – – – 10.7 7.1 25.0
See footnotes at end of table.
Page 40

TABLE B1. Percent distribution of nonfatal occupational injuries and illnesses involving days away from work1 by industry and selectednatures of injury or illness2, 2006 — Continued
Industry3 NAICScode4
Totalcases
Percent of industry case total involving —
Sprains,strains Fractures Cuts,
punctures Bruises Heatburns
Chemicalburns
Amputa-tions
Other engine equipmentmanufacturing ................................... 333618 490 42.9 8.2 6.1 12.2 – – –
Other general purpose machinerymanufacturing ........................................... 3339 3,810 31.0 7.9 12.3 7.1 0.8 0.5 1.3Pump and compressor manufacturing ... 33391 560 32.1 5.4 17.9 8.9 – – –
Pump and pumping equipmentmanufacturing ................................... 333911 280 28.6 7.1 21.4 10.7 – – –
Air and gas compressormanufacturing ................................... 333912 250 36.0 – 12.0 8.0 – – –
Measuring and dispensing pumpmanufacturing ................................... 333913 30 – – – – – – –
Material handling equipmentmanufacturing ....................................... 33392 1,350 28.9 9.6 12.6 8.1 – – 2.2Elevator and moving stairway
manufacturing ................................... 333921 150 33.3 – 13.3 – – – –Conveyor and conveying equipment
manufacturing ................................... 333922 440 31.8 9.1 15.9 9.1 – – –Overhead traveling crane, hoist, and
monorail system manufacturing ....... 333923 280 21.4 10.7 10.7 – – – –Industrial truck, tractor, trailer, and
stacker machinery manufacturing .... 333924 480 29.2 8.3 10.4 10.4 – – –All other general purpose machinery
manufacturing ....................................... 33399 1,910 31.9 7.3 10.5 5.8 – – 1.0Power-driven handtool manufacturing 333991 90 33.3 – – – – – –Welding and soldering equipment
manufacturing ................................... 333992 160 37.5 12.5 – – – – –Packaging machinery manufacturing 333993 220 31.8 – 31.8 9.1 – – –Industrial process furnace and oven
manufacturing ................................... 333994 110 36.4 18.2 – 18.2 – – –Fluid power cylinder and actuator
manufacturing ................................... 333995 290 34.5 – 6.9 – – – –Fluid power pump and motor
manufacturing ................................... 333996 220 36.4 – 9.1 – – – –Scale and balance (except laboratory)
manufacturing ................................... 333997 130 38.5 – – – – – –All other miscellaneous general
purpose machinery manufacturing ... 333999 680 26.5 7.4 7.4 7.4 – – –Computer and electronic productmanufacturing ............................................... 334 6,210 34.0 5.8 9.5 7.4 1.4 1.9 .5Computer and peripheral equipment
manufacturing ........................................... 3341 510 39.2 5.9 3.9 5.9 – – –Computer and peripheral equipment
manufacturing ....................................... 33411 510 39.2 5.9 3.9 5.9 – – –Electronic computer manufacturing .... 334111 240 37.5 – – – – – –
See footnotes at end of table.
Page 41

TABLE B1. Percent distribution of nonfatal occupational injuries and illnesses involving days away from work1 by industry andselected natures of injury or illness2, 2006 — Continued
Industry3
Percent of industry case total involving —
Carpaltunnel
syndrome
Tendon-itis
Multiple traumatic injuries anddisorders
Back pain and pain,except back
Allother
natures5Total
Withfractures,
burns,and
otherinjuries
Withsprains
andbruises
Total
Backpain,hurt
back only
Other engine equipmentmanufacturing ................................... 4.1 – – – – 8.2 – 14.3
Other general purpose machinerymanufacturing ........................................... 3.7 1.8 2.9 1.0 0.5 5.8 1.8 24.9
Pump and compressor manufacturing ... – – – – – 5.4 – 21.4Pump and pumping equipmentmanufacturing ................................... – – – – – – – 21.4
Air and gas compressormanufacturing ................................... – – – – – 8.0 – 24.0
Measuring and dispensing pumpmanufacturing ................................... – – – – – – – –
Material handling equipmentmanufacturing ....................................... 3.7 4.4 2.2 – – 5.2 3.0 22.2
Elevator and moving stairwaymanufacturing ................................... – – – – – – – 20.0
Conveyor and conveying equipmentmanufacturing ................................... – – – – – – – 15.9
Overhead traveling crane, hoist, andmonorail system manufacturing ....... – – – – – – – 35.7
Industrial truck, tractor, trailer, andstacker machinery manufacturing .... 4.2 4.2 – – – 8.3 4.2 22.9
All other general purpose machinerymanufacturing ....................................... 4.2 – 3.7 1.6 – 6.3 1.6 27.7
Power-driven handtool manufacturing – – – – – – – 22.2Welding and soldering equipmentmanufacturing ................................... – – – – – – – 37.5
Packaging machinery manufacturing – – – – – – – 9.1Industrial process furnace and ovenmanufacturing ................................... – – – – – – – –
Fluid power cylinder and actuatormanufacturing ................................... – – 6.9 – – 6.9 – 31.0
Fluid power pump and motormanufacturing ................................... – – 9.1 – – 9.1 – 18.2
Scale and balance (except laboratory)manufacturing ................................... – – – – – – – 46.2
All other miscellaneous generalpurpose machinery manufacturing ... 7.4 – 2.9 – – 7.4 2.9 33.8
Computer and electronic productmanufacturing ............................................... 4.5 1.0 3.9 .8 1.6 8.7 2.3 21.4
Computer and peripheral equipmentmanufacturing ........................................... 3.9 – 5.9 – – 11.8 – 21.6
Computer and peripheral equipmentmanufacturing ....................................... 3.9 – 5.9 – – 11.8 – 21.6
Electronic computer manufacturing .... – – 8.3 – – 12.5 – 20.8
See footnotes at end of table.
Page 42

TABLE B1. Percent distribution of nonfatal occupational injuries and illnesses involving days away from work1 by industry and selectednatures of injury or illness2, 2006 — Continued
Industry3 NAICScode4
Totalcases
Percent of industry case total involving —
Sprains,strains Fractures Cuts,
punctures Bruises Heatburns
Chemicalburns
Amputa-tions
Computer storage devicemanufacturing ................................... 334112 70 42.9 – – – – – –
Computer terminal manufacturing ...... 334113 30 66.7 – – – – – –Other computer peripheral equipment
manufacturing ................................... 334119 180 38.9 – 11.1 – – – –Communications equipment manufacturing 3342 690 44.9 4.3 5.8 5.8 – 2.9 –
Telephone apparatus manufacturing ...... 33421 170 52.9 – – – – – –Radio and television broadcasting and
wireless communications equipmentmanufacturing ....................................... 33422 390 35.9 5.1 7.7 7.7 – – –
Other communications equipmentmanufacturing ....................................... 33429 140 50.0 – – – – – –
Audio and video equipment manufacturing 3343 200 40.0 – 10.0 10.0 – – –Semiconductor and other electronic
component manufacturing ........................ 3344 2,570 31.1 5.8 9.7 8.2 2.7 3.1 –Semiconductor and other electronic
component manufacturing .................... 33441 2,570 31.1 5.8 9.7 8.2 2.7 3.1 –Electron tube manufacturing .............. 334411 130 23.1 – – 23.1 – – –Bare printed circuit board
manufacturing ................................... 334412 290 27.6 6.9 10.3 – – 13.8 –Semiconductor and related device
manufacturing ................................... 334413 730 49.3 4.1 4.1 9.6 – 2.7 –Electronic capacitor manufacturing .... 334414 100 30.0 – – 20.0 – – –Electronic resistor manufacturing ....... 334415 60 33.3 – – – – – –Electronic coil, transformer, and other
inductor manufacturing ..................... 334416 240 – – – – – – –Electronic connector manufacturing ... 334417 180 33.3 11.1 11.1 – – – –Printed circuit assembly (electronic
assembly) manufacturing ................. 334418 320 18.8 12.5 18.8 9.4 – – –Other electronic component
manufacturing ................................... 334419 520 26.9 5.8 17.3 3.8 5.8 – –Navigational, measuring, electromedical,
and control instruments manufacturing .... 3345 2,020 32.2 5.9 12.9 6.9 – 1.0 –Navigational, measuring, electromedical,
and control instruments manufacturing 33451 2,020 32.2 5.9 12.9 6.9 – 1.0 –Electromedical and electrotherapeutic
apparatus manufacturing .................. 334510 240 37.5 – 12.5 – – – –Search, detection, navigation,
guidance, aeronautical, and nauticalsystem and instrumentmanufacturing ................................... 334511 520 38.5 7.7 5.8 9.6 – – –
Automatic environmental controlmanufacturing for residential,commercial, and appliance use ........ 334512 220 27.3 13.6 27.3 – – – –
See footnotes at end of table.
Page 43
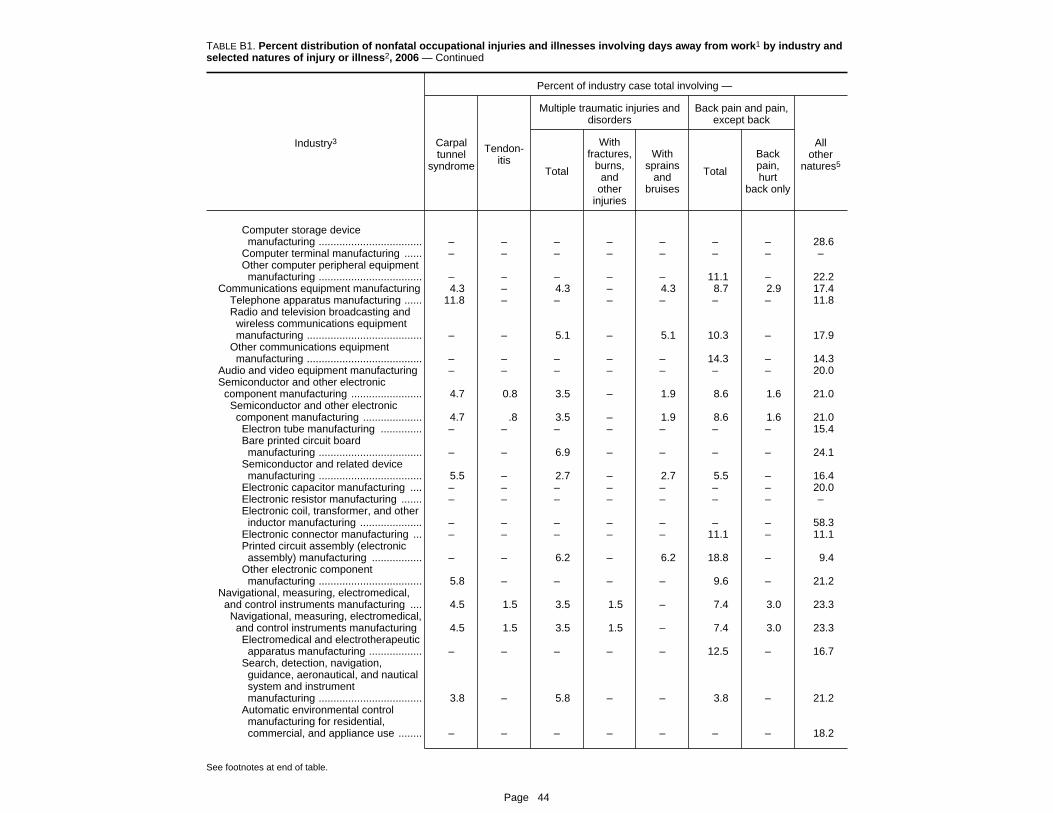
TABLE B1. Percent distribution of nonfatal occupational injuries and illnesses involving days away from work1 by industry andselected natures of injury or illness2, 2006 — Continued
Industry3
Percent of industry case total involving —
Carpaltunnel
syndrome
Tendon-itis
Multiple traumatic injuries anddisorders
Back pain and pain,except back
Allother
natures5Total
Withfractures,
burns,and
otherinjuries
Withsprains
andbruises
Total
Backpain,hurt
back only
Computer storage devicemanufacturing ................................... – – – – – – – 28.6
Computer terminal manufacturing ...... – – – – – – – –Other computer peripheral equipmentmanufacturing ................................... – – – – – 11.1 – 22.2
Communications equipment manufacturing 4.3 – 4.3 – 4.3 8.7 2.9 17.4Telephone apparatus manufacturing ...... 11.8 – – – – – – 11.8Radio and television broadcasting andwireless communications equipmentmanufacturing ....................................... – – 5.1 – 5.1 10.3 – 17.9
Other communications equipmentmanufacturing ....................................... – – – – – 14.3 – 14.3
Audio and video equipment manufacturing – – – – – – – 20.0Semiconductor and other electroniccomponent manufacturing ........................ 4.7 0.8 3.5 – 1.9 8.6 1.6 21.0
Semiconductor and other electroniccomponent manufacturing .................... 4.7 .8 3.5 – 1.9 8.6 1.6 21.0
Electron tube manufacturing .............. – – – – – – – 15.4Bare printed circuit boardmanufacturing ................................... – – 6.9 – – – – 24.1
Semiconductor and related devicemanufacturing ................................... 5.5 – 2.7 – 2.7 5.5 – 16.4
Electronic capacitor manufacturing .... – – – – – – – 20.0Electronic resistor manufacturing ....... – – – – – – – –Electronic coil, transformer, and otherinductor manufacturing ..................... – – – – – – – 58.3
Electronic connector manufacturing ... – – – – – 11.1 – 11.1Printed circuit assembly (electronicassembly) manufacturing ................. – – 6.2 – 6.2 18.8 – 9.4
Other electronic componentmanufacturing ................................... 5.8 – – – – 9.6 – 21.2
Navigational, measuring, electromedical,and control instruments manufacturing .... 4.5 1.5 3.5 1.5 – 7.4 3.0 23.3
Navigational, measuring, electromedical,and control instruments manufacturing 4.5 1.5 3.5 1.5 – 7.4 3.0 23.3
Electromedical and electrotherapeuticapparatus manufacturing .................. – – – – – 12.5 – 16.7
Search, detection, navigation,guidance, aeronautical, and nauticalsystem and instrumentmanufacturing ................................... 3.8 – 5.8 – – 3.8 – 21.2
Automatic environmental controlmanufacturing for residential,commercial, and appliance use ........ – – – – – – – 18.2
See footnotes at end of table.
Page 44

TABLE B1. Percent distribution of nonfatal occupational injuries and illnesses involving days away from work1 by industry and selectednatures of injury or illness2, 2006 — Continued
Industry3 NAICScode4
Totalcases
Percent of industry case total involving —
Sprains,strains Fractures Cuts,
punctures Bruises Heatburns
Chemicalburns
Amputa-tions
Instruments and related productsmanufacturing for measuring,displaying, and controlling industrialprocess variables ............................. 334513 320 28.1 6.2 9.4 9.4 – – –
Totalizing fluid meter and countingdevice manufacturing ....................... 334514 80 50.0 – – – – – –
Instrument manufacturing formeasuring and testing electricity andelectrical signals ............................... 334515 200 15.0 – – 10.0 – – –
Analytical laboratory instrumentmanufacturing ................................... 334516 160 43.8 – – – – – –
Irradiation apparatus manufacturing ... 334517 80 37.5 – – – – – –Watch, clock, and part manufacturing 334518 30 – – – – – – –Other measuring and controlling
device manufacturing ....................... 334519 170 17.6 – 47.1 – – – –Manufacturing and reproducing magnetic
and optical media ..................................... 3346 220 31.8 – – 9.1 – – –Manufacturing and reproducing
magnetic and optical media .................. 33461 220 31.8 – – 9.1 – – –Software reproducing ......................... 334611 50 – – – – – – –Prerecorded compact disc (except
software), tape, and recordreproducing ...................................... 334612 140 35.7 – – 14.3 – – –
Electrical equipment, appliance, andcomponent manufacturing ............................ 335 4,410 35.4 7.0 10.7 8.2 1.6 0.7 1.4Electric lighting equipment manufacturing .. 3351 590 30.5 11.9 11.9 10.2 – – 3.4
Electric lamp bulb and partmanufacturing ....................................... 33511 130 38.5 – – – – – –
Lighting fixture manufacturing ................ 33512 460 28.3 10.9 10.9 10.9 – – 4.3Residential electric lighting fixture
manufacturing ................................... 335121 150 26.7 – 13.3 20.0 – – –Commercial, industrial, and
institutional electric lighting fixturemanufacturing ................................... 335122 230 30.4 17.4 13.0 8.7 – – 8.7
Other lighting equipmentmanufacturing ................................... 335129 80 37.5 – – – – – –
Household appliance manufacturing .......... 3352 650 36.9 7.7 10.8 9.2 – – –Small electrical appliance manufacturing 33521 190 31.6 10.5 – 10.5 – – –
Electric housewares and householdfan manufacturing ............................. 335211 120 33.3 – – 16.7 – – –
Household vacuum cleanermanufacturing ................................... 335212 70 42.9 – – – – – –
Major appliance manufacturing .............. 33522 460 39.1 8.7 10.9 8.7 – – –
See footnotes at end of table.
Page 45

TABLE B1. Percent distribution of nonfatal occupational injuries and illnesses involving days away from work1 by industry andselected natures of injury or illness2, 2006 — Continued
Industry3
Percent of industry case total involving —
Carpaltunnel
syndrome
Tendon-itis
Multiple traumatic injuries anddisorders
Back pain and pain,except back
Allother
natures5Total
Withfractures,
burns,and
otherinjuries
Withsprains
andbruises
Total
Backpain,hurt
back only
Instruments and related productsmanufacturing for measuring,displaying, and controlling industrialprocess variables ............................. – – – – – 12.5 6.2 21.9
Totalizing fluid meter and countingdevice manufacturing ....................... – – – – – – – –
Instrument manufacturing formeasuring and testing electricity andelectrical signals ............................... – – – – – – – 45.0
Analytical laboratory instrumentmanufacturing ................................... – – – – – 12.5 12.5 25.0
Irradiation apparatus manufacturing ... – – – – – – – 25.0Watch, clock, and part manufacturing – – – – – – – –Other measuring and controllingdevice manufacturing ....................... – – – – – – – 29.4
Manufacturing and reproducing magneticand optical media ..................................... – – – – – 22.7 – 18.2
Manufacturing and reproducingmagnetic and optical media .................. – – – – – 22.7 – 18.2
Software reproducing ......................... – – – – – 40.0 – –Prerecorded compact disc (exceptsoftware), tape, and recordreproducing ...................................... – – – – – – – 14.3
Electrical equipment, appliance, andcomponent manufacturing ............................ 3.4 0.9 2.9 0.7 0.9 6.1 1.6 21.8
Electric lighting equipment manufacturing .. – – 3.4 – – 3.4 – 20.3Electric lamp bulb and partmanufacturing ....................................... – – – – – – – –
Lighting fixture manufacturing ................ – – – – – 4.3 – 23.9Residential electric lighting fixturemanufacturing ................................... – – – – – – – 26.7
Commercial, industrial, andinstitutional electric lighting fixturemanufacturing ................................... – – – – – – – 21.7
Other lighting equipmentmanufacturing ................................... – – – – – – – 37.5
Household appliance manufacturing .......... 3.1 – 4.6 – – 10.8 3.1 12.3Small electrical appliance manufacturing – – – – – 15.8 – 10.5
Electric housewares and householdfan manufacturing ............................. – – – – – 16.7 – –
Household vacuum cleanermanufacturing ................................... – – – – – – – 28.6
Major appliance manufacturing .............. – – 4.3 – – 8.7 – 10.9
See footnotes at end of table.
Page 46

TABLE B1. Percent distribution of nonfatal occupational injuries and illnesses involving days away from work1 by industry and selectednatures of injury or illness2, 2006 — Continued
Industry3 NAICScode4
Totalcases
Percent of industry case total involving —
Sprains,strains Fractures Cuts,
punctures Bruises Heatburns
Chemicalburns
Amputa-tions
Household cooking appliancemanufacturing ................................... 335221 180 38.9 – 16.7 11.1 – – –
Other major household appliancemanufacturing ................................... 335228 100 30.0 – 20.0 – – – –
Electrical equipment manufacturing ........... 3353 1,600 38.1 6.9 11.2 7.5 1.9 – –Electrical equipment manufacturing ....... 33531 1,600 38.1 6.9 11.2 7.5 1.9 – –
Power, distribution, and specialtytransformer manufacturing ............... 335311 540 29.6 5.6 18.5 9.3 3.7 – –
Motor and generator manufacturing ... 335312 440 34.1 9.1 11.4 4.5 – – –Switchgear and switchboard
apparatus manufacturing .................. 335313 300 40.0 6.7 6.7 10.0 – – –Relay and industrial control
manufacturing ................................... 335314 320 56.2 – – 6.2 – – –Other electrical equipment and component
manufacturing ........................................... 3359 1,570 33.8 5.1 10.2 8.3 1.3 1.3 1.3Battery manufacturing ............................ 33591 380 26.3 5.3 5.3 – – – –Communication and energy wire and
cable manufacturing ............................. 33592 240 33.3 8.3 8.3 8.3 – – –Fiber optic cable manufacturing ......... 335921 50 – – – – – – –Other communication and energy wire
manufacturing ................................... 335929 190 36.8 – – 10.5 – – –Wiring device manufacturing .................. 33593 710 38.0 4.2 12.7 11.3 – 2.8 –
Current-carrying wiring devicemanufacturing ................................... 335931 500 38.0 4.0 12.0 12.0 – – –
Noncurrent-carrying wiring devicemanufacturing ................................... 335932 210 33.3 – 14.3 9.5 – – –
All other electrical equipment andcomponent manufacturing .................... 33599 240 33.3 – 12.5 – – – –Carbon and graphite product
manufacturing ................................... 335991 50 40.0 – – – – – –All other miscellaneous electrical
equipment and componentmanufacturing ................................... 335999 190 31.6 – 10.5 – – – –
Transportation equipment manufacturing ....... 336 28,070 37.5 7.0 8.8 9.4 .9 .4 .9Motor vehicle manufacturing ...................... 3361 4,200 42.4 6.4 6.2 7.1 – – –
Automobile and light duty motor vehiclemanufacturing ....................................... 33611 3,170 40.1 4.7 5.4 6.6 – – –Automobile manufacturing .................. 336111 2,130 38.0 4.7 5.2 7.0 – – –Light truck and utility vehicle
manufacturing ................................... 336112 1,040 43.3 4.8 5.8 6.7 – – –Heavy duty truck manufacturing ............. 33612 1,030 50.5 11.7 8.7 8.7 – – –
Motor vehicle body and trailermanufacturing ........................................... 3362 4,200 39.0 8.1 11.4 8.3 1.4 – 1.2
See footnotes at end of table.
Page 47
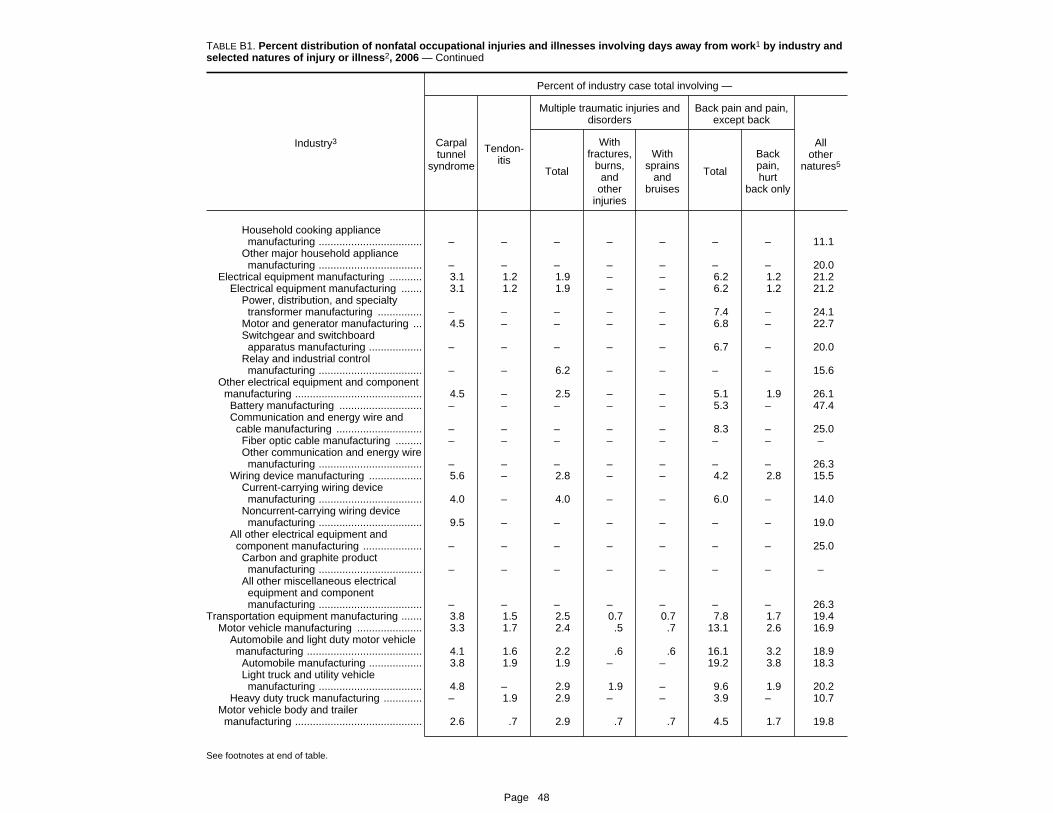
TABLE B1. Percent distribution of nonfatal occupational injuries and illnesses involving days away from work1 by industry andselected natures of injury or illness2, 2006 — Continued
Industry3
Percent of industry case total involving —
Carpaltunnel
syndrome
Tendon-itis
Multiple traumatic injuries anddisorders
Back pain and pain,except back
Allother
natures5Total
Withfractures,
burns,and
otherinjuries
Withsprains
andbruises
Total
Backpain,hurt
back only
Household cooking appliancemanufacturing ................................... – – – – – – – 11.1
Other major household appliancemanufacturing ................................... – – – – – – – 20.0
Electrical equipment manufacturing ........... 3.1 1.2 1.9 – – 6.2 1.2 21.2Electrical equipment manufacturing ....... 3.1 1.2 1.9 – – 6.2 1.2 21.2
Power, distribution, and specialtytransformer manufacturing ............... – – – – – 7.4 – 24.1
Motor and generator manufacturing ... 4.5 – – – – 6.8 – 22.7Switchgear and switchboardapparatus manufacturing .................. – – – – – 6.7 – 20.0
Relay and industrial controlmanufacturing ................................... – – 6.2 – – – – 15.6
Other electrical equipment and componentmanufacturing ........................................... 4.5 – 2.5 – – 5.1 1.9 26.1
Battery manufacturing ............................ – – – – – 5.3 – 47.4Communication and energy wire andcable manufacturing ............................. – – – – – 8.3 – 25.0
Fiber optic cable manufacturing ......... – – – – – – – –Other communication and energy wiremanufacturing ................................... – – – – – – – 26.3
Wiring device manufacturing .................. 5.6 – 2.8 – – 4.2 2.8 15.5Current-carrying wiring devicemanufacturing ................................... 4.0 – 4.0 – – 6.0 – 14.0
Noncurrent-carrying wiring devicemanufacturing ................................... 9.5 – – – – – – 19.0
All other electrical equipment andcomponent manufacturing .................... – – – – – – – 25.0
Carbon and graphite productmanufacturing ................................... – – – – – – – –
All other miscellaneous electricalequipment and componentmanufacturing ................................... – – – – – – – 26.3
Transportation equipment manufacturing ....... 3.8 1.5 2.5 0.7 0.7 7.8 1.7 19.4Motor vehicle manufacturing ...................... 3.3 1.7 2.4 .5 .7 13.1 2.6 16.9
Automobile and light duty motor vehiclemanufacturing ....................................... 4.1 1.6 2.2 .6 .6 16.1 3.2 18.9
Automobile manufacturing .................. 3.8 1.9 1.9 – – 19.2 3.8 18.3Light truck and utility vehiclemanufacturing ................................... 4.8 – 2.9 1.9 – 9.6 1.9 20.2
Heavy duty truck manufacturing ............. – 1.9 2.9 – – 3.9 – 10.7Motor vehicle body and trailermanufacturing ........................................... 2.6 .7 2.9 .7 .7 4.5 1.7 19.8
See footnotes at end of table.
Page 48

TABLE B1. Percent distribution of nonfatal occupational injuries and illnesses involving days away from work1 by industry and selectednatures of injury or illness2, 2006 — Continued
Industry3 NAICScode4
Totalcases
Percent of industry case total involving —
Sprains,strains Fractures Cuts,
punctures Bruises Heatburns
Chemicalburns
Amputa-tions
Motor vehicle body and trailermanufacturing ....................................... 33621 4,200 39.0 8.1 11.4 8.3 1.4 – 1.2Motor vehicle body manufacturing ..... 336211 1,540 40.3 5.8 11.7 7.1 2.6 – –Truck trailer manufacturing ................. 336212 1,030 33.0 10.7 11.7 9.7 1.9 – 1.9Motor home manufacturing ................ 336213 500 52.0 8.0 12.0 6.0 – – –Travel trailer and camper
manufacturing ................................... 336214 1,130 38.1 9.7 10.6 8.8 – – 1.8Motor vehicle parts manufacturing ............. 3363 9,760 36.1 8.2 9.1 8.5 .9 0.4 1.5
Motor vehicle gasoline engine andengine parts manufacturing .................. 33631 910 34.1 7.7 8.8 6.6 – – 2.2Carburetor, piston, piston ring, and
valve manufacturing ......................... 336311 140 42.9 – – – – – –Gasoline engine and engine parts
manufacturing ................................... 336312 770 33.8 7.8 9.1 6.5 – – 2.6Motor vehicle electrical and electronic
equipment manufacturing ..................... 33632 920 39.1 6.5 7.6 8.7 2.2 – –Vehicular lighting equipment
manufacturing ................................... 336321 260 38.5 – – 7.7 – – –Other motor vehicle electrical and
electronic equipment manufacturing 336322 660 39.4 7.6 7.6 7.6 – – –Motor vehicle steering and suspension
components (except spring)manufacturing ....................................... 33633 640 37.5 14.1 9.4 6.2 – – –
Motor vehicle brake systemmanufacturing ....................................... 33634 540 33.3 11.1 9.3 9.3 – – –
Motor vehicle transmission and powertrain parts manufacturing ...................... 33635 1,640 43.9 6.7 6.7 7.9 – – 1.8
Motor vehicle seating and interior trimmanufacturing ....................................... 33636 910 39.6 5.5 5.5 7.7 – – –
Motor vehicle metal stamping ................. 33637 1,860 28.5 6.5 17.7 8.6 – – 2.2Other motor vehicle parts manufacturing 33639 2,340 34.6 10.3 6.4 10.7 1.3 – 1.7
Motor vehicle air-conditioningmanufacturing ................................... 336391 170 29.4 – – 23.5 – – –
All other motor vehicle partsmanufacturing ................................... 336399 2,170 34.6 10.1 6.9 9.7 1.4 – 1.8
Aerospace product and partsmanufacturing ........................................... 3364 4,340 35.3 4.4 9.0 10.4 – – .7Aerospace product and parts
manufacturing ....................................... 33641 4,340 35.3 4.4 9.0 10.4 – – .7Aircraft manufacturing ........................ 336411 2,250 34.2 4.0 7.6 12.9 – – –Aircraft engine and engine parts
manufacturing ................................... 336412 740 32.4 4.1 13.5 9.5 – – –Other aircraft parts and auxiliary
equipment manufacturing ................. 336413 1,110 36.9 4.5 9.9 7.2 – – –
See footnotes at end of table.
Page 49
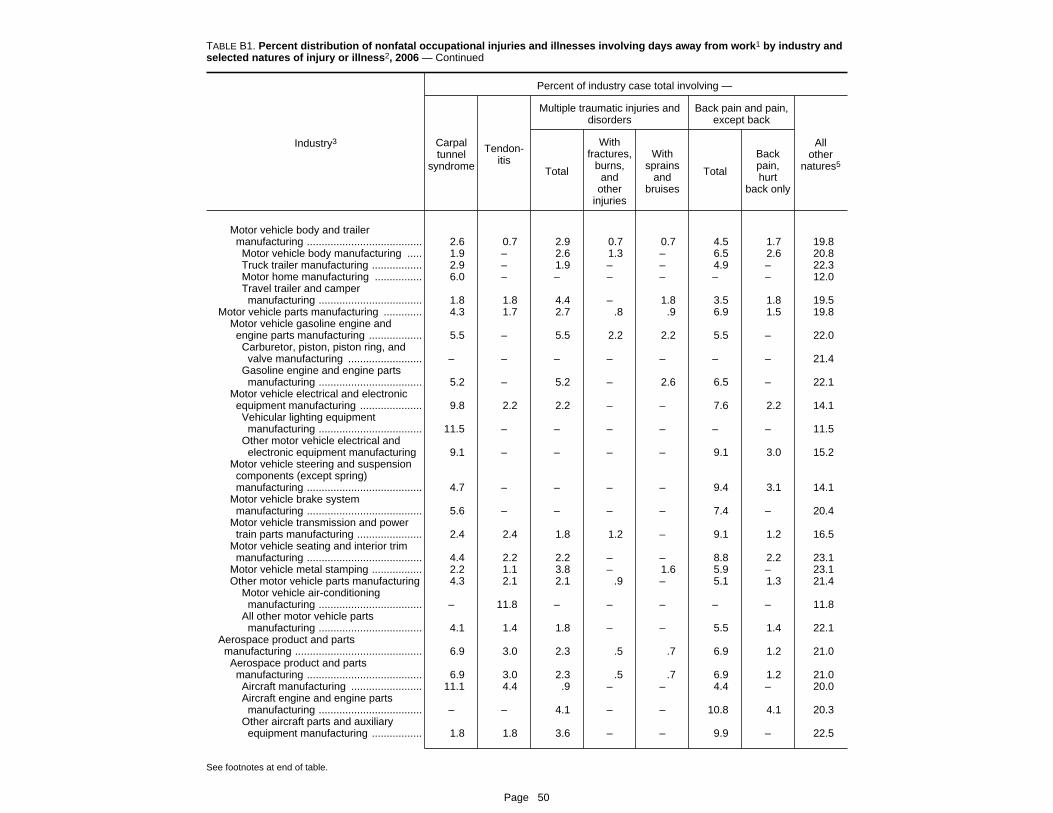
TABLE B1. Percent distribution of nonfatal occupational injuries and illnesses involving days away from work1 by industry andselected natures of injury or illness2, 2006 — Continued
Industry3
Percent of industry case total involving —
Carpaltunnel
syndrome
Tendon-itis
Multiple traumatic injuries anddisorders
Back pain and pain,except back
Allother
natures5Total
Withfractures,
burns,and
otherinjuries
Withsprains
andbruises
Total
Backpain,hurt
back only
Motor vehicle body and trailermanufacturing ....................................... 2.6 0.7 2.9 0.7 0.7 4.5 1.7 19.8
Motor vehicle body manufacturing ..... 1.9 – 2.6 1.3 – 6.5 2.6 20.8Truck trailer manufacturing ................. 2.9 – 1.9 – – 4.9 – 22.3Motor home manufacturing ................ 6.0 – – – – – – 12.0Travel trailer and campermanufacturing ................................... 1.8 1.8 4.4 – 1.8 3.5 1.8 19.5
Motor vehicle parts manufacturing ............. 4.3 1.7 2.7 .8 .9 6.9 1.5 19.8Motor vehicle gasoline engine andengine parts manufacturing .................. 5.5 – 5.5 2.2 2.2 5.5 – 22.0
Carburetor, piston, piston ring, andvalve manufacturing ......................... – – – – – – – 21.4
Gasoline engine and engine partsmanufacturing ................................... 5.2 – 5.2 – 2.6 6.5 – 22.1
Motor vehicle electrical and electronicequipment manufacturing ..................... 9.8 2.2 2.2 – – 7.6 2.2 14.1
Vehicular lighting equipmentmanufacturing ................................... 11.5 – – – – – – 11.5
Other motor vehicle electrical andelectronic equipment manufacturing 9.1 – – – – 9.1 3.0 15.2
Motor vehicle steering and suspensioncomponents (except spring)manufacturing ....................................... 4.7 – – – – 9.4 3.1 14.1
Motor vehicle brake systemmanufacturing ....................................... 5.6 – – – – 7.4 – 20.4
Motor vehicle transmission and powertrain parts manufacturing ...................... 2.4 2.4 1.8 1.2 – 9.1 1.2 16.5
Motor vehicle seating and interior trimmanufacturing ....................................... 4.4 2.2 2.2 – – 8.8 2.2 23.1
Motor vehicle metal stamping ................. 2.2 1.1 3.8 – 1.6 5.9 – 23.1Other motor vehicle parts manufacturing 4.3 2.1 2.1 .9 – 5.1 1.3 21.4
Motor vehicle air-conditioningmanufacturing ................................... – 11.8 – – – – – 11.8
All other motor vehicle partsmanufacturing ................................... 4.1 1.4 1.8 – – 5.5 1.4 22.1
Aerospace product and partsmanufacturing ........................................... 6.9 3.0 2.3 .5 .7 6.9 1.2 21.0
Aerospace product and partsmanufacturing ....................................... 6.9 3.0 2.3 .5 .7 6.9 1.2 21.0
Aircraft manufacturing ........................ 11.1 4.4 .9 – – 4.4 – 20.0Aircraft engine and engine partsmanufacturing ................................... – – 4.1 – – 10.8 4.1 20.3
Other aircraft parts and auxiliaryequipment manufacturing ................. 1.8 1.8 3.6 – – 9.9 – 22.5
See footnotes at end of table.
Page 50

TABLE B1. Percent distribution of nonfatal occupational injuries and illnesses involving days away from work1 by industry and selectednatures of injury or illness2, 2006 — Continued
Industry3 NAICScode4
Totalcases
Percent of industry case total involving —
Sprains,strains Fractures Cuts,
punctures Bruises Heatburns
Chemicalburns
Amputa-tions
Guided missile and space vehiclemanufacturing ................................... 336414 150 40.0 – – – – – –
Guided missile and space vehiclepropulsion unit and propulsion unitparts manufacturing .......................... 336415 60 50.0 – – – – – –
Other guided missile and spacevehicle parts and auxiliaryequipment manufacturing ................. 336419 30 – – – – – – –
Railroad rolling stock manufacturing .......... 3365 380 34.2 10.5 7.9 10.5 – – –Ship and boat building ................................ 3366 4,460 37.9 6.5 8.3 14.3 1.6 1.1 0.4
Ship and boat building ............................ 33661 4,460 37.9 6.5 8.3 14.3 1.6 1.1 .4Ship building and repairing ................. 336611 3,180 40.3 6.6 6.9 17.3 1.6 .6 –Boat building ....................................... 336612 1,280 31.2 6.2 11.7 7.8 1.6 1.6 –
Other transportation equipmentmanufacturing ........................................... 3369 720 36.1 4.2 9.7 5.6 – – –Other transportation equipment
manufacturing ....................................... 33699 720 36.1 4.2 9.7 5.6 – – –Motorcycle, bicycle, and parts
manufacturing ................................... 336991 310 32.3 6.5 6.5 – – – –All other transportation equipment
manufacturing ................................... 336999 220 27.3 – 9.1 – – – –Furniture and related product manufacturing 337 9,690 30.1 9.5 20.6 5.7 .5 .5 2.7
Household and institutional furniture andkitchen cabinet manufacturing .................. 3371 6,570 28.0 10.8 21.2 5.9 .5 .6 3.2Wood kitchen cabinet and countertop
manufacturing ....................................... 33711 3,770 25.2 12.2 22.3 5.6 – .8 3.2Household and institutional furniture
manufacturing ....................................... 33712 2,790 31.9 9.0 20.1 6.5 .7 – 3.2Upholstered household furniture
manufacturing ................................... 337121 910 38.5 7.7 13.2 7.7 – – –Nonupholstered wood household
furniture manufacturing .................... 337122 1,080 27.8 13.0 24.1 5.6 – – 4.6Metal household furniture
manufacturing ................................... 337124 140 35.7 – 21.4 – – – –Household furniture (except wood and
metal) manufacturing ........................ 337125 140 14.3 14.3 14.3 14.3 – – –Institutional furniture manufacturing ... 337127 420 35.7 4.8 19.0 4.8 4.8 – –
Office furniture (including fixtures)manufacturing ........................................... 3372 2,410 31.5 7.5 18.7 5.4 .8 – 2.1Office furniture (including fixtures)
manufacturing ....................................... 33721 2,410 31.5 7.5 18.7 5.4 .8 – 2.1Wood office furniture manufacturing .. 337211 430 34.9 4.7 11.6 – – – –Custom architectural woodwork and
millwork manufacturing ..................... 337212 520 32.7 7.7 25.0 7.7 – – –
See footnotes at end of table.
Page 51

TABLE B1. Percent distribution of nonfatal occupational injuries and illnesses involving days away from work1 by industry andselected natures of injury or illness2, 2006 — Continued
Industry3
Percent of industry case total involving —
Carpaltunnel
syndrome
Tendon-itis
Multiple traumatic injuries anddisorders
Back pain and pain,except back
Allother
natures5Total
Withfractures,
burns,and
otherinjuries
Withsprains
andbruises
Total
Backpain,hurt
back only
Guided missile and space vehiclemanufacturing ................................... – – – – – – – 26.7
Guided missile and space vehiclepropulsion unit and propulsion unitparts manufacturing .......................... – – – – – – – –
Other guided missile and spacevehicle parts and auxiliaryequipment manufacturing ................. – – – – – – – –
Railroad rolling stock manufacturing .......... – – 5.3 – – 5.3 – 18.4Ship and boat building ................................ 1.8 – 1.8 0.4 0.7 7.6 1.3 18.6
Ship and boat building ............................ 1.8 – 1.8 .4 .7 7.6 1.3 18.6Ship building and repairing ................. .6 – 1.3 – – 6.3 .9 17.9Boat building ....................................... 4.7 – 3.1 – 1.6 10.9 3.1 20.3
Other transportation equipmentmanufacturing ........................................... – – 2.8 – – 19.4 4.2 20.8
Other transportation equipmentmanufacturing ....................................... – – 2.8 – – 19.4 4.2 20.8
Motorcycle, bicycle, and partsmanufacturing ................................... – – – – – 29.0 6.5 16.1
All other transportation equipmentmanufacturing ................................... – – – – – 18.2 – 27.3
Furniture and related product manufacturing 2.4 0.9 2.0 .8 .4 11.1 6.3 13.9Household and institutional furniture andkitchen cabinet manufacturing .................. 2.3 .9 2.0 .9 .5 11.9 7.8 12.5
Wood kitchen cabinet and countertopmanufacturing ....................................... 2.1 .5 1.3 .5 – 13.8 10.1 12.7
Household and institutional furnituremanufacturing ....................................... 2.5 1.4 2.9 1.4 .7 9.3 4.7 12.2
Upholstered household furnituremanufacturing ................................... 5.5 3.3 – – – 8.8 5.5 12.1
Nonupholstered wood householdfurniture manufacturing .................... – – 2.8 – – 7.4 4.6 13.9
Metal household furnituremanufacturing ................................... – – – – – – – 14.3
Household furniture (except wood andmetal) manufacturing ........................ – – – – – 42.9 14.3 –
Institutional furniture manufacturing ... – – 4.8 – – 7.1 – 16.7Office furniture (including fixtures)manufacturing ........................................... 2.9 .8 2.1 – – 10.4 3.3 18.3
Office furniture (including fixtures)manufacturing ....................................... 2.9 .8 2.1 – – 10.4 3.3 18.3
Wood office furniture manufacturing .. 4.7 – 4.7 – – 16.3 11.6 18.6Custom architectural woodwork andmillwork manufacturing ..................... – – – – – 15.4 – 9.6
See footnotes at end of table.
Page 52

TABLE B1. Percent distribution of nonfatal occupational injuries and illnesses involving days away from work1 by industry and selectednatures of injury or illness2, 2006 — Continued
Industry3 NAICScode4
Totalcases
Percent of industry case total involving —
Sprains,strains Fractures Cuts,
punctures Bruises Heatburns
Chemicalburns
Amputa-tions
Office furniture (except wood)manufacturing ................................... 337214 240 41.7 8.3 16.7 8.3 – – –
Showcase, partition, shelving, andlocker manufacturing ........................ 337215 1,220 28.7 8.2 18.9 4.1 1.6 – 3.3
Other furniture related productmanufacturing ........................................... 3379 710 45.1 4.2 21.1 5.6 – – –Mattress manufacturing .......................... 33791 510 43.1 5.9 19.6 5.9 – – –Blind and shade manufacturing .............. 33792 210 47.6 – 23.8 – – – –
Miscellaneous manufacturing ......................... 339 6,120 32.8 8.5 12.6 7.0 1.0 0.7 .8Medical equipment and supplies
manufacturing ........................................... 3391 2,220 33.3 5.0 9.9 9.0 .9 .9 .9Medical equipment and supplies
manufacturing ....................................... 33911 2,220 33.3 5.0 9.9 9.0 .9 .9 .9Laboratory apparatus and furniture
manufacturing ................................... 339111 110 36.4 – 18.2 – – – –Surgical and medical instrument
manufacturing ................................... 339112 750 34.7 5.3 6.7 12.0 – – –Surgical appliance and supplies
manufacturing ................................... 339113 760 38.2 5.3 15.8 3.9 – – –Dental equipment and supplies
manufacturing ................................... 339114 110 36.4 – – – – – –Ophthalmic goods manufacturing ....... 339115 250 40.0 – – – – – –Dental laboratories ............................. 339116 240 – – – 25.0 – – –
Other miscellaneous manufacturing ........... 3399 3,900 32.6 10.8 14.1 5.9 .8 .5 .8Jewelry and silverware manufacturing ... 33991 310 29.0 9.7 12.9 6.5 – – –
Jewelry (except costume)manufacturing ................................... 339911 190 26.3 10.5 15.8 10.5 – – –
Silverware and hollowwaremanufacturing ................................... 339912 20 – – – – – – –
Jewelers’ material and lapidary workmanufacturing ................................... 339913 40 – – – – – – –
Costume jewelry and noveltymanufacturing ................................... 339914 60 50.0 – – – – – –
Sporting and athletic goodsmanufacturing ....................................... 33992 690 37.7 7.2 13.0 5.8 – – –
Doll, toy, and game manufacturing ......... 33993 130 38.5 15.4 – – – – –Office supplies (except paper)
manufacturing ....................................... 33994 270 33.3 – 14.8 – – – –Pen and mechanical pencil
manufacturing ................................... 339941 60 33.3 – – – – – –Lead pencil and art good
manufacturing ................................... 339942 70 42.9 – – – – – –Marking device manufacturing ........... 339943 80 37.5 – 37.5 – – – –
See footnotes at end of table.
Page 53
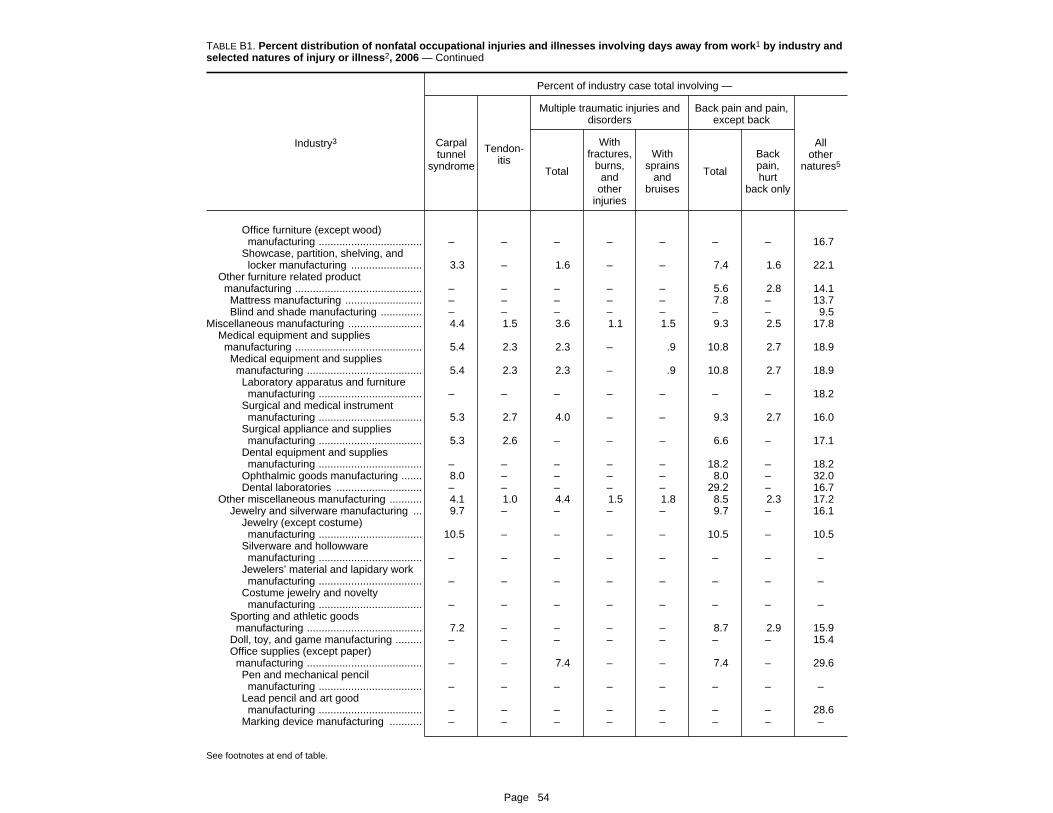
TABLE B1. Percent distribution of nonfatal occupational injuries and illnesses involving days away from work1 by industry andselected natures of injury or illness2, 2006 — Continued
Industry3
Percent of industry case total involving —
Carpaltunnel
syndrome
Tendon-itis
Multiple traumatic injuries anddisorders
Back pain and pain,except back
Allother
natures5Total
Withfractures,
burns,and
otherinjuries
Withsprains
andbruises
Total
Backpain,hurt
back only
Office furniture (except wood)manufacturing ................................... – – – – – – – 16.7
Showcase, partition, shelving, andlocker manufacturing ........................ 3.3 – 1.6 – – 7.4 1.6 22.1
Other furniture related productmanufacturing ........................................... – – – – – 5.6 2.8 14.1
Mattress manufacturing .......................... – – – – – 7.8 – 13.7Blind and shade manufacturing .............. – – – – – – – 9.5
Miscellaneous manufacturing ......................... 4.4 1.5 3.6 1.1 1.5 9.3 2.5 17.8Medical equipment and suppliesmanufacturing ........................................... 5.4 2.3 2.3 – .9 10.8 2.7 18.9
Medical equipment and suppliesmanufacturing ....................................... 5.4 2.3 2.3 – .9 10.8 2.7 18.9
Laboratory apparatus and furnituremanufacturing ................................... – – – – – – – 18.2
Surgical and medical instrumentmanufacturing ................................... 5.3 2.7 4.0 – – 9.3 2.7 16.0
Surgical appliance and suppliesmanufacturing ................................... 5.3 2.6 – – – 6.6 – 17.1
Dental equipment and suppliesmanufacturing ................................... – – – – – 18.2 – 18.2
Ophthalmic goods manufacturing ....... 8.0 – – – – 8.0 – 32.0Dental laboratories ............................. – – – – – 29.2 – 16.7
Other miscellaneous manufacturing ........... 4.1 1.0 4.4 1.5 1.8 8.5 2.3 17.2Jewelry and silverware manufacturing ... 9.7 – – – – 9.7 – 16.1
Jewelry (except costume)manufacturing ................................... 10.5 – – – – 10.5 – 10.5
Silverware and hollowwaremanufacturing ................................... – – – – – – – –
Jewelers’ material and lapidary workmanufacturing ................................... – – – – – – – –
Costume jewelry and noveltymanufacturing ................................... – – – – – – – –
Sporting and athletic goodsmanufacturing ....................................... 7.2 – – – – 8.7 2.9 15.9
Doll, toy, and game manufacturing ......... – – – – – – – 15.4Office supplies (except paper)manufacturing ....................................... – – 7.4 – – 7.4 – 29.6
Pen and mechanical pencilmanufacturing ................................... – – – – – – – –
Lead pencil and art goodmanufacturing ................................... – – – – – – – 28.6
Marking device manufacturing ........... – – – – – – – –
See footnotes at end of table.
Page 54

TABLE B1. Percent distribution of nonfatal occupational injuries and illnesses involving days away from work1 by industry and selectednatures of injury or illness2, 2006 — Continued
Industry3 NAICScode4
Totalcases
Percent of industry case total involving —
Sprains,strains Fractures Cuts,
punctures Bruises Heatburns
Chemicalburns
Amputa-tions
Carbon paper and inked ribbonmanufacturing ................................... 339944 50 – – – – – – –
Sign manufacturing ................................ 33995 1,060 28.3 16.0 15.1 2.8 – – –All other miscellaneous manufacturing ... 33999 1,450 32.4 9.7 14.5 7.6 1.4 – 1.4
Gasket, packing, and sealing devicemanufacturing ................................... 339991 360 33.3 8.3 11.1 5.6 – – –
Musical instrument manufacturing ...... 339992 200 15.0 15.0 15.0 15.0 – – –Fastener, button, needle, and pin
manufacturing ................................... 339993 70 28.6 – 42.9 – – – –Broom, brush, and mop
manufacturing ................................... 339994 100 30.0 – 20.0 – – – –Burial casket manufacturing ............... 339995 80 37.5 – – – – – –All other miscellaneous manufacturing 339999 650 36.9 9.2 13.8 7.7 – – –
Service providing ............................. 803,060 42.8 7.0 8.0 9.0 1.5 0.6 .3
Trade, transportation, and utilities9 .... 354,510 44.4 7.6 8.0 9.5 .7 .5 .4
Wholesale trade ........................................ 42 75,700 41.3 8.2 8.5 9.0 .9 1.0 .5
Merchant wholesalers, durable goods ............ 423 34,860 36.7 9.1 9.7 7.4 1.5 .6 .7Motor vehicle and motor vehicle parts and
supplies merchant wholesalers ................ 4231 4,790 42.0 11.1 6.5 5.8 – – –Furniture and home furnishing merchant
wholesalers .............................................. 4232 1,440 23.6 16.0 9.0 9.0 – – –Lumber and other construction materials
merchant wholesalers .............................. 4233 5,280 36.4 14.8 12.7 4.9 – – .4Professional and commercial equipment
and supplies merchant wholesalers ......... 4234 3,930 40.2 4.3 9.4 9.2 3.3 – 1.5Metal and mineral (except petroleum)
merchant wholesalers .............................. 4235 2,150 32.6 14.9 14.9 7.4 1.4 – 2.3Electrical goods merchant wholesalers ...... 4236 2,210 37.6 13.1 10.0 10.0 – – –Hardware, and plumbing and heating
equipment and supplies merchantwholesalers .............................................. 4237 3,140 43.0 5.7 7.3 9.2 – – –
Machinery, equipment, and suppliesmerchant wholesalers .............................. 4238 9,250 35.1 5.1 8.4 7.6 3.1 1.5 .9
Miscellaneous durable goods merchantwholesalers .............................................. 4239 2,660 30.8 7.5 12.8 7.1 1.9 1.5 1.9
Merchant wholesalers, nondurable goods ...... 424 37,340 44.3 7.6 7.2 10.9 .4 1.4 .3Paper and paper product merchant
wholesalers .............................................. 4241 2,410 37.8 10.8 7.9 6.2 – – –Drugs and druggists’ sundries merchant
wholesalers .............................................. 4242 1,840 53.3 2.7 4.3 9.2 – – –
See footnotes at end of table.
Page 55

TABLE B1. Percent distribution of nonfatal occupational injuries and illnesses involving days away from work1 by industry andselected natures of injury or illness2, 2006 — Continued
Industry3
Percent of industry case total involving —
Carpaltunnel
syndrome
Tendon-itis
Multiple traumatic injuries anddisorders
Back pain and pain,except back
Allother
natures5Total
Withfractures,
burns,and
otherinjuries
Withsprains
andbruises
Total
Backpain,hurt
back only
Carbon paper and inked ribbonmanufacturing ................................... – – – – – – – 60.0
Sign manufacturing ................................ – – 5.7 – 4.7 10.4 3.8 18.9All other miscellaneous manufacturing ... 4.1 1.4 4.1 2.8 – 6.9 2.1 14.5
Gasket, packing, and sealing devicemanufacturing ................................... 5.6 – – – – 5.6 – 19.4
Musical instrument manufacturing ...... – – – – – 10.0 – 20.0Fastener, button, needle, and pinmanufacturing ................................... – – – – – – – –
Broom, brush, and mopmanufacturing ................................... – – – – – – – –
Burial casket manufacturing ............... – – 25.0 – – – – –All other miscellaneous manufacturing 4.6 – 3.1 – – 9.2 – 10.8
Service providing ............................. .9 .3 4.0 .8 1.7 9.6 3.3 16.0
Trade, transportation, and utilities9 .... .8 .3 3.8 .7 1.4 8.8 3.1 15.4
Wholesale trade ........................................ 1.2 .2 3.9 .7 1.8 9.4 3.7 15.9
Merchant wholesalers, durable goods ............ 1.5 .2 4.7 .9 2.2 9.7 3.9 18.1Motor vehicle and motor vehicle parts andsupplies merchant wholesalers ................ 1.5 – 4.6 – 2.9 6.5 3.1 21.5
Furniture and home furnishing merchantwholesalers .............................................. 6.9 – 1.4 – – 22.9 18.8 10.4
Lumber and other construction materialsmerchant wholesalers .............................. .8 – 4.2 1.3 1.1 12.1 5.3 13.8
Professional and commercial equipmentand supplies merchant wholesalers ......... 1.5 – 2.5 1.5 .5 12.2 1.8 15.8
Metal and mineral (except petroleum)merchant wholesalers .............................. 2.8 – 5.1 – – 2.3 1.4 15.8
Electrical goods merchant wholesalers ...... 3.6 – 10.0 – 7.7 8.1 7.2 7.7Hardware, and plumbing and heatingequipment and supplies merchantwholesalers .............................................. 1.0 – 8.3 – 7.0 11.1 1.3 14.0
Machinery, equipment, and suppliesmerchant wholesalers .............................. .8 .2 2.6 .3 1.1 9.8 3.4 24.6
Miscellaneous durable goods merchantwholesalers .............................................. .8 – 9.0 4.1 1.5 5.6 2.3 21.1
Merchant wholesalers, nondurable goods ...... .9 .3 3.2 .6 1.5 9.5 3.9 14.0Paper and paper product merchantwholesalers .............................................. 5.0 – 5.4 1.7 2.1 8.7 .8 15.8
Drugs and druggists’ sundries merchantwholesalers .............................................. – – 4.3 – 2.7 9.8 3.8 15.2
See footnotes at end of table.
Page 56
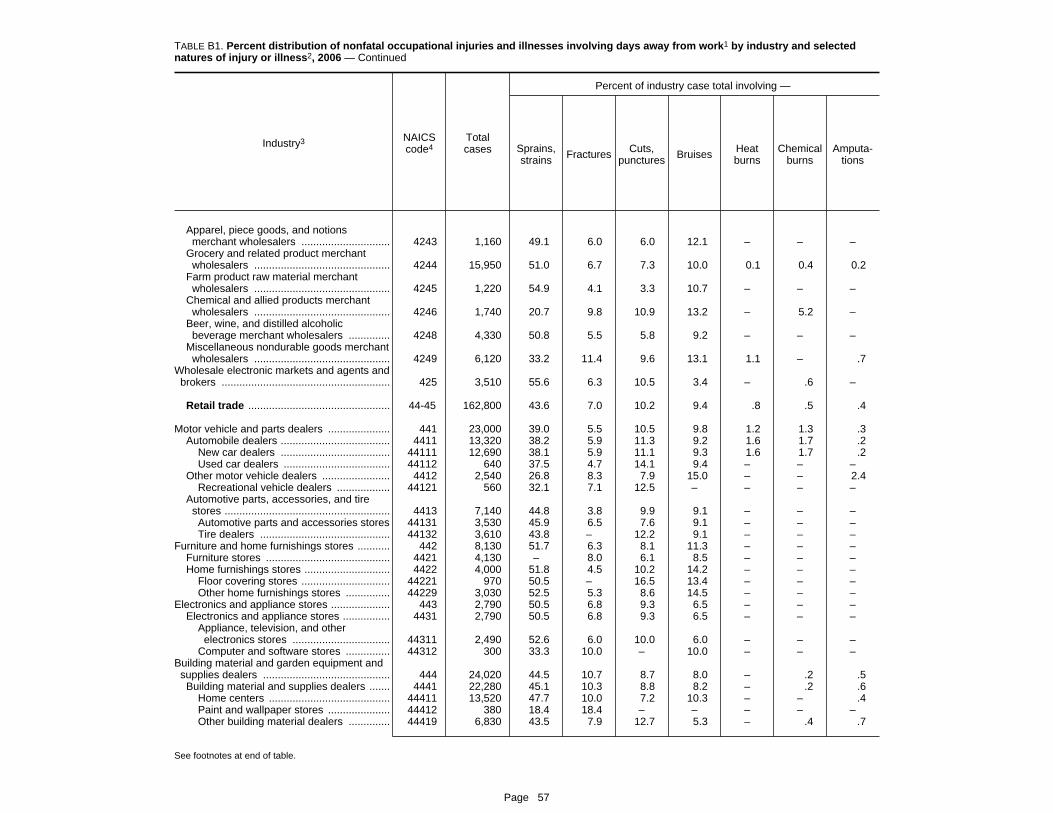
TABLE B1. Percent distribution of nonfatal occupational injuries and illnesses involving days away from work1 by industry and selectednatures of injury or illness2, 2006 — Continued
Industry3 NAICScode4
Totalcases
Percent of industry case total involving —
Sprains,strains Fractures Cuts,
punctures Bruises Heatburns
Chemicalburns
Amputa-tions
Apparel, piece goods, and notionsmerchant wholesalers .............................. 4243 1,160 49.1 6.0 6.0 12.1 – – –
Grocery and related product merchantwholesalers .............................................. 4244 15,950 51.0 6.7 7.3 10.0 0.1 0.4 0.2
Farm product raw material merchantwholesalers .............................................. 4245 1,220 54.9 4.1 3.3 10.7 – – –
Chemical and allied products merchantwholesalers .............................................. 4246 1,740 20.7 9.8 10.9 13.2 – 5.2 –
Beer, wine, and distilled alcoholicbeverage merchant wholesalers .............. 4248 4,330 50.8 5.5 5.8 9.2 – – –
Miscellaneous nondurable goods merchantwholesalers .............................................. 4249 6,120 33.2 11.4 9.6 13.1 1.1 – .7
Wholesale electronic markets and agents andbrokers ......................................................... 425 3,510 55.6 6.3 10.5 3.4 – .6 –
Retail trade ................................................ 44-45 162,800 43.6 7.0 10.2 9.4 .8 .5 .4
Motor vehicle and parts dealers ..................... 441 23,000 39.0 5.5 10.5 9.8 1.2 1.3 .3Automobile dealers ..................................... 4411 13,320 38.2 5.9 11.3 9.2 1.6 1.7 .2
New car dealers ..................................... 44111 12,690 38.1 5.9 11.1 9.3 1.6 1.7 .2Used car dealers .................................... 44112 640 37.5 4.7 14.1 9.4 – – –
Other motor vehicle dealers ....................... 4412 2,540 26.8 8.3 7.9 15.0 – – 2.4Recreational vehicle dealers .................. 44121 560 32.1 7.1 12.5 – – – –
Automotive parts, accessories, and tirestores ........................................................ 4413 7,140 44.8 3.8 9.9 9.1 – – –Automotive parts and accessories stores 44131 3,530 45.9 6.5 7.6 9.1 – – –Tire dealers ............................................ 44132 3,610 43.8 – 12.2 9.1 – – –
Furniture and home furnishings stores ........... 442 8,130 51.7 6.3 8.1 11.3 – – –Furniture stores .......................................... 4421 4,130 – 8.0 6.1 8.5 – – –Home furnishings stores ............................. 4422 4,000 51.8 4.5 10.2 14.2 – – –
Floor covering stores .............................. 44221 970 50.5 – 16.5 13.4 – – –Other home furnishings stores ............... 44229 3,030 52.5 5.3 8.6 14.5 – – –
Electronics and appliance stores .................... 443 2,790 50.5 6.8 9.3 6.5 – – –Electronics and appliance stores ................ 4431 2,790 50.5 6.8 9.3 6.5 – – –
Appliance, television, and otherelectronics stores ................................. 44311 2,490 52.6 6.0 10.0 6.0 – – –
Computer and software stores ............... 44312 300 33.3 10.0 – 10.0 – – –Building material and garden equipment andsupplies dealers ........................................... 444 24,020 44.5 10.7 8.7 8.0 – .2 .5Building material and supplies dealers ....... 4441 22,280 45.1 10.3 8.8 8.2 – .2 .6
Home centers ......................................... 44411 13,520 47.7 10.0 7.2 10.3 – – .4Paint and wallpaper stores ..................... 44412 380 18.4 18.4 – – – – –Other building material dealers .............. 44419 6,830 43.5 7.9 12.7 5.3 – .4 .7
See footnotes at end of table.
Page 57

TABLE B1. Percent distribution of nonfatal occupational injuries and illnesses involving days away from work1 by industry andselected natures of injury or illness2, 2006 — Continued
Industry3
Percent of industry case total involving —
Carpaltunnel
syndrome
Tendon-itis
Multiple traumatic injuries anddisorders
Back pain and pain,except back
Allother
natures5Total
Withfractures,
burns,and
otherinjuries
Withsprains
andbruises
Total
Backpain,hurt
back only
Apparel, piece goods, and notionsmerchant wholesalers .............................. 1.7 – – – – 7.8 – 15.5
Grocery and related product merchantwholesalers .............................................. .7 0.3 3.1 0.6 1.6 7.7 2.7 12.4
Farm product raw material merchantwholesalers .............................................. 2.5 – 2.5 – – 4.9 – 16.4
Chemical and allied products merchantwholesalers .............................................. – – 7.5 2.9 – 23.0 2.3 8.6
Beer, wine, and distilled alcoholicbeverage merchant wholesalers .............. .5 .5 2.8 .7 1.4 13.9 6.9 11.3
Miscellaneous nondurable goods merchantwholesalers .............................................. .3 – 2.8 – 2.3 6.0 2.5 21.4
Wholesale electronic markets and agents andbrokers ......................................................... – – 2.3 .6 – 6.0 .9 14.2
Retail trade ................................................ .8 .4 3.5 .7 1.3 8.3 2.7 15.1
Motor vehicle and parts dealers ..................... 1.0 .2 3.2 .8 .8 8.3 2.7 19.4Automobile dealers ..................................... 1.2 .2 3.4 .8 1.2 8.9 2.2 18.3
New car dealers ..................................... 1.3 .2 3.5 .8 1.3 9.1 2.2 18.1Used car dealers .................................... – – – – – 6.2 – 21.9
Other motor vehicle dealers ....................... – – 7.9 2.8 – 5.9 2.4 23.6Recreational vehicle dealers .................. – – 3.6 – – 10.7 – 23.2
Automotive parts, accessories, and tirestores ........................................................ 1.0 – 1.4 – – 8.0 3.8 19.9
Automotive parts and accessories stores – – 1.7 – – 10.5 4.2 17.3Tire dealers ............................................ – – – – – 5.3 3.6 22.4
Furniture and home furnishings stores ........... – .4 6.0 1.8 1.0 5.9 1.7 10.2Furniture stores .......................................... – – 8.0 2.9 1.0 7.3 2.4 10.7Home furnishings stores ............................. – .5 4.0 .8 1.0 4.5 1.0 9.8
Floor covering stores .............................. – – 7.2 – – – – 6.2Other home furnishings stores ............... – – 3.0 – – 5.3 .7 10.9
Electronics and appliance stores .................... – – 5.7 3.2 1.4 9.0 3.9 12.2Electronics and appliance stores ................ – – 5.7 3.2 1.4 9.0 3.9 12.2
Appliance, television, and otherelectronics stores ................................. – – 6.0 3.2 1.2 8.0 4.4 11.2
Computer and software stores ............... – – – – – 16.7 – 23.3Building material and garden equipment andsupplies dealers ........................................... .2 .1 3.5 1.1 1.2 7.2 2.7 16.2
Building material and supplies dealers ....... .3 .1 2.9 .7 1.1 6.9 2.4 16.7Home centers ......................................... .2 .2 2.2 .7 .4 6.3 1.5 15.3Paint and wallpaper stores ..................... – – – – – – – 57.9Other building material dealers .............. .4 – 4.4 .6 2.2 9.1 4.7 15.7
See footnotes at end of table.
Page 58

TABLE B1. Percent distribution of nonfatal occupational injuries and illnesses involving days away from work1 by industry and selectednatures of injury or illness2, 2006 — Continued
Industry3 NAICScode4
Totalcases
Percent of industry case total involving —
Sprains,strains Fractures Cuts,
punctures Bruises Heatburns
Chemicalburns
Amputa-tions
Lawn and garden equipment and suppliesstores ........................................................ 4442 1,740 36.8 16.1 8.0 5.7 – – –Outdoor power equipment stores ........... 44421 270 85.2 – – – – – –Nursery and garden centers ................... 44422 1,480 27.7 18.2 9.5 6.8 – – –
Food and beverage stores ............................. 445 35,710 41.4 5.0 16.4 10.0 1.6 0.4 0.9Grocery stores ............................................ 4451 31,980 41.2 4.8 16.8 10.0 1.7 .3 1.0
Supermarkets and other grocery (exceptconvenience) stores ............................. 44511 31,280 41.1 4.8 16.9 10.2 1.6 .4 .8
Convenience stores ................................ 44512 700 41.4 5.7 11.4 – 7.1 – –Specialty food stores .................................. 4452 2,260 36.7 9.3 15.0 11.1 1.3 – –
Meat markets .......................................... 44521 240 37.5 8.3 37.5 12.5 – – –Fish and seafood markets ...................... 44522 60 – – – – – – –Fruit and vegetable markets ................... 44523 600 43.3 11.7 11.7 8.3 – – –Other specialty food stores ..................... 44529 1,370 35.0 8.8 12.4 13.1 1.5 – –
Health and personal care stores .................... 446 4,170 57.6 5.5 6.5 7.7 – – –Health and personal care stores ................ 4461 4,170 57.6 5.5 6.5 7.7 – – –
Pharmacies and drug stores .................. 44611 3,240 57.1 6.8 6.2 8.6 – – –Cosmetics, beauty supplies, and
perfume stores ..................................... 44612 210 38.1 – – – – – –Optical goods stores ............................... 44613 50 – – – – – – –Other health and personal care stores ... 44619 660 69.7 – – – – – –
Gasoline stations ............................................ 447 5,960 56.4 11.9 2.7 8.9 2.5 – –Gasoline stations ........................................ 4471 5,960 56.4 11.9 2.7 8.9 2.5 – –
Gasoline stations with conveniencestores .................................................... 44711 5,130 54.4 12.5 1.9 9.4 2.7 – –
Other gasoline stations ........................... 44719 840 67.9 8.3 7.1 4.8 – – –Clothing and clothing accessories stores ....... 448 6,950 39.6 15.0 14.4 5.6 – – –
Clothing stores ........................................... 4481 5,220 36.0 15.3 12.6 7.1 .4 – –Men’s clothing stores .............................. 44811 290 – – 41.4 – – – –Family clothing stores ............................. 44814 2,630 38.8 5.3 8.0 9.1 .8 – –Other clothing stores .............................. 44819 360 – – 75.0 – – – –
Jewelry, luggage, and leather goods stores 4483 460 – 52.2 – – – – –Sporting goods, hobby, book, and musicstores ............................................................ 451 2,780 51.4 5.4 6.1 5.8 – .7 –Sporting goods, hobby, and musical
instrument stores ...................................... 4511 2,100 45.2 6.7 6.7 6.7 – 1.0 –Sporting goods stores ............................ 45111 620 37.1 6.5 9.7 9.7 – – –Hobby, toy, and game stores ................. 45112 1,200 42.5 7.5 4.2 5.8 – – –Sewing, needlework, and piece goods
stores .................................................... 45113 200 95.0 – – – – – –Musical instrument and supplies stores 45114 80 37.5 – – – – – –
Book, periodical, and music stores ............. 4512 680 70.6 – 4.4 2.9 – – –Book stores and news dealers ............... 45121 630 69.8 – 4.8 – – – –
See footnotes at end of table.
Page 59

TABLE B1. Percent distribution of nonfatal occupational injuries and illnesses involving days away from work1 by industry andselected natures of injury or illness2, 2006 — Continued
Industry3
Percent of industry case total involving —
Carpaltunnel
syndrome
Tendon-itis
Multiple traumatic injuries anddisorders
Back pain and pain,except back
Allother
natures5Total
Withfractures,
burns,and
otherinjuries
Withsprains
andbruises
Total
Backpain,hurt
back only
Lawn and garden equipment and suppliesstores ........................................................ – – 10.3 6.3 2.9 10.3 6.3 10.9
Outdoor power equipment stores ........... – – – – – – – –Nursery and garden centers ................... – – 12.2 6.8 3.4 12.2 7.4 12.2
Food and beverage stores ............................. 1.5 0.6 3.2 .6 1.5 7.0 2.4 12.0Grocery stores ............................................ 1.6 .7 2.9 .5 1.3 7.2 2.5 11.9
Supermarkets and other grocery (exceptconvenience) stores ............................. 1.6 .7 2.7 .5 1.1 7.1 2.5 12.1
Convenience stores ................................ – – – – – 11.4 – –Specialty food stores .................................. – – 6.2 – 1.8 4.4 1.8 13.7
Meat markets .......................................... – – – – – – – –Fish and seafood markets ...................... – – 66.7 – – – – –Fruit and vegetable markets ................... – – 5.0 – 3.3 – – 16.7Other specialty food stores ..................... – – 5.1 – 1.5 6.6 2.9 13.9
Health and personal care stores .................... 3.1 – 1.4 – 1.0 6.2 1.4 11.8Health and personal care stores ................ 3.1 – 1.4 – 1.0 6.2 1.4 11.8
Pharmacies and drug stores .................. 4.0 – 1.2 – – 7.7 1.9 8.3Cosmetics, beauty supplies, andperfume stores ..................................... – – – – – – – 33.3
Optical goods stores ............................... – – – – – – – 40.0Other health and personal care stores ... – – – – – – – 21.2
Gasoline stations ............................................ – – 4.2 1.2 .8 2.7 1.0 9.9Gasoline stations ........................................ – – 4.2 1.2 .8 2.7 1.0 9.9
Gasoline stations with conveniencestores .................................................... – – 4.7 1.2 .8 2.5 1.0 10.5
Other gasoline stations ........................... – – – – – 2.4 – 6.0Clothing and clothing accessories stores ....... .4 – 4.6 .6 2.4 7.5 3.6 12.4
Clothing stores ........................................... .6 – 5.0 .8 3.3 7.7 3.4 15.3Men’s clothing stores .............................. – – – – – – – 31.0Family clothing stores ............................. .8 – 4.6 .8 1.9 11.4 4.6 21.7Other clothing stores .............................. – – – – – – – –
Jewelry, luggage, and leather goods stores – – – – – – – –Sporting goods, hobby, book, and musicstores ............................................................ – – 1.8 – – 12.9 1.8 14.7
Sporting goods, hobby, and musicalinstrument stores ...................................... – – 2.4 – – 13.8 1.4 16.2
Sporting goods stores ............................ – – – – – 3.2 – 30.6Hobby, toy, and game stores ................. – – 3.3 – – 20.8 – 11.7Sewing, needlework, and piece goodsstores .................................................... – – – – – – – –
Musical instrument and supplies stores – – – – – – – –Book, periodical, and music stores ............. – – – – – 8.8 – 10.3
Book stores and news dealers ............... – – – – – 9.5 – 11.1
See footnotes at end of table.
Page 60
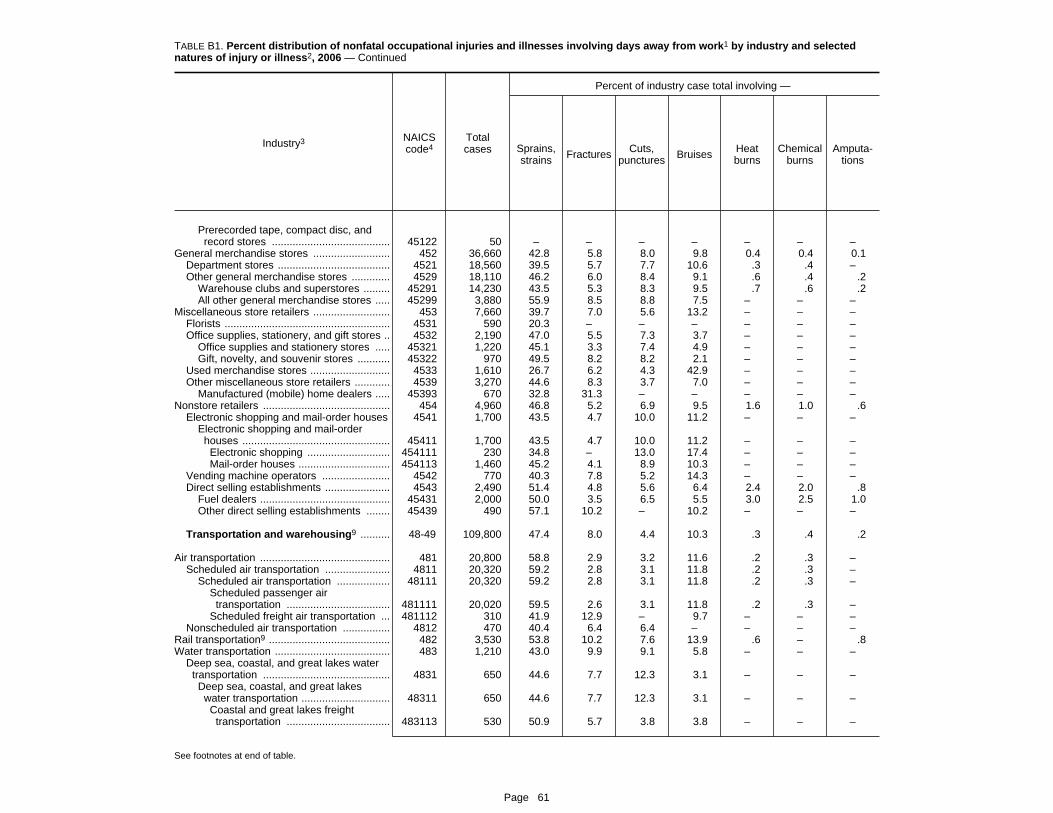
TABLE B1. Percent distribution of nonfatal occupational injuries and illnesses involving days away from work1 by industry and selectednatures of injury or illness2, 2006 — Continued
Industry3 NAICScode4
Totalcases
Percent of industry case total involving —
Sprains,strains Fractures Cuts,
punctures Bruises Heatburns
Chemicalburns
Amputa-tions
Prerecorded tape, compact disc, andrecord stores ........................................ 45122 50 – – – – – – –
General merchandise stores .......................... 452 36,660 42.8 5.8 8.0 9.8 0.4 0.4 0.1Department stores ...................................... 4521 18,560 39.5 5.7 7.7 10.6 .3 .4 –Other general merchandise stores ............. 4529 18,110 46.2 6.0 8.4 9.1 .6 .4 .2
Warehouse clubs and superstores ......... 45291 14,230 43.5 5.3 8.3 9.5 .7 .6 .2All other general merchandise stores ..... 45299 3,880 55.9 8.5 8.8 7.5 – – –
Miscellaneous store retailers .......................... 453 7,660 39.7 7.0 5.6 13.2 – – –Florists ........................................................ 4531 590 20.3 – – – – – –Office supplies, stationery, and gift stores .. 4532 2,190 47.0 5.5 7.3 3.7 – – –
Office supplies and stationery stores ..... 45321 1,220 45.1 3.3 7.4 4.9 – – –Gift, novelty, and souvenir stores ........... 45322 970 49.5 8.2 8.2 2.1 – – –
Used merchandise stores ........................... 4533 1,610 26.7 6.2 4.3 42.9 – – –Other miscellaneous store retailers ............ 4539 3,270 44.6 8.3 3.7 7.0 – – –
Manufactured (mobile) home dealers ..... 45393 670 32.8 31.3 – – – – –Nonstore retailers ........................................... 454 4,960 46.8 5.2 6.9 9.5 1.6 1.0 .6
Electronic shopping and mail-order houses 4541 1,700 43.5 4.7 10.0 11.2 – – –Electronic shopping and mail-order
houses .................................................. 45411 1,700 43.5 4.7 10.0 11.2 – – –Electronic shopping ............................ 454111 230 34.8 – 13.0 17.4 – – –Mail-order houses ............................... 454113 1,460 45.2 4.1 8.9 10.3 – – –
Vending machine operators ....................... 4542 770 40.3 7.8 5.2 14.3 – – –Direct selling establishments ...................... 4543 2,490 51.4 4.8 5.6 6.4 2.4 2.0 .8
Fuel dealers ............................................ 45431 2,000 50.0 3.5 6.5 5.5 3.0 2.5 1.0Other direct selling establishments ........ 45439 490 57.1 10.2 – 10.2 – – –
Transportation and warehousing9 .......... 48-49 109,800 47.4 8.0 4.4 10.3 .3 .4 .2
Air transportation ............................................ 481 20,800 58.8 2.9 3.2 11.6 .2 .3 –Scheduled air transportation ...................... 4811 20,320 59.2 2.8 3.1 11.8 .2 .3 –
Scheduled air transportation .................. 48111 20,320 59.2 2.8 3.1 11.8 .2 .3 –Scheduled passenger air
transportation ................................... 481111 20,020 59.5 2.6 3.1 11.8 .2 .3 –Scheduled freight air transportation ... 481112 310 41.9 12.9 – 9.7 – – –
Nonscheduled air transportation ................ 4812 470 40.4 6.4 6.4 – – – –Rail transportation9 ......................................... 482 3,530 53.8 10.2 7.6 13.9 .6 – .8Water transportation ....................................... 483 1,210 43.0 9.9 9.1 5.8 – – –
Deep sea, coastal, and great lakes watertransportation ........................................... 4831 650 44.6 7.7 12.3 3.1 – – –Deep sea, coastal, and great lakes
water transportation .............................. 48311 650 44.6 7.7 12.3 3.1 – – –Coastal and great lakes freight
transportation ................................... 483113 530 50.9 5.7 3.8 3.8 – – –
See footnotes at end of table.
Page 61

TABLE B1. Percent distribution of nonfatal occupational injuries and illnesses involving days away from work1 by industry andselected natures of injury or illness2, 2006 — Continued
Industry3
Percent of industry case total involving —
Carpaltunnel
syndrome
Tendon-itis
Multiple traumatic injuries anddisorders
Back pain and pain,except back
Allother
natures5Total
Withfractures,
burns,and
otherinjuries
Withsprains
andbruises
Total
Backpain,hurt
back only
Prerecorded tape, compact disc, andrecord stores ........................................ – – – – – – – –
General merchandise stores .......................... 0.5 0.5 3.1 0.4 1.3 11.6 3.1 16.9Department stores ...................................... .4 .4 3.3 .2 1.3 12.2 3.3 19.6Other general merchandise stores ............. .7 .6 2.7 .6 1.2 10.9 3.0 14.2
Warehouse clubs and superstores ......... .8 .4 3.1 .5 1.5 12.5 3.5 15.2All other general merchandise stores ..... – 1.8 1.3 .8 – 4.9 1.0 10.8
Miscellaneous store retailers .......................... .7 – 4.7 – 1.4 10.1 4.3 18.9Florists ........................................................ – – – – – – – 47.5Office supplies, stationery, and gift stores .. – – 2.3 – – 14.2 5.5 19.2
Office supplies and stationery stores ..... – – 3.3 – – 16.4 8.2 19.7Gift, novelty, and souvenir stores ........... – – – – – 11.3 – 18.6
Used merchandise stores ........................... – – 3.7 – – 5.6 3.1 10.6Other miscellaneous store retailers ............ 1.2 – 7.3 – 2.4 9.5 4.0 17.7
Manufactured (mobile) home dealers ..... – – – – – – – –Nonstore retailers ........................................... 1.0 1.2 3.4 – 1.6 6.2 1.8 16.7
Electronic shopping and mail-order houses 1.8 1.8 4.1 – 1.8 6.5 2.4 16.5Electronic shopping and mail-orderhouses .................................................. 1.8 1.8 4.1 – 1.8 6.5 2.4 16.5
Electronic shopping ............................ – – – – – 13.0 8.7 8.7Mail-order houses ............................... 1.4 1.4 4.1 – 1.4 4.8 1.4 17.8
Vending machine operators ....................... – – 5.2 – 3.9 7.8 2.6 16.9Direct selling establishments ...................... .8 1.2 2.4 – 1.2 5.6 1.6 16.5
Fuel dealers ............................................ – 1.5 2.5 – 1.0 6.0 1.5 17.0Other direct selling establishments ........ – – – – – 4.1 – 14.3
Transportation and warehousing9 .......... .4 .2 4.1 .7 1.5 9.2 3.5 15.1
Air transportation ............................................ .3 – 2.3 .3 .7 4.2 1.4 16.2Scheduled air transportation ...................... .3 – 2.2 .3 .7 4.0 1.3 15.9
Scheduled air transportation .................. .3 – 2.2 .3 .7 4.0 1.3 15.9Scheduled passenger airtransportation ................................... .3 – 2.0 .3 .6 3.9 1.3 16.1
Scheduled freight air transportation ... – – 12.9 – – 9.7 – 6.5Nonscheduled air transportation ................ – – 6.4 – – 12.8 6.4 27.7
Rail transportation9 ......................................... – – – – – – – 13.0Water transportation ....................................... – – 8.3 – 6.6 9.1 2.5 14.0
Deep sea, coastal, and great lakes watertransportation ........................................... – – 13.8 – 10.8 12.3 – 6.2
Deep sea, coastal, and great lakeswater transportation .............................. – – 13.8 – 10.8 12.3 – 6.2
Coastal and great lakes freighttransportation ................................... – – 13.2 – 11.3 15.1 – 5.7
See footnotes at end of table.
Page 62

TABLE B1. Percent distribution of nonfatal occupational injuries and illnesses involving days away from work1 by industry and selectednatures of injury or illness2, 2006 — Continued
Industry3 NAICScode4
Totalcases
Percent of industry case total involving —
Sprains,strains Fractures Cuts,
punctures Bruises Heatburns
Chemicalburns
Amputa-tions
Coastal and great lakes passengertransportation ................................... 483114 40 – – – – – – –
Inland water transportation ......................... 4832 560 41.1 12.5 5.4 8.9 – – –Inland water transportation ..................... 48321 560 41.1 12.5 5.4 8.9 – – –
Inland water freight transportation ...... 483211 490 40.8 12.2 6.1 8.2 – – –Inland water passenger transportation 483212 70 42.9 – – – – – –
Truck transportation ....................................... 484 40,090 45.5 12.5 4.2 10.5 0.4 0.6 0.3General freight trucking .............................. 4841 28,250 47.1 10.3 4.1 11.5 .5 .5 .4
General freight trucking, local ................. 48411 5,310 46.9 8.3 5.1 8.9 1.1 – –General freight trucking, long-distance ... 48412 22,940 47.1 10.8 3.8 12.1 .3 .6 .4
Specialized freight trucking ........................ 4842 11,840 41.7 17.8 4.4 8.0 .3 .8 –Used household and office goods
moving .................................................. 48421 2,830 33.2 18.7 4.9 6.7 – – –Specialized freight (except used goods)
trucking, local ....................................... 48422 4,500 37.3 24.9 5.6 7.6 .7 – –Specialized freight (except used goods)
trucking, long-distance ......................... 48423 4,510 51.4 10.2 2.9 9.3 – 1.8 –Transit and ground passenger transportation 485 6,320 50.0 5.4 2.7 7.1 – – –
Urban transit systems ................................. 4851 1,430 57.3 3.5 2.8 8.4 – – –Taxi and limousine service ......................... 4853 960 46.9 6.2 2.1 5.2 – – –
Taxi service ............................................ 48531 730 50.7 2.7 – 4.1 – – –Limousine service ................................... 48532 230 30.4 17.4 – 8.7 – – –
School and employee bus transportation ... 4854 1,790 44.7 5.0 3.4 8.4 – – –Charter bus industry ................................... 4855 310 48.4 9.7 – 6.5 – – –Other transit and ground passenger
transportation ........................................... 4859 1,290 51.9 6.2 2.3 3.1 – – –Pipeline transportation .................................... 486 230 60.9 – – – – – –
Pipeline transportation of natural gas ......... 4862 210 57.1 – – – – – –Scenic and sightseeing transportation ........... 487 410 34.1 4.9 9.8 4.9 – – –
Scenic and sightseeing transportation, land 4871 140 42.9 – – – – – –Scenic and sightseeing transportation,
water ......................................................... 4872 230 34.8 – 8.7 – – – –Scenic and sightseeing transportation,
other ......................................................... 4879 30 – – – – – – –Support activities for transportation ................ 488 9,310 44.8 8.4 6.9 10.7 .3 – .3
Support activities for air transportation ....... 4881 2,780 49.3 7.6 8.3 10.8 – – –Support activities for rail transportation ...... 4882 510 35.3 5.9 – 9.8 – – –Support activities for water transportation .. 4883 3,070 47.2 7.5 6.2 15.3 – – –
Port and harbor operations ..................... 48831 390 35.9 – – 28.2 – – –Marine cargo handling ............................ 48832 1,900 50.5 6.8 4.7 14.2 – – –Navigational services to shipping ........... 48833 690 44.9 10.1 10.1 11.6 – – –Other support activities for water
transportation ....................................... 48839 100 40.0 – 20.0 – – – –Support activities for road transportation .... 4884 1,530 35.3 13.1 6.5 2.6 – – –
See footnotes at end of table.
Page 63

TABLE B1. Percent distribution of nonfatal occupational injuries and illnesses involving days away from work1 by industry andselected natures of injury or illness2, 2006 — Continued
Industry3
Percent of industry case total involving —
Carpaltunnel
syndrome
Tendon-itis
Multiple traumatic injuries anddisorders
Back pain and pain,except back
Allother
natures5Total
Withfractures,
burns,and
otherinjuries
Withsprains
andbruises
Total
Backpain,hurt
back only
Coastal and great lakes passengertransportation ................................... – – – – – – – –
Inland water transportation ......................... – – 3.6 – – 5.4 – 23.2Inland water transportation ..................... – – 3.6 – – 5.4 – 23.2
Inland water freight transportation ...... – – – – – 4.1 – 22.4Inland water passenger transportation – – – – – – – 28.6
Truck transportation ....................................... 0.3 0.2 5.6 1.0 2.0 6.6 3.1 13.3General freight trucking .............................. .3 .1 5.2 1.0 1.7 6.3 2.7 13.7
General freight trucking, local ................. – – 5.6 1.7 1.3 10.2 4.9 13.4General freight trucking, long-distance ... .3 .1 5.1 .9 1.7 5.4 2.1 13.8
Specialized freight trucking ........................ .3 .3 6.6 .8 2.8 7.3 4.2 12.2Used household and office goodsmoving .................................................. – – 12.4 – 5.3 10.6 9.2 13.1
Specialized freight (except used goods)trucking, local ....................................... .4 – 5.6 1.1 2.2 5.3 1.8 11.3
Specialized freight (except used goods)trucking, long-distance ......................... – .7 4.0 1.1 1.8 7.1 3.5 12.4
Transit and ground passenger transportation .5 .5 4.6 .8 2.5 11.9 4.1 17.1Urban transit systems ................................. – 1.4 5.6 – 2.8 7.0 3.5 13.3Taxi and limousine service ......................... – – 5.2 – 4.2 9.4 3.1 24.0
Taxi service ............................................ – – 5.5 – 5.5 6.8 2.7 28.8Limousine service ................................... – – – – – 17.4 – 13.0
School and employee bus transportation ... – – 5.0 – 2.2 14.5 3.9 18.4Charter bus industry ................................... – – – – – 9.7 6.5 12.9Other transit and ground passengertransportation ........................................... – – 2.3 1.6 – 17.8 6.2 16.3
Pipeline transportation .................................... – – – – – – – 21.7Pipeline transportation of natural gas ......... – – – – – – – 23.8
Scenic and sightseeing transportation ........... – – 4.9 – – 22.0 – 14.6Scenic and sightseeing transportation, land – – – – – 14.3 – 14.3Scenic and sightseeing transportation,water ......................................................... – – – – – 34.8 – 13.0
Scenic and sightseeing transportation,other ......................................................... – – – – – – – –
Support activities for transportation ................ .2 – 4.4 1.2 1.3 7.2 2.0 16.6Support activities for air transportation ....... – – 3.2 – 1.4 6.8 2.5 13.3Support activities for rail transportation ...... – – 9.8 3.9 3.9 17.6 5.9 19.6Support activities for water transportation .. – – 5.5 2.0 1.3 5.9 2.0 11.7
Port and harbor operations ..................... – – 10.3 – 7.7 – – 15.4Marine cargo handling ............................ – – 5.8 2.1 – 6.8 1.6 10.0Navigational services to shipping ........... – – 2.9 – – 4.3 2.9 14.5Other support activities for watertransportation ....................................... – – – – – – – 20.0
Support activities for road transportation .... – – 2.6 – – 4.6 – 35.3
See footnotes at end of table.
Page 64

TABLE B1. Percent distribution of nonfatal occupational injuries and illnesses involving days away from work1 by industry and selectednatures of injury or illness2, 2006 — Continued
Industry3 NAICScode4
Totalcases
Percent of industry case total involving —
Sprains,strains Fractures Cuts,
punctures Bruises Heatburns
Chemicalburns
Amputa-tions
Motor vehicle towing ............................... 48841 660 40.9 15.2 – – – – –Freight transportation arrangement ............ 4885 830 41.0 10.8 7.2 10.8 – – –Other support activities for transportation .. 4889 580 50.0 5.2 10.3 8.6 – – –
Couriers and messengers .............................. 492 15,210 35.2 4.7 3.9 8.0 – 0.1 0.2Couriers ...................................................... 4921 14,510 34.7 4.7 3.9 7.6 – .1 .2Local messengers and local delivery ......... 4922 700 44.3 4.3 4.3 15.7 – – –
Warehousing and storage .............................. 493 12,700 48.7 6.2 5.4 11.5 0.2 .2 .3Warehousing and storage .......................... 4931 12,700 48.7 6.2 5.4 11.5 .2 .2 .3
General warehousing and storage ......... 49311 11,020 48.5 6.3 5.4 11.2 – .3 .4Refrigerated warehousing and storage ...... 49312 12,700 48.7 6.2 5.4 11.5 .2 .2 .3
Farm product warehousing and storage 49313 170 76.5 – – – – – –Other warehousing and storage ............. 49319 470 51.1 6.4 4.3 6.4 – – –
Utilities ...................................................... 22 6,210 48.6 6.9 5.0 6.4 1.3 .5 .3
Utilities ............................................................ 221 6,210 48.6 6.9 5.0 6.4 1.3 .5 .3Electric power generation, transmission
and distribution ......................................... 2211 4,170 46.0 7.9 5.3 6.0 1.4 – –Electric power generation ....................... 22111 1,960 47.4 6.6 5.6 6.6 2.6 – –
Hydroelectric power generation .......... 221111 210 33.3 9.5 – – – – –Fossil fuel electric power generation .. 221112 1,530 49.0 5.9 5.9 6.5 2.6 – –Nuclear electric power generation ...... 221113 120 50.0 16.7 – – – – –Other electric power generation ......... 221119 100 40.0 – – – – – –
Electric power transmission, control, anddistribution ............................................ 22112 2,200 45.0 9.1 5.0 5.5 – – –
Natural gas distribution ............................... 2212 1,350 54.1 5.2 4.4 5.2 – – –Water, sewage and other systems ............. 2213 680 54.4 4.4 4.4 10.3 – – –
Water supply and irrigation systems ...... 22131 520 57.7 3.8 – 11.5 – – –Sewage treatment facilities .................... 22132 140 50.0 – – – – – –Steam and air-conditioning supply ......... 22133 20 – – – – – – –
Information ............................................ 18,560 42.3 8.7 4.9 8.5 .3 .1 .2
Information ................................................ 51 18,560 42.3 8.7 4.9 8.5 .3 .1 .2
Publishing industries (except Internet) ........... 511 5,370 40.2 9.7 8.0 10.4 – – .6Newspaper, periodical, book, and directory
publishers ................................................. 5111 5,130 40.7 8.6 8.4 10.7 – – .6Newspaper publishers ............................ 51111 3,910 39.4 8.4 7.2 11.5 – – .5Periodical publishers .............................. 51112 510 45.1 9.8 15.7 5.9 – – –Book publishers ...................................... 51113 290 37.9 – 10.3 10.3 – – –Directory and mailing list publishers ....... 51114 310 58.1 6.5 12.9 9.7 – – –Other publishers ..................................... 51119 110 36.4 27.3 – – – – –
Software publishers .................................... 5112 240 29.2 33.3 – – – – –
See footnotes at end of table.
Page 65

TABLE B1. Percent distribution of nonfatal occupational injuries and illnesses involving days away from work1 by industry andselected natures of injury or illness2, 2006 — Continued
Industry3
Percent of industry case total involving —
Carpaltunnel
syndrome
Tendon-itis
Multiple traumatic injuries anddisorders
Back pain and pain,except back
Allother
natures5Total
Withfractures,
burns,and
otherinjuries
Withsprains
andbruises
Total
Backpain,hurt
back only
Motor vehicle towing ............................... – – – – – 7.6 – 27.3Freight transportation arrangement ............ – – 4.8 – – 12.0 2.4 12.0Other support activities for transportation .. – – 3.4 – – 5.2 – 15.5
Couriers and messengers .............................. 0.3 0.1 3.3 0.3 1.1 26.4 9.8 17.8Couriers ...................................................... .3 .1 3.3 .3 1.0 27.2 10.2 17.7Local messengers and local delivery ......... – – 2.9 – – 8.6 – 18.6
Warehousing and storage .............................. .9 .6 3.6 .5 1.6 7.9 2.4 14.4Warehousing and storage .......................... .9 .6 3.6 .5 1.6 7.9 2.4 14.4
General warehousing and storage ......... 1.0 .6 3.8 .5 1.6 8.1 2.5 14.4Refrigerated warehousing and storage ...... .9 .6 3.6 .5 1.6 7.9 2.4 14.4
Farm product warehousing and storage – – – – – – – 11.8Other warehousing and storage ............. – – – – – 10.6 – 19.1
Utilities ...................................................... 1.9 .3 2.4 1.0 .3 6.8 2.1 19.3
Utilities ............................................................ 1.9 .3 2.4 1.0 .3 6.8 2.1 19.3Electric power generation, transmissionand distribution ......................................... 1.9 .5 3.1 1.4 .5 7.9 2.6 19.2
Electric power generation ....................... 2.6 1.0 2.6 1.0 – 6.6 1.0 17.9Hydroelectric power generation .......... – – – – – – – 42.9Fossil fuel electric power generation .. 3.3 1.3 2.6 – – 6.5 1.3 15.0Nuclear electric power generation ...... – – – – – – – –Other electric power generation ......... – – – – – 20.0 – 20.0
Electric power transmission, control, anddistribution ............................................ 1.4 – 3.6 1.8 – 9.1 4.1 20.9
Natural gas distribution ............................... 2.2 – 1.5 – – 3.7 – 21.5Water, sewage and other systems ............. – – – – – 5.9 – 16.2
Water supply and irrigation systems ...... – – – – – 5.8 – 15.4Sewage treatment facilities .................... – – – – – – – 21.4Steam and air-conditioning supply ......... – – – – – – – –
Information ............................................ 2.3 .5 4.4 .7 1.8 9.8 2.8 18.0
Information ................................................ 2.3 .5 4.4 .7 1.8 9.8 2.8 18.0
Publishing industries (except Internet) ........... 2.2 .6 4.5 .7 2.2 8.4 2.6 15.1Newspaper, periodical, book, and directorypublishers ................................................. 2.3 .6 4.7 .8 2.3 8.4 2.7 14.8
Newspaper publishers ............................ 2.0 .5 5.6 1.0 3.1 8.7 2.6 15.3Periodical publishers .............................. – – – – – 3.9 – 15.7Book publishers ...................................... 6.9 – – – – 10.3 6.9 17.2Directory and mailing list publishers ....... – – – – – 9.7 6.5 6.5Other publishers ..................................... – – – – – – – –
Software publishers .................................... – – – – – 8.3 – 20.8
See footnotes at end of table.
Page 66
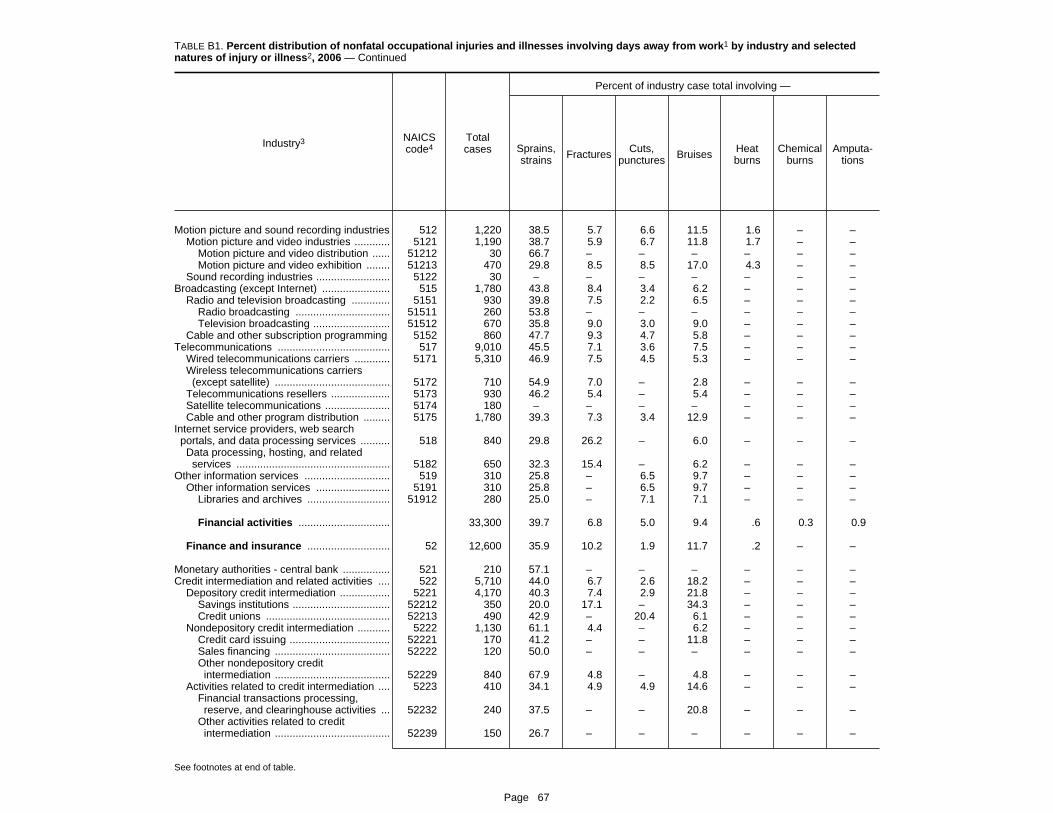
TABLE B1. Percent distribution of nonfatal occupational injuries and illnesses involving days away from work1 by industry and selectednatures of injury or illness2, 2006 — Continued
Industry3 NAICScode4
Totalcases
Percent of industry case total involving —
Sprains,strains Fractures Cuts,
punctures Bruises Heatburns
Chemicalburns
Amputa-tions
Motion picture and sound recording industries 512 1,220 38.5 5.7 6.6 11.5 1.6 – –Motion picture and video industries ............ 5121 1,190 38.7 5.9 6.7 11.8 1.7 – –
Motion picture and video distribution ...... 51212 30 66.7 – – – – – –Motion picture and video exhibition ........ 51213 470 29.8 8.5 8.5 17.0 4.3 – –
Sound recording industries ......................... 5122 30 – – – – – – –Broadcasting (except Internet) ....................... 515 1,780 43.8 8.4 3.4 6.2 – – –
Radio and television broadcasting ............. 5151 930 39.8 7.5 2.2 6.5 – – –Radio broadcasting ................................ 51511 260 53.8 – – – – – –Television broadcasting .......................... 51512 670 35.8 9.0 3.0 9.0 – – –
Cable and other subscription programming 5152 860 47.7 9.3 4.7 5.8 – – –Telecommunications ...................................... 517 9,010 45.5 7.1 3.6 7.5 – – –
Wired telecommunications carriers ............ 5171 5,310 46.9 7.5 4.5 5.3 – – –Wireless telecommunications carriers
(except satellite) ....................................... 5172 710 54.9 7.0 – 2.8 – – –Telecommunications resellers .................... 5173 930 46.2 5.4 – 5.4 – – –Satellite telecommunications ...................... 5174 180 – – – – – – –Cable and other program distribution ......... 5175 1,780 39.3 7.3 3.4 12.9 – – –
Internet service providers, web searchportals, and data processing services .......... 518 840 29.8 26.2 – 6.0 – – –Data processing, hosting, and related
services .................................................... 5182 650 32.3 15.4 – 6.2 – – –Other information services ............................. 519 310 25.8 – 6.5 9.7 – – –
Other information services ......................... 5191 310 25.8 – 6.5 9.7 – – –Libraries and archives ............................ 51912 280 25.0 – 7.1 7.1 – – –
Financial activities ............................... 33,300 39.7 6.8 5.0 9.4 .6 0.3 0.9
Finance and insurance ............................ 52 12,600 35.9 10.2 1.9 11.7 .2 – –
Monetary authorities - central bank ................ 521 210 57.1 – – – – – –Credit intermediation and related activities .... 522 5,710 44.0 6.7 2.6 18.2 – – –
Depository credit intermediation ................. 5221 4,170 40.3 7.4 2.9 21.8 – – –Savings institutions ................................. 52212 350 20.0 17.1 – 34.3 – – –Credit unions .......................................... 52213 490 42.9 – 20.4 6.1 – – –
Nondepository credit intermediation ........... 5222 1,130 61.1 4.4 – 6.2 – – –Credit card issuing .................................. 52221 170 41.2 – – 11.8 – – –Sales financing ....................................... 52222 120 50.0 – – – – – –Other nondepository credit
intermediation ....................................... 52229 840 67.9 4.8 – 4.8 – – –Activities related to credit intermediation .... 5223 410 34.1 4.9 4.9 14.6 – – –
Financial transactions processing,reserve, and clearinghouse activities ... 52232 240 37.5 – – 20.8 – – –
Other activities related to creditintermediation ....................................... 52239 150 26.7 – – – – – –
See footnotes at end of table.
Page 67

TABLE B1. Percent distribution of nonfatal occupational injuries and illnesses involving days away from work1 by industry andselected natures of injury or illness2, 2006 — Continued
Industry3
Percent of industry case total involving —
Carpaltunnel
syndrome
Tendon-itis
Multiple traumatic injuries anddisorders
Back pain and pain,except back
Allother
natures5Total
Withfractures,
burns,and
otherinjuries
Withsprains
andbruises
Total
Backpain,hurt
back only
Motion picture and sound recording industries 1.6 – 3.3 – 1.6 5.7 1.6 23.0Motion picture and video industries ............ 1.7 – 3.4 – 1.7 5.9 – 21.8
Motion picture and video distribution ...... – – – – – – – –Motion picture and video exhibition ........ – – – – – 8.5 – 21.3
Sound recording industries ......................... – – – – – – – 66.7Broadcasting (except Internet) ....................... – – 4.5 1.7 2.2 9.6 4.5 23.0
Radio and television broadcasting ............. – – 6.5 2.2 3.2 8.6 5.4 29.0Radio broadcasting ................................ – – – – – 11.5 11.5 26.9Television broadcasting .......................... – – 6.0 – 3.0 7.5 4.5 29.9
Cable and other subscription programming – – 2.3 – – 10.5 2.3 16.3Telecommunications ...................................... 2.4 0.6 4.3 .4 1.7 10.9 2.9 17.8
Wired telecommunications carriers ............ 1.5 .4 4.0 .8 1.7 12.4 3.6 17.5Wireless telecommunications carriers(except satellite) ....................................... 4.2 – 2.8 – – 8.5 2.8 15.5
Telecommunications resellers .................... 5.4 2.2 4.3 – 2.2 4.3 – 24.7Satellite telecommunications ...................... – – – – – – – –Cable and other program distribution ......... 3.4 – 6.7 – 1.7 7.9 2.8 18.0
Internet service providers, web searchportals, and data processing services .......... 4.8 – 6.0 – – 11.9 2.4 15.5
Data processing, hosting, and relatedservices .................................................... 4.6 – 6.2 – – 12.3 3.1 18.5
Other information services ............................. – – – – – 16.1 – 35.5Other information services ......................... – – – – – 16.1 – 35.5
Libraries and archives ............................ – – – – – 17.9 – 39.3
Financial activities ............................... 2.5 .3 6.5 1.5 2.8 8.1 2.8 20.0
Finance and insurance ............................ 6.3 .6 5.1 1.1 1.7 8.7 3.9 19.2
Monetary authorities - central bank ................ 14.3 – – – – – – –Credit intermediation and related activities .... 2.5 – 5.1 .9 1.4 8.1 4.0 12.3
Depository credit intermediation ................. 1.9 – 4.8 – .7 7.9 5.0 12.9Savings institutions ................................. – – – – – 8.6 – 8.6Credit unions .......................................... – – – – – – – 18.4
Nondepository credit intermediation ........... 4.4 – 5.3 – 3.5 5.3 1.8 10.6Credit card issuing .................................. 11.8 – 11.8 – – 11.8 – 11.8Sales financing ....................................... – – – – – – – 25.0Other nondepository creditintermediation ....................................... 3.6 – 4.8 – 3.6 4.8 – 8.3
Activities related to credit intermediation .... – – 9.8 – – 14.6 – 12.2Financial transactions processing,reserve, and clearinghouse activities ... – – – – – 20.8 – 8.3
Other activities related to creditintermediation ....................................... – – 20.0 – – 13.3 – 20.0
See footnotes at end of table.
Page 68

TABLE B1. Percent distribution of nonfatal occupational injuries and illnesses involving days away from work1 by industry and selectednatures of injury or illness2, 2006 — Continued
Industry3 NAICScode4
Totalcases
Percent of industry case total involving —
Sprains,strains Fractures Cuts,
punctures Bruises Heatburns
Chemicalburns
Amputa-tions
Securities, commodity contracts, and otherfinancial investments and related activities .. 523 770 9.1 7.8 – 5.2 – – –Securities and commodity contracts
intermediation and brokerage ................... 5231 250 8.0 20.0 – 8.0 – – –Investment banking and securities
dealing .................................................. 52311 100 – 20.0 – 20.0 – – –Securities brokerage .............................. 52312 160 – 18.8 – – – – –
Securities and commodity exchanges ........ 5232 20 – – – – – – –Portfolio management ............................ 52392 90 22.2 – – – – – –All other financial investment activities ... 52399 30 – – – – – – –
Insurance carriers and related activities ......... 524 5,490 31.7 12.0 1.5 6.0 – – –Insurance carriers ....................................... 5241 3,980 33.9 14.1 1.5 7.8 – – –
Direct life, health, and medical insurancecarriers ................................................. 52411 2,100 33.8 20.0 1.4 4.8 – – –
Direct insurance (except life, health, andmedical) carriers ................................... 52412 1,780 35.4 7.3 1.1 11.8 – – –
Reinsurance carriers .............................. 52413 100 – – – – – – –Agencies, brokerages, and other insurance
related activities ........................................ 5242 1,510 25.8 6.6 – – – – –Insurance agencies and brokerages ...... 52421 830 12.0 6.0 – – – – –Other insurance related activities ........... 52429 670 43.3 7.5 – – – – –
Funds, trusts, and other financial vehicles ..... 525 420 16.7 40.5 – 14.3 – – –Insurance and employee benefit funds ...... 5251 340 8.8 50.0 – 11.8 – – –
Other insurance funds ............................ 52519 240 12.5 54.2 – – – – –Other investment pools and funds .............. 5259 80 37.5 – – – – – –
Real estate and rental and leasing ......... 53 20,700 42.0 4.7 6.8 8.1 0.9 0.4 1.4
Real estate ..................................................... 531 12,500 45.3 3.3 7.4 7.4 .4 .3 2.2Lessors of real estate ................................. 5311 7,660 44.3 2.0 7.8 8.1 – – 3.7
Lessors of residential buildings anddwellings ............................................... 53111 5,700 48.2 1.9 8.4 3.5 – – 4.9
Lessors of nonresidential buildings(except miniwarehouses) ..................... 53112 890 44.9 3.4 9.0 3.4 – – –
Lessors of miniwarehouses andself-storage units .................................. 53113 540 – – – 68.5 – – –
Lessors of other real estate property ...... 53119 520 30.8 – – – – – –Offices of real estate agents and brokers ... 5312 1,030 43.7 9.7 7.8 8.7 – – –Activities related to real estate ................... 5313 3,810 47.8 4.2 6.6 6.0 .8 .5 –
Real estate property managers .............. 53131 3,620 46.1 4.4 6.9 5.8 .8 .6 –Rental and leasing services ........................... 532 8,170 37.0 6.7 5.8 8.9 1.7 .5 .2
Automotive equipment rental and leasing .. 5321 2,310 35.5 7.4 4.3 11.3 2.2 .9 –Passenger car rental and leasing ........... 53211 1,290 41.9 10.9 3.1 10.1 – – –
See footnotes at end of table.
Page 69
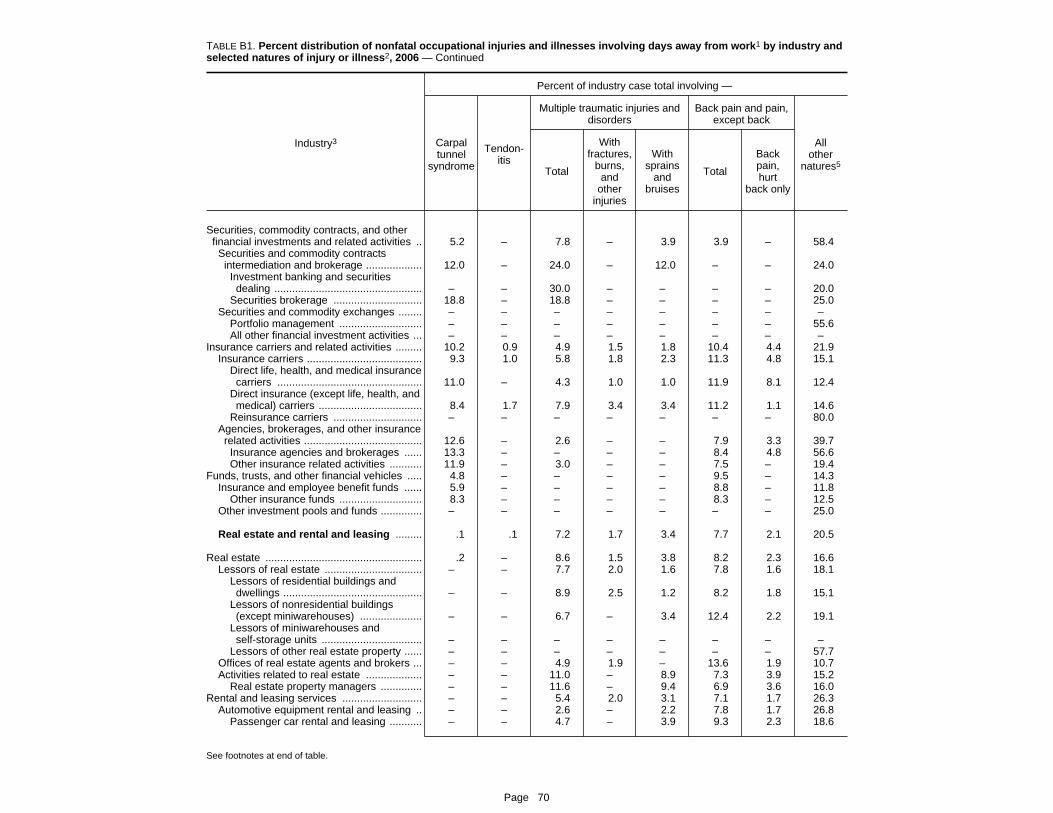
TABLE B1. Percent distribution of nonfatal occupational injuries and illnesses involving days away from work1 by industry andselected natures of injury or illness2, 2006 — Continued
Industry3
Percent of industry case total involving —
Carpaltunnel
syndrome
Tendon-itis
Multiple traumatic injuries anddisorders
Back pain and pain,except back
Allother
natures5Total
Withfractures,
burns,and
otherinjuries
Withsprains
andbruises
Total
Backpain,hurt
back only
Securities, commodity contracts, and otherfinancial investments and related activities .. 5.2 – 7.8 – 3.9 3.9 – 58.4
Securities and commodity contractsintermediation and brokerage ................... 12.0 – 24.0 – 12.0 – – 24.0
Investment banking and securitiesdealing .................................................. – – 30.0 – – – – 20.0
Securities brokerage .............................. 18.8 – 18.8 – – – – 25.0Securities and commodity exchanges ........ – – – – – – – –
Portfolio management ............................ – – – – – – – 55.6All other financial investment activities ... – – – – – – – –
Insurance carriers and related activities ......... 10.2 0.9 4.9 1.5 1.8 10.4 4.4 21.9Insurance carriers ....................................... 9.3 1.0 5.8 1.8 2.3 11.3 4.8 15.1
Direct life, health, and medical insurancecarriers ................................................. 11.0 – 4.3 1.0 1.0 11.9 8.1 12.4
Direct insurance (except life, health, andmedical) carriers ................................... 8.4 1.7 7.9 3.4 3.4 11.2 1.1 14.6
Reinsurance carriers .............................. – – – – – – – 80.0Agencies, brokerages, and other insurancerelated activities ........................................ 12.6 – 2.6 – – 7.9 3.3 39.7
Insurance agencies and brokerages ...... 13.3 – – – – 8.4 4.8 56.6Other insurance related activities ........... 11.9 – 3.0 – – 7.5 – 19.4
Funds, trusts, and other financial vehicles ..... 4.8 – – – – 9.5 – 14.3Insurance and employee benefit funds ...... 5.9 – – – – 8.8 – 11.8
Other insurance funds ............................ 8.3 – – – – 8.3 – 12.5Other investment pools and funds .............. – – – – – – – 25.0
Real estate and rental and leasing ......... .1 .1 7.2 1.7 3.4 7.7 2.1 20.5
Real estate ..................................................... .2 – 8.6 1.5 3.8 8.2 2.3 16.6Lessors of real estate ................................. – – 7.7 2.0 1.6 7.8 1.6 18.1
Lessors of residential buildings anddwellings ............................................... – – 8.9 2.5 1.2 8.2 1.8 15.1
Lessors of nonresidential buildings(except miniwarehouses) ..................... – – 6.7 – 3.4 12.4 2.2 19.1
Lessors of miniwarehouses andself-storage units .................................. – – – – – – – –
Lessors of other real estate property ...... – – – – – – – 57.7Offices of real estate agents and brokers ... – – 4.9 1.9 – 13.6 1.9 10.7Activities related to real estate ................... – – 11.0 – 8.9 7.3 3.9 15.2
Real estate property managers .............. – – 11.6 – 9.4 6.9 3.6 16.0Rental and leasing services ........................... – – 5.4 2.0 3.1 7.1 1.7 26.3
Automotive equipment rental and leasing .. – – 2.6 – 2.2 7.8 1.7 26.8Passenger car rental and leasing ........... – – 4.7 – 3.9 9.3 2.3 18.6
See footnotes at end of table.
Page 70

TABLE B1. Percent distribution of nonfatal occupational injuries and illnesses involving days away from work1 by industry and selectednatures of injury or illness2, 2006 — Continued
Industry3 NAICScode4
Totalcases
Percent of industry case total involving —
Sprains,strains Fractures Cuts,
punctures Bruises Heatburns
Chemicalburns
Amputa-tions
Truck, utility trailer, and rv (recreationalvehicle) rental and leasing .................... 53212 1,020 28.4 – 5.9 12.7 4.9 – –
Video tape and disc rental ...................... 53223 170 76.5 – – – – – –Other consumer goods rental ................. 53229 920 46.7 7.6 – – – – –
Commercial and industrial machinery andequipment rental and leasing ................... 5324 2,110 20.9 8.1 13.7 14.7 2.4 – –Construction, transportation, mining, and
forestry machinery and equipmentrental and leasing ................................. 53241 1,610 21.1 8.1 8.7 19.3 3.1 – –
Lessors of nonfinancial intangible assets(except copyrighted works) .......................... 533 30 – 66.7 – – – – –
Professional and business services .. 89,940 36.6 7.1 9.9 8.4 .8 0.8 0.5
Professional, scientific, and technicalservices ................................................... 54 22,350 34.7 8.3 10.6 6.5 .7 .4 –
Professional, scientific, and technicalservices ........................................................ 541 22,350 34.7 8.3 10.6 6.5 .7 .4 –Legal services ............................................ 5411 1,910 51.3 4.2 – 4.2 – – –Accounting, tax preparation, bookkeeping,
and payroll services .................................. 5412 1,800 40.0 4.4 7.2 16.7 – – –Accounting, tax preparation,
bookkeeping, and payroll services ....... 54121 1,800 40.0 4.4 7.2 16.7 – – –Tax preparation services .................... 541213 40 75.0 – – – – – –Other accounting services .................. 541219 730 45.2 – – – – – –
Architectural, engineering, and relatedservices .................................................... 5413 6,360 32.5 5.3 17.3 7.4 .9 1.1 –Architectural services ............................. 54131 490 – – – – – – –Engineering services .............................. 54133 4,040 42.1 5.7 17.8 9.2 – 1.5 –Surveying and mapping (except
geophysical) services ........................... 54137 340 – – – – – – –Computer systems design services .... 541512 930 12.9 – – – – – –Computer facilities management
services ............................................ 541513 50 – – – – – – –Other computer related services ........ 541519 110 – – – 18.2 – – –
Management, scientific, and technicalconsulting services ................................... 5416 1,360 41.2 11.0 5.1 – – – –Management consulting services ........... 54161 920 34.8 10.9 7.6 – – – –Environmental consulting services ......... 54162 140 – – – – – – –
Scientific research and developmentservices .................................................... 5417 2,000 45.5 7.0 6.0 5.0 – – –
Advertising and related services ................ 5418 2,070 30.4 9.7 10.6 5.3 – – –
See footnotes at end of table.
Page 71

TABLE B1. Percent distribution of nonfatal occupational injuries and illnesses involving days away from work1 by industry andselected natures of injury or illness2, 2006 — Continued
Industry3
Percent of industry case total involving —
Carpaltunnel
syndrome
Tendon-itis
Multiple traumatic injuries anddisorders
Back pain and pain,except back
Allother
natures5Total
Withfractures,
burns,and
otherinjuries
Withsprains
andbruises
Total
Backpain,hurt
back only
Truck, utility trailer, and rv (recreationalvehicle) rental and leasing .................... – – – – – 5.9 – 37.3
Video tape and disc rental ...................... – – – – – – – –Other consumer goods rental ................. – – 14.1 12.0 – 8.7 4.3 14.1
Commercial and industrial machinery andequipment rental and leasing ................... – – 1.9 – – 3.8 – 34.1
Construction, transportation, mining, andforestry machinery and equipmentrental and leasing ................................. – – – – – – – 36.0
Lessors of nonfinancial intangible assets(except copyrighted works) .......................... – – – – – – – –
Professional and business services .. 0.9 0.5 4.2 1.5 1.5 9.5 2.5 20.9
Professional, scientific, and technicalservices ................................................... 1.4 1.3 1.7 .6 .4 8.7 1.4 25.5
Professional, scientific, and technicalservices ........................................................ 1.4 1.3 1.7 .6 .4 8.7 1.4 25.5
Legal services ............................................ 3.1 – 1.0 – – 6.3 2.6 28.3Accounting, tax preparation, bookkeeping,and payroll services .................................. 1.7 – 1.7 – – 3.9 2.2 25.0
Accounting, tax preparation,bookkeeping, and payroll services ....... 1.7 – 1.7 – – 3.9 2.2 25.0
Tax preparation services .................... – – – – – – – –Other accounting services .................. – – – – – – – 37.0
Architectural, engineering, and relatedservices .................................................... .8 3.8 2.4 1.1 .8 7.7 .6 20.6
Architectural services ............................. – – – – – 51.0 – 32.7Engineering services .............................. – 5.7 3.0 1.7 – 5.4 – 8.7Surveying and mapping (exceptgeophysical) services ........................... – – – – – – – 44.1
Computer systems design services .... 7.5 – – – – 16.1 – 25.8Computer facilities managementservices ............................................ – – – – – – – 40.0
Other computer related services ........ – – – – – 36.4 – –Management, scientific, and technicalconsulting services ................................... – – – – – 13.2 – 22.8
Management consulting services ........... – – 3.3 – – 19.6 – 19.6Environmental consulting services ......... – – – – – – – 64.3
Scientific research and developmentservices .................................................... 3.0 1.5 2.5 1.0 – 10.0 5.5 18.5
Advertising and related services ................ – – 3.4 – – 22.2 – 17.9
See footnotes at end of table.
Page 72
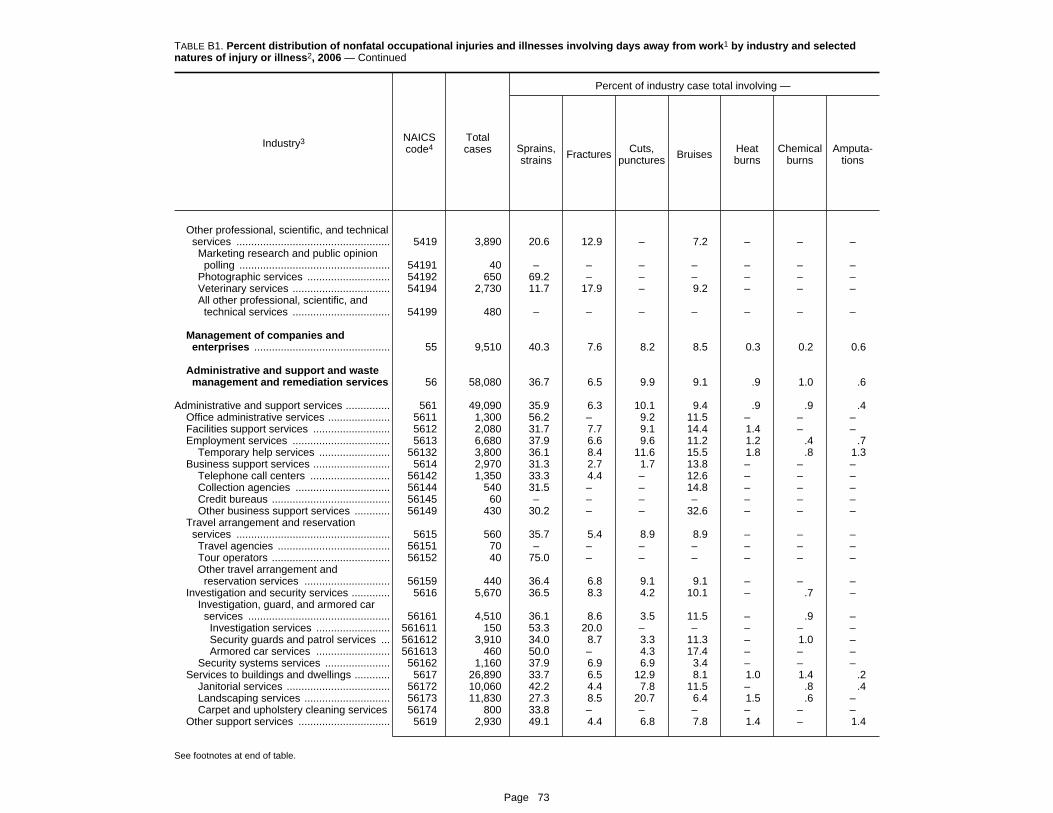
TABLE B1. Percent distribution of nonfatal occupational injuries and illnesses involving days away from work1 by industry and selectednatures of injury or illness2, 2006 — Continued
Industry3 NAICScode4
Totalcases
Percent of industry case total involving —
Sprains,strains Fractures Cuts,
punctures Bruises Heatburns
Chemicalburns
Amputa-tions
Other professional, scientific, and technicalservices .................................................... 5419 3,890 20.6 12.9 – 7.2 – – –Marketing research and public opinion
polling ................................................... 54191 40 – – – – – – –Photographic services ............................ 54192 650 69.2 – – – – – –Veterinary services ................................. 54194 2,730 11.7 17.9 – 9.2 – – –All other professional, scientific, and
technical services ................................. 54199 480 – – – – – – –
Management of companies andenterprises .............................................. 55 9,510 40.3 7.6 8.2 8.5 0.3 0.2 0.6
Administrative and support and wastemanagement and remediation services 56 58,080 36.7 6.5 9.9 9.1 .9 1.0 .6
Administrative and support services ............... 561 49,090 35.9 6.3 10.1 9.4 .9 .9 .4Office administrative services ..................... 5611 1,300 56.2 – 9.2 11.5 – – –Facilities support services .......................... 5612 2,080 31.7 7.7 9.1 14.4 1.4 – –Employment services ................................. 5613 6,680 37.9 6.6 9.6 11.2 1.2 .4 .7
Temporary help services ........................ 56132 3,800 36.1 8.4 11.6 15.5 1.8 .8 1.3Business support services .......................... 5614 2,970 31.3 2.7 1.7 13.8 – – –
Telephone call centers ........................... 56142 1,350 33.3 4.4 – 12.6 – – –Collection agencies ................................ 56144 540 31.5 – – 14.8 – – –Credit bureaus ........................................ 56145 60 – – – – – – –Other business support services ............ 56149 430 30.2 – – 32.6 – – –
Travel arrangement and reservationservices .................................................... 5615 560 35.7 5.4 8.9 8.9 – – –Travel agencies ...................................... 56151 70 – – – – – – –Tour operators ........................................ 56152 40 75.0 – – – – – –Other travel arrangement and
reservation services ............................. 56159 440 36.4 6.8 9.1 9.1 – – –Investigation and security services ............. 5616 5,670 36.5 8.3 4.2 10.1 – .7 –
Investigation, guard, and armored carservices ................................................ 56161 4,510 36.1 8.6 3.5 11.5 – .9 –Investigation services ......................... 561611 150 53.3 20.0 – – – – –Security guards and patrol services ... 561612 3,910 34.0 8.7 3.3 11.3 – 1.0 –Armored car services ......................... 561613 460 50.0 – 4.3 17.4 – – –
Security systems services ...................... 56162 1,160 37.9 6.9 6.9 3.4 – – –Services to buildings and dwellings ............ 5617 26,890 33.7 6.5 12.9 8.1 1.0 1.4 .2
Janitorial services ................................... 56172 10,060 42.2 4.4 7.8 11.5 – .8 .4Landscaping services ............................. 56173 11,830 27.3 8.5 20.7 6.4 1.5 .6 –Carpet and upholstery cleaning services 56174 800 33.8 – – – – – –
Other support services ............................... 5619 2,930 49.1 4.4 6.8 7.8 1.4 – 1.4
See footnotes at end of table.
Page 73

TABLE B1. Percent distribution of nonfatal occupational injuries and illnesses involving days away from work1 by industry andselected natures of injury or illness2, 2006 — Continued
Industry3
Percent of industry case total involving —
Carpaltunnel
syndrome
Tendon-itis
Multiple traumatic injuries anddisorders
Back pain and pain,except back
Allother
natures5Total
Withfractures,
burns,and
otherinjuries
Withsprains
andbruises
Total
Backpain,hurt
back only
Other professional, scientific, and technicalservices .................................................... – – – – – 4.9 – 53.0
Marketing research and public opinionpolling ................................................... – – – – – 50.0 – –
Photographic services ............................ – – – – – – – –Veterinary services ................................. – – – – – – – 58.6All other professional, scientific, andtechnical services ................................. – – – – – – – 91.7
Management of companies andenterprises .............................................. 2.4 0.3 4.6 1.7 1.6 11.0 2.9 15.8
Administrative and support and wastemanagement and remediation services .4 .2 5.1 1.9 2.0 9.6 2.9 20.0
Administrative and support services ............... .4 .2 4.8 1.5 2.1 10.1 3.1 20.5Office administrative services ..................... – – 3.8 – 3.8 – – 13.8Facilities support services .......................... – – 2.9 – 1.4 7.7 1.4 23.6Employment services ................................. – .4 4.3 .9 1.6 8.2 2.8 19.3
Temporary help services ........................ – .5 3.2 – 1.3 7.9 1.8 12.6Business support services .......................... 3.7 – 6.7 2.0 3.4 16.2 4.4 22.9
Telephone call centers ........................... 4.4 – 6.7 – 5.2 18.5 2.2 18.5Collection agencies ................................ 7.4 – 11.1 – 5.6 18.5 9.3 14.8Credit bureaus ........................................ – – – – – – – –Other business support services ............ – – – – – 18.6 – 16.3
Travel arrangement and reservationservices .................................................... 5.4 – – – – 19.6 10.7 10.7
Travel agencies ...................................... 28.6 – – – – – – –Tour operators ........................................ – – – – – – – –Other travel arrangement andreservation services ............................. – – – – – 25.0 13.6 9.1
Investigation and security services ............. .4 – 8.5 1.9 3.7 10.9 1.9 19.8Investigation, guard, and armored carservices ................................................ – – 8.4 2.4 2.7 12.4 2.0 17.5
Investigation services ......................... – – – – – 13.3 – 13.3Security guards and patrol services ... – – 9.2 2.6 2.8 13.0 2.0 18.2Armored car services ......................... – – – – – 6.5 – 10.9
Security systems services ...................... – – 8.6 – 8.6 5.2 – 29.3Services to buildings and dwellings ............ – .1 4.2 1.7 1.8 10.7 3.5 21.0
Janitorial services ................................... – .2 6.2 1.2 3.9 12.1 3.2 13.9Landscaping services ............................. – – 3.4 2.7 .5 5.9 .8 25.5Carpet and upholstery cleaning services – – – – – – – –
Other support services ............................... – – 4.4 1.7 .7 4.8 1.7 19.1
See footnotes at end of table.
Page 74

TABLE B1. Percent distribution of nonfatal occupational injuries and illnesses involving days away from work1 by industry and selectednatures of injury or illness2, 2006 — Continued
Industry3 NAICScode4
Totalcases
Percent of industry case total involving —
Sprains,strains Fractures Cuts,
punctures Bruises Heatburns
Chemicalburns
Amputa-tions
Waste management and remediationservices ........................................................ 562 9,000 41.3 7.7 8.9 7.2 0.4 1.2 2.0Waste collection ......................................... 5621 4,620 43.1 6.1 8.0 6.1 .4 1.5 1.7
Waste collection ..................................... 56211 4,620 43.1 6.1 8.0 6.1 .4 1.5 1.7Solid waste collection ......................... 562111 4,080 41.2 6.4 7.8 5.9 .5 1.7 1.7
Waste treatment and disposal .................... 5622 2,150 44.7 7.9 6.5 9.3 – .9 –Waste treatment and disposal ................ 56221 2,150 44.7 7.9 6.5 9.3 – .9 –
Hazardous waste treatment anddisposal ............................................ 562211 360 38.9 16.7 – 8.3 – – –
Solid waste landfill .............................. 562212 1,450 45.5 6.2 7.6 9.7 – – –Other nonhazardous waste treatment
and disposal ..................................... 562219 290 48.3 – – 10.3 – – –Remediation and other waste management
services .................................................... 5629 2,230 34.5 10.8 13.0 7.6 .9 .9 –Remediation services ............................. 56291 980 26.5 17.3 20.4 8.2 – 2.0 –All other waste management services .... 56299 790 48.1 3.8 – 7.6 – – –
Education and health services ............ 182,210 49.4 5.8 3.2 8.6 1.2 .4 10( )
Educational services ................................ 61 10,390 36.8 10.7 5.5 8.4 1.9 .7 .2
Educational services ...................................... 611 10,390 36.8 10.7 5.5 8.4 1.9 .7 .2Elementary and secondary schools ........... 6111 3,760 35.4 10.6 4.5 10.1 – .5 –Junior colleges ........................................... 6112 220 40.9 22.7 – 13.6 – – –Colleges, universities, and professional
schools ..................................................... 6113 4,850 42.3 8.0 7.8 8.7 1.2 .8 –Business schools and computer and
management training ................................ 6114 80 25.0 37.5 – – – – –Professional and management
development training ............................ 61143 60 – 50.0 – – – – –Technical and trade schools ....................... 6115 460 – – – – – – –Other schools and instruction ..................... 6116 590 23.7 27.1 – – – – –
Fine arts schools .................................... 61161 40 – 75.0 – – – – –Sports and recreation instruction ............ 61162 200 45.0 40.0 – – – – –All other schools and instruction ............. 61169 350 – – – – – – –
Educational support services ..................... 6117 420 19.0 19.0 – – – – –
Health care and social assistance .......... 62 171,820 50.1 5.5 3.1 8.6 1.1 .4 10( )
Ambulatory health care services .................... 621 31,700 43.8 7.8 3.4 5.0 1.2 .6 –Offices of physicians .................................. 6211 6,550 35.1 7.2 2.7 4.6 4.9 2.4 –
Offices of physicians .............................. 62111 6,550 35.1 7.2 2.7 4.6 4.9 2.4 –Offices of physicians (except mental
health specialists) ............................. 621111 6,440 34.9 7.0 2.5 4.3 5.0 2.5 –
See footnotes at end of table.
Page 75

TABLE B1. Percent distribution of nonfatal occupational injuries and illnesses involving days away from work1 by industry andselected natures of injury or illness2, 2006 — Continued
Industry3
Percent of industry case total involving —
Carpaltunnel
syndrome
Tendon-itis
Multiple traumatic injuries anddisorders
Back pain and pain,except back
Allother
natures5Total
Withfractures,
burns,and
otherinjuries
Withsprains
andbruises
Total
Backpain,hurt
back only
Waste management and remediationservices ........................................................ 0.2 – 7.0 3.8 1.6 6.4 2.1 17.3
Waste collection ......................................... – – 9.3 6.5 1.1 6.1 1.9 17.1Waste collection ..................................... – – 9.3 6.5 1.1 6.1 1.9 17.1
Solid waste collection ......................... – – 10.5 7.4 1.2 5.9 2.2 18.1Waste treatment and disposal .................... – – 5.6 .9 2.3 5.6 .9 18.1
Waste treatment and disposal ................ – – 5.6 .9 2.3 5.6 .9 18.1Hazardous waste treatment anddisposal ............................................ – – 5.6 – – 8.3 – 16.7
Solid waste landfill .............................. – – 6.2 – 2.1 6.2 1.4 17.9Other nonhazardous waste treatmentand disposal ..................................... – – – – – – – 24.1
Remediation and other waste managementservices .................................................... – – 3.6 .9 1.8 8.1 3.6 16.6
Remediation services ............................. – – 5.1 – 3.1 6.1 3.1 13.3All other waste management services .... – – – – – 10.1 5.1 26.6
Education and health services ............ .7 0.4 4.3 .6 2.2 11.7 4.4 14.2
Educational services ................................ .8 – 4.5 .8 1.8 13.5 4.1 16.9
Educational services ...................................... .8 – 4.5 .8 1.8 13.5 4.1 16.9Elementary and secondary schools ........... – – 5.3 .8 2.1 14.6 7.4 18.9Junior colleges ........................................... – – – – – 9.1 – 9.1Colleges, universities, and professionalschools ..................................................... 1.6 – 5.2 .8 1.9 9.7 2.9 14.4
Business schools and computer andmanagement training ................................ – – – – – 25.0 – –
Professional and managementdevelopment training ............................ – – – – – – – –
Technical and trade schools ....................... – – – – – 67.4 – –Other schools and instruction ..................... – – – – – – – 45.8
Fine arts schools .................................... – – – – – – – –Sports and recreation instruction ............ – – – – – – – –All other schools and instruction ............. – – – – – – – 71.4
Educational support services ..................... – – – – – 9.5 – 14.3
Health care and social assistance .......... .7 .4 4.3 .6 2.3 11.6 4.4 14.1
Ambulatory health care services .................... 1.5 .5 5.5 .5 2.7 11.8 4.0 18.9Offices of physicians .................................. 1.4 – 5.2 – 2.4 12.8 3.5 23.5
Offices of physicians .............................. 1.4 – 5.2 – 2.4 12.8 3.5 23.5Offices of physicians (except mentalhealth specialists) ............................. 1.4 – 5.3 – 2.5 13.0 3.6 23.9
See footnotes at end of table.
Page 76

TABLE B1. Percent distribution of nonfatal occupational injuries and illnesses involving days away from work1 by industry and selectednatures of injury or illness2, 2006 — Continued
Industry3 NAICScode4
Totalcases
Percent of industry case total involving —
Sprains,strains Fractures Cuts,
punctures Bruises Heatburns
Chemicalburns
Amputa-tions
Offices of physicians, mental healthspecialists ......................................... 621112 110 36.4 – 18.2 18.2 – – –
Offices of dentists ....................................... 6212 2,180 6.9 31.7 – – – – –Offices of other health practitioners ............ 6213 700 28.6 18.6 14.3 – – – –Outpatient care centers .............................. 6214 4,280 46.7 7.7 6.1 6.5 – – –Medical and diagnostic laboratories ........... 6215 910 48.4 15.4 – 4.4 – – –Home health care services ......................... 6216 11,370 42.9 5.9 3.2 5.9 0.3 – –Other ambulatory health care services ....... 6219 5,700 69.1 .9 1.2 3.5 – – –
Ambulance services ............................... 62191 4,730 72.9 .6 1.5 3.0 – – –All other ambulatory health care
services ................................................ 62199 970 51.5 3.1 – 6.2 – – –Hospitals ......................................................... 622 60,720 55.1 4.9 2.7 10.6 .9 0.4 0.1
General medical and surgical hospitals ...... 6221 56,850 55.6 4.8 2.7 10.4 .9 .4 .1Psychiatric and substance abuse hospitals 6222 1,840 42.4 6.5 3.3 15.8 – – –Specialty (except psychiatric and
substance abuse) hospitals ...................... 6223 2,030 53.7 5.9 2.0 9.4 1.0 – –Nursing and residential care facilities ............. 623 60,030 51.4 4.2 2.9 8.4 1.3 .4 10( )
Nursing care facilities ................................. 6231 37,870 53.1 3.6 2.4 8.1 1.3 .4 –Residential mental retardation, mental
health and substance abuse facilities ....... 6232 7,640 44.4 5.5 3.8 10.3 .8 – –Community care facilities for the elderly ..... 6233 10,940 54.4 3.7 3.5 7.5 1.8 .5 –Other residential care facilities ................... 6239 3,570 39.8 9.2 4.8 11.2 .8 – –
Social assistance ............................................ 624 19,380 40.6 7.9 4.6 9.2 1.3 .2 –Individual and family services ..................... 6241 9,030 41.7 7.9 3.1 7.5 .6 – –
Child and youth services ........................ 62411 1,090 41.3 13.8 2.8 4.6 – – –Services for the elderly and persons with
disabilities ............................................. 62412 6,450 40.6 7.8 2.2 8.1 .6 – –Other individual and family services ....... 62419 1,500 46.7 4.0 8.0 8.0 – – –
Community food and housing, andemergency and other relief services ........ 6242 1,500 28.7 – 1.3 10.7 – – –Community food services ....................... 62421 260 69.2 – – 7.7 – – –Community housing services ................. 62422 780 17.9 – – 5.1 – – –Emergency and other relief services ...... 62423 470 23.4 – – 23.4 – – –
Vocational rehabilitation services ............... 6243 4,700 36.8 7.4 10.0 14.3 .4 .4 –Child day care services .............................. 6244 4,150 46.5 11.3 3.1 6.5 4.3 – –
Leisure and hospitality ........................ 96,910 32.9 6.7 16.4 8.6 6.3 .9 .5
Arts, entertainment, and recreation ........ 71 14,980 40.3 8.9 9.3 8.7 1.5 .8 .5
Performing arts, spectator sports, and relatedindustries ...................................................... 711 3,600 50.8 9.7 5.0 8.3 – – –Performing arts companies ........................ 7111 780 47.4 7.7 9.0 3.8 – – –Spectator sports ......................................... 7112 1,950 50.8 8.2 4.1 10.3 – – –
See footnotes at end of table.
Page 77
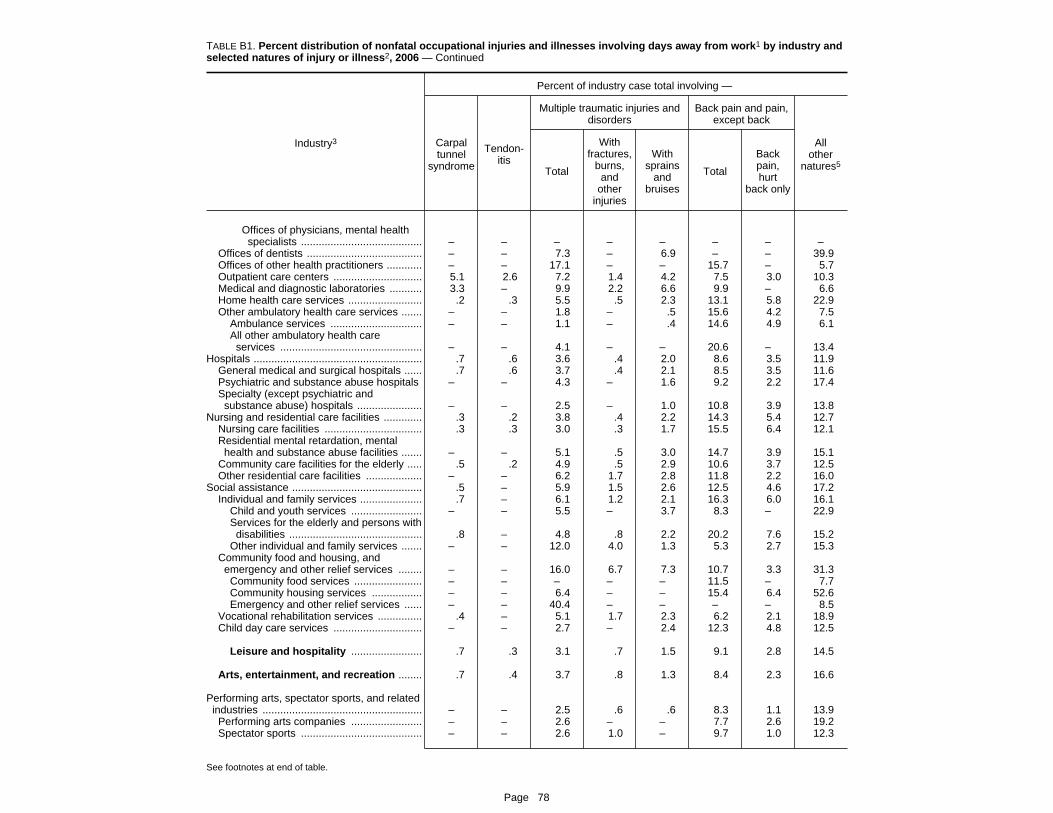
TABLE B1. Percent distribution of nonfatal occupational injuries and illnesses involving days away from work1 by industry andselected natures of injury or illness2, 2006 — Continued
Industry3
Percent of industry case total involving —
Carpaltunnel
syndrome
Tendon-itis
Multiple traumatic injuries anddisorders
Back pain and pain,except back
Allother
natures5Total
Withfractures,
burns,and
otherinjuries
Withsprains
andbruises
Total
Backpain,hurt
back only
Offices of physicians, mental healthspecialists ......................................... – – – – – – – –
Offices of dentists ....................................... – – 7.3 – 6.9 – – 39.9Offices of other health practitioners ............ – – 17.1 – – 15.7 – 5.7Outpatient care centers .............................. 5.1 2.6 7.2 1.4 4.2 7.5 3.0 10.3Medical and diagnostic laboratories ........... 3.3 – 9.9 2.2 6.6 9.9 – 6.6Home health care services ......................... .2 .3 5.5 .5 2.3 13.1 5.8 22.9Other ambulatory health care services ....... – – 1.8 – .5 15.6 4.2 7.5
Ambulance services ............................... – – 1.1 – .4 14.6 4.9 6.1All other ambulatory health careservices ................................................ – – 4.1 – – 20.6 – 13.4
Hospitals ......................................................... .7 .6 3.6 .4 2.0 8.6 3.5 11.9General medical and surgical hospitals ...... .7 .6 3.7 .4 2.1 8.5 3.5 11.6Psychiatric and substance abuse hospitals – – 4.3 – 1.6 9.2 2.2 17.4Specialty (except psychiatric andsubstance abuse) hospitals ...................... – – 2.5 – 1.0 10.8 3.9 13.8
Nursing and residential care facilities ............. .3 .2 3.8 .4 2.2 14.3 5.4 12.7Nursing care facilities ................................. .3 .3 3.0 .3 1.7 15.5 6.4 12.1Residential mental retardation, mentalhealth and substance abuse facilities ....... – – 5.1 .5 3.0 14.7 3.9 15.1
Community care facilities for the elderly ..... .5 .2 4.9 .5 2.9 10.6 3.7 12.5Other residential care facilities ................... – – 6.2 1.7 2.8 11.8 2.2 16.0
Social assistance ............................................ .5 – 5.9 1.5 2.6 12.5 4.6 17.2Individual and family services ..................... .7 – 6.1 1.2 2.1 16.3 6.0 16.1
Child and youth services ........................ – – 5.5 – 3.7 8.3 – 22.9Services for the elderly and persons withdisabilities ............................................. .8 – 4.8 .8 2.2 20.2 7.6 15.2
Other individual and family services ....... – – 12.0 4.0 1.3 5.3 2.7 15.3Community food and housing, andemergency and other relief services ........ – – 16.0 6.7 7.3 10.7 3.3 31.3
Community food services ....................... – – – – – 11.5 – 7.7Community housing services ................. – – 6.4 – – 15.4 6.4 52.6Emergency and other relief services ...... – – 40.4 – – – – 8.5
Vocational rehabilitation services ............... .4 – 5.1 1.7 2.3 6.2 2.1 18.9Child day care services .............................. – – 2.7 – 2.4 12.3 4.8 12.5
Leisure and hospitality ........................ .7 .3 3.1 .7 1.5 9.1 2.8 14.5
Arts, entertainment, and recreation ........ .7 .4 3.7 .8 1.3 8.4 2.3 16.6
Performing arts, spectator sports, and relatedindustries ...................................................... – – 2.5 .6 .6 8.3 1.1 13.9
Performing arts companies ........................ – – 2.6 – – 7.7 2.6 19.2Spectator sports ......................................... – – 2.6 1.0 – 9.7 1.0 12.3
See footnotes at end of table.
Page 78
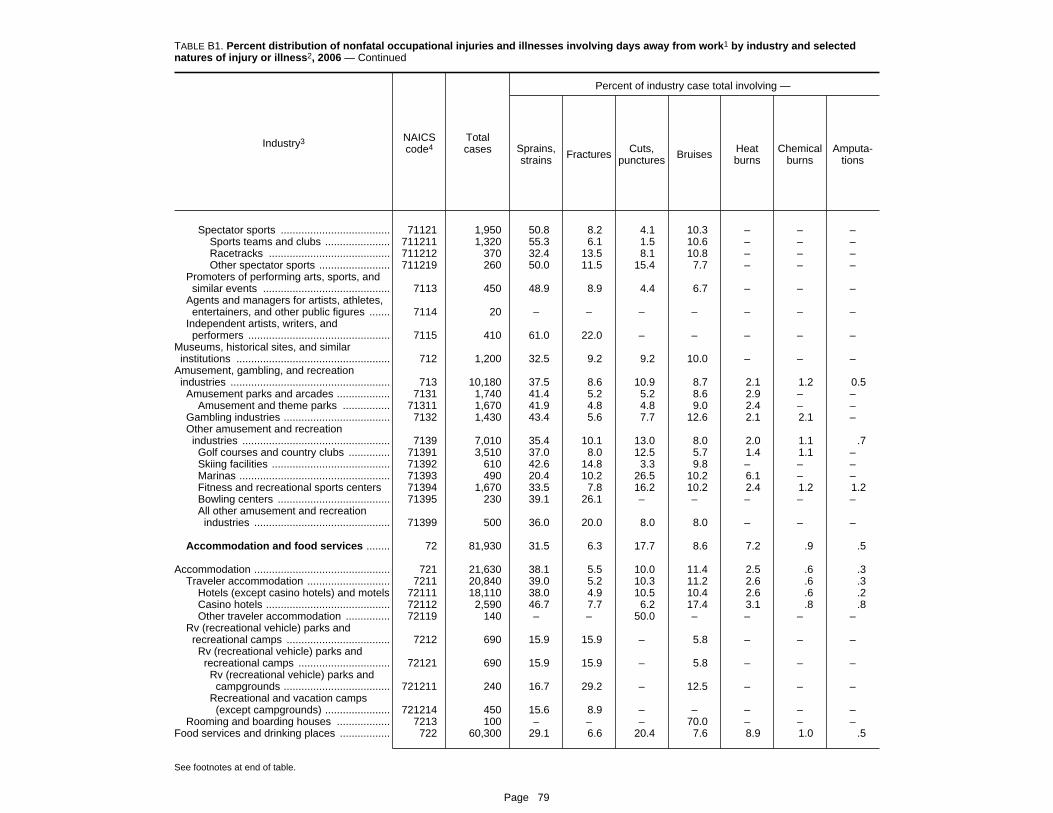
TABLE B1. Percent distribution of nonfatal occupational injuries and illnesses involving days away from work1 by industry and selectednatures of injury or illness2, 2006 — Continued
Industry3 NAICScode4
Totalcases
Percent of industry case total involving —
Sprains,strains Fractures Cuts,
punctures Bruises Heatburns
Chemicalburns
Amputa-tions
Spectator sports ..................................... 71121 1,950 50.8 8.2 4.1 10.3 – – –Sports teams and clubs ...................... 711211 1,320 55.3 6.1 1.5 10.6 – – –Racetracks ......................................... 711212 370 32.4 13.5 8.1 10.8 – – –Other spectator sports ........................ 711219 260 50.0 11.5 15.4 7.7 – – –
Promoters of performing arts, sports, andsimilar events ........................................... 7113 450 48.9 8.9 4.4 6.7 – – –
Agents and managers for artists, athletes,entertainers, and other public figures ....... 7114 20 – – – – – – –
Independent artists, writers, andperformers ................................................ 7115 410 61.0 22.0 – – – – –
Museums, historical sites, and similarinstitutions .................................................... 712 1,200 32.5 9.2 9.2 10.0 – – –
Amusement, gambling, and recreationindustries ...................................................... 713 10,180 37.5 8.6 10.9 8.7 2.1 1.2 0.5Amusement parks and arcades .................. 7131 1,740 41.4 5.2 5.2 8.6 2.9 – –
Amusement and theme parks ................ 71311 1,670 41.9 4.8 4.8 9.0 2.4 – –Gambling industries .................................... 7132 1,430 43.4 5.6 7.7 12.6 2.1 2.1 –Other amusement and recreation
industries .................................................. 7139 7,010 35.4 10.1 13.0 8.0 2.0 1.1 .7Golf courses and country clubs .............. 71391 3,510 37.0 8.0 12.5 5.7 1.4 1.1 –Skiing facilities ........................................ 71392 610 42.6 14.8 3.3 9.8 – – –Marinas ................................................... 71393 490 20.4 10.2 26.5 10.2 6.1 – –Fitness and recreational sports centers 71394 1,670 33.5 7.8 16.2 10.2 2.4 1.2 1.2Bowling centers ...................................... 71395 230 39.1 26.1 – – – – –All other amusement and recreation
industries .............................................. 71399 500 36.0 20.0 8.0 8.0 – – –
Accommodation and food services ........ 72 81,930 31.5 6.3 17.7 8.6 7.2 .9 .5
Accommodation .............................................. 721 21,630 38.1 5.5 10.0 11.4 2.5 .6 .3Traveler accommodation ............................ 7211 20,840 39.0 5.2 10.3 11.2 2.6 .6 .3
Hotels (except casino hotels) and motels 72111 18,110 38.0 4.9 10.5 10.4 2.6 .6 .2Casino hotels .......................................... 72112 2,590 46.7 7.7 6.2 17.4 3.1 .8 .8Other traveler accommodation ............... 72119 140 – – 50.0 – – – –
Rv (recreational vehicle) parks andrecreational camps ................................... 7212 690 15.9 15.9 – 5.8 – – –Rv (recreational vehicle) parks and
recreational camps ............................... 72121 690 15.9 15.9 – 5.8 – – –Rv (recreational vehicle) parks and
campgrounds .................................... 721211 240 16.7 29.2 – 12.5 – – –Recreational and vacation camps
(except campgrounds) ...................... 721214 450 15.6 8.9 – – – – –Rooming and boarding houses .................. 7213 100 – – – 70.0 – – –
Food services and drinking places ................. 722 60,300 29.1 6.6 20.4 7.6 8.9 1.0 .5
See footnotes at end of table.
Page 79

TABLE B1. Percent distribution of nonfatal occupational injuries and illnesses involving days away from work1 by industry andselected natures of injury or illness2, 2006 — Continued
Industry3
Percent of industry case total involving —
Carpaltunnel
syndrome
Tendon-itis
Multiple traumatic injuries anddisorders
Back pain and pain,except back
Allother
natures5Total
Withfractures,
burns,and
otherinjuries
Withsprains
andbruises
Total
Backpain,hurt
back only
Spectator sports ..................................... – – 2.6 1.0 – 9.7 1.0 12.3Sports teams and clubs ...................... – – 2.3 – – 11.4 – 12.9Racetracks ......................................... – – 5.4 – – 8.1 – 16.2Other spectator sports ........................ – – – – – – – 7.7
Promoters of performing arts, sports, andsimilar events ........................................... – – – – – 4.4 – 20.0
Agents and managers for artists, athletes,entertainers, and other public figures ....... – – – – – – – –
Independent artists, writers, andperformers ................................................ – – – – – – – –
Museums, historical sites, and similarinstitutions .................................................... – – 3.3 – 1.7 8.3 2.5 25.0
Amusement, gambling, and recreationindustries ...................................................... 0.8 0.5 4.2 .9 1.5 8.4 2.7 16.5
Amusement parks and arcades .................. 2.9 1.7 2.9 – 1.1 13.8 3.4 14.9Amusement and theme parks ................ 3.0 1.8 2.4 – 1.2 14.4 3.6 15.6
Gambling industries .................................... 1.4 – 3.5 – 2.1 11.2 2.1 11.2Other amusement and recreationindustries .................................................. .3 – 4.7 1.1 1.4 6.6 2.6 17.8
Golf courses and country clubs .............. – – 5.4 1.1 1.1 8.8 3.4 19.1Skiing facilities ........................................ – – 6.6 3.3 – 3.3 – 16.4Marinas ................................................... – – – – – – – 20.4Fitness and recreational sports centers – – 5.4 – 3.0 6.6 2.4 15.6Bowling centers ...................................... – – – – – – – –All other amusement and recreationindustries .............................................. – – – – – 4.0 – 20.0
Accommodation and food services ........ .7 .3 3.0 .7 1.6 9.2 2.9 14.1
Accommodation .............................................. .3 .3 3.6 .3 2.1 12.3 4.2 15.1Traveler accommodation ............................ .3 .3 3.6 .2 2.2 12.5 4.2 13.9
Hotels (except casino hotels) and motels .3 .3 3.4 .3 2.0 14.0 4.7 14.5Casino hotels .......................................... – – 5.4 – 3.5 2.7 – 8.9Other traveler accommodation ............... – – – – – – – 28.6
Rv (recreational vehicle) parks andrecreational camps ................................... – – – – – 5.8 4.3 50.7
Rv (recreational vehicle) parks andrecreational camps ............................... – – – – – 5.8 4.3 50.7
Rv (recreational vehicle) parks andcampgrounds .................................... – – – – – – – 33.3
Recreational and vacation camps(except campgrounds) ...................... – – – – – 6.7 6.7 62.2
Rooming and boarding houses .................. – – – – – – – –Food services and drinking places ................. .8 .2 2.8 .8 1.4 8.1 2.5 13.8
See footnotes at end of table.
Page 80

TABLE B1. Percent distribution of nonfatal occupational injuries and illnesses involving days away from work1 by industry and selectednatures of injury or illness2, 2006 — Continued
Industry3 NAICScode4
Totalcases
Percent of industry case total involving —
Sprains,strains Fractures Cuts,
punctures Bruises Heatburns
Chemicalburns
Amputa-tions
Full-service restaurants .............................. 7221 24,900 30.0 4.7 26.7 7.6 7.6 1.8 1.0Limited-service eating places ..................... 7222 29,750 28.4 7.6 14.6 7.4 9.9 .5 .2
Limited-service eating places ................. 72221 29,750 28.4 7.6 14.6 7.4 9.9 .5 .2Limited-service restaurants ................ 722211 25,080 28.1 8.8 14.2 8.2 9.2 .6 .3Cafeterias ........................................... 722212 550 40.0 – 16.4 7.3 18.2 – –
Special food services ................................. 7223 4,670 30.0 12.2 15.4 9.9 11.3 – –Drinking places (alcoholic beverages) ........ 7224 980 23.5 – 66.3 – – – –
Other services ...................................... 27,640 38.6 7.7 11.3 6.7 1.8 .3 .3
Other services, except publicadministration ......................................... 81 27,640 38.6 7.7 11.3 6.7 1.8 .3 .3
Repair and maintenance ................................ 811 13,050 37.9 10.2 16.2 5.6 1.5 – –Automotive repair and maintenance ........... 8111 8,200 30.0 13.7 19.9 6.6 2.3 – –Electronic and precision equipment repair
and maintenance ...................................... 8112 830 63.9 – – – – – –
See footnotes at end of table.
Page 81

TABLE B1. Percent distribution of nonfatal occupational injuries and illnesses involving days away from work1 by industry andselected natures of injury or illness2, 2006 — Continued
Industry3
Percent of industry case total involving —
Carpaltunnel
syndrome
Tendon-itis
Multiple traumatic injuries anddisorders
Back pain and pain,except back
Allother
natures5Total
Withfractures,
burns,and
otherinjuries
Withsprains
andbruises
Total
Backpain,hurt
back only
Full-service restaurants .............................. 0.2 0.4 2.1 0.3 1.2 6.8 1.7 11.2Limited-service eating places ..................... 1.4 – 3.4 1.3 1.5 9.9 3.3 16.5
Limited-service eating places ................. 1.4 – 3.4 1.3 1.5 9.9 3.3 16.5Limited-service restaurants ................ 1.7 – 2.3 – 1.5 10.4 3.8 16.4Cafeterias ........................................... – – 5.5 – 5.5 7.3 5.5 5.5
Special food services ................................. – .4 2.4 – 1.3 4.9 2.1 13.1Drinking places (alcoholic beverages) ........ – – – – – – – –
Other services ...................................... 1.3 .5 3.7 .9 1.6 9.4 2.0 18.5
Other services, except publicadministration ......................................... 1.3 .5 3.7 .9 1.6 9.4 2.0 18.5
Repair and maintenance ................................ .5 .3 3.5 .9 1.1 7.0 .6 16.8Automotive repair and maintenance ........... .5 – 3.7 .6 1.1 9.0 .7 13.4Electronic and precision equipment repairand maintenance ...................................... – – 8.4 – 7.2 4.8 – 18.1
See footnotes at end of table.
Page 82
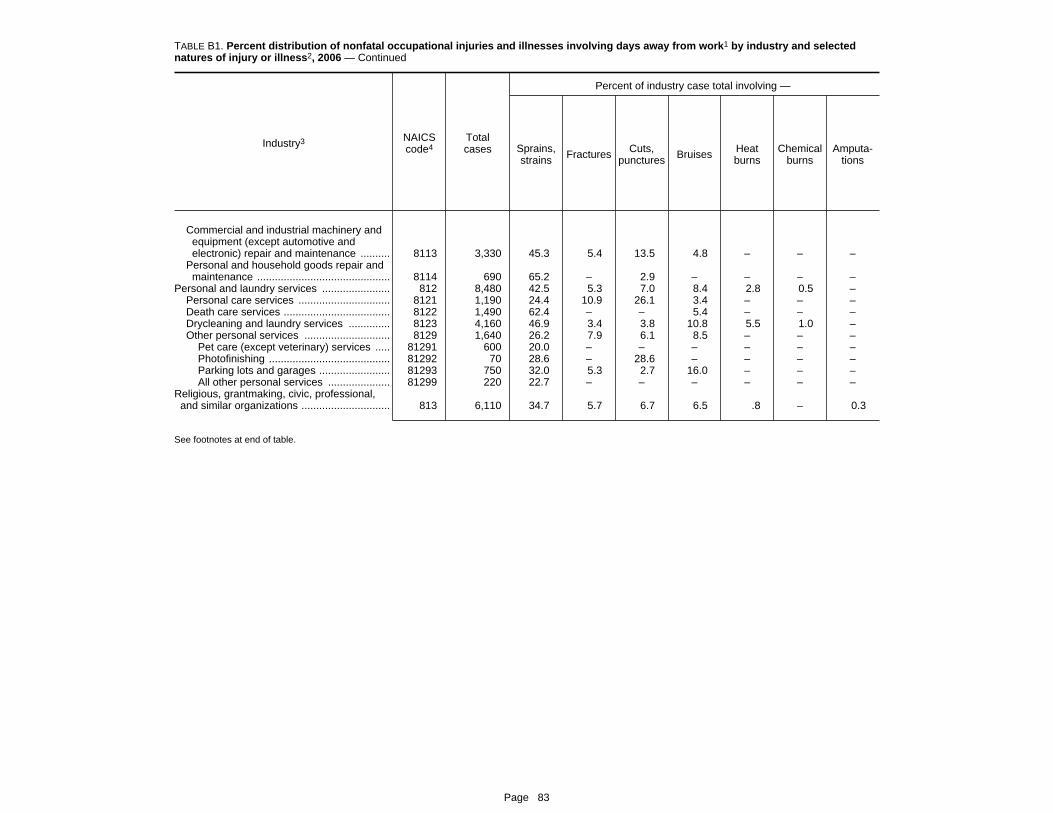
TABLE B1. Percent distribution of nonfatal occupational injuries and illnesses involving days away from work1 by industry and selectednatures of injury or illness2, 2006 — Continued
Industry3 NAICScode4
Totalcases
Percent of industry case total involving —
Sprains,strains Fractures Cuts,
punctures Bruises Heatburns
Chemicalburns
Amputa-tions
Commercial and industrial machinery andequipment (except automotive andelectronic) repair and maintenance .......... 8113 3,330 45.3 5.4 13.5 4.8 – – –
Personal and household goods repair andmaintenance ............................................. 8114 690 65.2 – 2.9 – – – –
Personal and laundry services ....................... 812 8,480 42.5 5.3 7.0 8.4 2.8 0.5 –Personal care services ............................... 8121 1,190 24.4 10.9 26.1 3.4 – – –Death care services .................................... 8122 1,490 62.4 – – 5.4 – – –Drycleaning and laundry services .............. 8123 4,160 46.9 3.4 3.8 10.8 5.5 1.0 –Other personal services ............................. 8129 1,640 26.2 7.9 6.1 8.5 – – –
Pet care (except veterinary) services ..... 81291 600 20.0 – – – – – –Photofinishing ......................................... 81292 70 28.6 – 28.6 – – – –Parking lots and garages ........................ 81293 750 32.0 5.3 2.7 16.0 – – –All other personal services ..................... 81299 220 22.7 – – – – – –
Religious, grantmaking, civic, professional,and similar organizations .............................. 813 6,110 34.7 5.7 6.7 6.5 .8 – 0.3
See footnotes at end of table.
Page 83

TABLE B1. Percent distribution of nonfatal occupational injuries and illnesses involving days away from work1 by industry andselected natures of injury or illness2, 2006 — Continued
Industry3
Percent of industry case total involving —
Carpaltunnel
syndrome
Tendon-itis
Multiple traumatic injuries anddisorders
Back pain and pain,except back
Allother
natures5Total
Withfractures,
burns,and
otherinjuries
Withsprains
andbruises
Total
Backpain,hurt
back only
Commercial and industrial machinery andequipment (except automotive andelectronic) repair and maintenance .......... – – 2.4 1.8 – 3.3 – 24.3
Personal and household goods repair andmaintenance ............................................. – – – – – 4.3 – 18.8
Personal and laundry services ....................... 2.7 1.1 4.1 1.2 1.9 6.5 1.8 19.1Personal care services ............................... 10.1 – 5.9 – 5.9 2.5 – 15.1Death care services .................................... – – 6.0 – – – – 13.4Drycleaning and laundry services .............. 2.2 .5 2.6 – 1.0 8.4 2.4 14.9Other personal services ............................. – – 4.9 – 3.0 7.3 – 37.8
Pet care (except veterinary) services ..... – – – – – – – 43.3Photofinishing ......................................... – – – – – – – –Parking lots and garages ........................ – – 5.3 – 2.7 5.3 – 32.0All other personal services ..................... – – – – – – – 54.5
Religious, grantmaking, civic, professional,and similar organizations .............................. 1.0 .3 3.4 .5 2.0 18.8 5.4 21.3
1 Days-away-from-work cases include those that resulted in daysaway from work, some of which also included job transfer or restriction.
2 Data shown in columns correspond to the following Nature codes: Sprains, strains = 021; Fractures = 012; Cuts, punctures = 034, 037;Bruises = 043; Heat burns = 053; Chemical burns = 051; Amputations =031; Carpal tunnel syndrome = 1241; Tendonitis = 1733; Multiple traumaticinjuries and illnesses, Total = 080-089; With fractures, burns, and otherinjuries = 083, 084; With sprains and bruises = 082; Back pain and pain,except back, Total = 0972, 0973; Back pain, hurt back only = 0972; Allother natures = all remaining codes, including 9999 (Nonclassifiable). These codes are based on the 1992 Occupational Injury and IllnessClassification System developed by the Bureau of Labor Statistics.
3 Totals include data for industries not shown separately.4 North American Industry Classification System — United States,
20025 Includes nonclassifiable responses.6 Excludes farms with fewer than 11 employees.7 Data for Mining (Sector 21 in the North American Industry
Classification System-- United States, 2002) include establishments notgoverned by the Mine Safety and Health Administration rules andreporting, such as those in Oil and Gas Extraction and related supportactivities. Data for mining operators in coal, metal, and nonmetal miningare provided to BLS by the Mine Safety and Health Administration, U.S.
Department of Labor. Independent mining contractors are excluded fromthe coal, metal, and nonmetal mining industries. These data do not reflectthe changes the Occupational Safety and Health Administration made toits recordkeeping requirements effective January 1, 2002; therefore,estimates for these industries are not comparable to estimates in otherindustries.
8 Data for mining operators in this industry are provided to BLS by theMine Safety and Health Administration, U.S. Department of Labor. Independent mining contractors are excluded. These data do not reflectthe changes the Occupational Safety and Health Administration made toits recordkeeping requirements effective January 1, 2002; therefore,estimates for these industries are not comparable to estimates in otherindustries.
9 Data for employers in rail transportation are provided to BLS by theFederal Railroad Administration, U.S. Department of Transportation.
10 Data too small to be displayed.
NOTE: Dash indicates data do not meet publication guidelines. Because of rounding and data exclusion of nonclassifiable responses, datamay not sum to the totals.
SOURCE: Bureau of Labor Statistics, U.S. Department of Labor,Survey of Occupational Injuries and Illnesses in cooperation withparticipating State agencies
Page 84