Table A1. Total energy supply, disposition, and price ... · U.S. Energy Information Administration...
40
U.S. Energy Information Administration / Annual Energy Outlook 2018 1 Table A1. Total energy supply, disposition, and price summary (quadrillion Btu per year, unless otherwise noted) Supply, disposition, and prices Reference case Annual growth 2017-2050 (percent) 2016 2017 2025 2030 2035 2040 2050 Production Crude oil and lease condensate ........................... 18.60 19.34 23.69 24.30 24.60 24.69 23.42 0.6% Natural gas plant liquids ....................................... 4.72 5.04 6.84 7.13 7.23 7.28 7.40 1.2% Dry natural gas ..................................................... 27.91 28.07 37.07 39.19 40.11 41.60 44.53 1.4% Coal 1 ..................................................................... 15.30 15.93 14.96 15.16 14.96 15.26 15.23 -0.1% Nuclear / uranium 2 ................................................ 8.41 8.29 7.52 7.28 6.99 6.96 6.64 -0.7% Conventional hydroelectric power ......................... 2.47 2.73 2.74 2.74 2.74 2.74 2.75 0.0% Biomass 3 ............................................................... 4.31 4.20 4.50 4.62 4.76 4.89 5.11 0.6% Other renewable energy 4 ...................................... 3.11 3.44 5.79 6.28 7.40 8.09 9.47 3.1% Other 5 ................................................................... 0.78 1.33 0.90 0.74 0.78 0.81 0.83 -1.4% Total .................................................................. 85.60 88.37 104.01 107.44 109.58 112.32 115.38 0.8% Imports Crude oil ............................................................... 17.34 17.29 15.36 14.78 15.33 15.39 15.94 -0.2% Petroleum and other liquids 6 ................................. 4.45 5.96 4.51 3.80 3.52 3.61 3.50 -1.6% Natural gas ........................................................... 3.10 3.10 2.66 2.46 2.28 2.01 1.21 -2.8% Other imports 7 ....................................................... 0.46 0.42 0.26 0.23 0.23 0.23 0.22 -1.9% Total .................................................................. 25.35 26.77 22.79 21.26 21.37 21.24 20.88 -0.8% Exports Petroleum and other liquids 8 ................................. 10.04 12.80 16.37 16.72 17.74 17.73 15.36 0.6% Natural gas ........................................................... 2.36 3.14 8.56 9.47 9.50 9.62 9.67 3.5% Coal ...................................................................... 1.60 1.95 1.76 1.77 1.84 2.16 2.11 0.2% Total .................................................................. 13.99 17.89 26.69 27.97 29.08 29.51 27.14 1.3% Discrepancy 9 .......................................................... 0.04 0.45 0.00 0.04 0.06 0.08 0.10 -- Consumption Petroleum and other liquids 10 ............................... 37.09 37.50 36.66 35.73 35.40 35.71 37.38 0.0% Natural gas ........................................................... 28.49 27.64 30.82 31.78 32.49 33.58 35.64 0.8% Coal 11 .................................................................... 14.16 14.20 13.27 13.43 13.16 13.14 13.15 -0.2% Nuclear / uranium 2 ................................................ 8.41 8.29 7.52 7.28 6.99 6.96 6.64 -0.7% Conventional hydroelectric power ......................... 2.47 2.73 2.74 2.74 2.74 2.74 2.75 0.0% Biomass 12 ............................................................. 2.81 2.65 2.96 3.09 3.25 3.38 3.62 0.9% Other renewable energy 4 ...................................... 3.11 3.44 5.79 6.28 7.40 8.09 9.47 3.1% Other 13 .................................................................. 0.37 0.35 0.34 0.36 0.36 0.37 0.37 0.2% Total .................................................................. 96.91 96.80 100.10 100.70 101.80 103.98 109.03 0.4% Prices (2017 dollars per unit) Crude oil spot prices (dollars per barrel) Brent .................................................................. 45 52 86 93 100 106 114 2.4% West Texas Intermediate ................................... 44 50 82 89 95 101 110 2.4% Natural gas at Henry Hub (dollars per million Btu) 2.57 3.05 4.07 4.26 4.26 4.50 5.01 1.5% Coal (dollars per ton) at the minemouth 14 ............................................ 33.0 32.9 34.0 35.0 36.6 38.7 39.8 0.6% Coal (dollars per million Btu) at the minemouth 14 ............................................ 1.65 1.63 1.69 1.75 1.82 1.91 1.97 0.6% Average end-use 15 ............................................. 2.33 2.28 2.43 2.45 2.50 2.56 2.63 0.4% Average electricity (cents per kilowatthour) .......... 10.5 10.6 11.1 11.2 11.2 11.2 11.0 0.1%
Transcript of Table A1. Total energy supply, disposition, and price ... · U.S. Energy Information Administration...

U.S. Energy Information Administration / Annual Energy Outlook 2018 1
Table A1. Total energy supply, disposition, and price summary (quadrillion Btu per year, unless otherwise noted)
Supply, disposition, and prices
Reference case
Annual growth
2017-2050 (percent)
2016
2017
2025
2030
2035
2040
2050
Production Crude oil and lease condensate ........................... 18.60 19.34 23.69 24.30 24.60 24.69 23.42 0.6% Natural gas plant liquids ....................................... 4.72 5.04 6.84 7.13 7.23 7.28 7.40 1.2% Dry natural gas ..................................................... 27.91 28.07 37.07 39.19 40.11 41.60 44.53 1.4% Coal1 ..................................................................... 15.30 15.93 14.96 15.16 14.96 15.26 15.23 -0.1% Nuclear / uranium2 ................................................ 8.41 8.29 7.52 7.28 6.99 6.96 6.64 -0.7% Conventional hydroelectric power ......................... 2.47 2.73 2.74 2.74 2.74 2.74 2.75 0.0% Biomass3............................................................... 4.31 4.20 4.50 4.62 4.76 4.89 5.11 0.6% Other renewable energy4 ...................................... 3.11 3.44 5.79 6.28 7.40 8.09 9.47 3.1% Other5 ................................................................... 0.78 1.33 0.90 0.74 0.78 0.81 0.83 -1.4% Total .................................................................. 85.60 88.37 104.01 107.44 109.58 112.32 115.38 0.8% Imports Crude oil ............................................................... 17.34 17.29 15.36 14.78 15.33 15.39 15.94 -0.2% Petroleum and other liquids6 ................................. 4.45 5.96 4.51 3.80 3.52 3.61 3.50 -1.6% Natural gas ........................................................... 3.10 3.10 2.66 2.46 2.28 2.01 1.21 -2.8% Other imports7 ....................................................... 0.46 0.42 0.26 0.23 0.23 0.23 0.22 -1.9% Total .................................................................. 25.35 26.77 22.79 21.26 21.37 21.24 20.88 -0.8% Exports Petroleum and other liquids8 ................................. 10.04 12.80 16.37 16.72 17.74 17.73 15.36 0.6% Natural gas ........................................................... 2.36 3.14 8.56 9.47 9.50 9.62 9.67 3.5% Coal ...................................................................... 1.60 1.95 1.76 1.77 1.84 2.16 2.11 0.2% Total .................................................................. 13.99 17.89 26.69 27.97 29.08 29.51 27.14 1.3% Discrepancy9 .......................................................... 0.04 0.45 0.00 0.04 0.06 0.08 0.10 - - Consumption Petroleum and other liquids10 ............................... 37.09 37.50 36.66 35.73 35.40 35.71 37.38 0.0% Natural gas ........................................................... 28.49 27.64 30.82 31.78 32.49 33.58 35.64 0.8% Coal11 .................................................................... 14.16 14.20 13.27 13.43 13.16 13.14 13.15 -0.2% Nuclear / uranium2 ................................................ 8.41 8.29 7.52 7.28 6.99 6.96 6.64 -0.7% Conventional hydroelectric power ......................... 2.47 2.73 2.74 2.74 2.74 2.74 2.75 0.0% Biomass12 ............................................................. 2.81 2.65 2.96 3.09 3.25 3.38 3.62 0.9% Other renewable energy4 ...................................... 3.11 3.44 5.79 6.28 7.40 8.09 9.47 3.1% Other13 .................................................................. 0.37 0.35 0.34 0.36 0.36 0.37 0.37 0.2% Total .................................................................. 96.91 96.80 100.10 100.70 101.80 103.98 109.03 0.4% Prices (2017 dollars per unit) Crude oil spot prices (dollars per barrel) Brent .................................................................. 45 52 86 93 100 106 114 2.4% West Texas Intermediate ................................... 44 50 82 89 95 101 110 2.4% Natural gas at Henry Hub (dollars per million Btu) 2.57 3.05 4.07 4.26 4.26 4.50 5.01 1.5% Coal (dollars per ton) at the minemouth14 ............................................ 33.0 32.9 34.0 35.0 36.6 38.7 39.8 0.6% Coal (dollars per million Btu) at the minemouth14 ............................................ 1.65 1.63 1.69 1.75 1.82 1.91 1.97 0.6% Average end-use15 ............................................. 2.33 2.28 2.43 2.45 2.50 2.56 2.63 0.4% Average electricity (cents per kilowatthour) .......... 10.5 10.6 11.1 11.2 11.2 11.2 11.0 0.1%

U.S. Energy Information Administration / Annual Energy Outlook 2018 2
Table A1. Total energy supply, disposition, and price summary (continued) (quadrillion Btu per year, unless otherwise noted)
Supply, disposition, and prices
Reference case
Annual growth
2017-2050 (percent)
2016
2017
2025
2030
2035
2040
2050
Prices (nominal dollars per unit) Crude oil spot prices (dollars per barrel) Brent .................................................................. 44 52 104 125 150 179 244 4.8% West Texas Intermediate ................................... 43 50 100 120 143 171 235 4.8% Natural gas at Henry Hub (dollars per million Btu) 2.53 3.05 4.93 5.75 6.41 7.59 10.78 3.9% Coal (dollars per ton) at the minemouth14 ............................................ 32.4 32.9 41.2 47.3 55.2 65.3 85.5 2.9% Coal (dollars per million Btu) at the minemouth14 ............................................ 1.62 1.63 2.05 2.36 2.74 3.22 4.23 2.9% Average end-use15 ............................................. 2.29 2.28 2.94 3.31 3.77 4.33 5.65 2.8% Average electricity (cents per kilowatthour) .......... 10.3 10.6 13.5 15.2 16.9 18.9 23.6 2.5%
1Includes waste coal. 2These values represent the energy obtained from uranium when it is used in light water reactors. The total energy content of uranium is much larger, but
alternative processes are required to take advantage of it. 3Includes grid-connected electricity from wood and wood waste; biomass, such as corn, used for liquid fuels production; and non-electric energy demand from
wood. Refer to Table A17 for details. 4Includes grid-connected electricity from landfill gas; biogenic municipal waste; wind; photovoltaic and solar thermal sources; and non-electric energy from
renewable sources, such as active and passive solar systems. Excludes electricity imports using renewable sources and nonmarketed renewable energy. See Table A17 for selected nonmarketed residential and commercial renewable energy data.
5Includes non-biogenic municipal waste, liquid hydrogen, methanol, and some domestic inputs to refineries. 6Includes imports of finished petroleum products, unfinished oils, alcohols, ethers, blending components, and renewable fuels such as ethanol. 7Includes coal, coal coke (net), and electricity (net). Excludes imports of fuel used in nuclear power plants. 8Includes crude oil, petroleum products, ethanol, and biodiesel. 9Balancing item. Includes unaccounted for supply, losses, gains, and net storage withdrawals. 10Estimated consumption. Includes petroleum-derived fuels and non-petroleum derived fuels, such as ethanol and biodiesel, and coal-based synthetic liquids.
Petroleum coke, which is a solid, is included. Also included are hydrocarbon gas liquids and crude oil consumed as a fuel. Refer to Table A17 for detailed renewable liquid fuels consumption.
11Excludes coal converted to coal-based synthetic liquids and natural gas. 12Includes grid-connected electricity from wood and wood waste, non-electric energy from wood, and biofuels heat and coproducts used in the production of liquid
fuels, but excludes the energy content of the liquid fuels. 13Includes non-biogenic municipal waste, liquid hydrogen, and net electricity imports. 14Includes reported prices for both open market and captive mines. Prices weighted by production, which differs from average minemouth prices published in EIA
data reports where it is weighted by reported sales. 15Prices weighted by consumption; weighted average excludes export free-alongside-ship (f.a.s.) prices. Btu = British thermal unit. - - = Not applicable. Note: Totals may not equal sum of components due to independent rounding. Data for 2016 are model results and may differ from official EIA data reports. Sources: 2016 natural gas supply values: U.S. Energy Information Administration (EIA), Natural Gas Monthly, July 2017). 2016 coal minemouth and delivered
coal prices: EIA, Annual Coal Report 2013. 2016 petroleum supply values: EIA, Petroleum Supply Annual 2016. 2016 crude oil spot prices and natural gas spot price at Henry Hub: Thomson Reuters. Other 2016 coal values: Quarterly Coal Report, October-December 2016. Other 2016 values: EIA, Monthly Energy Review, September 2017. 2017: EIA, Short-Term Energy Outlook, October 2017 and EIA, AEO2018 National Energy Modeling System run ref2018.d121317a. Projections: EIA, AEO2018 National Energy Modeling System run ref2018.d121317a.

U.S. Energy Information Administration / Annual Energy Outlook 2018 3
Table A2. Energy consumption by sector and source (quadrillion Btu per year, unless otherwise noted)
Sector and source
Reference case
Annual growth
2017-2050 (percent)
2016
2017
2025
2030
2035
2040
2050
Energy consumption Residential Propane .............................................................. 0.43 0.49 0.40 0.38 0.37 0.35 0.33 -1.2% Kerosene ............................................................ 0.01 0.01 0.01 0.01 0.01 0.01 0.00 -2.9% Distillate fuel oil ................................................... 0.43 0.47 0.39 0.35 0.32 0.29 0.24 -2.0% Petroleum and other liquids subtotal ................. 0.87 0.97 0.80 0.74 0.69 0.64 0.58 -1.6% Natural gas ......................................................... 4.51 4.54 4.74 4.74 4.72 4.69 4.70 0.1% Renewable energy1 ............................................ 0.34 0.33 0.37 0.34 0.32 0.30 0.27 -0.6% Electricity ............................................................ 4.80 4.69 4.74 4.81 4.89 5.02 5.27 0.4% Delivered energy ............................................. 10.53 10.53 10.66 10.63 10.62 10.65 10.82 0.1% Electricity related losses ..................................... 9.58 9.22 8.91 8.92 8.95 9.07 9.16 0.0% Total ................................................................. 20.11 19.75 19.57 19.55 19.57 19.72 19.98 0.0% Commercial Propane .............................................................. 0.14 0.14 0.17 0.18 0.19 0.20 0.22 1.3% Motor gasoline2 ................................................... 0.39 0.40 0.29 0.29 0.29 0.29 0.29 -0.9% Kerosene ............................................................ 0.00 0.00 0.00 0.00 0.00 0.01 0.01 3.5% Distillate fuel oil ................................................... 0.35 0.37 0.36 0.35 0.34 0.33 0.32 -0.5% Residual fuel oil .................................................. 0.01 0.01 0.05 0.05 0.05 0.05 0.05 6.8% Petroleum and other liquids subtotal ................. 0.89 0.92 0.88 0.87 0.87 0.87 0.89 -0.1% Natural gas ......................................................... 3.22 3.26 3.34 3.42 3.56 3.71 4.09 0.7% Coal .................................................................... 0.02 0.02 0.04 0.04 0.04 0.04 0.04 2.2% Renewable energy3 ............................................ 0.13 0.13 0.13 0.13 0.13 0.13 0.13 0.0% Electricity ............................................................ 4.64 4.61 4.77 4.84 4.92 5.05 5.51 0.5% Delivered energy ............................................. 8.91 8.94 9.15 9.31 9.53 9.80 10.66 0.5% Electricity related losses ..................................... 9.26 9.06 8.96 8.97 9.01 9.14 9.57 0.2% Total ................................................................. 18.16 18.01 18.12 18.28 18.54 18.94 20.23 0.4% Industrial4 Liquefied petroleum gases and other5 ................ 2.69 2.74 3.58 3.86 3.99 4.12 4.16 1.3% Motor gasoline2 ................................................... 0.26 0.26 0.28 0.28 0.29 0.29 0.31 0.5% Distillate fuel oil ................................................... 1.14 1.16 1.30 1.35 1.38 1.44 1.57 0.9% Residual fuel oil .................................................. 0.05 0.05 0.03 0.03 0.03 0.04 0.04 -0.6% Petrochemical feedstocks ................................... 0.64 0.71 1.05 1.17 1.24 1.30 1.32 1.9% Other petroleum6 ................................................ 3.37 3.41 3.57 3.63 3.79 3.93 4.20 0.6% Petroleum and other liquids subtotal ................. 8.15 8.33 9.81 10.32 10.72 11.12 11.59 1.0% Natural gas ......................................................... 8.01 8.06 9.17 9.46 9.81 10.22 10.80 0.9% Natural-gas-to-liquids heat and power ................ 0.00 0.00 0.00 0.00 0.00 0.00 0.00 - - Lease and plant fuel7 .......................................... 1.65 1.67 2.06 2.14 2.17 2.24 2.31 1.0% Natural gas to liquefy gas for export8 .................. 0.02 0.07 0.48 0.55 0.55 0.55 0.55 6.5% Natural gas subtotal .......................................... 9.68 9.80 11.71 12.15 12.53 13.02 13.67 1.0% Metallurgical coal ................................................ 0.47 0.52 0.44 0.47 0.51 0.52 0.51 -0.1% Other industrial coal ............................................ 0.69 0.65 0.76 0.73 0.70 0.70 0.70 0.2% Coal-to-liquids heat and power ........................... 0.00 0.00 0.00 0.00 0.00 0.00 0.00 - - Net coal coke imports ......................................... -0.02 -0.02 -0.02 -0.02 -0.02 -0.02 -0.01 -0.4% Coal subtotal ..................................................... 1.14 1.16 1.17 1.18 1.19 1.20 1.19 0.1% Biofuels heat and coproducts ............................. 0.83 0.82 0.86 0.86 0.86 0.86 0.83 0.0% Renewable energy9 ............................................ 1.47 1.46 1.76 1.97 2.17 2.34 2.68 1.9% Electricity ............................................................ 3.19 3.23 3.75 3.89 3.98 4.10 4.26 0.8% Delivered energy ............................................. 24.46 24.78 29.06 30.38 31.45 32.63 34.22 1.0% Electricity related losses ..................................... 6.37 6.34 7.04 7.21 7.28 7.41 7.40 0.5% Total ................................................................. 30.84 31.13 36.10 37.59 38.73 40.04 41.61 0.9%

U.S. Energy Information Administration / Annual Energy Outlook 2018 4
Table A2. Energy consumption by sector and source (continued) (quadrillion Btu per year, unless otherwise noted)
Sector and source
Reference case
Annual growth
2017-2050 (percent)
2016
2017
2025
2030
2035
2040
2050
Transportation Propane .............................................................. 0.01 0.01 0.01 0.01 0.01 0.01 0.02 1.8% Motor gasoline2 ................................................... 16.60 16.62 14.10 12.62 11.76 11.39 11.72 -1.1% of which: E8510................................................ 0.01 0.01 0.22 0.27 0.30 0.30 0.16 8.8% Jet fuel11 ............................................................. 2.77 2.79 3.17 3.44 3.71 3.99 4.56 1.5% Distillate fuel oil12 ................................................ 6.55 6.66 6.41 6.23 6.12 6.17 6.44 -0.1% Residual fuel oil .................................................. 0.70 0.70 0.69 0.67 0.64 0.60 0.56 -0.7% Other petroleum13 ............................................... 0.16 0.16 0.16 0.16 0.16 0.16 0.17 0.2% Petroleum and other liquids subtotal ................. 26.78 26.94 24.54 23.13 22.40 22.32 23.47 -0.4% Pipeline and distribution fuel natural gas ............ 0.70 0.64 0.70 0.70 0.71 0.72 0.75 0.5% Compressed / liquefied natural gas .................... 0.07 0.08 0.18 0.24 0.31 0.40 0.61 6.2% Liquid hydrogen .................................................. 0.00 0.00 0.02 0.03 0.04 0.04 0.05 13.5% Electricity ............................................................ 0.03 0.04 0.13 0.22 0.32 0.41 0.57 8.5% Delivered energy ............................................. 27.59 27.70 25.58 24.32 23.78 23.89 25.44 -0.3% Electricity related losses ..................................... 0.07 0.08 0.25 0.41 0.58 0.74 0.99 8.1% Total ................................................................. 27.66 27.77 25.83 24.74 24.36 24.62 26.44 -0.1% Unspecified sector14 ........................................... 0.14 0.15 0.49 0.55 0.60 0.66 0.77 5.1% Delivered energy consumption for all sectors Liquefied petroleum gases and other5 ................ 3.27 3.38 4.17 4.44 4.56 4.68 4.72 1.0% Motor gasoline2 ................................................... 17.28 17.24 14.68 13.21 12.35 11.98 12.33 -1.0% of which: E8510................................................ 0.01 0.01 0.22 0.27 0.30 0.30 0.16 8.8% Jet fuel11 ............................................................. 3.33 3.42 3.82 4.14 4.47 4.80 5.50 1.5% Kerosene ............................................................ 0.01 0.01 0.01 0.01 0.01 0.01 0.01 -0.5% Distillate fuel oil ................................................... 8.03 8.23 8.29 8.10 7.99 8.06 8.39 0.1% Residual fuel oil .................................................. 0.75 0.75 0.78 0.75 0.72 0.68 0.65 -0.4% Petrochemical feedstocks ................................... 0.64 0.71 1.05 1.17 1.24 1.30 1.32 1.9% Other petroleum15 ............................................... 3.53 3.57 3.73 3.79 3.95 4.09 4.37 0.6% Petroleum and other liquids subtotal ................. 36.83 37.31 36.53 35.61 35.29 35.61 37.29 0.0% Natural gas ......................................................... 15.81 15.94 17.43 17.87 18.41 19.02 20.20 0.7% Natural-gas-to-liquids heat and power ................ 0.00 0.00 0.00 0.00 0.00 0.00 0.00 - - Lease and plant fuel7 .......................................... 1.65 1.67 2.06 2.14 2.17 2.24 2.31 1.0% Natural gas to liquefy gas for export8 .................. 0.02 0.07 0.48 0.55 0.55 0.55 0.55 6.5% Pipeline and distribution fuel natural gas ............ 0.70 0.64 0.70 0.70 0.71 0.72 0.75 0.5% Natural gas subtotal .......................................... 18.18 18.32 20.67 21.26 21.84 22.53 23.81 0.8% Metallurgical coal ................................................ 0.47 0.52 0.44 0.47 0.51 0.52 0.51 -0.1% Other coal ........................................................... 0.72 0.67 0.79 0.77 0.74 0.73 0.73 0.3% Coal-to-liquids heat and power ........................... 0.00 0.00 0.00 0.00 0.00 0.00 0.00 - - Net coal coke imports ......................................... -0.02 -0.02 -0.02 -0.02 -0.02 -0.02 -0.01 -0.4% Coal subtotal ..................................................... 1.17 1.17 1.21 1.21 1.23 1.23 1.23 0.1% Biofuels heat and coproducts ............................. 0.83 0.82 0.86 0.86 0.86 0.86 0.83 0.0% Renewable energy16 ........................................... 1.95 1.92 2.26 2.45 2.62 2.77 3.09 1.4% Liquid hydrogen .................................................. 0.00 0.00 0.02 0.03 0.04 0.04 0.05 13.5% Electricity ............................................................ 12.67 12.56 13.39 13.76 14.11 14.58 15.61 0.7% Delivered energy ............................................. 71.63 72.10 74.93 75.18 75.98 77.62 81.91 0.4% Electricity related losses ..................................... 25.28 24.70 25.17 25.51 25.82 26.36 27.12 0.3% Total ................................................................. 96.91 96.80 100.10 100.70 101.80 103.98 109.03 0.4% Electric power17 Distillate fuel oil ................................................... 0.06 0.10 0.09 0.08 0.07 0.07 0.07 -1.2% Residual fuel oil .................................................. 0.19 0.09 0.04 0.04 0.04 0.03 0.02 -4.5% Petroleum and other liquids subtotal ................. 0.25 0.19 0.14 0.12 0.11 0.10 0.09 -2.4% Natural gas ......................................................... 10.31 9.32 10.15 10.52 10.65 11.05 11.83 0.7% Steam coal .......................................................... 13.00 13.02 12.06 12.22 11.93 11.91 11.92 -0.3% Nuclear / uranium18 ............................................. 8.41 8.29 7.52 7.28 6.99 6.96 6.64 -0.7% Renewable energy19 ........................................... 5.61 6.08 8.37 8.81 9.91 10.58 11.93 2.1% Non-biogenic municipal waste ............................ 0.13 0.13 0.13 0.13 0.13 0.13 0.13 0.0% Electricity imports ................................................ 0.24 0.22 0.19 0.20 0.19 0.19 0.19 -0.5% Total ................................................................. 37.95 37.26 38.56 39.27 39.93 40.94 42.73 0.4%

U.S. Energy Information Administration / Annual Energy Outlook 2018 5
Table A2. Energy consumption by sector and source (continued) (quadrillion Btu per year, unless otherwise noted)
Sector and source
Reference case
Annual growth
2017-2050 (percent)
2016
2017
2025
2030
2035
2040
2050
Total energy consumption Liquefied petroleum gases and other5 ................ 3.27 3.38 4.17 4.44 4.56 4.68 4.72 1.0% Motor gasoline2 ................................................... 17.28 17.24 14.68 13.21 12.35 11.98 12.33 -1.0% of which: E8510................................................ 0.01 0.01 0.22 0.27 0.30 0.30 0.16 8.8% Jet fuel11 ............................................................. 3.33 3.42 3.82 4.14 4.47 4.80 5.50 1.5% Kerosene ............................................................ 0.01 0.01 0.01 0.01 0.01 0.01 0.01 -0.5% Distillate fuel oil ................................................... 8.09 8.33 8.38 8.18 8.06 8.13 8.46 0.0% Residual fuel oil .................................................. 0.94 0.85 0.82 0.79 0.76 0.71 0.67 -0.7% Petrochemical feedstocks ................................... 0.64 0.71 1.05 1.17 1.24 1.30 1.32 1.9% Other petroleum15 ............................................... 3.53 3.57 3.73 3.79 3.95 4.09 4.37 0.6% Petroleum and other liquids subtotal ................. 37.09 37.50 36.66 35.73 35.40 35.71 37.38 0.0% Natural gas ......................................................... 26.12 25.27 27.59 28.39 29.06 30.07 32.03 0.7% Natural-gas-to-liquids heat and power ................ 0.00 0.00 0.00 0.00 0.00 0.00 0.00 - - Lease and plant fuel7 .......................................... 1.65 1.67 2.06 2.14 2.17 2.24 2.31 1.0% Natural gas to liquefy gas for export8 .................. 0.02 0.07 0.48 0.55 0.55 0.55 0.55 6.5% Pipeline and distribution fuel natural gas ............ 0.70 0.64 0.70 0.70 0.71 0.72 0.75 0.5% Natural gas subtotal .......................................... 28.49 27.64 30.82 31.78 32.49 33.58 35.64 0.8% Metallurgical coal ................................................ 0.47 0.52 0.44 0.47 0.51 0.52 0.51 -0.1% Other coal ........................................................... 13.71 13.69 12.85 12.99 12.67 12.64 12.65 -0.2% Coal-to-liquids heat and power ........................... 0.00 0.00 0.00 0.00 0.00 0.00 0.00 - - Net coal coke imports ......................................... -0.02 -0.02 -0.02 -0.02 -0.02 -0.02 -0.01 -0.4% Coal subtotal ..................................................... 14.16 14.20 13.27 13.43 13.16 13.14 13.15 -0.2% Nuclear / uranium18 ............................................. 8.41 8.29 7.52 7.28 6.99 6.96 6.64 -0.7% Biofuels heat and coproducts ............................. 0.83 0.82 0.86 0.86 0.86 0.86 0.83 0.0% Renewable energy20 ........................................... 7.55 8.00 10.63 11.25 12.53 13.36 15.01 1.9% Liquid hydrogen .................................................. 0.00 0.00 0.02 0.03 0.04 0.04 0.05 13.5% Non-biogenic municipal waste ............................ 0.13 0.13 0.13 0.13 0.13 0.13 0.13 0.0% Electricity imports ................................................ 0.24 0.22 0.19 0.20 0.19 0.19 0.19 -0.5% Total ................................................................. 96.91 96.80 100.10 100.70 101.80 103.98 109.03 0.4% Energy use and related statistics Delivered energy use ............................................ 71.63 72.10 74.93 75.18 75.98 77.62 81.91 0.4% Total energy use ................................................... 96.91 96.80 100.10 100.70 101.80 103.98 109.03 0.4% Ethanol consumed in motor gasoline and E85 ..... 1.21 1.22 1.21 1.12 1.06 1.06 1.14 -0.2% Population (millions) ............................................. 324 326 347 359 370 379 398 0.6% Gross domestic product (billion 2009 dollars) ....... 16,716 17,075 20,221 22,421 24,802 27,356 33,205 2.0% Carbon dioxide emissions (million metric tons) ..... 5,174 5,151 5,079 5,053 5,024 5,080 5,279 0.1%
1Includes wood used for residential heating. See Table A4 and/or Table A17 for estimates of nonmarketed renewable energy consumption for geothermal heat
pumps, solar thermal water heating, and electricity generation from wind and solar photovoltaic sources. 2Includes ethanol and ethers blended into gasoline. 3Excludes ethanol. Includes commercial sector consumption of wood and wood waste, landfill gas, municipal waste, and other biomass for combined heat and
power. See Table A5 and/or Table A17 for estimates of nonmarketed renewable energy consumption for solar thermal water heating and electricity generation from wind and solar photovoltaic sources.
4Includes energy for combined heat and power plants that have a non-regulatory status, and small on-site generating systems. 5Includes ethane, natural gasoline, and refinery olefins. 6Includes petroleum coke, asphalt, road oil, lubricants, still gas, and miscellaneous petroleum products. 7Represents natural gas used in well, field, and lease operations, and in natural gas processing plant machinery. 8Fuel used in facilities that liquefy natural gas for export. 9Includes consumption of energy produced from hydroelectric, wood and wood waste, municipal waste, and other biomass sources. Excludes ethanol in motor
gasoline. 10E85 refers to a blend of 85 percent ethanol (renewable) and 15 percent motor gasoline (nonrenewable). To address cold starting issues, the percentage of
ethanol varies seasonally. The annual average ethanol content of 74 percent is used for these projections. 11Includes only kerosene type. 12Diesel fuel for on- and off- road use. 13Includes aviation gasoline and lubricants. 14Represents consumption unattributed to the sectors above. 15Includes aviation gasoline, petroleum coke, asphalt, road oil, lubricants, still gas, and miscellaneous petroleum products. 16Includes electricity generated for sale to the grid and for own use from renewable sources, and non-electric energy from renewable sources. Excludes ethanol
and nonmarketed renewable energy consumption for geothermal heat pumps, buildings photovoltaic systems, and solar thermal water heaters. 17Includes consumption of energy by electricity-only and combined heat and power plants that have a regulatory status. 18These values represent the energy obtained from uranium when it is used in light water reactors. The total energy content of uranium is much larger, but
alternative processes are required to take advantage of it. 19Includes conventional hydroelectric, geothermal, wood and wood waste, biogenic municipal waste, other biomass, wind, photovoltaic, and solar thermal sources.
Excludes net electricity imports. 20Includes conventional hydroelectric, geothermal, wood and wood waste, biogenic municipal waste, other biomass, wind, photovoltaic, and solar thermal sources.
Excludes ethanol, net electricity imports, and nonmarketed renewable energy consumption for geothermal heat pumps, buildings photovoltaic systems, and solar thermal water heaters.
Btu = British thermal unit. - - = Not applicable. Note: Includes estimated consumption for petroleum and other liquids. Totals may not equal sum of components due to independent rounding. Data for 2016
are model results and may differ from official EIA data reports. Sources: 2016 consumption based on: U.S. Energy Information Administration (EIA), Monthly Energy Review, September 2017. 2016 and 2017 population and
gross domestic product: IHS Markit, Macroeconomic model, August 2017. 2016 carbon dioxide emissions and emission factors: EIA, Monthly Energy Review, September 2017. 2017: EIA, Short-Term Energy Outlook, October 2017 and EIA, AEO2018 National Energy Modeling System run ref2018.d121317a. Projections: EIA, AEO2018 National Energy Modeling System run ref2018.d121317a.
U.S. Energy Information Administration / Annual Energy Outlook 2018 6
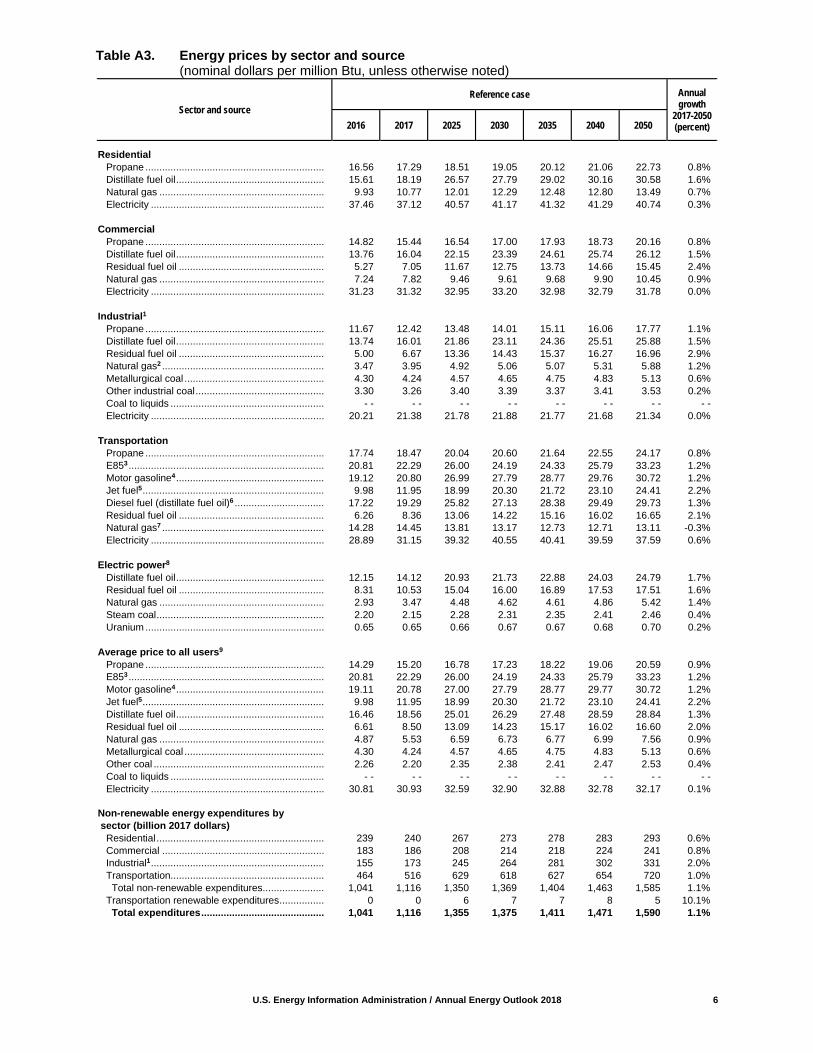
Table A3. Energy prices by sector and source (nominal dollars per million Btu, unless otherwise noted)
Sector and source
Reference case
Annual growth
2017-2050 (percent)
2016
2017
2025
2030
2035
2040
2050
Residential Propane ................................................................ 16.56 17.29 18.51 19.05 20.12 21.06 22.73 0.8% Distillate fuel oil ..................................................... 15.61 18.19 26.57 27.79 29.02 30.16 30.58 1.6% Natural gas ........................................................... 9.93 10.77 12.01 12.29 12.48 12.80 13.49 0.7% Electricity .............................................................. 37.46 37.12 40.57 41.17 41.32 41.29 40.74 0.3% Commercial Propane ................................................................ 14.82 15.44 16.54 17.00 17.93 18.73 20.16 0.8% Distillate fuel oil ..................................................... 13.76 16.04 22.15 23.39 24.61 25.74 26.12 1.5% Residual fuel oil .................................................... 5.27 7.05 11.67 12.75 13.73 14.66 15.45 2.4% Natural gas ........................................................... 7.24 7.82 9.46 9.61 9.68 9.90 10.45 0.9% Electricity .............................................................. 31.23 31.32 32.95 33.20 32.98 32.79 31.78 0.0% Industrial1 Propane ................................................................ 11.67 12.42 13.48 14.01 15.11 16.06 17.77 1.1% Distillate fuel oil ..................................................... 13.74 16.01 21.86 23.11 24.36 25.51 25.88 1.5% Residual fuel oil .................................................... 5.00 6.67 13.36 14.43 15.37 16.27 16.96 2.9% Natural gas2 .......................................................... 3.47 3.95 4.92 5.06 5.07 5.31 5.88 1.2% Metallurgical coal .................................................. 4.30 4.24 4.57 4.65 4.75 4.83 5.13 0.6% Other industrial coal .............................................. 3.30 3.26 3.40 3.39 3.37 3.41 3.53 0.2% Coal to liquids ....................................................... - - - - - - - - - - - - - - - - Electricity .............................................................. 20.21 21.38 21.78 21.88 21.77 21.68 21.34 0.0% Transportation Propane ................................................................ 17.74 18.47 20.04 20.60 21.64 22.55 24.17 0.8% E853 ...................................................................... 20.81 22.29 26.00 24.19 24.33 25.79 33.23 1.2% Motor gasoline4 ..................................................... 19.12 20.80 26.99 27.79 28.77 29.76 30.72 1.2% Jet fuel5 ................................................................. 9.98 11.95 18.99 20.30 21.72 23.10 24.41 2.2% Diesel fuel (distillate fuel oil)6 ................................ 17.22 19.29 25.82 27.13 28.38 29.49 29.73 1.3% Residual fuel oil .................................................... 6.26 8.36 13.06 14.22 15.16 16.02 16.65 2.1% Natural gas7 .......................................................... 14.28 14.45 13.81 13.17 12.73 12.71 13.11 -0.3% Electricity .............................................................. 28.89 31.15 39.32 40.55 40.41 39.59 37.59 0.6% Electric power8 Distillate fuel oil ..................................................... 12.15 14.12 20.93 21.73 22.88 24.03 24.79 1.7% Residual fuel oil .................................................... 8.31 10.53 15.04 16.00 16.89 17.53 17.51 1.6% Natural gas ........................................................... 2.93 3.47 4.48 4.62 4.61 4.86 5.42 1.4% Steam coal ............................................................ 2.20 2.15 2.28 2.31 2.35 2.41 2.46 0.4% Uranium ................................................................ 0.65 0.65 0.66 0.67 0.67 0.68 0.70 0.2% Average price to all users9 Propane ................................................................ 14.29 15.20 16.78 17.23 18.22 19.06 20.59 0.9% E853 ...................................................................... 20.81 22.29 26.00 24.19 24.33 25.79 33.23 1.2% Motor gasoline4 ..................................................... 19.11 20.78 27.00 27.79 28.77 29.77 30.72 1.2% Jet fuel5 ................................................................. 9.98 11.95 18.99 20.30 21.72 23.10 24.41 2.2% Distillate fuel oil ..................................................... 16.46 18.56 25.01 26.29 27.48 28.59 28.84 1.3% Residual fuel oil .................................................... 6.61 8.50 13.09 14.23 15.17 16.02 16.60 2.0% Natural gas ........................................................... 4.87 5.53 6.59 6.73 6.77 6.99 7.56 0.9% Metallurgical coal .................................................. 4.30 4.24 4.57 4.65 4.75 4.83 5.13 0.6% Other coal ............................................................. 2.26 2.20 2.35 2.38 2.41 2.47 2.53 0.4% Coal to liquids ....................................................... - - - - - - - - - - - - - - - - Electricity .............................................................. 30.81 30.93 32.59 32.90 32.88 32.78 32.17 0.1% Non-renewable energy expenditures by sector (billion 2017 dollars) Residential ............................................................ 239 240 267 273 278 283 293 0.6% Commercial .......................................................... 183 186 208 214 218 224 241 0.8% Industrial1 .............................................................. 155 173 245 264 281 302 331 2.0% Transportation....................................................... 464 516 629 618 627 654 720 1.0% Total non-renewable expenditures ...................... 1,041 1,116 1,350 1,369 1,404 1,463 1,585 1.1% Transportation renewable expenditures ................ 0 0 6 7 7 8 5 10.1% Total expenditures ............................................ 1,041 1,116 1,355 1,375 1,411 1,471 1,590 1.1%

U.S. Energy Information Administration / Annual Energy Outlook 2018 7
Table A3. Energy prices by sector and source (continued) (nominal dollars per million Btu, unless otherwise noted)
Sector and source
Reference case
Annual growth
2017-2050 (percent)
2016
2017
2025
2030
2035
2040
2050
Residential Propane ................................................................ 16.28 17.29 22.41 25.71 30.31 35.53 48.86 3.2% Distillate fuel oil ..................................................... 15.34 18.19 32.17 37.50 43.71 50.90 65.72 4.0% Natural gas ........................................................... 9.76 10.77 14.54 16.58 18.79 21.60 28.99 3.0% Electricity .............................................................. 36.82 37.12 49.12 55.56 62.23 69.66 87.56 2.6% Commercial Propane ................................................................ 14.56 15.44 20.02 22.95 27.00 31.60 43.33 3.2% Distillate fuel oil ..................................................... 13.52 16.04 26.82 31.56 37.07 43.43 56.13 3.9% Residual fuel oil .................................................... 5.18 7.05 14.13 17.21 20.68 24.74 33.20 4.8% Natural gas ........................................................... 7.11 7.82 11.45 12.97 14.59 16.70 22.46 3.2% Electricity .............................................................. 30.69 31.32 39.89 44.81 49.68 55.32 68.30 2.4% Industrial1 Propane ................................................................ 11.47 12.42 16.32 18.90 22.76 27.10 38.20 3.5% Distillate fuel oil ..................................................... 13.50 16.01 26.46 31.19 36.69 43.04 55.62 3.8% Residual fuel oil .................................................... 4.91 6.67 16.18 19.48 23.15 27.45 36.45 5.3% Natural gas2 .......................................................... 3.41 3.95 5.96 6.83 7.64 8.96 12.63 3.6% Metallurgical coal .................................................. 4.23 4.24 5.53 6.28 7.15 8.15 11.03 2.9% Other industrial coal .............................................. 3.24 3.26 4.12 4.57 5.08 5.75 7.58 2.6% Coal to liquids ....................................................... - - - - - - - - - - - - - - - - Electricity .............................................................. 19.86 21.38 26.36 29.52 32.79 36.58 45.86 2.3% Transportation Propane ................................................................ 17.44 18.47 24.27 27.80 32.60 38.05 51.95 3.2% E853 ...................................................................... 20.45 22.29 31.47 32.64 36.64 43.51 71.41 3.6% Motor gasoline4 ..................................................... 18.79 20.80 32.68 37.50 43.33 50.22 66.02 3.6% Jet fuel5 ................................................................. 9.81 11.95 22.99 27.40 32.72 38.98 52.46 4.6% Diesel fuel (distillate fuel oil)6 ................................ 16.93 19.29 31.25 36.62 42.75 49.77 63.89 3.7% Residual fuel oil .................................................... 6.15 8.36 15.81 19.20 22.83 27.03 35.78 4.5% Natural gas7 .......................................................... 14.03 14.45 16.72 17.77 19.18 21.45 28.17 2.0% Electricity .............................................................. 28.39 31.15 47.60 54.72 60.87 66.80 80.80 2.9% Electric power8 Distillate fuel oil ..................................................... 11.94 14.12 25.33 29.32 34.46 40.54 53.27 4.1% Residual fuel oil .................................................... 8.17 10.53 18.21 21.59 25.44 29.57 37.64 3.9% Natural gas ........................................................... 2.88 3.47 5.42 6.24 6.95 8.21 11.64 3.7% Steam coal ............................................................ 2.16 2.15 2.76 3.11 3.54 4.06 5.29 2.8% Uranium ................................................................ 0.63 0.65 0.80 0.90 1.02 1.15 1.51 2.6%

U.S. Energy Information Administration / Annual Energy Outlook 2018 8
Table A3. Energy prices by sector and source (continued) (nominal dollars per million Btu, unless otherwise noted)
Sector and source
Reference case
Annual growth
2017-2050 (percent)
2016
2017
2025
2030
2035
2040
2050
Average price to all users9 Propane ................................................................ 14.05 15.20 20.31 23.26 27.44 32.16 44.24 3.3% E853 ...................................................................... 20.45 22.29 31.47 32.64 36.64 43.51 71.41 3.6% Motor gasoline4 ..................................................... 18.78 20.78 32.68 37.50 43.34 50.23 66.03 3.6% Jet fuel5 ................................................................. 9.81 11.95 22.99 27.40 32.72 38.98 52.46 4.6% Distillate fuel oil ..................................................... 16.17 18.56 30.28 35.48 41.40 48.24 61.98 3.7% Residual fuel oil .................................................... 6.49 8.50 15.85 19.21 22.84 27.02 35.68 4.4% Natural gas ........................................................... 4.78 5.53 7.98 9.09 10.19 11.79 16.25 3.3% Metallurgical coal .................................................. 4.23 4.24 5.53 6.28 7.15 8.15 11.03 2.9% Other coal ............................................................. 2.22 2.20 2.85 3.21 3.64 4.17 5.44 2.8% Coal to liquids ....................................................... - - - - - - - - - - - - - - - - Electricity .............................................................. 30.28 30.93 39.45 44.40 49.52 55.31 69.14 2.5% Non-renewable energy expenditures by sector (billion nominal dollars) Residential ............................................................ 235 240 324 369 418 478 630 3.0% Commercial .......................................................... 179 186 252 289 328 378 517 3.1% Industrial1 .............................................................. 152 173 297 356 423 509 711 4.4% Transportation....................................................... 456 516 762 834 945 1,103 1,547 3.4% Total non-renewable expenditures ...................... 1,023 1,116 1,634 1,847 2,114 2,469 3,406 3.4% Transportation renewable expenditures ................ 0 0 7 9 11 13 12 12.7% Total expenditures ............................................ 1,023 1,116 1,641 1,856 2,125 2,482 3,418 3.5%
1Includes energy for combined heat and power plants that have a non-regulatory status, and small on-site generating systems. 2Excludes use for lease and plant fuel and fuel used for liquefaction in export facilities. 3E85 refers to a blend of 85 percent ethanol (renewable) and 15 percent motor gasoline (nonrenewable). To address cold starting issues, the percentage of
ethanol varies seasonally. The annual average ethanol content of 74 percent is used for these projections. 4Sales weighted-average price for all grades. Includes Federal, State, and local taxes. 5Kerosene-type jet fuel. Includes Federal and State taxes while excluding county and local taxes. 6Diesel fuel for on-road use. Includes Federal and State taxes while excluding county and local taxes. 7Natural gas used as fuel in motor vehicles, trains, and ships. Includes estimated motor vehicle fuel taxes and estimated dispensing costs or charges. 8Includes electricity-only and combined heat and power plants that have a regulatory status. 9Weighted averages of end-use fuel prices are derived from the prices shown in each sector and the corresponding sectoral consumption. Btu = British thermal unit. - - = Not applicable. Note: Data for 2016 are model results and may differ from official EIA data reports. Sources: 2016 prices for motor gasoline, distillate fuel oil, and jet fuel are based on prices in the U.S. Energy Information Administration (EIA), Petroleum
Marketing Monthly, July 2017. 2016 residential and commercial natural gas delivered prices: EIA, Natural Gas Monthly, July 2017). 2016 industrial natural gas delivered prices derived on: EIA, Manufacturing Energy Consumption Survey, 2002-2014. 2016 transportation sector natural gas delivered prices are model results. 2016 electric power sector distillate and residual fuel oil prices: EIA, Monthly Energy Review, September 2017. 2016 electric power sector natural gas prices: EIA, Electric Power Monthly, July 2017, Table 4.13.B, and EIA, State Energy Data Report 2015. 2016 coal prices based on: EIA, Quarterly Coal Report, October-December 2016 and EIA, AEO2018 National Energy Modeling System run ref2018.d121317a. 2016 electricity prices: EIA, Monthly Energy Review, September 2017. 2016 E85 prices derived from monthly prices in the Clean Cities Alternative Fuel Price Report. 2017: EIA, Short-Term Energy Outlook, October 2017 and EIA, AEO2018 National Energy Modeling System run ref2018.d121317a. Projections: EIA, AEO2018 National Energy Modeling System run ref2018.d121317a.

U.S. Energy Information Administration / Annual Energy Outlook 2018 9
Table A4. Residential sector key indicators and consumption (quadrillion Btu per year, unless otherwise noted)
Key indicators and consumption
Reference case
Annual growth
2017-2050 (percent)
2016
2017
2025
2030
2035
2040
2050
Key indicators Households (millions) Single-family ....................................................... 81.09 81.69 87.52 90.95 94.36 97.88 105.28 0.8% Multifamily ........................................................... 29.12 29.35 31.91 33.63 35.46 37.22 40.47 1.0% Mobile homes ..................................................... 5.84 5.74 5.20 5.01 4.84 4.70 4.68 -0.6% Total ................................................................. 116.05 116.77 124.63 129.60 134.66 139.81 150.44 0.8% Average house square footage ......................... 1,704 1,713 1,775 1,808 1,840 1,871 1,934 0.4% Energy intensity (million Btu per household) Delivered energy consumption ........................... 90.7 90.2 85.5 82.0 78.8 76.1 71.9 -0.7% Total energy consumption .................................. 173.3 169.1 157.0 150.8 145.3 141.0 132.8 -0.7% (thousand Btu per square foot) Delivered energy consumption ........................... 53.2 52.6 48.2 45.4 42.8 40.7 37.2 -1.0% Total energy consumption .................................. 101.7 98.7 88.5 83.4 79.0 75.4 68.7 -1.1% Delivered energy consumption by fuel Purchased electricity Space heating ..................................................... 0.30 0.29 0.33 0.32 0.31 0.30 0.29 0.0% Space cooling ..................................................... 0.88 0.72 0.80 0.84 0.88 0.92 1.01 1.0% Water heating ..................................................... 0.44 0.45 0.44 0.44 0.43 0.42 0.44 0.0% Refrigeration ....................................................... 0.34 0.34 0.32 0.32 0.33 0.34 0.38 0.3% Cooking .............................................................. 0.11 0.11 0.12 0.12 0.13 0.14 0.15 0.9% Clothes dryers ..................................................... 0.19 0.19 0.18 0.18 0.19 0.20 0.22 0.4% Freezers ............................................................. 0.07 0.07 0.07 0.06 0.06 0.06 0.06 -0.4% Lighting ............................................................... 0.46 0.44 0.37 0.36 0.32 0.30 0.26 -1.6% Clothes washers1 ................................................ 0.03 0.03 0.02 0.02 0.02 0.02 0.02 -1.0% Dishwashers1 ...................................................... 0.09 0.09 0.10 0.11 0.12 0.12 0.14 1.2% Televisions and related equipment2 .................... 0.28 0.28 0.25 0.26 0.28 0.31 0.35 0.7% Computers and related equipment3 .................... 0.11 0.10 0.08 0.07 0.06 0.05 0.03 -3.4% Furnace fans and boiler circulation pumps ......... 0.10 0.11 0.11 0.11 0.10 0.10 0.09 -0.3% Other uses4 ......................................................... 1.39 1.47 1.56 1.61 1.67 1.73 1.83 0.7% Delivered energy ............................................. 4.80 4.69 4.74 4.81 4.89 5.02 5.27 0.4% Natural gas Space heating ..................................................... 2.72 2.76 2.89 2.84 2.81 2.77 2.68 -0.1% Space cooling ..................................................... 0.02 0.02 0.02 0.02 0.02 0.02 0.02 -0.2% Water heating ..................................................... 1.25 1.26 1.33 1.37 1.38 1.38 1.47 0.5% Cooking .............................................................. 0.21 0.21 0.22 0.22 0.23 0.23 0.25 0.5% Clothes dryers ..................................................... 0.05 0.05 0.05 0.06 0.06 0.07 0.07 1.1% Other uses5 ......................................................... 0.25 0.25 0.23 0.23 0.22 0.22 0.21 -0.5% Delivered energy ............................................. 4.51 4.54 4.74 4.74 4.72 4.69 4.70 0.1% Distillate fuel oil Space heating ..................................................... 0.38 0.42 0.36 0.32 0.29 0.27 0.22 -1.9% Water heating ..................................................... 0.05 0.04 0.03 0.02 0.02 0.02 0.01 -3.6% Other uses6 ......................................................... 0.01 0.01 0.01 0.01 0.01 0.01 0.01 -0.6% Delivered energy ............................................. 0.43 0.47 0.39 0.35 0.32 0.29 0.24 -2.0% Propane Space heating ..................................................... 0.30 0.36 0.27 0.26 0.24 0.22 0.20 -1.7% Water heating ..................................................... 0.06 0.06 0.05 0.05 0.04 0.04 0.03 -1.6% Cooking .............................................................. 0.03 0.03 0.03 0.03 0.02 0.02 0.02 -0.5% Other uses6 ......................................................... 0.05 0.05 0.05 0.06 0.06 0.06 0.07 1.4% Delivered energy ............................................. 0.43 0.49 0.40 0.38 0.37 0.35 0.33 -1.2% Marketed renewables (wood)7 .............................. 0.34 0.33 0.37 0.34 0.32 0.30 0.27 -0.6% Kerosene .............................................................. 0.01 0.01 0.01 0.01 0.01 0.01 0.00 -2.9%

U.S. Energy Information Administration / Annual Energy Outlook 2018 10
Table A4. Residential sector key indicators and consumption (continued) (quadrillion Btu per year, unless otherwise noted)
Key indicators and consumption
Reference case
Annual growth
2017-2050 (percent)
2016
2017
2025
2030
2035
2040
2050
Delivered energy consumption by end use Space heating ..................................................... 4.05 4.16 4.23 4.09 3.97 3.87 3.67 -0.4% Space cooling ..................................................... 0.90 0.74 0.82 0.86 0.90 0.94 1.03 1.0% Water heating ..................................................... 1.80 1.81 1.85 1.87 1.87 1.86 1.96 0.3% Refrigeration ....................................................... 0.34 0.34 0.32 0.32 0.33 0.34 0.38 0.3% Cooking .............................................................. 0.35 0.35 0.36 0.37 0.38 0.39 0.42 0.6% Clothes dryers ..................................................... 0.24 0.24 0.23 0.24 0.25 0.26 0.29 0.6% Freezers ............................................................. 0.07 0.07 0.07 0.06 0.06 0.06 0.06 -0.4% Lighting ............................................................... 0.46 0.44 0.37 0.36 0.32 0.30 0.26 -1.6% Clothes washers1 ................................................ 0.03 0.03 0.02 0.02 0.02 0.02 0.02 -1.0% Dishwashers1 ...................................................... 0.09 0.09 0.10 0.11 0.12 0.12 0.14 1.2% Televisions and related equipment2 .................... 0.28 0.28 0.25 0.26 0.28 0.31 0.35 0.7% Computers and related equipment3 .................... 0.11 0.10 0.08 0.07 0.06 0.05 0.03 -3.4% Furnace fans and boiler circulation pumps ......... 0.10 0.11 0.11 0.11 0.10 0.10 0.09 -0.3% Other uses8 ......................................................... 1.69 1.77 1.86 1.91 1.96 2.02 2.11 0.5% Delivered energy ............................................. 10.53 10.53 10.66 10.63 10.62 10.65 10.82 0.1% Electricity related losses ...................................... 9.58 9.22 8.91 8.92 8.95 9.07 9.16 0.0% Total energy consumption by end use Space heating ..................................................... 4.65 4.74 4.86 4.69 4.55 4.42 4.17 -0.4% Space cooling ..................................................... 2.65 2.16 2.33 2.41 2.51 2.62 2.77 0.8% Water heating ..................................................... 2.69 2.68 2.67 2.69 2.65 2.62 2.73 0.1% Refrigeration ....................................................... 1.03 1.01 0.91 0.90 0.92 0.97 1.04 0.1% Cooking .............................................................. 0.56 0.56 0.58 0.60 0.62 0.64 0.68 0.6% Clothes dryers ..................................................... 0.62 0.62 0.57 0.58 0.60 0.63 0.67 0.3% Freezers ............................................................. 0.22 0.22 0.19 0.18 0.17 0.17 0.18 -0.6% Lighting ............................................................... 1.36 1.31 1.06 1.02 0.91 0.84 0.72 -1.8% Clothes washers1 ................................................ 0.08 0.07 0.05 0.05 0.04 0.05 0.05 -1.3% Dishwashers1 ...................................................... 0.28 0.28 0.28 0.31 0.33 0.35 0.38 0.9% Televisions and related equipment2 .................... 0.85 0.82 0.71 0.73 0.79 0.86 0.95 0.4% Computers and related equipment3 .................... 0.32 0.31 0.23 0.20 0.17 0.15 0.09 -3.6% Furnace fans and boiler circulation pumps ......... 0.31 0.31 0.32 0.30 0.28 0.27 0.26 -0.6% Other uses8 ......................................................... 4.47 4.65 4.79 4.90 5.01 5.15 5.29 0.4% Total ................................................................. 20.11 19.75 19.57 19.55 19.57 19.72 19.98 0.0% Nonmarketed renewables9 Geothermal heat pumps ..................................... 0.01 0.01 0.02 0.02 0.02 0.03 0.04 3.7% Solar hot water heating ....................................... 0.01 0.01 0.01 0.01 0.01 0.01 0.01 0.9% Solar photovoltaic ............................................... 0.10 0.13 0.40 0.64 0.95 1.35 2.54 9.3% Wind ................................................................... 0.03 0.03 0.03 0.03 0.03 0.03 0.04 0.8% Total ................................................................. 0.15 0.18 0.46 0.70 1.02 1.42 2.62 8.4% Heating degree days10 ........................................... 3,879 3,896 4,032 3,958 3,883 3,809 3,660 -0.2%Cooling degree days10 ........................................... 1,557 1,399 1,541 1,594 1,649 1,704 1,817 0.8%
1Does not include water heating portion of load. 2Includes televisions, set-top boxes, home theater systems, DVD players, and video game consoles. 3Includes desktop and laptop computers, monitors, and networking equipment. 4Includes small electric devices, heating elements, and motors not listed above. Electric vehicles are included in the transportation sector. 5Includes such appliances as outdoor grills, natural gas-fueled lights, pool heaters, spa heaters, and backup electricity generators. 6Includes such appliances as pool heaters, spa heaters, and backup electricity generators. 7Includes wood used for primary and secondary heating in wood stoves or fireplaces as reported in the Residential Energy Consumption Survey 2009. 8Includes small electric devices, heating elements, outdoor grills, natural gas-fueled lights, pool heaters, spa heaters, backup electricity generators, and motors
not listed above. Electric vehicles are included in the transportation sector. 9Consumption determined by using the average electric power sector fossil-fuels net heat rate. 10See Table A5 for regional detail. Btu = British thermal unit. - - = Not applicable. Note: Totals may not equal sum of components due to independent rounding. Data for 2016 are model results and may differ from official EIA data reports. Sources: 2016 consumption based on: U.S. Energy Information Administration (EIA), Monthly Energy Review, September 2017. 2016 degree days based on
state-level data from the National Oceanic and Atmospheric Administration’s Climatic Data Center and Climate Prediction Center. 2017: EIA, Short-Term Energy Outlook, October 2017 and EIA, AEO2018 National Energy Modeling System run ref2018.d121317a. Projections: EIA, AEO2018 National Energy Modeling System run ref2018.d121317a.

U.S. Energy Information Administration / Annual Energy Outlook 2018 11
Table A5. Commercial sector key indicators and consumption (quadrillion Btu per year, unless otherwise noted)
Key indicators and consumption
Reference case
Annual growth
2017-2050 (percent)
2016
2017
2025
2030
2035
2040
2050
Key indicators Total floorspace (billion square feet) Surviving ............................................................. 87.8 88.7 97.0 102.1 107.5 112.8 123.6 1.0% New additions ..................................................... 1.9 2.0 2.1 2.3 2.3 2.4 2.5 0.7% Total ................................................................. 89.7 90.7 99.1 104.4 109.8 115.1 126.1 1.0% Energy consumption intensity (thousand Btu per square foot) Delivered energy consumption ........................... 99.2 98.6 92.4 89.2 86.8 85.1 84.5 -0.5% Electricity related losses ..................................... 103.1 99.9 90.4 85.9 82.0 79.4 75.9 -0.8% Total energy consumption .................................. 202.4 198.5 182.8 175.1 168.8 164.5 160.4 -0.6% Delivered energy consumption by fuel Purchased electricity Space heating1 ................................................... 0.12 0.12 0.13 0.12 0.11 0.10 0.09 -0.8% Space cooling1 .................................................... 0.56 0.49 0.50 0.50 0.50 0.51 0.54 0.3% Water heating1 .................................................... 0.03 0.03 0.03 0.03 0.03 0.02 0.02 -0.7% Ventilation ........................................................... 0.52 0.52 0.50 0.45 0.42 0.40 0.37 -1.0% Cooking .............................................................. 0.08 0.08 0.08 0.07 0.07 0.07 0.07 -0.6% Lighting ............................................................... 0.50 0.49 0.43 0.41 0.37 0.35 0.30 -1.5% Refrigeration ....................................................... 0.64 0.65 0.65 0.66 0.67 0.69 0.74 0.4% Computing .......................................................... 0.35 0.34 0.31 0.31 0.33 0.34 0.33 -0.1% Office equipment ................................................. 0.33 0.36 0.52 0.59 0.65 0.70 0.87 2.7% Other uses2 ......................................................... 1.51 1.53 1.62 1.69 1.77 1.87 2.18 1.1% Delivered energy ............................................. 4.64 4.61 4.77 4.84 4.92 5.05 5.51 0.5% Natural gas Space heating1 ................................................... 1.57 1.56 1.55 1.53 1.52 1.51 1.49 -0.1% Space cooling1 .................................................... 0.03 0.03 0.02 0.02 0.02 0.02 0.02 -0.8% Water heating1 .................................................... 0.57 0.58 0.57 0.59 0.60 0.62 0.65 0.3% Cooking .............................................................. 0.32 0.33 0.35 0.38 0.40 0.42 0.47 1.1% Other uses3 ......................................................... 0.73 0.77 0.84 0.91 1.01 1.13 1.46 2.0% Delivered energy ............................................. 3.22 3.26 3.34 3.42 3.56 3.71 4.09 0.7% Distillate fuel oil Space heating1 ................................................... 0.24 0.24 0.21 0.20 0.19 0.18 0.17 -1.1% Water heating1 .................................................... 0.01 0.01 0.01 0.01 0.01 0.01 0.01 -0.6% Other uses4 ......................................................... 0.11 0.12 0.14 0.14 0.14 0.14 0.15 0.6% Delivered energy ............................................. 0.35 0.37 0.36 0.35 0.34 0.33 0.32 -0.5% Marketed renewables (biomass) ........................... 0.13 0.13 0.13 0.13 0.13 0.13 0.13 0.0% Other fuels5 ........................................................... 0.56 0.57 0.55 0.56 0.57 0.58 0.61 0.2% Delivered energy consumption by end use Space heating1 ................................................... 1.93 1.93 1.89 1.85 1.82 1.79 1.75 -0.3% Space cooling1 .................................................... 0.59 0.51 0.52 0.52 0.52 0.53 0.56 0.3% Water heating1 .................................................... 0.61 0.61 0.61 0.62 0.64 0.65 0.67 0.3% Ventilation ........................................................... 0.52 0.52 0.50 0.45 0.42 0.40 0.37 -1.0% Cooking .............................................................. 0.40 0.41 0.43 0.45 0.48 0.50 0.54 0.8% Lighting ............................................................... 0.50 0.49 0.43 0.41 0.37 0.35 0.30 -1.5% Refrigeration ....................................................... 0.64 0.65 0.65 0.66 0.67 0.69 0.74 0.4% Computing .......................................................... 0.35 0.34 0.31 0.31 0.33 0.34 0.33 -0.1% Office equipment ................................................. 0.33 0.36 0.52 0.59 0.65 0.70 0.87 2.7% Other uses6 ......................................................... 3.04 3.13 3.29 3.44 3.63 3.86 4.53 1.1% Delivered energy ............................................. 8.91 8.94 9.15 9.31 9.53 9.80 10.66 0.5%

U.S. Energy Information Administration / Annual Energy Outlook 2018 12
Table A5. Commercial sector key indicators and consumption (continued) (quadrillion Btu per year, unless otherwise noted)
Key indicators and consumption
Reference case
Annual growth
2017-2050 (percent)
2016
2017
2025
2030
2035
2040
2050
Electricity related losses ....................................... 9.26 9.06 8.96 8.97 9.01 9.14 9.57 0.2% Total energy consumption by end use Space heating1 ................................................... 2.16 2.16 2.13 2.07 2.03 1.98 1.91 -0.4% Space cooling1 .................................................... 1.70 1.47 1.46 1.44 1.43 1.44 1.49 0.0% Water heating1 .................................................... 0.67 0.67 0.66 0.67 0.68 0.69 0.72 0.2% Ventilation ........................................................... 1.55 1.53 1.43 1.28 1.18 1.11 1.03 -1.2% Cooking .............................................................. 0.57 0.57 0.58 0.59 0.61 0.62 0.65 0.4% Lighting ............................................................... 1.49 1.45 1.24 1.17 1.06 0.98 0.81 -1.7% Refrigeration ....................................................... 1.92 1.92 1.88 1.89 1.91 1.94 2.02 0.2% Computing .......................................................... 1.06 1.02 0.90 0.90 0.93 0.96 0.92 -0.3% Office equipment ................................................. 1.00 1.07 1.51 1.70 1.84 1.97 2.37 2.4% Other uses6 ......................................................... 6.05 6.14 6.34 6.58 6.87 7.24 8.31 0.9% Total ................................................................. 18.16 18.01 18.12 18.28 18.54 18.94 20.23 0.4% Nonmarketed renewable fuels7 Solar thermal ........................................................ 0.07 0.07 0.07 0.07 0.08 0.08 0.08 0.3% Solar photovoltaic ................................................. 0.09 0.11 0.22 0.28 0.36 0.46 0.67 5.7% Wind ..................................................................... 0.01 0.01 0.01 0.01 0.01 0.01 0.02 3.4% Total .................................................................. 0.16 0.18 0.30 0.36 0.44 0.54 0.77 4.4% Heating degree days New England ........................................................ 5,934 6,080 6,019 5,925 5,830 5,736 5,546 -0.3% Middle Atlantic ...................................................... 5,363 5,345 5,432 5,351 5,271 5,191 5,030 -0.2% East North Central ................................................ 5,703 5,671 6,101 6,063 6,026 5,988 5,912 0.1% West North Central ............................................... 5,787 6,049 6,367 6,334 6,298 6,262 6,187 0.1% South Atlantic........................................................ 2,452 2,266 2,506 2,461 2,417 2,372 2,284 0.0% East South Central ................................................ 3,093 2,862 3,334 3,309 3,284 3,257 3,203 0.3% West South Central ............................................... 1,752 1,635 1,956 1,915 1,874 1,834 1,754 0.2% Mountain ............................................................... 4,615 4,746 4,737 4,667 4,593 4,518 4,369 -0.3% Pacific ................................................................... 3,033 3,401 3,237 3,189 3,140 3,090 2,989 -0.4% United States .................................................... 3,879 3,896 4,032 3,958 3,883 3,809 3,660 -0.2% Cooling degree days New England ........................................................ 620 440 589 617 644 672 728 1.5% Middle Atlantic ...................................................... 882 642 831 865 900 935 1,004 1.4% East North Central ................................................ 957 698 816 831 846 861 892 0.7% West North Central ............................................... 1,071 907 1,002 1,016 1,031 1,046 1,077 0.5% South Atlantic........................................................ 2,418 2,210 2,325 2,381 2,437 2,494 2,609 0.5% East South Central ................................................ 1,957 1,575 1,795 1,836 1,877 1,919 2,002 0.7% West South Central ............................................... 2,883 2,694 2,942 3,023 3,104 3,185 3,348 0.7% Mountain ............................................................... 1,498 1,499 1,579 1,623 1,670 1,717 1,812 0.6% Pacific ................................................................... 923 1,003 979 1,011 1,043 1,076 1,143 0.4% United States .................................................... 1,557 1,399 1,541 1,594 1,649 1,704 1,817 0.8%
1Includes fuel consumption for district services. 2Includes (but is not limited to) miscellaneous uses such as transformers, medical imaging and other medical equipment, elevators, escalators, off-road electric
vehicles, laboratory fume hoods, laundry equipment, coffee brewers, and water services. 3Includes miscellaneous uses, such as emergency generators, combined heat and power in commercial buildings, and manufacturing performed in commercial
buildings. 4Includes miscellaneous uses, such as cooking, emergency generators, and combined heat and power in commercial buildings. 5Includes residual fuel oil, propane, coal, motor gasoline, and kerosene. 6Includes (but is not limited to) miscellaneous uses such as transformers, medical imaging and other medical equipment, elevators, escalators, off-road electric
vehicles, laboratory fume hoods, laundry equipment, coffee brewers, water services, emergency generators, combined heat and power in commercial buildings, manufacturing performed in commercial buildings, and cooking (distillate), plus residual fuel oil, propane, coal, motor gasoline, kerosene, and marketed renewable fuels (biomass).
7Consumption determined by using the average electric power sector fossil-fuels net heat rate. Btu = British thermal unit. Note: Totals may not equal sum of components due to independent rounding. Data for 2016 are model results and may differ from official EIA data reports. Sources: 2016 consumption based on: U.S. Energy Information Administration (EIA), Monthly Energy Review, September 2017. 2016 degree days based on
state-level data from the National Oceanic and Atmospheric Administration’s Climatic Data Center and Climate Prediction Center. 2017: EIA, Short-Term Energy Outlook, October 2017 and EIA, AEO2018 National Energy Modeling System run ref2018.d121317a. Projections: EIA, AEO2018 National Energy Modeling System run ref2018.d121317a.

U.S. Energy Information Administration / Annual Energy Outlook 2018 13
Table A6. Industrial sector key indicators and consumption
Shipments, prices, and consumption
Reference case
Annual growth
2017-2050 (percent)
2016
2017
2025
2030
2035
2040
2050
Key indicators Value of shipments (billion 2009 dollars) Manufacturing ..................................................... 5,289 5,544 6,327 6,936 7,576 8,266 9,643 1.7% Agriculture, mining, and construction .................. 2,046 2,031 2,450 2,603 2,744 2,905 3,265 1.4% Total ................................................................. 7,335 7,575 8,777 9,540 10,320 11,171 12,908 1.6% Energy prices (2017 dollars per million Btu) Propane .............................................................. 11.67 12.42 13.48 14.01 15.11 16.06 17.77 1.1% Motor gasoline .................................................... 18.71 20.39 26.65 27.47 28.51 29.52 30.49 1.2% Distillate fuel oil ................................................... 13.74 16.01 21.86 23.11 24.36 25.51 25.88 1.5% Residual fuel oil .................................................. 5.00 6.67 13.36 14.43 15.37 16.27 16.96 2.9% Asphalt and road oil ............................................ 2.56 3.41 10.72 10.22 10.99 11.70 12.34 4.0% Natural gas heat and power ................................ 3.45 3.96 4.95 5.09 5.10 5.34 5.91 1.2% Natural gas feedstocks ....................................... 3.49 3.94 4.90 5.04 5.05 5.29 5.84 1.2% Metallurgical coal ................................................ 4.30 4.24 4.57 4.65 4.75 4.83 5.13 0.6% Other industrial coal ............................................ 3.30 3.26 3.40 3.39 3.37 3.41 3.53 0.2% Coal to liquids ..................................................... - - - - - - - - - - - - - - - - Electricity ............................................................ 20.21 21.38 21.78 21.88 21.77 21.68 21.34 0.0% (nominal dollars per million Btu) Propane .............................................................. 11.47 12.42 16.32 18.90 22.76 27.10 38.20 3.5% Motor gasoline .................................................... 18.38 20.39 32.27 37.08 42.94 49.80 65.53 3.6% Distillate fuel oil ................................................... 13.50 16.01 26.46 31.19 36.69 43.04 55.62 3.8% Residual fuel oil .................................................. 4.91 6.67 16.18 19.48 23.15 27.45 36.45 5.3% Asphalt and road oil ............................................ 2.51 3.41 12.98 13.80 16.56 19.75 26.52 6.4% Natural gas heat and power ................................ 3.39 3.96 5.99 6.86 7.68 9.00 12.70 3.6% Natural gas feedstocks ....................................... 3.43 3.94 5.93 6.81 7.61 8.93 12.56 3.6% Metallurgical coal ................................................ 4.23 4.24 5.53 6.28 7.15 8.15 11.03 2.9% Other industrial coal ............................................ 3.24 3.26 4.12 4.57 5.08 5.75 7.58 2.6% Coal to liquids ..................................................... - - - - - - - - - - - - - - - - Electricity ............................................................ 19.86 21.38 26.36 29.52 32.79 36.58 45.86 2.3% Energy consumption (quadrillion Btu)1 Industrial consumption excluding refining Propane heat and power .................................... 0.41 0.38 0.21 0.22 0.22 0.23 0.24 -1.4% Liquefied petroleum gas and other feedstocks2 .. 2.27 2.35 3.37 3.64 3.77 3.89 3.91 1.6% Motor gasoline .................................................... 0.26 0.26 0.28 0.28 0.29 0.29 0.31 0.5% Distillate fuel oil ................................................... 1.14 1.16 1.30 1.35 1.38 1.44 1.57 0.9% Residual fuel oil .................................................. 0.04 0.04 0.03 0.03 0.03 0.04 0.04 -0.5% Petrochemical feedstocks ................................... 0.64 0.71 1.05 1.17 1.24 1.30 1.32 1.9% Petroleum coke ................................................... 0.11 0.19 0.15 0.14 0.13 0.14 0.14 -0.9% Asphalt and road oil ............................................ 0.85 0.86 0.96 1.06 1.19 1.32 1.65 2.0% Miscellaneous petroleum3 ................................... 0.37 0.37 0.37 0.38 0.37 0.37 0.37 0.0% Petroleum and other liquids subtotal ................ 6.10 6.33 7.72 8.27 8.62 9.01 9.55 1.3% Natural gas heat and power ................................ 5.85 5.79 6.83 7.12 7.37 7.65 8.10 1.0% Natural gas feedstocks ....................................... 0.70 0.83 1.05 1.10 1.12 1.15 1.16 1.0% Lease and plant fuel4 .......................................... 1.65 1.67 2.06 2.14 2.17 2.24 2.31 1.0% Natural gas to liquefy gas for export5 .................. 0.02 0.07 0.48 0.55 0.55 0.55 0.55 6.5% Natural gas subtotal ......................................... 8.22 8.35 10.41 10.91 11.21 11.60 12.12 1.1% Metallurgical coal and coke6 ............................... 0.45 0.51 0.42 0.45 0.49 0.50 0.50 -0.1% Other industrial coal ............................................ 0.67 0.62 0.72 0.70 0.67 0.66 0.67 0.2% Coal subtotal .................................................... 1.12 1.13 1.14 1.15 1.16 1.17 1.16 0.1% Renewables7 ....................................................... 1.47 1.46 1.76 1.97 2.17 2.34 2.68 1.9% Purchased electricity ........................................... 3.00 3.03 3.55 3.71 3.79 3.91 4.06 0.9% Delivered energy ............................................ 19.90 20.30 24.59 26.01 26.95 28.03 29.58 1.1% Electricity related losses ..................................... 5.98 5.95 6.68 6.88 6.93 7.06 7.05 0.5% Total ................................................................ 25.88 26.25 31.27 32.88 33.88 35.09 36.63 1.0%

U.S. Energy Information Administration / Annual Energy Outlook 2018 14
Table A6. Industrial sector key indicators and consumption (continued)
Shipments, prices, and consumption
Reference case
Annual growth
2017-2050 (percent)
2016
2017
2025
2030
2035
2040
2050
Refining consumption Liquefied petroleum gas heat and power2 .......... 0.01 0.01 0.00 0.00 0.00 0.00 0.00 - - Distillate fuel oil ................................................... 0.00 0.00 0.00 0.00 0.00 0.00 0.00 - - Residual fuel oil .................................................. 0.00 0.00 0.00 0.00 0.00 0.00 0.00 - - Petroleum coke ................................................... 0.54 0.43 0.37 0.35 0.35 0.35 0.33 -0.8% Still gas ............................................................... 1.49 1.56 1.72 1.70 1.75 1.76 1.72 0.3% Miscellaneous petroleum3 ................................... 0.01 0.01 0.00 0.00 0.00 0.00 0.00 - - Petroleum and other liquids subtotal ................ 2.05 2.00 2.09 2.05 2.10 2.10 2.04 0.1% Natural gas heat and power ................................ 1.28 1.22 1.04 1.00 1.04 1.11 1.19 -0.1% Natural gas feedstocks ....................................... 0.18 0.22 0.25 0.25 0.28 0.31 0.36 1.4% Natural-gas-to-liquids heat and power ................ 0.00 0.00 0.00 0.00 0.00 0.00 0.00 - - Natural gas subtotal ......................................... 1.46 1.44 1.29 1.24 1.32 1.42 1.54 0.2% Other industrial coal ............................................ 0.02 0.02 0.03 0.03 0.03 0.03 0.03 0.8% Coal-to-liquids heat and power ........................... 0.00 0.00 0.00 0.00 0.00 0.00 0.00 - - Coal subtotal .................................................... 0.02 0.02 0.03 0.03 0.03 0.03 0.03 0.8% Biofuels heat and coproducts ............................. 0.83 0.82 0.86 0.86 0.86 0.86 0.83 0.0% Purchased electricity ........................................... 0.20 0.20 0.19 0.18 0.19 0.19 0.20 0.0% Delivered energy ............................................ 4.56 4.49 4.47 4.37 4.50 4.60 4.64 0.1% Electricity related losses ..................................... 0.40 0.39 0.36 0.34 0.35 0.35 0.35 -0.4% Total ................................................................ 4.96 4.88 4.83 4.71 4.85 4.95 4.99 0.1% Total industrial sector consumption Liquefied petroleum gas heat and power2 .......... 0.41 0.39 0.21 0.22 0.22 0.23 0.24 -1.5% Liquefied petroleum gas and other feedstocks2 .. 2.27 2.35 3.37 3.64 3.77 3.89 3.91 1.6% Motor gasoline .................................................... 0.26 0.26 0.28 0.28 0.29 0.29 0.31 0.5% Distillate fuel oil ................................................... 1.14 1.16 1.30 1.35 1.38 1.44 1.57 0.9% Residual fuel oil .................................................. 0.05 0.05 0.03 0.03 0.03 0.04 0.04 -0.6% Petrochemical feedstocks ................................... 0.64 0.71 1.05 1.17 1.24 1.30 1.32 1.9% Petroleum coke ................................................... 0.65 0.62 0.52 0.50 0.49 0.48 0.46 -0.9% Asphalt and road oil ............................................ 0.85 0.86 0.96 1.06 1.19 1.32 1.65 2.0% Still gas ............................................................... 1.49 1.56 1.72 1.70 1.75 1.76 1.72 0.3% Miscellaneous petroleum3 ................................... 0.37 0.37 0.37 0.38 0.37 0.37 0.37 0.0% Petroleum and other liquids subtotal ................ 8.15 8.33 9.81 10.32 10.72 11.12 11.59 1.0% Natural gas heat and power ................................ 7.13 7.01 7.87 8.12 8.41 8.76 9.28 0.9% Natural gas feedstocks ....................................... 0.88 1.05 1.30 1.34 1.40 1.46 1.52 1.1% Natural-gas-to-liquids heat and power ................ 0.00 0.00 0.00 0.00 0.00 0.00 0.00 - - Lease and plant fuel4 .......................................... 1.65 1.67 2.06 2.14 2.17 2.24 2.31 1.0% Natural gas to liquefy gas for export5 .................. 0.02 0.07 0.48 0.55 0.55 0.55 0.55 6.5% Natural gas subtotal ......................................... 9.68 9.80 11.71 12.15 12.53 13.02 13.67 1.0% Metallurgical coal and coke6 ............................... 0.45 0.51 0.42 0.45 0.49 0.50 0.50 -0.1% Other industrial coal ............................................ 0.69 0.65 0.76 0.73 0.70 0.70 0.70 0.2% Coal-to-liquids heat and power ........................... 0.00 0.00 0.00 0.00 0.00 0.00 0.00 - - Coal subtotal .................................................... 1.14 1.16 1.17 1.18 1.19 1.20 1.19 0.1% Biofuels heat and coproducts ............................. 0.83 0.82 0.86 0.86 0.86 0.86 0.83 0.0% Renewables7 ....................................................... 1.47 1.46 1.76 1.97 2.17 2.34 2.68 1.9% Purchased electricity ........................................... 3.19 3.23 3.75 3.89 3.98 4.10 4.26 0.8% Delivered energy ............................................ 24.46 24.78 29.06 30.38 31.45 32.63 34.22 1.0% Electricity related losses ..................................... 6.37 6.34 7.04 7.21 7.28 7.41 7.40 0.5% Total ................................................................ 30.84 31.13 36.10 37.59 38.73 40.04 41.61 0.9%

U.S. Energy Information Administration / Annual Energy Outlook 2018 15
Table A6. Industrial sector key indicators and consumption (continued)
Key indicators and consumption
Reference case
Annual growth
2017-2050 (percent)
2016
2017
2025
2030
2035
2040
2050
Energy consumption per dollar of shipments (thousand Btu per 2009 dollar) Petroleum and other liquids ................................ 1.11 1.10 1.12 1.08 1.04 1.00 0.90 -0.6% Natural gas ......................................................... 1.32 1.29 1.33 1.27 1.21 1.17 1.06 -0.6% Coal .................................................................... 0.16 0.15 0.13 0.12 0.12 0.11 0.09 -1.5% Renewable fuels7 ................................................ 0.31 0.30 0.30 0.30 0.29 0.29 0.27 -0.3% Purchased electricity ........................................... 0.44 0.43 0.43 0.41 0.39 0.37 0.33 -0.8% Delivered energy ............................................ 3.34 3.27 3.31 3.18 3.05 2.92 2.65 -0.6% Industrial combined heat and power1 Capacity (gigawatts) ............................................. 25.2 26.1 28.9 30.5 32.5 35.0 41.1 1.4% Generation (billion kilowatthours).......................... 137 145 166 175 185 199 233 1.4%
1Includes combined heat and power plants that have a non-regulatory status, and small on-site generating systems. 2Includes ethane, natural gasoline, and refinery olefins. 3Includes lubricants and miscellaneous petroleum products. 4Represents natural gas used in well, field, and lease operations, and in natural gas processing plant machinery. 5Fuel used in facilities that liquefy natural gas for export. 6Includes net coal coke imports. 7Includes consumption of energy produced from hydroelectric, wood and wood waste, municipal waste, and other biomass sources. Btu = British thermal unit. - - = Not applicable. Note: Includes estimated consumption for petroleum and other liquids. Totals may not equal sum of components due to independent rounding. Data for 2016
are model results and may differ from official EIA data reports. Sources: 2016 prices for motor gasoline and distillate fuel oil are based on: U.S. Energy Information Administration (EIA), Petroleum Marketing Monthly, July
2017. 2016 petrochemical feedstock and asphalt and road oil prices are based on: EIA, State Energy Data Report 2015. 2016 coal prices are based on: EIA, Quarterly Coal Report, October-December 2016 and EIA, AEO2018 National Energy Modeling System run ref2018.d121317a. 2016 electricity prices: EIA, Monthly Energy Review, September 2017. 2016 natural gas prices: Natural Gas Monthly, July 2017). 2016 refining consumption based on: Petroleum Supply Annual 2016, and EIA, Refinery Capacity Report, June 2017. Other 2016 consumption values are based on: EIA, Monthly Energy Review, September 2017. 2016 shipments: IHS Markit, Industry model, May 2017. 2017: EIA, Short-Term Energy Outlook, October 2017 and EIA, AEO2018 National Energy Modeling System run ref2018.d121317a. Projections: EIA, AEO2018 National Energy Modeling System run ref2018.d121317a.

U.S. Energy Information Administration / Annual Energy Outlook 2018 16
Table A7. Transportation sector key indicators and delivered energy consumption
Key indicators and consumption
Reference case
Annual growth
2017-2050 (percent)
2016
2017
2025
2030
2035
2040
2050
Key indicators Travel indicators (billion vehicle miles traveled) Light-duty vehicles less than 8,501 pounds .... 2,747 2,794 2,879 2,943 3,010 3,086 3,302 0.5% Commercial light trucks1 ................................. 96 99 110 118 126 134 153 1.3% Freight trucks greater than 10,000 pounds ..... 277 285 316 336 356 377 416 1.2% Bus transportation ........................................... 204 205 214 220 225 228 235 0.4% Passenger rail ................................................. 40 40 44 46 49 51 55 1.0% (billion seat miles available) Air ................................................................... 1,087 1,105 1,342 1,511 1,689 1,873 2,287 2.2% (billion ton miles traveled) Rail ................................................................. 1,696 1,745 1,879 1,945 1,984 2,061 2,225 0.7% Domestic shipping .......................................... 452 446 383 336 314 292 276 -1.4% Energy efficiency indicators (miles per gallon) New light-duty vehicle CAFE standard2 .......... 32.8 33.5 46.1 46.3 46.4 46.5 46.5 1.0% New car2 ...................................................... 36.9 38.5 53.0 53.1 53.1 53.1 53.1 1.0% New light truck2 ............................................ 28.8 29.0 39.2 39.2 39.2 39.2 39.2 0.9% Compliance new light-duty vehicle3 ................ 33.2 33.4 46.9 47.8 48.3 48.5 48.6 1.1% New car3 ...................................................... 38.5 38.6 54.5 55.4 56.2 56.7 56.8 1.2% New light truck3 ............................................ 28.3 28.9 39.6 40.0 40.0 39.8 39.9 1.0% Tested new light-duty vehicle4 ........................ 32.5 32.9 46.9 47.7 48.2 48.5 48.5 1.2% New car4 ...................................................... 38.1 38.2 54.5 55.4 56.2 56.7 56.8 1.2% New light truck4 ............................................ 27.5 28.3 39.6 39.9 40.0 39.8 39.8 1.0% On-road new light-duty vehicle5 ...................... 26.3 26.6 37.9 38.6 39.0 39.2 39.3 1.2% New car5 ...................................................... 31.1 31.2 44.5 45.3 45.9 46.3 46.4 1.2% New light truck5 ............................................ 22.0 22.6 31.7 32.0 32.0 31.9 31.9 1.0% Light-duty stock6 ............................................. 22.4 22.8 27.8 31.7 34.7 36.6 38.2 1.6% New commercial light truck1 ............................ 13.1 13.3 19.6 20.5 20.6 20.6 20.6 1.3% Stock commercial light truck1 .......................... 13.8 13.7 16.9 18.3 19.2 19.8 20.3 1.2% Freight truck .................................................... 7.0 7.1 8.1 8.9 9.7 10.1 10.4 1.2% (seat miles per gallon) Aircraft ............................................................ 66.7 66.9 69.0 70.8 72.8 74.9 79.4 0.5% (ton miles per thousand Btu) Rail ................................................................. 3.5 3.5 3.7 3.8 4.0 4.1 4.5 0.8% Domestic shipping .......................................... 4.9 5.0 5.4 5.6 5.9 6.2 6.8 0.9% Energy use by mode (quadrillion Btu) Light-duty vehicles ................................................ 15.35 15.34 12.92 11.59 10.84 10.54 10.83 -1.0% Commercial light trucks1 ....................................... 0.88 0.90 0.82 0.81 0.82 0.85 0.94 0.1% Bus transportation ................................................. 0.23 0.23 0.24 0.25 0.25 0.25 0.25 0.2% Freight trucks ........................................................ 5.48 5.59 5.55 5.38 5.31 5.43 5.97 0.2% Rail, passenger ..................................................... 0.05 0.05 0.05 0.06 0.06 0.06 0.07 1.1% Rail, freight ........................................................... 0.49 0.50 0.51 0.51 0.50 0.50 0.50 0.0% Shipping, domestic ............................................... 0.09 0.09 0.07 0.06 0.05 0.05 0.04 -2.4% Shipping, international .......................................... 1.03 1.03 1.04 1.03 1.02 1.00 0.98 -0.2% Recreational boats ................................................ 0.24 0.24 0.25 0.25 0.25 0.25 0.24 0.0% Air ......................................................................... 2.36 2.39 2.77 3.03 3.28 3.52 4.03 1.6% Military use ........................................................... 0.55 0.55 0.55 0.57 0.61 0.65 0.75 0.9% Lubricants ............................................................. 0.14 0.14 0.14 0.14 0.14 0.14 0.15 0.2% Pipeline and distribution fuel ................................. 0.70 0.64 0.70 0.70 0.71 0.72 0.75 0.5% Total .................................................................. 27.60 27.71 25.61 24.36 23.82 23.94 25.49 -0.3%

U.S. Energy Information Administration / Annual Energy Outlook 2018 17
Table A7. Transportation sector key indicators and delivered energy consumption (continued)
Key indicators and consumption
Reference case
Annual growth
2017-2050 (percent)
2016
2017
2025
2030
2035
2040
2050
Energy use by mode (million barrels per day oil equivalent) Light-duty vehicles ................................................ 8.31 8.31 7.05 6.33 5.92 5.75 5.89 -1.0% Commercial light trucks1 ....................................... 0.46 0.47 0.43 0.43 0.44 0.45 0.50 0.2% Bus transportation ................................................. 0.11 0.11 0.12 0.12 0.12 0.12 0.12 0.2% Freight trucks ........................................................ 2.64 2.69 2.68 2.60 2.56 2.63 2.89 0.2% Rail, passenger ..................................................... 0.02 0.02 0.02 0.03 0.03 0.03 0.03 1.1% Rail, freight ........................................................... 0.23 0.24 0.24 0.24 0.24 0.24 0.24 0.0% Shipping, domestic ............................................... 0.04 0.04 0.03 0.03 0.03 0.02 0.02 -2.4% Shipping, international .......................................... 0.46 0.46 0.47 0.46 0.46 0.45 0.44 -0.1% Recreational boats ................................................ 0.13 0.13 0.13 0.13 0.13 0.13 0.13 0.0% Air ......................................................................... 1.14 1.16 1.34 1.46 1.58 1.70 1.95 1.6% Military use ........................................................... 0.26 0.27 0.26 0.27 0.29 0.31 0.36 0.9% Lubricants ............................................................. 0.06 0.06 0.06 0.06 0.07 0.07 0.07 0.2% Pipeline and distribution fuel ................................. 0.33 0.30 0.33 0.33 0.33 0.34 0.35 0.5% Total .................................................................. 14.22 14.27 13.17 12.50 12.20 12.25 13.00 -0.3%
1Commercial trucks 8,501 to 10,000 pounds gross vehicle weight rating. 2CAFE standard based on projected new vehicle sales. 3Includes CAFE credits for alternative fueled vehicle sales and credit banking. 4Environmental Protection Agency rated miles per gallon. 5Tested new vehicle efficiency revised for on-road performance. 6Combined”on-the-road” estimate for all cars and light trucks. CAFE = Corporate average fuel economy. Btu = British thermal unit. Note: Totals may not equal sum of components due to independent rounding. Data for 2016 are model results and may differ from official EIA data reports. Sources: 2016: U.S. Energy Information Administration (EIA), Monthly Energy Review, September 2017; EIA, Alternatives to Traditional Transportation Fuels
2009 (Part II - User and Fuel Data), April 2011; Federal Highway Administration, Highway Statistics 2015; Oak Ridge National Laboratory, Transportation Energy Data Book: Edition 36; National Highway Traffic and Safety Administration, Summary of Fuel Economy Performance, June 2015; U.S. Department of Commerce, Bureau of the Census, “Vehicle Inventory and Use Survey,” EC02TV; U.S. Environmental Protection Agency, Engines and Vehicles Compliance Information System, various years; EIA, U.S. Department of Transportation, Research and Special Programs Administration, Air Carrier Statistics Monthly, December 2010/2009; and United States Department of Defense, Defense Logistics Agency Energy, Fiscal Year 2015 Fact Book. 2017: EIA, Short-Term Energy Outlook, October 2017 and EIA, AEO2018 National Energy Modeling System run ref2018.d121317a. Projections: EIA, AEO2018 National Energy Modeling System run ref2018.d121317a.

U.S. Energy Information Administration / Annual Energy Outlook 2018 18
Table A8. Electricity supply, disposition, prices, and emissions (billion kilowatthours, unless otherwise noted)
Supply, disposition, prices, and emissions
Reference case
Annual growth
2017-2050 (percent)
2016
2017
2025
2030
2035
2040
2050
Net generation by fuel type Electric power sector1 Power only2 Coal ................................................................. 1,216 1,237 1,155 1,168 1,140 1,137 1,139 -0.2% Petroleum ........................................................ 21 17 12 10 9 9 7 -2.6% Natural gas3 ..................................................... 1,150 1,004 1,173 1,244 1,281 1,350 1,515 1.3% Nuclear power .................................................. 804 792 719 696 669 666 635 -0.7% Pumped storage/other4 .................................... 0 3 2 1 1 1 0 -5.3% Renewable sources5 ........................................ 573 625 866 911 1,029 1,099 1,241 2.1% Distributed generation (natural gas) ................. 0 0 1 2 3 3 7 - - Total ............................................................. 3,764 3,678 3,927 4,032 4,132 4,265 4,543 0.6% Combined heat and power6 Coal ................................................................. 14 20 17 17 17 17 17 -0.5% Petroleum ........................................................ 2 1 1 1 1 1 1 0.0% Natural gas ...................................................... 129 140 144 143 143 143 142 0.0% Renewable sources ......................................... 4 5 5 5 5 5 5 0.1% Total ............................................................. 153 165 166 166 166 166 164 0.0% Total net electric power sector generation ..... 3,917 3,843 4,093 4,198 4,297 4,430 4,708 0.6% Less direct use .................................................... 17 17 17 17 17 17 17 -0.1% Net available to the grid ..................................... 3,900 3,826 4,077 4,181 4,280 4,414 4,691 0.6% End-use sector7 Coal ................................................................... 12 12 11 11 10 10 9 -0.9% Petroleum .......................................................... 1 1 1 1 1 1 1 -1.2% Natural gas ........................................................ 103 108 131 146 166 190 251 2.6% Other gaseous fuels8 ......................................... 12 15 20 20 20 21 21 1.0% Renewable sources9 .......................................... 53 61 106 139 184 243 405 5.9% Other10 ............................................................... 2 2 3 3 3 3 3 0.2% Total end-use sector net generation ........... 184 199 270 319 384 466 689 3.8% Less direct use................................................... 130 147 215 256 309 375 541 4.0% Total sales to the grid ................................... 54 52 55 63 75 91 148 3.2% Total net electricity generation by fuel Coal ................................................................... 1,242 1,268 1,183 1,196 1,167 1,164 1,165 -0.3% Petroleum .......................................................... 24 19 13 11 10 10 8 -2.4% Natural gas ........................................................ 1,383 1,252 1,449 1,535 1,593 1,686 1,914 1.3% Nuclear power .................................................... 804 792 719 696 669 666 635 -0.7% Renewable sources5,9 ........................................ 630 691 976 1,055 1,219 1,347 1,651 2.7% Other11 ............................................................... 19 20 24 24 24 24 24 0.5% Total net electricity generation .................... 4,101 4,042 4,364 4,517 4,681 4,896 5,396 0.9% Net generation to the grid .................................. 3,954 3,878 4,132 4,244 4,355 4,504 4,839 0.7% Net imports ............................................................. 71 64 55 58 57 57 55 -0.5% Electricity sales by sector Residential ............................................................ 1,407 1,374 1,389 1,409 1,434 1,470 1,545 0.4% Commercial .......................................................... 1,360 1,351 1,397 1,417 1,443 1,481 1,615 0.5% Industrial ............................................................... 936 946 1,098 1,140 1,166 1,202 1,248 0.8% Transportation....................................................... 10 11 39 65 93 119 167 8.5% Total ................................................................... 3,713 3,681 3,924 4,032 4,135 4,272 4,575 0.7% Direct use ............................................................. 147 164 232 272 326 392 558 3.8% Total electricity use .......................................... 3,860 3,845 4,156 4,304 4,461 4,664 5,132 0.9%

U.S. Energy Information Administration / Annual Energy Outlook 2018 19
Table A8. Electricity supply, disposition, prices, and emissions (continued) (billion kilowatthours, unless otherwise noted)
Supply, disposition, prices, and emissions
Reference case
Annual growth
2017-2050 (percent)
2016
2017
2025
2030
2035
2040
2050
End-use prices (2017 cents per kilowatthour) Residential ............................................................ 12.8 12.7 13.8 14.0 14.1 14.1 13.9 0.3% Commercial .......................................................... 10.7 10.7 11.2 11.3 11.3 11.2 10.8 0.0% Industrial ............................................................... 6.9 7.3 7.4 7.5 7.4 7.4 7.3 0.0% Transportation....................................................... 9.9 10.6 13.4 13.8 13.8 13.5 12.8 0.6% All sectors average ........................................... 10.5 10.6 11.1 11.2 11.2 11.2 11.0 0.1% (nominal cents per kilowatthour) Residential ............................................................ 12.6 12.7 16.8 19.0 21.2 23.8 29.9 2.6% Commercial .......................................................... 10.5 10.7 13.6 15.3 17.0 18.9 23.3 2.4% Industrial ............................................................... 6.8 7.3 9.0 10.1 11.2 12.5 15.6 2.3% Transportation....................................................... 9.7 10.6 16.2 18.7 20.8 22.8 27.6 2.9% All sectors average ........................................... 10.3 10.6 13.5 15.2 16.9 18.9 23.6 2.5% Prices by service category (2017 cents per kilowatthour) Generation ............................................................ 6.5 6.3 6.1 6.0 5.8 5.7 5.6 -0.3% Transmission ........................................................ 1.3 1.3 1.5 1.6 1.6 1.7 1.6 0.6% Distribution ............................................................ 2.7 3.0 3.5 3.7 3.8 3.8 3.7 0.7% (nominal cents per kilowatthour) Generation ............................................................ 6.4 6.3 7.4 8.0 8.7 9.7 12.1 2.0% Transmission ........................................................ 1.3 1.3 1.8 2.1 2.4 2.8 3.5 3.0% Distribution ............................................................ 2.6 3.0 4.3 5.0 5.7 6.4 8.0 3.0% Electric power sector emissions1 Sulfur dioxide (million short tons) .......................... 1.47 1.03 1.06 1.25 1.24 1.28 1.28 0.6% Nitrogen oxide (million short tons) ........................ 1.18 1.05 0.96 1.01 1.00 1.00 0.99 -0.2% Mercury (short tons) .............................................. 4.92 4.99 4.60 4.69 4.56 4.48 4.43 -0.4%
1Includes electricity-only and combined heat and power plants that have a regulatory status. 2Includes plants that only produce electricity and that have a regulatory status. 3Includes electricity generation from fuel cells. 4Includes non-biogenic municipal waste. The U.S. Energy Information Administration estimates that in 2017 approximately 7 billion kilowatthours of electricity
were generated from a municipal waste stream containing petroleum-derived plastics and other non-renewable sources. See U.S. Energy Information Administration, Methodology for Allocating Municipal Solid Waste to Biogenic and Non-Biogenic Energy, (Washington, DC, May 2007).
5Includes conventional hydroelectric, geothermal, wood, wood waste, biogenic municipal waste, landfill gas, other biomass, solar, and wind power. 6Includes combined heat and power plants whose primary business is to sell electricity and heat to the public (i.e., those that report North American Industry
Classification System code 22 or that have a regulatory status). 7Includes combined heat and power plants and electricity-only plants in the commercial and industrial sectors that have a non-regulatory status; and small on-site
generating systems in the residential, commercial, and industrial sectors used primarily for own-use generation, but which may also sell some power to the grid. 8Includes refinery gas and still gas. 9Includes conventional hydroelectric, geothermal, wood, wood waste, all municipal waste, landfill gas, other biomass, solar, and wind power. 10Includes batteries, chemicals, hydrogen, pitch, purchased steam, sulfur, and miscellaneous technologies. 11Includes pumped storage, non-biogenic municipal waste, refinery gas, still gas, batteries, chemicals, hydrogen, pitch, purchased steam, sulfur, and
miscellaneous technologies. - - = Not applicable. Note: Totals may not equal sum of components due to independent rounding. Data for 2016 are model results and may differ from official EIA data reports. Sources: 2016 electric power sector generation; sales to the grid; net imports; electricity sales; and electricity end-use prices: U.S. Energy Information
Administration (EIA), Monthly Energy Review, September 2017, and supporting databases. 2016 emissions: U.S. Environmental Protection Agency, Clean Air Markets Database. 2016 electricity prices by service category: EIA, AEO2018 National Energy Modeling System run ref2018.d121317a. 2017: EIA, Short-Term Energy Outlook, October 2017 and EIA, AEO2018 National Energy Modeling System run ref2018.d121317a. Projections: EIA, AEO2018 National Energy Modeling System run ref2018.d121317a.

U.S. Energy Information Administration / Annual Energy Outlook 2018 20
Table A9. Electricity generating capacity (gigawatts)
Net summer capacity1
Reference case
Annual growth
2017-2050 (percent)
2016
2017
2025
2030
2035
2040
2050
Electric power sector2 Power only3 Coal4 ................................................................... 260.0 254.3 196.1 190.0 188.6 188.0 188.0 -0.9% Oil and natural gas steam4,5 ................................ 89.0 83.9 57.3 55.0 51.9 48.6 44.7 -1.9% Combined cycle ................................................... 206.2 215.7 240.9 256.2 266.1 279.6 333.7 1.3% Combustion turbine/diesel ................................... 140.1 139.5 153.0 157.8 163.3 174.8 217.0 1.3% Nuclear power6 .................................................... 99.3 99.3 89.8 87.0 83.5 83.1 79.1 -0.7% Pumped storage .................................................. 22.8 22.8 22.8 22.8 22.8 22.8 22.8 0.0% Diurnal storage .................................................... 0.5 0.6 15.2 26.9 33.7 35.4 39.7 13.3% Fuel cells ............................................................. 0.1 0.1 0.1 0.1 0.1 0.1 0.1 0.1% Renewable sources7 ........................................... 190.7 203.9 274.6 287.8 331.7 355.6 407.5 2.1% Distributed generation (natural gas)8 ................... 0.0 0.0 0.9 1.5 2.3 4.1 11.5 - - Total ............................................................... 1,008.7 1,020.2 1,050.6 1,085.0 1,144.0 1,192.2 1,344.0 0.8% Combined heat and power9 Coal ..................................................................... 3.7 3.2 2.7 2.7 2.7 2.7 2.7 -0.5% Oil and natural gas steam5 .................................. 0.5 0.5 0.6 0.6 0.6 0.6 0.6 0.6% Combined cycle ................................................... 24.7 25.0 24.9 24.9 24.9 24.9 24.9 0.0% Combustion turbine/diesel ................................... 3.2 3.3 3.2 3.2 3.2 3.2 3.2 0.0% Renewable sources7 ........................................... 1.0 1.1 1.1 1.1 1.1 1.1 1.1 0.0% Total ............................................................... 33.2 33.0 32.5 32.5 32.5 32.5 32.5 0.0% Cumulative planned additions10 Coal ..................................................................... - - - - 0.0 0.0 0.0 0.0 0.0 - - Oil and natural gas steam5 .................................. - - - - 0.3 0.3 0.3 0.3 0.3 - - Combined cycle ................................................... - - - - 25.3 25.3 25.3 25.3 25.3 - - Combustion turbine/diesel ................................... - - - - 9.1 9.1 9.1 9.1 9.1 - - Nuclear power ..................................................... - - - - 2.2 2.2 2.2 2.2 2.2 - - Pumped storage .................................................. - - - - 0.0 0.0 0.0 0.0 0.0 - - Diurnal storage .................................................... - - - - 0.0 0.0 0.0 0.0 0.0 - - Fuel cells ............................................................. - - - - 0.0 0.0 0.0 0.0 0.0 - - Renewable sources7 ........................................... - - - - 21.8 21.8 21.8 21.8 21.8 - - Distributed generation8 ........................................ - - - - 0.0 0.0 0.0 0.0 0.0 - - Total ............................................................... - - - - 58.8 58.8 58.8 58.8 58.8 - - Cumulative unplanned additions10 Coal ..................................................................... - - - - 0.0 0.0 0.0 0.0 0.0 - - Oil and natural gas steam5 .................................. - - - - 0.0 0.0 0.0 0.0 0.0 - - Combined cycle ................................................... - - - - 12.9 28.5 40.8 56.0 115.0 - - Combustion turbine/diesel ................................... - - - - 13.0 19.9 26.5 38.5 82.0 - - Nuclear power ..................................................... - - - - 0.0 0.0 0.0 0.0 0.0 - - Pumped storage .................................................. - - - - 0.0 0.0 0.0 0.0 0.0 - - Diurnal storage .................................................... - - - - 14.5 26.3 33.0 34.8 39.0 - - Fuel cells ............................................................. - - - - 0.0 0.0 0.0 0.0 0.0 - - Renewable sources7 ........................................... - - - - 49.0 62.2 106.1 130.0 181.9 - - Distributed generation8 ........................................ - - - - 0.9 1.5 2.3 4.1 11.5 - - Total ............................................................... - - - - 90.2 138.4 208.8 263.4 429.4 - - Cumulative electric power sector additions10 .. - - - - 149.0 197.2 267.6 322.2 488.2 - - Cumulative retirements11 Coal ..................................................................... - - - - 55.9 62.0 63.4 64.0 64.0 - - Oil and natural gas steam5 .................................. - - - - 29.5 31.9 35.0 38.2 42.2 - - Combined cycle ................................................... - - - - 13.1 13.5 15.8 17.5 22.5 - - Combustion turbine/diesel ................................... - - - - 8.8 10.9 11.9 12.4 13.6 - - Nuclear power ..................................................... - - - - 13.3 16.7 20.8 22.2 26.2 - - Pumped storage .................................................. - - - - 0.0 0.0 0.0 0.0 0.0 - - Diurnal storage .................................................... - - - - 0.0 0.0 0.0 0.0 0.0 - - Fuel cells ............................................................. - - - - 0.0 0.0 0.0 0.0 0.0 - - Renewable sources7 ........................................... - - - - 0.2 0.2 0.2 0.2 0.2 - - Total ............................................................... - - - - 120.8 135.0 147.0 154.6 168.7 - - Total electric power sector capacity .................... 1,041.8 1,053.2 1,083.1 1,117.5 1,176.5 1,224.7 1,376.5 0.8%

U.S. Energy Information Administration / Annual Energy Outlook 2018 21
Table A9. Electricity generating capacity (continued) (gigawatts)
Net summer capacity1
Reference case
Annual growth
2017-2050 (percent)
2016
2017
2025
2030
2035
2040
2050
End-use generators12 Coal ...................................................................... 2.9 3.0 2.7 2.6 2.6 2.5 2.2 -0.9% Petroleum ............................................................. 0.6 0.5 0.4 0.4 0.5 0.5 0.5 -0.5% Natural gas ........................................................... 16.8 17.2 20.7 23.4 26.7 30.5 40.4 2.6% Other gaseous fuels13 ........................................... 2.8 3.0 3.0 3.0 3.0 3.1 3.1 0.1% Renewable sources7 ............................................. 23.6 28.4 60.6 83.5 114.9 154.1 262.2 7.0% Other14 .................................................................. 0.5 0.5 0.5 0.5 0.5 0.5 0.5 0.2% Total .................................................................. 47.0 52.6 88.0 113.5 148.2 191.1 308.9 5.5% Cumulative capacity additions10 ....................... - - - - 37.0 62.7 97.5 140.5 258.6 - -
1Net summer capacity is the steady hourly output that generating equipment is expected to supply to system load (exclusive of auxiliary power), as demonstrated
by tests during summer peak demand. 2Includes electricity-only and combined heat and power plants that have a regulatory status. 3Includes plants that only produce electricity and that have a regulatory status. Includes capacity increases (uprates) at existing units. 4Total coal and oil and natural gas steam capacity account for the conversion of coal capacity to gas steam capacity, but the conversions are not included explicitly
as additions or retirements. The totals reflect 1.1 gigawatts of planned conversions as well as additional model-projected conversions. 5Includes oil-, gas-, and dual-fired capacity. 6Nuclear capacity includes 3.8 gigawatts of uprates. 7Includes conventional hydroelectric, geothermal, wood, wood waste, all municipal waste, landfill gas, other biomass, solar, and wind power. Facilities co-firing
biomass and coal are classified as coal. 8Primarily peak load capacity fueled by natural gas. 9Includes combined heat and power plants whose primary business is to sell electricity and heat to the public (i.e., those that report North American Industry
Classification System code 22 or that have a regulatory status). 10Cumulative additions after December 31, 2017. 11Cumulative retirements after December 31, 2017. 12Includes combined heat and power plants and electricity-only plants in the commercial and industrial sectors that have a non-regulatory status; and small on-
site generating systems in the residential, commercial, and industrial sectors used primarily for own-use generation, but which may also sell some power to the grid. 13Includes refinery gas and still gas. 14Includes batteries, chemicals, hydrogen, pitch, purchased steam, sulfur, and miscellaneous technologies. - - = Not applicable. Note: Totals may not equal sum of components due to independent rounding. Data for 2016 are model results and may differ from official EIA data reports. Sources: 2016 capacity and projected planned additions: U.S. Energy Information Administration (EIA), Form EIA-860, "Annual Electric Generator Report”
(preliminary). 2017: EIA, Short-Term Energy Outlook, October 2017 and EIA, AEO2018 National Energy Modeling System run ref2018.d121317a. Projections: EIA, AEO2018 National Energy Modeling System run ref2018.d121317a.

U.S. Energy Information Administration / Annual Energy Outlook 2018 22
Table A10. Electricity trade (billion kilowatthours, unless otherwise noted)
Electricity trade
Reference case
Annual growth
2017-2050 (percent)
2016
2017
2025
2030
2035
2040
2050
Interregional electricity trade Gross domestic sales Firm power .......................................................... 125 124 114 108 94 81 65 -1.9% Economy ............................................................. 197 185 224 224 218 203 245 0.9% Total ................................................................ 322 310 338 333 313 284 311 0.0% Gross domestic sales (million 2017 dollars) Firm power .......................................................... 8,247 8,221 7,529 7,166 6,253 5,370 4,322 -1.9% Economy ............................................................. 5,680 6,595 9,024 9,517 9,407 9,515 12,460 1.9% Total ................................................................ 13,927 14,816 16,553 16,683 15,660 14,886 16,781 0.4% International electricity trade Imports from Canada and Mexico Firm power .......................................................... 21.3 32.5 28.6 27.3 25.7 24.0 22.8 -1.1% Economy ............................................................. 59.2 43.7 38.0 41.3 41.2 42.5 41.9 -0.1% Total ................................................................ 80.4 76.2 66.6 68.6 66.9 66.5 64.7 -0.5% Exports to Canada and Mexico Firm power .......................................................... 2.4 1.8 1.8 0.9 0.0 0.0 0.0 - - Economy ............................................................. 7.3 10.1 9.7 10.0 10.0 10.0 10.0 0.0% Total ................................................................ 9.7 11.9 11.5 10.9 10.0 10.0 10.0 -0.5%
- - = Not applicable. Note: Totals may not equal sum of components due to independent rounding. Data for 2016 are model results and may differ from official EIA data reports. Firm
power sales are capacity sales, meaning the delivery of the power is scheduled as part of the normal operating conditions of the affected electric systems. Economy sales are subject to curtailment or cessation of delivery by the supplier in accordance with prior agreements or under specified conditions.
Sources: 2016 interregional firm electricity trade data: Federal Energy Regulatory Commission, Form 1, “Electric Utility Annual Report”, and 2014 seasonal reliability assessments from North American Electric Reliability Council regional entities and Independent System Operators. 2016 interregional economy electricity trade data are model results. 2016 Mexican electricity trade data: U.S. Energy Information Administration (EIA), Electric Power Annual 2016. 2016 Canadian international electricity trade data: National Energy Board, Electricity Exports and Imports Statistics, 2016. 2017: EIA, Short-Term Energy Outlook, October 2017 and EIA, AEO2018 National Energy Modeling System run ref2018.d121317a. Projections: EIA, AEO2018 National Energy Modeling System run ref2018.d121317a.

U.S. Energy Information Administration / Annual Energy Outlook 2018 23
Table A11. Petroleum and other liquids supply and disposition (million barrels per day, unless otherwise noted)
Supply and disposition
Reference case
Annual growth
2017-2050 (percent)
2016
2017
2025
2030
2035
2040
2050
Crude oil Domestic crude production1 .................................. 8.90 9.24 11.38 11.70 11.85 11.90 11.30 0.6% Alaska ................................................................ 0.49 0.48 0.54 0.60 0.55 0.52 0.30 -1.5% Lower 48 states ................................................. 8.42 8.76 10.84 11.10 11.30 11.38 11.00 0.7% Net imports ........................................................... 7.26 6.85 6.00 5.44 5.58 5.69 5.91 -0.4% Gross imports .................................................... 7.85 7.82 6.94 6.60 6.82 6.83 7.06 -0.3% Exports .............................................................. 0.59 0.97 0.93 1.15 1.24 1.13 1.15 0.5% Other crude supply2 .............................................. 0.07 0.33 0.07 0.00 0.00 0.00 0.00 - - Total crude supply ................................................. 16.23 16.42 17.46 17.14 17.43 17.59 17.21 0.1% Net product imports ................................................. -2.46 -2.64 -5.32 -5.57 -6.15 -6.21 -5.14 2.0% Gross refined product imports3 ............................. 0.88 1.62 1.10 1.05 1.12 1.23 1.29 -0.7% Unfinished oil imports ........................................... 0.61 0.58 0.54 0.50 0.46 0.41 0.33 -1.7% Blending component imports ................................ 0.66 0.65 0.50 0.31 0.17 0.17 0.16 -4.1% Exports ................................................................. 4.59 5.49 7.46 7.43 7.89 8.03 6.93 0.7% Refinery processing gain4 ........................................ 1.12 1.10 1.01 0.96 1.00 1.01 1.01 -0.2% Product stock withdrawal ......................................... -0.03 0.10 0.00 0.00 0.00 0.00 0.00 - - Natural gas plant liquids .......................................... 3.48 3.73 5.13 5.35 5.43 5.47 5.57 1.2% Supply from renewable sources .............................. 1.08 1.10 1.11 1.07 1.05 1.05 1.07 -0.1% Ethanol ................................................................. 0.90 0.92 0.90 0.84 0.80 0.80 0.85 -0.2% Domestic production .......................................... 0.98 1.00 0.98 0.94 0.91 0.90 0.95 -0.2% Net imports ........................................................ -0.07 -0.08 -0.08 -0.10 -0.11 -0.11 -0.09 0.4% Stock withdrawal ................................................ 0.00 0.00 0.00 0.00 0.00 0.00 0.00 - - Biodiesel ............................................................... 0.16 0.16 0.15 0.15 0.15 0.16 0.16 - - Domestic production .......................................... 0.10 0.10 0.08 0.08 0.08 0.08 0.08 -0.8% Net imports ........................................................ 0.06 0.05 0.07 0.07 0.07 0.07 0.08 1.2% Stock withdrawal ................................................ 0.00 0.00 0.00 0.00 0.00 0.00 0.00 - - Other biomass-derived liquids5 ............................. 0.02 0.03 0.05 0.08 0.10 0.10 0.06 2.4% Domestic production .......................................... 0.02 0.03 0.05 0.08 0.10 0.10 0.06 2.4% Net imports ........................................................ 0.00 0.00 0.00 0.00 0.00 0.00 0.00 - - Stock withdrawal ................................................ 0.00 0.00 0.00 0.00 0.00 0.00 0.00 - - Liquids from gas ...................................................... 0.00 0.00 0.00 0.00 0.00 0.00 0.00 - - Liquids from coal...................................................... 0.00 0.00 0.00 0.00 0.00 0.00 0.00 - - Other6 ...................................................................... 0.22 0.23 0.27 0.26 0.28 0.29 0.31 0.9% Total primary supply7 ............................................ 19.64 20.03 19.64 19.21 19.04 19.20 20.01 0.0% Product supplied by fuel Liquefied petroleum gases and other8 ............... 2.49 2.62 3.34 3.56 3.66 3.76 3.79 1.1% Motor gasoline9 .................................................. 9.32 9.32 8.00 7.21 6.75 6.56 6.75 -1.0% of which: E8510 .............................................. 0.01 0.01 0.15 0.19 0.20 0.21 0.11 8.8% Jet fuel11 ............................................................ 1.61 1.66 1.85 2.01 2.17 2.33 2.66 1.4% Distillate fuel oil12 ............................................... 3.88 3.95 3.98 3.88 3.83 3.86 4.02 0.1% of which: Diesel .............................................. 3.70 3.76 3.56 3.48 3.44 3.49 3.65 -0.1% Residual fuel oil ................................................. 0.33 0.33 0.36 0.34 0.33 0.31 0.29 -0.3% Other13 ............................................................... 2.01 2.01 2.15 2.24 2.33 2.42 2.55 0.7% by sector Residential and commercial ............................... 1.00 1.07 0.95 0.92 0.89 0.87 0.84 -0.7% Industrial14 ......................................................... 4.60 4.72 5.77 6.11 6.34 6.56 6.78 1.1% Transportation .................................................... 13.82 13.90 12.64 11.88 11.49 11.44 12.01 -0.4% Electric power15 ................................................. 0.11 0.09 0.06 0.05 0.05 0.05 0.04 -2.3% Unspecified sector16........................................... 0.07 0.07 0.24 0.27 0.29 0.32 0.37 5.1% Total product supplied .......................................... 19.64 19.89 19.67 19.23 19.07 19.24 20.05 0.0% Discrepancy17 .......................................................... 0.00 0.13 -0.03 -0.03 -0.03 -0.03 -0.04 - -

U.S. Energy Information Administration / Annual Energy Outlook 2018 24
Table A11. Petroleum and other liquids supply and disposition (continued) (million barrels per day, unless otherwise noted)
Supply and disposition
Reference case
Annual growth
2017-2050 (percent)
2016
2017
2025
2030
2035
2040
2050
Domestic refinery distillation capacity18 ................... 18.4 18.6 19.5 19.5 19.5 19.5 19.5 0.2% Capacity utilization rate (percent)19 .......................... 89.7 90.0 91.1 89.4 90.7 91.4 89.2 0.0% Total gross imports .................................................. 10.05 10.73 9.19 8.58 8.67 8.76 8.98 -0.5% Total gross exports .................................................. 5.26 6.56 8.52 8.74 9.28 9.31 8.23 0.7% Total net imports ...................................................... 4.79 4.18 0.67 -0.17 -0.61 -0.55 0.75 -5.1% Net import share of product supplied (percent) ........ 24.4 20.9 3.4 -0.9 -3.2 -2.8 3.7 -5.1% Expenditures for imported crude oil and petroleum products (billion 2017 dollars) .............. 110 124 215 213 233 250 274 2.4%
1Includes lease condensate. 2Strategic petroleum reserve stock additions plus unaccounted for crude oil and crude oil stock withdrawals. 3Includes other hydrocarbons and alcohols. 4The volumetric amount by which total output is greater than input due to the processing of crude oil into products which, in total, have a lower specific gravity
than the crude oil processed. 5Includes pyrolysis oils, biomass-derived Fischer-Tropsch liquids, biobutanol, and renewable feedstocks used for the on-site production of diesel and gasoline. 6Includes domestic sources of other blending components, other hydrocarbons, and ethers. 7Total crude supply, net product imports, refinery processing gain, product stock withdrawal, natural gas plant liquids, supply from renewable sources, liquids
from gas, liquids from coal, and other supply. 8Includes ethane, natural gasoline, and refinery olefins. 9Includes ethanol and ethers blended into gasoline. 10E85 refers to a blend of 85 percent ethanol (renewable) and 15 percent motor gasoline (nonrenewable). To address cold starting issues, the percentage of
ethanol varies seasonally. The annual average ethanol content of 74 percent is used for these projections. 11Includes only kerosene type. 12Includes distillate fuel oil from petroleum and biomass feedstocks. 13Includes kerosene, aviation gasoline, petrochemical feedstocks, lubricants, waxes, asphalt, road oil, still gas, special naphthas, petroleum coke, crude oil product
supplied, methanol, and miscellaneous petroleum products. 14Includes energy for combined heat and power plants that have a non-regulatory status, and small on-site generating systems. 15Includes consumption of energy by electricity-only and combined heat and power plants that have a regulatory status. 16Represents consumption unattributed to the sectors above. 17Balancing item. Includes unaccounted for supply, losses, and gains. 18End-of-year operable capacity. 19Rate is calculated by dividing the gross annual input to atmospheric crude oil distillation units by their operable refining capacity in barrels per calendar day. - - = Not applicable. Note: Totals may not equal sum of components due to independent rounding. Data for 2016 are model results and may differ from official EIA data reports. Sources: 2016 product supplied based on: U.S. Energy Information Administration (EIA), Monthly Energy Review, September 2017. Other 2016 data: EIA,
Petroleum Supply Annual 2014. 2017: EIA, Short-Term Energy Outlook, October 2017 and EIA, AEO2018 National Energy Modeling System run ref2018.d121317a. Projections: EIA, AEO2018 National Energy Modeling System run ref2018.d121317a.

U.S. Energy Information Administration / Annual Energy Outlook 2018 25
Table A12. Petroleum and other liquids prices (2017 dollars per gallon, unless otherwise noted)
Sector and fuel
Reference case
Annual growth
2017-2050 (percent)
2016
2017
2025
2030
2035
2040
2050
Crude oil prices (2017 dollars per barrel) Brent spot ............................................................. 45 52 86 93 100 106 114 2.4% West Texas Intermediate spot .............................. 44 50 82 89 95 101 110 2.4% Average imported refiners acquisition cost1 .......... 39 47 77 81 87 94 100 2.3% Brent / West Texas Intermediate spread .............. 0 3 3 4 5 5 4 1.2% Delivered sector product prices Residential Propane ............................................................. 1.51 1.58 1.69 1.74 1.84 1.92 2.08 0.8% Distillate fuel oil .................................................. 2.15 2.50 3.65 3.82 3.99 4.15 4.20 1.6% Commercial Distillate fuel oil .................................................. 1.89 2.21 3.05 3.21 3.38 3.54 3.59 1.5% Residual fuel oil ................................................. 0.79 1.05 1.75 1.91 2.06 2.19 2.31 2.4% Residual fuel oil (2017 dollars per barrel) .......... 33 44 73 80 86 92 97 2.4% Industrial2 Propane ............................................................. 1.07 1.13 1.23 1.28 1.38 1.47 1.62 1.1% Distillate fuel oil .................................................. 1.89 2.20 3.00 3.18 3.35 3.51 3.56 1.5% Residual fuel oil ................................................. 0.75 1.00 2.00 2.16 2.30 2.44 2.54 2.9% Residual fuel oil (2017 dollars per barrel) .......... 31 42 84 91 97 102 107 2.9% Transportation Propane ............................................................. 1.62 1.69 1.83 1.88 1.98 2.06 2.21 0.8% E853 ................................................................... 1.98 2.12 2.47 2.30 2.31 2.45 3.16 1.2% Ethanol wholesale price ..................................... 1.48 1.43 2.56 2.51 2.31 2.33 2.38 1.6% Motor gasoline4 .................................................. 2.30 2.50 3.25 3.34 3.46 3.57 3.67 1.2% Jet fuel5 .............................................................. 1.35 1.61 2.56 2.74 2.93 3.12 3.30 2.2% Diesel fuel (distillate fuel oil)6 ............................. 2.37 2.65 3.55 3.73 3.90 4.05 4.09 1.3% Residual fuel oil ................................................. 0.94 1.25 1.95 2.13 2.27 2.40 2.49 2.1% Residual fuel oil (2017 dollars per barrel) .......... 39 53 82 89 95 101 105 2.1% Electric power7 Distillate fuel oil .................................................. 1.67 1.94 2.88 2.99 3.14 3.30 3.41 1.7% Residual fuel oil ................................................. 1.24 1.58 2.25 2.39 2.53 2.62 2.62 1.6% Residual fuel oil (2017 dollars per barrel) .......... 52 66 95 101 106 110 110 1.6% Average prices, all sectors8 Propane ............................................................. 1.31 1.39 1.53 1.57 1.66 1.74 1.88 0.9% Motor gasoline4 .................................................. 2.30 2.50 3.25 3.34 3.46 3.57 3.67 1.2% Jet fuel5 .............................................................. 1.35 1.61 2.56 2.74 2.93 3.12 3.30 2.2% Distillate fuel oil .................................................. 2.26 2.55 3.44 3.61 3.78 3.93 3.96 1.3% Residual fuel oil ................................................. 0.99 1.27 1.96 2.13 2.27 2.40 2.49 2.0% Residual fuel oil (2017 dollars per barrel) .......... 42 53 82 89 95 101 104 2.0% Average ......................................................... 1.93 2.13 2.67 2.73 2.82 2.93 3.05 1.1%

U.S. Energy Information Administration / Annual Energy Outlook 2018 26
Table A12. Petroleum and other liquids prices (continued) (nominal dollars per gallon, unless otherwise noted)
Sector and fuel
Reference case
Annual growth
2017-2050 (percent)
2016
2017
2025
2030
2035
2040
2050
Crude oil prices (nominal dollars per barrel) Brent spot ............................................................. 44 52 104 125 150 179 244 4.8% West Texas Intermediate spot .............................. 43 50 100 120 143 171 235 4.8% Average imported refiners acquisition cost1 .......... 39 47 93 110 131 158 214 4.7% Delivered sector product prices Residential Propane ............................................................. 1.49 1.58 2.05 2.35 2.77 3.25 4.46 3.2% Distillate fuel oil .................................................. 2.11 2.50 4.42 5.15 6.01 7.00 9.03 4.0% Commercial Distillate fuel oil .................................................. 1.86 2.21 3.69 4.34 5.10 5.97 7.71 3.9% Residual fuel oil ................................................. 0.78 1.05 2.11 2.58 3.10 3.70 4.97 4.8% Residual fuel oil (nominal dollars per barrel) ...... 33 44 89 108 130 156 209 4.8% Industrial2 Propane ............................................................. 1.05 1.13 1.49 1.73 2.08 2.48 3.49 3.5% Distillate fuel oil .................................................. 1.86 2.20 3.64 4.29 5.04 5.92 7.64 3.8% Residual fuel oil ................................................. 0.73 1.00 2.42 2.92 3.47 4.11 5.46 5.3% Residual fuel oil (nominal dollars per barrel) ...... 31 42 102 122 146 173 229 5.3% Transportation Propane ............................................................. 1.59 1.69 2.22 2.54 2.98 3.48 4.75 3.2% E853 ................................................................... 1.95 2.12 2.99 3.10 3.48 4.13 6.79 3.6% Ethanol wholesale price ..................................... 1.45 1.43 3.10 3.39 3.49 3.93 5.12 3.9% Motor gasoline4 .................................................. 2.26 2.50 3.93 4.51 5.20 6.03 7.90 3.5% Jet fuel5 .............................................................. 1.32 1.61 3.10 3.70 4.42 5.26 7.08 4.6% Diesel fuel (distillate fuel oil)6 ............................. 2.33 2.65 4.30 5.03 5.88 6.84 8.78 3.7% Residual fuel oil ................................................. 0.92 1.25 2.37 2.87 3.42 4.05 5.36 4.5% Residual fuel oil (nominal dollars per barrel) ...... 39 53 99 121 144 170 225 4.5% Electric power7 Distillate fuel oil .................................................. 1.64 1.94 3.48 4.03 4.74 5.57 7.32 4.1% Residual fuel oil ................................................. 1.22 1.58 2.73 3.23 3.81 4.43 5.63 3.9% Residual fuel oil (nominal dollars per barrel) ...... 51 66 114 136 160 186 237 3.9% Average prices, all sectors8 Propane ............................................................. 1.28 1.39 1.85 2.12 2.51 2.94 4.04 3.3% Motor gasoline4 .................................................. 2.26 2.50 3.93 4.51 5.21 6.03 7.90 3.5% Jet fuel5 .............................................................. 1.32 1.61 3.10 3.70 4.42 5.26 7.08 4.6% Distillate fuel oil .................................................. 2.22 2.55 4.16 4.88 5.69 6.63 8.52 3.7% Residual fuel oil ................................................. 0.97 1.27 2.37 2.88 3.42 4.05 5.34 4.4% Residual fuel oil (nominal dollars per barrel) ...... 40.83 53.44 99.65 120.77 143.61 169.90 224.32 4.4% Average ......................................................... 1.89 2.13 3.24 3.68 4.25 4.95 6.56 3.5%
1Weighted average price delivered to U.S. refiners. 2Includes combined heat and power plants that have a non-regulatory status, and small on-site generating systems. 3E85 refers to a blend of 85 percent ethanol (renewable) and 15 percent motor gasoline (nonrenewable). To address cold starting issues, the percentage of
ethanol varies seasonally. The annual average ethanol content of 74 percent is used for these projections. 4Sales weighted-average price for all grades. Includes Federal, State, and local taxes. 5Includes only kerosene type. 6Diesel fuel for on-road use. Includes Federal and State taxes while excluding county and local taxes. 7Includes electricity-only and combined heat and power plants that have a regulatory status. 8Weighted averages of end-use fuel prices are derived from the prices in each sector and the corresponding sectoral consumption. Note: Data for 2016 are model results and may differ from official EIA data reports. Sources: 2016 Brent and West Texas Intermediate crude oil spot prices: Thomson Reuters. 2016 average imported crude oil price: U.S. Energy Information
Administration (EIA), Monthly Energy Review, September 2017. 2016 prices for motor gasoline, distillate fuel oil, and jet fuel are based on: EIA, Petroleum Marketing Monthly, July 2017. 2016 residential, commercial, industrial, and transportation sector petroleum product prices are derived from: EIA, Form EIA-782A, “Refiners’/Gas Plant Operators’ Monthly Petroleum Product Sales Report.” 2016 electric power prices based on: EIA, Monthly Energy Review, September 2017. 2016 E85 prices derived from monthly prices in the Clean Cities Alternative Fuel Price Report. 2016 wholesale ethanol prices derived from Oil Price Information Service, Chicago average spot price. 2017: EIA, Short-Term Energy Outlook, October 2017 and EIA, AEO2018 National Energy Modeling System run ref2018.d121317a. Projections: EIA, AEO2018 National Energy Modeling System run ref2018.d121317a.

U.S. Energy Information Administration / Annual Energy Outlook 2018 27
Table A13. Natural gas supply, disposition, and prices (trillion cubic feet, unless otherwise noted)
Supply, disposition, and prices
Reference case
Annual growth
2017-2050 (percent)
2016
2017
2025
2030
2035
2040
2050
Supply Dry gas production1 .............................................. 26.94 27.10 35.79 37.83 38.72 40.15 42.98 1.4% Supplemental natural gas2 .................................... 0.06 0.06 0.06 0.06 0.06 0.06 0.06 0.2% Net imports ........................................................... 0.69 -0.09 -5.89 -6.99 -7.19 -7.57 -8.40 14.7% Pipeline3 ............................................................. 0.79 0.50 -1.34 -1.71 -1.91 -2.29 -3.12 - - Liquefied natural gas ......................................... -0.10 -0.59 -4.55 -5.28 -5.28 -5.28 -5.28 6.9% Total supply ........................................................... 27.69 27.06 29.96 30.89 31.59 32.64 34.64 0.8% Consumption by sector ......................................... 27.50 26.68 29.78 30.72 31.42 32.47 34.48 0.8% Residential ............................................................ 4.35 4.38 4.58 4.57 4.55 4.52 4.54 0.1% Commercial .......................................................... 3.11 3.15 3.22 3.30 3.44 3.58 3.94 0.7% Industrial4 .............................................................. 9.33 9.45 11.29 11.72 12.09 12.55 13.18 1.0% Other industrial4 ................................................. 7.72 7.77 8.84 9.12 9.46 9.86 10.41 0.9% Lease and plant fuel5 ......................................... 1.59 1.61 1.99 2.06 2.09 2.16 2.23 1.0% Fuel used to liquefy gas for export6 ................... 0.02 0.07 0.46 0.54 0.54 0.54 0.54 6.5% Natural-gas-to-liquids heat and power7 .............. 0.00 0.00 0.00 0.00 0.00 0.00 0.00 - - Natural gas to liquids production8 ...................... 0.00 0.00 0.00 0.00 0.00 0.00 0.00 - - Transportation....................................................... 0.75 0.69 0.87 0.95 1.04 1.14 1.38 2.1% Motor vehicles, trains, and ships ........................ 0.07 0.08 0.20 0.27 0.35 0.44 0.66 6.6% Pipeline and distribution fuel .............................. 0.68 0.61 0.68 0.68 0.68 0.69 0.72 0.5% Electric power9 ...................................................... 9.97 9.02 9.82 10.17 10.30 10.69 11.44 0.7% Discrepancy10 ......................................................... 0.18 0.38 0.18 0.17 0.17 0.17 0.16 - - Natural gas spot price at Henry Hub (2017 dollars per million Btu) ................................ 2.57 3.05 4.07 4.26 4.26 4.50 5.01 1.5% (nominal dollars per million Btu)............................ 2.53 3.05 4.93 5.75 6.41 7.59 10.78 3.9% Delivered prices (2017 dollars per thousand cubic feet) Residential ......................................................... 10.30 11.17 12.46 12.74 12.94 13.28 13.99 0.7% Commercial........................................................ 7.50 8.11 9.81 9.96 10.04 10.27 10.84 0.9% Industrial11 ......................................................... 3.60 4.10 5.10 5.25 5.26 5.51 6.09 1.2% Transportation12 ................................................. 14.81 14.99 14.32 13.65 13.20 13.18 13.59 -0.3% Electric power7 ................................................... 3.03 3.58 4.63 4.78 4.77 5.03 5.60 1.4% Average13 ....................................................... 5.04 5.73 6.83 6.98 7.01 7.24 7.83 0.9% (nominal dollars per thousand cubic feet) Residential ......................................................... 10.12 11.17 15.08 17.19 19.49 22.40 30.06 3.0% Commercial........................................................ 7.37 8.11 11.88 13.45 15.13 17.32 23.29 3.2% Industrial11 ......................................................... 3.54 4.10 6.18 7.09 7.93 9.29 13.10 3.6% Transportation12 ................................................. 14.55 14.99 17.34 18.43 19.88 22.24 29.21 2.0% Electric power7 ................................................... 2.98 3.58 5.60 6.45 7.19 8.49 12.04 3.7% Average13 ....................................................... 4.96 5.73 8.27 9.41 10.56 12.22 16.83 3.3%
1Marketed production (wet) minus extraction losses. 2Synthetic natural gas, propane air, coke oven gas, refinery gas, biomass gas, air injected for Btu stabilization, and manufactured gas commingled and distributed
with natural gas. 3Natural gas imported from Canada and Mexico. 4Includes energy for combined heat and power plants that have a non-regulatory status, and small on-site generating systems. 5Represents natural gas used in well, field, and lease operations, in natural gas processing plant machinery, and for liquefaction in export facilities. 6Fuel used in facilities that liquefy natural gas for export. 7Includes any natural gas used in the process of converting natural gas to liquid fuel that is not actually converted. 8Includes any natural gas converted into liquid fuel. 9Includes consumption of energy by electricity-only and combined heat and power plants that have a regulatory status. 10Balancing item. Natural gas lost as a result of converting flow data measured at varying temperatures and pressures to a standard temperature and pressure
and the merger of different data reporting systems which vary in scope, format, definition, and respondent type. In addition, 2017 values include net storage injections.
11Excludes use for lease and plant fuel and fuel used for liquefaction in export facilities. 12Natural gas used as fuel in motor vehicles, trains, and ships. Price includes estimated motor vehicle fuel taxes and estimated dispensing costs or charges. 13Weighted average prices. Weights used are the sectoral consumption values excluding lease, plant, pipeline and distribution fuel, and fuel used for liquefaction
in export facilities. - - = Not applicable. Note: Totals may not equal sum of components due to independent rounding. Data for 2016 are model results and may differ from official EIA data reports. Sources: 2016 supply values; lease, plant, and pipeline fuel consumption; and residential and commercial delivered prices: U.S. Energy Information
Administration (EIA), Natural Gas Annual 2016. 2016 industrial delivered prices derived from: EIA, Manufacturing Energy Consumption Survey, 2002-2014. Other 2016 consumption based on: EIA, Monthly Energy Review, September 2017. 2016 natural gas spot price at Henry Hub: Thomson Reuters. 2016 electric power prices: EIA, Electric Power Monthly, July 2017, Table 4.13.B, and EIA, State Energy Data Report 2015. 2016 transportation sector delivered prices are model results. 2017: EIA, Short-Term Energy Outlook, October 2017 and EIA, AEO2018 National Energy Modeling System run ref2018.d121317a. Projections: EIA, AEO2018 National Energy Modeling System run ref2018.d121317a.

U.S. Energy Information Administration / Annual Energy Outlook 2018 28
Table A14. Oil and gas supply
Production and supply
Reference case
Annual growth
2017-2050 (percent)
2016
2017
2025
2030
2035
2040
2050
Crude oil Lower 48 average wellhead price1 (2017 dollars per barrel) ..................................... 39 50 82 89 95 101 109 2.4% Production (million barrels per day)2 United States total .............................................. 8.90 9.24 11.38 11.70 11.85 11.90 11.30 0.6% Lower 48 onshore ............................................ 6.75 6.98 8.94 9.54 9.83 9.90 9.54 0.9% Tight oil3 ........................................................ 4.56 4.97 7.01 7.61 7.98 8.14 7.92 1.4% Carbon dioxide enhanced oil recovery .......... 0.31 0.30 0.38 0.42 0.36 0.26 0.20 -1.3% Other ............................................................. 1.88 1.71 1.55 1.52 1.49 1.49 1.42 -0.6% Lower 48 offshore ............................................ 1.67 1.77 1.90 1.56 1.47 1.48 1.47 -0.6% State ............................................................. 0.07 0.07 0.04 0.04 0.03 0.03 0.02 -3.2% Federal ......................................................... 1.60 1.71 1.86 1.52 1.44 1.45 1.45 -0.5% Alaska .............................................................. 0.49 0.48 0.54 0.60 0.55 0.52 0.30 -1.5% Onshore ........................................................ 0.39 0.41 0.38 0.34 0.30 0.29 0.17 -2.6% State offshore ............................................... 0.10 0.07 0.16 0.24 0.22 0.20 0.12 1.5% Federal offshore ............................................ 0.00 0.00 0.00 0.01 0.04 0.02 0.01 1.9% Natural gas plant liquids production (million barrels per day) United States total ................................................ 3.48 3.73 5.16 5.34 5.42 5.46 5.57 1.2% Lower 48 onshore .............................................. 3.12 3.27 4.79 5.02 5.10 5.14 5.26 1.5% Lower 48 offshore .............................................. 0.33 0.43 0.31 0.26 0.26 0.27 0.28 -1.3% Alaska ................................................................ 0.03 0.03 0.05 0.06 0.06 0.05 0.03 -0.4% Natural gas Natural gas spot price at Henry Hub (2017 dollars per million Btu)............................. 2.57 3.05 4.07 4.26 4.26 4.50 5.01 1.5% Dry production (trillion cubic feet)4 United States total .............................................. 26.94 27.10 35.79 37.83 38.72 40.15 42.98 1.4% Lower 48 onshore ............................................ 25.37 25.49 34.38 36.56 37.39 38.68 41.46 1.5% Tight gas ....................................................... 5.44 5.30 5.37 5.16 5.00 4.99 5.33 0.0% Shale gas and tight oil plays3 ........................ 14.24 14.77 24.09 26.87 28.24 29.77 32.70 2.4% Coalbed methane ......................................... 1.00 0.90 0.78 0.71 0.64 0.60 0.50 -1.7% Other ............................................................. 4.69 4.53 4.13 3.82 3.51 3.31 2.93 -1.3% Lower 48 offshore ............................................ 1.26 1.29 1.08 0.94 1.00 1.15 1.21 -0.2% State ............................................................. 0.12 0.10 0.04 0.03 0.02 0.02 0.01 -5.8% Federal ......................................................... 1.14 1.19 1.04 0.91 0.98 1.13 1.20 0.0% Alaska .............................................................. 0.30 0.32 0.32 0.33 0.33 0.33 0.31 0.0% Supplemental gas supplies (trillion cubic feet)5 0.06 0.06 0.06 0.06 0.06 0.06 0.06 0.2% Total lower 48 wells drilled (thousands) .............. 14.4 25.6 29.7 31.6 33.1 34.0 34.4 0.9%
1Represents lower 48 onshore and offshore supplies. 2Includes lease condensate. 3Tight oil represents resources in low-permeability reservoirs, including shale and chalk formations. The specific plays included in the tight oil category are
Bakken/Three Forks/Sanish, Eagle Ford, Woodford, Austin Chalk, Spraberry, Niobrara, Avalon/Bone Springs, and Monterey. 4Marketed production (wet) minus extraction losses. 5Synthetic natural gas, propane air, coke oven gas, refinery gas, biomass gas, air injected for Btu stabilization, and manufactured gas commingled and distributed
with natural gas. Note: Totals may not equal sum of components due to independent rounding. Data for 2016 are model results and may differ from official EIA data reports. Sources: 2016 crude oil lower 48 average wellhead price: U.S. Energy Information Administration (EIA), Petroleum Marketing Monthly, July 2017. 2016 lower
48 onshore, lower 48 offshore, and Alaska crude oil production: EIA, Petroleum Supply Monthly, July 2017). 2016 natural gas spot price at Henry Hub: Thomson Reuters. 2016 Alaska and total natural gas production: EIA, Natural Gas Monthly, July 2017). 2016 supplemental gas supplies: EIA, Natural Gas Annual 2016. Other 2016 values: EIA, Office of Energy Analysis. 2017: EIA, Short-Term Energy Outlook, October 2017 and EIA, AEO2018 National Energy Modeling System run ref2018.d121317a. Projections: EIA, AEO2018 National Energy Modeling System run ref2018.d121317a.

U.S. Energy Information Administration / Annual Energy Outlook 2018 29
Table A15. Coal supply, disposition, and prices (million short tons, unless otherwise noted)
Supply, disposition, and prices
Reference case
Annual growth
2017-2050 (percent)
2016
2017
2025
2030
2035
2040
2050
Production1 Appalachia ............................................................ 183 196 155 151 151 152 138 -1.1% Interior .................................................................. 147 150 188 206 212 228 240 1.4% West ..................................................................... 411 438 395 393 373 366 368 -0.5% East of the Mississippi .......................................... 293 314 311 323 328 345 344 0.3% West of the Mississippi ......................................... 448 470 428 427 409 401 403 -0.5% Total .................................................................. 741 784 738 750 736 746 747 -0.1% Waste coal supplied2 ............................................. 9 9 9 9 9 9 9 0.0% Net imports Imports3 ................................................................ 10 9 4 2 2 2 2 -4.4% Exports ................................................................. 60 75 67 69 73 86 85 0.4% Total .................................................................. -50 -66 -64 -67 -71 -84 -83 0.7% Total supply4 .......................................................... 700 727 684 692 674 671 673 -0.2% Consumption by sector Commercial and institutional ................................. 1 1 2 2 2 2 2 2.1% Coke plants ........................................................... 16 18 16 16 18 18 18 -0.1% Other industrial5 .................................................... 35 33 39 38 36 36 36 0.3% Coal-to-liquids heat and power ............................. 0 0 0 0 0 0 0 - - Coal to liquids production ..................................... 0 0 0 0 0 0 0 - - Electric power6 ...................................................... 679 676 630 638 621 617 619 -0.3% Total .................................................................. 731 728 686 694 676 673 674 -0.2% Discrepancy and stock change7 ........................... -31 -1 -2 -2 -2 -2 -2 - - Average minemouth price8 (2017 dollars per short ton) ................................... 33.0 32.9 34.0 35.0 36.6 38.7 39.8 0.6% (2017 dollars per million Btu) ................................ 1.65 1.63 1.69 1.75 1.82 1.91 1.97 0.6% Delivered prices9 (2017 dollars per short ton) Commercial and institutional ................................. 87.3 84.9 82.5 84.9 85.3 86.6 88.7 0.1% Coke plants ........................................................... 120.4 118.3 129.6 132.1 134.9 137.3 145.9 0.6% Other industrial5 .................................................... 68.6 67.7 70.9 70.5 70.0 70.7 73.3 0.2% Coal to liquids ....................................................... - - - - - - - - - - - - - - - - Electric power6 (2017 dollars per short ton) ................................ 42.1 41.3 43.6 44.2 45.1 46.5 47.4 0.4% (2017 dollars per million Btu) ............................. 2.20 2.15 2.28 2.31 2.35 2.41 2.46 0.4% Average........................................................ 45.3 44.6 47.2 47.8 48.9 50.3 51.6 0.4% Exports10 ............................................................... 84.0 79.0 80.3 77.5 79.2 83.2 86.7 0.3%

U.S. Energy Information Administration / Annual Energy Outlook 2018 30
Table A15. Coal supply, disposition, and prices (continued) (million short tons, unless otherwise noted)
Supply, disposition, and prices
Reference case
Annual growth
2017-2050 (percent)
2016
2017
2025
2030
2035
2040
2050
Average minemouth price8 (nominal dollars per short ton) .............................. 32.4 32.9 41.2 47.3 55.2 65.3 85.5 2.9% (nominal dollars per million Btu)............................ 1.62 1.63 2.05 2.36 2.74 3.22 4.23 2.9% Delivered prices9 (nominal dollars per short ton) Commercial and institutional ................................. 85.8 84.9 99.9 114.6 128.5 146.0 190.7 2.5% Coke plants ........................................................... 118.3 118.3 156.9 178.2 203.2 231.7 313.6 3.0% Other industrial5 .................................................... 67.4 67.7 85.8 95.1 105.4 119.4 157.6 2.6% Coal to liquids ....................................................... - - - - - - - - - - - - - - - - Electric power6 (nominal dollars per short ton) ........................... 41.4 41.3 52.8 59.6 68.0 78.4 102.0 2.8% (nominal dollars per million Btu) ......................... 2.16 2.15 2.76 3.11 3.54 4.06 5.29 2.8% Average........................................................ 44.5 44.6 57.2 64.4 73.7 84.9 110.8 2.8% Exports10 ............................................................... 82.5 79.0 97.2 104.6 119.3 140.4 186.3 2.6%
1Includes anthracite, bituminous coal, subbituminous coal, and lignite. 2Includes waste coal consumed by the electric power and industrial sectors. Waste coal supplied is counted as a supply-side item to balance the same amount
of waste coal included in the consumption data. 3Excludes imports to Puerto Rico and the U.S. Virgin Islands. 4Production plus waste coal supplied plus net imports. 5Includes consumption for combined heat and power plants that have a non-regulatory status, and small on-site generating systems. Excludes all coal use in the
coal-to-liquids process. 6Includes all electricity-only and combined heat and power plants that have a regulatory status. 7Balancing item: the sum of production, net imports, and waste coal supplied minus total consumption. 8Includes reported prices for both open market and captive mines. Prices weighted by production, which differs from average minemouth prices published in EIA
data reports where it is weighted by reported sales. 9Prices weighted by consumption; weighted average excludes commercial and institutional prices, and export free-alongside-ship prices. 10Free-alongside-ship price at U.S. port of exit. - - = Not applicable. Btu = British thermal unit. Note: Totals may not equal sum of components due to independent rounding. Data for 2016 are model results and may differ from official EIA data reports. Sources: 2016 data based on: U.S. Energy Information Administration (EIA), Annual Coal Report 2013; EIA, Quarterly Coal Report, October-December 2016;
and EIA, AEO2018 National Energy Modeling System run ref2018.d121317a. 2017: EIA, Short-Term Energy Outlook, October 2017 and EIA, AEO2018 National Energy Modeling System run ref2018.d121317a. Projections: EIA, AEO2018 National Energy Modeling System run ref2018.d121317a.

U.S. Energy Information Administration / Annual Energy Outlook 2018 31
Table A16. Renewable energy generating capacity and generation (gigawatts, unless otherwise noted)
Net summer capacity and generation
Reference case
Annual growth
2017-2050 (percent)
2016
2017
2025
2030
2035
2040
2050
Electric power sector1 Net summer capacity Conventional hydroelectric power ...................... 79.0 79.2 79.4 79.4 79.5 79.5 79.7 0.0% Geothermal2 ....................................................... 2.5 2.5 3.9 5.4 6.7 7.2 8.5 3.8% Municipal waste3 ................................................ 3.7 3.7 3.7 3.7 3.7 3.7 3.7 0.0% Wood and other biomass4.................................. 3.6 3.6 3.8 3.8 3.8 3.8 3.8 0.2% Solar thermal ..................................................... 1.8 1.8 1.8 1.8 1.8 1.8 1.8 0.0% Solar photovoltaic5 ............................................. 19.9 25.3 51.6 63.1 105.5 128.7 172.4 6.0% Wind .................................................................. 81.1 88.9 131.4 131.5 131.7 131.8 138.6 1.4% Offshore wind..................................................... 0.0 0.0 0.1 0.1 0.1 0.1 0.1 2.2% Total electric power sector capacity ........... 191.7 205.0 275.6 288.8 332.8 356.6 408.5 2.1% Generation (billion kilowatthours) Conventional hydroelectric power ...................... 266.3 294.7 295.6 295.6 295.8 296.0 296.8 0.0% Geothermal2 ....................................................... 15.8 17.1 27.9 40.6 50.6 55.2 65.7 4.2% Biogenic municipal waste6 ................................. 18.6 19.9 21.1 21.6 21.5 22.0 23.1 0.5% Wood and other biomass ................................... 13.5 5.6 9.5 9.2 9.1 9.8 9.8 1.7% Dedicated plants ............................................. 12.9 4.9 9.2 9.0 8.8 9.5 9.2 1.9% Cofiring ........................................................... 0.6 0.7 0.3 0.3 0.3 0.3 0.6 -0.5% Solar thermal ..................................................... 3.4 3.3 2.9 2.8 2.8 2.8 2.8 -0.5% Solar photovoltaic5 ............................................. 32.2 43.6 109.4 138.9 244.9 307.8 409.0 7.0% Wind .................................................................. 226.9 245.9 404.3 407.3 409.6 410.5 438.5 1.8% Offshore wind..................................................... 0.0 0.1 0.1 0.1 0.1 0.1 0.1 2.2% Total electric power sector generation ....... 576.8 630.2 870.8 916.2 1,034.4 1,104.2 1,245.7 2.1% End-use sectors7 Net summer capacity Conventional hydroelectric power ................... 0.3 0.3 0.3 0.3 0.3 0.3 0.3 0.0% Geothermal ..................................................... 0.0 0.0 0.0 0.0 0.0 0.0 0.0 - - Municipal waste8 ............................................. 0.5 0.5 0.5 0.5 0.5 0.5 0.5 0.0% Biomass .......................................................... 4.0 4.2 4.5 4.5 4.4 4.6 5.0 0.5% Solar photovoltaic5 .......................................... 15.7 20.3 52.2 75.1 106.3 144.8 251.3 7.9% Wind ............................................................... 3.1 3.1 3.1 3.2 3.4 3.8 5.1 1.5% Total end-use sector capacity .................. 23.6 28.4 60.6 83.5 114.9 154.1 262.2 7.0% Generation (billion kilowatthours) Conventional hydroelectric power ................... 1.5 1.5 1.5 1.5 1.5 1.5 1.5 0.0% Geothermal ..................................................... 0.0 0.0 0.0 0.0 0.0 0.0 0.0 - - Municipal waste8 ............................................. 3.8 3.8 3.8 3.8 3.8 3.8 3.8 0.0% Biomass .......................................................... 22.0 23.2 23.2 23.0 22.8 24.0 26.0 0.3% Solar photovoltaic5 .......................................... 21.7 28.2 73.1 106.1 151.8 208.6 367.1 8.1% Wind ............................................................... 3.9 3.9 4.0 4.1 4.3 4.9 6.6 1.6% Total end-use sector generation .............. 52.9 60.6 105.6 138.5 184.3 242.8 405.0 5.9%

U.S. Energy Information Administration / Annual Energy Outlook 2018 32
Table A16. Renewable energy generating capacity and generation (continued) (gigawatts, unless otherwise noted)
Net summer capacity and generation
Reference case
Annual growth
2017-2050 (percent)
2016
2017
2025
2030
2035
2040
2050
Total, all sectors Net summer capacity Conventional hydroelectric power ...................... 79.3 79.6 79.7 79.7 79.8 79.9 80.0 0.0% Geothermal ........................................................ 2.5 2.5 3.9 5.4 6.7 7.2 8.5 3.8% Municipal waste ................................................. 4.2 4.2 4.2 4.2 4.2 4.2 4.2 0.0% Wood and other biomass4.................................. 7.6 7.8 8.3 8.2 8.2 8.4 8.8 0.4% Solar5 ................................................................. 37.4 47.4 105.6 139.9 213.5 275.2 425.4 6.9% Wind .................................................................. 84.2 92.0 134.5 134.7 135.2 135.7 143.8 1.4% Total capacity, all sectors ............................ 215.3 233.4 336.2 372.3 447.7 510.7 670.7 3.3% Generation (billion kilowatthours) Conventional hydroelectric power ...................... 267.8 296.2 297.0 297.1 297.3 297.5 298.3 0.0% Geothermal ........................................................ 15.8 17.1 27.9 40.6 50.6 55.2 65.7 4.2% Municipal waste ................................................. 22.5 23.7 25.0 25.4 25.3 25.9 26.9 0.4% Wood and other biomass ................................... 35.5 28.8 32.7 32.2 32.0 33.8 35.8 0.7% Solar5 ................................................................. 57.3 75.1 185.3 247.8 399.5 519.2 778.8 7.3% Wind .................................................................. 230.8 249.9 408.4 411.5 414.1 415.5 445.2 1.8% Total generation, all sectors ........................ 629.7 690.8 976.4 1,054.7 1,218.7 1,347.0 1,650.7 2.7%
1Includes electricity-only and combined heat and power plants that have a regulatory status. 2Includes both hydrothermal resources (hot water and steam) and near-field enhanced geothermal systems (EGS). Near-field EGS potential occurs on known
hydrothermal sites, however this potential requires the addition of external fluids for electricity generation and is only available after 2025. 3Includes municipal waste, landfill gas, and municipal sewage sludge. Incremental growth is assumed to be for landfill gas facilities. All municipal waste is
included, although a portion of the municipal waste stream contains petroleum-derived plastics and other non-renewable sources. 4Facilities co-firing biomass and coal are classified as coal. 5Does not include off-grid photovoltaics. 6Includes biogenic municipal waste, landfill gas, and municipal sewage sludge. Incremental growth is assumed to be for landfill gas facilities. Only biogenic
municipal waste is included. The U.S. Energy Information Administration estimates that in 2017 approximately 7 billion kilowatthours of electricity were generated from a municipal waste stream containing petroleum-derived plastics and other non-renewable sources. See U.S. Energy Information Administration, Methodology for Allocating Municipal Solid Waste to Biogenic and Non-Biogenic Energy (Washington, DC, May 2007).
7Includes combined heat and power plants and electricity-only plants in the commercial and industrial sectors that have a non-regulatory status; and small on-site generating systems in the residential, commercial, and industrial sectors used primarily for own-use generation, but which may also sell some power to the grid.
8Includes municipal waste, landfill gas, and municipal sewage sludge. All municipal waste is included, although a portion of the municipal waste stream contains petroleum-derived plastics and other non-renewable sources.
- - = Not applicable. Note: Totals may not equal sum of components due to independent rounding. Data for 2016 are model results and may differ from official EIA data reports. Sources: 2016 capacity: U.S. Energy Information Administration (EIA), Form EIA-860, "Annual Electric Generator Report" (preliminary). 2016 generation: EIA,
Monthly Energy Review, September 2017. 2017: EIA, Short-Term Energy Outlook, October 2017 and EIA, AEO2018 National Energy Modeling System run ref2018.d121317a. Projections: EIA, AEO2018 National Energy Modeling System run ref2018.d121317a.
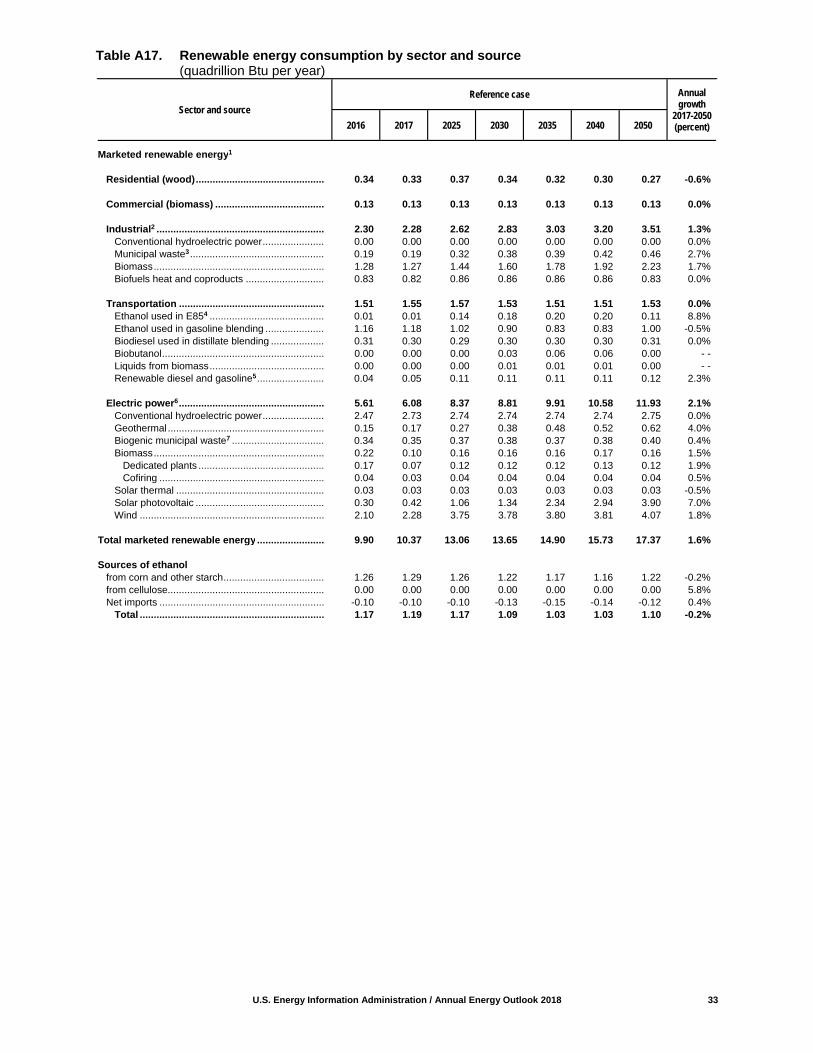
U.S. Energy Information Administration / Annual Energy Outlook 2018 33
Table A17. Renewable energy consumption by sector and source (quadrillion Btu per year)
Sector and source
Reference case
Annual growth
2017-2050 (percent)
2016
2017
2025
2030
2035
2040
2050
Marketed renewable energy1 Residential (wood) .............................................. 0.34 0.33 0.37 0.34 0.32 0.30 0.27 -0.6% Commercial (biomass) ....................................... 0.13 0.13 0.13 0.13 0.13 0.13 0.13 0.0% Industrial2 ............................................................ 2.30 2.28 2.62 2.83 3.03 3.20 3.51 1.3% Conventional hydroelectric power ...................... 0.00 0.00 0.00 0.00 0.00 0.00 0.00 0.0% Municipal waste3 ................................................ 0.19 0.19 0.32 0.38 0.39 0.42 0.46 2.7% Biomass ............................................................. 1.28 1.27 1.44 1.60 1.78 1.92 2.23 1.7% Biofuels heat and coproducts ............................ 0.83 0.82 0.86 0.86 0.86 0.86 0.83 0.0% Transportation .................................................... 1.51 1.55 1.57 1.53 1.51 1.51 1.53 0.0% Ethanol used in E854 ......................................... 0.01 0.01 0.14 0.18 0.20 0.20 0.11 8.8% Ethanol used in gasoline blending ..................... 1.16 1.18 1.02 0.90 0.83 0.83 1.00 -0.5% Biodiesel used in distillate blending ................... 0.31 0.30 0.29 0.30 0.30 0.30 0.31 0.0% Biobutanol .......................................................... 0.00 0.00 0.00 0.03 0.06 0.06 0.00 - - Liquids from biomass ......................................... 0.00 0.00 0.00 0.01 0.01 0.01 0.00 - - Renewable diesel and gasoline5 ........................ 0.04 0.05 0.11 0.11 0.11 0.11 0.12 2.3% Electric power6 .................................................... 5.61 6.08 8.37 8.81 9.91 10.58 11.93 2.1% Conventional hydroelectric power ...................... 2.47 2.73 2.74 2.74 2.74 2.74 2.75 0.0% Geothermal ........................................................ 0.15 0.17 0.27 0.38 0.48 0.52 0.62 4.0% Biogenic municipal waste7 ................................. 0.34 0.35 0.37 0.38 0.37 0.38 0.40 0.4% Biomass ............................................................. 0.22 0.10 0.16 0.16 0.16 0.17 0.16 1.5% Dedicated plants ............................................. 0.17 0.07 0.12 0.12 0.12 0.13 0.12 1.9% Cofiring ........................................................... 0.04 0.03 0.04 0.04 0.04 0.04 0.04 0.5% Solar thermal ..................................................... 0.03 0.03 0.03 0.03 0.03 0.03 0.03 -0.5% Solar photovoltaic .............................................. 0.30 0.42 1.06 1.34 2.34 2.94 3.90 7.0% Wind .................................................................. 2.10 2.28 3.75 3.78 3.80 3.81 4.07 1.8% Total marketed renewable energy ........................ 9.90 10.37 13.06 13.65 14.90 15.73 17.37 1.6% Sources of ethanol from corn and other starch .................................... 1.26 1.29 1.26 1.22 1.17 1.16 1.22 -0.2% from cellulose........................................................ 0.00 0.00 0.00 0.00 0.00 0.00 0.00 5.8% Net imports ........................................................... -0.10 -0.10 -0.10 -0.13 -0.15 -0.14 -0.12 0.4% Total .................................................................. 1.17 1.19 1.17 1.09 1.03 1.03 1.10 -0.2%

U.S. Energy Information Administration / Annual Energy Outlook 2018 34
Table A17. Renewable energy consumption by sector and source (continued) (quadrillion Btu per year)
Sector and source
Reference case
Annual growth
2017-2050 (percent)
2016
2017
2025
2030
2035
2040
2050
Nonmarketed renewable energy8 Selected consumption Residential .......................................................... 0.15 0.18 0.46 0.70 1.02 1.42 2.62 8.4% Solar hot water heating ...................................... 0.01 0.01 0.01 0.01 0.01 0.01 0.01 0.9% Geothermal heat pumps .................................... 0.01 0.01 0.02 0.02 0.02 0.03 0.04 3.7% Solar photovoltaic .............................................. 0.10 0.13 0.40 0.64 0.95 1.35 2.54 9.3% Wind .................................................................. 0.03 0.03 0.03 0.03 0.03 0.03 0.04 0.8% Commercial ........................................................ 0.16 0.18 0.30 0.36 0.44 0.54 0.77 4.4% Solar thermal ..................................................... 0.07 0.07 0.07 0.07 0.08 0.08 0.08 0.3% Solar photovoltaic .............................................. 0.09 0.11 0.22 0.28 0.36 0.46 0.67 5.7% Wind .................................................................. 0.01 0.01 0.01 0.01 0.01 0.01 0.02 3.4%
1Includes nonelectric renewable energy groups for which the energy source is bought and sold in the marketplace, although all transactions may not necessarily
be marketed, and marketed renewable energy inputs for electricity entering the marketplace on the electric power grid. Excludes electricity imports; see Table A2. Actual heat rates used to determine fuel consumption for all renewable fuels except hydroelectric, geothermal, solar, and wind. Consumption at hydroelectric, geothermal, solar, and wind facilities is determined by using the average electric power sector fossil-fuels net heat rate.
2Includes combined heat and power plants that have a non-regulatory status, and small on-site generating systems. 3Includes municipal waste, landfill gas, and municipal sewage sludge. All municipal waste is included, although a portion of the municipal waste stream contains
petroleum-derived plastics and other non-renewable sources. 4Excludes motor gasoline component of E85. E85 refers to a blend of 85 percent ethanol (renewable) and 15 percent motor gasoline (nonrenewable). To address
cold starting issues, the percentage of ethanol varies seasonally. The annual average ethanol content of 74 percent is used for these projections. 5Renewable feedstocks for the on-site production of diesel and gasoline. 6Includes consumption of energy by electricity-only and combined heat and power plants that have a regulatory status. 7Includes biogenic municipal waste, landfill gas, and municipal sewage sludge. Incremental growth is assumed to be for landfill gas facilities. Only biogenic
municipal waste is included. The U.S. Energy Information Administration estimates that in 2017 approximately 0.3 quadrillion Btus were consumed from a municipal waste stream containing petroleum-derived plastics and other non-renewable sources. See U.S. Energy Information Administration, Methodology for Allocating Municipal Solid Waste to Biogenic and Non-Biogenic Energy (Washington, DC, May 2007).
8Includes selected renewable energy consumption data for which the energy is not bought or sold, either directly or indirectly as an input to marketed energy. The U.S. Energy Information Administration does not estimate or project total consumption of nonmarketed renewable energy.
- - = Not applicable. Btu = British thermal unit. Note: Totals may not equal sum of components due to independent rounding. Data for 2016 are model results and may differ from official EIA data reports. Sources: 2016 ethanol: U.S. Energy Information Administration (EIA), Monthly Energy Review, September 2017. 2016 electric power sector: EIA, Form EIA-
860, "Annual Electric Generator Report” (preliminary). Other 2016 values: EIA, Office of Energy Analysis. 2017: EIA, Short-Term Energy Outlook, October 2017 and EIA, AEO2018 National Energy Modeling System run ref2018.d121317a. Projections: EIA, AEO2018 National Energy Modeling System run ref2018.d121317a.

U.S. Energy Information Administration / Annual Energy Outlook 2018 35
Table A18. Energy-related carbon dioxide emissions by sector and source (million metric tons, unless otherwise noted)
Sector and source
Reference case
Annual growth
2017-2050 (percent)
2016
2017
2025
2030
2035
2040
2050
Residential Petroleum ............................................................. 67 66 55 51 47 44 39 -1.6% Natural gas ........................................................... 241 241 252 251 250 249 250 0.1% Electricity1 ............................................................. 690 657 604 608 596 597 600 -0.3% Total residential ............................................... 998 964 911 910 893 889 889 -0.2% Commercial Petroleum ............................................................. 61 65 62 62 61 61 62 -0.1% Natural gas ........................................................... 171 173 177 182 189 197 217 0.7% Coal ...................................................................... 2 2 4 4 4 4 4 2.2% Electricity1 ............................................................. 667 646 608 611 599 602 627 -0.1% Total commercial ............................................. 901 886 851 858 853 863 910 0.1% Industrial2 Petroleum ............................................................. 339 371 392 400 408 417 425 0.4% Natural gas3 .......................................................... 487 495 590 612 631 656 690 1.0% Coal ...................................................................... 111 113 114 115 116 117 116 0.1% Electricity1 ............................................................. 459 452 478 492 484 488 485 0.2% Total industrial ................................................. 1,395 1,430 1,574 1,618 1,640 1,678 1,716 0.6% Transportation Petroleum4 ............................................................ 1,835 1,827 1,678 1,586 1,542 1,539 1,623 -0.4% Natural gas5 .......................................................... 39 38 48 52 57 62 76 2.1% Electricity1 ............................................................. 5 5 17 28 39 48 65 7.8% Total transportation ......................................... 1,879 1,871 1,744 1,667 1,638 1,650 1,764 -0.2% Electric power6 Petroleum ............................................................. 21 15 10 9 8 8 7 -2.4% Natural gas ........................................................... 546 495 539 558 565 586 628 0.7% Coal ...................................................................... 1,241 1,239 1,146 1,160 1,132 1,129 1,130 -0.3% Other7 ................................................................... 11 12 12 12 12 12 13 0.3% Total electric power ......................................... 1,821 1,760 1,707 1,739 1,718 1,735 1,777 0.0% Total by fuel Petroleum4 ............................................................ 2,323 2,344 2,198 2,107 2,067 2,069 2,156 -0.3% Natural gas ........................................................... 1,485 1,442 1,605 1,656 1,693 1,750 1,860 0.8% Coal ...................................................................... 1,354 1,353 1,264 1,279 1,252 1,249 1,250 -0.2% Other7 ................................................................... 11 12 12 12 12 12 13 0.3% Total .................................................................. 5,174 5,151 5,079 5,053 5,024 5,080 5,279 0.1% Carbon dioxide emissions (metric tons per person) ...................................... 16.0 15.8 14.7 14.1 13.6 13.4 13.3 -0.5%
1Emissions from the electric power sector are distributed to the end-use sectors. 2Includes combined heat and power plants that have a non-regulatory status, and small on-site generating systems. 3Includes lease and plant fuel. 4This includes carbon dioxide from international bunker fuels, both civilian and military, which are excluded from the accounting of carbon dioxide emissions under
the United Nations convention. From 1990 through 2014, international bunker fuels accounted for 90 to 126 million metric tons annually. 5Includes pipeline and distribution fuel natural gas and natural gas used as fuel in motor vehicles, trains, and ships. 6Includes electricity-only and combined heat and power plants that have a regulatory status. 7Includes emissions from geothermal power and nonbiogenic emissions from municipal waste. Note: By convention, the direct emissions from biogenic energy sources are excluded from energy-related carbon dioxide emissions. The release of carbon from
these sources is assumed to be balanced by the uptake of carbon when the feedstock is grown, resulting in zero net emissions over some period of time. If, however, increased use of biomass energy results in a decline in terrestrial carbon stocks, a net positive release of carbon may occur. See Table A19, "Energy-Related Carbon Dioxide Emissions by End Use", for the emissions from biogenic energy sources as an indication of the potential net release of carbon dioxide in the absence of offsetting sequestration. Totals may not equal sum of components due to independent rounding. Data for 2016 are model results and may differ from official EIA data reports.
Sources: 2016 emissions and emission factors: U.S. Energy Information Administration (EIA), Monthly Energy Review, September 2017. 2017: EIA, Short-Term Energy Outlook, October 2017 and EIA, AEO2018 National Energy Modeling System run ref2018.d121317a. Projections: EIA, AEO2018 National Energy Modeling System run ref2018.d121317a.

U.S. Energy Information Administration / Annual Energy Outlook 2018 36
Table A19. Energy-related carbon dioxide emissions by end use (million metric tons)
Sector and end use
Reference case
Annual growth
2017-2050 (percent)
2016
2017
2025
2030
2035
2040
2050
Residential Space heating ....................................................... 235 241 240 232 224 217 205 -0.5% Space cooling ....................................................... 127 102 103 107 108 111 116 0.4% Water heating ....................................................... 137 136 132 132 129 127 132 -0.1% Refrigeration ......................................................... 50 48 40 40 40 41 43 -0.3% Cooking ................................................................ 28 28 28 29 29 30 32 0.3% Clothes dryers....................................................... 30 29 26 26 26 27 29 -0.1% Freezers ............................................................... 11 10 8 8 7 7 7 -1.0% Lighting ................................................................. 65 62 47 45 39 36 30 -2.2% Clothes washers1 .................................................. 4 4 2 2 2 2 2 -1.7% Dishwashers1 ........................................................ 14 13 13 14 14 15 16 0.6% Televisions and related equipment2 ...................... 41 39 32 32 34 37 39 0.0% Computers and related equipment3 ...................... 15 15 10 9 7 6 4 -4.0% Furnace fans and boiler circulation pumps ........... 15 15 14 13 12 11 11 -1.0% Other uses4 ........................................................... 217 222 215 220 219 222 224 0.0% Discrepancy5 ......................................................... 10 0 0 0 0 0 0 -1.2% Total residential ............................................... 998 964 911 910 893 889 889 -0.2% Commercial Space heating6 ..................................................... 118 117 114 111 108 106 102 -0.4% Space cooling6 ...................................................... 82 70 65 64 62 61 62 -0.3% Water heating6 ...................................................... 35 35 34 35 36 36 37 0.2% Ventilation ............................................................. 74 72 63 57 51 47 43 -1.6% Cooking ................................................................ 29 29 29 29 30 31 33 0.4% Lighting ................................................................. 72 69 55 52 46 42 34 -2.1% Refrigeration ......................................................... 92 91 83 84 82 82 84 -0.2% Computing ............................................................ 51 48 40 40 40 41 38 -0.7% Office equipment ................................................... 48 50 67 75 79 84 99 2.1% Other uses7 ........................................................... 301 304 301 312 320 334 379 0.7% Total commercial ............................................. 901 886 851 858 853 863 910 0.1% Industrial8 Manufacturing Refining ............................................................. 260 252 245 238 246 250 252 0.0% Food products .................................................... 86 83 91 97 102 108 121 1.2% Paper products .................................................. 58 58 57 54 51 52 52 -0.3% Bulk chemicals ................................................... 281 295 379 400 405 412 408 1.0% Glass ................................................................. 10 10 10 11 11 11 10 0.2% Cement and lime ................................................ 32 32 36 32 28 29 31 -0.2% Iron and steel ..................................................... 103 109 102 107 111 112 108 0.0% Aluminum ........................................................... 18 18 20 21 22 22 22 0.6% Fabricated metal products ................................. 29 29 30 32 33 35 40 1.0% Machinery .......................................................... 14 14 17 18 18 18 18 0.8% Computers and electronics ................................ 15 15 15 16 16 16 17 0.4% Transportation equipment .................................. 32 32 30 33 35 36 38 0.5% Electrical equipment .......................................... 8 8 9 10 10 11 12 1.2% Wood products ................................................... 13 12 13 14 14 15 16 0.7% Plastics .............................................................. 28 27 29 31 32 33 36 0.8% Balance of manufacturing .................................. 113 111 110 110 110 110 112 0.0% Total manufacturing ........................................ 1,101 1,106 1,193 1,225 1,244 1,273 1,294 0.5% Nonmanufacturing Agriculture ......................................................... 81 81 80 83 84 85 88 0.3% Construction....................................................... 71 68 74 77 79 82 89 0.8% Mining ................................................................ 100 97 107 107 105 105 107 0.3% Total nonmanufacturing .................................. 252 246 261 267 268 273 285 0.4% Discrepancy5 ......................................................... 43 78 121 126 128 132 138 1.7% Total industrial ................................................. 1,395 1,430 1,574 1,618 1,640 1,678 1,716 0.6%

U.S. Energy Information Administration / Annual Energy Outlook 2018 37
Table A19. Energy-related carbon dioxide emissions by end use (continued) (million metric tons)
Sector and end use
Reference case
Annual growth
2017-2050 (percent)
2016
2017
2025
2030
2035
2040
2050
Transportation Light-duty vehicles ................................................ 1,031 1,013 847 761 715 697 719 -1.0% Commercial light trucks9 ....................................... 59 61 53 52 52 53 59 -0.1% Bus transportation ................................................. 16 16 16 16 16 16 16 0.1% Freight trucks ........................................................ 377 384 377 365 359 367 401 0.1% Rail, passenger ..................................................... 5 5 5 5 6 6 6 0.6% Rail, freight ........................................................... 34 35 34 33 32 31 30 -0.4% Shipping, domestic ............................................... 6 6 5 4 4 3 3 -2.4% Shipping, international .......................................... 78 78 77 76 74 72 71 -0.3% Recreational boats ................................................ 16 16 16 16 16 16 16 -0.1% Air ......................................................................... 168 169 196 214 232 249 285 1.6% Military use ........................................................... 39 39 39 40 43 46 53 0.9% Lubricants ............................................................. 5 5 5 5 5 5 5 0.2% Pipeline and distribution fuel ................................. 37 34 37 37 38 38 40 0.5% Discrepancy5 ......................................................... 8 10 35 41 47 51 59 5.4% Total transportation ......................................... 1,879 1,871 1,744 1,667 1,638 1,650 1,764 -0.2% Biogenic energy combustion10 Biomass ................................................................ 186 172 197 209 224 237 262 1.3% Electric power sector ......................................... 20 9 15 15 15 16 15 1.5% Other sectors ..................................................... 165 163 182 194 209 221 246 1.3% Biogenic waste...................................................... 31 31 33 34 34 35 36 0.4% Biofuels heat and coproducts ............................... 78 77 80 81 81 80 77 0.0% Ethanol ................................................................. 80 81 80 74 70 70 76 -0.2% Biodiesel ............................................................... 22 22 21 22 22 22 22 0.0% Liquids from biomass ............................................ 0 0 0 0 0 0 0 - - Renewable diesel and gasoline ............................ 3 4 8 8 8 8 8 2.3% Total .................................................................. 399 388 421 429 439 453 482 0.7%
1Does not include water heating portion of load. 2Includes televisions, set-top boxes, home theater systems, DVD players, and video game consoles. 3Includes desktop and laptop computers, monitors, and networking equipment. 4Includes small electric devices, heating elements, outdoor grills, natural gas-fueled lights, pool heaters, spa heaters, backup electricity generators, and motors
not listed above. Electric vehicles are included in the transportation sector. 5Represents differences between total emissions by end-use and total emissions by fuel as reported in Table A18. Emissions by fuel may reflect benchmarking
and other modeling adjustments to energy use and the associated emissions that are not assigned to specific end uses. 6Includes emissions related to fuel consumption for district services. 7Includes emissions related to (but not limited to) miscellaneous uses such as transformers, medical imaging and other medical equipment, elevators, escalators,
off-road electric vehicles, laboratory fume hoods, laundry equipment, coffee brewers, water services, emergency generators, combined heat and power in commercial buildings, manufacturing performed in commercial buildings, and cooking (distillate), plus residual fuel oil, propane, coal, motor gasoline, kerosene, and marketed renewable fuels (biomass).
8Includes combined heat and power plants that have a non-regulatory status, and small on-site generating systems. 9Commercial trucks 8,501 to 10,000 pounds gross vehicle weight rating. 10By convention, the direct emissions from biogenic energy sources are excluded from energy-related carbon dioxide emissions. The release of carbon from
these sources is assumed to be balanced by the uptake of carbon when the feedstock is grown, resulting in zero net emissions over some period of time. If, however, increased use of biomass energy results in a decline in terrestrial carbon stocks, a net positive release of carbon may occur. Accordingly, the emissions from biogenic energy sources are reported here as an indication of the potential net release of carbon dioxide in the absence of offsetting sequestration.
- - = Not applicable. Note: Totals may not equal sum of components due to independent rounding. Data for 2016 are model results and may differ from official EIA data reports. Sources: 2016 emissions and emission factors: U.S. Energy Information Administration (EIA), Monthly Energy Review, September 2017. 2017: EIA, Short-
Term Energy Outlook, October 2017 and EIA, AEO2018 National Energy Modeling System run ref2018.d121317a. Projections: EIA, AEO2018 National Energy Modeling System run ref2018.d121317a.

U.S. Energy Information Administration / Annual Energy Outlook 2018 38
Table A20. Macroeconomic indicators (billion 2009 chain-weighted dollars, unless otherwise noted)
Indicators
Reference case
Annual growth
2017-2050 (percent)
2016
2017
2025
2030
2035
2040
2050
Real gross domestic product ................................ 16,716 17,075 20,221 22,421 24,802 27,356 33,205 2.0%Components of real gross domestic product Real consumption .................................................. 11,572 11,877 14,364 16,126 17,940 19,871 24,338 2.2% Real investment ..................................................... 2,210 2,306 2,981 3,425 3,913 4,487 5,905 2.9% Real government spending .................................... 2,900 2,905 3,016 3,176 3,370 3,573 4,004 1.0% Real exports .......................................................... 2,120 2,200 2,920 3,532 4,224 5,019 6,819 3.5% Real imports .......................................................... 2,706 2,810 3,830 4,656 5,550 6,552 8,990 3.6% Energy intensity (thousand Btu per 2009 dollar of GDP) Delivered energy .................................................... 4.28 4.22 3.71 3.35 3.06 2.84 2.47 -1.6% Total energy ........................................................... 5.80 5.67 4.95 4.49 4.10 3.80 3.28 -1.6% Price indices GDP chain-type price index (2009=1.00) ............... 1.11 1.13 1.37 1.53 1.71 1.91 2.44 2.3% Consumer price index (1982-4=1.00) All-urban ............................................................. 2.40 2.45 3.02 3.43 3.89 4.43 5.79 2.6% Energy commodities and services ...................... 1.90 1.99 2.90 3.32 3.79 4.35 5.64 3.2% Wholesale price index (1982=1.00) All commodities ................................................... 1.85 1.93 2.33 2.54 2.74 2.97 3.50 1.8% Fuel and power ................................................... 1.46 1.59 2.33 2.67 3.04 3.50 4.61 3.3% Metals and metal products .................................. 1.94 2.07 2.30 2.38 2.43 2.47 2.53 0.6% Industrial commodities excluding energy ............ 1.93 1.99 2.28 2.46 2.61 2.78 3.14 1.4% Interest rates (percent, nominal) Federal funds rate .................................................. 0.40 1.03 3.00 3.00 3.00 3.00 3.00 - - 10-year treasury note ............................................. 1.84 2.40 4.03 4.01 4.03 4.07 4.07 - - AA utility bond rate ................................................. 3.73 3.92 6.07 5.97 5.95 5.97 5.91 - - Value of shipments (billion 2009 dollars) Non-industrial and service sectors ......................... 21,674 22,698 27,021 30,402 34,118 38,086 46,102 2.2% Total industrial ....................................................... 7,335 7,575 8,777 9,540 10,320 11,171 12,908 1.6% Agriculture, mining, and construction .................. 2,046 2,031 2,450 2,603 2,744 2,905 3,265 1.4% Manufacturing ..................................................... 5,289 5,544 6,327 6,936 7,576 8,266 9,643 1.7% Energy-intensive .............................................. 1,903 1,971 2,244 2,377 2,506 2,654 2,939 1.2% Non-energy-intensive ....................................... 3,386 3,573 4,082 4,560 5,070 5,612 6,704 1.9%Total shipments ...................................................... 29,008 30,272 35,798 39,942 44,439 49,257 59,010 2.0% Population and employment (millions) Population, with armed forces overseas ................ 324 326 347 359 370 379 398 0.6% Population, aged 16 and over ................................ 258 261 280 291 301 310 327 0.7% Population, aged 65 and over ................................ 49 51 66 74 79 82 88 1.7% Employment, nonfarm ............................................ 144 146 156 161 166 172 182 0.7% Employment, manufacturing .................................. 12.0 12.5 14.1 14.6 14.7 14.8 14.8 0.5% Key labor indicators Labor force (millions) ............................................. 159 160 170 176 181 187 198 0.6% Nonfarm labor productivity (2009=1.00)................. 1.07 1.08 1.22 1.32 1.43 1.55 1.81 1.6% Unemployment rate (percent) ................................ 4.85 4.40 4.58 4.70 4.66 4.73 4.68 - - Key indicators for energy demand Real disposable personal income .......................... 12,609 12,826 15,706 17,698 19,747 21,822 26,328 2.2% Housing starts (millions) ........................................ 1.26 1.31 1.61 1.62 1.67 1.65 1.75 0.9% Commercial floorspace (billion square feet) ........... 90 91 99 104 110 115 126 1.0% Unit sales of light-duty vehicles (millions) .............. 17.5 17.1 16.9 17.4 17.5 18.0 19.5 0.4%
GDP = Gross domestic product. Btu = British thermal unit. - - = Not applicable. Sources: 2016 and 2017: IHS Markit, Macroeconomic and Employment models, August 2017; and IHS Markit, Industry model, May 2017. Projections: U.S.
Energy Information Administration, AEO2018 National Energy Modeling System run ref2018.d121317a.

U.S. Energy Information Administration / Annual Energy Outlook 2018 39
Table A21. International petroleum and other liquids supply, disposition, and prices (million barrels per day, unless otherwise noted)
Supply, disposition, and prices
Reference case
Annual growth
2017-2050 (percent)
2016
2017
2025
2030
2035
2040
2050
Crude oil spot prices (2017 dollars per barrel) Brent ..................................................................... 45 52 86 93 100 106 114 2.4% West Texas Intermediate ...................................... 44 50 82 89 95 101 110 2.4% (nominal dollars per barrel) Brent ..................................................................... 44 52 104 125 150 179 244 4.8% West Texas Intermediate ...................................... 43 50 100 120 143 171 235 4.8% Petroleum and other liquids consumption1 OECD United States (50 states) ................................... 19.64 19.89 19.67 19.23 19.07 19.24 20.05 0.0% United States territories ..................................... 0.26 0.26 0.28 0.29 0.31 0.33 0.38 1.1% Canada .............................................................. 2.43 2.41 2.28 2.24 2.23 2.24 2.31 -0.1% Mexico and Chile ............................................... 2.30 2.26 2.28 2.34 2.44 2.56 2.76 0.6% OECD Europe2 .................................................. 14.33 14.41 13.29 13.10 13.01 12.94 12.64 -0.4% Japan ................................................................. 3.99 3.89 3.50 3.39 3.29 3.18 3.00 -0.8% South Korea ....................................................... 2.57 2.63 2.56 2.63 2.72 2.81 2.97 0.4% Australia and New Zealand ................................ 1.29 1.29 1.38 1.44 1.50 1.59 1.83 1.1% Total OECD consumption ............................ 46.81 47.04 45.24 44.68 44.56 44.89 45.94 -0.1% Non-OECD Russia ................................................................ 3.68 3.73 3.58 3.50 3.48 3.43 3.22 -0.4% Other Europe and Eurasia3 ................................ 1.98 2.00 1.89 1.84 1.90 1.92 1.97 0.0% China ................................................................. 12.54 12.90 15.48 16.36 16.86 17.02 16.41 0.7% India ................................................................... 4.35 4.56 5.39 6.12 7.12 8.32 10.19 2.5% Other Asia4 ........................................................ 8.38 8.58 9.91 10.95 12.14 13.59 16.65 2.0% Middle East ........................................................ 8.33 8.60 8.98 8.73 9.21 9.82 10.97 0.7% Africa ................................................................. 4.23 4.37 4.36 4.67 5.13 5.76 7.37 1.6% Brazil .................................................................. 3.04 2.99 3.30 3.46 3.59 3.78 4.13 1.0% Other Central and South America ...................... 3.51 3.54 3.75 3.86 4.05 4.30 4.90 1.0% Total non-OECD consumption ..................... 50.05 51.27 56.63 59.50 63.48 67.93 75.82 1.2% Total consumption ................................................. 96.86 98.32 101.87 104.17 108.03 112.82 121.76 0.7% Petroleum and other liquids production OPEC5 Middle East ..................................................... 29.86 29.89 31.12 31.85 33.42 35.26 38.36 0.8% North Africa ..................................................... 2.12 2.49 2.17 2.49 2.89 3.36 4.16 1.6% West Africa ..................................................... 4.21 4.18 4.41 4.54 4.67 4.78 5.62 0.9% South America ................................................ 3.01 2.75 2.23 2.62 3.14 3.76 4.59 1.6% Total OPEC production ............................. 39.19 39.30 39.93 41.50 44.12 47.16 52.74 0.9% Non-OPEC OECD United States (50 states) ................................ 14.81 15.42 18.90 19.37 19.65 19.75 19.27 0.7% Canada ........................................................... 4.58 4.75 5.44 5.54 5.85 6.21 7.16 1.3% Mexico and Chile ............................................ 2.50 2.32 2.11 2.14 2.28 2.59 3.42 1.2% OECD Europe2 ............................................... 4.06 4.11 3.84 3.62 3.50 3.28 2.88 -1.1% Japan and South Korea .................................. 0.22 0.23 0.27 0.28 0.29 0.29 0.30 0.9% Australia and New Zealand ............................. 0.43 0.41 0.47 0.45 0.45 0.55 0.76 1.9% Total OECD production ............................. 26.60 27.24 31.03 31.41 32.02 32.66 33.78 0.7% Non-OECD Russia ............................................................. 11.24 11.19 10.49 10.41 10.52 10.92 11.29 0.0% Other Europe and Eurasia3 ............................. 3.14 3.30 3.41 3.56 3.63 3.57 3.35 0.0% China .............................................................. 4.45 4.42 5.03 5.24 5.37 5.56 5.94 0.9% Other Asia4 ..................................................... 3.94 3.86 3.47 3.26 3.24 3.26 3.43 -0.4% Middle East ..................................................... 1.14 1.09 0.84 0.74 0.72 0.71 0.73 -1.2% Africa .............................................................. 1.76 1.82 1.72 1.66 1.64 1.65 1.74 -0.1% Brazil ............................................................... 3.18 3.36 4.04 4.51 4.85 5.16 5.91 1.7% Other Central and South America ................... 2.04 1.99 1.92 1.87 1.92 2.17 2.86 1.1% Total non-OECD production ..................... 30.89 31.02 30.91 31.27 31.90 33.00 35.24 0.4% Total petroleum and other liquids production .... 96.69 97.56 101.87 104.17 108.03 112.82 121.76 0.7%OPEC market share (percent) ................................. 40.5 40.3 39.2 39.8 40.8 41.8 43.3 - -
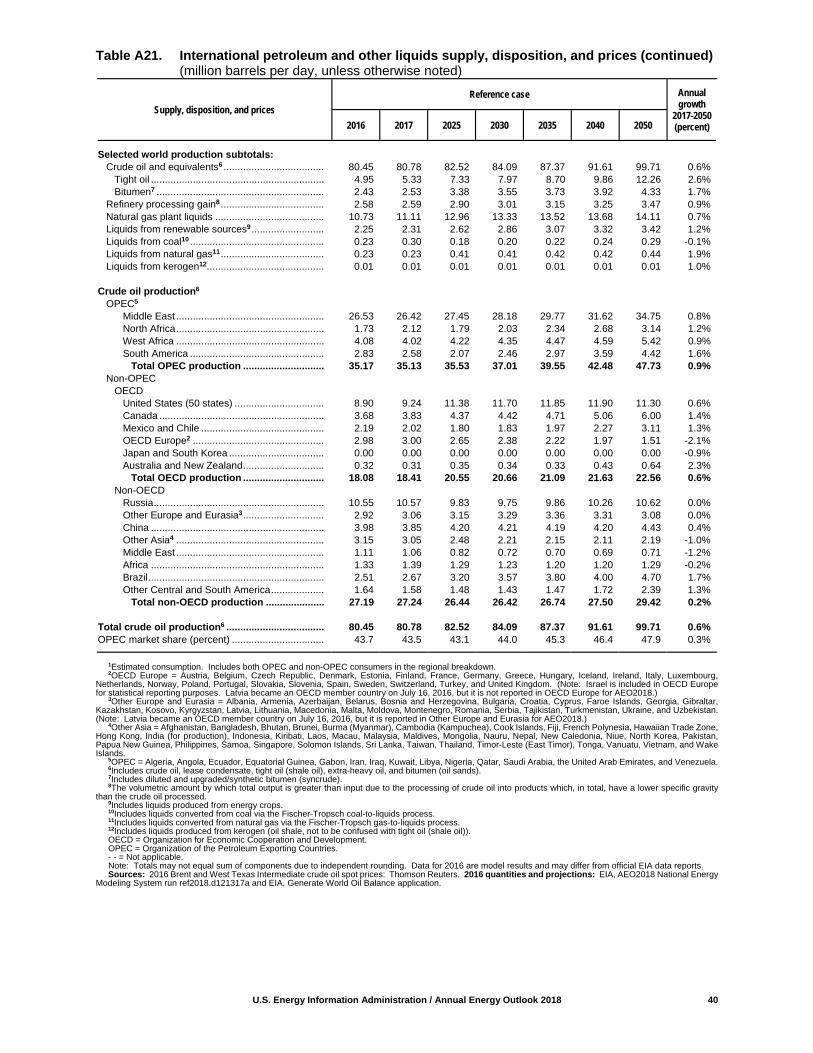
U.S. Energy Information Administration / Annual Energy Outlook 2018 40
Table A21. International petroleum and other liquids supply, disposition, and prices (continued) (million barrels per day, unless otherwise noted)
Supply, disposition, and prices
Reference case
Annual growth
2017-2050 (percent)
2016
2017
2025
2030
2035
2040
2050
Selected world production subtotals: Crude oil and equivalents6 .................................... 80.45 80.78 82.52 84.09 87.37 91.61 99.71 0.6% Tight oil .............................................................. 4.95 5.33 7.33 7.97 8.70 9.86 12.26 2.6% Bitumen7 ............................................................ 2.43 2.53 3.38 3.55 3.73 3.92 4.33 1.7% Refinery processing gain8 ..................................... 2.58 2.59 2.90 3.01 3.15 3.25 3.47 0.9% Natural gas plant liquids ....................................... 10.73 11.11 12.96 13.33 13.52 13.68 14.11 0.7% Liquids from renewable sources9 .......................... 2.25 2.31 2.62 2.86 3.07 3.32 3.42 1.2% Liquids from coal10 ................................................ 0.23 0.30 0.18 0.20 0.22 0.24 0.29 -0.1% Liquids from natural gas11 ..................................... 0.23 0.23 0.41 0.41 0.42 0.42 0.44 1.9% Liquids from kerogen12 .......................................... 0.01 0.01 0.01 0.01 0.01 0.01 0.01 1.0% Crude oil production6 OPEC5 Middle East ..................................................... 26.53 26.42 27.45 28.18 29.77 31.62 34.75 0.8% North Africa ..................................................... 1.73 2.12 1.79 2.03 2.34 2.68 3.14 1.2% West Africa ..................................................... 4.08 4.02 4.22 4.35 4.47 4.59 5.42 0.9% South America ................................................ 2.83 2.58 2.07 2.46 2.97 3.59 4.42 1.6% Total OPEC production ............................. 35.17 35.13 35.53 37.01 39.55 42.48 47.73 0.9% Non-OPEC OECD United States (50 states) ................................ 8.90 9.24 11.38 11.70 11.85 11.90 11.30 0.6% Canada ........................................................... 3.68 3.83 4.37 4.42 4.71 5.06 6.00 1.4% Mexico and Chile ............................................ 2.19 2.02 1.80 1.83 1.97 2.27 3.11 1.3% OECD Europe2 ............................................... 2.98 3.00 2.65 2.38 2.22 1.97 1.51 -2.1% Japan and South Korea .................................. 0.00 0.00 0.00 0.00 0.00 0.00 0.00 -0.9% Australia and New Zealand ............................. 0.32 0.31 0.35 0.34 0.33 0.43 0.64 2.3% Total OECD production ............................. 18.08 18.41 20.55 20.66 21.09 21.63 22.56 0.6% Non-OECD Russia ............................................................. 10.55 10.57 9.83 9.75 9.86 10.26 10.62 0.0% Other Europe and Eurasia3 ............................. 2.92 3.06 3.15 3.29 3.36 3.31 3.08 0.0% China .............................................................. 3.98 3.85 4.20 4.21 4.19 4.20 4.43 0.4% Other Asia4 ..................................................... 3.15 3.05 2.48 2.21 2.15 2.11 2.19 -1.0% Middle East ..................................................... 1.11 1.06 0.82 0.72 0.70 0.69 0.71 -1.2% Africa .............................................................. 1.33 1.39 1.29 1.23 1.20 1.20 1.29 -0.2% Brazil ............................................................... 2.51 2.67 3.20 3.57 3.80 4.00 4.70 1.7% Other Central and South America ................... 1.64 1.58 1.48 1.43 1.47 1.72 2.39 1.3% Total non-OECD production ..................... 27.19 27.24 26.44 26.42 26.74 27.50 29.42 0.2% Total crude oil production6 ................................... 80.45 80.78 82.52 84.09 87.37 91.61 99.71 0.6%OPEC market share (percent) ................................. 43.7 43.5 43.1 44.0 45.3 46.4 47.9 0.3%
1Estimated consumption. Includes both OPEC and non-OPEC consumers in the regional breakdown. 2OECD Europe = Austria, Belgium, Czech Republic, Denmark, Estonia, Finland, France, Germany, Greece, Hungary, Iceland, Ireland, Italy, Luxembourg,
Netherlands, Norway, Poland, Portugal, Slovakia, Slovenia, Spain, Sweden, Switzerland, Turkey, and United Kingdom. (Note: Israel is included in OECD Europe for statistical reporting purposes. Latvia became an OECD member country on July 16, 2016, but it is not reported in OECD Europe for AEO2018.)
3Other Europe and Eurasia = Albania, Armenia, Azerbaijan, Belarus, Bosnia and Herzegovina, Bulgaria, Croatia, Cyprus, Faroe Islands, Georgia, Gibraltar, Kazakhstan, Kosovo, Kyrgyzstan, Latvia, Lithuania, Macedonia, Malta, Moldova, Montenegro, Romania, Serbia, Tajikistan, Turkmenistan, Ukraine, and Uzbekistan. (Note: Latvia became an OECD member country on July 16, 2016, but it is reported in Other Europe and Eurasia for AEO2018.)
4Other Asia = Afghanistan, Bangladesh, Bhutan, Brunei, Burma (Myanmar), Cambodia (Kampuchea), Cook Islands, Fiji, French Polynesia, Hawaiian Trade Zone, Hong Kong, India (for production), Indonesia, Kiribati, Laos, Macau, Malaysia, Maldives, Mongolia, Nauru, Nepal, New Caledonia, Niue, North Korea, Pakistan, Papua New Guinea, Philippines, Samoa, Singapore, Solomon Islands, Sri Lanka, Taiwan, Thailand, Timor-Leste (East Timor), Tonga, Vanuatu, Vietnam, and Wake Islands.
5OPEC = Algeria, Angola, Ecuador, Equatorial Guinea, Gabon, Iran, Iraq, Kuwait, Libya, Nigeria, Qatar, Saudi Arabia, the United Arab Emirates, and Venezuela. 6Includes crude oil, lease condensate, tight oil (shale oil), extra-heavy oil, and bitumen (oil sands). 7Includes diluted and upgraded/synthetic bitumen (syncrude). 8The volumetric amount by which total output is greater than input due to the processing of crude oil into products which, in total, have a lower specific gravity
than the crude oil processed. 9Includes liquids produced from energy crops. 10Includes liquids converted from coal via the Fischer-Tropsch coal-to-liquids process. 11Includes liquids converted from natural gas via the Fischer-Tropsch gas-to-liquids process. 12Includes liquids produced from kerogen (oil shale, not to be confused with tight oil (shale oil)). OECD = Organization for Economic Cooperation and Development. OPEC = Organization of the Petroleum Exporting Countries. - - = Not applicable. Note: Totals may not equal sum of components due to independent rounding. Data for 2016 are model results and may differ from official EIA data reports. Sources: 2016 Brent and West Texas Intermediate crude oil spot prices: Thomson Reuters. 2016 quantities and projections: EIA, AEO2018 National Energy
Modeling System run ref2018.d121317a and EIA, Generate World Oil Balance application.