
T2*-based fiber orientation mapping
10
T 2 *-based fiber orientation mapping ☆ Jongho Lee a,b, ⁎, Peter van Gelderen a , Li-Wei Kuo a , Hellmut Merkle a , Afonso C. Silva c , Jeff H. Duyn a a Advanced MRI Section, Laboratory of Functional and Molecular Imaging, National Institute of Neurological Disorders and Stroke, National Institutes of Health, Bethesda, Maryland, USA b Department of Radiology, University of Pennsylvania, Philadelphia, Pennsylvania, USA c Cerebral Microcirculation Unit, Laboratory of Functional and Molecular Imaging, National Institute of Neurological Disorders and Stroke, National Institutes of Health, Bethesda, Maryland, USA abstract article info Article history: Received 6 December 2010 Revised 6 April 2011 Accepted 14 April 2011 Available online 22 April 2011 Keywords: T 2 ⁎ relaxation R 2 ⁎ Fiber tracking Magnetic susceptibility anisotropy in white matter Susceptibility tensor imaging (STI) Diffusion tensor imaging (DTI) Recent MRI studies at high field have observed that, in certain white matter fiber bundles, the signal in T 2 ⁎ - weighted MRI (i.e. MRI sensitized to apparent transverse relaxivity) is dependent on fiber orientation θ relative to B 0 . In this study, the characteristics of this dependency are quantitatively investigated at 7 T using ex-vivo brain specimens, which allowed a large range of rotation angles to be measured. The data confirm the previously suggested variation of R 2 ⁎ (= 1/T 2 *) with θ and also indicate that this dependency takes the shape of a combination of sin2θ and sin4θ functions, with modulation amplitudes (=ΔR 2 ⁎ ) reaching 6.44 ± 0.15 Hz (or ΔT 2 ⁎ = 2.91 ± 0.33 ms) in the major fiber bundles of the corpus callosum. This particular dependency can be explained by a model of local, sub-voxel scale magnetic field changes resulting from magnetic susceptibility sources that are anisotropic. As an illustration of a potential use of the orientation dependence of R 2 ⁎ , the feasibility of generating fiber orientation maps from R 2 ⁎ data is investigated. Published by Elsevier Inc. Introduction Visualization of white matter structure and assessment of its integrity has important applications in the study of human brain. MRI techniques based on T 2 , magnetization transfer, and water diffusion contrasts are sensitive to various aspects of white matter integrity (Miller et al., 1988; Moseley et al., 1990; Dousset et al., 1992), allowing the identification of pathological processes such as edema formation, inflammation and demyelination that may alter the cellular composition and structure of white matter. Recently, work performed at high magnetic fields (≥7 T) has demonstrated that, even in a healthy brain, substantial R 2 ⁎ (=1/T 2 ⁎ ) variations exist that appear to highlight the major fiber bundles (Li et al., 2006). The effect has been partly attributed to the differences in myelin content and microstructure (Li et al., 2009b) and it is also plausible that the preferential axonal orientation in major fiber bundles may have influenced their R 2 ⁎ values. Indeed, a few studies have shown that R 2 ⁎ weighted images (Wiggins et al., 2008; Schäfer et al., 2009) and calculated R 2 ⁎ images (Cherubini et al., 2009; Bender and Klose, 2010; Denk et al., 2011) exhibit contrast that is dependent on the orientation of white matter fibers relative to the main magnetic field (B 0 ). However, full characterization of this orientation depen- dence has been hampered by the restricted range of head orientations available for in-vivo studies. To overcome this limitation, and to investigate the full range of fiber orientations, we performed R 2 ⁎ - weighted MRI on post-mortem human brain samples. A significant dependence on orientation was found, which could be accurately modeled by the effects of cylindrical susceptibility perturbers with a strength that varies with orientation. Using such a model, we then investigated the feasibility of estimating fiber orientation from the R 2 ⁎ data, and verified the results with Diffusion Tensor Imaging (DTI). Material and methods Orientation dependence of white matter R 2 ⁎ In the presence of microscopic susceptibility perturbers, the apparent transverse relaxation in gradient echo (GRE) techniques is accelerated. In the case of randomly distributed point perturbers, the decay of the GRE signal, S(t), is independent of B 0 orientation can be approximated by St ðÞ =M 0 ·exp −t = T 2 ð1Þ where M 0 (signal intensity at t = 0) is proportional to the spin density. The time constant T 2 ⁎ (or its reciprocal R 2 ⁎ ) represents contributions NeuroImage 57 (2011) 225–234 ☆ This research was supported (in part) by the Intramural Research Program of the NIH, NINDS. ⁎ Corresponding author at: 3 W Gates Building, 3400 Spruce St., Philadelphia, PA 19104, USA. Fax: +1 215 573 2113. E-mail addresses: [email protected], [email protected] (J. Lee). 1053-8119/$ – see front matter. Published by Elsevier Inc. doi:10.1016/j.neuroimage.2011.04.026 Contents lists available at ScienceDirect NeuroImage journal homepage: www.elsevier.com/locate/ynimg
-
Upload
jongho-lee -
Category
Documents
-
view
216 -
download
4
Transcript of T2*-based fiber orientation mapping

NeuroImage 57 (2011) 225–234
Contents lists available at ScienceDirect
NeuroImage
j ourna l homepage: www.e lsev ie r.com/ locate /yn img
T2*-based fiber orientation mapping☆
Jongho Lee a,b,⁎, Peter van Gelderen a, Li-Wei Kuo a, Hellmut Merkle a, Afonso C. Silva c, Jeff H. Duyn a
a Advanced MRI Section, Laboratory of Functional and Molecular Imaging, National Institute of Neurological Disorders and Stroke, National Institutes of Health, Bethesda, Maryland, USAb Department of Radiology, University of Pennsylvania, Philadelphia, Pennsylvania, USAc Cerebral Microcirculation Unit, Laboratory of Functional and Molecular Imaging, National Institute of Neurological Disorders and Stroke, National Institutes of Health,Bethesda, Maryland, USA
☆ This research was supported (in part) by the IntramNIH, NINDS.⁎ Corresponding author at: 3 W Gates Building, 340
19104, USA. Fax: +1 215 573 2113.E-mail addresses: [email protected], jonghoyi@up
1053-8119/$ – see front matter. Published by Elsevierdoi:10.1016/j.neuroimage.2011.04.026
a b s t r a c t
a r t i c l e i n f oArticle history:Received 6 December 2010Revised 6 April 2011Accepted 14 April 2011Available online 22 April 2011
Keywords:T2⁎ relaxationR2⁎
Fiber trackingMagnetic susceptibility anisotropy inwhite matterSusceptibility tensor imaging (STI)Diffusion tensor imaging (DTI)
Recent MRI studies at high field have observed that, in certain white matter fiber bundles, the signal in T2⁎-weighted MRI (i.e. MRI sensitized to apparent transverse relaxivity) is dependent on fiber orientation θrelative to B0. In this study, the characteristics of this dependency are quantitatively investigated at 7 T usingex-vivo brain specimens, which allowed a large range of rotation angles to be measured. The data confirm thepreviously suggested variation of R2
⁎ (=1/T2*) with θ and also indicate that this dependency takes the shapeof a combination of sin2θ and sin4θ functions, with modulation amplitudes (=ΔR2
⁎) reaching 6.44±0.15 Hz(or ΔT2⁎=2.91±0.33 ms) in the major fiber bundles of the corpus callosum. This particular dependency canbe explained by a model of local, sub-voxel scale magnetic field changes resulting from magneticsusceptibility sources that are anisotropic. As an illustration of a potential use of the orientation dependenceof R2
⁎, the feasibility of generating fiber orientation maps from R2⁎ data is investigated.
ural Research Program of the
0 Spruce St., Philadelphia, PA
enn.edu (J. Lee).
Inc.
Published by Elsevier Inc.
Introduction
Visualization of white matter structure and assessment of itsintegrity has important applications in the study of human brain. MRItechniques based on T2, magnetization transfer, and water diffusioncontrasts are sensitive to various aspects of white matter integrity(Miller et al., 1988; Moseley et al., 1990; Dousset et al., 1992),allowing the identification of pathological processes such as edemaformation, inflammation and demyelination that may alter thecellular composition and structure of white matter.
Recently, work performed at high magnetic fields (≥7 T) hasdemonstrated that, even in a healthy brain, substantial R2⁎ (=1/T2⁎)variations exist that appear to highlight the major fiber bundles (Li etal., 2006). The effect has been partly attributed to the differences inmyelin content and microstructure (Li et al., 2009b) and it is alsoplausible that the preferential axonal orientation in major fiberbundles may have influenced their R2⁎ values. Indeed, a few studieshave shown that R2⁎weighted images (Wiggins et al., 2008; Schäfer etal., 2009) and calculated R2⁎ images (Cherubini et al., 2009; Bender
and Klose, 2010; Denk et al., 2011) exhibit contrast that is dependenton the orientation of whitematter fibers relative to themainmagneticfield (B0). However, full characterization of this orientation depen-dence has been hampered by the restricted range of head orientationsavailable for in-vivo studies. To overcome this limitation, and toinvestigate the full range of fiber orientations, we performed R2⁎-weighted MRI on post-mortem human brain samples. A significantdependence on orientation was found, which could be accuratelymodeled by the effects of cylindrical susceptibility perturbers with astrength that varies with orientation. Using such a model, we theninvestigated the feasibility of estimating fiber orientation from the R2⁎
data, and verified the results with Diffusion Tensor Imaging (DTI).
Material and methods
Orientation dependence of white matter R2⁎
In the presence of microscopic susceptibility perturbers, theapparent transverse relaxation in gradient echo (GRE) techniques isaccelerated. In the case of randomly distributed point perturbers, thedecay of the GRE signal, S(t), is independent of B0 orientation can beapproximated by
S tð Þ = M0·exp −t= T�2� � ð1Þ
whereM0 (signal intensity at t=0) is proportional to the spin density.The time constant T2⁎ (or its reciprocal R2⁎) represents contributions

226 J. Lee et al. / NeuroImage 57 (2011) 225–234
from spin–spin relaxation (represented by T2) and additional signaldephasing due to local (andmostly static) field inhomogeneities (T2′):
1= T�2 = 1= T2 + 1 = T2′ or R�2 = R2 + R2′: ð2Þ
For finite perturbers, the quantitative value of R2′ is dependent onperturber strength, size and density.
In white matter fiber bundles, the distribution of perturbers maybe non-random and, furthermore, non-isotropic. In fact, compoundssuch as iron and lipids in ferritin and myelin may contributesignificantly to microscopic susceptibility variations (Ogg et al.,1999; Haacke et al., 2005; Li et al., 2006, 2009b; Fukunaga et al.,2010), and generally align with axons that may be highly ordered. Inwhite matter, this may lead to an ordered distribution of perturbers,and make the GRE signal decay orientation dependent. Under specificconditions, the signal decay remains close to exponential with anorientation dependence that can be analytically calculated (Yablons-kiy and Haacke, 1994). For example, for sufficiently long echo times,the signal decay in sets of parallel cylinders resembling the fiberbundle structures in white matter can be approximated as anexponential with a decay rate
R�2 =c0 + c1·χ·sin
2θ = c0 + 0:5·c1·χ· 1 + sin 2θ−π = 2ð Þð Þ ð3Þ
where c0 and c1 are constants, χ is magnetic susceptibility differencebetween the susceptibility perturbers and surroundingmedium, and θis the relative orientation between the structure and B0 field(Yablonskiy and Haacke, 1994; Yablonskiy et al., 1997; Bender andKlose, 2010).
In addition to this expected sin2θ dependency of R2⁎, anadditional angular dependent term may arise from the recentlyreported magnetic susceptibility anisotropy of white matter (Lee etal., 2010; Liu, 2010). When susceptibility anisotropy is included inthe model, the magnetic susceptibility itself has an angulardependency. If a cylindrical structure is assumed and two dimen-sional in-plane rotation is used, the susceptibility anisotropy (χaniso)can be expressed as follows (see Appendix) (Scholz et al., 1984;Hong, 1995):
χaniso = χ( + χ/−χ(
� �·sin2 θ + φð Þ ð4Þ
where χ( and χ/
are the volume susceptibility of the cylindricalstructure relative to mediumwhen it is parallel and perpendicular toB0 respectively, and φ is the potential phase offset between angular
Fig. 1. (a) Tissue sample and container. The sample was rotated on the x–z plane (physica(b) PVC shim sets were used to improve field homogeneity.
dependence introduced by the distribution of perturbers and thesusceptibility anisotropy that results from the perturbers' molecularstructure. Hence, the angular dependent R2⁎ term mentioned inEq. (3) becomes:
χ·sin2θ = χiso+χanisoð Þ·sin2θ= χiso+χ(+ χ/−χ(� �
·sin2 θ+φð Þh i
·sin2θ
ð5Þ
where the total susceptibility (χ) is divided into an isotropic (χiso)and an anisotropic (χaniso) portion. For certain tissue constituents,susceptibility perturber structure and the molecular structureunderlying the susceptibility anisotropy may be aligned in a parallelor perpendicular fashion. For example, the phospholipid molecule(and possibly other elongated molecules such as cholesterol) that isa major constituent of the axonal myelin sheath has its long axisoriented generally perpendicular to the axonal direction. For anyanisotropy resulting from such an arrangement, one would expect toobserve a 0 or π/2 phase offset between the two sinusoids in Eq. (5).In this case, Eq. (5) can be expanded to show a sin(4θ−π/2) term aswell as a sin(2θ−π/2) term and the resulting R2⁎ will show acombination of sin2θ and sin4θ dependencies.
Sample preparation
Two coronal formalin fixed (for approximately 1 year) humanbrain slabs, derived from an adult patient with no history ofneurological disease were used for the experiments. The thicknessof the slabs was approximately 10 mm. The slabs were cut into acylindrical shape (approximately 60 mmdiameter). A few days beforethe MRI scans, they were placed in a cylindrical shaped PVC container(62 mm diameter, 65 mm deep) filled with phosphate buffered saline(Shepherd et al., 2009). For the MRI experiments, the cylindrical axisof the sample container was placed perpendicular to the mainmagnetic field (anterior–posterior direction in supine position or y-axis) such that rotating the container resulted in a change in theorientation of some of the major fiber bundles (e.g. corpus callosum)relative to the B0 field (Fig. 1a). To reduce large scale field variations,the sample container was placed in a cavity centered within the shimmodule. The width of the cavity was marginally larger than thecontainer's diameter to facilitate accurate rotation of the samplecontainer about the cylindrical axis (Fig. 1b). The shim module(12×30×4 cm3) was made out of PVC that has a similar susceptibilityto water (van Gelderen et al., 2008). Additional shim pieces, eachcurved on one side, were stacked on the top of the shimmodule in twolayers to further improve field homogeneity.
l) such that the major fibers in corpus callosum changed the orientation relative to B0.

227J. Lee et al. / NeuroImage 57 (2011) 225–234
MRI data acquisition and analysis
R2⁎-weighted MRI data were obtained from a 7 T clinical scanner(General Electric, Milwaukee, WI). Gradient strength and slew ratewere 40 mT/m and 150 mT/m/ms respectively. A custom designedsingle channel 3-inch diameter surface coil with Nova preamplifiers(Nova Medical, Wilmington, MA) was used for signal reception and aNova Medical quadrature birdcage transmit coil was used for signalexcitation.
To demonstrate the orientation dependence of white matter R2⁎
values, the samples were scanned at 18 different orientations, eachrotated by 10° in the x–z physical plane and covering orientationsfrom 0° to 170°. After acquiring localizer scans and adjusting the B0shims, angular R2⁎ data were collected sequentially. For each angle, thetable was pulled out and the samples container was rotated by 10°,after which the table was put back to its original position. Note thatonly in-plane rotation was performed (rather than covering the entireangular space).
Data for the estimation of R2⁎ were acquired with a multi-echo 3DGRE sequence. The scan parameters were as follows: TR=700 ms,first echo time=4.636 ms, echo spacing=2.748 ms (for Sample 1) or2.956 ms (for Sample 2), number of echoes=12, flip angle=60°,acquisition bandwidth=±64 kHz, FOV=8×8×1.2 cm3, resolu-tion=0.625×0.625×0.75 mm3, and matrix =128×128×16. Thedata acquisition for each angle took 23.9 min and the total acquisitiontime was 7.2 h.
From the 3D GRE data, magnitude images were reconstructed, andR2⁎ values were estimated by weighted least-square fitting of themulti-echo time series using the magnitude images as a weightingfunction. The R2⁎ images for each angle were aligned to the initial scan(0° data) based on alignment parameters derived from the secondecho magnitude images. This was done because the second echoimages have high SNR and good contrast. Several steps wereperformed for the alignment: first, the signal variation due to thesensitivity of the surface coil was removed by dividing by a low-passfiltered image of the original image. After that, the sensitivitycorrected image was aligned with the initial scan. The alignmentwas refined using FLIRT in FSL (Jenkinson and Smith, 2001) applying2D rigid body transformations. Although this achieved precisealignment of much of the image, small misalignments remained incertain areas presumably due to the changes in field homogeneity andgradient nonlinearity. This issue was subsequently resolved byadditional nonlinear image registration (FNIRT, FSL) (Smith et al.,2004).
To estimate the orientation dependence of R2⁎ in white matter, tworegions of interest (ROI) were selected in the corpus callosum usingmultiple slices in each sample. The ROIs covered areas where theaxonal orientation was expected to be relatively uniform (Figs. 2a andd). For each angle, the ROI-averaged R2⁎ and its standard deviationwere calculated. For each ROI, the angular dependency of themean R2⁎
value was then fitted with the susceptibility anisotropy model asdescribed in Eq. (5) using:
R�2 θð Þ = c0 + c1·sin 2θ + φ0ð Þ + c2·sin 4θ + φ1ð Þ: ð6Þ
This model does not assume alignment between magneticsusceptibility perturber structure and magnetic susceptibility anisot-ropy structure. As a result, the phases of the two sinusoids areindependent.
For comparison, the data was also fitted without including theanisotropy term (isotropic model) using:
R�2 θð Þ = c0 + c1·sin 2θ + φ0ð Þ ð7Þ
Least-square fit results were used to compare the validity of thetwomodels. An adjusted R2 value that takes into account the numbers
of regressors used in each model, was calculated to check thegoodness of the fit. To estimate the statistical significance of theadditional regressors in the susceptibility anisotropy model, an F-testwas performed for the two models in the four ROIs (the two ROIs inthe two samples). The resulting F-values were averaged and a p-valuewas calculated from F-distribution.
After fitting the data to the two models, phase coherence wasobserved between the two sinusoids of the susceptibility anisotropymodel (see Fig. 3). Hence a new anisotropic model with phasecoherence was designed as following:
R�2 θð Þ = c0 + c1·sin 2θ + φ0ð Þ + c2·sin 4θ + 2φ0–π =2ð Þ: ð8Þ
This model was fitted to the average R2⁎ values in each ROI, afterwhich the adjusted R2 value was calculated and an F-test (with thismodel and the isotropic susceptibility model) was performed.
In order to investigate the feasibility to calculate fiber orientationmaps using the angular dependence of R2⁎, the parameters c0, c1 and c2were calculated by averaging the parameters from the two ROIs ineach tissue and setting φ0 to -π/2 to have a peak R2⁎ at a 90° angle. Theresulting R2⁎ values from Eq. (8) were inverted to T2⁎ values and thisresulted in angular dependent T2⁎ curves for each of the two tissuesamples. These curves were normalized to have a peak-to-peak valueof 1. Subsequently, the curve from Sample 1 was used in generatingthe orientation map of Sample 2 and vice versa. Note that theinversion from R2⁎ to T2⁎ was only performed to facilitate thecomparison with DTI data (see Results).
To generate a T2⁎-based fiber orientation map, the normalized T2⁎
curve was cross-correlated on a voxel-by-voxel basis with a 4D T2⁎
data set (3D space+18 aligned orientations). First, the peakcorrelation coefficient in each voxel was calculated to generate acorrelation coefficient map. The angle at which peak correlationoccurred provided a “T2⁎ angle”map. Then the size of T2⁎ variation (i.e.ΔT2⁎) at this angle was estimated by a linear regression to generate aΔT2⁎ map. After that, the T2⁎ angle map was color coded similarly towhat is a common practice in DTI: in each voxel, an orientation anglewas decomposed into x and z contributions and graded red and bluecolors were assigned proportionally to the magnitudes of the x and zcomponents, respectively. Finally, the resulting color map wasmultiplied by the ΔT2⁎ map to highlight the strongest angulardependencies. This map was referred to as a T2* orientation map. Amask based on T2⁎ values (10 msbT2⁎b30 ms) was used to select whitematter regions.
For comparison, fiber orientation data were also obtained with DTIusing a 7 T animal MRI system (30 cm bore size, Bruker BioSpin,Ettlingen, Germany). The scanner was equipped with a 15-cmgradient set (Resonance Research, Billerica, MA) capable of delivering450 mT/m gradients within 130 μs rise time. A four-element customdesigned phased array coil (28 mm diameter each) was used forsignal reception.
For the DTI scan, the sample was positioned using a three-planelocalizer and ROI-based B0 shimming (MAPSHIM, Bruker BioSpin)wasperformed. After that, DTI data were acquired using a spin-echosequence (line-by-line)with the following parameters: TR=1000 ms,TE=57.43 ms, flip angle=70°, acquisition bandwidth=±10 kHz,FOV=8×8×1.2 cm3, resolution=0.625×0.625×0.75 mm3, and ma-trix =128×128×16. The number of diffusion gradient directions was20, and the diffusion b-value was 3000 s/mm2. The selection ofdirections was based on a downhill simplex method (Skare et al.,2000). The baseline images without diffusion gradient were acquiredthree times. The total scan duration was 13.1 h.
The DTI data were processed using DTIFIT in FSL (Smith et al.,2004) and eigenvectors, eigenvalues, and fractional anisotropy (FA)maps were generated. To visualize white matter fiber orientation,each pixel was color-coded as red–green–blue (corresponding to x–y–z orientation respectively) based on the direction of its primary

Fig. 2. The locations of ROIs in each sample (a and d) and the plots of R2⁎ values over the angles in each ROI (b, and c for Sample 1; e and f for Sample 2). The fitted lines (dashed red for
the isotropic susceptibility model; dotted blue for the anisotropic susceptibility model) clearly show that the isotropic model has poor fit whereas the anisotropic model tightlyfollows the measurement. The R2
⁎ values are the highest when the fiber orientation is perpendicular to B0 field whereas the value becomes low when it is parallel to B0 field.
228 J. Lee et al. / NeuroImage 57 (2011) 225–234

Fig. 3. Fitted results of the anisotropic susceptibility model from Eq. (6) in Sample 1.The sinusoidal functions show coherence in their phases; the positive peaks of sin4θcomponents coincide with the peaks of sin2θ.
Fig. 4. The orientation dependent R2⁎ curves from the phase coherence model from
Eq. (8). The curves from each sample show great similarity.
229J. Lee et al. / NeuroImage 57 (2011) 225–234
eigenvector, and intensity coded based on its FA value. To allowcomparison with the T2⁎ orientation map, a modified DTI map wasgenerated. This was done by reducing the 3D tensor to 2D byexcluding any y component in each voxel. From this 2D tensor, a 2DFA value was calculated. Then, the 2D FA value was multiplied by aprimary eigenvector of the x and z directions. This created a 2D DTIfiber orientation map.
Results
The orientation dependent R2⁎ variation is shown in Fig. 2. The R2⁎
curves clearly demonstrate orientation dependence, with maximum
Table 1Model parameters for the susceptibility anisotropy model.
R�2 θð Þ = c0 + c1·sin 2θ + φ0ð Þ + c2·sin 4θ + φ1ð Þ
c1∙sin(2θ+φ0) c2∙sin(4θ+φ1) c0(Hz)
c1 (Hz) φ0 (°) Peaka (°) c2 (Hz) φ1 (°) Peakb (°)
Sample 1 ROI1 −3.090 143.5 63.3 1.084 216.8 58.3; 148.3 46.9ROI2 −2.977 28.5 120.8 1.356 −40.0 32.5;122.5 45.8
Sample 2 ROI1 −2.927 145.8 62.1 1.283 191.1 64.7; 154.7 52.8ROI2 −3.218 25.5 122.2 1.231 −8.7 24.7;114.7 52.4
a Peak is an angle (θ ∈ [0° 180°]) that sin(2θ+φ0) becomes 1.b Peak is an angle (θ ∈ [0° 180°]) that sin(4θ+φ1) becomes 1. A bolded number is
the angle when both sin(2θ+φ0) and sin(4θ+φ1) become close to the positive peaks.
R2⁎ values foundwhen fibers are oriented perpendicular to the B0 field.Significantly lower R2* values were found for parallel orientations. Themean ΔR2⁎ from the four ROIs was 6.44±0.15 Hz. In T2⁎, the mean ΔT2⁎
was 2.91±0.33 ms. The fitted curves for the isotropic model (dashedred lines) deviate significantly from the measurements. On the otherhand, the anisotropic model (dotted blue lines) tightly matches themeasurements, indicating the existence of a sin4θ component in theR2⁎ angular dependency. The adjusted R2 value for the isotropic modelwas 0.804±0.029. The value increased to 0.954±0.010 for theanisotropic model (or 0.947±0.019 for the phase coherence model),indicating significant improvement in fitting when a sin4θ componentfrom susceptibility anisotropy is included in the model. The p-valuefrom the F-test was 2.4×10⁻⁵ (or 7.2×10⁻⁶ for the phase coherencemodel) confirming the statistically significance of the additionalregressors in the susceptibility anisotropy model.
Results of the anisotropic model fit are listed in Table 1. When thephases of sin2θ and sin4θ terms are compared, the positive peak ofsin2θ coincides with the positive peak of sin4θ. This phase coherenceis clearly observed in Fig. 3. This result, in addition to the high R2 valuementioned above, suggests that the susceptibility perturber structureand susceptibility anisotropy structure are aligned in white matter.
Fig. 4 shows the orientation dependent R2⁎ curves for the phasecoherencemodel. The shapesof the curves fromthe two samples exhibitgreat similarity. The parameter values of this model are listed in Table 2.
In Fig. 5, T2⁎ angle maps (5a and 5e), correlation coefficient maps(5b and 5f), ΔT2⁎ maps (5c and 5 g), and T2⁎ orientation maps (5 d and5 h) are shown for the central four slices in each sample. The angleand orientation map reveal the expected fiber orientation. Forexample, the corpus callosum shows fiber orientation roughlymatching the macroscopic orientation, which is primarily in theleft–right direction. Also, the areas of cortico-pontine tract (CPT) and
Table 2Model parameters for the susceptibility anisotropy model with phase coherence.
R�2 θð Þ = c0 + c1·sin 2θ + φ0ð Þ + c2·sin 4θ + 2φ0–π= 2ð Þ
c1 (Hz) c2 (Hz) φ0 (°) c0 (Hz)
Sample 1 ROI1 −3.085 1.054 146.7 46.9ROI2 −2.976 1.353 26.9 45.8
Sample 2 ROI1 −2.925 1.276 143.5 52.8ROI2 −3.204 1.160 30.9 52.4

Fig. 5. T2⁎ angle maps (a and e), correlation coefficient maps (b and f),ΔT2⁎maps (c and g), and T2⁎ orientationmaps (d and h). The T2⁎ angle map and orientationmaps demonstrate theorientations of fiber bundles. In T2⁎ angle map, dark blue and dark red represent approximately the same orientation therefore the color change from blue to red suggests smoothorientation variation. The ΔT2⁎ maps as well as the correlation coefficient maps show similarity to FA maps shown in the DTI results (Fig. 6).
230 J. Lee et al. / NeuroImage 57 (2011) 225–234
superior thalamic radiation (STR) show an up–down orientation.These orientation results can be further confirmed by the DTI resultsshown in Figs. 6 and 7. The correlation coefficientmaps (Figs. 5b and f)illustrate high correlation values in the areas of large FA values in DTI
results (Figs. 6a and c). The ΔT2⁎maps (Figs. 5c and g) also show largeΔT2⁎ in the areas of large FA values, suggesting that the ΔT2⁎maps maycontain similar information as FA maps (see Fig. 7 for a comparisonbetween the ΔT2⁎ maps and the 2D FA maps.)
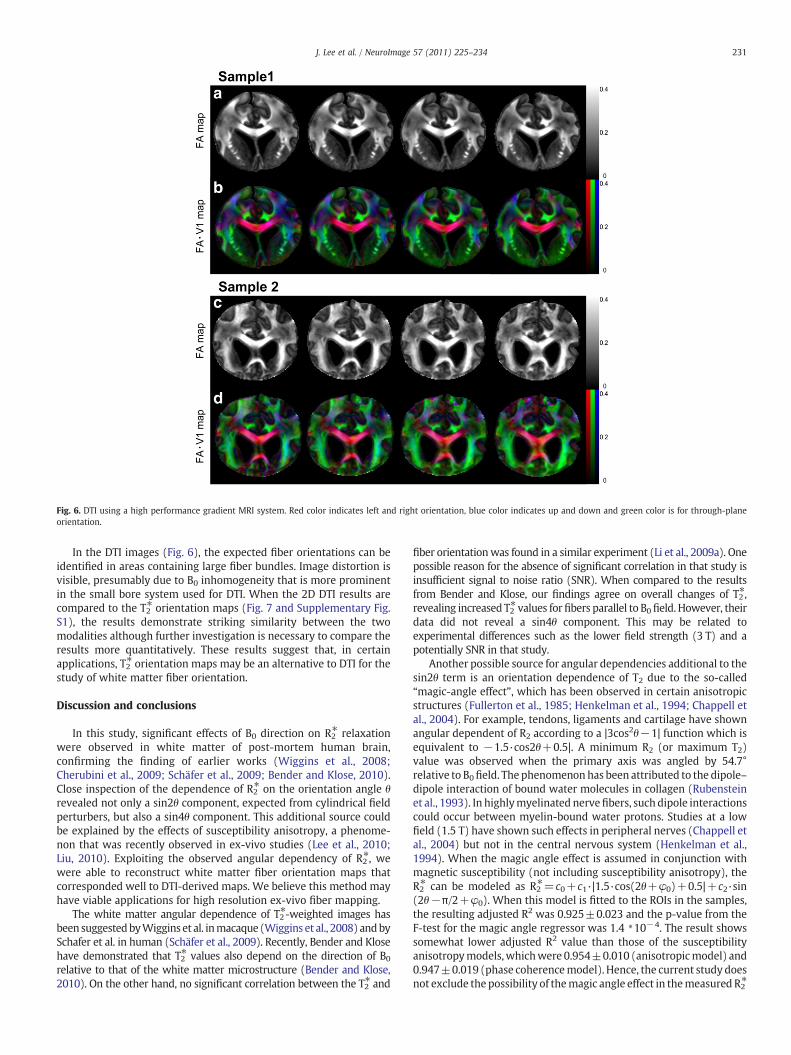
Fig. 6. DTI using a high performance gradient MRI system. Red color indicates left and right orientation, blue color indicates up and down and green color is for through-planeorientation.
231J. Lee et al. / NeuroImage 57 (2011) 225–234
In the DTI images (Fig. 6), the expected fiber orientations can beidentified in areas containing large fiber bundles. Image distortion isvisible, presumably due to B0 inhomogeneity that is more prominentin the small bore system used for DTI. When the 2D DTI results arecompared to the T2⁎ orientation maps (Fig. 7 and Supplementary Fig.S1), the results demonstrate striking similarity between the twomodalities although further investigation is necessary to compare theresults more quantitatively. These results suggest that, in certainapplications, T2⁎ orientation maps may be an alternative to DTI for thestudy of white matter fiber orientation.
Discussion and conclusions
In this study, significant effects of B0 direction on R2⁎ relaxationwere observed in white matter of post-mortem human brain,confirming the finding of earlier works (Wiggins et al., 2008;Cherubini et al., 2009; Schäfer et al., 2009; Bender and Klose, 2010).Close inspection of the dependence of R2⁎ on the orientation angle θrevealed not only a sin2θ component, expected from cylindrical fieldperturbers, but also a sin4θ component. This additional source couldbe explained by the effects of susceptibility anisotropy, a phenome-non that was recently observed in ex-vivo studies (Lee et al., 2010;Liu, 2010). Exploiting the observed angular dependency of R2⁎, wewere able to reconstruct white matter fiber orientation maps thatcorresponded well to DTI-derived maps. We believe this method mayhave viable applications for high resolution ex-vivo fiber mapping.
The white matter angular dependence of T2⁎-weighted images hasbeen suggestedbyWiggins et al. inmacaque (Wiggins et al., 2008) andbySchafer et al. in human (Schäfer et al., 2009). Recently, Bender and Klosehave demonstrated that T2⁎ values also depend on the direction of B0relative to that of the white matter microstructure (Bender and Klose,2010). On the other hand, no significant correlation between the T2⁎ and
fiber orientationwas found in a similar experiment (Li et al., 2009a). Onepossible reason for the absence of significant correlation in that study isinsufficient signal to noise ratio (SNR). When compared to the resultsfrom Bender and Klose, our findings agree on overall changes of T2⁎,revealing increased T2⁎ values forfibers parallel to B0field. However, theirdata did not reveal a sin4θ component. This may be related toexperimental differences such as the lower field strength (3 T) and apotentially SNR in that study.
Another possible source for angular dependencies additional to thesin2θ term is an orientation dependence of T2 due to the so-called“magic-angle effect”, which has been observed in certain anisotropicstructures (Fullerton et al., 1985; Henkelman et al., 1994; Chappell etal., 2004). For example, tendons, ligaments and cartilage have shownangular dependent of R2 according to a |3cos2θ−1| function which isequivalent to −1.5·cos2θ+0.5|. A minimum R2 (or maximum T2)value was observed when the primary axis was angled by 54.7°relative to B0field. The phenomenonhas been attributed to the dipole–dipole interaction of bound water molecules in collagen (Rubensteinet al., 1993). In highlymyelinated nervefibers, such dipole interactionscould occur between myelin-bound water protons. Studies at a lowfield (1.5 T) have shown such effects in peripheral nerves (Chappell etal., 2004) but not in the central nervous system (Henkelman et al.,1994). When the magic angle effect is assumed in conjunction withmagnetic susceptibility (not including susceptibility anisotropy), theR2⁎ can be modeled as R2⁎=c0+c1·|1.5·cos(2θ+φ0)+0.5|+c2·sin(2θ−π/2+φ0). When this model is fitted to the ROIs in the samples,the resulting adjusted R2 was 0.925±0.023 and the p-value from theF-test for the magic angle regressor was 1.4 *10−4. The result showssomewhat lower adjusted R2 value than those of the susceptibilityanisotropymodels,whichwere 0.954±0.010 (anisotropicmodel) and0.947±0.019 (phase coherencemodel). Hence, the current study doesnot exclude the possibility of themagic angle effect in themeasured R2⁎

Fig. 7. Comparison between T2⁎ and DTI orientation maps. The T2⁎ orientation maps are the same as in Figs. 5d and h and the ΔT2⁎ are the same as in Figs. 5c and g. The DTI images arethe 2D DTI results multiplying 2D FA maps with 2D primary eigenvector maps.
232 J. Lee et al. / NeuroImage 57 (2011) 225–234
orientation. Magnetic susceptibility anisotropy and the magic angleeffect may coexist in white matter, and further investigation possiblyincluding measurements of T2 effects on fiber orientation and theirfield dependence is necessary to confirm this.
The constituents of magnetic susceptibility may include myelin, ironand deoxyhemoglobin. The effects of myelin and iron on R2⁎ have been
suggested in several studies (Ogg et al., 1999; Haacke et al., 2005; Li et al.,2006, 2009b; Fukunaga et al., 2010). The results from an iron extractionexperiment demonstrated the effects of iron on R2⁎ in gray matter(Fukunaga et al., 2010). For susceptibility anisotropy, however, myelin islikely to be the primary origin because of the highly ordered andanisotropic molecular structure of its phospholipid bilayer, which has

233J. Lee et al. / NeuroImage 57 (2011) 225–234
been shown to exhibit susceptibility anisotropy in-vitro (Boroske andHelfrich, 1978; Scholz et al., 1984; Speyer et al., 1987). On the contrary,iron (either in ionic form or inside clusters such as ferritin), is notexpected to show susceptibility anisotropy due to its spherical shape andsparse distribution (Connor et al., 1990; Connor and Menzies, 1996).Deoxyhemoglobin, which has been extensively studied for its effects onR2⁎ in gray matter in fMRI, may have contributed little to the observedanisotropy due to its low concentration in WM (Weber et al., 2008).
When thephase coherent anisotropicmodel in Eq. (8) is reorganizedusing trigonometry (φ0 was set to π/2 to have the maximum R2⁎ at π/2)and compared to Eq. (5), the ratio of c2/c1 becomes (χ/−χ()/4(χiso+χ() when φ=π/2. If we define Δχaniso=χ(−χ/ and χiso′=χiso+χ(then Δχaniso/χiso′=−4c2/c1. From Table 2, c1=−3.048±0.124 andc2=1.211±0.131, and therefore, Δχaniso/χiso′=1.59. A direct compar-ison of this ratiowith the previousmeasurement (Lee et al., 2010) is notpossible as the information ofχiso (andχiso′) relative to the susceptibilityof the surrounding medium was not measured. The large fractionalsusceptibility anisotropy apparent in our data may be interpreted asfollows: the isotropic susceptibility estimated from the orientationdependence of R2⁎ may be lower than the individual contribution ofmyelin, as its (diamagnetic) effect may be partially canceled by that of(paramagnetic) ferritin. On the other hand, the anisotropic portion ofsusceptibility is likely to originate frommyelin only as discussed earlier.Hence there is no cancelation for Δχaniso, and thus the estimated ratiomay appear larger than expected due to reduced χiso. Another way χisomay have been underestimated is through susceptibility anisotropy inthe absence of perturber distribution effects (e.g. when myelin is notperfectly aligned along infinite parallel cylinders). Such a mechanismwould generate a sin2θ dependency opposite to that resulting fromperturber distribution effects alone, and lead to anunderestimationof c1and thus χiso. An indication that the actual perturber distributiondeviated from the cylindrical model comes from comparison oforientation dependence R2′ with the overall R2′. For example, at 3 T, R2⁎
of in-vivo white matter is 22.4 (24.0) Hz and R2 is 13.5 (11.9) Hz for thefrontal (occipital) area (Wansapura et al., 1999). The resulting R2′ fromEq. (2) is 8.9 (12.1) Hz. These values are substantially higher than theorientation dependent R2′ component (0 to 2.68 Hz) found at 3 T(Bender and Klose, 2010). Similarly, at 7 T, R2⁎=31.6 Hz (Li et al., 2006)and R2=21.3 Hz (Cox and Gowland, 2010), which leaves R2′=10.3 Hz.This is substantially higher than theorientationdependence of R2′ foundin the current study (−2.2 to 4.3 Hz) although some of this effect maybe explained by changes in relaxivity associated with the fixationprocess (Shepherd et al., 2009).
One limitation of the current study is that the angular resolutionfor the R2⁎ angle map was limited to 10°. This resulted from the factthat the map was generated from the angle of highest correlation.Although this was adequate to demonstrate and characterize theorientation dependence, improved angular resolution may beobtained by least-square fitting of the phase. This will be particularlyimportant when only a small number of orientations are available. Inaddition, the current study was limited by the fact that only in-planerotation was performed, allowing the resolution of two orthogonaldirections of fiber orientation. The expansion to full rotation space isstraightforward using rotation in two different orientations. Thiswould require a new container design as well as a new receiver coildesign.
Recently, Liu has demonstrated the susceptibility tensor imaging(STI) based on susceptibility anisotropy in white matter (Liu, 2010).The method may share some of the same origins as the T2⁎ orientationmap. However, the STI results are based on image phase (Duyn et al.,2007) whereas T2⁎ orientation is based on image magnitude. Furtherresearch is necessary to compare the advantages and disadvantages ofthe two methods.
One of the primary challenges of applying the currentmethod to invivo conditions is limited space and flexibility to orient a head insideof a scanner. Therefore, the method presented here is better suited for
ex-vivo high resolution imaging of tissue samples. It has been knownthat fixation substantially reduces T2 and T2⁎ values and waterdiffusivity (Sun et al., 2003; Shepherd et al., 2009). This creates aunique challenge for ex-vivo high resolution DTI because diffusiongradients in a DTI sequence generally take several tens of millisecondsin a typical human scanner. Therefore, unless the size of sample issmall enough to be scanned in an animal scanner where a highperformance gradient system is available, acquiring an ex-vivo humanwhole brain DTI in a high resolution is challenging. Furthermore, theproblem becomes more challenging at high fields due to reduced T2and T2⁎. On the other hand, in T2⁎ orientation mapping, the reduced T2⁎
may be compensated by increased contrast. Hence, increasing fieldstrength may improve CNR more than linearly, benefitting fromstronger susceptibility effects as well as increased proton polarization.As a result, the method introduced in this study may be useful inmapping details of white matter fiber orientation at high resolutionthat could be used as a template for other studies.
Supplementarymaterials related to this article can be found onlineat doi:10.1016/j.neuroimage.2011.04.026.
Acknowledgment
We thank Dr. Kant M. Matsuda for sample preparation.
Appendix
In 3D space, susceptibility anisotropy can be represented as atensor: a 3×3 matrix in the form of [χ11 χ12 χ13; χ21 χ22 χ23; χ31 χ32χ33] (Liu, 2010). In this general case, Δχ can be written as χ11·sin2θ·cos2φ+ χ22·sin2θ·sin2φ+ χ33·cos2θ+ (χ12+ χ21)·sin2θ·sinφ·cosφ+(χ13+χ31)·sinθ·cosθ·cosφ+(χ23+χ32)·sinθ·cosθ·sinφ inspherical coordinates where φ is the angle from the x-axis in the x–y plane and θ is the angle from the z-axis. These angles point to thedirection of B0 field.
When a cylindrical structure whose axial orientation is along z-axis is assumedwith 2D rotation in x–z plane (i.e. φ=0), the equationcan be simplified to χ11·sin2θ+χ33·cos2θ where χ11 is the volumesusceptibility of the cylinder when it is perpendicular to B0 field (χ/)and χ33 is the volume susceptibility of the cylinder when it is parallelto B0 field (χ() (Hong, 1995). This equation can be reorganized toshow χ(+(χ/−χ()·sin
2θ as in Eq. (4).
References
Bender, B., Klose, U., 2010. The in vivo influence of white matter fiber orientationtowards B0 on T2* in the human brain. NMR Biomed. 23, 1071–1076.
Boroske, E., Helfrich, W., 1978. Magnetic anisotropy of egg lecithin membranes.Biophys. J. 24, 863–868.
Chappell, K.E., Robson, M.D., Stonebridge-Foster, A., Glover, A., Allsop, J.M., Williams, A.D., Herlihy, A.H., Moss, J., Gishen, P., Bydder, G.M., 2004. Magic angle effects in MRneurography. AJNR 25, 431–440.
Cherubini, A., Peran, P., Hagberg, G.E., Varsi, A.E., Luccichenti, G., Caltagirone, C.,Sabatini, U., Spalletta, G., 2009. Characterization of white matter fiber bundles withT2* relaxometry and diffusion tensor imaging. Magn. Reson. Med. 61, 1066–1072.
Connor, J.R., Menzies, S.L., 1996. Relationship of iron to oligondendrocytes andmyelination. Glia 17, 83–93.
Connor, J., Menzies, S., Martin, S.M.S., Mufson, E., 1990. Cellular distribution oftransferrin, ferritin, and iron in normal and aged human brains. J. Neurosci. Res. 27,595–611.
Cox, E.F., Gowland, P.A., 2010. Simultaneous quantification of T2 and T2′ using acombined gradient echo-spin echo sequence at ultrahigh field. Magn. Reson. Med.64, 1441–1446.
Denk, C., Torres, E.H., MacKay, A., Rauscher, A., 2011. The influence of white matter fibreorientation on MR signal phase and decay. NMR Biomed. 24, 246–252.
Dousset, V., Grossman, R.I., Ramer, K.N., Schnall, M.D., Young, L.H., Gonzalez-Scarano, F.,Lavi, E., Cohen, J.A., 1992. Experimental allergic encephalomyelitis and multiplesclerosis: lesion characterization with magnetization transfer imaging. Radiology182, 483–491.
Duyn, J.H., van Gelderen, P., Li, T.Q., de Zwart, J.A., Koretsky, A.P., Fukunaga, M., 2007.High-fieldMRI of brain cortical substructure based on signal phase. Proc. Natl. Acad.Sci. U. S. A. 104, 11796–11801.
Fukunaga, M., Li, T.Q., van Gelderen, P., de Zwart, J.A., Shmueli, K., Yao, B., Lee, J., Maric,D., Aronova, M.A., Zhang, G., 2010. Layer-specific variation of iron content in

234 J. Lee et al. / NeuroImage 57 (2011) 225–234
cerebral cortex as a source of MRI contrast. Proc. Natl. Acad. Sci. U. S. A. 107,3834–3839.
Fullerton, G.D., Cameron, I.L., Ord, V.A., 1985. Orientation of tendons in the magneticfield and its effect on T2 relaxation times. Radiology 155, 433–435.
Haacke, E.M., Cheng, N.Y.C., House, M.J., Liu, Q., Neelavalli, J., Ogg, R.J., Khan, A., Ayaz, M.,Kirsch, W., Obenaus, A., 2005. Imaging iron stores in the brain using magneticresonance imaging. Magn. Reson. Imaging 23, 1–25.
Henkelman, R.M., Stanisz, G.J., Kim, J.K., Bronskill, M.J., 1994. Anisotropy of NMRproperties of tissues. Magn. Reson. Med. 32, 592–601.
Hong, F.T., 1995. Magnetic field effects on biomolecules, cells, and living organisms.Biosystems 36, 187–229.
Jenkinson, M., Smith, S., 2001. A global optimisation method for robust affineregistration of brain images. Med. Image Anal. 5, 143–156.
Lee, J., Shmueli, K., Fukunaga, M., van Gelderen, P., Merkle, H., Silva, A.C., Duyn, J.H.,2010. Sensitivity of MRI resonance frequency to the orientation of brain tissuemicrostructure. Proc. Natl. Acad. Sci. U. S. A. 107, 5130–5135.
Li, T.Q., van Gelderen, P., Merkle, H., Talagala, L., Koretsky, A.P., Duyn, J., 2006. Extensiveheterogeneity in whitematter intensity in high-resolution T2*-weightedMRI of thehuman brain at 7.0 T. Neuroimage 32, 1032–1040.
Li, T.Q., Fukunaga, M., Dodd, S., van Gelderen, P., Merkle, H., Duyn, J.H., 2009a. Is R2* inhuman brain white matter dependent on B0 orientation? Proceedings of the 17thAnnual Meeting of ISMRM, Honolulu, Hawaii, p. 957.
Li, T.Q., Yao, B., van Gelderen, P., Merkle, H., Dodd, S.J., Talagala, L., Koretsky, A.P., Duyn, J.H., 2009b. Characterization of T2* heterogeneity in human brain white matter.Magn. Reson. Med. 62, 1652–1657.
Liu, C., 2010. Susceptibility tensor imaging. Magn. Reson. Med. 63, 1471–1477.Miller, D.H., Rudge, P., Johnson, G., Kendall, B.E., Macmanus, D.G., Moseley, I.F., Barnes,
D., Mcdonald, W.I., 1988. Serial gadolinium enhanced magnetic resonance imagingin multiple sclerosis. Brain 111, 927–939.
Moseley, M.E., Cohen, Y., Mintorovitch, J., Chileuitt, L., Shimizu, H., Kucharczyk, J.,Wendland, M.F., Weinstein, P.R., 1990. Early detection of regional cerebral ischemiain cats: comparison of diffusion- and T2 weighted MRI and spectroscopy. Magn.Reson. Med. 14, 330.
Ogg, R.J., Langston, J.W., Haacke, E.M., Steen, R.G., Taylor, J.S., 1999. The correlationbetween phase shifts in gradient-echo MR images and regional brain ironconcentration. Magn. Reson. Imaging 17, 1141–1148.
Rubenstein, J.D., Kim, J.K., Morova-Protzner, I., Stanchev, P.L., Henkelman, R.M., 1993.Effects of collagen orientation on MR imaging characteristics of bovine articularcartilage. Radiology 188, 219–226.
Schäfer, A., Wiggins, C.J., Turner, R., 2009. Understanding the orientation dependent T2*contrast of the cingulum in ultra high fields. Proceedings of the 17th AnnualMeeting of ISMRM, Honolulu, Hawaii, p. 955.
Scholz, F., Boroske, E., Helfrich, W., 1984. Magnetic anisotropy of lecithin membranes. Anew anisotropy susceptometer. Biophys. J. 45, 589–592.
Shepherd, T.M., Thelwall, P.E., Stanisz, G.J., Blackband, S.J., 2009. Aldehyde fixativesolutions alter the water relaxation and diffusion properties of nervous tissue.Magn. Reson. Med. 62, 26–34.
Skare, S., Hedehus, M., Moseley, M.E., Li, T.Q., 2000. Condition number as a measure ofnoise performance of diffusion tensor data acquisition schemes with MRI. J. Magn.Reson. 147, 340–352.
Smith, S.M., Jenkinson, M., Woolrich, M.W., Beckmann, C.F., Behrens, T.E., Johansen-Berg, H., Bannister, P.R., De Luca, M., Drobnjak, I., Flitney, D.E., 2004. Advances infunctional and structural MR image analysis and implementation as FSL. Neuro-image 23, S208–S219.
Speyer, J.B., Sripada, P.K., Das Gupta, S.K., Shipley, G.G., Griffin, R.G., 1987. Magneticorientation of sphingomyelin-lecithin bilayers. Biophys. J. 51, 687–691.
Sun, S.W., Neil, J.J., Song, S.K., 2003. Relative indices of water diffusion anisotropy areequivalent in live and formalin-fixed mouse brains. Magn. Reson. Med. 50, 743–748.
van Gelderen, P., Merkle, H., de Zwart, J.A., Duyn, J.H., 2008. Passive shimming for acylindrical brain-sample container. ISMRM Workshop: High Field Systems andApplications, Rome, Italy, p. 47.
Wansapura, J.P., Holland, S.K., Dunn, R.S., Ball Jr., W.S., 1999. NMR relaxation times inthe human brain at 3.0 Tesla. J. Magn. Reson. Imaging 9, 531–538.
Weber, B., Keller, A.L., Reichold, J., Logothetis, N.K., 2008. The microvascular system of thestriate and extrastriate visual cortex of the macaque. Cereb. Cortex 18, 2318–2330.
Wiggins, C.J., Gudmundsdottir, V., Le Bihan, D., Lebon, V., Chaumeil, M., 2008.Orientation dependence of white matter T2* contrast at 7 T: a direct demonstra-tion. Proceedings of the 16th Annual Meeting of ISMRM, Toronto, Canada, p. 237.
Yablonskiy, D.A., Haacke, E.M., 1994. Theory of NMR signal behavior in magneticallyinhomogeneous tissues: the static dephasing regime.Magn. Reson.Med. 32, 749–763.
Yablonskiy, Reinus, Stark, Haacke, 1997. Quantitation of T2′ anisotropic effects onmagnetic resonance bone mineral density measurement. MRM 37 (2), 214–221.


