t Sikorsky Data/Analyses S- 6A - Defense Technical ... Noise Measurement U.S. Department...
192
0 Noise Measurement U.S. Department of Transportation °"•=•==•Flight Test: Federal Aviation AdministrationhtTe t Report No. FAA-EE-84-6 Data/Analyses September 1984 Sikorsky S- 6A Office of Environmental and Energy Helicopter Washington, D.C. 20591 C1.1 0-; public through the National J tvnNwa Technical Information Service Edward J. Rickely Springfield, Virginia 22161 Tyrone L. Bland 8 12 04 118
Transcript of t Sikorsky Data/Analyses S- 6A - Defense Technical ... Noise Measurement U.S. Department...

0 Noise MeasurementU.S. Department of Transportation°"•=•==•Flight Test:Federal Aviation AdministrationhtTe t
Report No. FAA-EE-84-6 Data/AnalysesSeptember 1984 Sikorsky S- 6A
Office of Environmental and Energy HelicopterWashington, D.C. 20591
C1.1
0-;
public through the National J tvnNwa
Technical Information Service Edward J. RickelySpringfield, Virginia 22161 Tyrone L. Bland
8 12 04 118
ABOUT THE COVER
The cover of this report (and other reports in this series) is comprisedof silhouettes of the seven helicopters tested during the summer of 1983at Dulles International Airport. The highlighted outline is that of theSikorsky S-76A, the subject of this report. The helicopters shown on thecover include (clockwise from the upper right) the Hughes 500-D, theAerospatiale TwinStar, the Sikorsky S-76A, the Boeing VertolBV-234/CH-47D, the Bell 222, the Aerospatiale Dauphin, and theAerospatiale AStar.
NOTICE
The United States Government does not endorse productsor manufacturers. Trade or manufacturers' names areused as necessary in documenting the subject test program.
*2
° .
Technical Report Documentation PageI. Report No. 2. Government Accession No. 3. Recipient's Catalog No
FAAEE-84-6 A N9 O4. Title and Subtitle 5. Report Date -
Noise Measurement Flight Test for Sikorsky S-76A )eptember 1984 -.Helicopter; Data and Analyses 6. Performing Organization Code
S..... _ _ _ _ __ ___ _ 8. Performing Organization Report No.7 Authorts) j. Steven Newman, Edward J. Rickley (1),
Tyrone L. Bland (2), Kristy R. Beattie (2) _
9. Performing Organization Name one Address 10 Work Unit No (TRAIS)
Federal Aviation Administration, Office of Environmentand Energy, Noise Abatement Division, Noise Technology 11. Contract or Grant No.
Branch, (AEE-120), 800 Independence Ave., SW _.
Washington, DC 20591 13. Type of Report and Period Covered
12. Sponsoring Agency Noame and Address
Federal Aviation Administration, Office of Environmentand Energy, Noise Abatement Division, Noise Technology _..
"Branch, (AEE-120), 800 Independence Ave., SW 14. Sponsoring Agency Code
Washington, DC 20591 .'.15. Supplementary Notes
(1) U.S. Department of Transportation Systems Center, Kendall Square, Cambridge,Mass. 02142
(2) ORI, Inc. 1375 Piccard Drive, Rockville, Maryland 20850 . -"16. Abstract
- This report documents the results of abk-tdeaI-Aviation-Administration-•lFAAý noisemeasurement flight test program with the Sikorsky S-76 Jielicopter. The-report-7.' ,vcontains documentary sections describing the acoustic&R!characteristics of thesubject helicopter and provides analyses and discussions addressing topics ranging L..from acousticl'ropagation to environmental impact 9f helicopter noise.
This report is the sixth in a series of seven documenting the FAA helicopter noisemeasurement program conducted at Dulles International Airport during the summerof 1983. The S-76 test program involved the acquistion of detailed acoustic&S, --position and meteorological data.
This test program was designed to address a series of objectives including:.(1) acquisition of acousticifdata for use in assesing heliport environmentlimpact,;1 2) documentation of directivity characteristics for static operation of helicopters;(3) establishment of ground-to-ground and air-to-ground acousticaiýpropagationrelationships for helicopters; ,4) determination of noise event duration influenceson energy dose acoustical metrics;(5) examination of the differences between noisemeasured by a surface-mounted microphone and a microphone mounted at a height offour feet -.-1.meters1.,^andf6) documentation of noise levels aquired usinginternational helicopter noise certification test procedures. ..
17. Key Words 18. Distribution Statementhelicopter, noise, Sikorsky, heliport, 1.is Statment
This document is available to -heenvironmental impact, directivity, public through the National Technicalnoise certification standards puli thoghte-.ioaTcniaInformation Service, Springfield, VA.
22161
19. Security Classif. (of this report) 20. Security Clossif. (of this page) 21. No. of Pages 22. Pri . ;.
Unclassified Unclassified 190 -
Form DOT F 1700.7 (8-72) Reproduction of completed page authorized
S
0
S
S
S
-S
0U
Cf
C--
C;)
Cl)
S
S
S
S"" " •'*1'. * -.... .- . • - '• .'"•' ' . °L . ." -. •-_ - . °. - .-.- , - -•t .,.- .• . .
Acknowledgments
The authors wish to thank the following individuals and organizations whocontributed to the success of the measurement program and/or theproduction of this report.
1. The FAA Rotorcraft Program Office, for providing the testhelicopter, the flight crew and the pilot.
2. The Dulles Air Traffic Control Tower - Mr. Art Harrison, Chief
3. The National Air and Space Administration (NASA), RotorcraftOffice, and Mr. John Ward for their support of data reductionactivities.
4. Ms. Sharon Daboin for her support in data acquisition and testadministration.
5. Ms. Maryalice Locke of ORI, Inc. for her support in reportproduction.
6. Ms. Loretta Harrison for her typing and report productionassistance.
ACCPSSion For
DTIC T -BUri~nnm-,ncedJust ifi crtio " • l-'-
ByDistribution/
Availability Codes
Avail and/orDist Special
A-1-4/ if
"L:'

[ TABLE OF CONTENTS
PAGE
LIST OF TABLES................................... iv
LIST OF FIGURES................................... vi
GLOSSARYo.o... .. s............................ viii
1.0 INTRODUCTION...........................so... ... s .*.... 1e
2.0 TEST HELICOPTER DESCRIPTION.......................... 5
3.0 TEST SYNOPSIS ................ o....... ... ****see ... eei.. 8
3.1 MEASUREMENT FACILITY............... ............ 103.2 MICROPHONE LOCATIONS........................ 123.3 FLIGHT PATH MARKERS AND GUIDANCE SYSTEM4S LOCATIONS.. 12
4.0 TEST PLANNING AND BACKGROUND ...... . ... ..... ... 15
4.1 ADVANCE BRIEFINGS AND COORDINATION.................. 154.2 TEST COMMUNICATIONS ................ ... .. .... see. 154.3 LOCAL MEDIA NOTIFICATION.................... 174.4 AMBIENT NOISE.............................. 17 s-
5.0 DATA ACQUISITION AND GUIDANCE SYSTEMS .................... 19
5.1 APPROACH GUIDANCE SYSTEM... .......... *... .so. 195.2 PHOTO ALTITUDE DETERMINATION SYSTEI4I................. 205.3 COCKPIT PHOTO DATA .... ....... .......... . oo....... 24-
5.4 UPPER AIR METEOROLOGICAL DATA/NWS: STERLING, VA ..... 255.5 SURFACE MIETEOROLOGICAL DATA/NWS: DULLES AIRPORT ..... 275.6 NOISE MEASUREMENT INSTRUMENTATION ................... 28
5.6.1 TSC IIAGN4ETIC RECORDING SYSTEM ................ 295.6.2 FAA DIRECT READ MEASUREM1ENT SYSTEM ........... 315.6.3 DEPLOYMENT OF ACOUSTICAL MEASUREMENT -
INSTRUMENTATION .....................o....... .33
6.0 NOISE DATA REDUCTION ...... .. *..*.. .s ..... s ......... o... . 37
6.1 TSC MAGNETIC RECORDING DATA REDUCTION ............... 376.1.1 AMBIENT NOISE.. ....... ............. o .... oo.o... 396.1.2 SPECTRAL SHAPING ......... ......... *.s ...... 396.1.3 ANALYSIS SYSTEM TIME CONSTANT ................ 396.1.4 BANDSH.ARING........................... 406.1.5 TONE CORRECTIONS........................ 406.1.6 OTHER METRICS. ......... .. ............ 406.1.7 SPECTRAL DATIA/STATIC TESTS ................... 41
PAGE
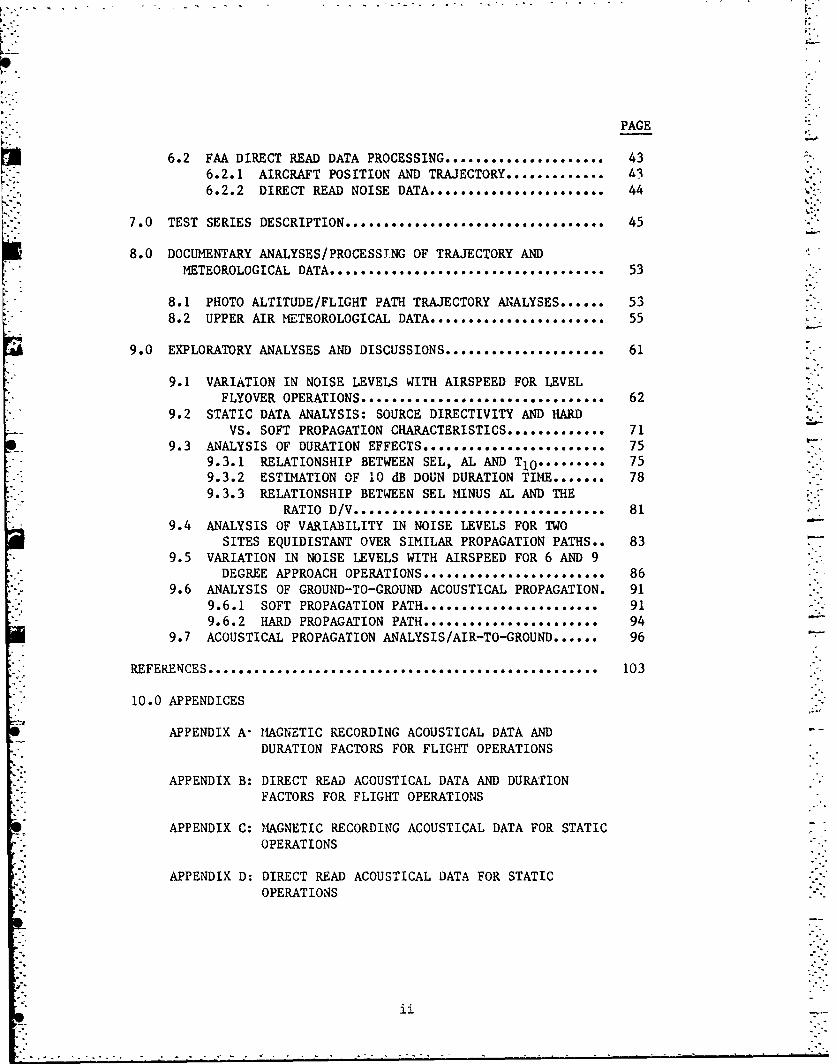
6.2 FAA DIRECT READ DATA PROCESSING ..................... 436.2.1 AIRCRAFT POSITION AND TRAJECTORY ............. 3"6.2.2 DIRECT READ NOISE DATA OE T .................... 44
7.0 TEST SERIES DESCRIPTION...... ..... ..... ................. 45
8.0 DOCUMENTARY ANALYSES/PROCESSING OF TRAJECTORY ANDMETEOROLOGICAL DATA ......... .. o... .... .eotoooo .... 53
8.1 PHOTO ALTITUDE/FLIGHT PATH TRAJECTORY ANALYSES...... 53)8.2 UPPER AIR METEOROLOGICAL DATA.................... o.o. 55
9.0 EXPLORATORY ANALYSES AND DISCUSSIONS...................... 61
9.1 VARIATION IN NOISE LEVELS WITH AIRSPEED FOR LEVELFLYOVER OPERATIONS ................................ 62
9.2 STATIC DATA ANALYSIS: SOURCE DIRECTIVITY AND HARDVS. SOFT PROPAGATION CHARACTERISTICS ............. 71
9.3 ANALYSIS OF DURATION EFFECTS ......................... 759.3.1 RELATIONSHIP BETWEEN SEL, AL AND TIO ....... 0. 759.3.2 ESTIMATION OF 10 dB DOUN DURATION TIME....... 789.3.3 RELATIONSHIP BETWEEN SEL MINUS AL AND THE
RATIO D/V. ...... oo .......... ......... 819.4 ANALYSIS OF VARIABILITY IN NOISE LEVELS FOR TWO
SITES EQUIDISTANT OVER SIMILAR PROPAGATION PATHS.. 83 -
9.5 VARIATION IN NOISE LEVELS WITH AIRSPEED FOR 6 AND 9DEGREE APPROACH OPERATIONS ....................... 86
9.6 ANALYSIS OF GROUND-TO-GROUND ACOUSTICAL PROPAGATION. 919.6.1 SOFT PROPAGATION PATH ....................... 919.6.2 HARD PROPAGATION PATH.- ................. 94
9.7 ACOUSTICAL PROPAGATION ANALYSIS/AIR-TO-GROUND...... 96
REFERENCES .......... ........ o... ................... o........... 103
10.0 APPENDICES
APPENDIX A* MAGNETIC RECORDING ACOUSTICAL DATA ANDDURATION FACTORS FOR FLIGHT OPERATIONS
APPENDIX B: DIRECT READ ACOUSTICAL DATA AND DURATIONFACTORS FOR FLIGHT OPERATIONS
APPENDIX C: MAGNETIC RECORDING ACOUSTICAL DATA FOR STATICOPERATIONS
APPENDIX D: DIRECT READ ACOUSTICAL DATA FOR STATICOPERATIONS
-..

. -° . ,
APPENDIX E: COCKPIT INSTRUMENT PHOTO DATA AND OBSERVER DATA
APPENDIX F: PHOTO-ALTITUDE AND FLIGHT PATH TRAJECTORYDATA
APPENDIX G: NWS UPPER AIR METEOROLOGICAL DATA
APPENDIX H: NWS-IAD SURFACE METEOROLOGICAL DATA
APPENDIX I: ON-SITE METEOROLOGICAL DATA -.
iiii!
1 °,
.............................
...............................................................................
LIST OF TABLES
PAGE
2.1 HELICOPTER CHARPACTERISTICS. .................... 6
2.2 ICAO REFERENCE PARAMETERS................................ 7
5.1 REFERENCE HELICOPTER ALTITUDES FOR APPROACH.............. 20
5.2 EWS SYSTEM ACCURACY. .. o......... .. ***....* ............. 28
5.3 RUSTRAK RECORDER RANGE................................... 28
7.1 TEST SUMMA RY............................................. 48
9.1 ADVANCING BLADE TIP MACH NUMMBERSo....................... 62
9.2 SUMMARY OF 1980, 1983 AND 1984 TEST CONDITIONS........... 66
9.3 CORPARVSON OF 1000 FT LFO NOISE DATA..................... 68
9.4 EMIPIRICAL PROPAGATION CONSTANTSo......................... 69
9.5 A-WEIGHTED NOISE LEVEL RANGESo....oo..................... 75
9.6 DURATION (T-1O) REGRESSION ON D/V.. ..................... 80
9.7 SEL-AIM REGRESSION ON D/V ................................ 83
9.8 COMPARISON OF NOISE VS. DIRECTIVITY ANGLES FOR TWOSOFT SURFACES: HIGE..... . .. ... ... .. .. ................. 85
9.9 APPROACH ADJUSTMENTS ...... ............................... 88
9.10 DATA FROM SOFT SITES........ ... .......................... 93
9.11 EMPIRICAL PROPAGATION CONS2ANTS FOR SOFT SITES........... 94
9.12 SUMMAARY OF SOFT PATH PROPAGATION CONSTANTS........o...... 94
9.13 PROPAGATION DATA -ICAO TAKEOFF. ......................... 98
9.14 PROPAGATION DATA - TAKEOFF............................... 98
9.15 PROPAGATION DATA - TAKEOFF............................... 98
9.16 SUMMARY TABLE OF PROPAGATION CONSTANTS FOR THREE TAKEOFF.OPERATIONSo ...... o..... .. o... ................... ..... ... 98 •-•''
iv
PAGE
9.17 SUMMARY TABLE FOR TAKEOFF OPERATION...................... 98
"9.18 LEVEL FLYOVER PROPAGATION ANALYSIS - AL .................. 100
"9.19 SUMMARY TABLE FOR LFO -AL............................... 100
9.20 LEVEL FLYOVER PROPAGATION -EPNL ......................... 102
9.21 SUMMARY TABLE FOR LFO - EPNL ............................. 102
V

J•, • '•~~~ ~~~ .'' ..- '• '- • -. .•'''--•• ..• '• '-'' . .` . .. .• I o , • .J • .
LIST OF FIGURES
PAGE
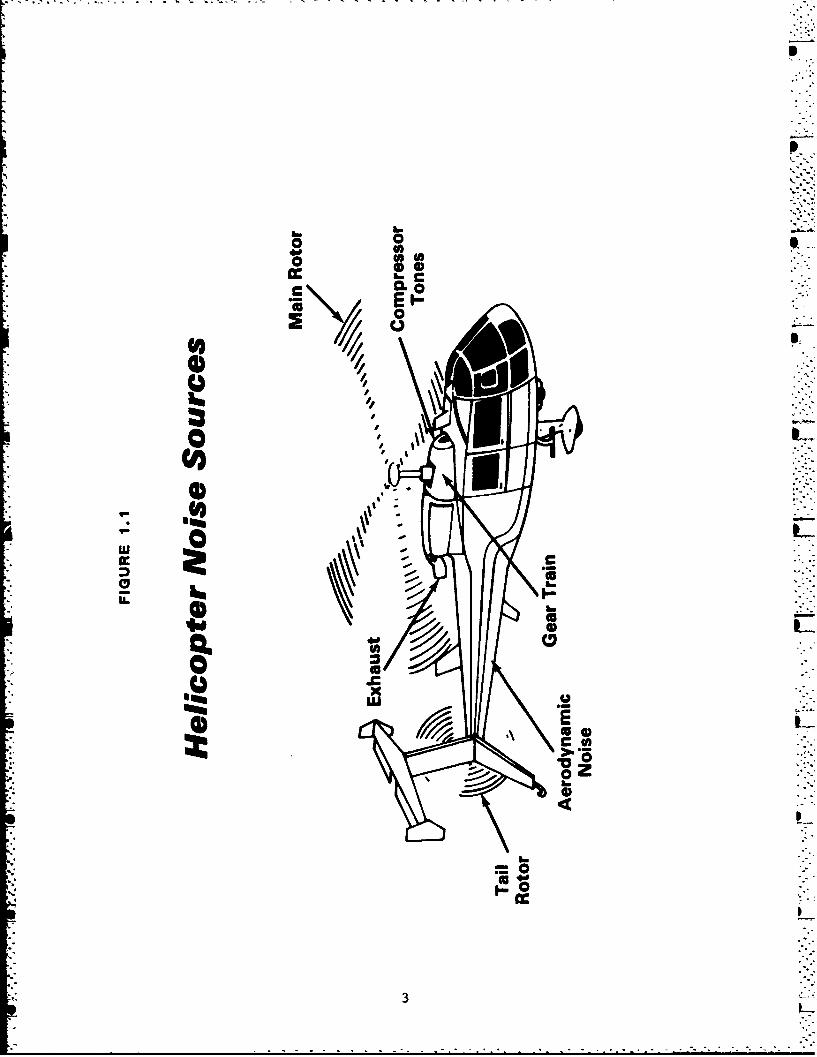
1.1 HELICOPTER NOISE SOURCES ................................. 3
3.1 FLIGHT TEST AND NOISE HEASUREMENT PERSONNEL IN ACTION.... 9
3.2 DULLES AIRPORT AND TEST FLIGHT TRACK ..................... 11
3.3 NOISE MEASUREMENT AND PHOTO-SITE SCHEMATIC ............... 14
4.1 COMMUNICATIONS NETWORK ........................ 16
4.2 QUAIL AND QUAIL SONG ...................... . ..... 18
5.1 POP SYSTEM ................. ......................... 22
5.2 COCKPIT PHOTOGRAPH .............. .... . ....... ....... 25
5.3 TECHNICIANS LAUNCHING RADIOSONDE BALLOONo....oo........... 26
5.4 ACOUSTICAL MEASUREMENT INSTRUMENTATION.............. ...... 30
5.5 ACOUSTICAL MEASUREMENT INSTRUMENTATIONo....o.............. 32
5.6 MICROPHONE AND ACOUSTICAL EQUIPMENT DEPLOYMENT FORFLIGHT OPERATIONS..... .... .... ............. ........... 34
5.7 MICROPHONE AND ACOUSTICAL EQUIPMENT DEPLOYMENT FORSTATIC OPERATIONS.. .. .... ooo .... . ... ... ... 35
6.1 TSC LABORATORY .......................................... 37
6.2 ACOUSTICAL DATA REDUCTION/INSTRUMENTATION................ 38
6.3 ACOUSTICAL EMISSION ANGLE CONVENTION ...... o............. 41
6.4 DIRECT READ DATA REDUCTION .. .............. ..... .... . .ooo ...... 42
7.1 HELICOPTER TAKEOFF NOISE TESTS.....o..................... 49
7.2 HELICOPTER APPROACH NOISE TESTSo........................... 50
7.3 HELICOPTER FLYOVER NOISE TESTS.........o............... . 51
8.1 TIME HISTORY ANALYSIS FOR TEMPERATURE .................... 56
8.2 TIME HISTORY ANALYSIS FOR RELATIVE HUMIDITY.............. 56
8.3 WIND SPEED VS. TIME: HEAD/TAIL WIND..................... 58
S~vi
,'. °,'
PAGE
8.4 WIND SPEED VS, TIME: CROSS WIND ......................... 58
9.1 LFO: SEL VS. INDICATED AIRSPEED ........ 64'
9.2 LFO: AL VS. INDICATED AIRSPEED ......................... 64
9.3 HARD VS. SOFT PATH DIRECTIVITY: HIGE.................... 66 -
9.4 HARD VS. SOFT PATH DIRECTIVITY: FI ...................... 68
9.5 HELICOPTER HOVER NOISE TEST .............................. 73
9.6 DURATION ANALYSIS - 500 FT. LFO .......................... 78
9.7 APPROACH OPERATION: SEL ................................. 88
9.8 APPROACH OPERATION: AL .................................. 88
9.9 TIP VORTEX INTERACTICN ..................... .... ............ 90
L9
"GLOSSARY
AGL Above groupd level
AIR Aerospace Information Report
AL A-Weighted sound level, expressed in decibels (SeeLA)
ALM Maximum A-weighted scund level, expressed in
decibels (see LAM)
ALAM As measured maximum A-weighted Sound Level
ALT Aircraft altitude above the microphone location
APP Approach operational mode
CLC Centerline Center
CPA Closest point of approach
d Distance
"dB Decibel
"dBA A-Weighted sound level expressed in units ofdecibels (see AL)
df Degree of freedom
A Delta, or change in value
AI Correction term obtained by correcting SPL valuesfor atmospheric absorption and flight trackdeviations per FAR 36, Amendment 9, Appendix A,Section A36.11, Paragraph d
"A2 Correction term accounting for changes in eventduration with deviations from the reference flightpath
"DUR(A) "10 dB-Down" duration of LA time history
EPNL Effective perceived noise level (symbol isLEPN)
EV Event, test run number
viii

FAA Federal Aviation Administration
FAR Federal Aviation Regulation
FAR-36 Federal Aviation Regulation, Part 36
GLR Graphic level recorder
IHIGE Hover-in-ground effect -"
HOGE Hover-out-of-ground effect
IAS Indicated airspeed
ICAO International Civil Aviation Organization
IRIG-B Inter-Range Instrumentation Group B (established
technical time code standard)
j The value which determines the radiation pattern
K(DUR) The constant used to correct SEL for distance and
velocity duration effects in A2
KIAS Knots Indicated Air Speed
K(P) Propagation constant describing the change in noise
level with distance _
K(S) Propagation constant describing the charge in SEL
with distance
Kts Knots
LA A-Weighted sound level, expressed in decibels
Leq Equivalent sound level
"LFO Level Flyover operational mode
1MA Advancing blade tip Mach number
"MR Rotational Mach number
-MT Translational Mach number
N Sample size
NWS National Weather Service
OASPLM Maximum overall sound pressure level in decibels
ix

PISLM Precision integrating sound level meter
PNLM Maximum perceived noise level
PNLTM Maximum tone corrected perceived noise level
POP Photo overhead positioning system
Q - Time history "shape factor"
RH Relative Humidity in percent
RPM Revolutions per minute
SAE Society of Automotive Engineers
SEL Sound exposure level expressed in decibels. Theintegration of the AL time history, normalized toone second (symbol is LAE)
SELAM As measured sound exposure level
SEL-ALM Duration correction factor
SHP Shaft horse power
SLR Single lens reflex (35 mm camera)
"SPL Sound pressure level
"" T Ten dB down duration time
TC Tone correction calcualted at PNLTM
T/O Takeoff
TSC Department of Transportation, Transportation Systems -'-
Center
V Velocity
VASI Visual Approach Slope Indicator
VH Maximum speed in level flight with maximum L..continuous power
VNE- Never-exceed speed
Vy - Velocity for best rate of climb
x _
* *" .. " .

i•'•"•-•'•~~~~~~~~~~~~~....... ... ........._.-,,,, o • •. ..... o.••• ......... .... •. .'••-
1.0 Introduction - This report documents the results of a Federal
Aviation Administration (FAA) noise measurement/flight test program
involving the Sikorsky S-76A helicopter. The report contains documentary
sections describing the acoustical characteristics of the subject
helicopter and provides analyses and discussions addressing topics ranging
from acoustical propagation to environmental impact of helicopter noise.
This report is the sixth in a series of seven documenting the FAA
helicopter noise measurement program conducted at Dulles International
Airport during the summer of 1983.
The S-76A test program was conducted by the FAA in cooperation with
Sikorsky Aircraft and a number of supporting Federal agencies. The
rigorously controlled tests involved the acquisition of detailed
acoustical, position and meteorological data.
This test program was designed to address a series of objectives
including: 1) acquisition of acoustical data for use in heliport
environmental impact analyses, 2) documentation of directivity characte-
ristics for static operation of helicopters, (3) establishment of ground-
to-ground and air-to-ground acoustical propagation relationships for -'-"
helicopters, 4) determination of noise event duration influences on energy
dose acoustical metrics, 5) examination of the differences between noise
measured by a surface mounted microphone and a microphone mounted at a
height of four feet (1.2 meters), and 6) documentation of noise levels
acquired using international helicopter noise certification test
procedures.
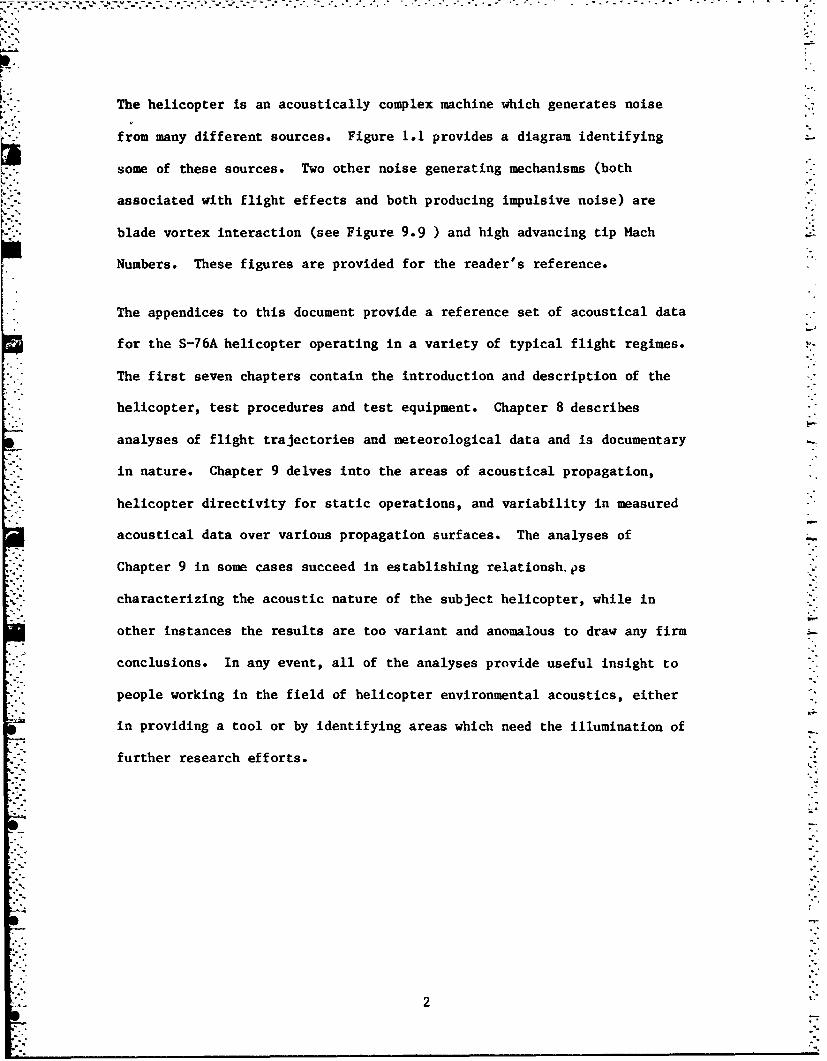
The helicopter is an acoustically complex machine which generates noise
from many different sources. Figure 1.1 provides a diagram identifying
some of these sources. Two other noise generating mechanisms (both
associated with flight effects and both producing impulsive noise) are
blade vortex interaction (see Figure 9.9 ) and high advancing tip Mach
Numbers. These figures are provided for the reader's reference.
The appendices to this document provide a reference set of acoustical data
for the S-76A helicopter operating in a variety of typical flight regimes.
The first seven chapters contain the introduction and description of the
helicopter, test procedures and test equipment. Chapter 8 describes
analyses of flight trajectories and meteorological data and is documentary
in nature. Chapter 9 delves into the areas of acoustical propagation,
helicopter directivity for static operations, and variability in measured
acoustical data over various propagation surfaces. The analyses of
Chapter 9 in some cases succeed in establishing relationshps
characterizing the acoustic nature of the subject helicopter, while in
other instances the results are too variant and anomalous to draw any firm
conclusions. In any event, all of the analyses provide useful insight to
people working in the field of helicopter environmental acoustics, either
in providing a tool or by identifying areas which need the illumination of
further research efforts.
2
INS bS
• .o
a 0
oc
0
LeD
oo
0
*0 0* - b.

TEST HELICOPTER DESCRIPTION
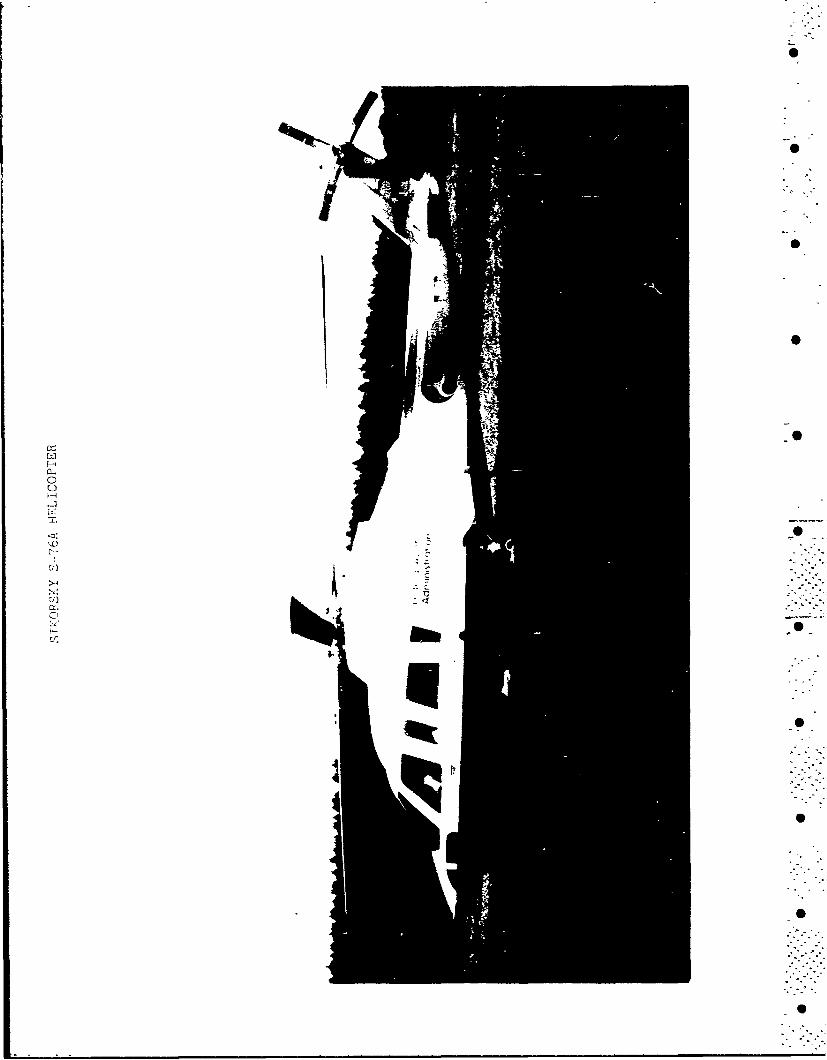
"2.0 Test Helicopter Description - The Sikorsky S-76A, previously known as
simply the Sikorsky S-76, is a twin turbine, general purpose all-weather
helicopter designed to meet the needs of the offshore oil support, the
"corporate executive, and the general utility markets. It is manufactured
by Sikorsky Aircraft of Stratford, Connecticut and can accomodate a pilot,
a copilot and up to twelve passengers. Various executive/luxury layout
are available. Also available are three different medical kits to convert
the S-76A to an air medical evacuation system; a single stretcher
intensive care unit; or to a three stretcher ambulance.
Selected operational characteristics, obtained from the helicopter
manufacturer, are presented in Table 2.1.
Table 2.2 presents a summary of the flight operational reference
parameters determined using the procedures specified in the International
Civil Aviation Organization (ICAO) noise certification testing
requirements. Presented along with the operational parameters are the
altitudes that one would expect the helicopter to attain (referred to the
ICAO reference test sites). This information is provided so that the
reader may implement an £CAO type data correction using the "As Measured"
data contained in this report. This report does not undertake such a, -.
correction, leaving it as the topic of a subsequent report.
5

TABLE 2.!
HELICOPTER CHARACTERISTICS
HELICOPTER MANUFACTURER :Sikorsky Aircraft
HELICOPTER MODEL : S-76A
HELICOPTER TYPE : Single Rotor
TEST HELICOPTER N-NUMBER :-N38
MAXIMUM GROSS TAKEOFF WEIGHT 10300 lbs (4672 kg)
NUMBER AND TYPE OF ENGINE(S) : 2 Detroit Diesel Allison 250-C30
SHAFT HORSE POWER (PER ENGINE) : 676 HP (30 Min. rating)
MAXIMUM CONTINUOUS POWER : 650 HP per engine
SPECIFIC FUEL CONSUMPTION AT
MAXIMUM POWER (LB/HR/HP) :-.63 LB/HR/HP
NEVER EXCEED SPEED (VNE) : 155 KTS
MAX SPEED IN LEVEL FLIGHT H
WITH MAX CONTINUOUS POWER (VH) :145 KTS
- SPEED FOR BEST RATE OF CLIMB (Vy) :-74 KTS
BEST RATE OF CLIMB :1350 FT/MIN
MAIN AND TAIL ROTOR SPECIFICATIONS
MAIN TAIL
ROTOR SPEED (100%) : 293 RPM 1611 RPM
DIAMETER 44 ft. (528 in.) 8 ft. (96 in.)
CHORD : 15.6 in. 6.5 in.
NUMBER OF BLADES 4 4
PERIPHERAL VELOCITY : 675 fps 674 fps
BLADE LOAD :-88 lb/ft2
FUNDAMENTAL BLADE PASSAGEFREQUENCY 20 Hz 107 Hz
ROTATIONAL TIP MACH NUMBER (77°F) .594 .594
6
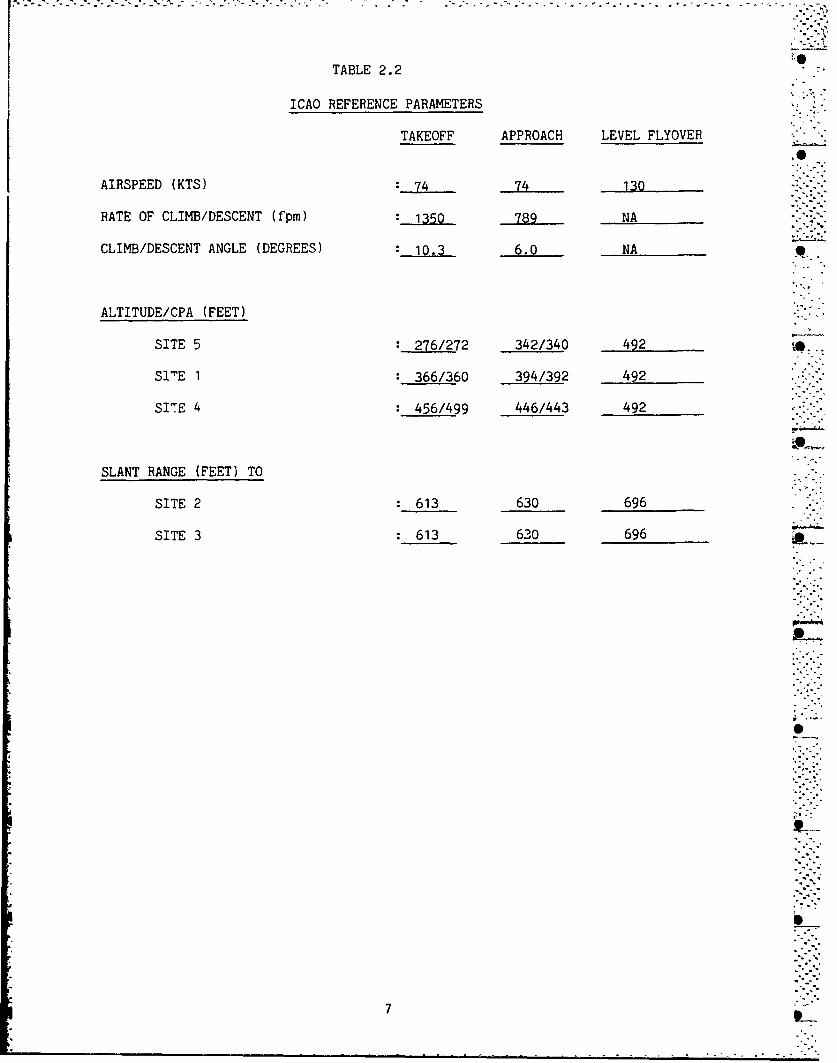
TABLE 2.2
ICAO REFERENCE PARAMETERS
TAKEOFF APPROACH LEVEL FLYOVER
AIRSPEED (KTS) :-74 74 130
RATE OF CLIMB/DESCENT (fpm) 1350 789 NA
CLIMB/DESCENT ANGLE (DEGREES) 10.3 6.0 NA
ALTITUDE/CPA (FEET)
SITE 5 276/272 342/340 492 0.
S1'E 1 366/360 394/392 492
SI-E 4 456/499 446/443 492
SLANT RANGE (FEET) TO
SITE 2 613 630 696
SITE 3 613 630 696
7
TEST SYNOPSIS
3.0 Test Syncpsis Below is a listing of pertinent details pertaining to
the execution of the helicopter tests.
1. Test Sponsor, Program Management, and Data Analysis: Federal
Aviation Administration, Office of Environment and Energy, Noise Abatement
Division, Noise Technology Branch (AEE-120).
2. Test Helicopter: Sikorsky S-76A, provided by the FAA Rotorcraft
Program Office.
3. Test Date: Monday, June 13, 1983.
4. Test Location: Dulles International Airport, Runway 30 over-run
area.
5. Noise Data Measurement (recording), processing and analysis:
Department of Transportation (DOT), Transportation Systems Center (TSC),
Noise Measurement and Assessment Facility.
6. Noise Data Measurement (direct-read), processing and analysis:
FAA, Noise Technology Branch (AEE-120).
7. Cockpit instrument photo documentation; photo-altitude
determination system; documentary photographs: Department of
Transportation, Photographic Services Laboratory.
8. Meteorological Data (fifteen minute observations): National
Weather Service Office, Dulles ±nternational Airport.
9. Meteorological Data (radiosonde/rawinsonde weather balloon
launches): National Weather Service Upper Air Station, Sterling Park,
Virginia.
- - - - - -

FIGURE 3.1Flight Test and Noise Measurement Personnel
In Action
AWM'S

10. Meteorological Data (on site observations): DOT-TSC.
11. Flight Path Guidance (portable visual approach slope indicator
(VASI) and theodolite/verbal course corrections): FAA Technical Center,
ACT-310.
12. Air Traffic Control: Dulles International Airport Air Traffic
Control Tower.
13. Test site preparation; surveying, clearing underbrush, connecting
electrical power, providing markers, painting signs, and other physical
arrangements: Dulles International Airport Grounds and Maintenance, and
Airways Facilities personnel.
Figure 3.1 is a photo collage of flight test and measurement personnel
performing their tasks.
3.1 Measurement Facility - The noise measurement testing area was located
adjacent to the approach end of Runway 12 at Dulles International Airport.
(The approach end of Runway 12 is synonymous with Runway 30 over-run
area.) The low ambient noise level, the availability of emergency D
equipment, and the security of the area all made this location desirable.
Figure 3.2 provides a photograph of the Dulles terminal and of the test
area.
The test area adjacent to the runway was nominally flat with a ground
cover of short, clipped grass, approximately 1800 feet by 2200 feet, and
bordered on north, south, and west by woods. There was minimum
interference from the commercial and general aviation activity at the
airport since Runway 12/30 was closed to normal traffic during the tests.
The runways used for normal traffic, 1L and IR, were approximately 2 and 3
miles east, respectively, of the test site.
10

FIG URE 3.2
The Terminal and Air Traffic Control Towerat Dulles International Airport
Approach to Runway 12 at Dulles NoiseMeasurement Site for 1983 Helicopter Tests

The flight track centerline was located parallel to Runway 12/30 centered
between the runway and the taxiway. The helicopter hover point for the
static operations was located on the southwest corner of the approach end
of Runway 12. Eight noise measurement sites were established in the
grassy area adjacent to the Runway 12 approach ground track.
3.2 Microphone Locations - There were eight separate microphone sites
located within the testing area, making up two measurement arrays. One
array was used for the flight operations, the other for the static
operations. A schematic of the test area is shown in Figure 3.3.
A. Flight Operations - The microphone array for flight operations
consisted of two sideline sites, numbered 2 and 3 in Figure 3.3, and three
centerline sites, numbered 5, 1, and 4, located directly below the flight
path of the helicopter. Since site number 3, the north sideline site, was
located in a lightly wooded area, it was offset 46 feet to the west to
provide sufficient clearance from surrounding Lrqes aad bushes.
B. Static Operations - The microphone array for static operations
consisted of sites 7H, 5H, IH, 2, and 411. These sites were situated
around the helicopter hover point which was located on the southwest
corner of the approach end of Runway 12. These site locations allowed for
both hard and soft ground-to-ground propagation paths.
- 3.3 Flight Path Markers and Guidance System Locations - Visual cues in
the form of squares of plywood painted bright yellow with a black "X" in
-. the center were provided to define the takeoff rotation point. This point
was located 1640 feet (500 m) from centerline center (CLC) microphone
_i ~12

location. Four portable, battery-powered spotlights were deployed at
various locations to assist pilots in maintaining the array centerline. P
To provide visual guidance during the approach portion of the test, a
"standard visual approach slope indicator (VASI) system was used. In
addition to the visual guidance, the VASI crew also provided verbal .
guidance with the aid of a theodolite. Both methods assisted the
helicopter pile in adhering to the microphone array centerline and in
maintaining the proper approach path. The locations of the VASI from CLC
are shown in the following table.
Approach Angle Distance from CLC(degrees) (feet)
12 18309 24566 37013 7423
Each of these locations provided a glidepath which crossed over the L_
centerline center microphone location at an altitude of 394 feet.
This test program included approach operations utilizing 3, 6 and 9 degree
glide slopes.
13

FIGURE 3.3Noise Measurement and Photo Site Schematic
-. 30 VASI
4031'?(1209m)
60 VASI
1752'(52Gm)Take Off
91K u Rotation
923' PointL
(277m)
P5lO 100 12(30m)I
((37m)______ ý5H- 492' (148m) Hover
225'....Point(67m)
392' 42(1 18m) (4m
492'(148m)
100'
46' (3m4 2(14m) 03 492' (148m) 492' (148 m)
392' 42(118m)(148m)
-0P4
100'
* Microphone Sites 4(_04H* Photo Altitude Sites 492' 0148m) 4El VASI Sites Flight Track Centerline
NOTES: Broken Line Indicates not to Scale.Metric Measurements toNearest! Meter. 14 L

TEST PLANNING AND BACKGROUND
4.0 Test Planning/Background Activities - This section provides a brief
discussion of important administrative and test planning activities.
4.1 Test Program Advance Briefings and Coordination - A pre-test briefing
was conducted approximately one month prior to the test. The meeting was
attended by all pilots participating in the test, along with FAA program
managers, manufacturer test coordinators, and other key test participants
from the Dulles Airport community. During this meeting, the airspace
safety and communications protocol were rigorously defined and at the same .
time test participants were able to iron out logistical and procedural
details. On the morning of the test, a final brief meeting was convened
on the flight line to review safety rules and coordinate last-minute -.
changes in the test schedule.
4.2 Communications Network - During the helicopter noise measurement
test, an elaborate communications network was utilized to manage the
various systems and crews. This network was headed by a central group
which coordinated the testing using three two-way radio systems,
designated as Radios 1-3.
Radio I was a walkie talkie system operating on 169.275 MHz, providing
communications between the VASI, National Weather Service, FAA Acoustic
Measurement crew, the TSC acoustic tea. coordinator, and the noise test
coordinating team.
Radio 2 was a second walkie talkie system operating on 170.40 MHz,
providing communications between the TSC acoustic team coordinator and the . -
TSC acoustic measurement teams.
15.. -

0 C4> L-
4 o0
INN 0 c) F 0 a
CCD
-0- uN'
0 0*I..)
0)0
4- 4-. 0
0 U'
N N
uLo
V- r0 - I,(4n
0(
aa)
160 l

Radio 3, a multi-channel transceiver, was used as both an air-to-ground
and ground-to-ground communications system. In air-to-ground mode it
provided communications between VASI, helicopter flight crews, and noise
test control on 123.175 11Hz. In ground-to-ground mode it provided
communications between the air traffic control tower (121.9 MHz), Page
Avjet (the fuel source; 122.95 MHz), and noise test control. A schematic
of this network is shown in Figure 4.1.
L
4.3 Local Media Notification - Noise test program managers working
through the FAA Office of Public- Affairs released an article to the local
media explaining that helicopter noise tests were to be conducted atL
Dulles Airport on June 13, the test day commencing around dawn and
extending through midday. The article described general test objectives,
flight paths, and rationale behind the very early morning start time (low
wind requirements). In the case of a farm located very close to the
airport, a member of the program management team personally visited the
residents and explained what was going to be involved in the test. As a
consequence of these efforts (it is assumed), there were very few
complaints about the test program.
4.4 Ambient Noise - One of the reasons that the Dulles Runway 30 over-run
area was selected as the test site was tne low ambient noise level in the
area. Typically one observed an A-Weighted LEQ on the order of 45 dB,
with dominanht transient noise sources primarily from the avian and insect
families. The primary offender was the Collinus Virginianus, commonly
known as the bobwhite, quail, or partridge. The infrequent intrusive
17

._......=..:- .5-- .-.-. _'."..... .....-.-. '". .. I'... ... t',,...:•._.•.... j'..-.-.....-.-.."<-'--...... - '" '7. ... -
sound pressure levels were on the order of 55 dB centered in the 2000 Hz
one-third octave band. A drawing of the noisy offender and narrow band
analysis of the song may be found in Figure 4.2.
As an additional measure for safety and for lessening ambient noise, a
Notice to Airmen or NOTAM was issued advising aircraft of the noise test,
and indicating that Runway 12/30 was closed for the duration of the test.
FIGURE 4.2
1.5 Sec. Avg.
5'50
7.
S00 250 5000Hz
18L

DATA ACQUISITION AND GUIDANCE SYSTEMS
5.0 Data Acquisition and Guidance Systems - This section provides a
detailed description of the test program data acquisition systems, with
special attention giver to documenting the operational accuracy of each
system. In addition, discussion is provided (as needed) of field
experiences which might be of help to others engaged in controlled
helicopter noise measurements. In each case, the location of a given
measurement system is described relative to the helicopter flight path.
5.1 Approach Guidance System - Approach guidance was provided to the
pilot by means of a visual approach slope indicator (VASI) and through
verbal commands from an observer using a ballon-tracking theodolite. (A
picture of the theodolite is included in Figure 3.1, in Section 3.0.) The
VASI and theodolite were positioned at the point where the approach path
intercepted the ground.
The VASI system used in the test was a 3-light arrangement giving vertical -
displacement information within +0.5 degrees of the reference approach
slope. The pilot observed a green light if the helicopter was within 0.5
degrees of the approach slope, red if below the approach slope, white if
above. The VASI was adjusted and repositioned to provide a variety of
approach angles. A picture of the VASI is included in Figure 3.1.
-'9
The theodolite system, used in conjunction with the VASI, also provided
accurate approach guidance to the pilot. A brief time lag existed between
the instant the theodolite observor perceived deviation, transmitted a
command, and the pilot made the correction; however, the theodolite crew
was generally able to alert the pilot of approach path deviations (slope
and lateral displacement) before the helicopter exceeded the limits of the
one degree green light of the VASI. Thus, the helicopter only
19 ]9 7:i

occasionally and temporarily deviated more than 0.5 degrees from the
reference approach path.
Approach paths of 3, 6 and 9 degrees were used during the test program.
Table 5.1 summarizes the VASI beam width at each measurement location for
a variety of the approach angles used in this test.
TABLE 5.1
REFERENCE HELICOPTER ALTITUDES FOR APPROACH TESTS(all distances expressed in feet)
MICROPHONE MICROPHONE MICROPHONENO. 4 NO. 1 NO. 5
APPROACH A = 8010 A = 7518 A = 7026ANGLE 30 B = 420 B = 394 B = 368
C = .70 C = +66 C = +62
60 A = 4241 A = 3749 A = 3257= 446 B = 394 B = 342
C = 37 C = +33 C = +29
90 A = 2980 A = 2488 A = 1362
B = 472 B = 394 B = 316C : +27 C : +22 C = .18
A = distance from VASI to microphone location
B = reference helicopter altitude
C : boundary of the 1 degree VASI glide slope
"beam width".
|I
5.2 Photo Altitude Determination Systems - The helicopter altitude over a
given microphone was determined by the photographic technique described in
the Society of Automotive Engineers report AIR-902 (ref. 1). This
"technique involves photographing an aircraft during a flyover event and
"20
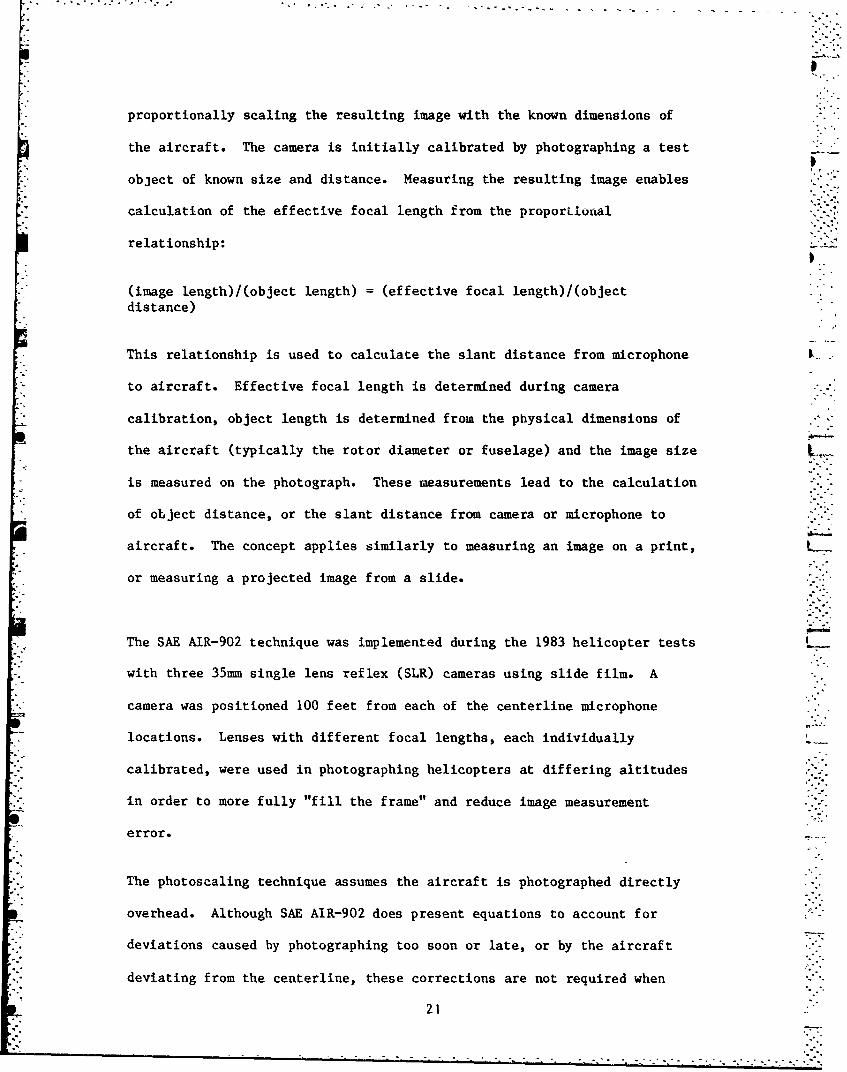
proportionally scaling the resulting image with the known dimensions of
the aircraft. The camera is initially calibrated by photographing a test
"object of known size and distance. Measuring the resulting image enables
calculation of the effective focal length from the proportional
relationship:
(image length)/(object length) = (effective focal length)/(object"distance)
This relationship is used to calculate the slant distance from microphone
to aircraft. Effective focal length is determined during camera
calibration, object length is determined from the physical dimensions of
the aircraft (typically the rotor diameter or fuselage) and the image size
is measured on the photograph. These measurements lead to the calculation
of object distance, or the slant distance from camera or microphone to
aircraft. The concept applies similarly to measuring an image on a print,
or measuring a projected image from a slide.
The SAE AIR-902 technique was implemented during the 1983 helicopter tests
with three 35m single lens reflex (SLR) cameras using slide film. A
camera was positioned 100 feet from each of the centerline microphone '. -
locations. Lenses with different focal lengths, each individually
calibrated, were used in photographing helicopters at differing altitudes
in order to more fully "fill the frame" and reduce image measurement
error.
The photoscaling technique assumes the aircraft is photographed directly
overhead. Although SAE AIR-902 does present equations to account for
"deviations caused by photographing too soon or late, or by the aircraft
deviating from the centerline, these corrections are not required when
21

Figure 5.1
Photo Overhead Oosioning System(Pop SysWm)n
7.
6*
t~ Photographer using theZ2U~ POP system to photograph
the helicopter.
Artist's Drawing of the Photo Overhead PositioningSystem (Figure is not to scale.)
Cr
Photographs of the Sikorsky S-76A, as taken by thephotographer using the POP system.
22
••.•. .-.:.. ... . . .. .- -•.•.

S.. . . . ._ . .'.. . . .. . . . .
deviations are small. Typically, most of the deviations were acoustically
insignificant. Consequently, corrections were not required for any of the
1983 test photos.
The photographer was aided in estimating when the helicopter was directly
overhead by means of a photo-overhead positioning system (POPS) as
illustrated in the figure and pictures in Figure 5.1 The POP system
consisted of two parallel (to the ground) wires in a vertical plane
orthogonal to the flight path. The photographer, lying beneath the POP
system, initially positioned the camera to coincide with the vertical
plane of the two guide wires. The photographer tracked the approaching
helicopter in the viewfinder and tripped the shutter when the helicopter
crossed the superimposed wires. This process of tracking the helicopter
also minimized image blurring and the consequent elongation of the image
of the fuselage.
A scale graduated in 1/32-inch increments was used to measure the
projected image. This scaling resolution translated to an error in
altitude of less than one percent. A potential error lies in the scaler's
interpretation of the edge of the image. In an effort to quantify this
error, a test group of ten individuals measured a selection of the
fuzziest photographs from the helcopter tests. The resulting statistics
rev'.aled that 2/3 of the participants were within two percent of the mean
altitude. SAE AIR-902 indicates that the overall photoscaling technique,
under even the most extreme conditions, rarely produces error exceeding
12 percent, which is equivalent to a maximum of 1 dB error in corrected
sound level data. Actual accuracy varies from photo to photo; however, by
using skilled photographers and exercising reasonable care in the
measurements, the accuracy is good enough to ignore the resulting small
error in altitude.
23
........ -.....-....-..- -.-.---....-.-. -. .. , -.. '
Tests were recently conducted in West Germany which compared this camera
method with the more elaborate Kinotheodolite tracking method to discover
which was best for determining overflight height and overground speed.
Both methods were found to be reasonably accurate; thus, the simpler
camera method remains appropriate for test purposes (ref. 2).
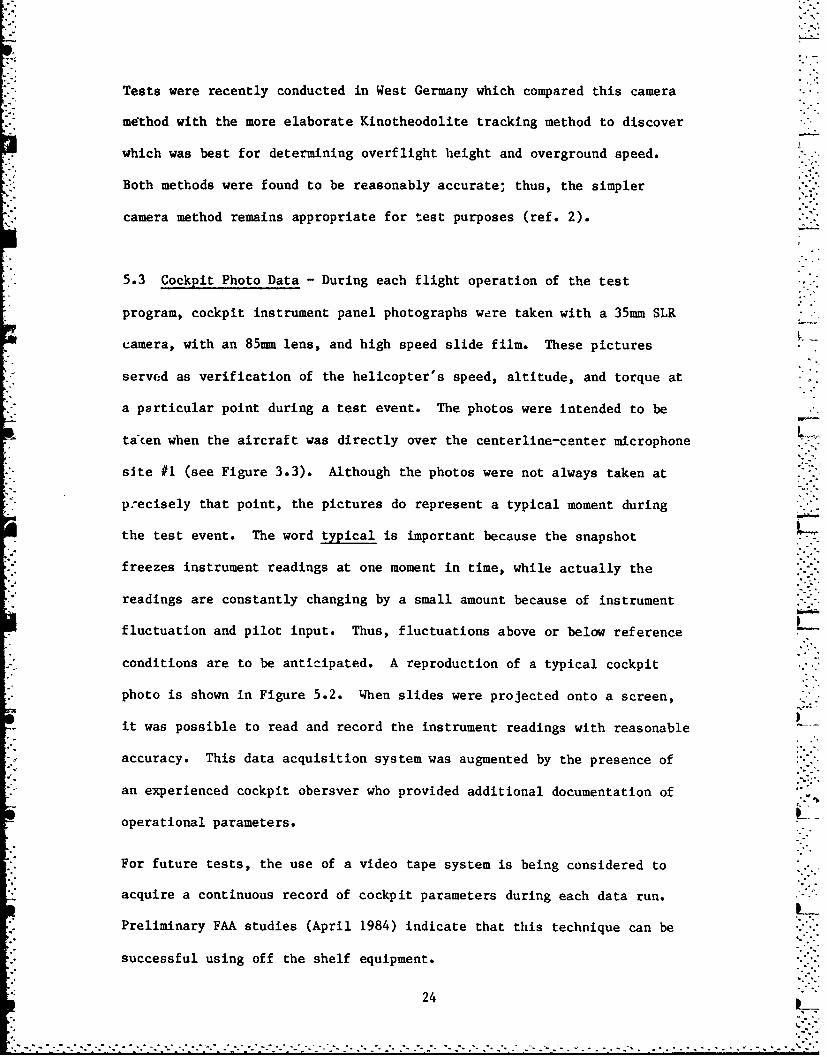
5.3 Cockpit Photo Data - During each flight operation of the test
program, cockpit instrument panel photographs were taken with a 35mm SLR
camera, with an 85mm lens, and high speed slide film. These pictures
served as verification of the helicopter's speed, altitude, and torque at
a particular point during a test event. The photos were intended to be
taken when the aircraft was directly over the centerline-center microphone L.
site #1 (see Figure 3.3). Although the photos were not always taken at
precisely that point, the pictures do represent a typical moment during
the test event. The word typical is important because the snapshot
freezes instrument readings at one moment in time, while actually the
readings are constantly changing by a small amount because of instrument
fluctuation and pilot input. Thus, fluctuations above or below reference
conditions are to be anticipated. A reproduction of a typical cockpit
photo is shown in Figure 5.2. When slides were projected onto a screen,
it was possible to read and record the instrument readings with reasonable
accuracy. This data acquisition system was augmented by the presence of
an experienced cockpit obersver who provided additional documentation of
operational parameters.
For future tests, the use of a video tape system is being considered to
acquire a continuous record of cockpit parameters during each data run.
*. Preliminary FAA studies (April 1984) indicate that this technique can be
.. successful using off the shelf equipment.
24

FIGURE 5.2
•,9,,
5.4 Upper Air Meteorological Data Acquisition/NWS.: Sterling, VA - The
National Weather Service (NWS) at Sterling, Virginia provided upper air
meteorological data obtained from balloon-borlie radiosondes. These data
consisted of pressure, temperature, relative humidity, wind direction, and
speed at 100' intervals from ground level through the highest test
altitude. The balloons were launched approximately 2 miles north of the
Mreasu ement array. To slow the ascent rate of the balloon, an inverted
parachute was attached to the end of the flight train. The VIZ Accu-Lok
(manufacturer) radiosonde employed in these tests consisted of sensors
which sampled the ambient temperature, relative humidity, and pressure of
the air. Each radiosonde was individually calibrated by the manufacturer.
The sensors were coupled to a radio transmitter which emitted an RF signal
of 1680 MHz sequentially pulse-modulated at rates corresponding to the
values of sampled meteorological parameters. These signals were received
by the ground-based tracking system and converted into a continuous trace
on a strip chart recorder. The levels were then extracted manually and
25
.%%.

entered into a minicomputer where calculations were performed. Wind speed
and direction were determined from changes in position and direction of
the "flight train" as detected by the radiosonde tracking system. Figure
5.3 shows technicians preparing to launch a radiosonde.
i "~
i L
FIGURE 5.3
The manufacturer's specifications for accuracy are:
Pressure +4 mb up to 250 mb
Temperature - +0.5'C, over a range of +30'C to -30"C
Humidity = +5% over a range of +25'C to 5'C
The National Weather Service has determined the "operational accuracy" of
a radiosonde (as documented in an unpublished report entitlkd "Standard
for Weather Bureau Field Programs", 1-1-67) to be as follows:
Pressure = +2 mb, over a range of 1050mb to 5 mb
Temperature = +I'C, over a range of +50%C to -70"C
Humidity = +5% over a range of +40'C to -40'C
26 L
.-. , .-.

The temperature and pressure data are considered accurate enough for
general documentary purposes. The relative humidity data are the least
reliable. The radiosonde reports lower than actual humidities when the
*.- air is near saturation. These inaccuracies are attributable to the slow
response time of the humidity sensor to sudden changes. (Ref. 3).
* For future testing, the use of a SODAR (acoustical sounding) system is
being considered. The SODAR is a measurement system capable of defining
the micro-wind structure, making the influences of wind speed, direction
anZ gradient easier to identify and to assess in real time (Ref. 4).
5.5 Surface Meteorological Data Acquisition/NWS: Dulles Airport - The
National Weather Service Station at Dulles provided temperature,
windspeed, and wind direction on the test day. Readings were noted every
15 minutes. These data are presented in Appendix H. The temperature
transducers were located apl roximately 2.5 miles east of the test site at
a height of 6 feet (1.8 m) above the ground, the wind instruments were at
a height of 30 fee' (10 m) above ground level. The dry bulb thermometer
Sand dew point transducer were contained in the Bristol (manufacturer)
HO-61 system operating with + one degree accuracy. The windspeed and
direction were measured with the Electric Speed Indicator (manufacturer)
F420C System, operating with an accuracy of 1 knot and +5'.
On-site meterological data were also nbtained by TSC personnel uqing a
Climatronics (manufacturer) model EWS weather system. The anemometer and
temperature sensor were located 10 feet above ground level at noise
site 4. These data are presented in Appendix I. The following table
27

(Table 5.2) identifies the accuracy of the individual components of the
EWS system.
TABLE 5.2
Sensor Accuracy Range Timc Constant
Windspeed +.025 mph 0-100 mph 5 secor 1.5%
Wind +1.5% 0-360" 15 secDirection
Relative +2% 0-100% RH 10 secHumidity 0-100% RH
Temperature +1.O'F -40 to +120'F 10 sec
After "detection" (sensing), the meteorological data are recorded on a
Rustrak (manufacturer) paperchart recorder. The following table (Table
5.3) identifies the range and resolutions associated with the recording of
each parameter.
TABLE 5.3
Sensor Range Chart Resolution
Windspeed 0-25 TSC mod +0.5 mph -
0-50 mph
Wind 0-3600 +5%Direction
Relative 0-100% RH +2% RHHumidity
Temperature -40W to 120'F +1'F
5.6.0 Noise Data Acquisition Sytems/SXstem Deployment - This section
provides a detailed description of the acoustical measurement systems
employed in the test program along with the deployment plan utilized in
each phase of testing.
28
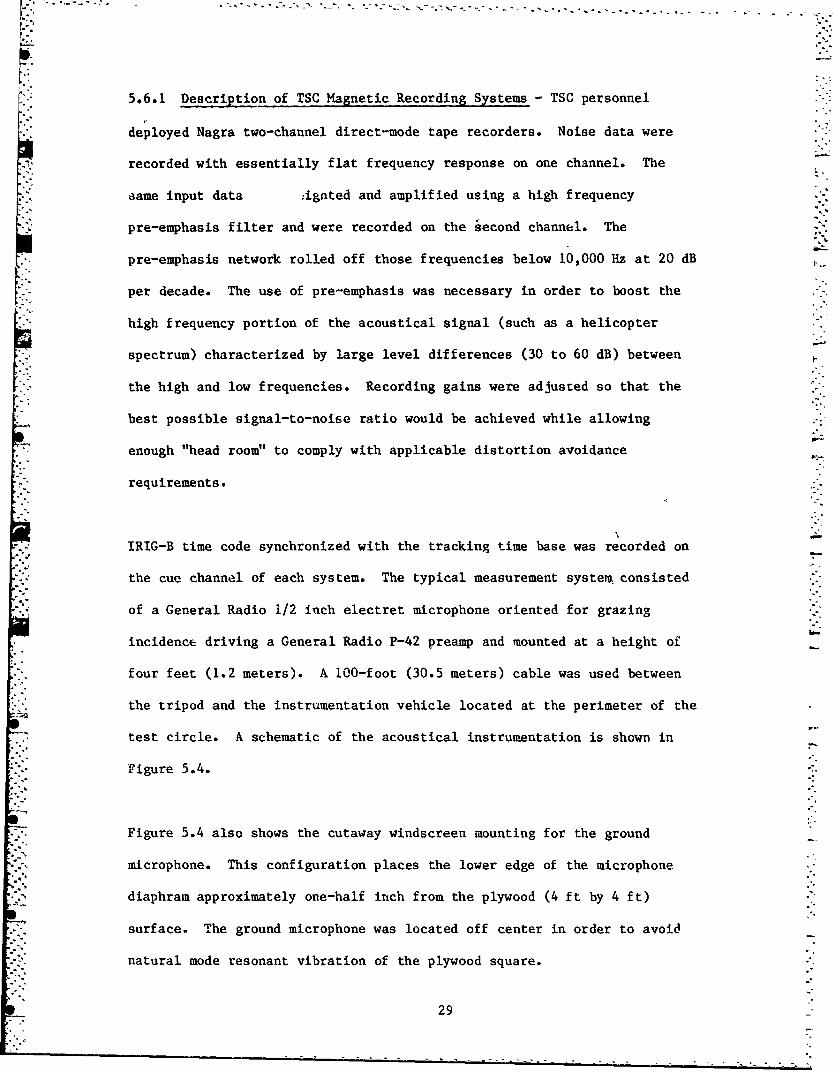
"5.6.1 Description of TSC Magnetic Recording Systems - TSC personnel
"deployed Nagra two-channel direct-mode tape recorders. Noise data were
recorded with essentially flat frequency response on one channel. The
"•ame input data Aignted and amplified using a high frequency
pre-emphasis filter and were recorded on the second channel. The
pre-emphasis network rolled off those frequencies below 10,000 Hz at 20 dB
per decade. The use of pre-emphasis was necessary in order to boost the
high frequency portion of the acoustical signal (such as a helicopter
spectrum) characterized by large level differences (30 to 60 dB) between
the high and low frequencies. Recording gains were adjusted so that the
best possible signal-to-noise ratio would be achieved while allowing
enough "head room" to comply with applicable distortion avoidance
requirements.
IRIG-B time code synchronized with the tracking time base was recorded on
the cue channel of each system. The typical measurement syste% consisted
of a General Radio 1/2 inch electret microphone oriented for grazing
incidence driving a General Radio P-42 preamp and mounted at a height of
four feet (1.2 meters). A 100-foot (30.5 meters) cable was used between
the tripod and the instrumentation vehicle located at the perimeter of the
test circle. A schematic of the acoustical instrumentation is shown in
Figure 5.4.
Figure 5.4 also shows the cutaway windscreen mounting for the ground
microphone. This configuration places the lower edge of the microphone
diaphram approximately one-half inch from the plywood (4 ft by 4 ft)
surface. The ground microphone was located off center in order to avoid
natural mode resonant vibration of the plywood square.
29
S.. . .. o

(-
0
rcc
a1)ri> 0.
cn C0 .0
r- C14a.
N~ cr-o 00
rd
aa) C)>cn -o1.
him C w 3'Id 0 LU
(EO>)a*
*~~ C 0
0. LC
.- a)E (D
C14 0.u-) E
U crn
00
c0
30a
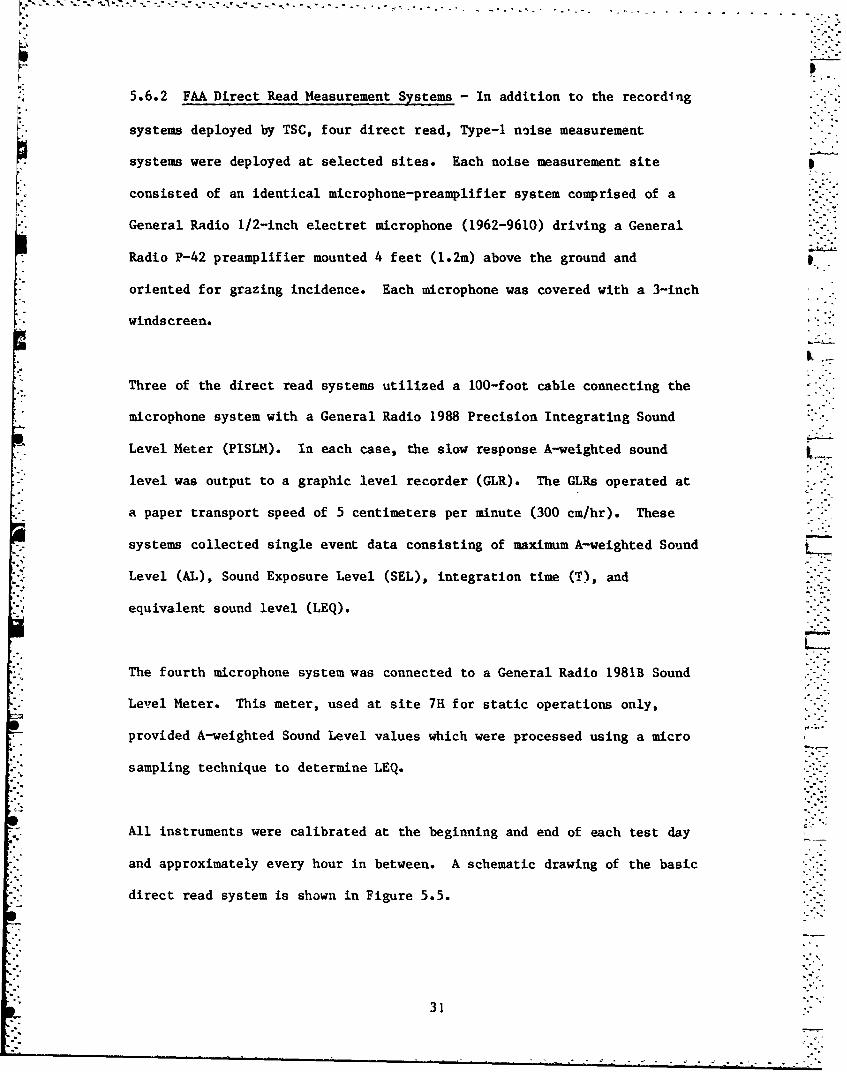
5.6.2 FAA Direct Read Measurement Systems - In addition to the recording
"systems deployed by TSC, four direct read, Type-i noise measurement
systems were deployed at selected sites. Each noise measurement site
consisted of an identical microphone-preamplifier system comprised of a
General Radio 1/2-inch electret microphone (1962-9610) driving a General
Radio P-42 preamplifier mounted 4 feet (1.2m) above the ground and
oriented for grazing incidence. Each microphone was covered with a 3-inch
windscreen.
Three of the direct read systems utilized a 100-foot cable connecting the
microphone system with a General Radio 1988 Precision Integrating Sound
Level Meter (PISLM). In each case, the slow response A-weighted sound
level was output to a graphic level recorder (GLR). The GLRs; operated at
a paper transport speed of 5 centimeters per minute (300 cm/hr). These
systems collected single event data consisting of maximum A-weighted Sound
Level (AL), Sound Exposure Level (SEL), integration time (T), and
equivalent sound level (LEQ).
The fourth microphone system was connected to a General Radio 1981B Sound
Level Meter. This meter, used at site 7H for static operations only,
provided A-weighted Sound Level values which were processed using a micro
sampling technique to determine LEQ.
All instruments were calibrated at the beginning and end of each test day
and approximately every hour in between. A schematic drawing of the basic
direct read system is shown in Figure 5.5.
31

a• x
-Ni = m.)
(D
M.0 M - 0L
00.
-4-Ii. 1- 0).
0 D r-
"L"-
i"Uu-c04
N. -0.
0
a 0
O0 0)
'N
32
-- - -

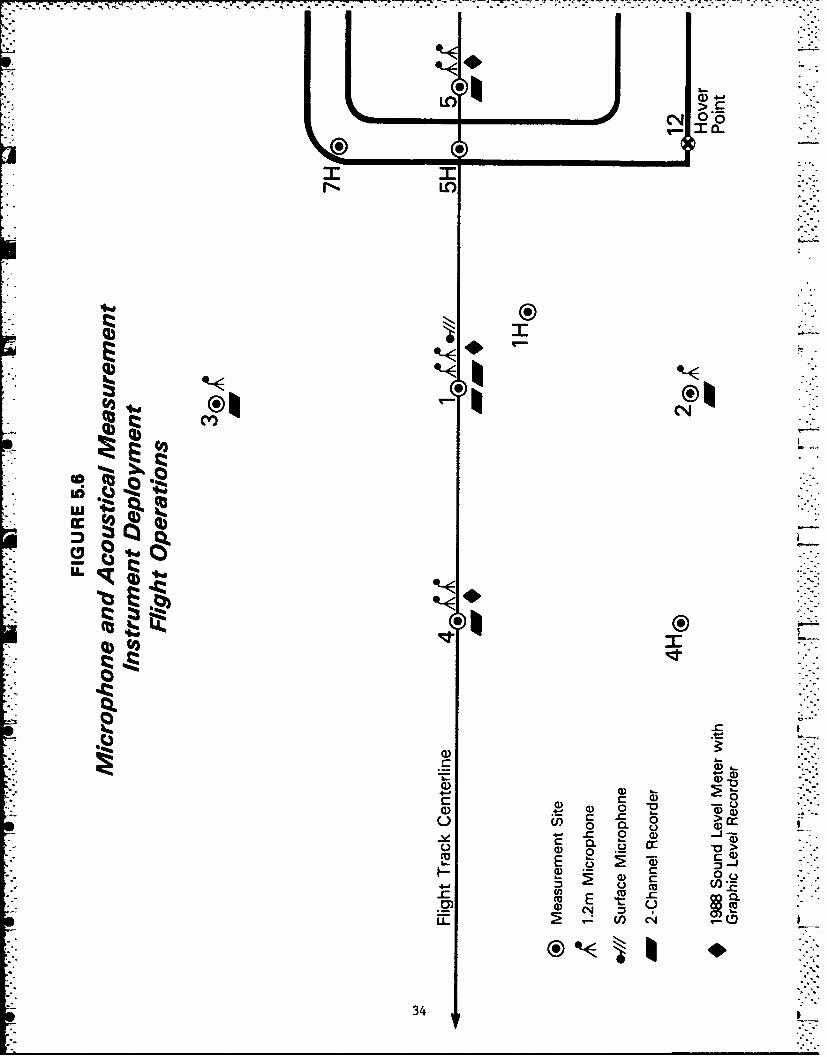
5.6.3 Deployment of Acoustical Measurement Instrumentation - This section
describes the deployment of the magnetic tape recording and direct read
noise measurement systems.
During the testing, TSC deployed six magnetic tape recording systems.
During the flight operations, four of these recording system were located
at the three centerline sites: one system at site 4, one at site 5, and
"two at centerline cente: with the microphone of one of those systems at 4
feet above ground, the microphone of the other at ground level. The two
remaining recording systems were located at the two sidelines sites. The
I'AA deployed three direct read systems at the three centerline sites
during the flight operations. Figure 5.6 provides a schematic drawing of
* the equipment deployment for the flight operations. The only exception to
this deployment scheme was the removal of personnel and equipment from
site 1 during test series 02.
In the case of static operations, only four of the six recorder systems
were used. The recorder system with the 4-foot microphone at site 1 moved
-. to site 1H. The recorders at sites 4 and 5 moved to 4H and 5H
respectively. The recorder at site 2, the south sideline site, was also
Sised. The three direct read systems were moved from the centerline sites
to sites 5H, 2, and 4H. The fourth direct read system was employed at
site 7H. Figure 5.7 provides a schematic diagram of the equipment
deployment for the static operations.
33
> -.
0~ '-Io
I Ic
to IZCY
4IuE*-
04) -
c c-0
-C 0)(~) c (I )0
() 0 A2 >
F- CD 0 0
E ME
34

U-t) 0
LO
(I)
(n -J
CD u
'Sm. I.35

*�.-�-�---. -.
N
I'

ACOUSTICAL DATA REDUCTION
6.0 Acoustical Data Reduction - This section describes the treatment of
tape recorded and direct read acoustical data from the point of
acquisition to point of entry into the data tables shown in the appendices
of this document.
6.1 TSC Magnetic Recording Data Reduction - The analog magnetic tape
recordings analyzed at the TSC facility in Cambridge, Massachusetts were
fed into magnetic disc storage after filtering and digitizing using the
GenRad 1921 one-third octave real-time analyzer. Figure 6.1 is a picture
of the TSC facility; Figure 6.2 provides a flow chart of the data
collection, reduction and out process accomplish by TSC personnel.
Recording system frequency response adjustments were applied, assuring
overall linearity of the recorc.•ng and reduction system. The stored 24,
one-third octave sound pressure levels (SPLs) for contiguous one-half
second integration periods making up each event comprise the base of "raw -
data." Data reduction followed the basic procedures defined in Federal
Aviation Regulation (FAR) Part 36 (Ref. 3). The following sections
describe the steps involved in arriving at final sound level values. ,. ,
FIGURE 6.1
37.9-

on xC4
0 0a L
~* 0
cma cA x
c~wo
0 t
M V
C4
Ck
Cc~ o 2O0 '7
v CL & NU,38
6.1.1 Ambient Noise - The ambient noise is considered to consist of both
the acoustical background noise and the electrical noise of the
measurement system. For each event, the ambient level was taken as the
five to ten-second time averaged one-third octave band taken immediately
prior to the event. The ambient noise was used to correct the measured
raw spectral data by subtracting the ambient level from the measured noise
levels on an energy basis. This subtraction yielded the corrected noise
level of the aircraft. The following execptions are noted:
1. At one-third octave frequencies of 630 Hz and below, if the
measured level was within 3 dB of the ambient level, the measured level
"was corrected by being set equal to the ambient. If the measured level
was less than the ambient level, the measured level was not corrected.
2. At one-third octave frequencies above 630 Hz, if the measured
level was within 3 dB or less of the ambient, the level was identified as
"masked."
6.1.2 Spectral Shaping - The raw spectral data, corrected for ambient
noise, were adjusted by sloping the spectrum shape at -2 dB per one-third
octave for those bands (above 1.25 kHz) where the signal to noise ratio
was less than 3 dB, i.e., "masked" bands. This procedure was applied in
cases involving no more than 9 "masked" one-third octave bands. The
shaping of the spectrum over this 9-band range was conducted to minimize
EPNL data loss. This spectral shaping methodology deviates from FAR-36
procedures in that the extrapolation includes four more bands than
normally allowed.
6.1.3 Analysis System Time Constant/Slow Response - The corrected raw
spectral data (contiguous linear 1/2 second records of data) were
39
processed using a sliding window or weighted running logarithmic averaging
procedure to achieve the "slow" dynamic response equivalent to the "slow
response" characteristic of sound level meters as required under the
provisions of FAR-36. The following relationship using four consecutive
data records was used:
0~~i3 .1L 2 oIL-1 0.1LL 10 Log (0.13(10.0ILi-3)0.21(10. i- )+0.27(10.°' i- )+0.39(10. i)]
where Li is the one-third octave band sound pressure level for the ith
• -one-half second record number.
6.1.4 Bandsharing of Tones - All calculations of PNLTM included testing
* for the presence of band sharing and adjustment in accordance with the
procedures defined in F.1-36, Appendix B, Section B 36.2.3.3, (Ref. 6).
6.1.5 Tone Corrections - Tone corrections were computed using the
helicopter acoustical spectrum from 24 Hz to 11,200 Hz, (bands 14 through
40). Tone correction values were computed for bands 17 through 40, the
same set of bands used in computing the EPNL and PNLT. The initiation of
the tone correction procedure at a lower frequency reflects recognition of
the strong low frequency tonal content of helicopter noise. This
procedure is in accordance with the requirements of ICAO Annex 16,
Appendix 4, paragraph 4.3. (Ref. 7)
6.1.6 Other Metrics - In addition to the EPNL/PNLT family of metrics and
* the SEL/AL family, the overall sound pressure level and 1O-dB down
* duration times are presented as part of the "As Measured" data set in
Appendix A. Two factors relating to the event time history (distance
duration and speed corrections, discussed in a later section) are also
presented.
40
. . .
L .°
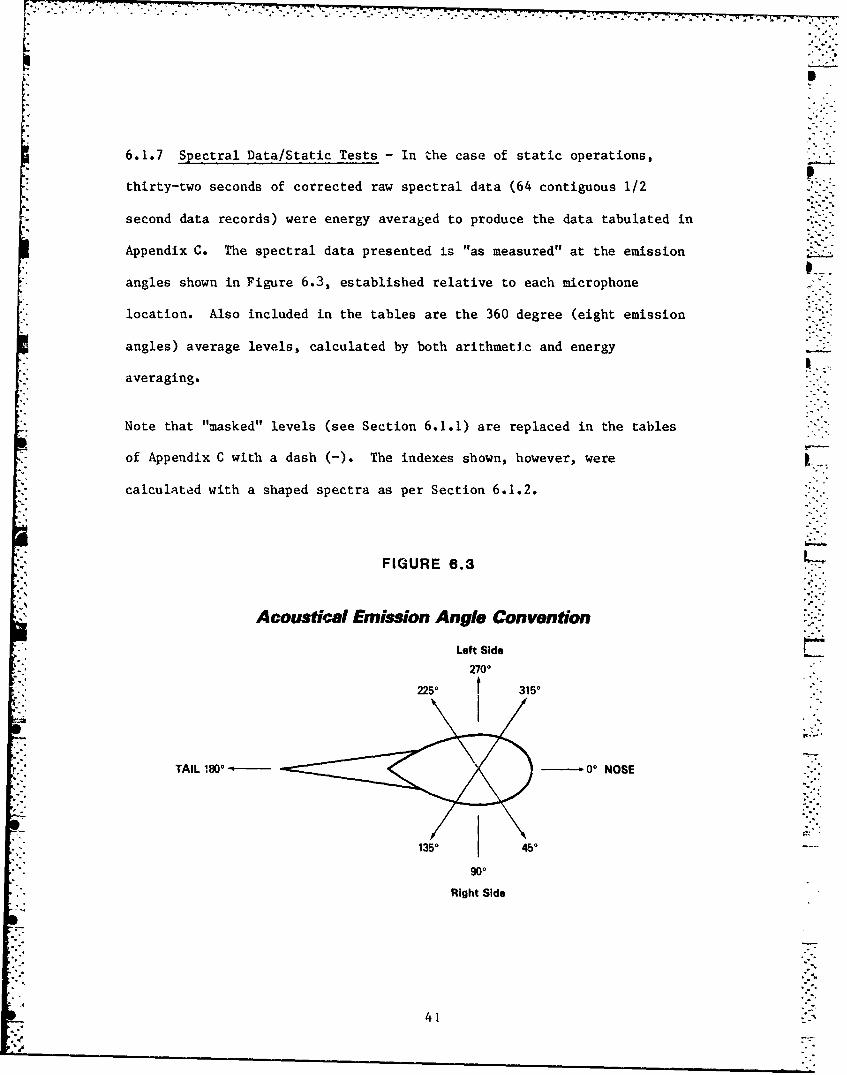
6.1.7 Spectral Data/Static Tests - In the case of static operations,
thirty-two seconds of corrected raw spectral data (64 contiguous 1/2
second data records) were energy averaged to produce the data tabulated in
Appendix C. The spectral data presented is "as measured" at the emission
angles shown in Figure 6.3, established relative to each microphone
location. Also included in the tables are the 360 degree (eight emission
angles) average levels, calculated by both arithmetic and energy "
averaging.
Note that "masked" levels (see Section 6.1.1) are replaced in the tables
of Appendix C with a dash (-). The indexes shown, however, were
"calculated with a shaped spectra as per Section 6.1.2.
FIGURE 6.3
..-
Acoustical Emission Angle Convention
Left Side
2700
2250 t 3150
TAIL 1800 -O NOSE
1350 45o
90o
Right Side
41
C-
CL C C
C6 1 !
0 0
0 E oLaEr I
>U 3. to
0( U.
oc
I.I*
42,
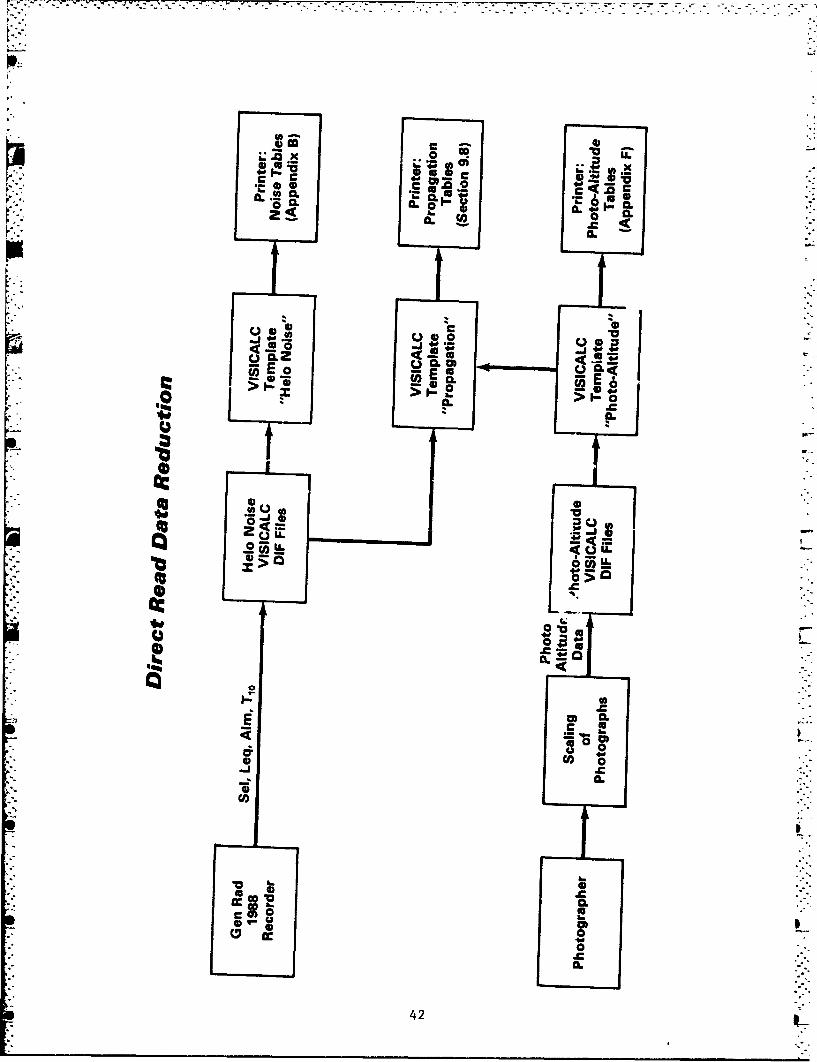
6.2 FAA Direct Read Data Reduction - Figure 6.4 provides a flow diagram
of the data collection, reduction and output process effected by FAA
personnel. FAA direct read data was reduced using the Apple lie
microcomputer and the VISICALOS software package. VISICAL0 is an
electronic worksheet composed of 256 x 256 rows and columns which can
support mathematical manipulation of the data placed anywhere on the
worksheet. This form of computer software lends itself
to a variety of data analyses, by means of constructing templates .
(worksheets constructed for specific purposes). Data files can be
constructed to contain a variety of information such as noise data and
position data using a file format called DIF (data interchange
format).
Data analysis can be performed by loading DIF files onto analysis--
templates. The output or results can be displayed in a format suitable
for inclusion in reports or presentations. Data tables generated using
these techniques are contained in Appendices B and D, and are discussed in
Section 9.0.
6.2.1 Aircraft Position and Trajectory - A VISICALOM DIF file was created
to contain the photo altitude data for each event of each test series for
the test conducted. These data were input into a VISICAL0M template
designed to perform a 3-point regression through the photo altitude data
from which estimates of aircraft altitudes could be determined for each
microphone location.
43
1.'
6.2.2 Direct Read Noise Data - Another template was designed to take two
VISICALC\ DIF files as input. The first contained the "as measured"
noise levels SEL and dBA obtained from the FAA direct read systems and the
1O-dB duration time obtained from the graphic level recorder for each of
the three microphone sites.
The second consisted of the estimates of aircraft altitude over three
microphone sites. Calculations using the two input files determined two
figures of merit related to the event duration influences on the SEL -'
energy dose metric. This analysis is described in Section 9.4. All of
the available template output data are presented in Appendix B.
44-- .4.
°.1
S44L

TEST SERIES DESCRIPTION
7.0 Test Series Description - The noise-flight test operations schedule
for the Sikorsky S-76A consisted of two major parts.
The first part or core test program included the ICAO certification test
operations (takeoff. approach, and level flyover) supplemented by level
flyovers at various altitudes (at a constant airspeed) and at various
airspeeds (at a constant altitude). In addition to the ICAO takeoff
operation, a second, direct climb takeoff flight series was included.
Alternative approach operations were also included, utilizing nine and
twelve degree approach angles to compare with the six degree ICAO approach
data.
The second part of the test program consisted of static operations
designed to assess helicopter directivity patterns and examine
ground-to-ground propagation.
The information presented in Table 7.1 describes the Hughes 500D test
schedule by test series, each test series representing a group of similar
events. Each noise event is identified by a letter prefix, corresponding
to the appropriate test series, followed by a number which represents the
numerical sequence of event (i.e., Al, A2, A3, A4, B5, B6,...etc.). In
some cases the actual order of test series may not follow alphabetically,
as a Dl, D2, D3, D4, ES, E6, E8, H9, H10, H111:... etc.). In the case of
static operations the individual events are reported by the acoustical
emission angle referenced to each individual microphone location (i.e.,
J120, J165, J210, J255, J300, J345, J030, J75). In Table 7.1, the test
target operational parameters for each series are specified along with
approximate start and stop times. These times can be used to reference
45

corresponding meteorological data in Appendix G. Timing of fuel breaks
are also identified so that the reader can estimate changes in helicopter
weight with fuel burn-off. Actual operational parameters and position
information for specific events are specified in the appendices of this
document.
Operations requiring a more detailed description are detailed below.
Test Series H: Identified by the manufacturer as a "Category B Takeoff"
(see Code of Federal Regulations 14, Part 29), carried out in accordance
with the following protocol:
Rotor RPM: 100%
Torque: 100%
Initial condition: Zero knots, hover-in-ground effect (5 feet above
ground level), 700 meters before CLC.
Phase 1: Accelerate to 45 knots, climbing out
Phase 2: Upon reaching a marker 500 meters prior to CLC, achieve a rate
*. of ascent of 1350 feet per minute maintaining 52 knots.
Test Series J: Identified by the manufacturer as "Takeoff with a turn",
involved identical operation conditions as test series F (the ICAO takeoff
operation) except with a 90 degree turn initiated directly over the
centerline microphone location at CLC. The turn was to achieve a 20
degree bank angle with a continued climbout in the direction of sideline
microphone number 3, extending well beyond that site.
Test Series 0-1 (oh-one): Identified as "Quiet takeoff from centerline
center (CLC)." This operation involved an initial 1-foot hover over CLC,
46
the application of power, achieving 15 to 20% torque, accelerating to 15
feet, achieving translational lift, then acquiring the best rate of
climb.
TeSL Series 0-2 (oh-two): Not to be confused with molecular oxygen, this
test series was identified as a "Quiet Approach Operation"and conducted as
a landing approach to the CLC microphone location, site 1. This test
series was characterized by the following flight path parameters:
1. 2000 feet prior to CLC: 200 feet above ground level (AGL), 70 knots
2. 1000 feet prior to CLC: 100 feet AGL, 50 knots
3. 500 feet prior to CLC: 50 feet AGL, 30 knots
4. CLC site: terminate operation at a low hover
The noise measurement personnel and equipment were removed from site 1
prior to this test series
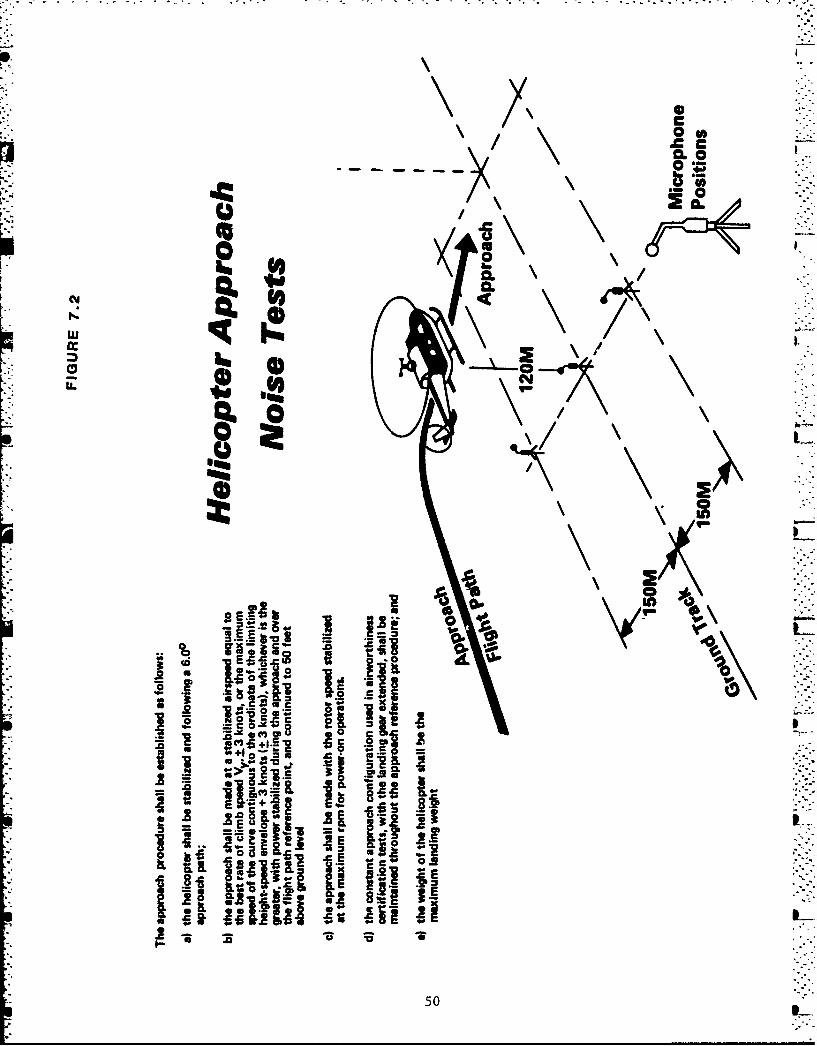
Figures 7.1, 7.2, and 7.3 present the test flight configurations for the
takeoff, approach and level flyover operations. A schematic of the actual
ground track in relation to measurement sites is shown in Figure 3.3.
47

TABLE 7.1
TEST SU4MARY
SIKORSKY S-76A
Test Series Description Start Finish
And Run Nurbers Of Series Time Time
A/A1-A6 LFO, 500', Vne 6:06 am 6:20 am
B/B7-B13 LMO, 500', 0.9 Vne 6:23 6:37
C/C14-C18 LFO, 500', 0.8 Vne 6:40 7:00
D/D19-D23 LFO, 500', 0.7 Vne 7:06 7:16
E/E24-E28 LFO, 1000', Vne 7:27 7:38
F/F29-F36 ICAO Takeoff 7:46 8:07FUEL BRaEAK
G/G37-G43 3 Deg App, 74 kts 8:59 9:25
HA144-H49 Category B Takeoff 9:42 9:56
1/150-155 6 Deg App, 74 kts 10:02 10:25
J/J56-J60 Takeoff with Turn 10:31 10:50
K/K61-K66 9 Deg App, 74 kts 10:54 11:10FUEL BREAK
L HIGE 11:47 12:00
M Flt Idle/Gnd Idle 12:02 pm 12:19 pmBREAK
01 Quiet Takeoff 12:43 1:03
02 Quiet Approach 12:46 1:06
48T•::- 7.

S,'4,
c
0.
/
--- -- • --• \-_
CI
I-. 1 ,/\ \,
00
-4 c
S cc0.0 ! W S.-S
- *-" , q .oo9/'
o - . -•o '
.. -O 'a.. • m
- . c, 5 o .. . 00 - I .- =
. -. 5 ca.9 , • j ..
49
,°2 o
c0
C36U
UY 0
0.
inS
cC
I 21-. 90~ e.
I 50

A !CL
\ 0-
so V
I. - - "
U-4
shmm /
-.. b= I 8"... .. ; *0. 0o* 4',
+" -w-+'' -+ i+. - '• +++:- + +-: - .+ a,_ ;+.
F CL
czi E 1 * '
St.. E-2 E -0
>1 >
51
DOCUMENTARY ANALYSES
8.0 Documentary Analyses/Processing of Trajectory and Meteorological
"Data - This section contains analyses which were performed to document the
flight path trajectory and upper air meteorological characteristics during
the Sikorsky S-76A test program.
8.1 Photo-Altitude Flight Path Trajectory Analyses - Data acquired from
the three centerline photo-altitude sites were processed on an Apple Ile
microcomputer using a VISICALC\ (manufacturer) electronic spreadsheet
template developed by the authors for this specific application. The
scaled photo-altitudes for each event (from all three photo sites) were
entered as a single data set. The template operated on these data,
calculating the straight line slope in degrees between the helicopter
position over each pair of sites. In addition, a linear regression
analysis was performed in order to create a straight line approximation to
the actual flight path. This regression line was then used to compute
estimated altitudes and CPA's (Closest Point of Approach) referenced to
each microphone location (Note: Photo sites were offset from microphone
sites by 100 feet). The results of this analysis are contained in the
tables of Appendix F.
Discussion - While the photo-altitude data do provide a reasonable
description of the helicopter trajectory and provide the means to effect
distance corrections to a reference flight path (not implemented in this
report), there is the need to exercise caution in interpretation of the
data. The following excerpt makes an important point for those trying to
relate the descent profiles (in approach test series) to resulting
acoustical data.
53 I-
In our experience, attempts by the pilot to fly down a very narrowVASI beam produce a continuously varying rate of descent. Thus whilethe mean flight path is maintained within a reasonable degree of testprecision, the rate of descent (important parameter connected withblade/vortex interactions) at any instant in time may vary much more
than during operational flying. (Ref. 8)
Further, care is necessary when using the regression slope and the
regression estimated altitudes; one must be sure that the site-to-site
slopes are similiar (approximate' constant angle) and that they are in
agreement with the regression slope. If these slopes are not in
agreement, then use photo altitude data along with the site-to-site slopes
in calculating altitude over microphone locations. Also included for
reference are the mean values and standard deviations for the data L
collected at each site, for each series. These data display the
variability in helicopter position within a given test series.
54
IL"r- . -- .,-.- . ..-
"2.% .
8,2 Meteorological Data This section documents meteorological conditionsincluding the coarse variation in upper air meteorological parameters as a
function of time for the June 13 test program.
The National Weather Service office in Sterling, Virginia prGvided
preliminary data processing resulting in the data tables shown in Appendix
H. Supplementary analyses were then undertaken to develop time histories
of various parameters over the period of testing for selected altitides.
Each time history was constructed using least square linear regression
techniques for the five available data points (one for each launch). The
plots attempt to represent the gross (macro) meteorological trends over
the test period. Paragraphs below point out some of the more salient
features of each plot. E
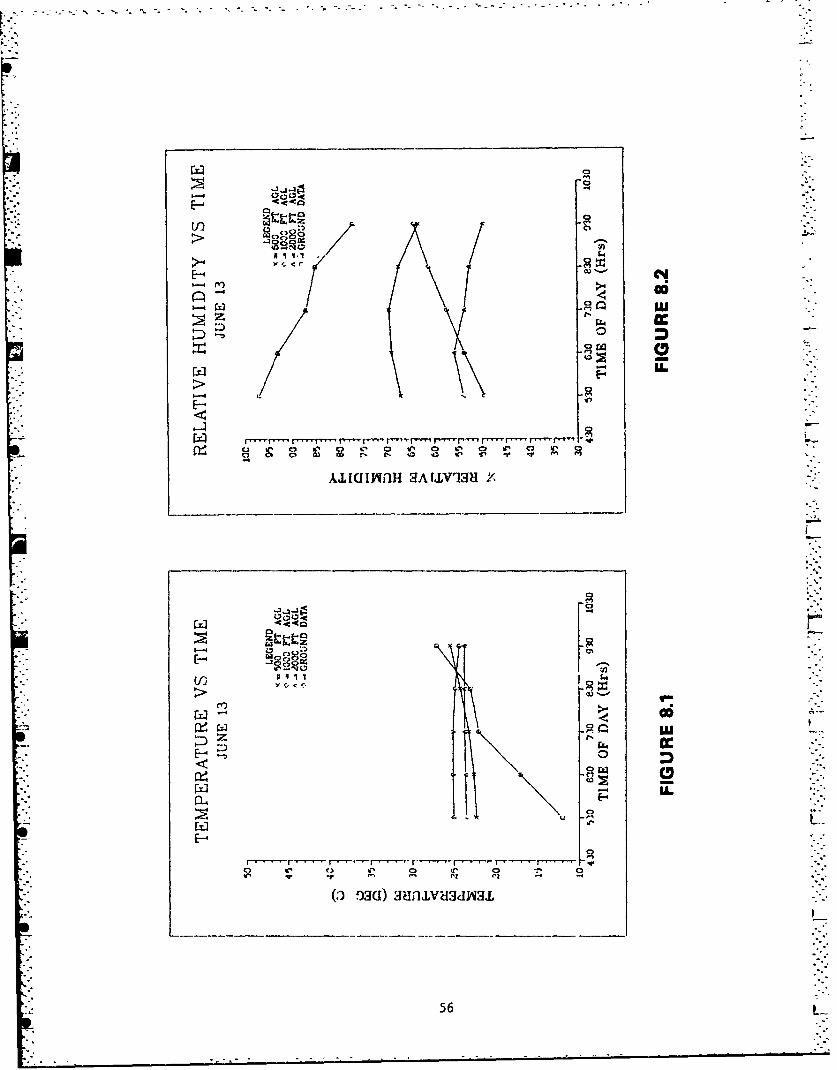
Temperature -Figure 8.1 shows the time history of temperature (oc) for'I-.:
June 13, 1983. It can be seen from the figure that a temperature
inversion existed between the ground and the 500 foot level between 5:30
and 9:30 a.m., concurrent with the level flyover, takeoff and approach
operations of this test. After 9:30 a.m., the inversion layer is seen to
have dispersed, evidently due to solar heating of the earth's surface. At
this time one observes a normal lapse rate of 1.5 to 2 C/1000 ft.
Static operations were conducted between 11:47 a.m. to 12:20 pm., with
add!.ional takeoff/approacA operations conducted between 12:43 and 1:06
p.m. Surface meteorological readings provided by the National Weather
Service (Dulles International Airport) are available (see Apendix H) for
analyses in connection with these operations.
55
1-4c o
"i¶ It L4~f
EII- vw
(Z4
ci 0 0 1., 0 0 0 O
XlalAUIJfH RALLVISH Y,
Y- C, C a.
LU
I~ wL
Ina auuag
56

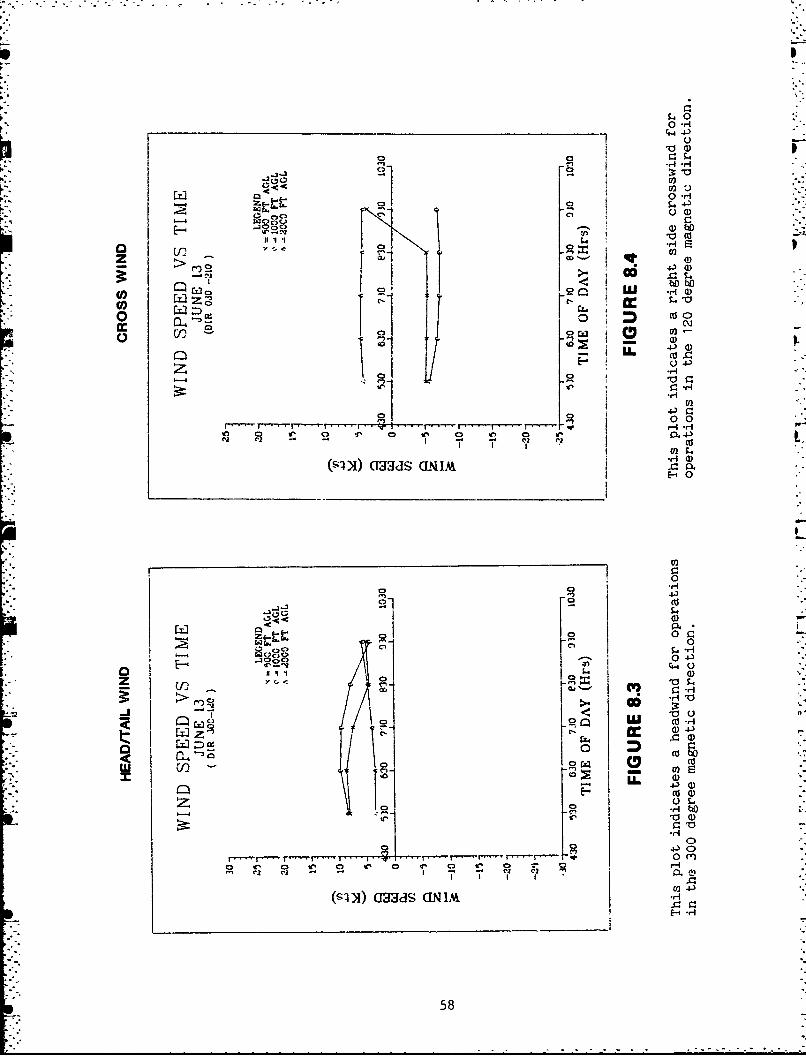
Discussion - In the context of a noise measurement/flight test one
attempts to avoid so-called anomalous meteorological conditions, (see ref.
3) a concept that is difficult to define., Although the reasons behind the
requirement to avoid "anomalous conditions" arose from concerns involved
with atmospheric absorption, one might extend the requirement to include
concerns for smooth flight, and normal attitudinal operation of the
helicopter. While extreme cross wind componentu and/or strong shifts in
wind in the vicinity of the test site might suggest the presence of
buffeting or turbulance, it is primarily the pilot's reported ease or
difficulty in flying the helicopter which identifies a potential problem.
While the data do suggest the presence of some variation in wind speed and
direction, they do not connote an extreme condition which miiht lead to
concern.
As a final note, the influence of wind on blade-vortex interactions
(considered a sensitive function) cannot be properly addressed using the
data presented in this section. Rather, it is necessary to acquire
detailed (time coded) data virtually concurrent with the flight operations
and in very close proximity to the test helicopter. It is anticipated
that future tests will employ tethered ballon systems or an acoustical
sounding (SODAR) device deployed in close proximity to the test area.
57"IL "
0 ri
I 22
0 rl
o 0 0
ou b-4o' 1*c E 0- 010
o L Ci- rz
LLU . caCIE- 4-
0 00
E-0
0 0
E- Any <
':2.
0) W
0 Cf' r)
r4.3-- -r r 01 m~w 0
ol V I el e
I I r
(S0 41 O S N
r'r' fl'0 58

Relative Humidity - Figure 8.2 shows the relative humidity (%) as a func-
"tion of time for June 13, 1983. From the figure it is seen that the
surface moisture decreases with time as expected with solar heating of the
earth's surface. Attention is directed to the high relative humidity
corresponding to the period of the temperature inversion. At 9:30 a.m.
the relative humidity at the ground level is 20 to 25% higher than at the
500 foot level. From additional meteorological data provided by the
National Weather Service, we see that by noon the surface relative
humidity had decreased from 78% to 59%. The emphasis in examing relative
humidity is in establishing atmospheric absorption coefficients for
eventual correction of noise levels. An interesting trend is observed in
ARP-866A concerning the test atmospheric absorption. For temperatures
"greater than 50 F and himidity greater than 5%, there is virtually no
change in absorption with variation in relative humidity at frequencies
below 630 Hz, typically dominant in rotorcraft spectra.
F
Wind- Figures 8.3 and 8.4 show the head/tail and cross wind components of
the wind vector as a function of time for June 13. Figure 8.3 shows that
head/tail winds of 7 knots were present at the 500 foot level, influending
level flyover, takeoff and approach operations conducted during this time.
See Appendix F, the cockpit data, to identify direction of travel.
Additional meteorological data show that ground winds were about 7 knots
up to 12 noon. Figure 8.4 also shows that up to the 1000 foot level, the
magnitude of the crosswind was about 7 knots. This information shows that
generally consistent wind conditions existed during the test period.
Further, there were no pilot reports of turbulence or difficulty in
managing flight controls.
59--------------------------- -........

- -•
o EXPLORATORY ANALYSES AND DISCUSSIONS
9.0 Exploratory Analyses and Discussion - This section is comprised of a
series of distinct and separate analyses of the data acquired with the
"Sikorsky S-76 test helicopter. In each analysis section an introductory
discussion is provided describing pre-processing of data (beyond the basic
reduction previously described), followed by presentation of either a data
table, graph(s), or ieference to appropriate appendices. Each section
concludes with a discussion cf salient results and presentation of
conclusions.
The following list identifies the analyses which are contaihed in this
section.
9.1 Variation in noise levels with airspeedi for level flyover
operations
9.2 Static data analysis: source directivity and hard vs. soft
propagation characteristics
9.3 Duration effect analysis
9.4 Analysis of variability in noise levels for two sites
equidistant over similar propagation paths
9.5 Variation in noise levels with airspeed and rate of descent for
approach operations
9.6 Analysis of ground-to-ground acoustical propagation for a
nominally soft propagation path
9.7 Air-to-ground acoustical propagation analysis
61
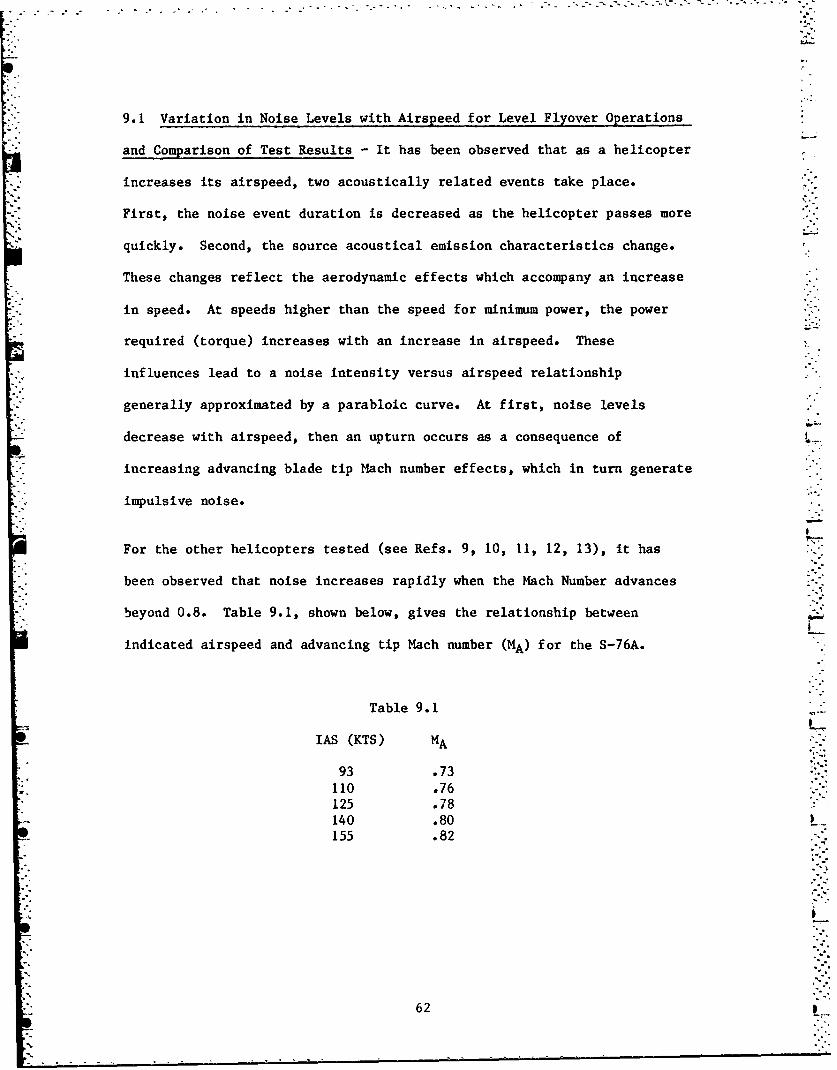
S. o , - °. , ° . . . -•• , .. . • -•- - • . . . o "- - " "- ' •- • - '' .''" . • .'' -- -. - - ° ¸
9.1 Variation in Noise Levels with Airspeed for Level Flyover Operations
and Comparison of Test Results - It has been observed that as a helicopter
increases its airspeed, two acoustically related events take place.
First, the noise event duration is decreased as the helicopter passes more
quickly. Second, the source acoustical emission characteristics change.
These changes reflect the aerodynamic effects which accompany an increase
in speed. At speeds higher than the speed for minimum power, the power
required (torque) increases with an increase in airspeed. These
influences lead to a noise intensity versus airspeed relati3nship
generally approximated by a parabloic curve. At first, noise levels
decrease with airspeed, then an upturn occurs as a consequence of V-
increasing advancing blade tip Mach number effects, which in turn generate
"Z' impulsive noise.
For the other helicopters tested (see Refs. 9, 10, ii, 12, 13), it has
been observed that noise increases rapidly when the Mach Number advances
"beyond 0.8. Table 9.1, shown below, gives the relationship between
indicated airspeed and advancing tip Mach number (MA) for the S-76A.
Table 9.1
IAS (KTS) MA
93 .73110 .76125 .78140 .80155 .82
"62
- • . -

The noise versus airspeed plots for the Sikorsky S-/6A are shown for two
acoustical metrics in Figures 9.1 and 9.2. Each of these plots displays
the expected parabolic nature, reflecting the influence of the noise
versus airspeed relationship discussed above.
This section also contains a comparison of the subject noise data with
sound levels acquired in two other tests of the Sikorsky S-76A, one an FAA
test (Ref. 14) conducted in 1980 at the FAA Technical Center, the other a
Joint Helicopter Association International (HAI) / FAA test conducted in
1984 at Dulles International Airport. Salient features of each test are
identified in the paragraphs below.
1980 Magnetic Recording Data - The 1980 magnetic recording noise data used
in the comparison were "fully corrected", that is adjusted for test flight
path divergence from the reference flight path, (using photo-theodolite
data) and test atmospheric absorption divergence from corresponding
reference values. The 1980 3-microphone average noise levels were plotted
verses corresponding average indicated airspeed values (attained from
cockpit photos).
1980 Direct Read Data - The 1980 direct read Precision Integrating Sound
Level Meter (PISLM) data were not corrected. One may however consider the
absence of corrections as inconsequential as the magnetic recording data
corrections were very very small. The plotted data point represents the
average value for a single centerline microphone.
63
".............................................
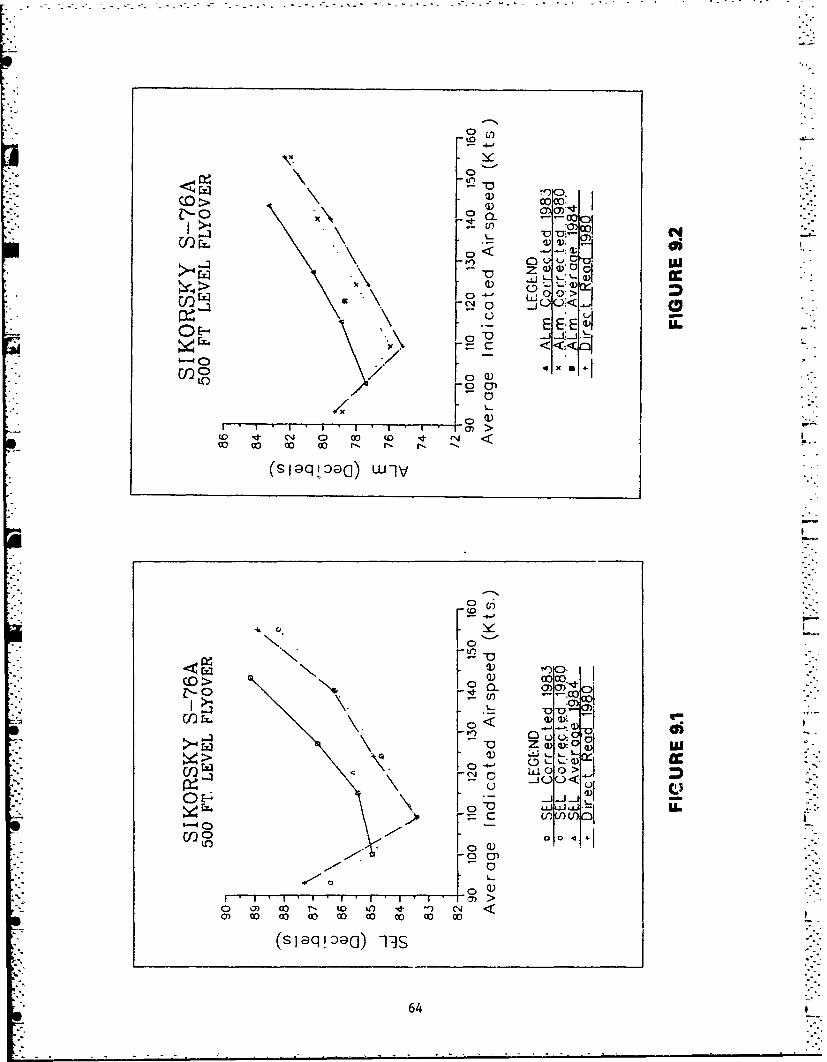
00
00
0 <-0 L)L CD
'*E~ E. E LL
U)0
/
11 't c'J 0 00 (D C <00 00 00 co 1* Ný i*- -
> .0)W r-00
""0 F 004+1
U) IL >
64

1983 Magnetic Recording Data - The magnetic recording data from the 1983
program (contained in appendicies of this report) was averaged for each
test series and then position corrected using information acquired from
the photo-altitude systems. In each case the mean noise level for a given
test series was corrected using the corresponding mean altitude. The
resulting corrected noise levels for each of the three microphones were
averaged and the aggregate mean value was plotted verses the corresponding
mean indicated airspeed gleaned from cockpit photographs. The propagation
constant (KP(A)=25) used in the correction process was determined in
section 9.7 of this document.
1984 Direct Read Data - The 1984 direct read data were acquired from a
single direct read PISIM system and for a single airspeed and are
uncorrected, although as observed above, corrections are typically very
smal for the 500 foot level flyover operation. The data point
representing this data set is the mean value for a set of 12 events.
GTable 9.2, below, identifies other pertinent flight test information.
Comparison of 1980 and 1983 500 Ft Level Flyover Results - The data
plotted in Figure 9.1 and 9.2 have been processed as described above.
While further statistical processing (analysis of variance and analysis of
covariance) would be appropriate in a comprehensive repeatability analysis
(subject of a future study) one can see a very definite and consistent
differential of approximately 2 dB between the 1980 results and the
results acquired in 1983.
6
65 .- •
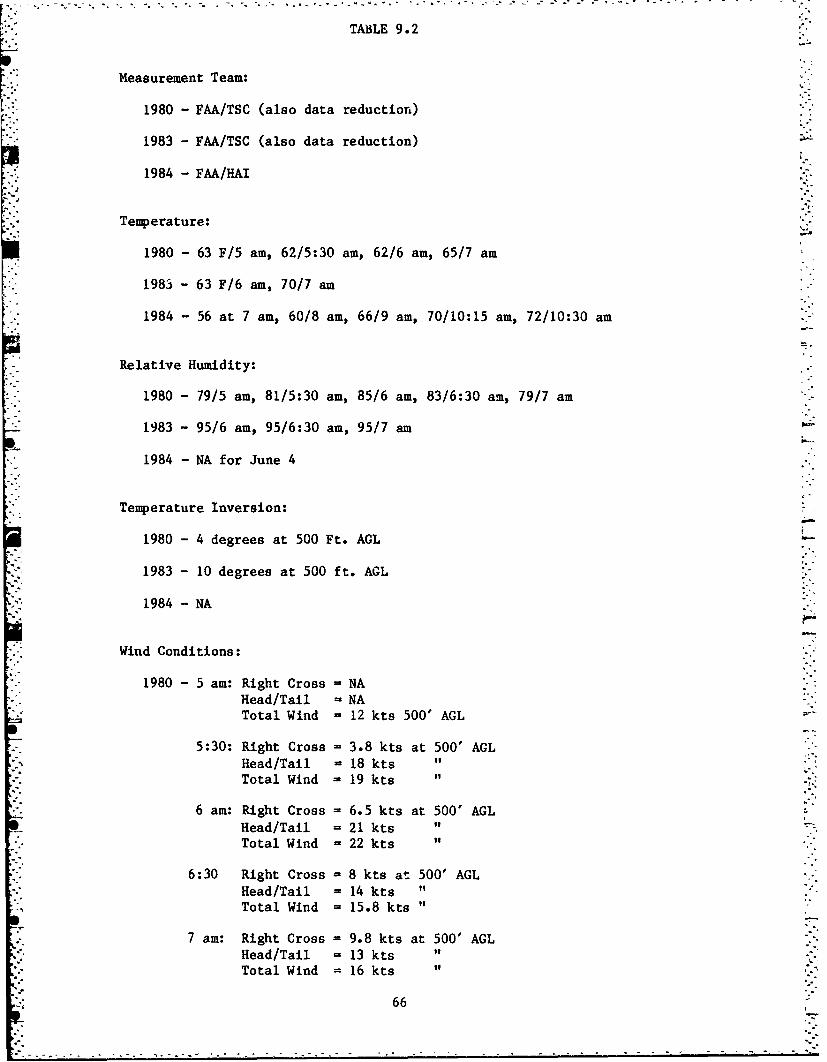
TABLE 9.2
Measurement Team:
1980 -FAA/TSC (also data reduction)
1983 -FAA/TSC (also data reduction) -.
1984 - FAA/HAI
Temperature:
1980 - 63 F/5 am, 62/5:30 am, 62/6 am, 65/7 am
1983 - 63 F/6 am, 70/7 am
1984 - 56 at 7 am, 60/8 am, 66/9 am, 70/10:15 am, 72/10:30 am
Relative Humidity:
1980 - 79/5 am, 81/5:30 am, 85/6 am, 83/6:30 am, 79/7 am
1983 - 95/6 am, 95/6:30 am, 95/7 am
1984 - NA for June 4
Temperature Inversion:
1980 -4 degrees at 500 Ft. AGL
1983 - 10 degrees at 500 ft. AGL
1984 - NA
Wind Conditions:
1980 - 5 am: Right Cross = NAHead/Tail - NATotal Wind - 12 kts 500' AGL
5:30: Right Cross = 3.8 kts at 500' AGLHead/Tail - 18 kts "Total Wind - 19 kts
6 am: Right Cross = 6.5 kts at 500' AGLHead/Tail - 21 ktsTotal Wind = 22 kts
6:30 Right Cross = 8 kts at 500' AGLHead/Tail = 14 ktsTotal Wind = 15.8 kts "
7 am: Right Cross = 9.8 kts at 500' AGLHead/Tail = 13 ktsTotal Wind = 16 kts
"66

1983 - 6:30 am: 300-120 degree heading - 8 kts at 500 AGL030-210 degree heading = -5 kts "
7:30 am: 300-120 degree heading = 7 kts at 500 AGL030-210 degree heading = -5 kts "
Rotor RPM:
1980 - 100%
1983 - 100%
1984 - 100%
Helicopter History/Maintenance Cycle:
1980 - Helicopter provided by Sikorsky Helicopter, belonging toSikorsky Chief Executive Officer.
1983 - Helicopter provided by FAA Rotorcraft Program Office,involved in a broad range of FAA flight test activities.Same pilot participating in the 1980 test.
1984 - Helicopter provided by Sikorsky Aircraft, Sikorsky pilots,executive demonstrator.
67
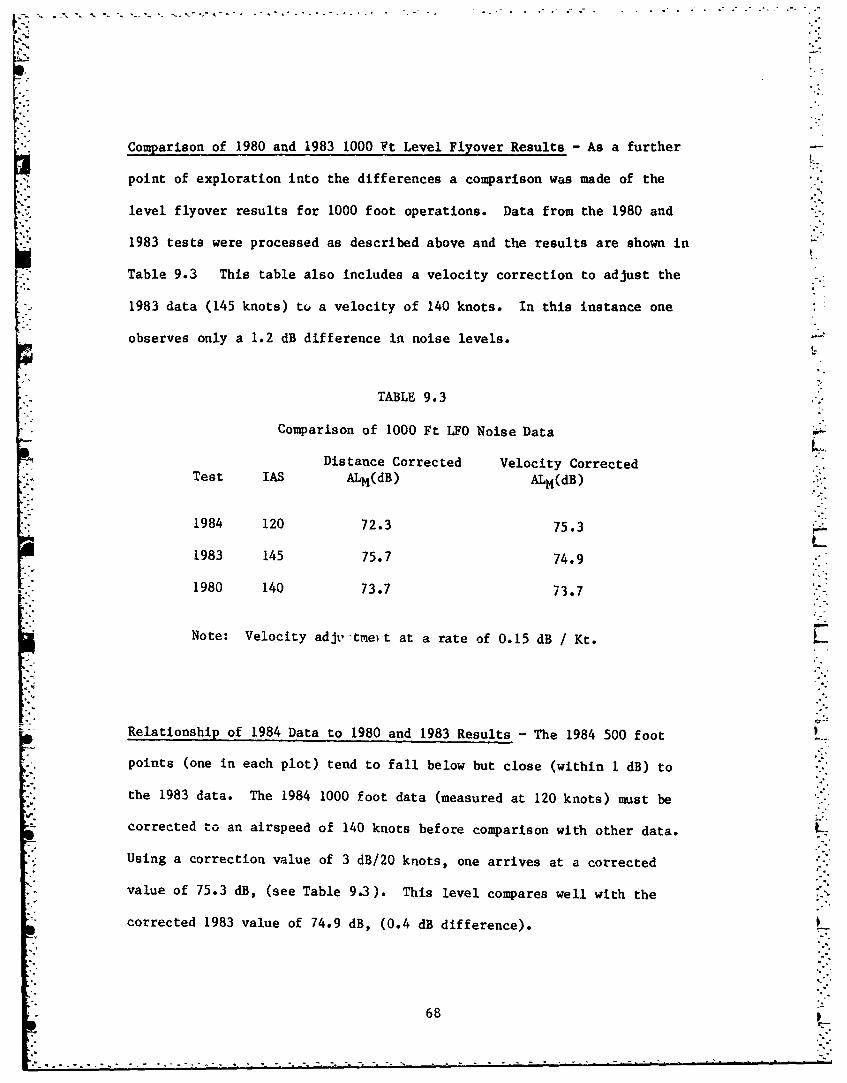
1.%.
"Comparison of 1980 and 1983 1000 Ft Level Flyover Results - As a further
point of exploration into the differences a comparison was made of the
level flyover results for 1000 foot operations. Data from the 1980 and
1983 tests were processed as described above and the results are shown in
Table 9.3 This table also includes a velocity correction to adjust the
1983 data (145 knots) to a velocity of 140 knots. In this instance one
observes only a 1.2 dB difference in noise levels.
TABLE 9.3
Comparison of 1000 Ft LFO Noise Data
Distance Corrected Velocity CorrectedTest IAS ALM(dB) ALM(dB)
1984 120 72.3 75.3-
1983 145 75.7 74.9
1980 140 73.7 73.7
Note: Velocity adjt,'-tmet at a rate of 0.15 dB / Kt. .
Relationship of 1984 Data to 1980 and 1983 Results - The 1984 500 foot
points (one in each plot) tend to fall below but close (within 1 dB) to
"the 1983 data. The 1984 1000 foot data (measured at 120 knots) must be
corrected to an airspeed of 140 knots before comparison with other data. L
Using a correction value of 3 dB/20 knots, one arrives at a corrected
*" value of 75.3 dB, (see Table 9.3). This level compares well with the
corrected 1983 value of 74.9 dB, (0.4 dB difference).
68
- - - - -' .-- ----------

The reversal in relative loudness-1983 higher than 1984 at 500 feet with
Vte opposite prevailing at 1000 feet--is 1'elieved to be a result of a
higher attenuation rate during the 1983 test program as shown in Table
9.4. The diminution of the difference between the 1983 and 1980 results
is believed to arise from ths same effect. A more thorough treatment of
propagation is provided in Section 9.8 of this report. All things
considered, the 1984 results tend to agree well with the 1983 data, as the
graphs in Figures 9.1 and 9.2 show. Our attention therefore becomes
directed to further exploration of differences between 1983 and 1980
results.
Table 9.4
Empirica. Propagation Constants (AL)
1984 1980 1983(120 kts) (140 kts) (145 kts)
K 21.3 25.4 22.3
Note: See Section 9.7 for furtherdiscussion of propagation
Discussion
Examination of the factors outlined above does not lead one to any
immediate, explanation for the 2 dB differences observed between 1980 and
1983 results.
It can be speculated that the source of disparity may be any one of the
factors listed below:
69
- - . . . .- - - -

1) tra., and balance of the rotor system
2) mai•tenance condition of the helicopter
3) "intrinsic" differences between differt models of the same helicopter
type
It is not thought that "anomolous" atmospheric conditions can be cited as
the cause, considering the reported stable meteorological data, the rather
short slant distance3 involved (500 feet), the consistent differences over
ýar time of testir- ac each different airspeed, and the internal
ccnsistencey (small variability) within each data set.
At Lne present time a Helicopter Noise Measurement Reveatability Program
is being conductea by The International Civil Aviation Organization
"(ICAO). This program involves eight to ten different national measurement
teams conducting noise rests on the same helicopter model, a Bell 206-L3.
In the process of analyzing results of that program a more extensive
analysis of these disparate S-76A results will be conducted.
TO-
70.

9.2 .Static Operations: Analysis of Source Directivity and Hard vs. Soft
Path Propagation Characteristics - This analysis is comprised of two
principal components. First, the plots shown in Figures f.3 and 9.4
depict: the time averaged directivity patterns for various static
operations for measurement sites located equidistant from the hover point.
The second component involves the fact that one of the two sites lies
separated from the hover point by a hard concrete surface, while the other
site is separated from the hover point by a soft grassy surface. The
difference in the propagation of s ind over the two disparate surfaces is
reflected in the difference between the upper and lower curves in each
plot. Figure 9.5 depicts the microphone positions and hard and soft paths
-in relation to the helicopter movement.
Time averaged (approximately 60 seconds) data are shown for anoustical
emission directivity angles (see Figure 6.1) established every 45 degrees
from the nose of the helicrpter (zero degrees), in a clockwise fashion.
Magnetic recording data plotted in these figuras can be found in Appendix
C for microphones 5H and 2.
Discussion -The plots coatained in this analysis dramatically portray the
directive nature of the S-76A acoustical radiation pattern for static
operations.
Key points of interest include:
1. On the average the Ground Idle (GI) operation provides a 1OdB
benefit relative to the Flight Idle (FI) operat 4 on. The reduced
RP4, GI mode epitomi',es the concept of "Fly Neighborly" ard is to
be recommended for use in sensitive areas.
71
-------------------------------------------------------

85 SKR SKIS77- SIKORSKY S-76'• : HIGE Fi-H I *5 .S&-SYS.7• ~AR e3 ", PA'TH" A? 7•, 3. F--.•O E ...
79- 69 HARb PATH.? . . . . . " E 67
AA AL L ,
7s ," * -. . . . ' .:, . "' - S _ • . ,' , "
:71--V .i , .. . .,, .: . • 61 - ... . : '. -÷ -U • .1 .-s. >3T ' . . . . D • "" . . . . .69 SOFT PATH ' SOFT PATH67-- , . I .3 -
* 5 ...... 4..... .... .-. *-.f ~......... ........... I .....8 98 I88 278 AVG 8 98 188 278 AVG
EMIStION BIRECTIVITY AHGLE EMIISSIOH DIRECTIVITY AHGLE
FIGURE 9.3 FIGURE 9.4
Flight Idle (FI) - Noise data for the Flat-Pitch Flight Idle (FI)
operation are shown in Figure 9.4. Again we observe the left sided
dominance of the acoustic radiation pattern. Identification of the
emission ar[gle where maximum noise levels occur is impossible because of
the missing data nevertheless the general trends of the data are provided
for the reader. On the average maximum differences between hard and soft
sites are about 6 to 9 dB.
In each case discussed below, observations concerning noise impact and
acceptability are based on consideration of typical urban/community
mbient noise levels and the levels of urban transportaLion noise sources.
In general, the interpretation of environmental impact requires careful
consideration of the ambient sound levels in the vicinity of the apecific
heliport under consideration.
72

lift 00
LI
II
(A I
0)0
0//
V'3.
* = 73

2. The soft path propagation scenario provides, on the average, a
4dB reduction in noise levels relative to the hard path scenario.
Clearly there exists a significant advantage in situating
heliports in locations where noise sensitive areas are separated
from the heliport by an acoustically absorbent surface such as
grass.
3. In all three static operational modes, the nose af the helicopter
presents the minimum radiation of acoustical energy. Positioning
the nose toward the most noise sensitive community locations is
clearly to be recommended.
4. The spacial maxima of the noise radiation pattern for each mode
of operations follow: HIGE/leftrear quadrant, FI/rightrear
quadrant, GI/both rear quadrants.
Hover-In-Ground-Effect (HIGE) - Data for the Hover-In-Ground-Effect (HIGE)
operation are shown in Figure 9.3. The discontinuties in the plot are a
result of missing data at the 90' emission angle for site #2. The S-76
displays an acoustical radiation pattern that tends to be most prominent" on the left side of the aircraft (tail rotor side), with the maximum noise
occuring at the 180' emission angle corresponding to the tail and engine
exhaust port. The maximum difference between noise levels propagated
across hard and soft paths is seen to occur at the 270' emission angle
"(left side of the aircraft) and is about 9 dB. This left s*de dominance is
possibly due to a combination of main rotor vortex interaction with the
tail rotor.
74
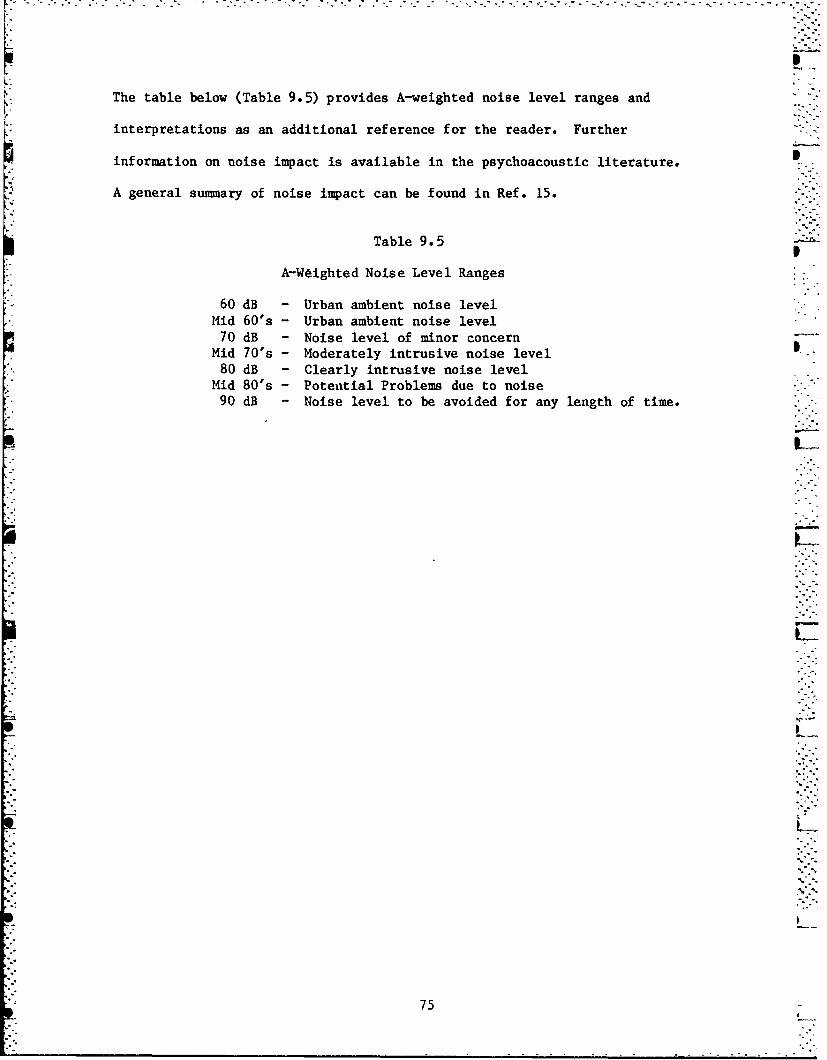
The table below (Table 9.5) provides A-weighted noise level ranges and
interpretations as an additional reference for the reader. Further
,. information on noise impact is available in the psychoacoustic literature.
"A general summary of noise impact can be found in Ref. 15.
Table 9.5
A-Weighted Noise Level Ranges
60 dB - Urban ambient noise levelMid 60's - Urban ambient noise level
70 dB - Noise level of minor concernMid 70's - Moderately intrusive noise level
80 dB - Clearly intrusive noise levelMid 80's - Potential Problems due to noise %
90 dB - Noise level to be avoided for any length of time.
-.
E
75
:0
9.3 Analysis of Duration Effects - This section consists of three parts,
each developing relationships and insights useful in adjusting from one
acoustical metric to another (typically from a maximum level to an energy
dose). Each section quantitatively addresses the influence of the event
duration.
9.3.1 Relationships Between SEL, AL and T-1O - This analysis explores the
relationship between the helicopter noise event (intensity) time-history,
the maximum intensity, and the total acoustical energy of the event. Our
interests in this endeavor include the following:
1) It is often necessary to estimate an acoustical metric given only
part of the information required.
2) The time history duration is related to the ground speed and
altitude of a helicopter. Thus aDy data adjustments for different alti-
tudes and speeds will affect duration time and consequently the SEL
(energy metric). The requirement to adjust data for these effects often
arises in environmental impact analysis around heliports. In addition,
the need to implement data corrections in helicopter noise certification
tests further warrants the study of duration effects.
Two different approaches have been utilized in analyzing the effect of
event 10-dB-down duration (DURATION or TI 0 ) on the accumulated energy
dose (Sound Exposure Level).
Both techniques are empirical, each employing the same input data but
using a different theoretical ap;,roach to describe duration influences.
76 •
- - - - - - - - ------
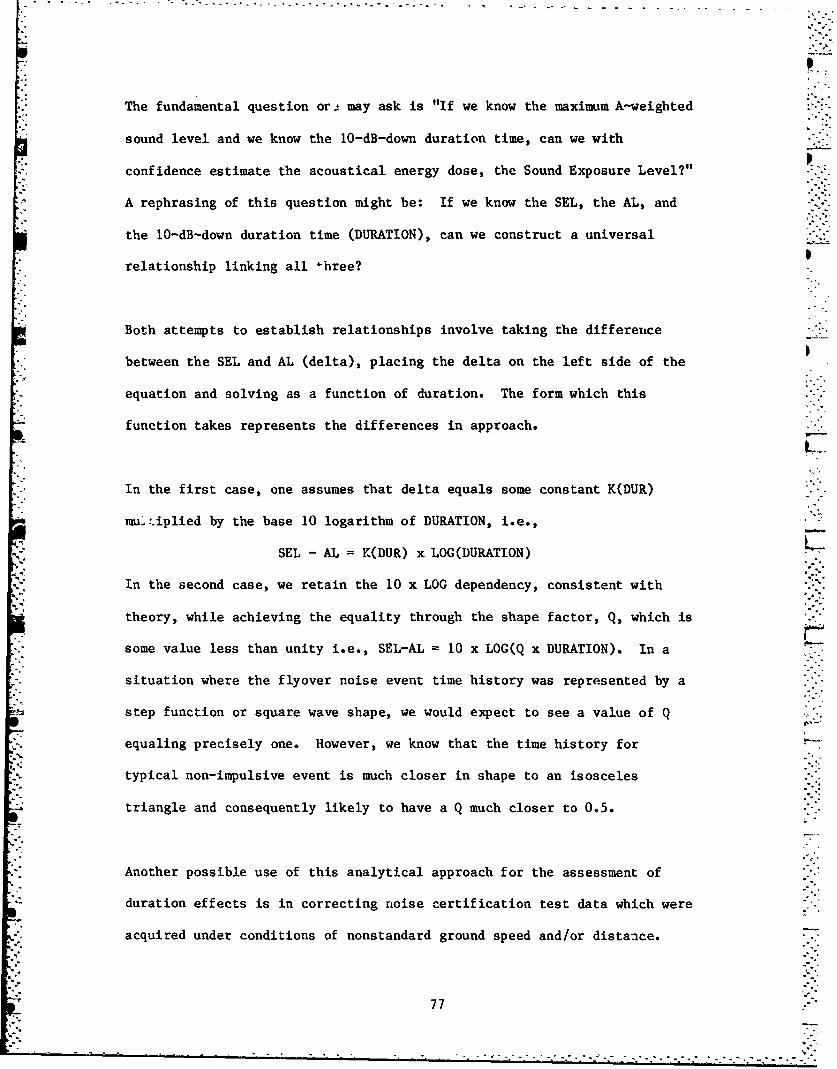
The fundamental question or. may ask is "If we know the maximum A-weighted
sound level and we know the 10-dB-down duration time, can we with
confidence estimate the acoustical energy dose, the Sound Exposure Level?"
A rephrasing of this question might be: If we know the SEL, the AL, and
the 10-dB-down duration time (DURATION), can we construct a universal
relationship linking all -hree?
Both attempts to establish relationships involve taking the differenice
between the SEL and AL (delta), placing the delta on the left side of the
equation and solving as a function of duration. The form which this
function takes represents the differences in approach.
In the first case, one assumes that delta equals some constant K(DUR)
mu..'iplied by the base 10 logarithm of DURATION, i.e.,
SEL - AL = K(DUR) x LOG(DURATION)
In the second case, we retain the 10 x LOG dependency, consistent with
theory, while achieving the equality through the shape factor, Q, which is
some value less than unity i.e., SEL-AL 10 x LOG(Q x DURATION). In a
situation where the flyover noise event time history was represented by a
step function or square wave shape, we would expect to see a value of Q
equaling precisely one. However, we know that the time history for
typical non-impulsive event is much closer in shape to an isosceles
triangle and consequently likely to have a Q much closer to 0.5.
Another possible use of this analytical approach for the assessment of
duration effects is in correcting noise certification test data which were
acquired under conditions of nonstandard ground speed and/or distance.
77
.................................................................
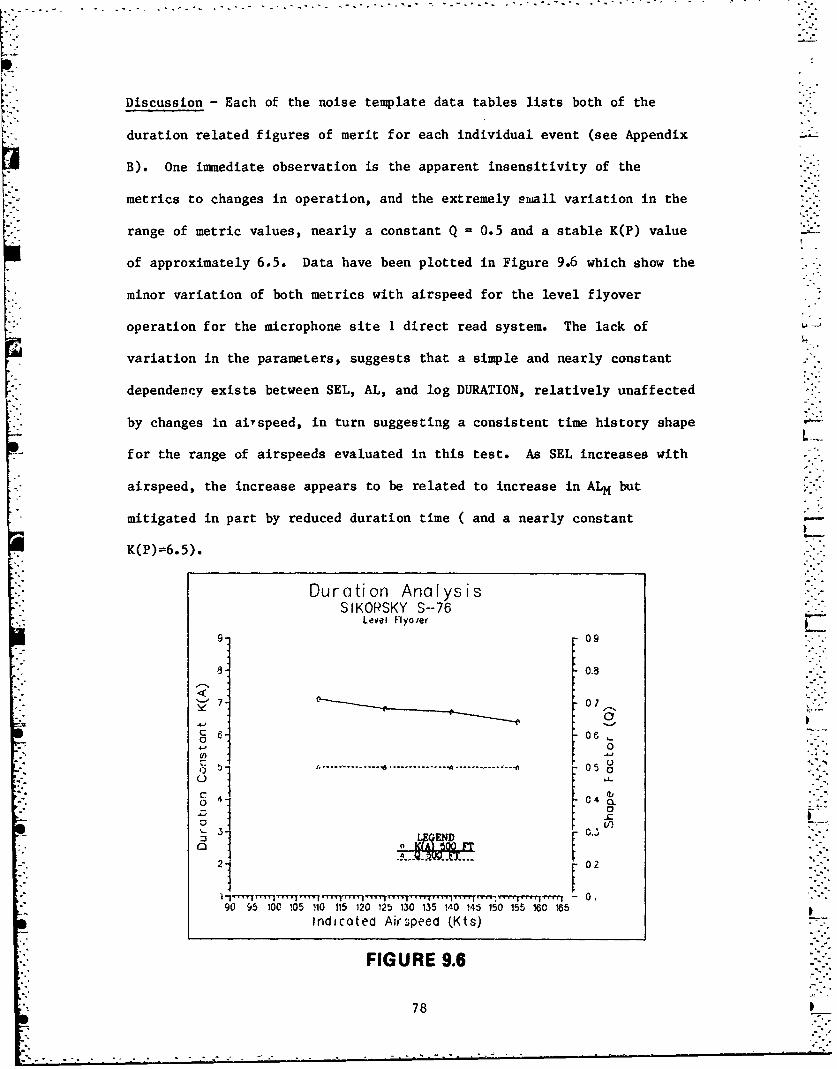
Discussion- Each of the noise template data tables lists both of the
duration related figures of merit for each individual event (see Appendix
B). One immediate observation is the apparent insensitivity of the
metrics to changes in operation, and the extremely esall variation in the
range of metric values, nearly a constant Q 0.5 and a stable K(P) value
of approximately 6.5. Data have been plotted in Figure 9.6 which show the
minor variation of both metrics with airspeed for the level flyover
operation for the microphone site 1 direct read system. The lack of
variation in the parameters, suggests that a simple and nearly constant
dependency exists between SEL, AL, and log DURATION, relatively unaffected
by changes in aiTspeed, in turn suggesting a consistent time history shape
for the range of airspeeds evaluated in this test. As SEL increases with
airspeed, the increase appears to be related to increase in ALM but
mitigated in part by reduced duration time ( and a nearly constant -
K(P)=6.5).
Duration AnalysisSIKORSKY S--76
Level Flyo/er
§9 09
8 0.5
o 7- 07 ..
_ • 6- ~ ~06 ."'"
--- 0- aZDo -
40
020.
90 95 100 105 110 115 1 0 1 130 135 !,"0 145 150 155 160 !65Indicoted Airspeed (Kts)
FIGURE 9.6
78

It is interesting to note that similar results were fiund for the other
helicopters, (Ref. 9, 10, 11, 12, 13) suggesting that different helicopter
models will have similar values for K and Q. This implies that it would 0
not be necessary to develop unique constants for different helicopter
models for use in implementing duration corrections. Caution is raised,
however, to avoid drawing any firm conclusions. The possibility exists
that this particular analytical technique lacks the sensitivity necessary
to detect distance and speed functionality.
9.3.2 Estimation of 10 dB Down Duration Time - In some cases, one does not
have access to 10 dB down duratin time (DURATION) information. A
moderate to highly reliable technique for estimating DURATION for the
Sikorsky S-76 is developed empirically in this section.
The distance from the helicopter to the observer at the closest point of
approach (expressed in feet) divided by the airspeed (expressed in knots)
yields a ratio, hereafter referred to as (D/V). This ratio has been
compiled for various test series for microphone sites 1,2 and 3 and has
been presented in Table 9.6 along with the average DURATION expressed in
seconds. A linear regression was performed on each data set in Table 9.6
and those results are also displayed in Table 9.6. Here one observes S
generally high correlation coefficients, in the range of 0.64 to 0.80.
The regression equations relating DURATION with D/V are given as
Canterline center, Microphone Site 1:TI0 = [1.9 x (D/V) I + 1.9
Sideline South, Microphone Site 2:TI0 = [1.4 x (D/V) ] + 3.7
Sideline North, Microphone Site 3:T [0 !1.4 x (D/V) I - 3.7
79

TABLE 9.6
HELICOPTER: SIKORSKY S-76 DURATION (T-10) REGRESSION ON D/v
SITE I
COCKPITPHOTO
TEST DATA AVG AVGSERIES V AVG DUR(A) EST ALT D/V
A 143.17 8.1 467.7 3.3 LINEAR8 127 8.9 479 3.8 REGRESSIONC 115 9.7 485.6 4.2D) 100 11.7 457.4 4.6 SITE #1E 145 16.8 1037.8 7.2F 78.5 10.9 399.7 5.1 SLOPE 1.96 77.5 9.3 387.4 5 INTERCEPT 1.88H 65 12 444.2 6.8 R SO. .561 74 10.7 364.3 4.9 R .75J 75.25 10.9 372.7 5 SAMPLE 11K 74 17 406.7 5.5
SITE 2
A 143.17 9.1 679 4.7 LINEAR8 127 10.8 687 5.4 REGRESSIONC 115 12.4 691.4 6D 100 13.5 671.8 6.7 SITE #2E 145 15.8 1148.6 7.9F 78.5 14.1 634.7 8.1 SLOPE 1.386 77.5 13.8 626.8 8.1 INTERCEPT 3.6H 65 14.5 633.5 9.7 R SO. .65! 74 15.5 612.2 8.3 R .8J 75.25 14.4 617.7 8.2 SANPLE 11K 74 19 638.4 8.6
SITE 3
A 143.17 9.7 679.2 4.7 LINEARB 127 10.8 687.5 5.4 REGRESSIONC 115 11.5 691.6 6D 100 13.1 672.1 6.7 SITE 13E 145 16.1 1149.5 7.9F 78.5 13.5 626.4 8 SLOPE 1.436 77.5 17.8 623.5 8 INTERCEPT 3.75H 65 13.8 658.4 10.1 R SO. .411 74 14.3 607.6 8.2 R .64J 75.25 15.8 623.1 8.3 SMPLE 11K 74 22.2 630.2 8.5
80
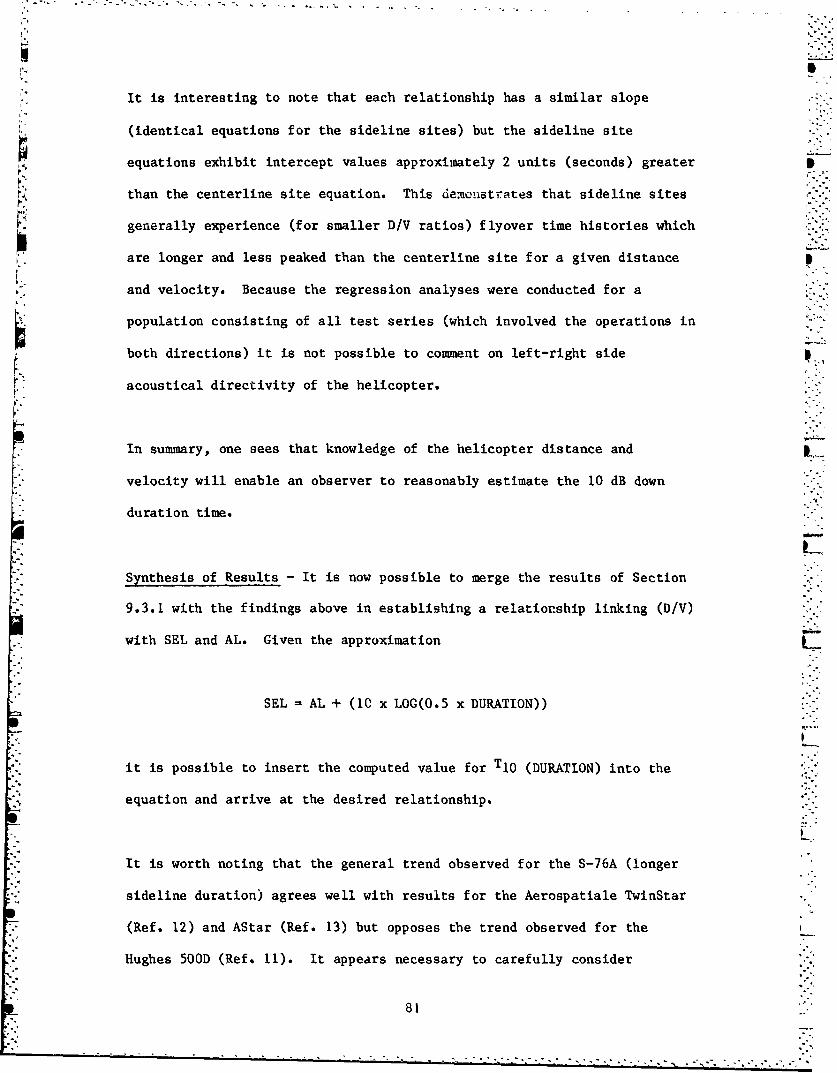
"It is interesting to note that each relationship has a similar slope
(identical equations for the sideline sites) but the sideline site
equations exhibit intercept values approximately 2 units (seconds) greater
than the centerline site equation. This demonatrates that sideline sites
generally experience (for smaller D/V ratios) flyover time histories which
are longer and less peaked than the centerline site for a given distance
and velocity. Because the regression analyses were conducted for a
population consisting of all test series (which involved the operations in
both directions) it is not possible to comment on left-right side ,
acoustical directivity of the helicopter.
In summary, one sees that knowledge of the helicopter distance and 3
velocity will enable an observer to reasonably estimate the 10 dB down
duration time.
Synthesis of Results -It is now possible to merge the results of Section
9.3.1 with the findings above in establishing a relationship linking (D/V)
with SEL and AL. Given the approximation
SEL AL + (10 x LOG(0.5 x DURATION))
it is possible to insert the computed value for TI 0 (DURATION) into the
equation and arrive at the desired relationship.
It is worth noting that the general trend observed for the S-76A (longer
sideline duration) agrees well with results for the Aerospatiale TwinStar
(Ref. 12) and AStar (Ref. 13) but opposes the trend observed for the
Hughes 500D (Ref. 11). It appears necessary to carefully consider
81- . .. . . . . .°

helicopter specific characteristics in estimating SEL or other energy-dose
acoustical metrics at sideline locations. It is significant to note that
slopes computed above for the S-76A are generally similar (approximately
2) to those observed for the AStar, TwinStar and Hughes 500D, suggesting
that a general relationship would do well in assessing changes or
differentials in noise level with changes in either distance or velocity.
"9.3.3 Relationship Between SEL Minus AL and the Ratio D/V - The
difference between SEL and ALM or conversely, EPNL and PNLTM (in a
certification context) is referred to as the DURATION CORRECTION. This
difference is clearly controlled by the event TI 0 (or 10 dB down dura-
tion time) and the acoustical energy contained within those bounds. As
discussed in previous sections, the T10 is highly correlated with the
ratio D/V. This analysis establishes a direct link between D/V and the
DURATION CORRECTION in a manner similar to that employed in Section 9.3.2.
* ." lable 9.7 provides a summary of data used in regression analyses for
microphones 1, 2 and 3. The regression equations, along with other
-' statistical information, are provided in Table 9.7 also.
It is encouraginA to note the generally strong correlations (coefficients
greater than 0.67) which suggest that SEL can be estimated directly (and
with confidence) from the ALM and knowledge of D/V. It is also interest-
ing to note the difference in regression equations. As mentioned in
Section 9.3.2, it is difficult to comment explicitly (and quantitatively)
on source directivity because operations were conducted in both direc-
tions. Regadless, one can see that centerline/sideline differences do
exist.
82
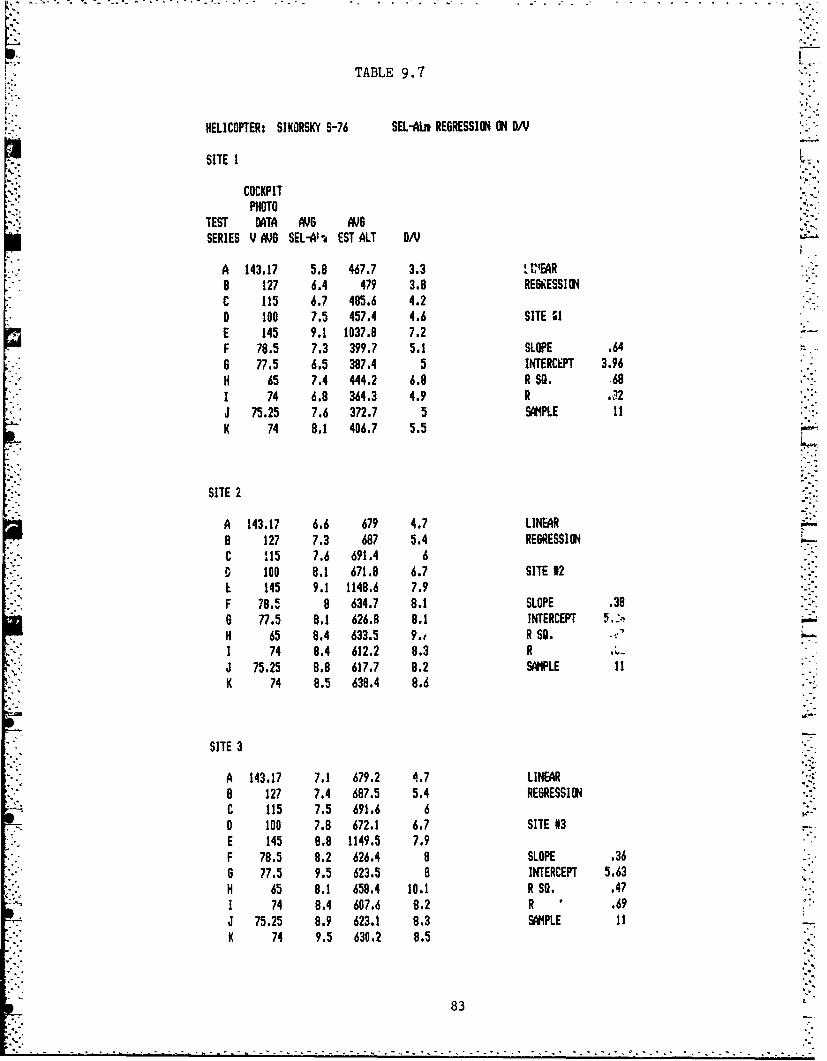
TABLE 9.7
HELICOPTER: SIKORSKY S-76 SEL-ALIm REGRESSION ON DON
SITE 1
COCKPITPHOTO
TEST DATA AJ6 AV6SERIES V AVA SEL-Aloa EST ALT D/V
A 143.17 5.8 467.7 3.3 1 1'4EAR8 127 6.4 479 3.8 RE69ESSIONC 115 6.7 485.6 4.20 100 7.5 457.4 4.6 SITE 1
soE 145 9.1 1037.8 7.2F 78.5 7.3 399.7 5.1 SLOPE .64L6 77.5 6.5 387.4 5 INTERCEPT 3.96H 65 7.4 444.2 6.8 R SO. .68I 74 6.8 364.3 4.9 R .32J 75.25 7.6 372.7 5 SAMPLE 11K 74 8.1 406.7 5.5
SITE 2
A 143.17 6.6 679 4.7 LINEAR8 127 7.3 687 5.4 REGRESSIONC 115 7.6 691.4 6p 100 8.1 671.8 6.7 SITE 12k 145 9.1 1148.6 7.9F 78.5 8 634.7 8.1 SLOPE .386 77.5 8.1 626.8 8.1 INTERCEPT 5,',-H 65 8.4 633.5 9.,1 R SO. -.I 74 8.4 612.2 8.3 RJ 75.25 8.8 617.7 8.2 SAMPLE 11K 74 8.5 638.4 8.6
SITE 3
A 143.17 7.1 679.2 4.7 LINEARB 127 7.4 687.5 5.4 REGRESSIONC 115 7.5 691.6 6D 100 7.8 672.1 6.7 SITE #3E 145 8.8 1149.5 7.9F 78.5 8.2 626.4 8 SLOPE .366 77.5 9.5 623.5 8 INTERCEPT 5.63H 65 8.1 658.4 10.1 R SO. .471 74 8.4 607.6 8.2 R .69J 75.25 8.9 623.1 8.3 SAMPLE 11K 74 9.5 630.2 8.5
83

"0
9.4 Analysis of Variability in Noise Levels for Two Sites Over Similiar
Propagation Paths - This analysis examines the differences in noise levels
observed for two sites each located 500 feet away from the hover point
over similar terrain. The objective of the analysis was to examine
variability in noise lqvels associated with ground-to-ground propagation
over nominally similar propagation paths. The key word in the last
sentence was nominally,...in fact the only difference in the propagation
paths is that microphone IH was located in a slight depression, (elevation
is minus 2.5 feet relative to the hover point), while site 2 has an
elevation of plus 0.2 feet relative to the hover point. This is a net
difference of 2.7 feet over a distance of 500 feet. This configuration
serves to demonstrate the sensitivity of ground-to-ground sound
propagation over minor terrain variations.
Discussion - The r,=sults presented in Table 9.8 show the observed
differences in tint, average noise levels for eight directivity angles and
the spacial average. In each case, magnetic recording data (Appendix C)
have been used in the analyses. It is observed that significant
differences in noise level occur for this low angle (ground-to-ground)
prcpagation scenarios.
It is speculated that very minor variations in site elevation (and result-
ing microphone placement) lead to site-to-site differences in the measured
noise levels for static operations. Differences in microphone height
result in different positions within the interference pattern of incident
and reflected sound waves. It is also appropriate to consider whether
variation in the acoustical source characteristics with time may
84
"TABLE 9.8
COHPARISON OFNOISE VERSUS DIRECTIVITY AN6LES
FORTWO SOFT SURFACES
HELICOPTER: SIKORSKY S-76
OPERATION: HOOER-IN-6ROUW-EFFECT
DIRECTIVITY ANGLES (DEGREES) Lav(360 DEGREE)
SITE 0 45 90 135 180 225 270 315 ENERGY ARITH.
LEG LEO LEO LEO LEO LEO LEO LEO LE. LEO
SOFT IH 62 63.8 68.9 72.4 74.5 69 70.1 69 70.2 68.7SOFT 2 66 69.1 72.9 78.2 77 72.5 69.8 73.2 73.9 72.3
DELTA ao 4 5.3 4 5.8 2.5 3.5 .3 4.2 3.7 3.6
* DELTA d8 (SITE IH) minus (SITE 2)
85

contribute to noise level differences. In this analysis, magnetic .
recording data from microphone site 2 a.re compared with data recorded at
site 1H approximately one minute later. That is, the helicopter rotated
45 degrees every sixty seconds, in order to project each directivity angle
(there is a 45 degree separation between the two sites). In addition to
source variatioa, it is also possible that the helicoptei "aim," based on
magnetic compass readings may have been slightly different in each case,
resulting in the projection of different intensities and accounting for
the observed differences. A final item of consideration is the
possibility of tefraction of sound waves (due to thermal or wind
gradients) resulting in shadow regions. It is worth noting that,
generally, similar results have been observed for other test helicopters
(Bell 222, ref. 9; Aerospatiale Dauphin, ref. 10; Hughes 500D, Ref. 11;
Aerospatiale TwinStar, Ref. 12; Aerospatiale AStar, Ref. 13). Regardless
of what the mechanisms are which create this variance, one perceives that
static operations display intrinsically variant sound levels, in both
direction and time, and also potentially variant (all other factors being -.-
normalized) for two nominally identical propagation paths.
86

S.-
9.5 Variation in Noise Levels With Airspeed for 3. 6 and 9 Degree
Approach Operations - This section examines the variation in noise level
for variations in approach angle. Data are presented for 3, 6 and 9
degree approaches. The appropriate "As Measured" mean acoustical data
"contained in Appendix A, have been adjusted using factors presented in
"Table 9. 9 and plotted (corrected for the minor differences in altitude)
-in Figure 9.7 and 9.8.
This analysis has several objectives: first, to explore the realm of "Fly
Neighborly" operating possibilities; second, to consider whether or not it
is reasonable to establish a range of approach operating conditions for
noise certification testing; and third, to compare results with data
acquired during an extensive noise test conducted with the S-76A in 1980
(Ref. 14).
Discussion - In the approach operational mode, impulsive (banging or
* •. slapping) acoustical signatures are a result of the interaction between
vortices (generated by the fundamental rotor blade action) colliding with
successive sweeps of the rotor blades (see Figure 9.9). As reported in
reference 16, for certain helicopters, maximum interaction occurs at
airspeeds in the 50 to 70 knot range, at rates-of-descent ranging from 200
to 400 feet per minute. When the rotor blade enters the vortex region, it
experiences local pressure fluctuations and associated changes in blade
loading. These perturbations and resulting pressure gradients generate
the characteristic impulsive signature.
. The data presented in Figures 9.7 and 9.8 for the three centerline
locations portray the variation in noise level as the approach angle (rate
of descent) changes with airspeed held nominally constant. The potential
benefit of using "Fly Neighborly" approach procedures is evident in the 4
87

toe S-76.A APPROACH OPERATIONS 94-f- S-76A APPROACH OPERATIONS
98 92
96- 90 "6 DEGRE-L 94 -'' 'IL
92+ q6+
_94- 9 DEG .. ADJUSTED E3 84- "T
D - .3 DEG g hJ -SUSD E "
"4-.- .A.784 " 7D-L-
s o ........................ ...... ..... .. .......... .................................................. 7 4 . .............. . . . ..... ................ . .... .........4 5 4 4 5
ICR,,PHOE SITES MI.P"'VE SITES
FIGURE 9.7 FIGURE 9.8
TABLE 9.9 -SIKORSKY S-76A
APPROACH ADJUSTMENTS (dB)
PropagationSite 4 Site 1 Site 5 Constant
9 9Deg AL 1.6 dB 1.1 dB 0.04 dB A 2
S9 Deg SEL 0.74 dB 0.77 dB 0.03 dB Ks 16
3 Deg AL 0.2 dB 0.62 dB 1.33 dB KA 23
3 Deg SEL 0.12 dB 0.43 dB 0.93 dB KS = 16
The above adjustments are applied to "As Measured" noise levels to arrive
at values used in Figures 9.8 and 9.9. All noise levels were corrected tothe 6 degree reference altitudes (shown below).
Approach
Altitudes Site 4 Site 1 Site 5
6 Deg* 412.85 364.08 302.93
3 Deg** 420.27 387.41 346.20
9 Deg** 484.52 406.73 304.28
"* Reference Altitude
**Average Test Altitudes
88

of descent) changes with airspeed held nominally constant. The potential
benefit of using "Fly Neighborly" approach procedures is evident in the 4
to 5 dB differential between the 3 and 6 degree and the 9 degree data. It
is interesting to note that "as measured" data reported in Reference 5 for
the 6 degree approach operation agree quite well with the results of the
subject test program. At microphone site 1, 1980 results revealed a mean
"AL of 85.2 dB and a mean SEL of 92.1 dB, whereas the 1983 tests showed an
AL of 86.7 dB and an average SEL 92.6 dB.
From a certification standpoint, it is clear that the 6 degree aproach
would present a greater noise exposure than the alternative procedure
"examined.
It is noted that a more exhaustive series of testing would include 5 or 6
airspeeds (and additional microphone locations) for each approach angle.
A recent study conducted in France (ref. 17) included a matrix of 24
microphones. While cost and logistical constraints make this unrealistic
for evaluation of each civil transport helicopter, one would be prudent to
evaluate several centerline and sideline microphone locations for a
variety of operational modes in any in-depth "Fly Neighborly" flight test
program.
Two other points of concern in developing "Fly Neighborly" procedures are
i safety and passenger comfort. Rates of descent, airspeed, initial
approach altitude and "engine-out" performance are all factors requiring
careful consideration in establishing a noise abatement approach.
89

,oC
> Ag
"4i
U. '
°us
LUL.o
"2 9o
%>
IliaE
IL
09

Finally, while certain operational modes may significantly reduce noise
levels, there may be an unacceptable acceleration /deceleration or rate-
of-descent imposed on passengers. This clearly presents an important
tradeoff to consider in any cormercial air-shuttle operations.
9'
I.
................................... .
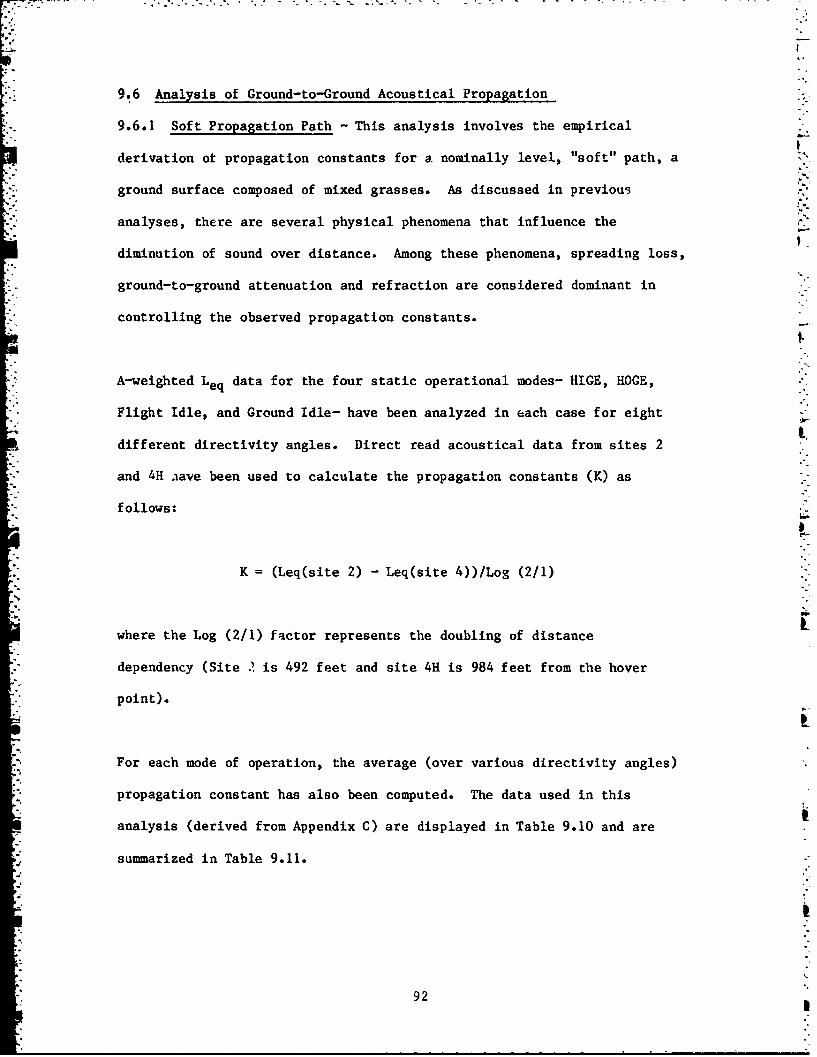
9.6 Analysis of Ground-to-Ground Acoustical Propagation
9.6.1 Soft Propagation Path - This analysis involves the empirical
derivation ot propagation constants for a nominally level, "soft" path, a
ground surface composed of mixed grasses. As discussed in previous
analyses, there are several physical phenomena that influence the
diminution of sound over distance. Among these phenomena, spreading loss,
ground-to-ground attenuation and refraction are considered dominant in
controlling the observed propagation constants.
A-weighted Leq data for the four static operational modes- HIGE, HOGE,
Flight Idle, and Ground Idle- have been analyzed in each case for eight
different directivity angles. Direct read acoustical data from sites 2
and 4H aave been used to calculate the propagation constants (K) as
follows:
K = (Leq(site 2) - Leq(site 4))/Log (2/1)
where the Log (2/1) factor represents the doubling of distance
dependency (Site ? is 492 feet and site 4H is 984 feet from the hover
point).
For each mode of operation, the average (over various directivity angles)
propagation constant has also been computed. The data used in this
analysis (derived from Appendix C) are displayed in Table 9.10 and are
summarized in Table 9.11.
"92

TABLE 9.10
DATA UTILIZED IN COMPUTING BIPIRICALPROPAGATION CONST•NTS (K) S
FOR SOFT SITES4H &2--."
SIKORSKY S-76
6-13-83
SITE 4H
HI6E FLT.IDLE 6RN.IDLE
L-0 54.40 N-OA 47.80 N-0B 49.60
L-315 62.70 Mt-315A 54.20 M-315B NA
L-270 59.00 N-270A 52.20 N-2708 NA
L-225 63.20 M-225 53.30 M-225B N8
L-180 66.20 N-180A 53.00 M-180B 39.40
L-135 64.90 M-135A NA M-1358 NA.
L-90 61.30 M1-90A NA t1-908 N
L-45 56.30 M-45 50.10 H-45B NA.
SITE 2
HIGE FLT.IDLE 1SIDLE
L-0 63.YO N-OA 57.10 N-00 54.80
L-315 72.10 M--315 61.50 1N-315B N8
L-270 69.60 N-270A 60.30 M-2708 NA
L-225 73.20 N-225A 62.80 N-225B N-
L-180 76.10 t-180A 61.40 M-180B 45.20
L-135 77.00 ,-135A NA M-1358 NA
L-90 71.80 ,--904 M-90NL-45 67.90 N-45A 59.70 M-45B NA
93

TABLE 9.11
SIKORSKY S-76
EMPIRICAL PROPOGATION CONSTANTS (K)FOR SOFT SITES (4H+2)
-------------------------------..........................................
EMISSION HIGE FLT.IDLE 6ND.IDLEANLE K K K
0 31.67 31.00 17.33315 31.33 24.33270 35.33 27.00225 33.33 31.67180 33.00 28.00 19.33135 40.33
90 35.0045 38.67 32.00
AVERAGE 34.83 29.00 18.33
ip
TABLE 9.12
Summary of Soft Path"Propagation Constants L
Average Average Average AverageHIGE FI GI HOCE
Helicopter K K K K
Bell 222 41.20 22.30 13.90 9.10
"Aerospatiale 19.16 26.34 24.42Dauphin 2
Hugheb 500D 28.67 25.04 23.50
Aerospatiale 37.08 35.05 32.60 30.35TwinStar
Aerospatiale 37.87 36.12 23.33AStar
Sikorsky S-76A 34.83 29.00 18.33
AVERAGE 33.14 28.98 22.33 21.66
94 S

Discussion - The results shown in Table 9.1 exhibit some minor variation
from one operational mode to the next. The attenuation constants for HIGE
and flight idle tend to agree well with results reported for other
helicopters, being in the vicinity of 30 for the S-76A. The ground idle
data are suspicious probably influenced by poor signal to noise conditions
(also a very small sample size).
A summary of results for other helicopters is presented in Table 9.12.
Although S-76A results are somewhat higher, the generalized relationship
AdB = 25 log (dl/d2) provides a reasonable working approximation for
calculating ground-to-ground diminution of A-weighted sound levels over
nominally soft paths out to a distance of 1000 feet for the average
helicopter.
9.6.2 lard Propagation Path This part of the analyses would involve the
empirical derivation of constants for sound propagation over a "hard"
propagation path, a concrete/composite taxi-way surface. The analytical
mrethods described above (Section 9.6.1) are applicable using data from
sites 5H and 7H, respectively 492 and 717 feet from the hover site. The
salient feature of this scenario is the presence of a ground surface which
is highly reflective and uniform in composition. -
Discussion- The results of the analysis (not shown) revealed absurdly
large propagation constant values. This outcome suggests a very high rate ,
of attenuation between site 5H and 71. The presence of a strong local
temperature inversion (very low wind) is probably the source of
95
.................... ..........,......... .. ...... :.:......,.°...-...._-. .. ,.., •
L
dtfficulty, resulting in a shadow region beyond site 5H. It is evident
that an iscthermal condition with no wind would be the preferred condition
for assessmwent of ground-to-ground propagation. If there is in fact
significant shadowing (along the hard path), one may ask why the soft path
scerario does not exhibit strange results as well. It can only be
speculated that the hard asphalt surface controlled the temperature
profile (and micrometeorology) in the vicinity of 5H and 7H. Conversely,
the temperature profile in the vicinity of sites 2 and 4H may haveS
differed significantly, perhaps controlled by the moist grassy surface.
In essence, the rate of heat loss, the specific heat, and rate of heating
for the dissimilar surfaces appear to have played a significant role in
influencing the test results.
The "anomolous" result of propagation constants of approximately 50 (i.e.,
AdB f 501og (dl/d2) have now been observed for the hard path sce.iario for
two other helicopters: Hughes 500D, (Ref. 11) and Aerospatial'. AStar,
(Ref. 13). In each case, one also observed static analyses for
equidistant (150 m) hard and soft paths displaying (see Section 9.2) in
which hard paLh levels were always higher. The presence of a low loss
rate propagation constant directly opposes those results. The only
plausible explanation remains the influence of micro meteorology.
Subsequent reports in this series will endeavor to further investigate
hard path ground-to-ground propagation.
96

9.7 Air-to-Ground Acoustical Propagation Analysis - The approach and
takeoff operations provided the opportunity to assess empirically the
influences of spherical spreading and atmospheric absorption. Through -
utilization of both noise and position data at each of the three flight
track centerline locations (microphones 5, 1, and 4), it was possible to
determine air-to-ground propagation constants.
One would expect the propagation constants to reflect the aggregate
influences of spherical spreading and atmospheric absorption. It is
assumed that the acoustical source characteristics remain constant as the
helicopter passes over the measurement array. In past studies (Ref. 9,
10, 11, 12, 13), it has been observed that this assumption is reasonably
valid for takeoff and level flyover operations. In the case of approach,
however, significant variation has been evident. Because of the
spacial/temporal variability in approach sound radiation along the (1000
feet) segment of interest, approach data have not been utilized in
estimating propagation constants. As a final background note relating to
the assumption of source stability a helicopter would require
approximately 10 seconds, travelling at 60 knots, to travel the distance
between measurement sites 4 and 5.
In both the case of the single event intensity metric, AL, and the single
event energy metric, SEL, the difference between SEL and AL is determined
for each pair of centerline sites. The delta in each case is then equated
with the base ten logarithm of the respective altitude ratio multiplied by
the propagaticot constant (either KP(AL) or KP(SEL), the values to be
determined.
97
S....................... . .,-+ .............,, -:.- . +.......

TABLE 9.13 TABLE 9.14 TABLE 9.15
HELICOPTER: SIKORSKY S-76 HELICOPTER: SIKORSKY S-76 HELICOPTER: SIKORSKY S-76
TEST DATE: 6-13-83 TEST DATE: 6-13-83 TEST DATE: 6-13-83
OPERATION: ICAO TAKEOFF OPERATION: TAKEOFF OPEMTICN: TAKEOFFTARGET IAS=75 KTS TARGET IAr=74 KTS
MIC. 5-4 MIC. 5-4 MIC. 5-4
EVENT NO. KP(AL) KP(SEL) EVENT NO. KP(AL) KP(SEL) EVENT NO. KP(AL) KP(SEL)
F29 NA ff H44 31.9 19.4 J56 NA NA
F30 12.3 6.2 ff45 6.7 2.9 J57 N N
F31 16.9 9.1 H46 -1.1 2.3 J58 25.7 21.2
F32 22.8 7.4 M47 -5.2 3.5 J59 22.3 17
F33 18.5 7.4 ff48 32.7 17.8 J60 22.6 12.6
F34 23.3 14.4 H49 0 5.9F35 21.6 11.6 AVERAGE 23.5 16.9
F36 25.7 12.6 AVEIRGE 10.8 8.6STO. DEV 1.91 4.30
AVERAGE 20.2 9.8 STD. DEV 17.11 7.849M C.I. 3.21 7.26
STD. DEV 4.56 3.10 90T. C.I. 14.08 6.45
90/. C.I. 3.35 2.28
TABLE 9.16 TABLE 9.17
Summary Table of Propagation Constants Summary Table for the Takeoff Operation
for Three Takeoff OperationsPropagation
Operation KP(AL) Helicopter Constant (K)
ICAO Takeoff 20.2 Bell 222 N/A
Takeoff 10.8 Aerospatiale 20.67Dauphin 2
Takeoff 23.5Hughes 500D 21.15
AVERAGE 18.17Aerospatiale 24.4
TwinStar
"Aerospatiale 21.9AStar
Sikorsky S-76A 18.17
Average 21.26
98
' - - . . -. .
Data have also been analyzed from the 500 and 1000 foot level flyover
operations and the KP(AL) has been computed. In this case, data were
pooled for all centerline sites (5, 1, and 4) in the process of arriving
at the propagation constant.
The takeoff analyses are shown in Tables 9.13, 9.14 and 9.15 and are
summarized in-Table 9.16. Results of the level flyover calculations are
presented in Table 9.18. The level flyover and takeoff analyses are also
accompanied by a tabulation of results from five previous reports (Tables
9.17 and 9.19).
Discussion - In the case of takeoff data (Table 9.16) one observes a
propagation constant of about 18, a value in good agreement with previous
results shown in Table 9.17. This value suggests that either little
absorption takes place over the propagation path or that the source
frequency content is dominated by low frequency components, (relatively
unaffected by absorption).
In the case of level flyover data (Table 9.18), one observes a value of
approximately 29, also in good agreement with previous results shown in
Table 9.19. The variability in level flyover propagation constants from
one helicopter to the next (spanning a range of 20 to 30) is likely
associated with disparate source frequency content, different absoprtion
characteristics on the various test days and variation in absorption on
any particular test day.
99
S. . ... . - . • . -. -, -. . -. -• 2 .-. - " .-. . .'- ..., . . - . . .

TABLE 9.18
SIKORSKY S-7dA
LEVEL FLYOVER PROPADATIIN--AL
ALOPERATION fIC 5 fII I IC 4 WEIGHTED
AVERA6E
= 5 5 5500' (0.9vh) AVG AL= 83.7 83.7 84.5 83.97 0
STD DEV= .7 .3 .4
N= 5 5 51000' (0.9.h) AVG AL= 75 75.1 75.6 75.23
STID DEV= 1.2 1.1 1.3
K= AdB / L08(1039.67 / 470.53) AdB= 8.73
K= 8.73 / .3443082
K= 25.36
TABLE 9.19
SIUMARY FOR LEVEL FLYOVER OPERATION
AL METRIC
HELICOPTER PROPAGATION CONSTANT (K) e
BELL 222 21.08
AEROSPATIALEDAUPHIN 2 21.40 0
HUGHES 500D 20.81
AEROSPATIALE"lIdINSTAR 20.19
AEROSPATIALE"ASTAR 18.77
SIKORSKY S-7dA 25.36
AVERAGE 21.27
S100
Table 9.20 provides a brief examination of propagation for the EPNL
acoustical metric, used in noise certification. Calculations show a
constant of approximately 20, a value greater than the mean but in good
agreement with other results summarized in Table 9.21. The reader may
consider computing propagation constants for other acoustical metrics as
the need arises.
101
•10

- - - - . -. .
TABLE 9.20
SIKORSKY S-7dA
LEVEL FLYOVER PROFAATION--ENL"
EPNLOPERATION NIC 5 NIC 1 NIC 4 WEIGHTEO
N 5 5 5500' (0.9h) AVG EPNL= 92.2 92.5 93.1 92.60
S'D DE .8 .1 .3
Nc 3 5 41000' (O.Wh) AVG ERNL= 86.1 86.5 86.6 86.43
STD DEW 1.1 .6 1.1
K= Ad/ 1L06(1039.67 / 470.53 A& 6.17
K= 6.17 / .3443082
K= 17.91
TABLE 9.21
SIMIY TABLE FOR ERIL
HELICOPTER PROPAGAIONH CONSTANT (K)
BELL 222 14.33
AEROSPATIALEMUPHIN 2 18.67
HUGHES 5000 14.80
AEROSPATIALE"IWINSTAR 13.84
AEROSPATIALEASTAR 13.14
SIKORSKY S-,6A 17.91
AVEMGE = 15.45
102
REFERENCES
1. "Determination of Minimum Distance from Ground Observer to AircraftFor Acoustic Tests," Aerospace Information Report 902, Society ofAutomotive Engineers, May 15, 1966.
2. "Flight Path Tracking: Kinotheodolite vs. Camera - A comparison ofResults." ICAO Committee on Aviaiton Environmental Protection,
Working Group II meeting, Boston, MA, May 1984.
3. Richner, Hans and Peter Phillips, "Reproducibility of VIZ RadiosondeData and Some Sources of Air," Journal of Applied Meteorology, 26,November 1980, May 1981.
4. "Measuring Micro-Wind Structure in the Vicinity of the MicrophoneArray During Noise Certification Testing," ICAO Committee on AviationEnviroinmental Protection, Working Group II Meeting, Boston, MA,May 1984.
5. "Noise Standards: Aircraft Type and Airworthiness Certification,"Federal Aviation Regulations Part 36, Department of Transportation,Washington, D.C., June 1974. L
"6. FAR 36, Appendix B, Section B36.2.3.3.
7. "International Standards and Recommended Practices - Aircraft Noise,"Annex 16, International Civil Aviation Organization, May 1981,Appendix 4, paragraph 4.3.
8. Westland Helicopters Limited, via P. R. Kearsey, personalcommunication, January 1984.
9. Newman, J. Steven, Edward J. Rickley, Tyrone L. Bland, Sharon A.Daboin. Noise Measurement Flight Test: Data/Analyses Bell 222 TwinJet Helicopter - FAA-EE-84-01, Federal Aviation Administration,"Washington, DC, February 1984.
10. Newman, J. Steven, Edward J. Rickley, Sharon A. Daboin, Kristy R.Beattie. Noise Measurement Flight Test: Data/Analyses Aerospatiale.SA 365N Dauphin Helicopter - FAA-EE-84-02, Federal AviationAdministration, Washington, DC, April 1984.
11. Newman, J. Steven, Edward J. Rickley, Kristy R. Beattie, Tyrone L.Bland. Noise Measurement Flight Test: Data/Analyses Hughes 500 D/E -
FAA-EE-84-3, Federal Aviation Administration, Washington, DC, June1984.
103

12. Newman, J. Steven, Edward J. Rickley, Kristy R. Beattie, Tyrone L.Bland. Noise Measurement Flight Test: Data/Analyses Aerospatiale AS355F TwinStar Helicopter - FAA-EE-84-04, Federal AviationAdministration, Washington, DC, September 1984.
13. Newman, J. Steven, Edward J. Rickley, Tyrone L. Bland, Kristy R.Beattie. Noise Measurement Flight Test: Data/Analyses AerospatialeAS 350D AStar Helicopter - FAA-EE-84-05, Federal AviationAdministration, Washington, DC, September 1984.
14. Newman, J. Steven, Edward J. Rickley, David W. Ford. Helicopter noiseDefinition Report - FAA-EE-81-16, Federal Aviation Administration,Washington, DC, December 1981.
15. Impact of Noise on People - Federal Aviation Administration,Washington, DC, May 1977.
16. Cox, C. R., "Helicopter Rotor Aerodynamic and AeroacousticEnvironments," paper at the 4th AIAA Aeroacoustic Conference, Atlanta,GA, October 1977.
17. "Procedures de Vol A Empreintes Acoustiques Reduites Pour Le SA 365NDauphin," ICAO Committee on Aviation Environmental Protection, WorkingGroup II Meeting, Boston, MA, May 1984.
i-
104
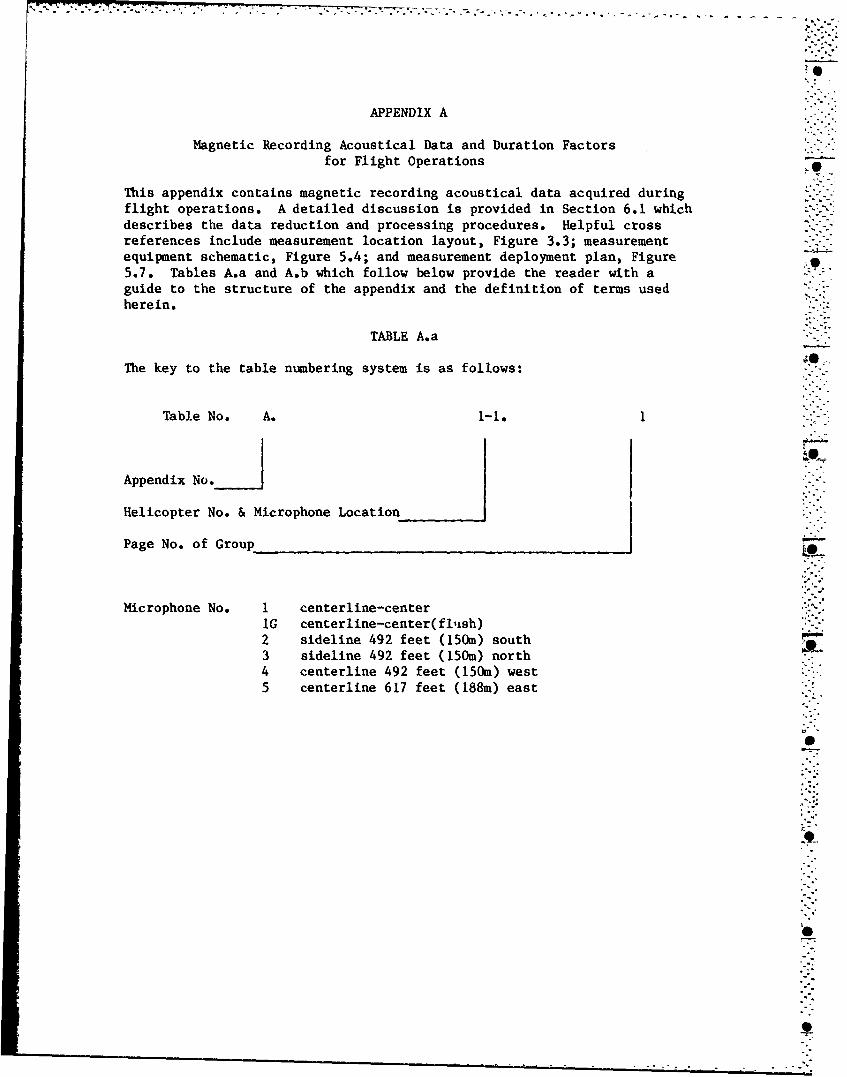
APPENDIX A
Magnetic Recording Acoustical Data and Duration Factorsfor Flight Operations
This appendix contains magnetic recording acoustical data acquired duringflight operations. A detailed discussion is provided in Section 6.1 whichdescribes the data reduction and processing procedures. Helpful crossreferences include measurement location layout, Figure 3.3; measurementequipment schematic, Figure 5.4; and measurement deployment plan, Figure5.7. Tables A.a and A.b which follow below provide the reader with aguide to the structure of the appendix and the definition of terms usedherein.
TABLE A.a
The key to the table numbering system is as follows: 0
Table No. A. 1-1. 1
Appendix No.
Helicopter No. &Microphone Location
Page No. of Group
Microphone No. 1 centerline-centerIG centerline-center(flush)2 sideline 492 feet (150m) south3 sideline 492 feet (150m) north4 centerline 492 feet (150m) west5 centerline 617 feet (188m) east
9-.
0--
,.
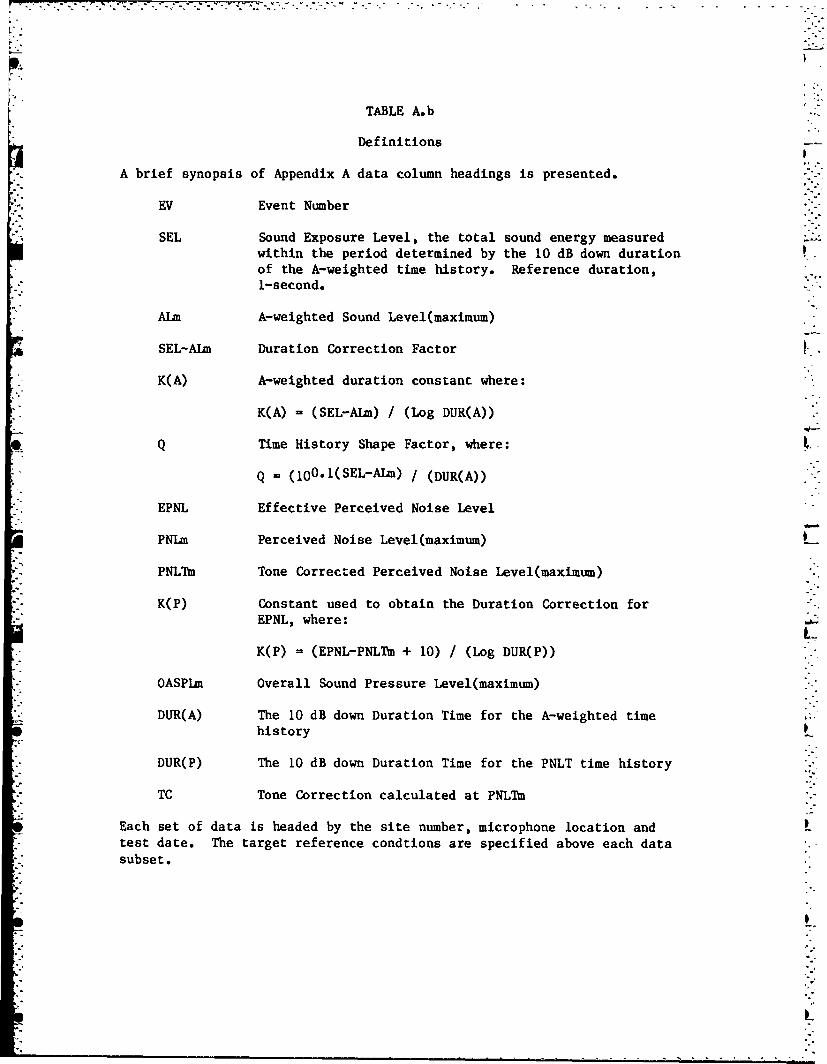
TABLE A.b
Definitions
A brief synopsis of Appendix A data column headings is presented.
EV Event Number
SEL Sound Exposure Level, the total sound energy measuredwithin the period determined by the 10 dB down durationof the A-weighted time history. Reference duration,1-second.
ALm A-weighted Sound Level(maximum)
SEL-ALm Duration Correction Factor
K(A) A-weighted duration constant where:
K(A) = (SEL-ALtn) / (Log DUR(A))
Q Time History Shape Factor, where:
Q (I00.I(SEL-ALto) / (DUR(A))
EPNL Effective Perceived Noise Level
PNLm Perceived Noise Level(maximum)
PNLTm Tone Corrected Perceived Noise Level(maximum)
"K(P) Constant used to obtain the Duration Correction for"EPNL, where:mLK(P) f (EPNL-PNLTm + 10) / (Log DUR(P))
OASPLm Overall Sound Pressure Level(maximum)
DUR(A) The 10 dB down Duration Time for the A-weighted timehistory
DUR(P) The 10 dB down Duration Time for the PNLT time history
TC Tone Correction calculated at PNLTm
Each set of data is headed by the site number, microphone location andStest date. The target reference condtions are specified above each data
. subset.
LL

TABLE NO. A.4-1.1
SIKORSKY S-76 IELICOPTER (SPIRIT) DOT/TSC5/ 9/84
"SUINIARY NOISE LEVEL DATA
AS MEASURED
SITE: I CENTERLINE - CENTER JUNE 13,1983
EV SEL AL& SEL-ALa K(A) 0 EPNL P•i PtLT. K(P) OASPLo OUI(A) 0UI3P) TC
TAKEOFF-- Target IAS 74 KTS (ICAO)
F29 85.8 78.6 7.1 7.0 0.5 89.7 91.0 92.8 6.9 92.0 10.5 10.0 1.9F30 86.8 79.3 7.5 7.1 0.5 90.6 91.5 93.6 6.8 82.3 11.5 10.5 2.1F31 87.6 79.8 7.8 7.3 0.5 91.2 92.1 94.2 6.8 82.6 11.5 10.5 2.1F32 86.2 78.5 7.7 7.2 0.5 90.1 91.1 92.7 7.2 82.4 11.5 10.5 2.0F33 86.6 79.5 7.0 6.9 0.5 90.7 92.0 94.2 6.6 82.7 10.5 9.5 2.3F34 85.9 78.9 7.1 6.8 0.5 90.1 91.1 93.5 6.8 82.1 11.0 9.5 2.4F35 86.2 79.7 6.5 6.5 0.4 90.5 92.2 94.1 6.7 82.9 10.0 9.0 2.3F36 86.2 78.7 7.5 7.2 0.5 90.1 91.2 93.4 7.1 82.9 11.0 9.5 2.4
"Av . 86.4 79.1 7.3 7.0 0.5 90.4 91.5 93.6 6.9 92.5 10.9 9.9 2.2"SJ Dv 0.6 0.5 0.4 0.3 0.0 0.5 0.5 0.6 0.2 0.3 0.6 0.6 0.2M90 Cl 0.4 0.4 0.3 0.2 0.0 0.3 0.3 0.4 0.1 0.2 0.4 0.4 0.1
TAKEOFF -- CATERGORY B (SEE TEXT)
1444 88.5 81.9 6.6 6.5 0.4 92.1 94.1 95.6 6.5 85.1 10.5 10.0 1.5W.45 88. 81.6 6.9 6.7 0.5 91.8 93.7 95.4 6.4 84.3 10.5 10.0 1.7146 88.6 82.3 6.3 6.5 0.4 92.5 95.0 96.3 6.5 84.9 9.5 9.0 1.4147 87.0 78.3 8.7 7.3 0.5 90.6 90.8 92.4 7.5 81.6 16.0 12.0 2.0148 86.6 78.5 8.1 7.5 0.5 90.4 91.0 92.7 7.4 82.8 12.0 10.5 1.7
-H49 86.6 79.0 7.6 6.7 0.4 90.3 91.3 93.2 6.6 81.6 13.5 12.0 1.7
Av 87.6 80.3 7.4 6.9 0.5 91.3 92.7 94.3 6.8 83.4 12.0 10.6 1.7"Stl Dv 1.0 1.9 0.9 0.4 0.0 1.0 1.8 1.7 0.5 1.6 2.4 1.2 0.2"M90 CI 0.8 1.5 0.8 0.4 0.0 0.8 1.5 1.4 0.4 1.3 2.0 1.0 0.2
TAKEOFF (WITH TURN) -- TARGET IAS 74 KTS
J56 88.4 80.4 8.0 7.6 0.6 92.2 92.6 94.7 7.2 86.2 11.0 11.0 2.1J57 86.6 78.6 8.1 7.6 0.6 90.2 90.7 92.7 7.4 83.5 11.5 10.5 2.0-158 87.0 79.2 7.7 7.4 0.5 90.6 91.8 93.8 6.6 83.0 11.0 10.5 2.1'159 86.8 79.6 7.2 6.9 0.5 90.5 92.1 93.7 6.8 82.4 11.0 10.0 1.7.J60 88.0 80.8 7.2 7.2 0.5 91.9 93.3 95.4 6.7 84.2 10.0 9.5 2.1
A 87.3 79.7 7.6 7.4 0.5 91.1 92.1 94.1 6.9 83.9 10.9 10.3 2.0":l "Dy 0.8 0.9 0.4 0.3 0.0 0.9 1.0 1.0 0.3 1.5 0.5 0.6 0.290% CI 0.7 0.9 0.4 0.3 0.0 0.9 0.9 1.0 0.3 1.4 0.5 0.5 0.2
- NOISE INDEXES CALCULATED USING IEASUJRED DATA UNCORRECTEDFOR TEMPERAPTUREWNID1TY,OR AIRCRAFT DEVIATION FROI REF FLIGHT TRACK

TABLE NO. A.4-1.2
SIKORSKY S-76 HELICOPTER (SPIRIT) DOT/TSC5/ 9/84
S.UMARY NOISE LEVEL DATA
AS MEASURED
SITE: I CENTERLINE - CENTER JUNE 13,1983
EV SEL AL, SEL-ALs K(A) 8 EPHL PilLs PNLT& K(P) OASPLg DUR(A) DUR(P) TC
3 DEGREE APPR•A•H -- TARGET IAS 74 KTS
637 94.0 87.6 6.4 6.9 0.5 97.4 100.4 101.1 6.7 96.6 8.5 8.5 0.7638 94.7 88.8 5.9 6.0 0.4 97.3 101.2 101.7 5.9 97.9 9.5 8.5 0.5639 92.2 86.4 5.8 6.6 0.5 95.8 98.8 99.6 6.8 95.8 7.5 8.0 0.8640 91.1 85.8 5.4 6.4 0.5 - 98.5 99.6 - 94.9 7.0 - 1.0641 95.5 88.9 6.6 7.1 0.5 98.1 101.3 102.0 6.6 97.5 8.5 8.5 0.7642 92.6 85.3 7.3 6.9 0.5 95.7 98.1 98.9 6.7 95.4 11.5 10.5 0.8643 90.1 82.2 7.9 7.2 0.5 93.0 94.3 95.0 7.3 90.8 12.5 12.5 0.8Av•. 92.9 86.4 6.5 6.7 0.5 96.2 99.0 99.7 6.7 95.6 9.3 9.4 0.8"StdOv 1.9 2.3 0.9 0.4 0.0 1.8 2.4 2.4 0.4 2.3 2.0 1.7 0.2"90I CI 1.4 1.7 0.7 0.3 0.0 1.5 1.8 1.8 0.4 1.7 1.5 1.4 0.1
"6 DEGREE APPROAH -- TARGET IAS 74 KIS
"150 93.9 87.8 6.1 6.3 0.4 96.7 100.2 101.0 6.2 98.3 9.5 8.5 0.8151 91.9 83.7 8.1 6.8 0.4 95.3 97.1 97.8 7.2 94.6 15.5 11.0 0.6152 92.7 86.4 6.4 6.8 0.5 95.8 98.5 98.8 7.1 95.2 8.5 9.5 0.3153 93.6 86.8 6.9 6.6 0.4 96.9 99.9 100.8 6.2 96.5 11.0 9.5 0.9154 92.2 86.4 5.8 6.1 0.4 95.7 99.8 100.5 5.7 96.9 9.0 8.0 0.8155 93.0 85.6 7.4 7.3 0.5 96.2 98.3 99.0 7.3 94.9 10.5 10.0 0.7
Avg. 92.9 86.1 6.8 6.6 0.5 96.1 99.0 99.6 6.6 96.1 10.7 9.4 0.7"Std Dv 0.8 1.4 0.9 0.4 0.0 0.6 1.2 1.3 0.7 1.4 2.5 1.1 0.2.90 C! 0.7 1.1 0.7 0.4 0.0 0.5 1.0 1.1 0.6 1.2 2.i 0.9 0.2
9 DEGREE APPROACH -- TARGET lAS 74 KTS
1K61 84.1 77.2 6.9 6.9 0.5 - 89.5 90.0 - 88.8 10.0 - 0.5-K62 90.3 81.1 9.2 7.4 0.5 93.2 94.1 94.6 7.2 90.0 17.5 15.5 0.5K63 88.0 79.1 8.9 6.5 0.3 91.6 92.8 94.0 5.8 89.2 23.5 21.0 1.11K64 85.9 77.8 8.1 6.7 0.4 89.4 90.4 90.9 7.0 88.2 16.5 16.0 0.5K65 87.5 80.5 7.0 6.1 0.3 91.0 93.7 94.3 6.4 89.9 14.5 11.0 0.61K66 86.7 78.2 8.6 6.6 0.4 90.4 91.5 92.2 6.4 88.4 20.0 19.0 0.7Avg. 87.1 79.0 8.1 6.7 0.4 91.1 92.0 92.7 6.6 89.1 17.0 16.5 0.7FStd Dv 2.1 1.6 0.9 0.4 0.1 1.4 1.8 1.9 0.6 0.8 4.6 3.8 0.2"90I C] 1.7 1.3 0.8 0.4 0.1 1.4 1.5 1.6 0.5 0.6 3.8 3.6 0.2
* - NOISE INDEXES CALCULATED USING EASIURED DATA UNCORRECTEDFOR TEMPERAIUREHUNIDITYOR AIRCRAFT DEVIATION FROM REF FLIGHT TRACK

TABLE NO. A.4-1.3
SIKORSKY S--76 HELICOPTER (SPIRIT) DOT/TSC5/ 9/84
SUIIARY NOISE LEVEL DATA
AS •KSIRED# -*
SITE: I CENTERLIHE - CENTER JUE 13,1983
EV SEL AU. SEt-ALa K(A) 0 EPHI PNLU POLTs K(P) DASPLI OUR(A) IR(P) TC "-""
500 FT. FLYOVER -- TARGET IAS 145 KTS
Al 89.5 83.9 5.6 6.3 0.5 92.5 96.4 97.0 6.3 100.1 7.5 7.5 0.6A2 89.7 83.8 5.9 6.4 0.5 92.7 96.4 97.0 6.3 98.4 8.5 8.0 0.6A3 89.4 83.7 5.7 6.5 0.5 92.6 96.3 96.7 6.4 100.1 7.5 8.0 0.4A5 89.2 83.2 5.9 6.4 0.5 92.3 95.8 96.5 6.2 99.3 8.5 8.5 0.7A6 90.1 84.0 6.1 6.6 0.5 92.4 95.2 95.8 6.9 99.6 8.5 9.0 0.6
Av . 89.6 83.7 5.8 6.4 0.5 92.5 96.0 96.6 6.4 99". 8.1 8.2 0.6"SJ Dv 0.3 0.3 0.2 0.1 0.0 0.1 0.5 0.5 0.3 0.7 0.5 0.6 0.190M C! 0.3 0.3 0.2 0.1 0.0 0.1 0.4 0.5 0.2 0.7 0.5 0.5 0.1
500 FT. FLYOVER -- TARET IAS 130 KTS
87 86.0 79.8 6.2 6.8 0.5 - 92.1 93.1 - 94.9 8.0 - 1.088 R8.4 81.7 6.7 6.8 0.5 91 0 93.3 94.3 7.0 94.2 9.5 9.0 1.1 ,89 86.3 79.6 6.8 6.8 0.5 89.2 91.7 92.7 6.8 93.1 10.0 9.0 1.0B8O 87.3 80.7 6.6 6.8 0.5 89.9 92.5 93.6 6.6 93.1 9.5 9.0 1.1B11 87.4 81.4 6.0 6.5 0.5 90.2 93.6 94.4 6.4 95.2 8.5 8.0 0.8B12 88.3 82.3 6.0 6.6 0.5 90.9 94.1 94.9 6.6 94.5 8.0 8.0 0.9B13 85.5 79.0 6.5 6.8 0.5 88.4 91.1 92.1 6.6 92.9 9.0 9.0 1.0
A 87.0 80.6 6.4 6.7 0.5 39.9 92.6 93.6 6.7 94.0 8.9 8.7 1.0 -"MS D 1.1 1.2 0.3 0.1 0.0 1.0 1.1 1.0 0.2 1.0 0.8 0.5 0.190M Cl 0.8 0.9 0.2 0.1 0.0 0.8 0.8 0.7 0.1 0.7 0.6 0.4 0.1
500 FT. FLYOVER -- TARGET IAS 115 KTS
C14 86.4 79.4 7.0 6.9 0.5 89.0 91.1 92.0 6.9 8B.0 10.5 10.5 1.0C15 85.7 79.3 6.4 6.7 0.5 88.8 91.4 92.7 6.6 87.4 9.0 8.5 1.1C17 84.7 78.2 6.5 6.9 0.5 87.8 90.3 91.3 7.1 91.1 9.0 8.0 1.1CIS 86.7 79.9 6.9 6.7 0.5 89.6 91.8 92.8 6.7 89.3 10.5 10.0 1.0
Avg . 85.9 79.2 6.7 6.8 0.5 8B.8 91.1 7,.2 6.8 89.0 9.7 9.2 1.0Std Dv 0.9 0.7 0.3 0.1 0.0 0.8 0.7 0.7 0.2 1.7 0.9 1.2 0.090M CI 1.0 0.8 0.3 0.1 0.0 0.9 0.8 0.8 0.3 2.0 1.0 1.4 0.1
500 FT. FLYOVER -- TARGET kAS 100 KTS
D19 86.3 77.3 9.0 8.0 0.6 89.1 89.1 90.0 8.1 83.8 13.5 13.0 0.9020 86.9 79.2 7.7 6.9 0.4 89.6 91.0 91.9 7.1 84.1 13.0 i2.0 1.4021 84.8 77.7 7.1 6.9 0.5 87.8 90.2 91.1 6.7 83.1 10.5 10.0 0.9022 86.3 78.6 7.7 6.8 0.4 89.1 90.8 91.7 6.8 83.3 13.5 12.0 1.1023 86.7 80.5 6.2 6.8 0.5 89.9 93.1 93.9 6.7 87.7 8.0 8.0 0.7
Avg. 86.2 78.7 7.5 7.1 0.5 89.1 90.8 91.7 7.1 84.4 11.7 11.0 1.0 0StM Dv 0.8 1.3 1.0 0.5 0.1 0.8 1.4 1.4 0.6 1.9 2.4 2.0 0.290M Cl 0.8 1.2 1.0 0.5 0.1 0.0 1.4 1.3 0.6 1.8 2.3 1.9 0.2
1000 FT. FLYOVER - TARGET IAS 145 KTS
E24 84.1 75.1 8.9 7.4 0.5 86.5 86.7 87.3 7.6 94.7 16.0 16.5 0.6E25 83.9 74.0 9.9 7.6 0.5 86.1 84.6 85.7 7.9 93.0 20.0 20.5 1.1E26 83.5 74.4 9.2 7.6 0.5 86.0 85.5 86.3 7.6 94.5 16.0 18.5 1.1E27 85.3 76.8 8.5 7.1 0.5 87.6 88.5 89.0 7.3 95.1 15.5 14.5 0.8E28 84.0 75.0 9.0 7.4 0.5 86.6 86.7 87.6 7.4 94.7 16.5 16.0 1.4
Av . 84.2 75.1 9.1 7.4 0.5 86.5 86.4 87.2 7.6 94.4 i6.8 17.2 1.0St0 0.7 1.1 0.5 0.2 0.0 0.6 1.4 1.3 0.2 0.8 1.8 2.3 0.390M Cl 0.7 1.0 0.5 0.2 0.0 0.6 1.4 1.2 0.2 0.8 1.7 2.2 0.3
-...
TABLE NO. A.4-1G
SIKORSKY S-76 HELICOPTER (SPIRIT) DOT/TSC5/10/84
SUIMARY NOISE LEVEL DATA
AS NEASURED '
SITE% 16 CENTERLINE-CENTER (FLUSH) JUNE 13,1983
EV SF.t AL& SEL-ALs K(A) a EPHL PNLa PNLTs K(P) OASPL* DUR(A) DURMP) TC
NO DATA
L
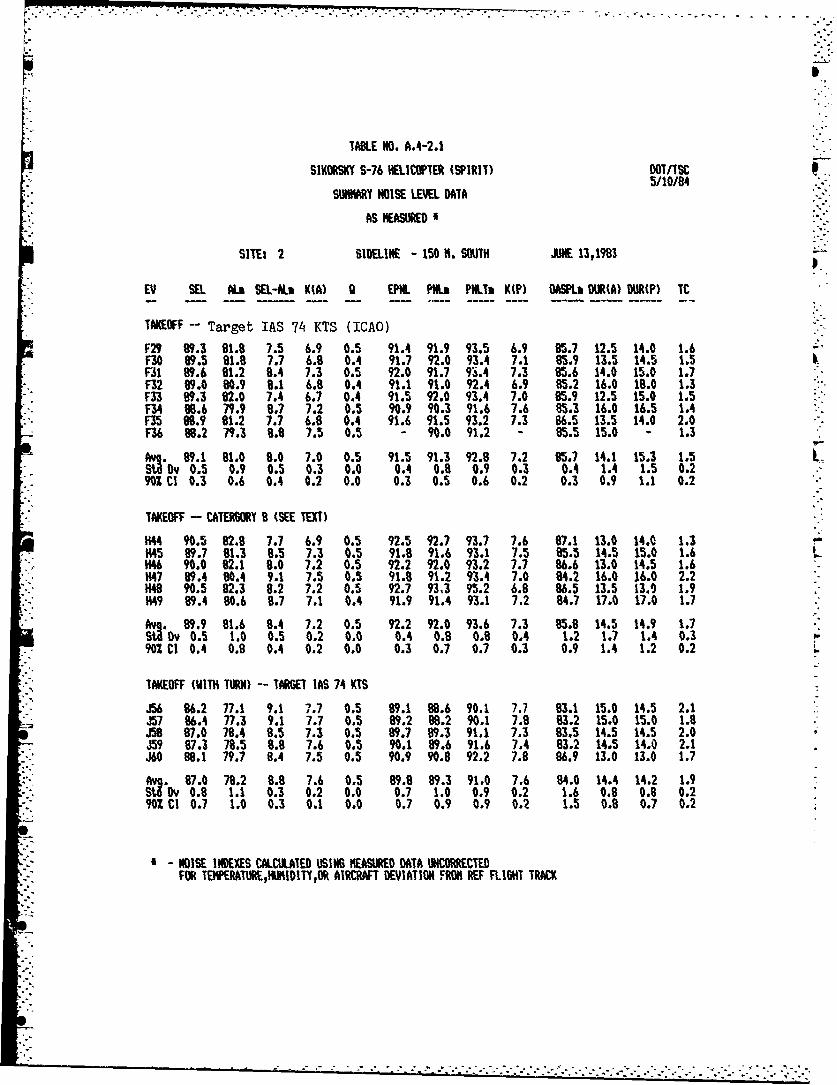
"TABLE NO. A.4-2.1
SIKORSKY S-76 HELICIPTER 4SPIRIT) OOT/TSC"5/10/84
S"MIRY NOISE LEVEI. DATA
AS NEASURED i
SITE: 2 SIDELINE - 150 M. SOUTH JINE 13,1983
EV SEL MA SEL-AL. K(A) 9 EPIH. PiN.% PNLTT K(P) OASPL DUR(A) DURP) TC
TAKEOFF -- Target IAS 74 KTS (ICAO)
F29 89.3 81.8 7.5 6.9 0.5 91.4 91.9 93.5 6.9 85.7 12.5 14.0 1.6F30 89.5 81.8 7.7 6.8 0.4 91.7 92.0 93.4 7.1 85.9 13.5 14.5 1.5F31 89.6 81.2 8.4 7.3 0.5 92.0 91.7 9M.4 7.3 85.6 14.0 15.0 1.7F32 89.0 80.9 8.1 6.8 0.4 91.1 91.0 92.4 6.9 85.2 16.0 18.0 1.3F33 89.3 82.0 7.4 6.7 0.4 91.5 92.0 93.4 7.0 85.9 12.5 15.0 1.5F34 86.6 79.9 8.7 7.2 0.5 90.9 90.3 91.6 7.6 85.3 16.0 16.5 1.4F35 98.9 81.2 7.7 6.8 0.4 91.6 91.5 93.2 7.3 86.5 13.5 14.0 2.0F36 88.2 79.3 8.8 7.5 0.5 - 90.0 91.2 - 85.5 15.0 - 1.3
Avq. 89.1 81.0 8.0 7.0 0.5 91.5 91.3 92.8 7.2 85.7 14.1 15.3 1.5"Stadv 0.5 0.9 0.5 0.3 0.0 0.4 0.8 0.9 0.3 0.4 1.4 1.5 0.290M CI 0.3 0.6 0.4 0.2 0.0 0.3 0.5 0.6 0.2 0.3 0.9 1.1 0.2
TAKEOFF CATERRY 8 (SEE TEXT)
1444 90.5 82.8 7.7 6.9 0.5 92.5 92.7 93.7 7.6 87.1 13.0 14.0 1.31445 89.7 81.3 8.5 7.3 0.5 91.8 91.6 93.1 7.5 85.5 14.5 15.0 1.6146 90.0 82.1 8.0 7.2 0.5 92.2 92.0 93.2 7.7 86.6 13.0 14.5 1.6
H47 89.4 80.4 9.1 7.5 0.5 91.8 91.2 93.4 7.0 84.2 16.0 16.0 2.2H148 90.5 82.3 8.2 7.2 0.5 92.7 93,3 95.2 6.8 86.5 13.5 13.9 1.91449 89.4 80.6 8.7 7.1 0.4 91.9 91.4 93.1 7.2 84.7 17.0 17.0 1.7
Av . 89.9 81.6 8.4 7.2 0.5 92.2 92.0 93.6 7.3 85.8 14.5 14.9 1.7S• Ov 0.5 1.0 0.5 0.2 0.0 0.4 0.8 0.8 0.4 1.2 1.7 1.4 0.3M90 Cl 0.4 0.8 0.4 0.2 0.0 0.3 0.7 0.7 0.3 0.9 1.4 1.2 0.2 -
"TAKEOFF (WITH TURN) -- TARGET IAS 74 KIS
J56 86.2 77.1 9.1 7.7 0.5 89.1 88.6 90.1 7.7 83.1 15.0 14.5 2.1J57 86.4 77.3 9.1 7.7 0.5 89.2 88.2 90.1 7.8 83.2 15.0 15.0 1.8J58 87.0 78.4 8.5 7.3 0.5 89.7 89.3 91.1 7.3 83.5 14.5 14.5 2.0-159 87.3 78.5 8.8 7.6 0.5 90.1 89.6 91.6 7.4 83.2 14.5 14.0 2.1J60 88.1 79.7 8.4 7.5 0.5 90.9 90.8 92.2 7.8 86.9 13.0 13.0 1.7
A". 87.0 78.2 8.8 7.6 0.5 89.8 89.3 91.0 7.6 84.0 14.4 14.2 1.9d 0.8 1.1 0.3 0.2 0.0 0.7 1.0 0.9 0.2 1.6 0.8 0.8 0.2
90M C! 0.7 1.0 0.3 0.1 0.0 0.7 0.9 0.9 0.2 1.5 0.8 0.7 0.2
N- OISE INDEXES CALCULATED USING MEASUREO DATA UICORRECTEDFOR TEIMPERATUREHUBIITYOR AIRCRAFT DEVIATION FRON REF FLIGHT TRACK
• , ,,.............. ... .... ......-..-...... .- .- .-...-.-....-.-. '........-..-..'.",-... ........•..-.

- -- --....-.. ,,-
TABLE NO. A.4-2.2
SIKORSKY S-76 HELICOPTER (SPIRIT) DOT/TSC5f9/84
SUII•RY NOISE LEVEL DATA
AS MEASURED
SITE: 2 SIDELINE - 150 M. SOUTH JUNE 13,1993
EY kL. ALo SEL-ALs K(A) 0 EPNL PNLa PIINTa K(P) DASPLi) DURA) OUR(P) TC
3 DEGREE APPROACH -- TARGET IAS 74 KTS
637 87.6 79.8 7.8 7.2 0.5 91.3 92.4 94.2 7.0 86.9 12.0 10.5 1.8G63 89.0 80.8 8.2 6.9 0.4 92.4 92.9 94.6 7.1 87.2 15.0 12.5 1.7639 87.0 78.5 8.5 7.6 0.5 90.2 90.7 92.3 7.4 86.3 13.0 12.0 1.6640 87.3 78.9 8.4 7.2 0.5 90.8 91.5 93.6 6.3 86.5 14.5 13.5 2.1641 85.0 79.2 5.7 5.7 0.4 87.9 90.7 91.9 6.4 85.7 10.0 9.0 1.2642 88.2 79.8 8.4 7.1 0.5 91.7 92.8 94.0 6.6 89.6 15.0 14.5 1.2643 87.4 78.0 9.4 7.6 0.5 90.6 89.9 92.5 6.8 95.8 17.0 15.0 2.6Avg. 87.3 79.3 8.1 7.1 0.5 90.7 91.5 93.3 6.6 86.7 13.8 12.4 1.8
"Std Dy 1.2 1.0 1.1 0.6 0.1 1.4 1.2 1.1 0.4 1.0 2.3 2.1 0.5"902 CI 0.9 0.7 0.8 0.5 0.0 1.0 0.9 0.8 0.3 0.7 1.7 1.6 0.4
6 DEGREE APPROACH -- TARGET ]AS 74 KTS
150 "0.3 81.4 8.9 7.3 0.5 93.4 92.6 94.1 7.6 89.0 16.5 16.5 1.6151 91.0 84.0 7.0 6.7 0.5 94.6 96.1 97.6 6.8 91.4 11.0 10.5 1.6 L152 ---- NO DATA153 91.6 83.4 8.3 6.5 0.4 94.6 65.5 97.4 6.1 90.6 18.5 15.0 1.9154 91.2 82.6 8.6 7.0 0.4 94.3 94.7 96.5 6.6 89.9 16.5 15.0 1.7"155 90.8 81.8 9.0 7.6 0.5 94.0 94.2 95.3 7.5 89.3 15.0 14.5 1.1
"Avg. 91.0 82.7 6.3 7.0 0.5 94.2 94.6 96.2 6.9 90.0 15.5 14.3 1.6"SD 0.5 1.1 0.8 0.4 0.1 0.5 1.3 1.5 0.6 1.0 2.8 2.3 0.3"90! CI 0.5 1.0 0.8 0.4 0.1 0.5 1.3 1.4 0.6 0.9 2.7 2.1 0.3 L
9 DEGREE APPROACH -- TARGET IAS 74 KTS
.K61 87.1 78.7 8.3 7.4 0.5 90.6 91.1 92.6 7.2 88.1 13.5 13.0 1.61K62 90.5 81.8 8.7 7.0 0.4 93.4 94.0 95.6 6.9 89.9 17.5 13.5 1.7-K63 87.7 78.3 9.3 6.8 0.4 "0.9 90.7 92.2 6.7 86.8 23.0 20.5 1.4-K64 87.8 78.4 9.4 6.9 0.4 90.7 90.8 92.1 6.5 88.1 22.5 21.0 1.31K65 89.1 82.6 6.5 5.6 0.3 92.2 94.8 95.8 6.2 90.1 15.0 11.0 0.9K66 87.9 79.2 8.8 6.5 0.3 91.1 92.1 93.1 7.2 87.2 22.5 13.5 1.0
A .8B3 79.8 8.5 6.7 0.4 91.5 92.3 93.6 6.8 88.4 19.0 15.4 1.3ASl'By 1.2 1.9 1.0 0.6 0.1 1.1 1.7 1.7 0.4 1.4 4.2 4.2 0.3
"902 CI 1.0 1.5 0.9 0.5 0.1 0.9 1.4 1.4 0.3 1.1 3.5 3.5 0.2
0
- NOISE INDEXES CALCULATED USING HEASURED DATA UNCORRECTEDFOR TEIIPERATUREI4UIIDITY,OR AIRCRAFT DEVIATION FRON REF FLIGHT TRACK
Io

TABLE NO. A.4-2.3
WiKORSKY S-76 HELICOPTER (SPIRIT) DOT/TSC5/ 9/84
SINIARY NOISE LEVEL DATA
AS KiEASIREODO
SITE: 2 SIDELINE - 150 K. SOUTH JUNE 13,19B3
E' SEL ALa SEL-ALs K(A) 0 EPHI PH. PHITs K(P) OASPLj DUR(A) DURMP) TC
500 FT. LOVER - TAMT AS 145 KTS
Al 89.6 83.5 6.1 6.8 0.5 93.2 95.3 96.2 6.9 100.6 8.0 10.0 1.2A2 90.6 83.3 7.3 7.3 0.5 93.0 95.0 95.8 7.2 96.9 10.0 10.0 0.7A3 89.5 83.4 6.0 6.7 0.5 93.0 95.5 96.4 7.0 100.8 8.0 9.0 1.2A5 89.3 83.1 6.1 6.6 0.5 - 94.4 95.7 - 100.1 8.5 - 1.4A6 91.1 83.7 7.4 7.1 0.5 93.3 95.2 95.8 7.2 97.8 11.0 11.0 0.7
Avg. 90.0 83.4 6.6 6.9 0.5 93.1 95.1 96.0 7.1 99.2 9.1 10.0 1.1StdID 0.8 0.2 0.7 0.3 0.0 0.1 0.4 0.3 0.1 1.8 1.3 0.8 0.390% CI 0.8 0.2 0.7 0.3 0.0 0.2 0.4 0.3 0.2 1.7 1.3 1.0 0.3
500 FT. FLYOVER -- TAR6 14S 130 KTS
87 87.0 80.4 6.6 6.7 0.5 89.9 92.0 92.9 7.0 95.2 9.5 10.0 0.9
88 89.0 80.8 8.1 7.5 0.5 90.9 91.8 92.7 7.6 91.7 12.0 12.0 0.989 86.2 79.3 6.8 6.8 0.5 88.8 91.1 92.0 6.7 95.1 10.0 10.0 1.0810 88.3 80.1 8.2 7.4 0.5 90.5 91.5 92.5 7.2 91.5 13.0 12.5 1.1Bil 87.3 80.8 6.5 6.7 0.5 89.7 92.0 92.9 7.0 96.3 9.5 9.5 1.2B12 88.7 80.7 7.9 7.5 0.5 90.8 92.0 93.0 7.4 92.9 11.5 11.5 0.9B13 86.0 79.1 6.9 6.9 0.5 88.8 91.1 92.1 6.9 95.3 10.0 9.5 1.0
Avq, 87.5 80.2 7.3 7.1 0.5 89.9 91.6 92.6 7.1 94.0 10.8 10.7 1.0"Stl Dv 1.2 0.7 0.8 0.4 0.0 0.9 0.4 0.4 0.3 1.9 1.4 1.3 0.1M90 Cl 0.9 0.5 0.6 0.3 0.0 0.6 0.3 0.3 0.2 1.4 1.0 0.9 0.1
500 FT. FLYOVER -- TARGET IAS 115 KTS
C14 86.9 78.2 8.7 7.2 0.5 88.8 89.6 90.7 7.0 86. 16.0 14.5 1.2C15 85.5 78.6 6.9 6.9 0.5 87.9 90.1 90.9 7.1 '70.4 10.0 9.5 0.9C17 85.2 78.8 6.4 6.6 0.5 88.0 90.1 91.3 6.8 92.1 9.5 9.5 1.2CIS 86.9 78.4 8.4 7.4 0.5 88.9 89.8 90.6 7.2 86.9 14.0 14.0 0.8
"Avg. 86.1 78.5 7.6 7.0 0.5 88.4 89.9 90.9 7.0 89.0 12.4 11.9 1.0"Std Dv 0.9 0.3 1.1 0.3 0.0 0.6 0 z 0.3 0.2 2.8 3.1 2.7 0.2"I90 CI 1.0 0.3 1.3 0.4 0.0 0.7 '.2 0.4 0.2 3.3 3.7 3.2 0.3
500 FT. FLYOVER - TARGET IAS 100 KTS
019 84.7 76.1 8.6 7.5 0.5 87.0 86.9 BB.3 7.7 85.2 14.0 13.5 1.4020 86.3 77.3 9.0 7.3 0.5 87.9 87.7 88.8 7.5 83.6 17.5 17.0 1.1021 84.1 76.7 7.4 7.0 0.5 86.3 87.6 88.7 7.1 84.9 11.5 12.0 1.1022 86.5 78.0 8.5 7.3 0.5 88.2 88.6 89.5 7.3 84.0 14.5 15.0 1.0D23 85.3 78.2 7.1 7.1 0.5 87.9 89.6 90.9 7.0 86.6 10.0 10.0 1.6
SAv. 85.4 77.2 8.1 7.2 0.5 87.5 88.1 89.2 7.3 84.9 13.5 13.5 1.2S N 1.0 0.9 0.8 0.2 0.0 0.8 1.1 1.0 0.3 1.2 2.9 2.7 0.3
90M Cl 1.0 0.8 0.8 0.2 0.0 0.8 1.0 1.0 0.3 1.1 2.8 2.6 0.3
1000 FT. FLYOVER -- TAMGT lAS 145 KTS
E24 84.8 75.9 8.9 7.5 0.5 87.9 89.3 89.8 7.0 95.8 15.0 14.0 0.5E25 85.2 75.2 9.9 8.0 0.6 - 86.0 87.2 - 92.4 17.5 - 1.8E26 83.6 74.8 8.8 7.4 0.5 86.4 86.1 86.9 7.6 96.1 15.5 17.5 0.8E27 86.8 77.7 9.0 7.6 0.5 89.4 89.7 90.5 7.5 96.5 15.5 15.5 1.2"E28 84.1 75.2 8.9 7.4 0.5 - 86.7 87.7 - 96.4 15.5 - 1.0
Av 84.9 75.8 9.1 7.6 0.5 87.9 87.6 88.4 7.4 95.4 15.8 15.7 1.1StlOv 1.2 1.2 0.5 0.2 0.0 1.5 1.8 1.6 0.3 1.7 1.0 1.8 0.5M90 CI 1.2 1.1 0.4 0.2 0.0 2.6 1.7 1.6 0.5 1.6 0.9 3.0 0.5

TABLE NO. A.4-3.1
SIKORSKY S-76 HELICOPTER (SPIRIT) DDT/TSC5/184
SONY NOISE LEVEL DATA
AS IEAS•RED
SITE: 3 SIDELIIE - 150 M. NORTh AJE 13,1 8,
EV SEL AL% SEL-AL. K(A) O EPNL PNLI P'NLi K(P) ASPL DUR(A) DOR) TC
TAKEOFF - Target IAS 74 KTS (ICAO)
F29 87.6 78.9 8.6 7.4 0.5 89.1 88.8 90.1 7.6 83.2 14.5 15.5 1.3F30 68.2 80.2 8.1 7.1 0.5 90.0 89.9 91.0 7.6 84.1 13.5 15.0 1.1F31 88.5 80.8 7.6 7.0 0.5 90.1 90.4 91.7 7.5 84.9 12.5 13.0 1.3F32 87.6 79.2 8.3 7.4 0.5 89.2 89.1 90.2 7.7 83.4 13.5 14.5 1.1F33 87.9 79.8 8.1 7.4 0.5 89.9 90.1 91.4 7.6 83.9 12.5 13.0 1.3F34 86.9 78.2 8.7 7.5 0.5 98.8 88.5 89.6 7.7 82.7 14.5 15.5 1.1F35 87.0 79.1 7.9 7.2 0.5 89.4 89.5 92.0 6.7 63.5 12.5 12.5 2.5F36 86.0 77.7 8.3 7.1 0.5 98.0 88.1 89.3 7.4 82.8 14.5 15.0 1.2
Av. 87.4 79.2 8.2 7.3 0.5 89.3 89.3 90.6 7.5 83.5 13.5 14.2 1.4"St Dv 0.8 1.0 0.4 0.2 0.0 0.7 0.8 1.0 0.3 0.7 0.9 1.2 0.5"90I CI 0.5 0.7 0.2 0.1 0.0 0.5 0.5 0.7 0.2 0.5 0.6 0.8 0.3
TAKEOFF - CATERGORY B (SEE TEXT)
1444 88.7 80.8 7.8 7.4 0.5 90.6 91.1 92.1 7.9 85.0 11.5 12.0 1.11445 8L.6 80.4 8.2 7.0 0.5 90.7 91.0 92.2 7.3 85.1 14.5 14.5 1.21446 88.8 81.2 7.6 7.1 0.5 91.1 91.7 93.1 7.4 86.1 11.5 12.0 1.41447 87.9 79.3 8.5 7.1 0.4 90.3 90.0 91.4 7.5 83.7 16.0 15.5 1.51448 87.7 79.0 8.7 7.1 0.4 89.9 89.8 91.2 7.2 84.1 16.5 16.5 1.4H49 87.7 79.8 7.9 7.1 0.5 - 90.4 91.8 - 84.4 13.0 - 1.4
Avq" 88.2 80.1 8.1 7.1 0.5 90.5 90.7 92.0 7.5 84.7 13.8 14.1 1.3Bv 0.5 0.9 0.4 0.1 0.0 0.4 0.7 0.7 0.3 0.9 2.2 2.0 0.2
"90I CI 0.4 0.7 0.4 0.1 0.0 0.4 0.6 0.6 0.2 0.7 1.8 1.9 0.1
TAKEOFF (WITH TURN) - TARGET IAS 74 KTS
356 90.9 82.6 8.3 7.2 0.5 93.3 93.4 95.2 7.1 86.5 14.0 14.0 1.8J57 88.6 78.9 9.7 8.0 0.6 91.8 90.9 93.0 7.5 84.0 16.0 15.0 2.1J58 89.5 80.7 8.8 7.4 0.5 91.9 92.1 93.6 6.9 85.0 15.5 16.0 1.5J59 91.0 82.9 8.1 7.1 0.5 93.6 93.6 95.2 7.2 87.1 14.0 14.5 1.8J60 89.7 79.9 9.8 7.6 0.5 92.5 91.5 92.6 7.1 83.7 19.5 24.5 1.1An 89.9 81.0 8.9 7.5 0.5 92.6 92.3 93.9 7.2 85.3 15.8 16.8 1.7"S D 1.0 1.7 0.8 0.4 0.0 0.8 1.2 1.2 0.2 1.5 2.3 4.4 0.4M Cl 1.0 1.6 0.7 0.3 0.0 0.8 1.1 1.2 0.2 1.4 2.1 4.2 0.4
* - NOISE INDEXES CALCULATED USING MEASURED DATA UNCORRECTEDFOR TEIIPERATOREpHURIDITY,OR AIRCRAFT DEVIATION FROM REF FLIGHT TRACK

L " " "" -° " "° . . ...
TABLE NO. A.4-3.2
SIKORSKY S-76 HELICOPTER (SPIRIT) DOT/TSC 0,. 51~S 9/84;- "
SUMNARY NOISE LEVEL DATA
AS MEASURED'
SITE: 3 SIDELINE - 150 N. NORTH I 13,1903
EV SEL ALU SEL-ALs K(A) 0 EPNL P"6. PTlk 1(P) OASPL URD") "'IP) ltC
3 DEGREE APROACH -- TARGET IAS 74 KIS
637 86.9 77.9 B.9 7.7 0.5 90.2 90.1 91.9 7.4 86.1 14.5 13.0 2.0 -.
638 87.0 76.7 10.3 8.2 0.6 90.3 89.3 91.1 7.7 86.5 18.0 16.0 2.0 .
639 8".0 77.3 8.7 7.6 0.5 89.2 89.2 90.7 7.6 95.6 14.0 13.0 1.7
640 86.7 76.9 9.8 7.8 0.5 89.3 88.8 90.5 7.5 85.4 18.0 14.5 1.7
"641 86.7 77.0 9.8 7.2 0.4 89.1 98.9 9.2 7.1 86.3 23.0 18.0 1.4
642 98.3 79.0 9.2 7.4 0.5 90.9 90.3 91.6 7.5 85.7 18.0 17.0 1.7
643 87.7 77.6 10.1 7.9 0.5 90.0 98.5 90.6 7.5 84.1 19.0 18.0 2.2
A V.87,0 77.5 9.5 7.7 0.5 89.9 89.3 91.0 7.5 85.7 17.8 15.6 1.8
Std v 0.7 0.8 0.6 0.3 0.1 0.7 0.7 0.6 0.2 0.8 3.0 2.2 0.390? cI 0.5 0.6 0.4 0.2 0.0 0.5 0.5 0.4 0.1 0.6 2.2 1.6 0.2
6 DEGAREE OACH -- TARGET IAS 74 KTS-
150 NO DATA151 NO DATA152 - NO DA•A153 83.8 77.1 6.7 7.1 0.5 87.6 89.9 91.2 6.8 85.7 9.0 8.5 1.3
154 87.0 77.2 9.7 7.8 0.5 90.7 90.6 91.9 7.5 86.2 17.5 15.0 1.3
155 85.6 76.8 8.8 7.3 0.5 89.7 89.1 90.9 7.6 85.4 16.5 14.5 1.8
85.5 77.0 8.4 7.4 0.5 89.3 89.9 91.4 7.3 85.8 14.3 12.7 1.5
"SV'Dv 1.6 0.2 1.5 0.4 0.0 1.6 0.7 0.5 0.4 0.4 4.6 3.6 0.390M CI 2.7 0.4 2.6 0.7 0.1 2.7 1.2 0.8 0.7 0.6 7.8 6.1 0.5
9 DEGREE APPROAC -- TARGET IAS 74 KIS
K(61 82.7 73.6 9.1 7.8 0.6 86.6 85.1 88.7 7.0 83.5 14.5 13.0 3.6
,K62 84.6 74.0 10.5 8.2 0.6 88.2 87.1 89.4 7.3 82.7 19.0 16.0 3.3
K63 85.0 75.5 9.5 6.8 0.4 87.8 95.7 87.9 7.1 81.0 24.5 24.5 2.2
1(64 8.4 73.5 9.9 7.3 0.4 86.7 85.1 86.8 7.4 82.0 22.5 21.5 2.5
K65 84.7 75.8 8.9 6.5 0.3 87.9 98.8 89.9 6.4 84.0 23.5 18.0 1.11K66 83.5 74.5 9.0 6.2 0.3 86.0 86.9 87.6 7.1 81.4 29.0 15.5 0.9 -
Avg. 84.0 74.5 9.5 7.1 0.4 87.2 86.4 88.4 7.1 82.4 22.2 18.1 2.3
.Su ov 0.9 1.0 0.6 0.8 0.1 0.9 1.4 1.2 0.4 1.2 5.0 4.2 1.1
90M CI 0.8 0.8 0.5 0.7 0.1 0.7 1.2 1.0 0.3 1.0 4.1 3.5 0.9
- NOISE INOEXES CALCULATED USING NEASURED DATA UNCORRECTED"FOR TENRATIUREHUKIOITYtOR AIRCRAFT DEVIAIOII FRON REF FLIGHT TRACK
................................ - . ....
- ..- ~ cr-. -. . -'-
TABLE NO. A.4-3.3
SIKORS-Y -76 HELICOPTER (SPIRIT) DOT/TSC5/5/84
SWIARY NOISE LEVEL DATA
AS MEASURED 0
SITE: 3 SIDELINE - 150 N. NORTH JUNE 13,1983
EV SEL AL. SEL-AL. K(A) 0 EPIL PMLe PNLT& K(P) DASPLa DURRA) DUR(P) TC
500 FT. FLYOVER -- TARGET IAS 145 KTS
Al 90.2 82.5 7.7 7.4 0.5 91.7 93.5 94.2 7.5 96.3 11.0 10.0 0.9A2 89.0 82.5 6.5 6.8 0.5 - 93.5 94.9 - 98.2 9.0 - 1.6Q3 90.3 82,8 7.5 7.5 0.6 92.1 93.6 94.3 7.8 97.4 10.0 10.0 1.0AS 90.4 82.9 7.5 7.5 0.6 - 93.4 94.1 - 96.6 10.0 - 0.7A6 89.7 83.6 6.1 6.5 0.5 93.0 94.6 96.1 7.1 99.8 8.5 9.5 1.4
Avg. 89.9 82.9 7.1 7.2 0.5 92.3 93.7 94.7 7.5 97.7 9.7 9.8 1.1 r"StNDy 0.6 0.4 0.7 0.4 0.0 0.7 0.5 0.8 0M4 1.4 1.0 0.3 0.4"90Z CI 0.5 0.4 0.7 0.4 0.0 1.1 0.5 0.8 0.6 1.3 0.9 0.5 0.4
500 FT. FLYOVER TARET lAS 130 KTS
87 87.7 79.8 7.8 7.3 0.5 88.9 90.3 91.1 7.4 89.8 12.0 11.0 0.988 87.3 80.7 6.5 6.7 0.5 89.3 91.2 92.6 6.8 95.2 9.5 9.5 1.6B9 87.8 79.5 8.3 7.7 0.6 89.1 90.1 90.9 7.6 90.4 12.0 12.0 0.7810 86.9 80.0 6.8 6.8 0.5 89.2 90.9 92.3 6.6 94.7 10.0 11.0 1.6811 88.6 80.9 7.8 7.5 0.5 90.1 91.6 92.3 7.3 92.3 11.0 11.5 0.7812 87.4 80.8 6.6 7.0 0.5 89.9 91.8 93.3 6.7 95.7 9.0 9.5 1.5813 87.0 78.9 8.2 7.6 0.5 88.6 89.6 90.3 7.5 91.1 12.0 12.5 0.9
Avg. 87.5 80.1 7.4 7.2 0.5 89.3 90.8 91.8 7.2 92.7 10.8 11.0 1.1 ""StNOv 0.6 0.7 0.7 0.4 0.0 0.5 0.8 1.1 0.4 2.4 1.3 1.2 0.490Z CI 0.4 0.5 0.5 0.3 0.0 0.4 0.6 0.8 0.3 1.8 0.9 0.8 0.3
500 FT. FLYOVER -- TARERT IAS 115 KTS
C14 85.9 78.1 7.8 7.2 0.5 87.7 88.5 89.9 7.2 89.0 12.0 12.5 1.5C15 86.3 78.7 7.7 7.1 0.5 87.4 89.1 89.8 7.1 85.9 12.0 11.5 0.7 SC17 85.6 78.5 7.0 6.9 0.5 87.0 89.1 90.0 7.1 87.0 10.5 10.0 0.8CIS 85.6 78.1 7.5 7.1 0.5 87.3 88.4 89.6 7.4 89.0 11.5 11.0 1.5
Avg. 85.9 78.4 7.5 7.1 0.5 87.4 88.8 89.8 7.2 87.7 11.5 11.2 1.1Std DN 0.4 0.3 0.3 0.1 0.0 0.3 0.4 0.2 0.2 1.5 0.7 1.0 0.490Z CI 0.4 0.3 0.4 0.1 0.0 0.3 0.4 0.2 0.2 1.8 0.8 1.2 0.5
500 FT. FLYOVER -- TARGET IAS 100 KTS
019 87.0 79.2 7.8 6.9 0.4 88.1 89.2 90.4 7.0 83.7 13.5 12.5 1.1 .:020 85.3 77.5 7.9 7.3 0.5 87.3 87.9 89.3 7.3 85.0 12.0 12.5 1.4021 85.1 77.5 7.6 7.2 0.5 86.5 88.0 88.9 7.2 83.9 11.5 11.5 0.8022 85.5 77.6 7.9 7.2 0.5 87.3 88.0 89.1 7.3 84.0 12.5 13.0 1.2023 86.2 78.4 7.8 6.4 0.4 87.6 89.1 89.9 6.5 85.2 16.0 15.0 0.8
Av.. 85.8 78.0 7.8 7.0 0.5 87.4 88.4 89.5 7.1 84.4 13.1 12.9 1.1St Dv 0.8 0.7 0.1 0.3 0.1 0.6 0.7 0.6 0.3 0.7 1.8 1.3 0.3"90Z CI 0.7 0.7 0.1 0.3 0.1 0.5 0.6 0.6 0.3 0.6 1.7 1.2 0.3
1000 FT. FLYOVER -- TARGET ]AS 145 KTS
E24 85.0 75.4 9.6 7.9 0.5 87.2 86.7 87.8 7.8 93.4 16.5 16.0 1.4 aE25 84.4 76.2 8.1 6.4 0.4 - 86.4 87.4 - 94.4 18.5 - 1.0E26 85.5 75.9 9.6 8.1 0.6 87.8 87.7 88.8 7.8 94.1 15.5 14.5 1.3E27 85.6 78.2 7.5 6.6 0.4 88.3 88.9 89.8 7.0 95.9 13.51 16.0 1.0E28 85.9 76.4 9.4 7.7 0.5 88.2 87.9 89.3 7.4 94.3 16.5 16.0 1.4
A y. 85.3 76.4 8.8 7.3 0.5 87.9 87.5 88.6 7.5 94.4 16.1 15.6 1.2"SD 0.6 1.0 1.0 0.8 0.1 0.5 1.0 1.0 0.4 0.9 1.8 0.7 0.2
90M CI 0.6 1.0 0.9 0.7 0.1 0.6 0.9 1.0 0.4 0.9 1.7 0.9 0.2

TABKE NO. A.4-4.1
SIKORSKY S-76 HELICOPTER (SPIRIT) 5OT/Tsc5/10/84 ""
SIARY NOISE LEYEl. DATA
AS NEASURED "
SIE: 4 CENTERLINE - 150 N. WEST JUNE 13,1983
EV SEL ALs SEL-AL& KMA) 0 EPHL PKll P#Lla K(P) OASPL* DiUR(A)OURMP) 1C
TAKEOFF -- Target IAS 74 KTS (ICAO)
F29 84.4 76.3 8.1 7.3 0.5 97.9 88.6 89.9 7.2 79.7 13.0 12.5 1.3F30 86.7 78.5 8.2 7.6 0.6 90.1 90.2 91.8 7.7 81.1 12.0 12.0 2.1F31 86.6 77.7 8.9 7.8 0,6 89.6 89.7 91.7 7.1 90.3 14.0 13.0 2.0
F32 85.5 77.2 8.3 7.3 0.5 88.9 88.8 90.9 7.3 80.0 13.5 12.5 2.1
F33 85.8 78.4 7.4 7.1 0.5 89.4 90.0 92.2 7.0 80.7 11.0 10.5 2.2
F14 85.0 77.6 7.4 6.8 0.4 88.6 89.3 91.3 6.8 79.3 12.5 12.0 2.1
F35 85.7 78.5 7.3 7.4 0.6 89.6 90.3 92.5 7.4 82.0 9.5 9.0 2.2
F36 85.2 76.7 8.6 7.6 0.5 88.5 88.6 90.5 7.4 80.7 13.5 12.0 2.0
An. 85.6 77.6 8.0 7.4 0.5 89.1 89.4 91.4 7.2 90.5 12.4 11.7 2.0 LStd Dv 0.8 0.8 0.6 0.3 0.0 0.7 0.7 0.9 0.3 0.9 1.5 1.3 0.3
901 CI 0.5 0.6 0.4 0.2 0.0 0.5 0.5 0.6 0.2 0.6 1.0 0.9 0.2
TAKEOFF - CATERGORY 8 (SEE TEXT)
H44 87.4 80.2 7.2 7.2 0.5 90.7 92.0 93.8 6.9 82.3 10.0 10.0 1.9"145 87.7 80.5 7.2 6.8 0.5 90.8 92.4 93.4 7.3 83.3 11.5 10.5 0.9 .
1H46 88.2 80.6 7.6 7.3 0.5 91.5 92.5 94.1 7.2 83.3 11.0 10.5 1.6
H47 87.0 79.4 7.6 6.7 0.4 90.3 91.6 92.5 7.0 81.7 13.5 13.0 0.9
"H48 85.6 76.6 8.9 7.6 0.5 98.8 88.7 90.0 7.7 80.3 15.0 14.0 1.9
H49 87.2 79.7 7.5 7.0 0.5 90.6 91.8 93.1 7.1 82.0 12.0 11.5 1.6
An. 87.2 79.5 7.7 7.1 0.5 90.4 91.5 92.8 7.2 82.1 12.2 11.6 1.5
S t Dv 0.9 1.5 0.7 0.3 0.0 0.9 1.4 1.5 0.3 1.1 1.8 1.6 0.5
90M CI 0.7 1.2 0.5 0.3 0.0 0.8 1.2 1.2 0.2 0.9 1.5 1.3 0.4
TAKEOFF (WITH TURN) - TARGET IAS 74 KTS
J56 84.1 76.9 7.2 7.5 0.6 - 88.2 89.7 - 80.6 9.0 - 1.6
J57 83.6 75.1 8.5 7.3 0.5 86.7 87.0 88.8 7.3 78.8 14.5 12.0 1.7
J58 84.4 77.0 7.5 6.7 0.4 87.5 88.8 90.8 6.4 80.3 13.0 11.5 2.0
J59 85.4 78.1 7.3 6.9 0.5 88.4 89.2 90.8 7.1 80.7 11.5 11.5 1.6
"J60 86.1 78.9 7.2 6.8 0.5 89.7 91.1 92.8 6.7 81.0 11.5 10.5 1.7
SAv. 84.7 77.2 7.5 7.1 0.5 88.1 88.9 90.6 6.9 80.3 11.9 11.4 1.7
St v 1.0 1.4 0.6 0.4 0.1 1.3 1.5 1.5 0.4 0.9 2.0 0.6 0.2907. CI 1.0 1.4 0.5 0.3 0.1 1.5 1.4 1.4 0.5 0.8 1.9 0.7 0.2
"I- NiSE INDEXES CALCULATED USING NEASURED DATA INCORRECTEDFOR TEIMPERATURE,H'ILIHITY,OR AIRCRAFT DEYIATION FRON REF FLIGHT TRACK

TABLE NO. A.4-4.2
SIKORSKY S-76 HELICOPTER (SPIRIT) DOT/TSC- 5/5/84SUIIARY NOISE LEVEL DATA
AS MEASURED '
SIITE: 4 CENTERLINE - 1 N. VEST JUNEe 13,1983
EY SEL ka SEL-AL% K(A) 0 EPHL PNLHi PNLTi K(P) OASPL DUR(A) D1R(P) TC
3 DEGREE APPROACH -- TARGET IAS 74 KTS
637 90.9 84.8 6.2 6.6 0.5 94.5 98.1 98.9 6.4 94.5 8.5 7.5 0.9638 93.6 86.0 7.6 7.5 0.6 96.5 98.8 99.7 6.8 94.6 10.5 10.0 0.9639 87.3 79.5 7.8 8.4 0.7 - 92.4 93.6 - 88.2 8.5 - 1.2640 90.5 83.5 7.0 6.9 0.5 93.7 95.9 96.7 6.9 90.6 10.5 10.0 0.8641 93.6 86.5 7.2 7.3 0.5 96.5 98.9 99.7 6.8 95.7 9.5 10.0 0.8642 90.7 83.5 7.2 6.7 0.4 93.8 95.3 96.0 7.1 90.6 12.0 12.5 0.8643 91.3 85.1 6.2 6.3 0.4 93.9 96.5 97.2 6.8 91.5 9.5 9.5 0.7A.- 91.1 84.1 7.0 7.1 0.5 94.8 96.5 97.4 6.8 92.2 9.9 9.9 0.9
""y 2.1 2.3 0.6 0.7 0.1 1.3 2.3 2.2 0.2 2.7 1.2 1.6 0.2"907 CI 1.6 1.7 0.5 0.5 0.1 1.1 1.7 1.6 0.2 2.0 0.9 1.3 0.1
6 DEGREE APPROACH -- TARGET IAS 74 KTS
150 92.7 88.0 4.7 5.1 0.3 95.7 99.9 100.4 5.6 96.0 8.5 9.0 0.5151 92.1 85.2 6.9 6.2 0.4 95.2 97.6 98.3 6.2 94.1 13.0 13.0 0.8152 91.9 84.7 7.2 6.6 0.4 - 96.9 97.9 - 91.9 12.0 - 1.0153 92.7 83.3 9.4 7.5 0.5 95.5 96.2 96.8 7.4 91.9 18.0 14.5 0.6154 93.3 86.1 7.2 6.8 0.5 96.5 98.9 99.6 6.7 95.3 11.5 11.0 0.7155 92.8 87.8 4.9 5.5 0.4 95.9 99.6 100.2 6.1 95.5 8.0 8.5 0.6
Avg. 92.6 85.9 6.7 6.3 0.4 95.8 98.2 98.9 6.4 94.1 11.8 11.2 0.7Ss' S Dv 0.5 1.8 1.7 0.9 0.1 0.5 1.5 1.4 0.7 i.e 3.6 2.6 0.290! Cl 0.4 1.5 1.4 0.7 0.0 0.5 1.2 1.2 0.7 1.5 3.0 2.4 0.1
9 DEGREE APPROACH - TARGET lAS 74 K1"S
1(61 84.5 76.2 8.2 7.3 0.5 - 88.4 89.1 - 88.1 13.5 - 0.7-(62 90.7 83.2 7.5 6.5 0.4 93.7 95.3 96.0 6.9 91.0 14.0 13.0 0.91(63 86.9 76.8 10.1 7.8 0.5 90.1 89.9 90.6 7.4 86.3 20.0 19.0 0.71(64 86.9 78.0 8.9 6.3 0.3 89.6 91.5 92.2 6.5 88.8 26.0 14.0 0.71(65 88.0 80.4 7.6 5.6 0.3 91.0 93.2 94.0 6.1 90.1 23.0 13.5 0.91K66 86.7 77.7 9.0 6.7 0.4 90.2 91.0 91.8 6.7 87.4 22.0 18.0 0.8
Avg. 87.3 78.7 8.5 6.7 0.4 90.9 91.5 92.3 6.7 88.6 19.7 15.5 0.8Std Dv 2.0 2.6 1.0 0.8 0.1 1.6 2.4 2.5 0.5 1.7 5.0 2.8 0.1M90 CI 1.7 2.2 0.8 0.6 0.1 1.6 2.0 2.0 0.4 1.4 4.1 2.7 0.1
- - NOISE INDEXES CALCULATED USING REAMSUED DATA UNCORRECTEDFOR TERPERATUREHUIIIDITYOR AIRCRAFT DEVIATION FROR REF FLIGHT TRACK
.- ;• .- '.-.: :.' -.. %.;-- , -. r.... .. .. .:. -., .. . .- r-r- - .--.-. - . . .- . - . . .. . • - . -. . .
"-�r TABLE N0. A.4-4.3
SIKORSKY S-76 HELICOPTER (SPIRIT) OUT/TSCS/ 9/84
SWIARWY NOISE LEVEL DATA
AS MEASURED '
"SITE: 4 CENTERLINE - 150 M. VEST JUNE 13,1983
EV SEL MLm SEL-ALU K(A) 0 EPKL PMLe PNLT% K(P) OASPL OUR(A) OUR(P) TC
500 FT. FLYOVER -- TARGET IAS 145 KTS
Al 90.2 85.0 5.2 5.9 0.4 93.4 97.4 98.0 6.1 99.3 7.5 7.5 0.6"A2 90.0 84.1 5.9 6.3 0.5 92.7 96.4 96.6 6.7 98.2 8.5 8.0 0.3"A3 89.9 84.6 5.3 6.3 0.5 93.0 97.1 97.6 6.2 99.1 7.0 7.5 0.5
.'- AS 90.0 84.4 5.6 6.2 0.5 93.3 97.1 97.8 6.1 99.1 8.0 8.0 0.7A6 90.3 84.2 6.0 6.5 0.5 93.3 96.8 97.4 6.5 98.1 8.5 8.0 0.6
Av . 90.1 84.5 5.6 6.2 0.5 93.1 97.0 97.5 6.3 98.8 7.9 7.8 0.5SJ-Ov 012 0.4 0.4 0.2 0.0 0.3 0.4 0.5 0.3 0.6 0.7 0.3 0.290ZCI 0.2 0.3 0.3 0.2 0.0 0.3 0.4 0.5 0.2 0.5 0.6 0.3 0.1
500 FT. FLYOVER -- TARGET IAS 130 KTS
87 87.8 82.1 5.7 6.5 0.5 91.1 94.8 95.5 6.4 93.0 7.5 7.5 0.788 98.1 82.2 5.9 6.4 0.5 91.1 94.2 95.2 6.5 93.2 8.5 8.0 1.089 86.9 80.7 6.1 6.6 0.5 89.8 92.9 94.0 6.2 92.4 8.5 8.5 1.2 ."810 ---- NO DATA -.
t11 87.5 81.7 5.9 6.3 0.5 90.4 94.0 94.6 6.4 92.8 8.5 8.0 0.6812 88.3 82.4 5.9 6.5 0.5 91.2 94.5 95.4 6.2 93.3 8.0 8.5 0.9813 86.0 79.8 6.2 6.5 0.5 88.7 91.9 92.6 6.4 91.8 9.0 9.0 0.7
Avg. 87.4 81.5 5.9 6.5 0.5 90.4 93.7 94.6 6.4 92.8 8.3 8.2 0.8Std 'I 0.9 1.0 0.2 0.1 0.0 1.0 1.1 1.1 0.1 0.6 0.5 0.5 0.2M90 CI 0.7 0.8 0.1 0.1 0.0 0.8 0.9 0.9 0.1 0.5 0.4 0.4 0.2
500 FT. FLYOVER -- TARGET IAS 115 KTS ,
C14 85.6 78.4 7.2 6.8 0.5 88.2 90.1 91.1 6.9 85.5 11.5 11.0 1.0C15 86.2 90.4 5.8 6.4 0.5 89.3 92.5 93.5 6.2 86.3 8.0 8.5 0.9C17 83.6 77.7 5.8 6.3 0.5 86.1 89.1 90.0 6.3 88.1 8.5 9.0 1.0CIS 86.2 79.7 6.6 6.6 0.5 89.0 91.6 92.6 6.6 86.4 10.0 9.5 0.9
MAvg 85.4 79.1 6.4 6.5 0.5 88.1 90.8 91.8 6.5 86.6 9.5 9.5 1.0DyS•I 1.3 1.2 0.7 0.2 0.0 1.5 1.6 1.5 0.3 1.1 1.6 1.1 0.0
"90Z Cl 1.5 1.4 0.8 0.3 0.0 1.7 1.8 1.8 0.4 1.3 1.9 1.3 0.0
500 FT. FLYOVER -- TARGET IAS 100 KTS
D19 86.6 79.9 6.7 6.7 0.5 89.4 92.0 92.6 6.8 85.6 10.0 10.0 0.6020 86.1 78.2 7.9 7.1 0.5 88.9 90.1 91.3 6.9 81.5 13.0 12.5 1.3""21 83.9 77.2 6.7 6.7 0.5 86.9 89.3 90.2 6.7 81.6 10.0 10.0 0.9"022 85.8 77.8 7.9 7.2 0.5 88.8 90.4 91.6 6.9 82.0 12.5 11.0 1.2"023 85.6 78.8 6.8 6.1 0.4 88.4 91.1 92.3 6.4 84.4 13.0 9.0 1.3
R AvE. 85.6 78.4 7.2 6.8 0.5 88.5 90.6 91.6 6.7 83.0 11.7 10.5 1.1St4Ov 1.0 1.0 0.6 0.4 0.1 1.0 1.0 0.9 0.2 1.9 1.6 1.3 0.3M C. 1.0 1.0 0.6 0.4 0.0 0.9 1.0 0.9 0.2 1.8 1.5 1.3 0.3
1000 FT. FLOVER - TARGET lAS 145 KTS
E24 83.6 74.9 8.6 7.3 0.5 85.7 86.3 87.5 7.3 92.4 15.0 13.5 1.2E25 83.3 74.6 8.8 7.0 0.4 - 85.6 86.5 - 90.6 17.5 - 0.8E26 83.3 74.6 8.7 7.4 0.5 85.7 86.5 87.1 7.2 93.0 15.0 15.5 0.7"E27 85.5 77.7 7.8 6.8 0.4 88.0 88.8 89.3 7.3 94.6 14.0 15.5 1.0E28 84.4 76.0 8.4 7.1 0.5 86.8 87.7 88.4 7.1 93.1 15.0 15.0 0.9
A". 84.0 75.6 8.5 7.1 0.5 86.6 87.0 87.8 7.2 92.7 15.3 14.9 0.9Std D" 0.9 1.3 0.4 0.2 0.0 1.1 1.3 1.1 0.1 1.5 1.3 0.9 0.290Z C| 0.9 1.3 0.4 0.2 0.0 1.2 1.2 1.1 0.1 1.4 1.2 1.1 0.2
S.• . .- . • : . . . . . - . ' 2- . . _• . . , . . . . . . -' -. • -• . . - -. - ._ , . - . . . . . . . . . . ' ,
TABLE NO. A.4-5.1
SIKORSKY S-76 HELICOPTER (SPIRIT) OOT/TSC 05/7184 ''SUMMY NOISE LEVEL DATA
AS MEASURED .
SITE: 5 CENTERLINE - 188 M. EAST JUNE 13,1983
EV SEL AL& SEL-ALs K(A) 0 EPNL PNL% PNLT% K(P) OASPLs OUR(A) OURP) TC
TAKEOFF-- Target IAS 74 KTS (ICAO)
F29 86.8 79.6 7.2 7.4 0.6 90.9 92.0 94.3 6.9 84.1 9.5 9.0 2.3F30 87.1 79.3 7.7 7.4 0.5 90.9 92.0 94.3 6.8 84.1 11.0 9.5 2.4F31 88.1 80.9 7.1 7.1 0.5 91.8 93.4 95.2 6.9 84.2 10.0 9.0 1.9F32 85.9 79.0 6.9 6.8 0.5 90.0 91.2 93.1 6.8 81.9 10.5 10.5 2.0P33 86.4 80.0 6.4 6.7 0.5 90.7 92.4 94.6 6.6 82.9 9.0 8.5 2.2F34 87.7 81.3 6.4 6.9 0.5 91.8 93.8 95.9 6.7 84.2 8.5 7.5 2.1F35 87.9 81.8 6.1 6.8 0.5 91.9 94.4 96.0 6.8 85.1 8.0 7.5 1.6F36 87.4 81.1 6.3 6.7 0.5 91.7 93.9 96.0 6.3 84.7 8.5 8.0 2.1
Av• 87.2 80.4 6.8 7.0 0.5 91.2 92.9 94.9 6.7 83.9 9.4 8.7 2.1"Dv 0.7 1.0 0.6 0.3 0.0 0.7 1.1 1.1 0.2 1.0 1.1 1.0 0.2
90M CI 0.5 0.7 0.4 0.2 0.0 0.5 0.8 0.7 0.1 0.7 0.7 0.7 0.2
TAKEOFF -- CATERGORY B (SEE TEXT)
14-4 88.6 81.3 7.3 7.1 0.5 92.4 93.7 95.9 6.6 83.7 10.5 10.0 2.1H45 87.9 79.5 8.3 7.4 0.5 91.8 91.9 93.7 7.2 82.3 13.5 13.0 1.7 S146 88.1 79.9 8.3 7.5 0.5 92.1 92.5 94.6 7.2 83.2 12.5 11.0 2.3M47 87.3 79.2 8.1 7.0 0.5 91.2 91.9 94.0 6.7 82.2 14.0 12.0 2.2148 88.0 80.3 7.7 7.1 0.5 92.0 92.9 95.1 6.6 83.5 12.0 11.0 2.21H49 87.6 79.0 8.6 7.4 0.5 91.5 91.4 93.3 7.3 81.7 14.5 13.5 1.8
Avg. 87.9 79.9 8.0 7.3 0.5 91.8 92.4 94.4 6.9 82.8 12.8 11.7 2.1Std Dv 0.4 0.8 0.5 0.2 0.0 0.4 0.8 1.0 0.3 0.8 1.5 1.3 0.2"90I C! 0.4 0.7 0.4 0.2 0.0 0.4 0.7 0.8 0.3 0.7 1.2 1.1 0.2 .
TAKEOFF (WITH TURN) -- TARGET IAS 74 KTS
J56 89.0 82.7 6.2 6.7 0.5 93.2 95.5 97.1 6.9 85.8 8.5 7.5 2.1J57 87.9 80.6 7.2 7,2 0.5 92.0 93.5 95.4 7.0 84.4 10.0 9.0 2.1J58 88.3 82.1 6.1 6.6 0.5 92.2 94.9 96.5 6.6 85.7 8.5 7.5 1.6J59 88.4 82.0 6.4 6.5 0.5 92.5 94.7 96.6 6.4 85.7 9.5 8.5 2.2 OJ60 88.9 83.0 5.9 6.7 0.5 93.1 95.7 97.9 6.2 86.4 7.5 7.0 2.3
"Av . 88.5 82.1 6.4 6.8 0.5 92.6 94.9 96.7 6.6 85.6 8.8 7.9 2.0StI Ov 0.5 0.9 0.5 0.3 0.0 0.5 0.9 0.9 0.3 0.7 1.0 0.8 0.390% CIl 0.4 0.9 0.5 0.3 0.0 0.5 0.8 0.9 0.3 0.7 0.9 0.8 0.3
* - NOISE INDEXES CALCULATED USING IMEASURE"FOR TEiPERATURE,MJIDITY,OR AIRCRAFT DEVIATION FROM REF FLIGHT TRACK
0*%
0-::

TABLE NO. A.4-5.2
SIKORSKY S-76 HELICOPTER (SPIRIT) DOT/TSC 8,45/7184,:, :-
SUNMARY NOISE LE'EL DATA
AS MiEASURED
SITE: 5 CENTERLINE - 188 N. EAST JUNE 13,1983
EV SEL Au SEL-AL& K(A) 0 EPHL PKI% PHLTW K(P) APLD OUR() DURMP) TC-- .. .... .............. ... .... .. .......- -:-:--
3 DEGREE APPROACH -- TARGET IAS 74 KTS
G37 93.8 86.6 7.2 7.0 0.5 96.5 98.4 99.1 7.1 94.3 10.5 11.0 0.9638 94.6 89.8 4.8 5.5 0.4 97.2 101.9 102.3 5.6 98.4 7.5 7.5 0.5 -47G39 94.6 88.0 6.6 6.9 0.5 - 100.6 101.3 - 96.9 9.0 - 0.6GAO 93.1 86.3 6.8 6.8 0.5 96.1 98.2 98.9 7.0 93.1 10.0 10.5 0.7G41 92.9 85.9 7.0 7.0 0.5 95.6 97.2 97.8 7.7 92.8 10.0 10.5 0.6642 94.1 86.9 7.2 7.2 0.5 96.9 98.7 99.3 7.5 95.7 10.0 10.0 0.6G43 90.5 82.4 8.1 6.8 0.4 93.4 94.9 96.0 6.8 90.2 15.5 12.0 1.1
Avg. 93.4 86.6 6.8 6.7 0.5 95.9 98.6 99.2 7.0 94.5 10.4 10.2 0.7St Dv 1.4 2.3 1.0 0.6 0.0 1.4 2.3 2.1 0.7 2.8 2.5 1.5 0.2907 CI 1.1 1.7 0.7 0.4 0.0 1.1 1.7 1.5 0.6 2.0 1.8 1.2 0.2
6 DEGREE APPROACH -- TARGET IAS 74 KTS.
150 95.1 90.1 5.0 5.7 0.4 98.1 103.1 103.7 5.7 99.6 7.5 6.0 0.6151 94.5 88.7 5.9 6.7 0.5 98.1 101.1 102.1 6.9 97.9 7.5 7.5 1.0152 95.4 88.6 6.7 6.6 0.4 - 101.1 101.9 - 97.1 10.5 - 0.9153 96.2 91.5 4.6 5.3 0.4 99.2 103.7 104.2 5.6 99.4 7.5 7.5 0.7154 93.1 87.4 5.7 5.7 0.4 96.6 100.6 101.4 5.4 97.9 10.0 9.0 0.8155 92.8 85.4 7.4 7.1 0.5 96.3 99.1 99.9 6.4 95.8 11.0 10.0 0.7
Avg. 94.5 88.6 5.9 6.2 0.4 97.7 101.4 102.2 6.0 98.0 9.0 8.0 0.8Std v 1.3 2.1 1.0 0.7 0.1 1.2 1.7 1.6 0.6 1.4 1.7 1.5 0.1902 CI 1.1 1.7 0.9 0.6 0.0 1.2 1.4 1.3 0.6 1.2 1.4 1.5 0.1 JL
9 DEGREE APPROACH - TARGET IAS 74 KTS
K61 86.9 79.9 7.0 7.1 0.5 - 92.9 93.6 - 92.6 9.5 - 0.6K62 88.2 79.9 8.2 7.6 0.6 - 92.9 93.4 - 89.5 12.0 - 0.5K63 90.4 84.5 5.9 6.2 0.4 94.6 98.6 99.8 5.4 95.6 9.0 8.0 1.2K64 86.6 80.4 6.2 6.3 0.4 90.4 92.9 93.9 6.8 91.6 9.5 9.0 1.4K65 8v.9 79.6 7.3 6.8 0.5 - 92.1 92.8 - 89.9 12.0 - 0.7K66 86.8 80.0 6.8 6.4 0.4 90.4 92.6 93.6 6.5 91.2 11.5 11.0 0.7
Avr. 87.6 80.7 6.9 6.8 0.5 91.8 93.7 94.5 6.2 91.7 10.6 9.3 0.9'vSt••Dv 1.5 1.9 0.8 0.5 0.1 2.4 2.4 2.6 0.8 2.2 1.4 1.5 0.390% Cl 1.2 1.5 0.7 0.4 0.0 4.1 2.0 2.1 1.3 1.8 1.1 2.6 0.3
N* - OISE INDEXES CALCULATED USING REASURED DATA UNCORRECTEDFOR TENPERATUREHUMIDITYIDR AIRCRAFT DEVIATION FROM REF FLIGHT TRACK
-t"
TABLE NO. A.4-5.3
SIKORSKY S-76 HELICOPTER (SPIRIT) DOT/TSC
SWWY NOISE LEVEL DATA
AS MEASURED *
SITE: 5 CENTERLINE - 188 N. EAST JUNE 13,1983
EV SEL ALs SEL-AL& K(A) 9 EPHL PNL& PNLTs K(P) OASPL DOR(A) DUR(P) TC
500 FT. FLYOVER -- TARGET IAS 145 KTSAl 88.8 83.4 5.4 6.1 0.5 91.9 95.9 96.4 6.2 98.3 7.5 7.5 1.0A2 89.1 83.5 5.6 6.2 0.5 91.9 95.6 96.4 6.3 97.5 8.0 7.5 0.8A3 88.9 83.3 5.6 6.4 0.5 92.0 95.9 96.6 6.2 99.9 7.5 7.5 0.7A5 88.6 83.2 5.4 6.4 0.5 91.7 95.5 96.3 6.3 98.4 7.0 7.0 1.2A6 90.8 84.9 5.9 6.5 0.5 93.7 97.2 97.9 6.2 100.1 8.0 8.5 0.7A. 89.2 83.7 5.6 6.3 0.5 92.2 96.0 96.7 6.3 98.9 7.6 7.6 0.9StdDv 0.9 0.7 0.2 0.1 0.0 0.8 0.7 0.6 0.0 1.1 0.4 0.5 0.2M90 Cl 0.8 0.7 0.2 0.1 0.0 0.8 0.7 0.6 0.0 1.1 0.4 0.5 0.2
500 FT. FLYOVER - TARMET JAS 130 KTS
"87 86.9 81.0 5.8 6.3 0.5 90.2 93.2 94.3 6.6 92.7 8.5 8.0 1.188 88.2 82.1 6.1 6.6 0.5 91.0 94.2 95.0 6.6 94.1 8.5 8.0 0.989 86.1 80.0 6.1 6.6 0.5 89.3 92.1 93.1 6.6 92.4 8.5 8.5 1.1810 87.2 80.8 6.3 6.6 0.5 90.1 92.9 93.9 6.3 92.9 9.0 9.5 1.0811 86.9 81.2 5.8 6.4 0.5 89.8 93.1 93.9 6.5 95.2 8.0 8.0 0.7812 87.8 82.2 5.6 6.2 0.5 90.4 93.7 94.6 6.6 94.3 8.0 7.5 1.0813 85.4 79.0 6.4 6.7 0.5 88.2 90.8 91.8 6.7 92.6 9.0 9.0 1.2Avg. 86.9 80.9 6.0 6.5 0.5 89.9 92.9 93.8 6.6 93.4 8.5 8.4 1.0"Std v 1.0 1.1 0.3 0.2 0.0 0.9 1.1 1.1 0.1 1.1 0.4 0.7 0.2"90% Cl 0.7 0.8 0.2 0.1 0.0 0.7 0.8 0.8 0.1 0.8 0.3 0.5 0.1
500 FT. FLYOVER -- TARGET IAS 115 KTS
C14 86.5 79.9 6.6 6.4 0.4 89.3 91.7 92.9 6.4 87.0 11.0 10.0 1.1C15 85.9 80.0 5.9 6.2 0.4 88.8 92.0 93.2 6.0 87.3 9.0 8.5 1.3C17 84.4 78.3 6.1 6.6 0.5 87.2 90.1 91.2 6.7 89.9 8.5 8.0 1.1CIO OE.8 79.3 6.5 6.5 0.4 88.6 91.2 92.3 6.4 87.5 10.0 9.5 1.1DAv• 85.7 79.4 6.3 6.4 0.4 88.5 91.2 92.4 6.4 87.9 9.6 9.0 1.2
St Dr 0.9 0.8 0.3 0.2 0.0 0.9 0.8 0.9 0.3 1.4 1.1 0.9 0.190% CI 1.0 0.9 0.4 0.2 0.0 1.0 1.0 1.1 0.3 1.6 1.3 1.1 0.1
500 FT. FLYOVER - TARGET IAS 100 KTS
019 84.3 77.0 7.3 6.5 0.4 87.2 89.5 90.4 6.4 81.8 13.0 12.0 0.9020 85.7 78.5 7.3 6.7 0.4 88.7 90.9 92.1 6.3 82.3 12.0 11.0 1.2"021 84.0 77.4 6.6 6.7 0.5 86.9 89.7 90.6 6.7 82.3 9.5 9.0 0.9D22 85.6 78.1 7.5 6.8 0.4 88.6 90.3 91.4 6.7 82.1 13.0 12.0 1.0"D23 85.7 78.8 7.0 7.1 0.5 88.4 90.8 91.6 6.9 83.8 9.5 9.5 0.9SAvg. 85.1 78.0 7.1 6.8 0.5 88.0 90.2 91.2 6.6 82.5 11.4 10.7 1.0Std Dv 0.9 0.7 0.4 0.2 0.0 0.8 0.6 0.7 0.2 0.8 1.8 1.4 0.2M90 Cl 0.8 0.7 0.4 0.2 0.0 0.8 0.6 0.7 0.2 0.8 1.7 1.3 0.2
"1000 FT. FLYOVER -- TARGET IAS 145 KTS
E24 83.1 74.9 8.2 6.8 0.4 - 85.9 86.9 - 93.1 15.5 - 1.0E25 83.9 73.9 10.0 8.0 0.6 - 85.4 86.4 - 92.0 17.5 - 1.0E26 82.9 74.3 8.6 7.3 0.5 85.3 85.2 86.2 7.3 92.8 15.5 17.0 1.0E27 85.2 77.0 8.2 7.1 0.5 87.3 88.3 88.8 7.3 94.2 14.0 14.5 0.5E28 83.5 75.1 8.5 7.2 0.5 85.7 85.8 87.1 7.1 93.4 15.0 16.5 1.3Avq. 83.7 75.0 8.7 7.3 0.5 86.1 86.1 87.1 7.2 93.1 15.5 16.0 1.0Std Dv 0.9 1.2 0.7 0.4 0.1 1.1 1.2 1.0 0.1 0.8 1.3 1.3 0.390% Cl 0.8 1.1 0.7 0.4 0.1 1.8 1.2 1.0 0.2 0.7 1.2 2.2 0.3
APPENDIX B
Direct Read Acoustical Data and DurationFactors for Flight Operations
In addition to the magnetic recording systems, four direct-read, Type-inoise measurement systems were deployed at selected sites during flightoperations. The data acquisition is described in Section 5.6.2.
These direct read systems collected single event data consisting ofmaximum A-weighted sound level (AL), Sound Exposure Level (SEL),integration time (T), and equivalent sound level (LEQ). The SEL and dBA,as well as the integration time were put into a computer data file andanalyzed to determine two figures of merit related to the event durationinfluence on the SEL energy dose metric. The data reduction is furtherdescribed in Section 6.2.2; the analysis of these data is discussed inSection 9.3. S
This appendix presents direct read data and contains the results of thehelicopter noise duration effect analysis for flight operations. Thedirect read acoustical data for static operations is presented inAppendix D. -I-Each table within this appendix provides the following information:
Run No. The test run number
SEL(dB) Sound Exposure Level, expressed in decibels
AL(dB) A-Weighted Sound Level, expressed in decibels
T(IO-dB) Integration time
K(A) Propagation constant describing the change in dBA withdistance L
Q Time history "shape factor"
Average The average of the column
N Sample size L
Std Dev Standard Deviation
90% C.I. Ninety percent confidence interval
Mic Site The centerline mircophone site at which the measurementswere taken
........ .%

TABLE 8.1.1
HELICOPTER: SIKORSKY S-76
TEST DATE: 6-13-83
OPERATION: 500 FT FLYOVER(1.ONME)/TARGET IAS=145 KTS
HIC SITE: 5
RUN NO. SEL(DB) AL(DB) T(IO-DB) K(A) 0
Al 89.8 84.8 7 5.9 .5A2 89.6 84 8 6.2 .5A3 89.8 84.2 8 6.2 .5A4 91.3 86 7 6.3 .5A5 89.1 84 7 6 .5A6 91.5 85.8 8 6.3 .5
AVERAGE 90.20 84.80 7.50 6.20 .5
N 6 6 6 6 6
STD.DEV. 0.98 0.90 0.55 .15 .01
907. C.I. 0.81 0.74 0.45 .12 .01
TABLE 8.1.2
HELICOMlER: SIKORSKY S-76
TEST DATE: 6-13-83
OPERATION: 500 FT FLYOVER(! .OI*ME)/TARGET IAS=145 KTS
MIC SITE: I
RUN NO. SEL(DB) AL(DB) T(UO-DB) K(A) 0
Al 90.8 85 6.9 .5A2 90.6 84.1 9 6.8 .5A3 90.9 85.6 6 6.8 .6A4 NA N NA N NAA5 90.3 84.6 8 6.3 .5A6 92 85.6 7 7.6 .6
AVERAGE 90.90 85.00 7.40 6.90 .9
N 5 5 5 5 5
STD.DEV. 0.65 0.65 1.14 .45 .06
90" C.I. 0.62 0.62 1.09 .43 .06
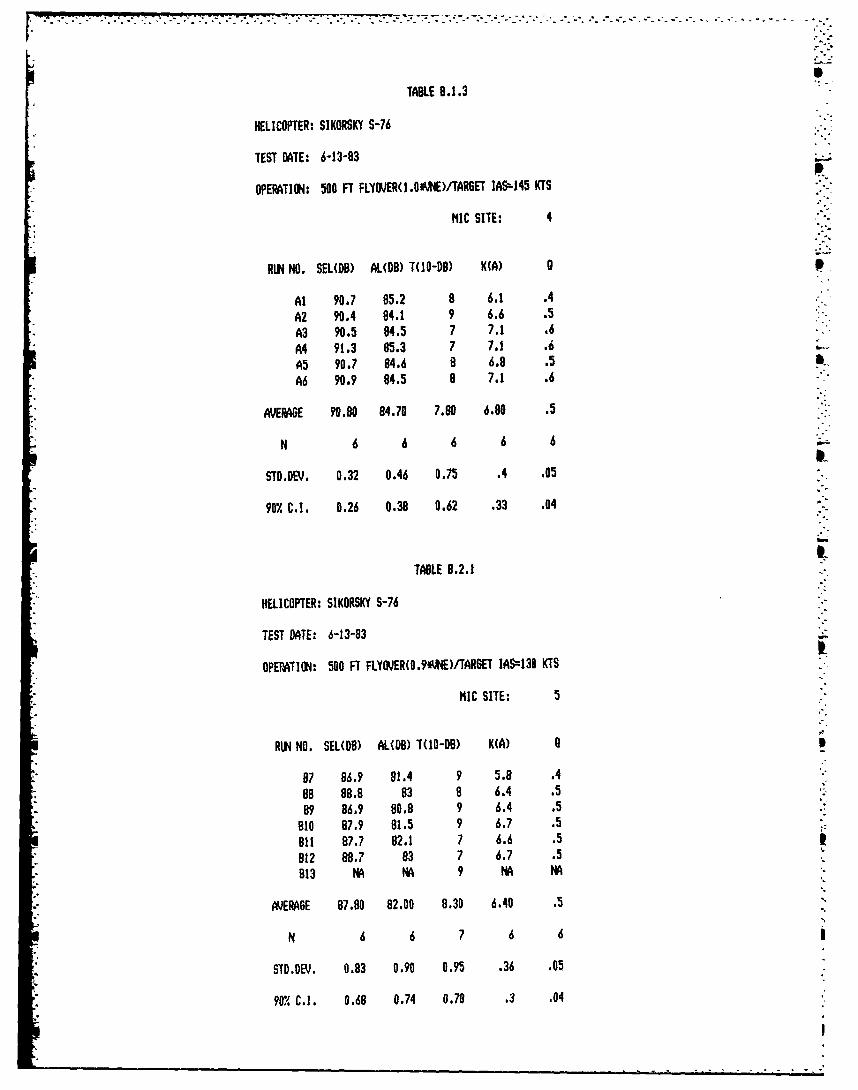
r ~ --. . - *.~* - -- i---. -'-. ,---- ---- ---
iS
TABLE 0.1.3
HELICOPTER: SIKORSKY S-76
TEST DATE: 6-13-83
OPERATION: 500 FT FLY)ER(1I.Oi•ME)/TARGET IA9,-145 KTS
MIC SITE: 4
RUN NO. SEL(DB) ALUDB) T(IO-DB) K(A) ,
Al 90.7 85.2 8 6.1 .4A2 90.4 84.1 9 6.6 .5
A3 90.5 84.5 7 7.1 .6A4 91.3 85.3 7 7.1 .6A5 90.7 84.6 8 6.8 .5 .A6 90.9 84.5 8 7.1 .6
AVERAGE 90.80 84.70 7.80 6.80 .5
N6 6 6 6
STD.DEV. 0.32 0.46 0.75 .4 .05
907. C.I. 0.26 0.38 0.62 .33 .04
TABLE 8.2.1
"HELICOPTER: SIKORSKY S-76
TEST DATE: 6-13-83
OPERATION: 500 FT FLYIIJER(0.9#MNE)/TARGET IAS-130 KIS
MIC SITE: 5
RUN NO. SEL(D8) AL(DB) T(IO-DB) K(A) 0
87 86.9 81.4 9 5.8 .488 88.8 83 8 6.4 .5B9 86.9 80.8 9 6.4 .5
810 87.9 81.5 9 6.7 .5811 87.7 82.1 7 6.6 .5B12 88.7 83 7 6.7 .5B13 N N 9 NA NA
A'ERAGE 87.80 82.00 8.30 6.40 .5
N 6 6 7 6 6
STD.DEV. 0.83 0.90 0.95 .36 .05
90% C.I. 0.68 0.74 0.70 .3 .04
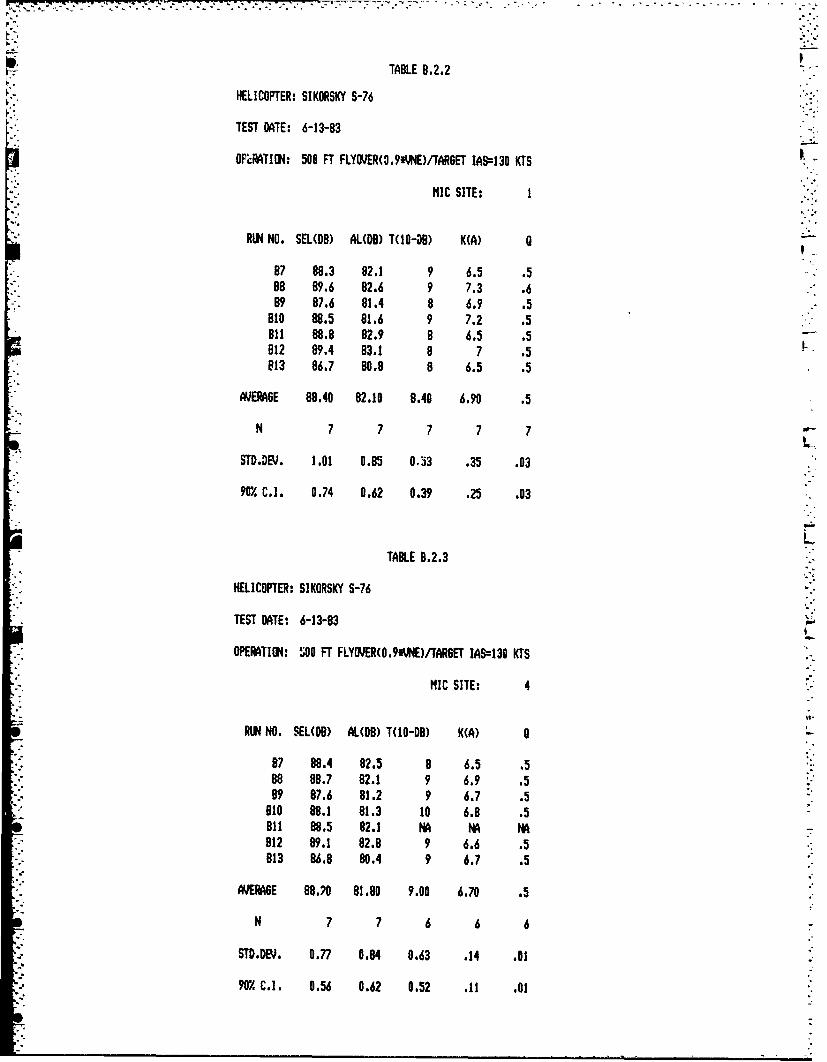
TABLE 8.2.2
HELICOPTER: SIKORSKY S-76
TEST DATE: 6-13-83
OPERATION: 500 FT FLYO•ER(O.9'ME)/TAR6ET IAS=130 KTS
IIC SITE: I
RUN NO. SEL(DB) AL(DB) T(IO-DOB) K(A) 9
87 88.3 82.1 9 6.5 .588 89.6 82.6 9 7.3 .6B9 87.6 81.4 8 6.9 .5
810 88.5 81.6 9 7.2 .5811 88.8 82.9 8 6.5 .5812 89.4 83.1 8 7 .5813 86.7 80.8 8 6.5 .5
AVERA6E 88.40 82.10 8.40 6.90 .5
N 7 7 7 7 7
STD.DEV. 1.01 0.85 0,53 .35 .03
"90M. C.I. 0.74 0.62 0.39 .25 .03
TABLE B.2.3
HELICOPTER: SIKORSKY S-76
TEST DATE: 6-13-83
OPERATION: S00 FT FLYOPJR(o.9M•E)/TARGET IAS=130 KTS
MIC SITE: 4
RUN NO. SELIDB) ALUDB) T(IO-DB) K(A) 0
87 88.4 82.5 8 6.5 .588 88.7 82.1 9 6.9 .589 87.6 81.2 9 6.7 .5
810 88.1 81.3 10 6.8 .5811 88.5 82.1 NA NA NA812 89.1 82.8 9 6.6 .5813 86.8 80.4 9 6.7 .5
-AERA6E 88.70 81.80 9.00 6.70 .5
N 7 7 6 6 6
"STD.DEV. 0.77 0.84 0.63 .14 .01
"90./ C.I. 0.56 0.62 0.52 .11 .01

- -..Ts-~---
".-- TABLE 8.3.1
HELICOPTER: SIKORSKY 5-7 T E
TEST DATE: 6-13-83
OPERATION: 500 FT FLYOF.R.M,8#OE)/TAR6ET IAS=115 KTS
•IC SITE: 5
RUN NO. SEL(O)) AL(DB) T(IO-DB) K(A) 0
"C14 87.2 80.6 10 6.6 .5Ci5 86.8 80.8 9 6.3 .4Cid 86.1 79.1 It 6.7 .5C17 85.2 79.2 9 6.3 .4C18 86.7 80.1 10 6.6 .5
AVERGE 86.40 80.00 9.80 6.50 .5
N 5 5 5 5 5L9
STD.DEV. 0.78 0.78 0.84 .2 .01
90r/. C.I. 0.74 0.75 0.80 .19 .01
TABLE 8.3.2
HELICOPTER: SIKORSKY S-76
TEST DATE: 6-13-83
OPERATION: 500 FT FLY)VER(O.SME)/TARGET IAS=115 KTS
MIC SITE: I
RIUN NO. SEL(DB) AL(DB) T(IO-DB) K(A) a
C14 87.5 80.2 10 7.3 .5C15 87.3 81.2 8 6.8 .5Ci6 86.7 79.2 10 7.5 .6C17 85.5 79.4 8 6.8 .5CIO 87.3 80.3 10 7 .5
AVERAGE 86.90 80.10 9.20 7.10 .5
N 5 5 5 5 5
STD.DEV. 0.82 0.80 1.10 .33 .03
90" C.. 0.78 0.76 1.04 .32 .02
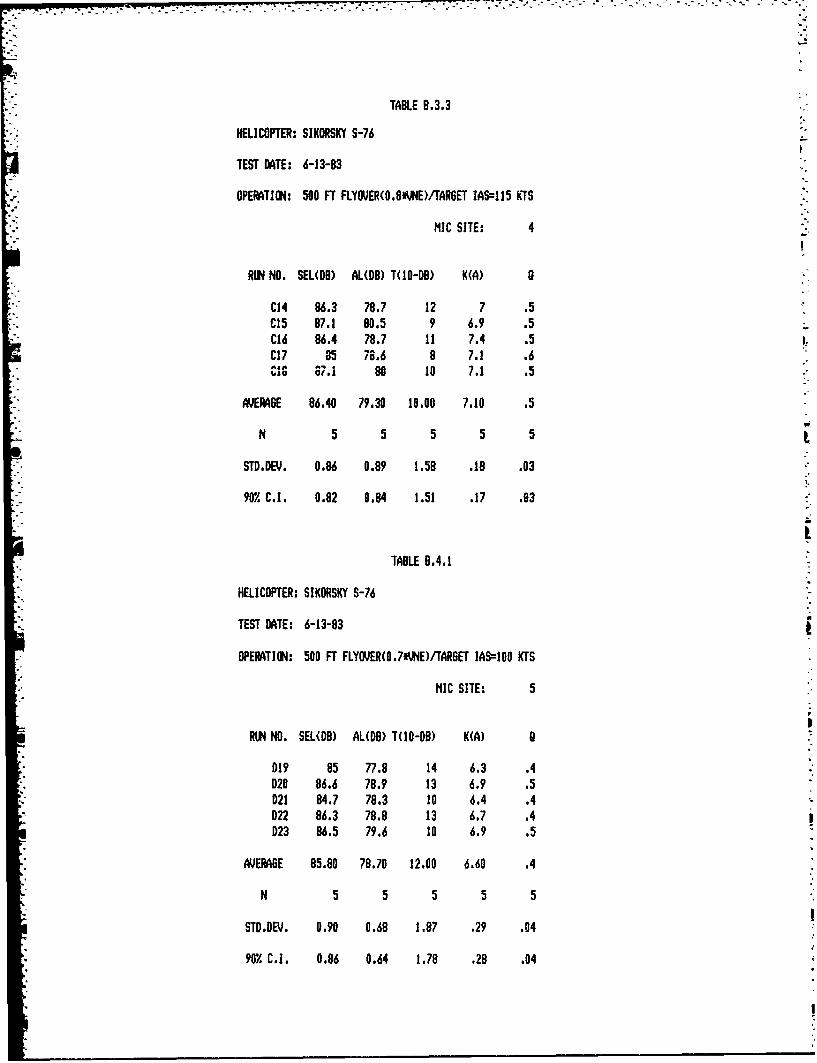
"TABLE B.3.3
HELICOPTER: SIKORSKY S-76
TEST DATE: 6-13-83
OPERATION: 500 FT FLYOVER(O,8"AIE)/TARGET 1AS=115 kTS
lIC SITE: 4
RUN NO. SEL(DB) AUL(DB) T(0-D) K(A) a
C14 86.3 78.7 12 7 .5C15 87.1 80.5 9 6.9 .5C16 86.4 78.7 11 7.4 .5C17 85 78.6 8 7.1 .6CIS 87.1 80 10 7.1 .5
VERAGE 86.40 79.30 10.00 7.10 .5
N 5 5 5 5 5
STD.DEV. 0.86 0.89 1.58 .18 .03
90. C.1. 0.82 0.84 1.51 .17 .03
TABLE B.4.1
HELICOPTER: SIKORSKY S-76
TEST DATE: 6-13-83
OPERATI•N: 500 FT FLYOVER(O.7',NE)/TAR6ET IAS=100 KTS
MIC SITE: 5
RUN NO. SEL(DB) AL(DB) T(IO-DB) K(A) a
019 85 77.8 14 6.3 .4020 86.6 78.9 13 6.9 .5021 84.7 78.3 10 6.4 .4D22 86.3 78.9 13 6.7 .4023 86.5 79.6 10 6.9 .5
AVERA6E 85.80 78.70 12.00 6.60 .4
N 5 5 5 5 5
STE.DEV. 0.90 0.68 1.87 .29 .04
90"M C.I. 0.86 0.64 1.78 .28 .04
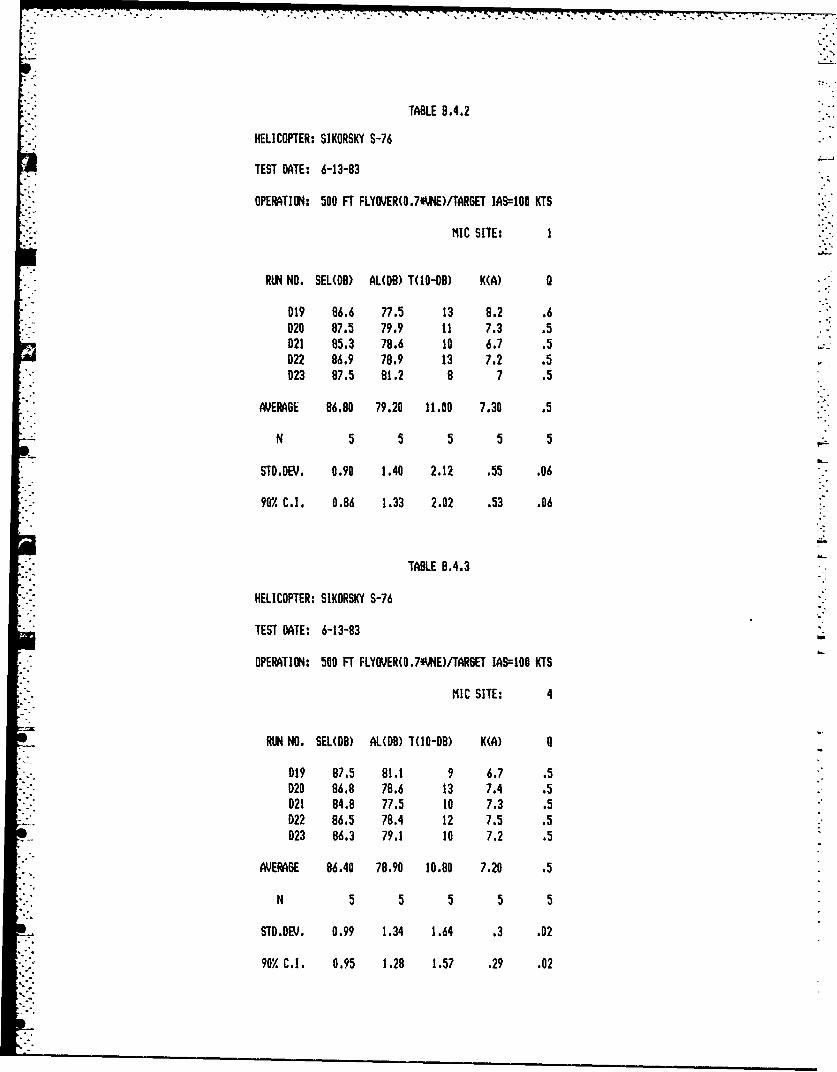
TABLE 8.4.2
HELICOPTER: SIKORSKY S-76
TEST DATE: 6-13-83
OPERATION: 500 FT FLYOVER(O.7*YIE)/TARGET IAS=t00 KTS
•IC SITE: I
RUN NO. SEL(DB) AL(DB) T(IO-DB) K(A) 0
D19 86.6 77.5 13 8.2 .6D20 87.5 79.9 11 7.3 .5021 85.3 78.6 10 6.7 .5D22 86.9 78.9 13 7.2 .5023 87.5 81.2 8 7 .5
AVERAGE 86.80 79.20 11.00 7.30 .5
N 5 5 5 5 5
STD.DEV. 0.90 1.40 2.12 .55 .06
907. C.I. 0.86 1.33 2.02 .53 .06
TABLE 8.4.3
HELICOPTER: SIKORSKY S-76
TEST DATE: 6-13-83
OPERATION: 500 FT FLYOVER(O.7lVNE)/TAR6ET IAS100 KTS
MIC SITE: 4
RUN NO. SEL(D8) AL(DB) T(IO-DB) K(A) -
019 87.5 81.1 9 6.7 .5020 86.8 78.6 13 7.4 .5021 84.8 77.5 10 7.3 .5022 86.5 78.4 12 7.5 .5023 86.3 79.1 10 7.2 .5
AVERAGE 86.40 78.90 10.80 7.20 .5
N 5 5 5 5 5
STD.DEV. 0.99 1.34 1.64 .3 .02
"90% C.]. 0.95 1,28 1.57 .29 .02

TABLE 8.5.1
HELICOPTER: SIKORSIKY S-76
TEST DATE: 6-13-83
OPERTION: 1000 FT.FLYOJER(I.O•IE)/TARET 1AS=145 KTS
MIC SITE: 5
RUN NO. SEL(DB) AL(DB) T(10-DB) K(A) O
E24 84.: 75.8 16 6.9 .4E25 84.8 74.8 17 8.1 .6E26 84 75.5 16 7.1 .4E27 85.8 77.5 14 7.2 .5E28 84.1 75.6 15 7.2 .5
AVEIR6E 84.60 75.80 15.60 7.30 .5
N 5 5 5 5 5
STD.DEV. 0.76 1.00 1.14 .48 .06
90/. C.I. 0.73 0.95 1.09 .46 .06
TABLE B.5.2
HELICOPTER: SIKORSKY S-76
TEST DATE: 6-13-83
OPERATION: 1000 FT.FLYPJER(I1.DM)iTAR6ET lAS4145 KTS
""IC SITE:
RUN NO. SEL(DB) AL(DM) T(10-D8) K(A) 0
E24 84.9 76.2 15 7.4 .5"E25 85 75 19 7.8 .5E26 84.8 76.4 14 7.3 .5E27 86.2 77.7 15 7.2 .5E28 84.8 76.6 12 7.6 .6
VERAGE 85.10 76.40 15.00 7.59 .5
N 5 5 5 5 5
STD.DEV. 0.60 0.97 2.55 .24 .03
90, C.1. 0.57 0.92 2.43 .23 .03

•.. • ..
TABLE 8.5.3
HELICOPTER: SIKORSKY 5-76
TEST DATE: 6-13-83
OPERATION: 1000 FT.FLYOVER(I.OJE)./TAR6ET IAS:145 KTS
,IC SITE: 4
RUN NO. SEL(DB) AL(DB) T(IO-DO) K(A) 0 .
E24 84.4 76.1 15 7.1 .5E25 84.3 74.8 20 7.3 .5E26 84.2 75.7 14 7.4 .5E27 85.8 77.6 14 7.2 .5E28 84.4 76 15 7.1 .5 p
AVERAGE 84.60 76.00 15.60 7.20 .5
N 5 5 5 5 5
STD.DE)V. 0.66 1.01 2.51 .14 .02
90%. C.,. 0.63 0.96 2.39 .14 .02
TABLE B.6.1
HELICOPTER: SIKORSKY S-76
TEST DATE: 6-13-83
OPEIRTION: ICAO TAKEOFF/TAR6ET IAS=74 KTS ,
NIC SITE: 5
RUN NO. SEL(O8) AL(DB) T(1O-DB) K(A) 0
F29 87.1 80 9 7.4 .6"F30 87.5 80.2 1O 7.3 .5F31 88.5 81.4 9 7.4 .6F32 86.4 79.9 10 6.5 .4F33 86.9 80.8 9 6.4 .5F34 88.2 82.2 9 6.3 .4F35 88.4 82.7 8 6.3 .5F36 87.9 81.9 9 6.3 .4
AVERA6E 87.60 81.10 9.10 6.70 .5
N 8 8 8 8 8
"STD.DEV. 0.76 1.07 0.64 .54 .06
901% C.I. 0.51 0.72 0.43 .36 .04

TABLE B.6.2
HELICOPTER: SIKORSKY S-76
TEST DATE: 6-13-83
OPERATION: ICAO TAKEOFF/TARGET IAS=74 KTS
MIC SITE:
"RUN NO. SEL(DB) AL(iD) T(UO-DB) K(A)
F29 85.8 .78.6 NA N NAF30 87.3 79 12 7.7 .6"F31 88.2 80.2 11 7.7 .6F32 86.5 78.4 11 7.8 .6F33 86.9 79.2 10 7.7 .6F34 86.4 78.7 12 7.1 5 LF35 86.8 80 9 7.1 .5F36 86.6 79 11 7.3 .5
AVERAGE 86.80 79.10 10.90 7.50 .6
N 8 8 7 7 7
STD"DE•. 0.71 0.65 1.07 .29 .04
90./. C.1. 0.47 0.43 0.79 .21 .03
TABLE 8.6.3
HELICOPTER: SIKORSKY S-76
TEST DATE: 6-13-83
OPERATION: ICAO TAKEOFF/TARGET IAS=74 KTS
MIC SITE: 4
RUN NO. SEL(DB) AL(DB) T(IO-DB) K(A) a
F29 NA NA 13 N NA,"F30 86.3 77.8 13 7.6 .5F31 86.3 77.3 14 7.9 .6"F32 85.2 76.2 14 7.9 .6F33 85.5 77.3 12 7.6 .6F34 84.5 76.2 13 7.5 .5F35 85.6 77.5 12 7.5 .5F36 84.9 75.8 13 8.2 .6
AVERAGE 85.50 76.90 13.00 7.70 .6
N 7 7 8 7 7
"STD.DEV. 0.68 0.78 0.76 .25 .04
90% C.I. 0.50 0.57 0.51 .18 .03

TABLE 8.7.1
HELICOPTER: SIKORSKY S-76
TEST DATE: 6-13-83
OPERATION: 3 DEGREE APPRDACl./TARGET 1A=74 ITS
NIC SITE: -
RON NO. SEL(D8) AL(DB) "T105-08) K(A) a
637 94.4 87.4 10 7 .5
G38 95.3 90.5 8 5.3 .4
639 95 88.6 9 6.7 .5
G40 93.2 86.6 9 6.9 .5
641 93.1 86.3 10 6.8 .5
642 94.6 87.5 9 7.4 .6643 90.1 82.6 15 6.4 .4
AVERA6E 93.70 87.10 10.00 6.70 .5
N 7 7 7 7 7 .•-
STD.DEV. 1.78 2.42 2.31 .67 .07
9r/. C.I. 1.31 1.78 1.70 .49 .05
"TABLE 8.7.2
HELICOPTER: SIKORSKY S-76
TEST DATE: 6-13-83
OPERATION: 3 DE6REE APPROACH/TARGET 1AS=74 KTS
MIC SITE: %
RO4N NO. SEL(O8) AL(MB) T(10-08) K(A) 0
637 94.1 87.7 8 7.1 .5
"638 95.4 89.5 8 6.5 .5
639 92.6 86.7 7 7 .6
540 92.5 86.3 9 6.5 .5
641 95.6 88.9 9 7 5L
642 93.4 86 11 7.1 .5
643 90.5 82.8 12 7.1 .5
'.ERAGE 93.40 86.80 9.10 6.90 .5
7 7 7 7 7
STD.DEV. 1.79 2.21 1.77 .27 .03
"9I. C.I. 1.31 1.63 1.30 .2 .02

- -.- .
TABLE 8.7.3
HELICOPTER: SIKORSKY 5-76
TEST DATE: 6-13-83
OPERTION: 3 DEGREE APPROACITAR6ET IAS=74 KTS
HIC SITE: 4
RIN NO. SEL(DB) AL(DB) T(IO-D8) K(A) a
637 91.6 84.8 9 7.1 .5638 94.1 86.4 10 7.7 .6639 87.8 79.4 11 8.1 .6640 90.8 84 10 6.8 .5641 94.3 87.1 10 7.2 .5642 91 83.9 12 6.6 .4643 91.7 85.1 9 6.9 .5
AVERA6E 91.60 84.40 10.10 7.20 .5
N 7 7 7 7 7
STD.DEV. 2.20 2.49 1.07 .52 .07
9M/ C.I. 1.61 1.83 0.79 .38 .05
"TABLE 8.8.1
HELICOPTER: SIKORSKY S-76
TEST DATE: 6-13-83
OPERTION: TAKEOFF/CATAGORY 8
HIC SITE: 5
RIN NO. SEL(DD) AL(DB) T(IO-DB) K(A) a
1H44 88.4 81.6 10 6.8 .51H45 87.4 79.8 13 6.8 .4H46 87.9 79.6 13 7.5 .5H47 87.1 78.1 14 7.9 .6H48 87.9 80.4 12 6.9 .5H49 87.5 79.3 14 7.2 .5
AVERA6E 87.70 79.80 12.70 7.20 .5
N 6 6 6 6 6
STO.DEV. 0.46 1.16 1.51 .41 .04
90M C.I. 0.38 0.96 1.24 .34 .04
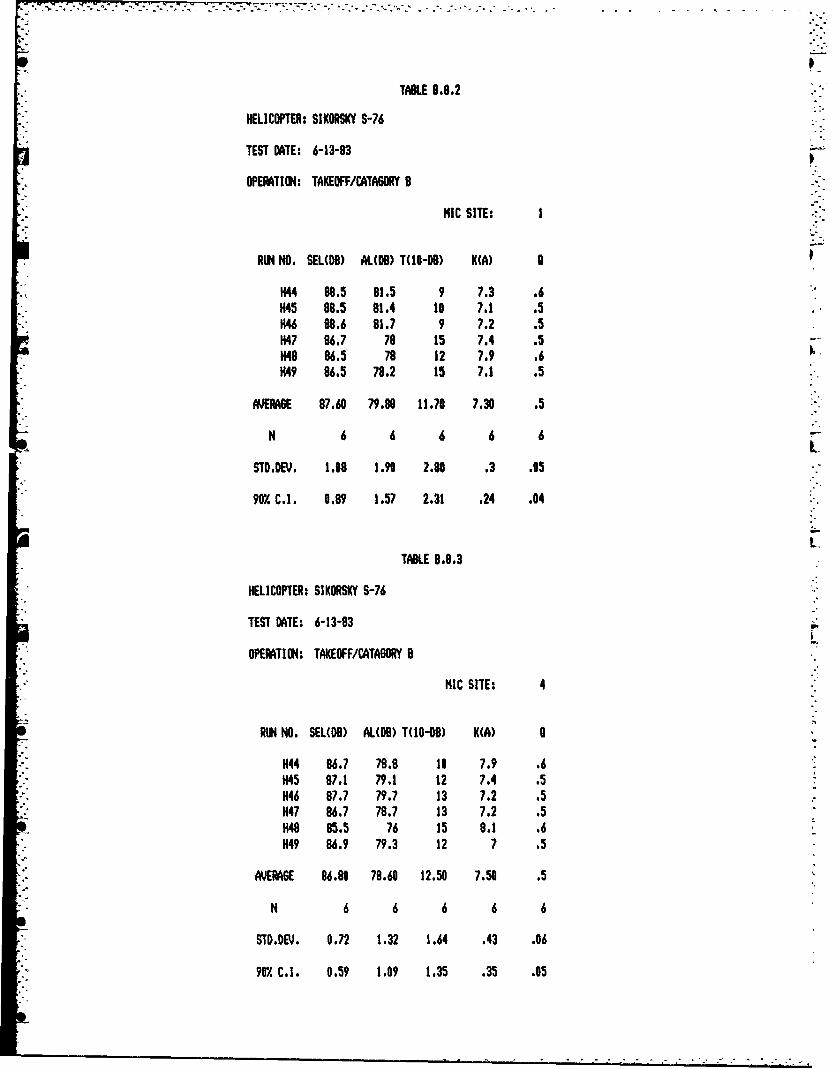
TABLE 9.8.2
HELICOPTER: SIKORSKY S-76
TEST DATE: 6-13-83
OPEMTION: TAKEOFF/CATASORY 9
NIC SITE: I
RiN NO. SEL(D) AL(DB) T(IO-DB) K(A) a
,H44 88.5 81.5 9 7.3 .6"1445 88.5 81.4 10 7.1 .5H46 89.6 81.7 9 7.2 .54H47 86.7 78 15 7.4 .5M48 86.5 78 12 7.9 .6H49 86.5 78.2 15 7.1 .5
AYEIWE 87.60 79.80 11.70 7,30 .5
N 6 6 6 6 6
STD.DEV. 1.08 1.90 2.80 .3 .05
901% C.I. 0.89 1.57 2.31 .24 .04
OI L
TABLE 8.8.3
HELICOPTER: SIKORSKY S-76
TEST DATE: 6-13-83
OPERATION: TAKEOFF/CATA6ORY B
MIC SITE: 4
RIN NO. SEL(DB) AL(DB) T(IO-OB) K(A) 0
-H44 86.7 78.8 10 7.9 .61H45 87.1 79,1 12 7.4 .54H46 87.7 79.7 13 7.2 .5
,H47 96.7 78.7 13 7.2 .5s148 85.5 76 15 8.1 .6
1H49 86.9 79.3 12 7 .5
AVERA6E 86.80 78.60 12.50 7.50 .5
"N 6 6 6 6 6
STD.DEV. 0.72 1.32 1.64 .43 .06
"91r/. C.1. 0.59 1.09 1.35 .35 .05
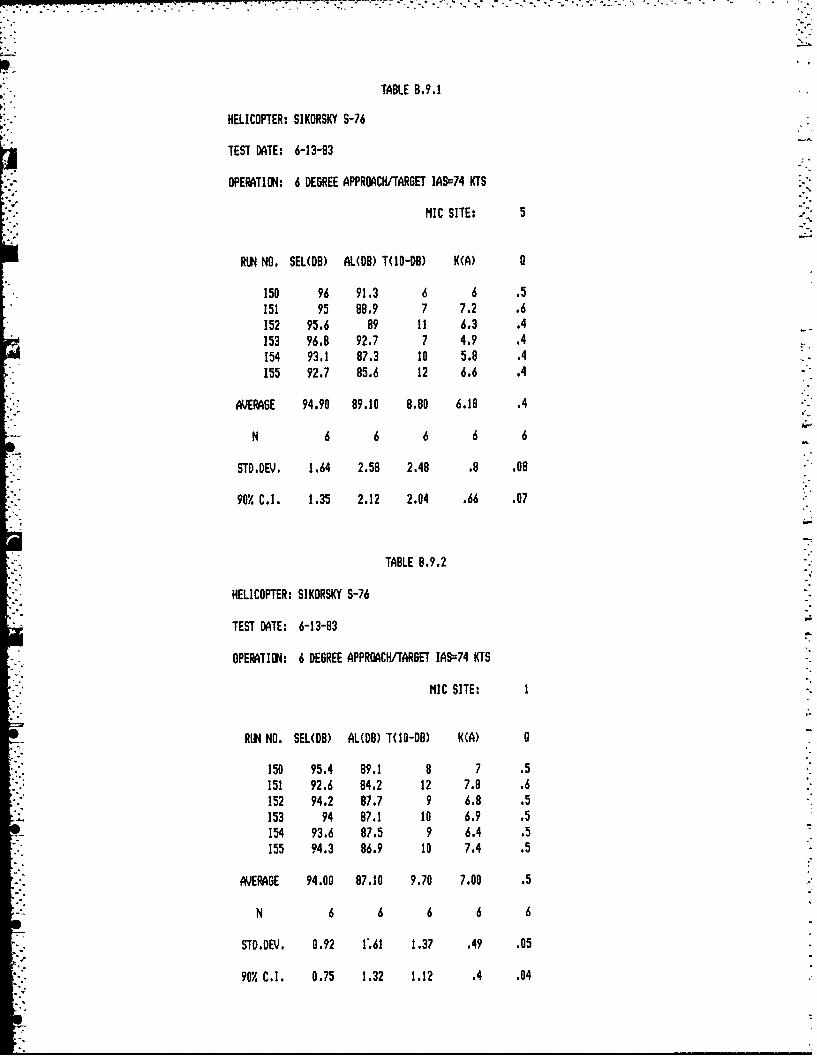
•. . . . . . . . . .
TABLE 8.9.1
HELICOPTER: SIKORSKY S-76
TEST DATE: 6-13-83
OPERATION: 6 DEGREE APPROACHWTARGET IAS=74 KTS
MIC SITE:
RUN NO, SEL(DB) ALD(DB) T(IO-DB) K(A) a
150 96 91.3 6 6 .5151 95 88.9 7 7.2 .6152 95.6 89 11 6.3 .4153 96.8 92.7 7 4.9 .4154 93.1 87.3 10 5.8 .4155 92.7 85.6 12 6.6 .4
AVERAGE 94.90 89.10 8.80 6.10 .4
N 6 6 6 6 6
STD.DE)•, 1.64 2.58 2.48 .8 08
90". C.1. 1.35 2.12 2.04 .66 .07
TABLE 8.9.2
HELICOPTER: SIKORSKY S-76
TEST DATE: 6-13-83
OPERATION: 6 DEGREE APPROACH/TARGET AS474 KTS
MIC SITE:
RLN NO. SEL(DB) AL(DB) T(IO-DB) K(A) a
150 95.4 89.1 8 7 .5151 92.6 84.2 12 7.8 .6152 94.2 87.7 9 6.8 .5153 94 87.1 10 6.9 .5154 93.6 87.5 9 6.4 .5155 94.3 86.9 10 7.4 .5
AVERAGE 94.00 87.10 9.70 7.00 .5
N 6 6 6 6 6
STD.DEV. 0.92 1'.61 1.37 .49 .05
90% C,., 0.75 1.32 1.12 .4 .04
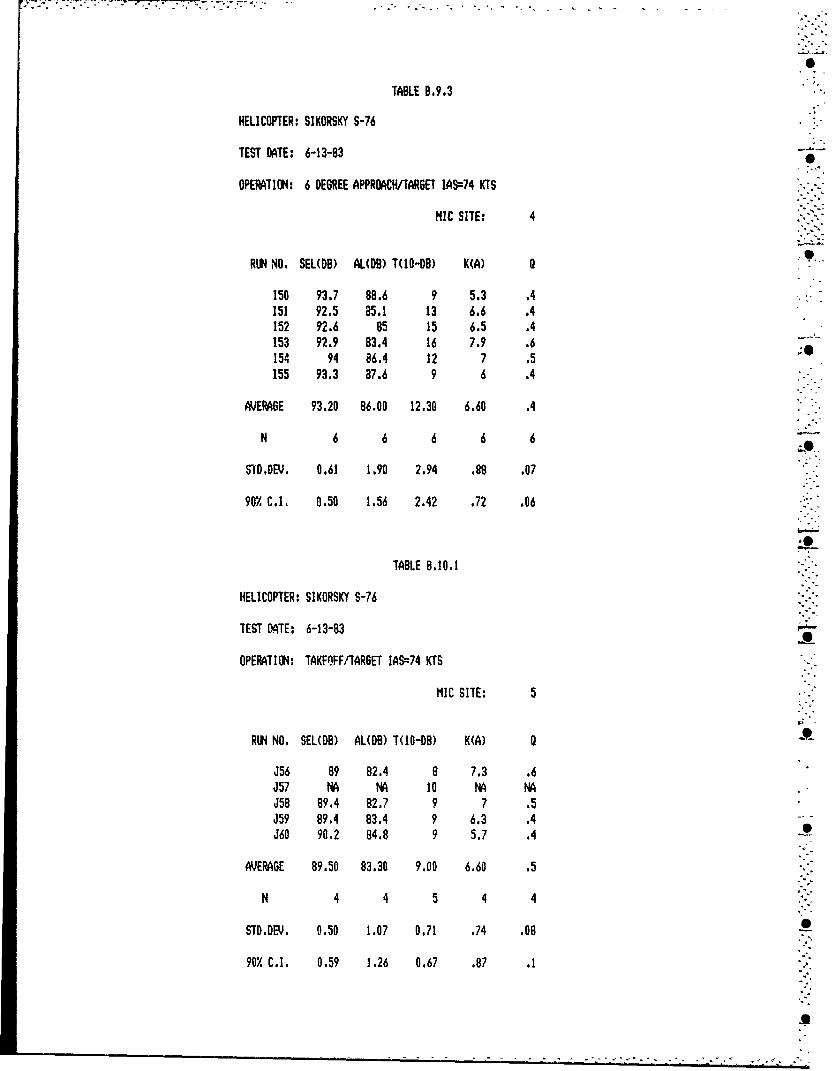
TABLE 8.9.3
HELICOPTER: SIKORSKY S-76
TEST DATE: 6-13-83
OPERATION: 6 DEGREE APPROACH/TARGET 1AS=74 'TS
MIC SITE: 4
RUN NO. SEL(DB) AL(DB) T(10-DB) K(A) 0 ."
I50 93.7 88.6 9 5.3 .4151 92.5 85.1 13 6.6 .4152 92.6 85 15 6.5 .4153 92.9 83.4 16 7.9 .6154 94 86.4 12 7 .5155 93.3 87.6 9 6 .4
AVERAGE 93.20 86.00 12.30 6.60 .4
N 6 66
STDDEV. 0.61 1.90 2.94 .88 .07
90% C.I. 0.50 1.56 2.42 .72 .06
TABLE 8.10.1
HELICOPTER: SIKORSKY S-76
TEST DATE: 6-13-83
OPERATION: TAKFQFF/TAROET IAS=74 KTS
MIC SITE: 5
RUN NO. SEL(DB) AL(DB) T(1O-DB) K(A) Q 9
J56 89 82.4 8 7.3 .6J57 NA NA 10 N NAJ58 89.4 82.7 9 7 .5J59 89.4 83.4 9 6.3 .4J60 90.2 84.8 9 5.7 .4
AVERAGE 89.50 83.30 9.00 6.60 .5
N 4 4 5 4 4
STD.DEV. 0.50 1.07 0.71 .74 .08
90% C.I. 0.59 1.26 0.67 .87 .1

TABLE B.10.2
HELICOPTER: SIK1RSKY 8-76
TEST DATE: 6-13-8i
OPEIATION: TAKEOFF/TARGET IAS=74 KTS
MIC SITE: 1
RiN NO. SEL(DB) AL(DB) T(JO-DB) K(A) 0
J56 86.8 79.1 10 7.7 .6J57 86.4 78.1 11 7.7 .6J58 87 79.7 10 7.3 .5J59 87 80.1 10 6.9 .5J60 88.2 81.1 1o 7.1 .5
AVERAGE 87.10 79.70 10.20 7.30 .5
N 5 5 5 5 5
STD.DEV. 0.67 1.02 0.45 .35 .04
9M/, C.I. 0.64 0.97 0.43 .34 .04
TABLE B.10.3
i•-ICOPTER: SIKORSK S-76
TEST DATE: 6-13-83
OPERATION: TAKEOFF/TAR6ET 1A9=74 KTS
NIC SITE: 4
RUN NO. SEL(DB) AL(DB) T(IO-DB) M(A) 9
J56 84.5 76.8 11 7.4 .5J57 83.5 75.1 14 7.3 .5J58 84.7 77 12 7.1 .5J59 85.6 78.4 11 6.9 .5J60 86.9 78.9 12 7.4 .5
AVERAGE 85.00 77.20 12.00 7.20 .5
N 5 5 5 5 5
STD.DEV. 1.28 1.49 1.22 .21 .03
901% C.I. 1.22 1.42 1.17 .2 .03

TABLE B.11.1
HELICOPTER: SIKORSKY S-76
TEST DATE: 6-13-83
OPERATION: 9 DEGREE APPROACH/TARGET 1AS=74 KTS
MIC SITE: 5
RUN NO. SEL(DB) AL(DB) T(IO-DB) K(A) 0 0
K61 87.5 80.5 12 6.5 .4K62 89.2 81.3 12 7.3 .51(63 91.9 85.8 9 6.4 .5K64 87.7 81.7 9 6.3 .4K65 88.1 81.1 12 6.5 .4K66 88.2 81.5 12 6.2 .4
AVERAGE 88.80 82.00 11.00 6.50 .4
N 6 6 6 A 6N"-0
STD.DEV. 1.64 1.91 1.55 .4 .04
90w C.1. 1.35 1.57 1.27 .33 .04
TABLE 8.11.2
HELICOPTER: SIKORSKY S-76
TEST DATE: 6-13-83
OPERATION: 9 DEGREE APPROACH/TARGET ]AS=74 K'S
11C SITE: I
RUN NO. SEL(DB) AL(DD) T(IO-DB) K(A) 0
K61 85.7 77.9 It 7.5 .5K62 90 81.3 14 7.6 .5K63 87.5 78.5 23 6.6 .3K64 85.9 77.5 12 7.8 .6K65 87.7 80.9 9 7.1 .5166 86.5 78.2 12 7.7 .6
AVERAGE 87.20 79.10 13.50 7.40 .5
N 6 6 6 6 6
STD.DEV. 1.59 1.63 4.93 .44 .09
901 C.1. 1.31 1.34 4.06 .36 .07

TABLE 8.11.3
HELICOPTER: SIKORSKY S-76
TEST DATE: 6-13-83 -
OPERATION: 9 DEGREE APPROACH/TARGET IAS74 KTS1
HIC SITE: 4
RUN NO. SEL(DB) AL(DB) T(1O-D8) K(A) 0
K61 84.7 75.5 15 7.8 .6K62 91.6 83.9 12 7.1 .5K63 87 76.4 21 8 .6K64 87,1 77.6 26 6.7 .3K65 88.7 81.2 14 6.5 .4K(66 86.8 77.9 22 6.6 .4
AVERAGE 87.70 78.80 18.30 7.10 .4
N 6 6 6 1 6
STD.DEV. 2.32 3.18 5.47 .64 .1
90M. C.I. 1.91 2.62 4.50 .52 .08
S
I-.
r
S
o
S

° -.
APPENDIX C
Magnetic Recording Acoustical Data for Static Operations
This appendix contains time averaged, A-weighted sound level data alongwith time averaged, one-third octave sound pressure level information foreight different directivity emission angles. These data were acquiredJune 6 using the TSC magnetic recording system discussed in Section5.6.1.
Thirty-two seconds of corrected raw spectral data (64 contiguous 1/2second data records) have been energy averaged to produce the datatabulated in this appendix. The spectral data presented are "As Measured"for the given emission angles established relative to each microphonelocation. Also included in the tables are the 360 degree (eight emissionangle) average levels, calculated by both arithmetic and energy averaging. 4The data reduction is further described in Section 6.1. Figure 6.1(previously shown) provides the reader with a quick reference to theemission angle convention.
The data contained in these tables have been used in analyses presented inSections 9.2 and 9.7. The reader may cross reference the magnetic -recording data of this appendix with direct read static data presented inAppendix D.
A-o

r o
Appendix C
"As Measured" 1/3 Octave Noise Data--Static Test are presented.
The key to the table numbering system is as follows:
Table No. C. 1-1H. 1
Appendix No.
Helicopter No. & Microphone Location
Page No. of Group
Table No. C.1-X.X Aerospatiale SA-365N (Dauphin)C.2-X.X Aerospatiale SA-355F (Twinstar)C.3-X.X Aerospatiale AS-350D (Astar)C.4-X.X Sikorsky S-76 (Spirit)C.5-X.X Bell 222C.6-X.X Hughes 500DC.7-X.X Boeing Vertol CH-470D (Shinook)
Microphone No. 1H (soft) 150 m northwest2 (soft) 150 m west4H (soft) 300 m west5H (hard) 150 m north
Page No. 1 Hover-in-Ground-Effect2 Flight Idle3 Ground Idle4 Hover-Out-of-Ground-Effect
4.
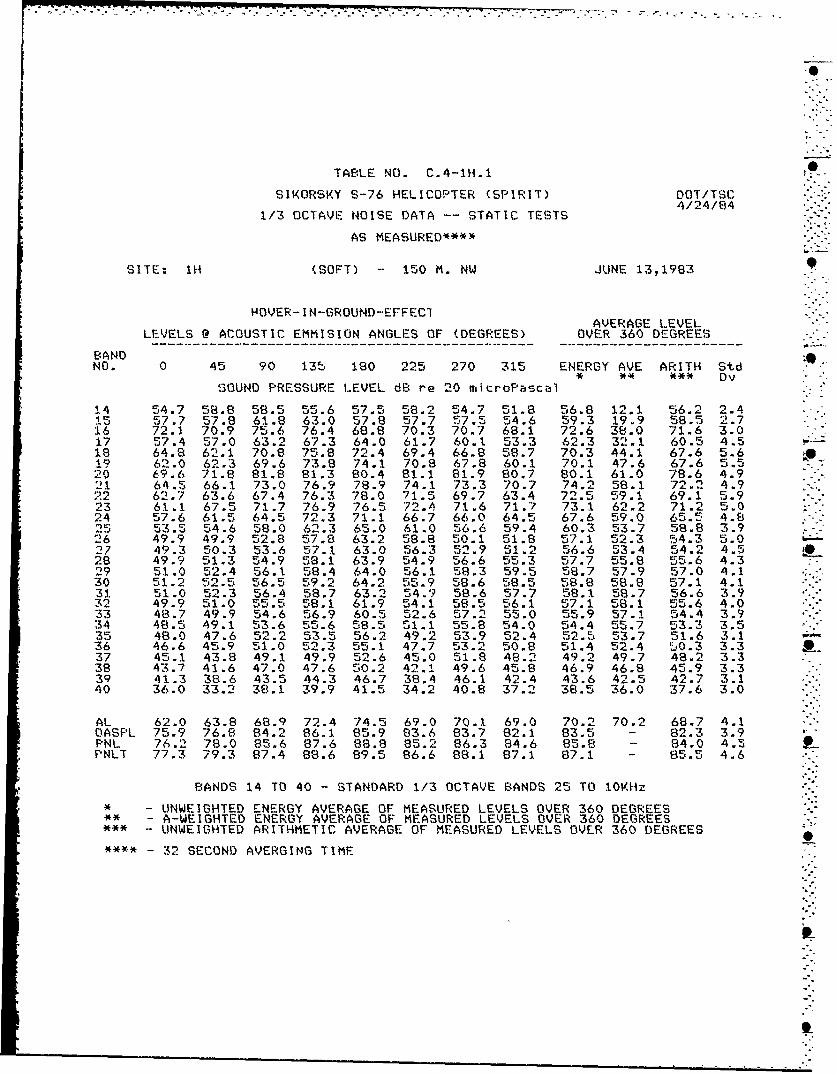
.~~Qyr7* "'r~ -i-.--.*-r-~ *-v. ~. *-*. ,-."". .-- .o
TABLE NO. C.4-1H.1 rSIKORSKY S--76 HELICOPTER (SPIRIT) DOT/ITSC
4/24/841/3 OCTAVE NOISE DATA -- STATIC TESTS
AS MEASURED****
SITE: 1H (SOFT) -- 150 M. NW JUNE 13,1983
HOVER- I N-GROUND-EFFECIAVERAGE LEVEL
LEVELS @ ACOUSTIC EMMISION ANGLES OF (DEGREES) OVER 360 DEGREES
BANDNO. 0 45 90 135 180 225 270 315 ENERGY AVE ARITH Std
* ** *** -DvSOUND PRESSURE LEVEL dB re 20 microPascal
14 54.7 58.8 58.5 55.6 57.5 58.2 54.7 51.8 56.8 12.1 56.2 2.415 57.7 57.8 61.8 63.0 57.8 57.7 57.5 54.6 59.3 19.9 58.5 2.716 72.1 70.9 75.6 76.4 68.8 70.3 70.7 68.1 72.6 38.0 71.6 3.017 57.4 57.0 63.2 67.3 64.0 61.7 60.1 53.3 62.3 32.1 60.5 4.5 -18 64.8 62.1 70.8 75.8 72.4 69.4 66.8 58.7 70.3 44.1 67.6 5.619 62.0 62.3 69.6 73.8 74.1 70.8 67.8 60.1 70.1 47.6 67.6 5.520 69.6 71.8 81.8 81.3 80.4 81.1 81.9 80.7 80.1 61.0 78.6 4.921 64.5 66.1 73.0 76.9 78.9 74.1 73.3 70.7 74.2 58.1 72.2 4.9 -.22 62.7 63.6 67.4 76.3 78.0 71.5 69.7 63.4 72.5 59.1 69.1 5.923 61.1 67.5 71.7 76.9 76.5 72.4 71.6 71.7 73.1 62.2 71.2 5.024 57.6 61.5 64.5 72.3 71.1 66.7 66.0 64.5 67.6 59.0 65.5 4.825 53.5 54.6 58.0 62.3 65.0 61.0 56.6 59.4 60.3 53.7 58.8 3.926 49.9 49.9 52.8 57.8 63.2 58.8 50.1 51.8 57.1 52.3 54.3 5.027 49.3 50.3 53.6 57.1 63.0 56.3 52.9 51.2 56.6 53.4 54.2 4.5 A28 49.9 51.3 54.9 58.1 63.9 54.9 56.6 55.3 57.7 55.8 55.6 4.329 51.0 52.4 56.1 58.4 64.0 56.1 58.3 59.5 58.7 57.9 57.0 4.130 51.2 52.5 56.5 59.2 64.2 55.9 58.6 58.5 58.8 58.8 57.1 4.1 -"31 51.0 52.3 56.4 58.7 63.2 54.9 58.6 57.7 58.1 58.7 56.6 3.932 49.9 51.0 55.5 58.1 61.9 54.1 58.5 56.1 57.1 58.1 55.6 4.033 48.7 49.9 54.6 56.9 60.5 52.6 57.2 55.0 55.9 57.1 54.4 3.934 48.5 49.1 53.6 55.6 58.5 51.1 55.8 54.0 54.4 55.7 53.3 3.535 48.0 47.6 52.2 53.5 56.2 49.2 53.9 52.4 52.5 53.7 51.6 3.136 46.6 45.9 51.0 52.3 55.1 47.7 53.2 50.8 51.4 52.4 50.3 3.337 45.1 43.8 49.1 49.9 52.6 45.0 51.8 48.2 49.2 49.7 48.2 3.338 43.7 41.6 47.0 47.6 50.2 42.1 49.6 45.8 46.9 46.8 45.9 3.339 41.3 38.6 43.5 44.3 46.7 38.4 46.1 42.4 43.6 42.5 42.7 3.140 36.0 33.2 38.1 39.9 41.5 34.2 40.8 37.2 38.5 36.0 37.6 3.0
AL 62.0 63.8 68.9 72.4 74.5 69.0 70.1 69.0 70.2 70.2 68.7 4.1OASPL 75.9 76.8 84.2 86.1 85.9 83.6 83.7 82.1 83.5 - 82.3 3.9PNL 76.2 78.0 85.6 87.6 88.8 85.2 86.3 84.6 85.8 - 84.0 4.5F'NLT 77.3 79.3 87.4 88.6 89.5 86.6 88.1 87.1 87.1 - 85.5 4.6
BANDS 14 TO 40 - STANDARD 1/3 OCTAVE BANDS 25 TO 1OKHz
* -- UNWEIGHTED ENERGY AVERAGE OF MEASURED LEVELS OVER 360 DEGREES- A-WEIGHTED ENERGY AVERAGE OF MEASURED LEVELS OVER 360 DEGREES* - UNWEIGHTED ARITHMETIC AVERAGE OF MEASURED LEVELS OVER 360 DEGREES
- 32 SECOND AVERGING TIME
9-.
°°I

TABLE NO. C.4-1H.2
SIKORSKY S-76 HELICOPTER (SPIRIT) DOT/TSC4/24/84
1/3 OCTAVE NOISE DATA -- STATIC TESTS
AS MEASURED****
SITE: IH (SOFT) - 150 M. NW JUNE 13,1983
FLIGHT IDLEAVERAGE LEVEL
LEVELS @ ACOUSTIC EMMISION ANGLES OF (DEGREES) OVER 360 DEGREES
BANDNO. 0 45 90 135 180 225 270 315 ENERGY AVE ARITH Std
S *** DvSOUND PRESSURE LEVEL dB re 20 microPascal
14 51.4 52.4 50.8 - - 52.3 51.6 51.3 51.7 7.0 51.6 0.615 4e.5 48.5 49.8 - - 49.5 54.3 50.0 50.6 11.2 50.1 2.216 66.9 64.5 64.0 - - 64.6 68.7 66.9 66.3 31.7 65.9 1.817 49.9 50.0 50.0 - - 52.5 57.9 49.8 53.0 22.8 51.7 3.218 58.2 54.9 55.3 - - 59.2 64.8 52.2 59.5 33.3 57.4 4.419 51.4 56.3 57.1 - - 57.4 61.5 56.3 57.6 35.1 56.7 3.220 70.9 64.7 73.3 - - 71.2 73.4 73.4 71.9 52.8 71.1 3.421 63.1 58.8 63.7 - - 62.2 64.2 65.3 63.3 47.2 62.9 2.322 54.7 55.5 57.8 - - 58.0 59.9 56.2 57.4 44.0 57.0 1.923 54.5 60.9 61.2 - - 63.0 63.1 59.7 61.1 50.2 60.4 3.224 51.3 55.4 56.7 - - 57.4 57.8 53.9 55.9 47.3 55.4 2.525 46.7 48.4 50.7 - - 50.7 52.2 49.9 50.1 43.5 49.8 1.926 42.9 40.6 41.8 - - 42.2 43.7 43.2 42.5 37.7 42.4 1.127 41.4 39.4 39.8 - - 41.6 42.4 41.4 41.1 37.9 41.0 1.228 40.7 37.9 39.6 - - 44.3 43.7 41.3 41.8 39.9 41.2 2.429 41.8 38.8 40.6 - - 47.6 44.8 42.1 43.6 42.8 42.6 3.130 41.0 38.6 40.1 - - 46.6 43.7 40.9 42.7 42.7 41.8 2.931 40.4 38.4 39.5 - - 45.4 44.5 41.4 42.4 43.0 41.6 2.832 39.7 38.0 38.6 - - 44.3 44.1 41.3 41.7 42.7 41.0 2.733 39.7 37.4 38.1 - - 44.7 43.6 41.5 41.7 42.9 40.8 3.034 39.5 36.5 36.9 - - 45.7 42.0 41.3 41.5 42.8 40.3 3.535 40.8 36.0 35.9 - - 45.4 40.5 41.1 41.2 42.4 39.9 3.636 42.1 36.3 35.5 - - 43.9 38.8 40.2 40.5 41.5 39.5 3.337 44.4 38.4 32.7 - - 41.3 36.7 41.5 40.6 41.1 39.2 4.138 44.5 38.3 30.9 - - 37.5 33.8 41.6 39.9 39.8 37.8 5.039 39.7 34.4 28.0 - - 33.4 30.6 38.0 35.7 34.6 34.0 4.440 33.2 29.7 25.2 - - 29.7 28.4 32.7 30.6 28.1 29.8 2.9
AL 56.7 55.0 58.0 - - 59.5 59.6 58.4 58.1 58.1 57.9 1.8OASPL 73.3 69.9 74.8 - - 73.7 76.2 75.2 74.2 - 73.8 2.2PNL 72.8 69.2 73.6 - - 74.5 75.4 74.7 74.0 - 73.4 2.2PNLT 75.1 70.4 75.7 - - 76.4 77.2 76.8 75.9 - 75.3 2.5
BANDS 14 TO 40 - STANDARD 1/3 OCTAVE BANDS 25 TO 10KHz
* - UNWEIGHTED ENERGY AVERAGE OF MEASURED LEVELS OVER 360 DEGREES** - A-WEIGHTED ENERGY AVERAGE OF MEASURED LEVELS OVER 360 DEGREES
- UNWEIGHTED ARITHMETIC AVERAGE OF MEASURED LEVELS OVER 360 DEGREES
- 32 SECOND AVERGING TIME

TARL.E NO. C.4-!H.73
SSIKORSKY S--76 HELICOPTER (SPIRIT) 001/TSC4/24/84
-/3 OCTAVE NOISE DATA -- STATIC TESTS
AS MEASURED****
"SITE: IH (SOFT) - 150 M. NW JUNE 13,1983
GROUND IDLEAVERAGE LEVEL
LEVELS @ ACOUSTIC EMHISION ANGLES OF (DEGREES) OVER 360 DEGREES
SBANDNO. 0 45 90 135 180 225 270 315 ENERGY AVE ARITH Std
• ** *** DvSOUND PRESSURE LEVEL dB re 20 microPascal
"14 - 43.0 .. .. .. 47.8 -- - 46.0 1.3 45.4 3.415 45.1 47.1 - 46.2 6.8 46.1 1.4'16 -- 46.4 .. . 46.3 -- - 46.4 11.8 46.3 0.1
17 -- 46.9 - - - 51.9 - - 50.1 19.9 49.4 3.519 - 48.0 ...- 52.9 - - 51.1 24.9 50.4 3.519 - 48.5 - - - 51.1 - - 50.0 27.5 49.8 1.820 -" 52.6 ...- 57.4 - - 55.6 36.5 55.0 3.421 - 49.1 - 48.6 - 48.9 32.8 48.9 0.422 - 50.9 .. . . 51.2 -" - 51.1 37.7 51.0 0.223 - 52.3 - - 52.4 - - 52.4 41.5 52.3 0.124 - 46.5 .. .. .. 51.1 - - 49.4 '0.8 48.8 3.325 - 37.5 - - - 42.8 - - 40.9 34.3 40.1 3.726 31.0 .. .. . 36.8 - - 34.8 30.0 33.9 4.127 - 29.0 - - - 37,0 - - 34.6 31.4 33.0 5.728 - 31.9 .. . . 35.2 - - 33.9 32.0 33.5 2.329 - 30.7 - - - 34.0 - - 32.7 31.9 32.3 2.330 26.1 . .. . 31.5 - - 29.6 29.6 28.8 3.831 -- 28.9 - - - 29.6 - - 29.3 29.9 29.2 0.532 - 31.3 .. . . 30.8 -- - 31.1 32.1 31.1 0.433 - - - - 31.5 - - 32.6 33.8 32.4 1.334 34.2 .. . . 29.7 - - 32.5 33.8 31.9 3.235 - 35.7 .. . . 28.6 - - 33.5 34.7 32.1 5.036 - 36.6 .- 29.7 .. .. 34.4 35.4 33.1 4.937 - 36.6 - - - 29.0 - - 34.3 34.8 32.8 5.438 -- 34.6 .. . .. 27.2 .. .. 32.3 32.2 30.9 5.239 - 33.8 - - - 26.0 - - 31.5 30.4 29.9 5.540 -- 34.3 ...- 25.8 - - 31.9 29.4 30.1 6.0
AL - 48.2 - - - 48.5 -- - 48.4 48.4 48.3 0.2OASPL -- 59.6 .. . .. 62.4 - - 61.2 - 61.0 2.0FNL -- 61.8 .. . . 61.4 - - 61.8 - 61.6 0.3PNLT -- 62.4 .. .. . 62.6 -- - 62.8 - 62.5 0.1
BANDS 14 TO 40 - STANDARD 1/3 OCTAVE BANDS 25 TO IOKHz
* -- UNWEIGHTED ENERGY AVERAGE OF MEASURED LEVELS OVER 360 DEGREES- A-WEIGHTED ENERGY AVERAGE OF MEASURED LEVELS OVER 360 DEGREES
-- UNWEIGHTED ARITHMETIC AVERAGE OF MEASURED LEVELS OVER 360 DEGREES
• - 32 SECOND AVERGING TIME
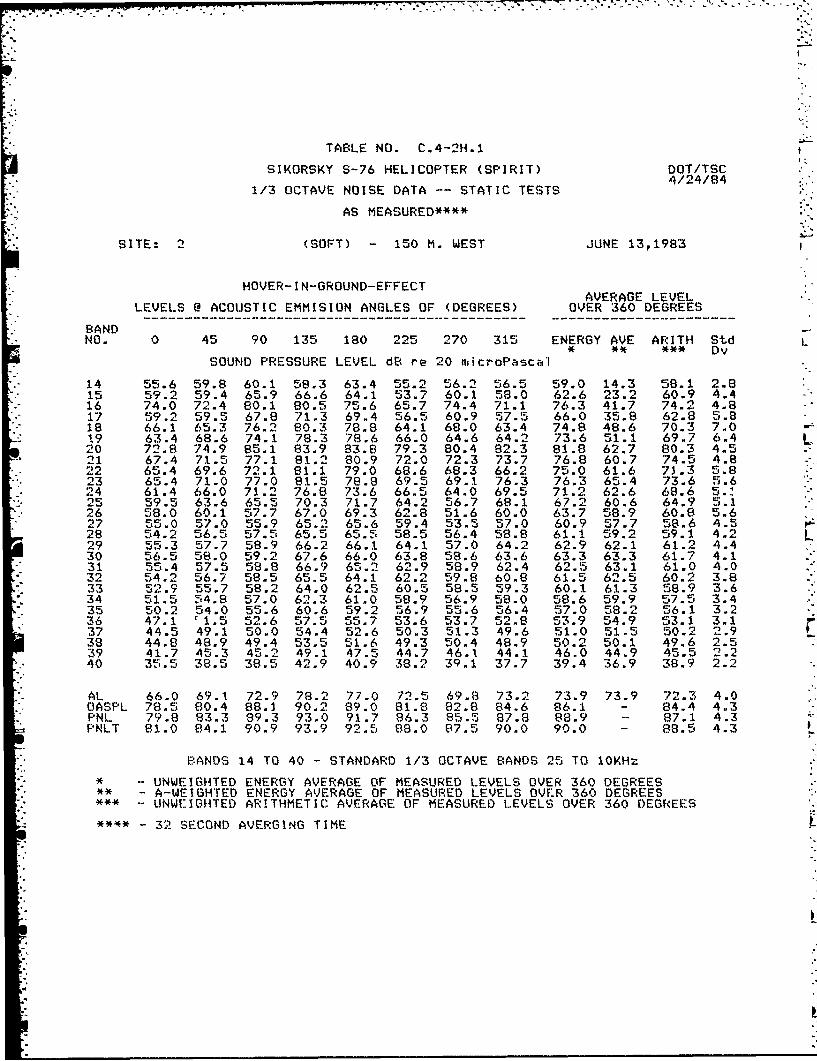
TABLE NO. C.4-2H.1
SIKORSKY S-76 HELICOPTER (SPIRIT) DOT/TSC4/24/84
1/3 OCTAVE NOISE DATA -- STATIC TESTS
AS MEASURED****
SITE: 2 (SOFT) - 150 M. WEST JUNE 13,1983
HOVER- I N-GROUND-EFFECTAVERAGE LEVEL
LEVELS @ ACOUSTIC EMMISION ANGLES OF (DEGREES) OVER 360 DEGREES
BANDNO. 0 45 90 135 180 225 270 315 ENERGY AVE ARITH Std
* ** *** Dv
SOUND PRESSURE LEVEL d8 re 20 microPascal
14 55.6 59.8 60.1 58.3 63.4 55.2 56.2 56.5 59.0 14.3 58.1 2.815 59.2 59.4 65.9 66.6 64.1 53.7 60.1 58.0 62.6 23.2 60.9 4.416 74.0 72.4 80.1 80.5 75.6 65.7 74.4 71.1 76.3 41.7 74.2 4.817 59.2 59.5 67.8 71.3 69.4 56.5 60.9 57.5 66.0 35.8 62.8 5.818 66.1 65.3 76.2 80.3 78.8 64.1 68.0 63.4 74.8 48.6 70.3 7.0i9 63.4 68.6 74.1 78.3 78.6 66.0 64.6 64.2 73.6 51.1 69.7 6.420 72.8 74.9 85.1 83.9 83.8 79.3 80.4 82.3 81.8 62.7 80.3 4.521 67.4 71.5 77.1 81.2 80.9 72.0 72.3 73.7 76.8 60.7 74.5 4.822 65.4 69.6 72.1 81.1 79.0 68.6 68.3 66.2 75.0 61.6 73.3 5.823 65.4 71.0 77.0 81.5 78.8 69.5 69.1 76.3 76.3 65.4 73.6 5.624 61.4 66.0 71.2 76.8 73.6 66.5 64.0 69.5 71.2 62.6 68.6 5.425 59.5 63.6 65.5 70.3 71.7 64.2 56.7 68.1 67.2 60.6 64.9 5.126 58.0 60.1 57.7 67.0 69.3 62.8 51.6 60.0 63.7 58.9 60.8 5.627 55.0 57.0 55.9 65.2 65.6 59.4 53.5 57.0 60.9 57.7 58.6 4.528 54.2 56.5 57.5 65.5 65.5 58.5 56.4 58.8 61.1 59.2 59.1 4.229 55.3 57.7 58.9 66.2 66.1 64.1 57.0 64.2 62.9 62.1 61.2 4.430 56.5 58.0 59.2 67.6 66.0 63.8 58.6 63.6 63.3 63.3 61.7 4.131 55.4 57.5 58.8 66.9 65.2 62.9 58.9 62.4 62.5 63.1 61.0 4.032 54.2 56.7 58.5 65.5 64.1 62.2 59.8 60.8 61.5 62.5 60.2 3.833 52.9 55.7 58.2 64.0 62.5 60.5 58.5 59.3 60.1 61.3 58.9 3.634 51.5 54.8 57.0 62.3 61.0 58.9 56.9 58.0 58.6 59.9 57.5 3.435 50.2 54.0 55.6 60.6 59.2 56.9 55.6 56.4 57.0 58.2 56.1 3.236 47.1 1.5 52.6 57.5 55.7 53.6 53.7 52.8 53.9 54.9 53.1 3.137 44.5 49.1 50.0 54.4 52.6 50.3 51.3 49.6 51.0 51.5 50.2 2.938 44.8 48.9 49.4 53.5 51.6 49.3 50.4 48.9 50.2 50.1 49.6 2.539 41.7 45.3 45.2 49.1 47.5 44.7 46.1 44.1 46.0 44.9 45.5 2.240 35.5 38.5 38.5 42.9 40.9 38.2 39.1 37.7 39.4 36.9 38.9 2.2
AL 66.0 69.1 72.9 78.2 77.0 72.5 69.8 73.2 73.9 73.9 72.3 4.0OASPL 78.5 80.4 88.1 90.2 89.0 81.8 82.8 84.6 86.1 - 84.4 4.3PNL 79.8 83.3 89.3 93.0 91.7 86.3 85.5 87.8 88.9 - 87.1 4.3P PNLT 81.0 84.1 90.9 93.9 92.5 88.0 87.5 90.0 90.0 - 88.5 4.3
"BANDS 14 TO 40 - STANDARD 1/3 OCTAVE BANDS 25 TO 10KHz
UNWEIGHTED ENERGY AVERAGE OF MEASURED LEVELS OVER 360 DEGREES"" ** --- WEIGHTED ENERGY AVERAGE OF MEASURED LEVELS OVER 360 DEGREES
*N** - U-WEIGHTED ARITHMETIC AVERAGE OF MEASURED LEVELS OVER 360 DEGREES
**** - 32 SECOND AVERGING TIME

TABLE NO. C. 4-2H. 2
1./3 OCTAVE NOISE DATA --- STATIC TESTS .*;
AS MEASURED**** SFI-O1
SITE: 2 (SOFT) - 150 M. WEST JUNE 13,190.3
FLIGHT IDLEAVERAGE LEVEL
LEVELS R ACOUSTIC EMMISION ANGLES OF (DEGREES) OVER 360 DEGREES
BANDNO. 0 45 90 135 180 225 270 315 ENERGY AVE ARITH Std
* ** *** DvSOUND PRESSURE LEVEL dB re 20 rnicroPascal
14 53.5 56.9 - -- 51.3 55.5 54.6 52.9 54.5 9.8 54.1 2.015 52.2 54.9 - - 53.5 53.8 55.1 54.3 54.1 14.7 54.0 1.116 69.1 65.9 -- - 68.9 67.4 70.5 ?1.4 69.2 34.6 68.9 2,017 52.6 53.3 - - 53.5 55.9 57.0 54.2 54.7 24.5 54.4 1.7s18 60.3 56.8 - - 60.1 61.4 65.8 55.8 61.3 35.1 60.0 3.6
19 53.2 59.7 - - 57.6 59.7 62.2 57.2 59.1 36.6 58.3 3.120 70.5 68.6 -- - 75.6 74.3 72.9 75.2 73.5 54.4 72.8 2.821 63.8 63.8 - - 67.2 65.8 66.3 68.3 66.2 50.1 65.9 1.822 58.8 62.2 . -. 62.1 61.9 60.6 59.4 61.0 47.6 60.8 1.523 59.4 65.6 - - 64.7 67.7 63.5 61.8 64.5 53.6 63.8 2.924 58.1 61.2 .. .. 59.5 61.9 59.5 57.9 59.9 51.3 59.7 1.625 55.1 58.1 - - 52.7 56.6 55.7 55.0 55.8 49.2 55.5 1.826 47.0 50.2 - - 41.4 47.1 48.6 46.1 47.4 42.6 46.7 3.027 40.3 45.5 - - 39.9 43.4 45.8 44.1 43.7 40.5 43.2 2.528 38.2 43.5 - " 41.0 43.8 45.9 45.9 43.8 41.9 43.0 3.029 38.8 43.1 - - 43.7 48.4 46.3 46.8 45.5 44.7 44.5 3.430 37.8 41.6 " - 44.6 50.3 45.5 45.9 45.9 45.9 44.3 4.231 37.8 40.8 - - 45.3 51.2 46.2 4n.9 46.4 47.0 44.5 4.732 37.6 41.0 - - 46.2 51.5 46.3 46.4 46.8 47.8 44.8 4.933 37.9 40.3 - - 47.4 50.9 46.0 47.0 46.8 48.0 44.9 4.934 37.i 38.9 - - 46.8 50.8 44.3 47.5 46.4 47.7 44.2 5.335 37.7 37.5 - - 46.3 49.8 42.9 47.4 45.7 46.9 43.6 5.236 38.1 34.0 -- 43.8 46.2 40.0 44.9 42.8 43.8 41.2 4.737 40.0 30.1 - - 41.7 43.4 37.0 45.2 41.6 42.1 39.6 5.438 41.0 28.9 - - 41.4 43.7 35.5 46.7 41.9 41.8 39.2 6.239 35.6 25.0 - - 36.4 36.5 30.4 41.9 36.9 35.8 34.3 5.840 29.2 22.6 -- - 29.3 30.1 24.3 36.1 30.8 28.3 28.6 4.8
"AL 57.6 60.1 .. .. 61.7 63.8 60.7 61.7 61.3 61.3 60.9 2.1OASPL 74.2 73.7 - - 77.6 77.0 76.7 77.7 76.4 - 76.1 1.8PNL 72.7 73.4 - - 71.8 78.6 76.1 78.0 76.8 - 76.1 2.5PNLT 74.7 74.6 - - 80.0 80.5 77.5 80.1 78,6 - 77.9 2.7
BANDS 14 TO 40 - STANDARD 1/3 OCTAVE BANDS 25 TO 1OKHz
UNWEIGHTED ENERGY AVERAGE OF MEASURED LEVELS OVER 360 DEGREESA" - U-WEIGHTED ENERGY AVERAGE OF MEASURED LEVELS OVER 360 DEGREESUNWEIGHTED ARITHMETIC AVERAGE OF MEASURED LEVELS OVER 360 DEGREES
"- 32 SECOND AVERGING TIME
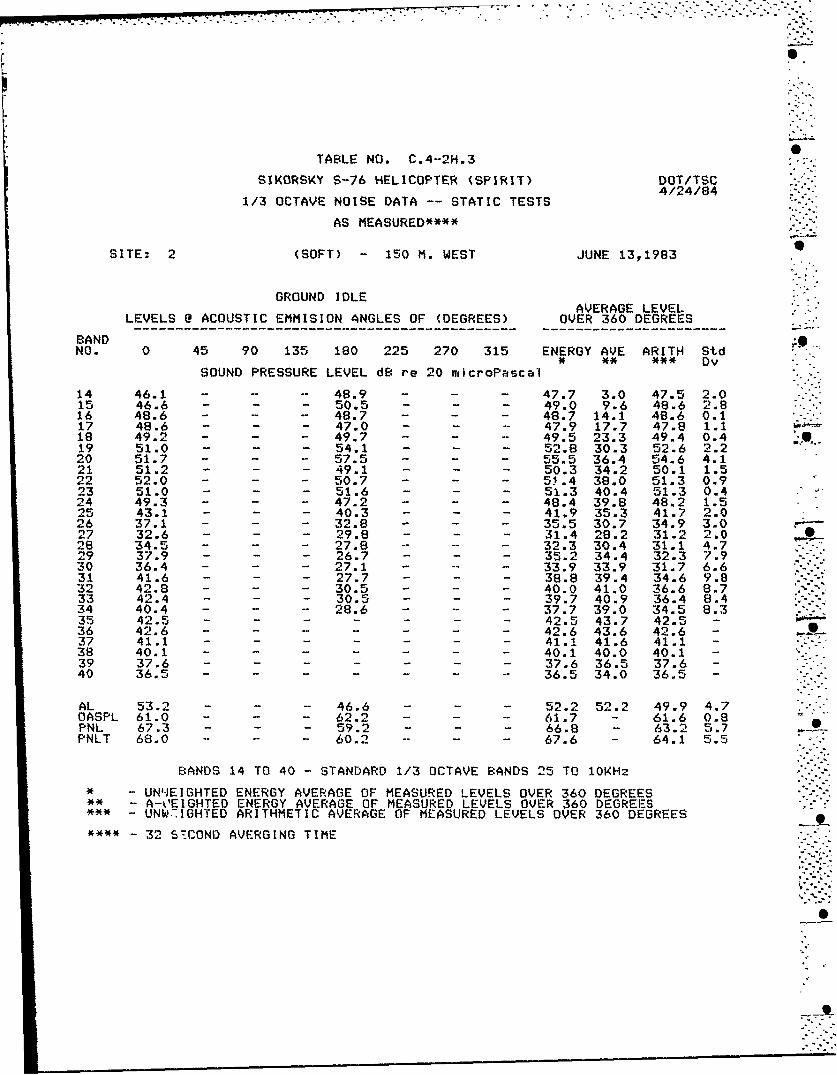
S= . .......... .
,0-
TABLE NO. C.4-2H.3
SIKORSKY S-76 HELICOPTER (SPIRIT) DOT/TSC4/24/84 "[[]
1/3 OCTAVE NOISE DATA -- STATIC TESTS 4/24/84
AS MEASURED****
SITE: 2 (SOFT) - 150 M. WEST JUNE 13,1983
GROUND IDLEAVERAGE LEVEL
LEVELS 0 ACOUSTIC EMMISION ANGLES OF (DEGREES) OVER 360 DEGREES
BANDNO. 0 45 90 135 180 225 270 315 ENERGY AVE ARITH Std
• ** *** DvSOUND PRESSURE LEVEL dB re 20 microPascal
14 46.1 - - - 48.9 - - - 47.7 3.0 47.5 2.015 46.6 - - - 50.5 - - - 49.0 9.6 48.6 2.816 48.6 - - - 48.7 - - - 48.7 14.1 48.6 0.117 48.6 - - - 47.0 - - 47.9 17.7 47.8 1.118 49.2 - - - 49.7 - - 49.5 23.3 49.4 0.419 51.0 - - - 54.1 - - 52.8 30.3 52.6 2.220 51.7 - - - 57.5 - - 55.5 36.4 54.6 4.121 51.2 - - - 49.1 - - 50.3 34.2 50.1 1.522 52.0 - - - 50.7 - - - 51.4 38.0 51.3 0.923 51.0 - - - 51.6 - - - 51.3 40.4 51.3 0.424 49.3 - - - 47.2 - - - 48.4 39.8 48.2 1.525 43.1 - - - 40.3 - - 41.9 35.3 41.7 2.026 37.1 - - - 32.8 - - 35.5 30.7 34.9 3.027 32.6 - - - 29.8 - - - 31.4 28.2 31.2 2.028 34.5 - - - 27.8 - - 32.3 30.4 31.1 4.729 37.9 - - - 26.7 - - - 35.2 34.4 32.3 7.930 36.4 - - - 27.1 - - - 33.9 33.9 31.7 6.631 41.6 - - - 27.7 - - - 38.8 39.4 34.6 9.832 42.8 - - - 30.5 - - - 40.0 41.0 36.6 8.733 42.4 - - - 30.5 - - - 39.7 40.9 36.4 8.434 40.4 - - - 28.6 - - - 37.7 39.0 34.5 8.335 42.5 - - - - - - - 42.5 43.7 42.5 -36 42.6 - - - - - 42.6 43.6 42.6 --.37 41.1 - - - - - - - 41.1 41.6 41.1 -38 40.1 - - - - - - 40.1 40.0 40.1 -39 37.6 - - - - - - 37.6 36.5 37.6 -40 36.5 - - - - - - 36.5 34.0 36.5 -
AL 53.2 - - - 46.6 - - - 52.2 52.2 49.9 4.7OASPL 61.0 - - - 62.2 - - . 61.7 - 61.6 0.8PNL 67.3 - - - 59.2 - - - 66.8 - 63.2 5.7PNLT 68.0 .- 60.2 - - 67.6 - 64.1 5.5
BANDS 14 TO 40 - STANDARD 1/3 OCTAVE BANDS 25 TO IOKHz
S - UN1iEIGHTED ENERGY AVERAGE OF MEASURED LEVELS OVER 360 DEGREES• - A--U'EIGHTED ENERGY AVERAGE OF MEASURED LEVELS OVER 360 DEGREES
- UNWCIGHTED ARITHMETIC AVERAGE OF MEASURED LEVELS OVER 360 DEGREES
32 S-COND AVERGING TIME
0,- -:',-9

TABLE NO. C.4-4H -
SIKORSKY S-76 HELICOPTER (SPIRIT) 4OT/TSC4/24/84 :-•
1/3 OCTAVE NOISE DATA -- STATIC TESTS
AS MEASURED****
SITE" 4H (SOFT) - 300 M. WEST JUNE 13,1983
AVERAGE LEVEL
LEVELS G ACOUSTIC EMMISION ANGLES OF (DEGREES) OVER 360 DEGREES------------------------------------------------------ ------------- I--------
BANDNO. 0 45 90 135 180 225 270 315 ENERGY AVE ARITH Std
** *** Dv
SOUND PRESSURE LEVEL dB re 20 m.icroPascal
*****NO DATA*****

TABLE NO. C.4-5H.1
SIKORSKY S-76 HELICOPTER (SPIRIT) DOT/TSC .4/24/84
1/3 OCTAVE NOISE DATA -- STATIC TESTS
AS MEASURED****
SITE: 5H (HARD) - 150 M. NORTH JUNE 13.1983
HOVER-IN--GROUND-EFFECT "-AVERAGE LEVEL "LEVELS Q ACOUSTIC EMMISION ANGLES OF (DEGREES) OVER 360 DEGREES
BANDNO. 0 45 90 135 180 225 270 315 ENERGY AVE ARITH Std
* ** *** DvSOUND PRESSURE LEVEL dB re 20 microPascal
14 56.7 60.4 - 55.3 56.2 60.5 60.3 61.8 59.4 14.7 58.7 2.615 57.6 58.2 - 57.7 57.7 59.6 62.6 61.3 59.7 20.3 59.2 2.016 71.5 67.1 71.1 68.8 72.5 75.8 72.3 72.1 37.5 71.3 2.817 56.8 56.9 - 62.4 60.9 61.1 63.8 60.0 60.9 30.7 60.3 2.618 64.4 61.5 - 70.7 68.1 68.7 69.9 66.8 68.0 41.8 67.2 3.219 60.3 63.3 - 69.5 70.6 70.6 71.7 66.7 68.9 46.4 67.5 4.320 66.0 70.7 - 77.5 82.2 82.9 81.6 76.2 79.5 60.4 76.7 6.421 63.1 66.0 - 71.9 77.3 75.5 74.9 70.3 73.4 57.3 71.3 5.222 63.1 65.1 - 70.8 77.3 74.0 73.9 69.6 72.7 59.3 70.5 5.123 64.2 67.6 - 75.5 80.8 77.0 79.0 74.2 76.6 65.7 74.0 6.024 63.6 66.2 - 74.3 80.1 76.2 74.8 71.2 75.0 66.4 72.3 5.825 64.3 67.6 - 75.8 80.7 77.6 76.3 74.6 76.2 69.6 73.8 5.826 64.6 67.6 - 74.9 81.1 77.4 73.0 72.5 75.7 70.9 73.0 5.627 63.9 67.3 - 73.9 79.2 75.3 72.4 71.6 74.1 70.9 71.9 5.128 61.7 65.7 -- 72.1 75.3 71.7 71.2 72.6 71.6 69.7 70.0 4.729 59.2 63.4 - 68.1 71.2 64.0 62.1 71.4 67.6 66.8 65.6 4.730 57.9 62.1 - 65.9 70.1 63.4 59.6 68.8 65.9 65.9 64.0 4.631 55.9 60.5 - 63.8 67.7 61.2 57.9 67.5 63.9 64.5 62.1 4.532 53.9 59.5 62.0 65.7 59.9 57.0 65.0 62.0 63.0 60.4 4.233 52.2 58.7 - 60.7 63.9 58.1 55.3 62.8 60.3 61.5 58.8 4.134 51.5 57.8 -- 59.2 61.9 56.5 54.0 61.1 58.6 59.9 57.4 3.835 50.4 56.2 - 57.3 59.5 54.0 51.8 59.3 56.6 57.8 55.5 3.636 47.9 53.9 - 55.3 57.3 51.3 49.6 56.5 54.2 55.2 53.1 3.637 45.3 51.3 - 52.6 54.2 48.1 47.0 53.4 51.3 51.8 50.3 3.538 45.4 50.7 - 51.9 53.2 47.1 46.2 52.7 50.6 50.5 49.6 3.339 42.2 47.4 -- 48.0 49.1 42.5 42.0 48.4 46.6 45.5 45.7 3.240 36.4 41.2 - 42.1 43.1 36.1 35.9 42.7 40.6 38.1 39.6 3.3
AL 68.6 72.7 - 78.3 83.0 79.0 77.2 78.6 78.5 78.5 76.8 4.7OASPL 76.5 78.4 -- 84.9 89.7 87.5 86.8 83.9 85.7 - 84.0 4.8PNL 80.5 84.6 -- 90.2 95.0 91.0 89.6 89.8 90.6 - 88.7 4.7FPNLT 81.5 85.6 -- 91.4 96.4 92.7 91.0 93.1 92.0 - 90.0 4.9
BANDS 14 TO 40 - STANDARD 1/3 OCTAVE BANDS 25 TO IOKHz
* -- UNWEIGHTED ENERGY AVERAGE OF MEASURED LEVELS OVER 360 DEGREES** A-WEIGHTED ENERGY AVERAGE OF MEASURED LEVELS OVER 360 DEGREES
- UNWEIGHTED ARITHMETIC AVERAGE OF MEASURED LEVELS OVER 360 DEGREES
- 32 SECOND AVERGING TIME
o3
.,

0
TABLE NO. C.4--5H.2
SIKORSKY S--76 HELICOPTER (SPIRIT) DOT/TSC4/24/04 0
1/3 OCTAVE NOISE DATA -- STATIC TESTS
AS MEASURED****
SITE- 5H (HARD) - 150 M. NORTH JUNE 13,1983
FLIGHI IDLEAVERAGE LEVEL.
LEVELS @ ACOUSTIZ EMMISION ANGLES OF (DEGRFES) OVER 360 DEGREES
BANDNO. 0 45 90 135 180 225 270 315 ENERGY AVE ARITH Std* .** *** Dv -
SOUND PRESSURE LEVEL dB re 20 usicroPascal Dv
14 54.5 50.4 63.2 61.2 .- - 57.6 53.5 58.8 14.1 56.7 4.915 53.0 47.2 61.2 59.1 - - 56.7 54.1 57.1 17.7 55.2 5.016 67.3 64.2 69.3 65.3 - - 67.1 67.6 67.1 32.5 66.8 1.817 51.2 49.4 58.5 55.6 - - 56.7 54.4 55.3 25.1 54.3 3.4i 57.7 57.5 64.3 57,3 -- - 63,3 55.1 60.6 34.4 59.2 3.719 52.9 55.6 62.1 57.2 - - 62.5 58.6 59.4 36.9 58.1 3.720 70.2 61.2 71.2 69.2 - - 73.4 74.3 71.4 52.3 69.9 4.721 62.4 56.0 64.6 60.5 -- - 64.5 64.5 62.9 46.8 62.1 3.422 55.8 55.7 60.2 57.9 -- - 60.7 59.0 58.6 45,2 58.2 2.123 59.2 62.9 66.9 65.1 - - 67.4 64.2 65.0 54.1 64.3 3.024 58.5 59.1 62.6 61.5 . -. 63.1 60.4 61.2 52.6 60.9 1.925 59.1 58.3 64.0 64.0 - 65.9 64.4 63.4 56.8 62.6 3.126 57.9 58.2 62.8 63,.3 . -. 63.9 62.3 62.0 57.2 61.4 2.727 58.7 58.4 62.6 62,7 - - 65.3 61.2 62.1 58.9 61.5 2.628 56.4 56.7 60.6 60.8 . -. 64.2 61.2 60.8 58.9 60.0 3.029 55.4 55.1 57.6 56.9 - -- 62.0 59.6 58.8 58.0 58.1 2.6 -
30 52.4 54.0 54.5 56.1 - - 60.1 57.1 56.5 56.5 55.7 2.731 51.3 52.8 52.4 53.9 - 59.1 56.0 55.1 55.7 54.2 2.932 50.3 51.9 50.3 51.3 58.2 54.7 53.9 54.9 52.8 3.133 49.2 51.2 48.8 49.6 56.1 53.5 52.3 53.5 51.4 2.934 48.8 50.1 47.2 48.8 53.2 52.3 50.6 51.9 50.1 2.335 49.7 48.4 46.2 47.4 50.5 50.7 49.1 50.3 48.8 1.836 50.1 46.5 43.2 46.6 47.7 48.1 47.5 48.5 47.0 2.337 52.1 47.6 40.7 42.5 - - 44.6 49.5 47.9 48.4 46.2 4.338 54.1 49.6 39.6 42.0 .. .. 42.6 49.8 49.1 49.0 46.3 5.739 49.2 45.7 34.9 36.9 - - 37.4 45.0 44.4 43.3 41.5 5.8 p40 42.9 40.8 28.8 30.3 - -. 30.5 38.9 38.5 36.0 35.4 6.2
AL 64.9 64.6 67.1 67.4 - - 70.5 68.2 67.6 67.6 67.1 2.2OASPL 74.0 71.0 76.9 74.9 ...- 77.9 77.1 75.9 - 75.3 2.6PNL 78.7 77.0 78.9 78.9 - - 81.9 81.2 79.7 -- 79.4 1.8PNLT 80.8 77.9 80.2 80.6 . -. 83.5 83.3 81.4 - 81.C 2.1
EBANDS 14 TO 40 - STANDARD 1/3 OCTAVE BANDS 25 TO 10KHz
* -- UNWEIGHTED ENERGY AVERAGE OF MEASURED LEVELS OVER 360 DEGREES.** - A-WEIGHTED ENERGY AVERAGE OF MEASURED LEVELS OVER 360 DEGREES,
* - UNWEIGHTED ARITHMETIC AVERAGE OF MEASURED LEVELS OVER 360 DEGPEES,,
* - 32 SECOND AVERGING TIME
.1.
..........

7-•
TABLE NO. C.4-5H. 3
SIKORSKY S-76 HELICOPTER (SPIRIT) DOT/TSC .-4/24/84 3
1/3 OCTAVE NOISE DATA --- STATIC TESTS
AS MEASURED****
SITE: 511 (HARD) - 150 M. NORTH JUNE 13,1983
pGROUND IDLE
AVERAGE LEVELLEVELS @ ACOUSTIC EMMISION ANGLES OF (DEGREES) OVER 360 DEGREES
BANDNO. 0 45 90 135 1.80 225 270 315 ENERGY AVE ARITH Std
* ** *** Dv53OUND PRESSURE LEVEL de re 20 microPascal
14 -- - 48.2 .. .. 51.6 -- 50.2 5.5 49.9 2.415 - - 47.3 .. . . 48.7 - 48.1 8.7 48.0 1.0
16 -- 47.7 .. .. .. 48.7 - 48.2 13.6 48.2 0.71 -- - 54.5 - - - 56.5 - 55.6 25.4 55.5 1.4158 . -. 55.1 . .. . 58.0 - 56.8 30.6 56.6 2.119 -- 52.3 . .. .. 53.2 - 52.8 30.3 52.7 0.620 - 55.6 .. .. .. 58.1 -- 57.0 37.9 56.9 1.821 - - 51.3 Z$ 4. 52.3 - 51.8 35.7 51.8 0.722 53.7 .. .. .. 55.6 - 54.8 41.4 54.6 1.323 - - 54.5 - - - 56.5 - 55.6 44.7 55.5 1.424 .. .. 54.8 .. .. . 56.5 -- 55.7 47.1 55.6 1.225 -- - 53.2 - - - 55.1 - 54.3 47.7 54.1 1.326 -- - 52.4 .. .. .. 53.5 - 53.0 48.2 52.9 0.827 - - 51.4 - - 53.8 - 52.8 49.6 52.6 1.728 .. .. 48.5 . .. . 53.0 -- 51.3 49.4 50.7 3.229 -- - 45.5 .. . .. 50.4 - 48.6 47.8 47.9 3.530 - - 43.6 .. .. .. 48.8 - 46.9 46.9 46.2 3.731 - - 42.2 .. . . 46.0 - 44.5 45.1 44.1 2.732 . -. 41.5 .. .. .. 43.9 - 42.9 43.9 42.7 1.733 - - 39.9 - - - 41.1 - 40.5 41.7 40.5 0.834 -- - 37.9 .. . .. 38.6 - 38.3 39.6 38.2 0.535 - 37.2 - - - 38.0 - 37.6 38.8 37.6 0.6"36 -- - 38.4 .. .. .. 38.6 - 38.5 39.5 38.5 0.137 - - 37.0 - - - 37.1 - 37.1 37.6 37.1 0.138 . - 36.5 .. . . 36.0 -- 36.3 36.2 36.2 0.4
S 39 - - 35.0 . 34.4 - 34.7 33.6 34.7 0.440 34.9 - 33.9 - 34.4 31.9 34.4 0.7
AL -- - 56.4 .. .. . 59.1 - 58.0 58.0 57.7 1.9OASPL .. . 64.8 .. .. .. 66.9 -- 66.0 - 65.8 1.5PNL -- - 68.7 .. . .. 70.5 - 69.7 "- 69.6 1.3F'N.T .. .. 69.3 .. .. .. 71.4 - 70.o - 70.3 1.5
IB.ANDS 14 TO 40 STANDARD 1/3 OCTAVE BANDS 25 TO IOKHz
* - UNWEIGHTED ENERGY AVERAGE OF MEASURED LEVELS OVER 360 DEGREES** - A-WEIGHEIED ENERGY AVERAGE OF MEASURED LEVELS OVER 360 DEGREESX** -- UNWEIGHTED ARITHMETIC AVERAGE OF MEASUTED LEVELS OVER 360 DEGREES
- 32 SECOND AVERGING TIME
i
:-)
I" m -- ,[ - r " • % -m • '

APPENDIX D
Direct Read Acoustical Data for Static Operations
This appendix contains time averaged, A-weighted sound level data (Leqvalues) obtained using direct read Precision Integrating Sound Levelmeters. Data are presenLed for microphone locations 5H, 2, and 4 (seeFigure 3.3).
A description of the measurement systems is provided in Section 5.6.2, anda figure of the typical PISIM system is shown in Figure 5.4. Data are"shown in Table D-I, depicting the equivalent sound levels for eightdifferent source emission angles. In each case the angle is indexed to"the specific measurement site. A figure showing the emission angleconvention is included in the text (Figure 6.1). In each case, the Leq(or time averaged AL) represents an average over a sample period ofapproximately 60 seconds.
Quantities appearing in this appendix include:
HIGE Hover-in-ground-effect, skid height 5 feet aboveground level
% HOGE Hover-out-of-ground-effect, skid height 30 feetabove ground level
Flight Idle Skids on ground
Ground Idle Skids on ground
. o-.

TABLE D.1
"STATIC OPERATIONSDIRECT READ DATA
(ALL VLUES A-"EI6HTED LEG, EXPRESSED IN DECIBLES)
SIKORSKY S-76
6-13-83
SITE 4H
HI6E FLT.IDLE 6RN.IDLE
L-0 54.40 M-OA 47.80 M-OB 49.60L-315 62.70 H-315A 54.20 M-315 NAL-270 59.00 M-270A 52.20 M-2708 NAL-225 63,20 H-225 53.30 M-2258 NAL-180 66.20 M-180A 53.00 M-1808 39.40L-135 64.90 M-135 NA 1-135B NAL-90 61.30 M-90A NA -908 NL-45 56.30 H-45A 50.10 M-458 NA
SITE 2
HI6E FLT.IDLE GOD.IDLE
L-0 63.90 M-GA 57.10 1-OGB 54.80L-315 72.10 H-315A 61.50 M-3158 N1.L-270 69.60 H-270A 60.30 M-270B NAL-225 73.20 M-225A 62.80 1-2258 NAL-180 76.10 M-180A 61.40 M-180B 45.20L-135 77.00 M-135A N- M-10 NA -L-90 71.80 N-90A N -90B NL-45 67.90 M-45 59.70 11-458 NA
SITE 5H
HIGE FLT.IDLE ND.IDLE
L-0 68.40 1-GA 64.80 H-0B NAL-315 78.00 M-315 68.20 M-315B NAL-270 78.00 H-27DA 70.90 M-2708 59.80L-225 79.80 M-225 NA -225B NAL-180 82.50 1-IBG NA1 -180B NAL-135 79.60 M-135A 66.80 M-1358 NAL-90 75.40 M-90A 66.90 M-90B 57.30L-45 71.80 M-45 64.40 M-45B N.
V.
0
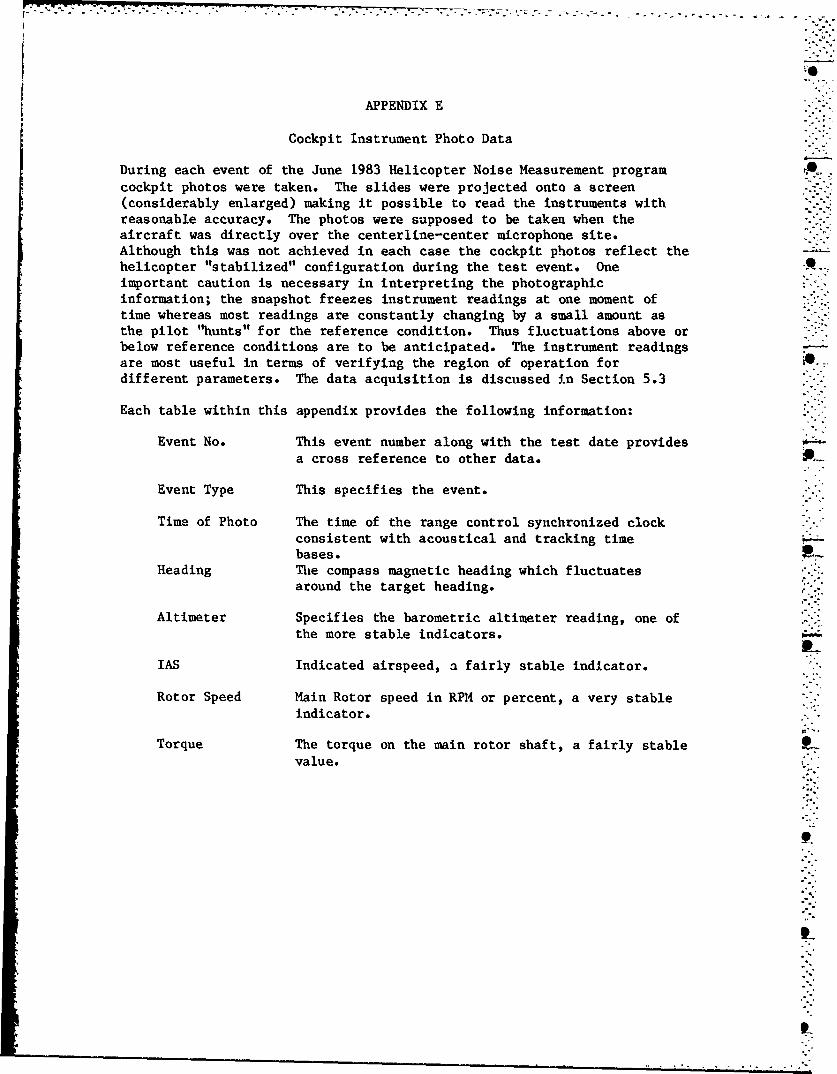
0
APPENDIX E
Cockpit Instrument Photo Data
During each event of the June 1983 Helicopter Noise Measurement programcockpit photos were taken. The slides were projected onto a screen(considerably enlarged) making it possible to read the instruments withreasonable accuracy. The photos were supposed to be taken when theaircraft was directly over the centerline-center microphone site.Although this was not achieved in each case the cockpit photos reflect thehelicopter "stabilized" configuration during the test event. One -important caution is necessary in interpreting the photographicinformation; the snapshot freezes instrument readings at one moment oftime whereas most readings are constantly changing by a small amount asthe pilot "hunts" for the reference condition. Thus fluctuations above orbelow reference conditions are to be anticipated. The instrument readingsare most useful in terms of verifying the region of operation fordifferent parameters. The data acquisition is discussed in Section 5.3
Each table within this appendix provides the following information:
Event No. This event number along with the test date providesa cross reference to other data.
Event Type This specifies the event.
Time of Photo The time of the range control synchronized clockconsistent with acoustical and tracking timebases.
Heading The compass magnetic heading which fluctuatesaround the target heading.
Altimeter Specifies the barometric altimeter reading, one of
the more stable indicators.
IAS Indicated airspeed, a fairly stable indicator.
Rotor Speed Main Rotor speed in RPM or percent, a very stableindicator.
Torque The torque on the main rotor shaft, a fairly stablevalue.
I-
a% ONO - %0 N % f,% 1 .r ý L ýTr % n %D - - ,-tr r T -T -4 .1 o, c. a% m 5%-
00
0 0 0 Ta.,
S0000000 0000000ý 00000 0 00 00C 000000 2: ý -4 -4-4 -4 -4r-4 -4 14 -4 4-4 41-4 -4-4 r- - -4 -4-4 -4-4 -4 4 r-4 14
Czl
- 0 14L) n nul 0 Ifn0 0 C) C) 0r f) C 0 0 0oUo LnLnE- V cl2C - - t-4 - C14 1 cq cn I cn C-4-4 01010C) L -4 -T -T
Ci2 E- -.4 -4--4 -4 -4 - 4 -4-4-4 "4 -.4 -4 -4 1-4 1-4 -4--4 -4-1 ý
E-,
0 0 0) 0 0 0 0 0 0 0 0 0 06W E~- II Uin 0I O.TI1 *0 1 010CD1 0 r-in I U
E. E- E 4 -
4F-4
CI)040 0 00C )000 0 00 0 000 00000 0C)0 0 0 00CUf)0 L,0
0 Dw0L -r nrý m -:r %D aOn oo co %00U,0 rc -4cn % r- M N I r-0 00(>-4 -4-4 -4C N"NJ m' CflnC C-4 T U0c 0 0-4-A-4 CNC4Cn MCn
o 000000~ 0000000000000000000E-0000000 0000000 00 0 00 00 0 00 00000 Z f4 ~
Wi 0- >' 4 ý4 > -C 0_ 0C
E-S

0
0000
'-C 0 00 00 0 00 00 00 00 00C ,00 0000
S00000000 00 00 00 00 0000 00000
0 -4, .4 _4 .-: :.4 -
4~~-
-4 ~ 4.
00
E-4
0000-00 000 0000000
E- U) I) I - 00I r
c'J .E
'-4
0~~~~~ C)
010 000 C)aI~0 o 000 CAO
0 0 -4 C,4 * .
0 ' T 0 n c
OW'4 0
E-40C ~ %, 0rrC4) %D
P E,
0
tE- -r
V)0 ) '
0= nL )00 L nL nL n (%Ca % c - 00
L) w o n :) C 00 ) l r- - - - - C c C4 4

83ý Lnoin-oo nnnonUonnU: 000000'Do00 0'000,U,nlo000 00-4-4- 00 00 0 00 00 0 C14cJN Cl q 7% m -4men0 ~ -ItcoC4
Oo a
0 0-4T""~c 0000 r'-0000ccv)o 000000000S00000 00000000 tfloooo~t)0 0000000000E- 13.
0x
E--
0
Li2 0/ -)L 4
bee
C?..
E0 E- C14 %0 C140 IT -4 _j -T T 4 -TIT -- -:sw0-4* ID nr n W 4. DON N w0 w0, w v 0 0 0 f, N4 N~ Nn N (,I C00-4 -4 C14 N- N' C14 "MM~ N in 00
0 -3E-.
E13 0
.a9
C-..
0d C/)0-J L4'tr).O L 00 0LnL 0-*v -C'L--& 00 .t vn Lm '4co'4ir) o-0 t-jen- 0-0
'~O ~ M '' 0 -4 -4 N M' 0 0-4 -4e'.l r- -- r
Et 0- . r 0 0 %- nx % D0 - 00 - - nr N Ln 0 000N0 w0000

APPENDIX F
Photo-Altitude and Flight Path Trajectory Data -
This appendix contains the results of the photo-altitude and flight pathtrajectory analysis.
The helicopter altitude over a given microphone was determined by aphotographic technique which involves photographing an aircraft during aflyover event and proportionally scaling the resulting image with theknown dimensions of the aircraft. The data acquisition is described indetail in Section 5.2. The detailed data reduction procedures is set outin Section 6.2.1; the analysis of these data is discussed in Section 8.2
Each table within this appendix provides the following information:
Event No. the test run number
Est. Alt. estimated altitude above microphone site
P-Alt. altitude above photo site, determined byphotographic technique
Est. CPA estimated closest point of approach to microphonesite
Est. ANG Ielizopter elevation with respect to the ground asviewed from a sideline site as the helicopterpasses through a plane perpendicular to the flight - .track and coincident with the observer location.
ANG 5-1 flight path slope, expressed in degrees, betweenP-Alt site 5 and P-Alt site 1.
ANG 1-4 flight path slope, expressed in degrees, betweenP-Alt Site I and P-Alt Site 4.
ANG 5-4 flight path slope, expressed in degrees, betweenP-Alt Site 5 and P-Alt Site 4.
Reg C/D Angle flight path slope, expressed in degress, ofregression line through P-Alt data points.
0'°'
S
- . .. .
77177
TABLE F.1
HELICOPTER: SIKORSKY S-76
TEST DATE: 6-13-83
OPERATION: 500 FTFLYOVER(10'ItNE)ITARGET IAS=145 KTS
CBETERLINE SIDELINE
NIC #5 NIC 01 MIC 14 NIC 32 NIC #3 RES.EST. EST. EST. EST. ELEV EST. ELEV A6 N G CID
OW8P NO ALT. P-ALT. ALT. P-ALT. ALT. P-ALT. CPA ANG CPA ANG 5-1 1-4 5-4 A4GLE
Al 458.2 463.6 454.8 444.4 452.2 458.8 670 42.8 670.3 42.7 -2.1 1i7 -.2 -. 2A2 496.8 493.4 492.4 502.5 488.9 484.4 696.1 45 696.5 45 1.1 -2 -. 4 -. 3A3 501.7 500.4 492.5 500.4 485.1 483 696.1 45 697 45 0 -1.9 -. 9 -. 8"A4 431.4 430.8 435.2 NA 437.5 436.9 456.9 41.5 656.6 IN NA NA .4 .4"A- 477 478.7 466 468.1 457.2 458.8 677.7 43.4 678.6 43.4 -1.1 -l -1.1 -. 9A6 454.9 452.9 465.5 464.5 474 471.9 677.3 43.4 676.4 43.5 1.4 .9 1.1 1
AVERAGE 470 470 467.7 476 465.8 465.6 679 43.5 679.2 43.9STD. DEV 27 26.1 22.1 25 20.2 18 15.2 1.3 15.6 1
TABLE F.2
HELICOPTER: SIKORSKY S-76
TEST DATE: 6-13-83
OPERATION: 500 FT.FLYOVER(O.9MNE)ITARGET IAS=130 KTS
"CENTERLINE SIDELINE
""IC #5 NIC 11 HIC #4 tIC 12 NIC 13 REG.EST. EST. EST. EST. ELEV EST. ELEV AN •N6 CJD
EVEBT U9 ALT. P-ALT. ALT. P-ALT. ALT. P-ALT. CPA AN8 CPA ANG 5-1 1-4 5-4 ANGLE
87 457.8 460 438.5 443.6 423.2 425.2 659.1 41.7 660.7 41.6 -1.8 -2 -1.9 -1.788 456.7 454.1 460.9 464.5 464.3 461.2 674.2 43.1 673.8 43.2 1.2 -. 3 .4 .489 508.6 510.5 491.6 496.4 478.1 479.7 695.5 45 697.1 44.9 -1.5 -1.8 -1.7 -1.5
- BIO 496.8 496.2 497.2 498.4 497.6 496.8 699.5 45.3 699.5 45.3 .3 -. 1 0 0811 466.7 470.7 446.9 450.9 427.1 N 664.7 42.2 663.4 NA -2.2 NA NA -2.2B12 492.5 492.8 485.7 488.5 480.3 480.4 691.3 44.6 691.9 44.6 -.4 -. 8 -. 6 -.5B 813 544.5 544.9 532.1 537.6 522.2 522.2 724.7 47.2 725.8 47.2 -.8 -1. -1.2 -1.1
SEW 489.1 489.9 479 482.8 470.4 477.6 687 44.2 687.5 44.5STD. DEV 31.8 31.7 32.5 32.5 35.9 183 22.8 1.9 23.1 1.9

TABLE F.3
HELICOPTER: SIKORSKY 5-76
TEST DATE: 6-13-83
"W"ErTIoN: 500 FULYOVER(0.8"E)TARGET 1AS115 KYS
CENTERLINE SIDELINE
"HIC #5 NIC #1 MIC 64 MIC #2 MIC #3 RES.EST. EST. EST. EST. ELEB EST. ELEV AN6 6 C/1) Do
"" 2J9UTNO ALT. P-ALT. ALT. P-ALT. ALT. P-LT. CPA AG CPA A46 5-1 1-4 5-4 ANGLE
C14 495.8 493.6 503.4 504.5 509.5 507 703.9 45.7 703.2 45.7 1.3 .3 .8 .7C15 466.9 467 466.4 466.3 466 466.2 677.9 43.5 678 43.5 0 0 0 0
"" C16 508.3 509 503.9 504.5 500.3 501.1 704.2 45.7 704.6 45.7 -. 4 -.3 -. 4 -.3C17 479.5 481.5 472.3 471.6 466.5 468.7 682 43.8 682.6 43.8 -1.1 -. 2 -. 6 -. 6
" C18 488.4 487.9 482.2 486.6 477.3 476.4 688.9 44.4 689.5 44.4 -. 1 -1.1 -.4 -. 5
A VERAGE 487.8 487.8 485.6 486.7 483.9 483.9 691.4 44.6 691.6 44.6STD. DEV 15.7 15.5 17.4 17.9 19.9 18.9 12.2 1 12 1
TABLE F.4
HELICOPTER: SIKORSKY S-76 1
TEST DATE: 6-13-83
OPERATION: 500 FT.FLYOVER(O.7"R4E)/TARGET 1AS400 KTS
L_CENTERLINE SIDELINE
"IIC #5 NIC #1 MIC 64 MIC 62 HIC #3 REG.EST. EST. EST. EST. ELEV EST. ELEV A86 446 AN8 C/D
EOW NO ALT. P-ALT. ALT. P-ALT. ALT. P-ALT. CPA *46 CPA AN6 5-1 1-4 5-4 ANGLE
D19 458 456.1 461 463.7 463.5 461.2 674.2 43.1 674 43.2 .9 -.2 .3 .3" D20 457 456.8 457.4 457.6 457.8 457.6 671.8 42.9 671.8 42.9 .1 0 0 0
021 476.2 477.6 471.5 470.7 467.7 469.3 681.4 43.8 681.8 43.8 -. 7 -.1 -.4 -.3D)22 455 455.4 448 450.9 442.3 442.5 665.4 42.3 666 42.3 -. 4 -.9 -.7 -. 6D23 458.3 459.7 449.3 450.9 442.2 443.6 666.3 42.4 667.1 42.4 -.9 -.8 -.8 -. 7 . "
. AVERA6E 460.9 461.1 457.4 458.8 454.7 454.8 671.8 42.9 672.1 42.9"STD. DEV 8.6 9.4 9.5 8.5 11.9 11.6 6.5 .6 6.3 .6
S.- -.- ~. ---.-. .-
TABLE F.5
HELICOPTER: SIKORSKY 0-76
TEST DTE: 6-13-83
OPEMTION: 1000 FT.FLYOVER(1.0UN'E)fTARGET 1AS145 KTS
CBETERLINE SIDELINE
NIC 15 NIC I1 NIC 14 HIC 12 HIC 03 RE6.EST. EST. EST. EST. ELEV EST. ELEV AN6 A M6 C/D
EI:4vTINO ALT. P-ALT. ALT. P-ALT. ALT. P-ALT. CPA AN•6 CPA 4 5-1 1-4 5-4 ,NGLE
E24 1070 1075.9 1060 1052.1 1052 1058.9 1168.6 65.1 1169.8 65.1 -2.7 .8 -. 9 -. 8 -
E25 1055.2 1060.4 1054.7 1043.2 1054.4 1060.9 1163.8 65 1163.9 65 -1.9 2.1 0 0E26 1069.9 1072 1061.5 1041.2 1054.7 1057 1169.9 65.1 1170.9 65.1 -1.2 -. 4 -. 8 -. 7E27 973.5 972.6 976.6 977 979.1 979.1 1093.5 63.3 1093.2 63.3 .5 .1 .3 .3"E28 1061.5 1068.1 1036.1 1034.5 1015.9 1023.2 1147 64.6 9J49.9 64.6 -3.8 -1.2 -2.5 -2.3
AVOMWE 1046 1049.8 1037.8 1033.6 1031.2 1035.6 1148.6 64.6 1149.5 64.6 iwSTD. DEV 41 43.5 35.7 33.2 33.4 35.7 32.1 .8 32.6 .8
TABLE F.6
HELICOPTER: SIKORSKY S-76
TEST MTE: 6-13-83
OPEMTION: ICAO TAKEOFF/TARSET 1AS=74 KTS
CENTERLINE SIDELINE
"NIC #5 MIC 11 NIC 14 HIC 12 HIC 13 REG.EST. EST. EST. EST. ELEV EST. ELEV AN6 ANS A18 C/D
EVNUT NO ALT. P-ALT. ALT. P-ALT. ALT. P-ALT. CPA M6 CPA M16 5-1 1-4 5-4 AIGLE
F29 322.9 307.8 427.6 406.3 511.1 496.5 651.8 41 643.1 41.5 11.3 10.4 10.9 9.7F30 333.3 318 438.2 417.3 521.9 507.1 658.9 41.7 650 42.2 11.4 10.3 10.9 9.7F31 317.4 298.3 449.7 423 555.1 536.6 666.5 42.4 655.2 43 14.2 13 13.6 12.3F32 342.4 330.4 428.6 410.3 497.3 485.7 652.5 41.1 645.3 41.5 9.2 8.7 9 8F33 287.7 274.2 375 359.4 444.6 431.3 618.6 37.3 611.9 37.8 9.8 8.3 9.1 8.1F34 268.8 250.8 389.7 366.4 486.1 468.6 627.6 38.4 618.1 39 13.2 11.7 12.5 11.2F35 232.9 216.4 329.1 315.6 405.8 389.1 591.9 33.8 585.2 34.4 11.4 8.5 10 8.9"F36 256.4 239.3 360.1 343.9 442.8 425.6 609.7 36.2 601.9 36.8 12 9.4 10.7 9.6
AVEM6E 295.2 279.4 399.7 380:3 483:1 467.6 634:7 39 626.4 39.5"5"STD. DEV 39.80 .8, 42.8 39.5 40.9 48.9 26.7 3.1 25.6 3

TABLE F.7
HELICOPTER: SIKORSKY S-76
TEST DATE: 6-13-83
"OPERATION: 3 DEGREE APPRODACI/TARGET IAS•74 KTS
CENTERLINE SIDELINE
HIC #5 HIC II HIC 14 HIC #2 HIC #3 REG.EST. EST. EST. EST. ELEV EST. ELEV AN6 AN6 A16 CI)D
EVENT NO ALT. P-ALT. ALT. P-ALT. ALT. P-ALT. CF *N6 CEPA AN6 5-1 1-4 5-4 AN.E
637 350.2 349.1 372.5 363.1 390.3 389.9 617.1 37.1 615.4 37.3 1.6 3.1 2.4 2.1638 336 333.6 366.6 355.8 391 389.3 613.6 36.7 611.2 36.9 2.6 3.9 3.2 2.8639 334.5 328.8 372.4 365.3 402.6 397 617 37.1 614.1 37.3 4.2 3.7 4 3.5"640 369.8 366.1 399.1 392 422.4 419 633.5 39 631.2 39.2 3 3.1 3.1 2.7"641 327,9 327.2 340.5 335.4 350.5 350.2 598.3 34.7 597.4 34.8 1 1.7 1.3 1.2642 360.7 355.5 397 389.6 426 421 632.2 38.9 629.3 39.1 4 3.7 3.8 3.4"643 344.3 354.6 463.8 377.6 559.1 576.9 S76.1 43.3 665.7 43.9 2.7 22.1 12.7 11.1
AVERAGE 346.2 345 387.4 368.4 420.3 420.5 626.8 38.1 623.5 38.4STD. DEV 15.1 15.1 39 19.9 66.1 72.9 24.8 2.7 21.8 2.9
TABLE F.8
HELICOPTER: SIKORSKY S-76
TEST DATE- 6-13-83
OPERATION: TAKEOFF/CATAGORY B
CENTERLINE SIDELINE
"HIC 15 HIC 1 HIC 14 HIC #2 Hie #3 REG.EST. EST. EST. EST. ELBJ EST. ELEV A46 46 AN6 C/)D
ow NO ALT. P-ALT. ALT. P-ALT. ALT. P-ALT. CPA AN6 CPA *46 5-1 1-4 5-4 WI6LE
1H44 346.6 340.3 389.7 381.1 424.1 418 627.6 38.4 624.2 38.6 4.7 4.3 4.5 4""H45 391.5 382.6 450.6 439.6 497.8 489 667.2 42.5 662.1 42.8 6.6 5.7 6.2 5.5H146 361.3 362.2 405 379.9 439.8 442.7 637.2 39.5 633.7 39.7 2.1 7.3 4.7 4.1H47 428.9 420.7 500 480.9 556.6 549.3 701.4 45.5 695 45.8 7 7.9 7.4 6.6H48 369 368.1 443.5 406.3 502.9 504.8 662.4 42 656 42.4 4.4 11.3 7.9 6.9 -
H49 415.4 398.4 476.4 482.7 525.1 506.2 684.9 44.1 679.5 44.4 9.7 2.7 6.3 5.7
, AVEIAGE 385.5 378.7 444.2 428.4 491 485 63.5 42 658.4 42.3STD. DEV 32.2 28.4 41.7 46.7 50.5 47.5 27.9 2.7 26.8 2.7
......................................".. .... *
S
TABLE F.9
HELICOPTER: SIKORSKY S-76
TEST DATE: 6-13-83 S
OPERATION: 6 DEGREE APPRRACI/TARSET IAS=74 KIS
CENTERLINE SIDELINE
NIC #5 NiC 31 NYC #4 NYC 32 NlC #3 REG.EST. EST. EST. EST. ELEV EST. ELEV N6 ANG6 N6 C/D
EVEN8T NO ALT. P-ALT, ALT. P-ALT. ALT. P-ALT. CPA A16 CA•M •i6 5-1 1-4 5-4 M.&E
150 291.8 284.6 361.6 341 417.3 411.2 610.6 36.3 605.4 36.7 6.5 8.1 7.3 6.5151 310.8 298.3 364.2 364.2 406.9 393.4 612.2 36.5 608.1 36.8 7.6 3.4 5.5 5152 310.7 306.4 360.6 343.9 400.3 397 610 36.2 606.2 36.5 4.4 6.2 5.3 4.6153 292.6 233.4 357.1 343.9 408.6 399.7 608 36 603.1 36.3 7 6.5 6.7 6 -154 314.8 305.1 379.8 367.5 431.6 422.1 621.6 37.7 616.5 38 7.2 6.3 6.8 6155 300.8 290.7 362.2 352.7 411.2 401 611 36.4 606.3 36.7 7.2 5.6 6.4 5.7
AVERAGE 303.6 294.8 364.3 352.2 412.7 404.1 612.2 36.5 607.6 36.8ST". DEV 10 10 8 11.3 10,e 10.7 4.8 .6 4.6 .6
TABLE F.10O,
HELICOPTER: SIKORSKY S-76
TEST DATE: 6-13-83
OPERATION: TAKEOFF W/TU1rTARGET IAS=74 KTS
CBETERLINE SIDELINE
"NIC 35 NIC #1 NIC #4 NIC #2 NIC #3 REG.EST. EST. EST. EST. ELEJ EST. ELEV AN6 *M86 AN C/D
EBVET NO ALT. P-ALT. ALT. P-ALT. ALT. P-ALT. CPA ANG CPA AN6 5-1 1-4 5-4 W4GLE
J56 NA NA NA 347.7 NA NA NAt NA NA NA NA NA NA NA:.,-
J57 325.9 306.4 421.8 402.3 517.7 NA 648.1 40.6 653.9 tN 11 N A 11 iJ58 277.2 258.5 369.4 350.7 461.6 NA 615.3 36.9 620.5 NA 10.6 NA NA 10.6J59 273.3 254.6 365.5 346.8 457.7 NA 612.9 36.6 618.1 NA 10.6 NA NA 10.6J60 236.2 216.4 333.8 314 431.4 NA 594.6 34.2 599.7 NA 11.2 "A NA 11.2
AVERAGE 278.2 259 372.7 352.3 467.1 617.7 37.1 623.1STD. DEV 36.8 36.9 36.4 31.7 36.3 22.3 2.6 22.6
.-:..
,0"
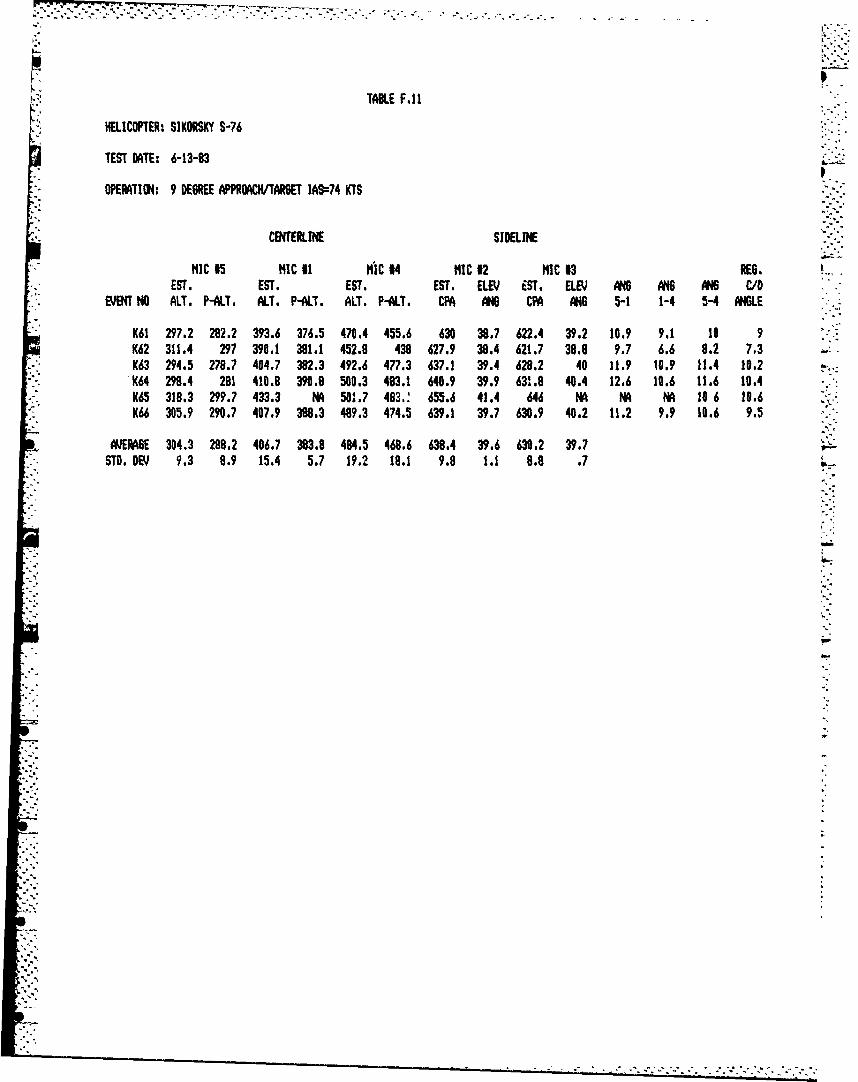
K TABLE F.11
HELICOPTER: SIKORSKY S-76
TEST DATE: 6-13-83
OPERATION: 9 DEGREE APPROACW/1AR6ET IAS74 KTS
CENTERLINE SIOELINE
"HIC 35 hIC 31 1IC 14 HIC #2 WIC #3 REG. KEST. EST. EST. EST. ELEV EST. ELEY A6 4N6 AN C/O
O NO ALT. P-ALT. ALT. P-ALT. ALT. P-ALT. CPA A10 CPA A44 5-1 1-4 5-4 AIGLE
K61 297.2 282.2 393.6 376.5 470.4 455.6 630 38.7 622.4 39.2 10.9 9.1 10 9
K62 311.4 297 390.1 381.1 452.8 438 627.9 38.4 621.7 38.8 9.7 6.6 8.2 7.3 .1(63 294.5 278.7 404.7 382.3 492.6 477.3 637.1 39.4 628.2 40 11.9 10.9 11.4 10.2
'K64 298.4 281 410.8 390.9 500.3 483.1 640.9 39.9 631.8 40.4 12.6 10.6 11.6 10.4,K65 318.3 299.7 433.3 N 501.7 483.: 655.6 41.4 646 NA NA 10 6 10.61K66 305.9 290.7 407.9 388.3 489.3 474.5 639.1 39.7 630.9 40.2 11.2 9.9 10.6 9.5
AVERAGE 304.3 288.2 406.7 383.8 484.5 468.6 638.4 39.6 630.2 39.7"STD. DEV 9.3 8.9 15.4 5.7 19.2 18.1 9.8 1.1 8.8 .7
N.

"APPENDIX G
NWS Upper Air Meteorological Data
This appendix presents a summary of meteorological data gleaned fromNational Weather Service radiosonde (rawinsonde) welther balloonascensions conducted at Sterling, VA. The data collection is furtherdescribed in Section 5.4. Tables are identified by launch date and launchIItime. Within each table the following d ta are provided:
Time expressed first in Eastern Standard, then inEastern Daylight Time
Surface Height height of launch point with respect to sea level
,e•',Z height above ground level, expressed in feet
Pressire expressed in millibars
Temperature expressed in degrees centigrade
Relative expressed as a percentNumidity
Wind Direction t ie direction from which tne wind is blowing(in degrees)
Wind Speed expressed in knots
.".5 ,
.- .-
0::

in i
toq if. I IN IM MrI
0
It i
.4 vi0 iN I 0 M~ V
Sw-
.1 *E 0 0 0 C' N 0 04SIf __0in U) Uc if 4 V o V N 4 V MV 0 IT4~ Cc ý 0 Q I )F Ai4V
wE w w 0 T k 1 I N 4 C9t M 94"( 4 T~4 v1 41P4 N I IN N IN
wi
eli11-7

- I_.
Im II i-,
OO 0.qN0t ) )f )wn 0 190) In % WN m- 4,in ilw .a
of 0%E °m.m MOM m
• ! II!
3 I II I
0 O"i i0 in i.0. hO I *
3
z I I.L
-i00-
Iii -(4 i 40m 1 0N W r. Nl $ý 94N !4$iw v 1 n1 4 v
IL
N mm 0.,0 0 -q NvN NI
o i I Nv4M 0~ 0%0c m Np 4 0 0 1 m m N 9 4
,,0 0 O
in
0oo.° 0 000oo oo0 000
SI 0 ,

M' 4 -4.-4-4 V4 -
m I Iq it Iq i nfoin 3z >
I .. I-I
0% w
c I-P
i-
z
0'. , .
MPI N• N i ,4 ,DI ,. w o ,m
Va rw '0 wI IN .4 a r. in I le m Cl 4 4 v
'40 In.'~ 0 0 0
u 0K'0 0 ** 0 000 00x 000 0 0 000 0
m 5'W
I I" I+' I, L"°"+u 0 . . S * S S•,O•• 0

w 9
m *4O 0ý P4 O494 9 4 4V
~It N0. ob 004N N r0 " 04C4 No N v In04 IN IbON 0 MrP~)MM m~ P)M m
M- Wmz >iI
M041w ) 0VON40 N m a M N i%0 ) n w ) . 4Io' %N N M -0 -10 Dob MN r% OO 40 UHOU %0Iv)n))i) n nIf n no91 n n o
-:2- ~ wI.ui Jz
c zi l-c MIX
J W0 )494N,40UN 0fl ( W(NNO '4 9(.INNNNNNNNNI~
to 0j &L0~ ) 4 il i ~ , Y i
UI. ix
W - 000, 000wwN s% a %~0o n 0q00mm(N "0
0 0
u - 0000000 0 o0 00000 00000... CzI 000 00000 000000000000w Lo 4NMT0 4v MW 4 N M04 0 4'NM V04 N 0~e 01.

. W:
WI-I C'J Ml 4l'E N 0O~NO if)OON toIm W
94 94 9ml V494 94 v 4w l Pm4
IN4
2.
z1,4 M ln)N ** v me 0 00 0 0 -A 9 .4 MP 4) M V q W
0) z 0lz
J' 06 YNNN- 4NNNMNN144N1 N N NN
J0b 04 NNOw .
NNN N

0. .1 0 in 0 NN v O n 0V W WOr In OI m lz x clO 11 * I p4 We 4e V p4 4N NN v nIIqlM P
z, 0
1-1 MN v40qlo nlr M P09"I f000-W(.1 VNMm, 2-z N I 4VW )1 nW ni )W )W nI f ni
-c X Win
i IM
*C I II
I Ol 0 NNN N oUIo 0 011 0.00
mco 'NKr 60 I f nItVTMMi NFw - ! 0 0 I ýP I h I.0 % Q 7 .0 kOL0 c-CN(.0 I 4
1-i .~ 0000 *0;oo000o00000.0.0.000.0.0
=1 Wu
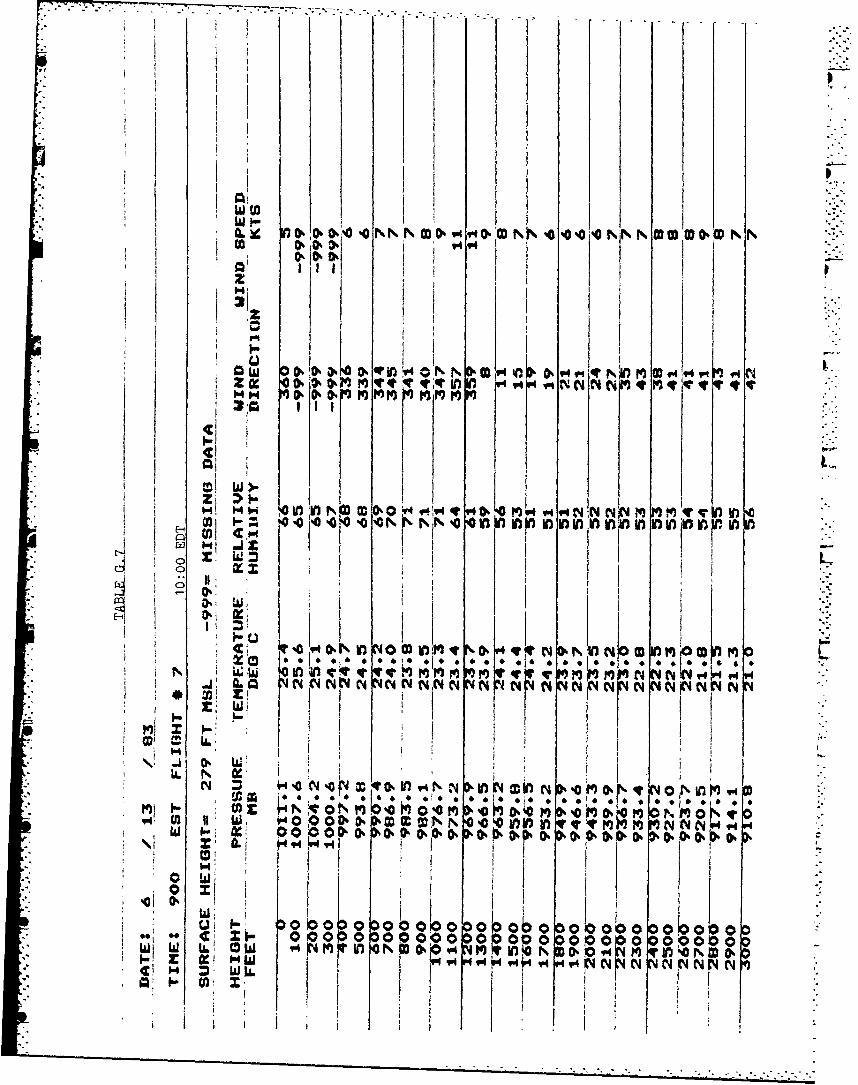
W to
*ii
Wi-
I I4,
ION. okf% Iqq 1
en W
•Z;
N~ 1. 0 *1,44tV ýt
N11 m~ ~ ~ ~ v~"~O
v q. . )i r Itq m. P)*.q .
N. NU) N 41t Otm v 0. m t m4 o.* .j
N , 04f TMI) NNN
* cow
Q! I- D OOOýo 00000 06 0 0 000000000C!~~~~ x 0 0 00 20W w L6Ic 4Nf )O 0 M lwN 6 o m 0aN 0

F•.', ,....* - --
W,II-
I z
fm ; Witý i
3iW
z m
LU
P4 NooOr 4T P )im I's 04~ k4C~.rMI' MOO N Nv o49
w w. -
to Iz -
w i-
t Ipo N ~ ~ ~ YM z 44Nr vq
w O:M 00 0 01 000 0 0 0•'
0 " "
w~U~ciIN ,1
S• mi x 1'4 '•" 0 ,_4 N N• 0IC' C1d.
ZWIio o Vo ,•o o , oI o ~,• ,o
wiI
00oooo oo o000*0 00000000ooo 000= U. IL
to W
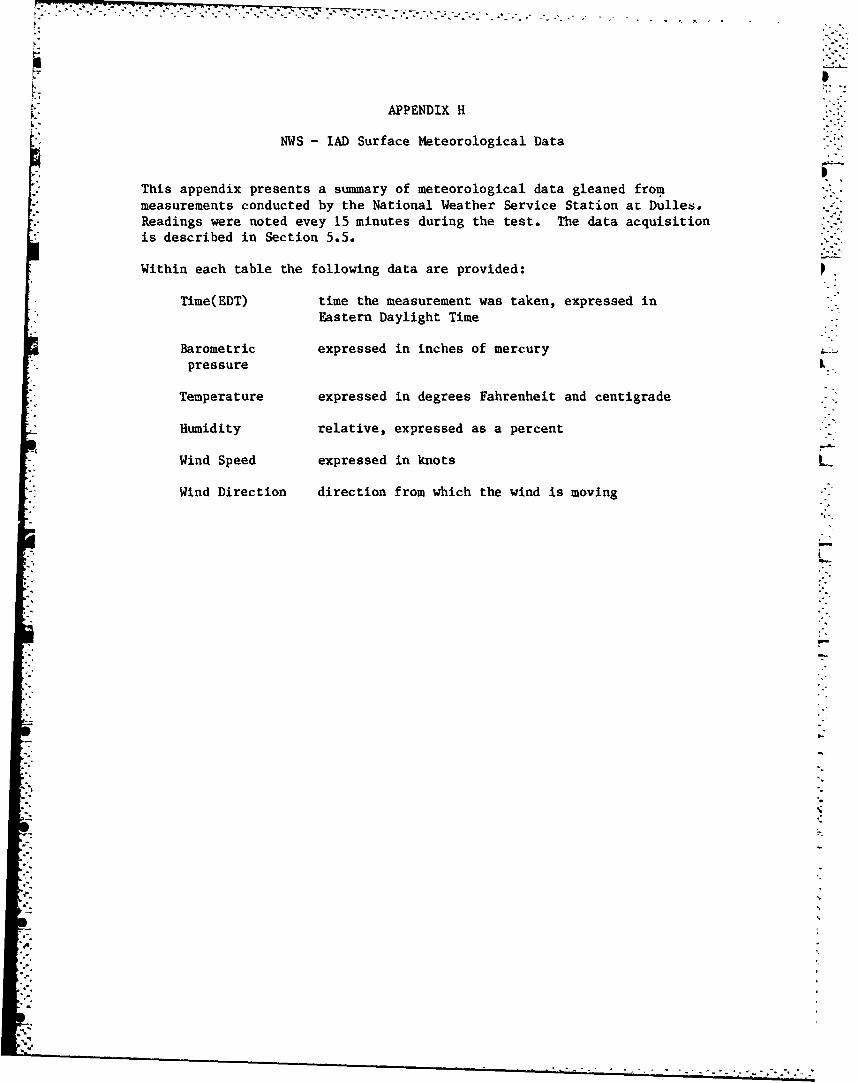
-.. , n nL t L p - - -. .
APPENDIX H
"NWS - lAD Surface Meteorological Data
This appendix presents a summary of meteorological data gleaned frommeasurements conducted by the National Weather Service Station at Dulles.Readings were noted evey 15 minutes during the test. The data acquisition"is described in Section 5.5.
Within each table the following data are provided:
Time(EDT) time the measurement was taken, expressed inEastern Daylight Time
Barometric expressed in inches of mercury
pressure
Temperature expressed in degrees Fahrenheit and centigrade
Humidity relative, expressed as a percent
Wind Speed expressed in knots L
"Wind Direction direction from which the wind is moving

C//)
0(z
HzCz 0 0 0 0 0 CT\ ON CFl OCl Cl Y D 0 0 D O CO W t- t- CL- t-
H4-
cic
CIa)Cr)
00
C- E-- - C- C- -I -l -l - - C- C- C- -n -n -M - - - -M
L) H' c)' a' 0, am N ' U 00 C, co mo co c- o t- - m- 0- 4-
C/)
r i :-:*-*
C:))
(Y) E-a
Cr) 0 0). .M- w x N' N' a) 0-(n (n --T co T 0 C -T iT '.o C-CoO' 4-'
in in n -. -. -. -. -. -. -. -C - - - C- C- C- - C- C- C-
4-)
E-44
0)E- E 0" f) Ln n C TýC> n 0 L (D ý 0 f) kO4n V
C/)N - T 0-l) 7 0 ()' Zco F- : : ;C S0-' 0 0 0 0 0 0 0

0CxW
E- cc -,T 00) C) 0o NN M
1-4
--
o
I-i
0
E-0
13 C'C - r z C N N C
0 I
* >..
0 - ' t
00)
0C/) 0/0X Wz
0)
* E-4 2) E0U(2) E-I' w~~ -V
Q- M -TC(

APPENDIX I
On-Site Meteorological Data
This appendix presents a summary of meteorological data collected on-siteby TSC personnel using a climatronics model EWS weather system. Theanemometer and temperature sensor were located 5 feet above ground levelat noise site 4. The data collection is further described in Section 5.5.
Within each table, the following data are provided:
Time(EDT) expressed in Eastern Daylight Time
Temperature expressed in degrees Fahrenheit and centigrade
Humidity expressed as a percent
Windspeed expressed in knots
Wind Direction direction from which the wind is blowing
Remarks observations concerning cloud cover and visibility
"I'..
4-
"-9-:°

7- - -- - - - - - - - - - - -17 -7 .-. w
0 cl
E
.1-0 WC)U) W L4. U
(30 S. m 0
0 V /3
E- ) W ~iIL M)0 U
.0
0(dw - i
E- W-
84 '0 :ca.
izi
V)l
j-4
* CO 0
- ~ E -O -M -M -~ - -O -' ( -. - -M -C - -~ -C -. --- C- -O -o a a-z M n V- W M CM CM CM CM CM CM CM C -CM OD CM CM CM
Z Lf) IU) ILl '.0 '.D '1 0 t- - t, C- C- - C--- L- t-- tC- CO 00 CO 0 C
--
E-4.Vd) 0 ILn 0 n~ 0 n~ 0 un 0 ILl 0 U' 0 n~ 0 IUl 0Un 0 U'l 0 0
Hi i-4C (1) -T 0 - () -. 0' (1 -Z7 ' Cl --T 0 Ml -ý 0'- Ml Cl)
0~ 0~ '0 C0 '0 C.0 C- C- CD 0 CO CO CO CO a' a C' a:' 00 - -
U))
~~>1
cd .3- 10 05_
o >, u)
t.)O~v) 00
oo;
o
< 0.-2 w
a. :2c:
(::2
00 0
a..
E-2 0
'-4
14* \D U
US GVERMENTPRITIN OFFCE 984461-161007