T H E G E O L O G AY O F ntelope Island - Utah
173
Antelope Island THE GEOLOGY OF D AVIS COUNTY, UTA H Jon K. King and Grant C. Willis, editors
Transcript of T H E G E O L O G AY O F ntelope Island - Utah

Antelope IslandT H E G E O L O G Y O F
D A V I S C O U N T Y , U T A H
Jon K. King and Grant C. Willis, editors

THE GEOLOGY OF ANTELOPE ISLAND, DAVIS COUNTY, UTAH
Jon K. King and Grant C. Willis, editors
Miscellaneous Publication 00-1UTAH GEOLOGICAL SURVEYa division of
Utah Department of Natural Resources
2000
ISBN 1-55791-647-0

The Geology of Antelope Island

STATE OF UTAHMichael O. Leavitt, Governor
DEPARTMENT OF NATURAL RESOURCESKathleen Clarke, Executive Director
UTAH GEOLOGICAL SURVEYKimm M. Harty, Acting Director
UGS BoardMember Representing Craig Nelson (Chairman) ............................................................................................................... Civil Engineering D. Cary Smith .................................................................................................................................. Mineral Industry C. William Berge ............................................................................................................................ Mineral IndustryE.H. Deedee O’Brien ........................................................................................................................ Public-at-LargeRobert Robison ............................................................................................................................... Mineral IndustryCharles Semborski .......................................................................................................................... Mineral IndustryRichard R. Kennedy ................................................................................................. Economics-Business/ScientificDavid Terry, Director, Trust Lands Administration ..................................................................... Ex officio member
UTAH GEOLOGICAL SURVEY
The UTAH GEOLOGICAL SURVEY is organized into five geologic programs with Administration, Editorial, and ComputerResources providing necessary support to the programs. The ECONOMIC GEOLOGY PROGRAM undertakes studies to identify coal,geothermal, uranium, hydrocarbon, and industrial and metallic resources; initiates detailed studies of these resources including mining dis-trict and field studies; develops computerized resource data bases, to answer state, federal, and industry requests for information; andencourages the prudent development of Utah’s geologic resources. The APPLIED GEOLOGY PROGRAM responds to requests fromlocal and state governmental entities for engineering-geologic investigations; and identifies, documents, and interprets Utah’s geologic haz-ards. The GEOLOGIC MAPPING PROGRAM maps the bedrock and surficial geology of the state at a regional scale by county and ata more detailed scale by quadrangle. The GEOLOGIC EXTENSION SERVICE answers inquiries from the public and provides infor-mation about Utah’s geology in a non-technical format. The ENVIRONMENTAL SCIENCES PROGRAM maintains and publishesrecords of Utah’s fossil resources, provides paleontological and archeological recovery services to state and local governments, conductsstudies of environmental change to aid resource management, and evaluates the quantity and quality of Utah’s ground-water resources.
The UGS Library is open to the public and contains many reference works on Utah geology and many unpublished documents onaspects of Utah geology by UGS staff and others. The UGS has several computer data bases with information on mineral and energyresources, geologic hazards, stratigraphic sections, and bibliographic references. Most files may be viewed by using the UGS Library. TheUGS also manages a sample library which contains core, cuttings, and soil samples from mineral and petroleum drill holes and engineer-ing geology investigations. Samples may be viewed at the Sample Library or requested as a loan for outside study.
The UGS publishes the results of its investigations in the form of maps, reports, and compilations of data that are accessible to the pub-lic. For information on UGS publications, contact the Natural Resources Map/Bookstore, 1594 W. North Temple, Salt Lake City, Utah84116, (801) 537-3320 or 1-888-UTAH MAP. E-mail: [email protected] and visit our web site at http://www.ugs.state.ut.us.
UGS Editorial StaffJ. Stringfellow ....................................................................................................................................................EditorVicky Clarke, Sharon Hamre...............................................................................................................Graphic ArtistsPatricia H. Speranza, James W. Parker, Lori Douglas ..........................................................................Cartographers
The Utah Department of Natural Resources receives federal aid and prohibits discrimination on the basis of race, color, sex, age, national origin, or disability. Forinformation or complaints regarding discrimination, contact Executive Director, Utah Department of Natural Resources, 1594 West North Temple #3710, Box 145610,
Salt Lake City, UT 84116-5610 or Equal Employment Opportunity Commission, 1801 L Street, NW, Washington DC 20507.
Printed on recycled paper 3/00

ii The Geology of Antelope Island Utah Geological Survey

The Geology of Antelope IslandMiscellaneous Publication 00-1 iii
The Miscellaneous Publication series of the Utah Geological Survey provides non-UGS authors with a high-quality format forpapers concerning Utah geology. Although some reviews have been incorporated, this publication does not necessarily conform toUGS technical, policy, or editorial standards.
Many of the papers in this Miscellaneous Publication were written in the early 1990s and have not been fully updated with information or research completed since that time. The extent of peer review varies between papers.

The Geology of Antelope Island Utah Geological Surveyiv
TABLE OF CONTENTS
1. Introduction to the geology of Antelope Island, Utah Willis, G.C., King, J.K., and Doelling, H.H. . . . . . . . . . . . . . . . . . . . . . . . . . . . . . . . . . . . . . . . . . . . . . . . .1
2. Petrology and geologic history of the Precambrian Farmington Canyon Complex, Antelope Island, Utah Yonkee, W.A., Willis, G.C., and Doelling, H.H. . . . . . . . . . . . . . . . . . . . . . . . . . . . . . . . . . . . . . . . . . . . . .5
3. Proterozoic and Cambrian sedimentary and low-grade metasedimentary rocks on Antelope Island Yonkee, W.A., Willis, G.C., and Doelling, H.H. . . . . . . . . . . . . . . . . . . . . . . . . . . . . . . . . . . . . . . . . . . . .37
4. Tertiary rocks of Antelope Island, Davis County, Utah Willis, G.C., and Jensen, M.E. . . . . . . . . . . . . . . . . . . . . . . . . . . . . . . . . . . . . . . . . . . . . . . . . . . . . . . . . .49
5. Antelope Island - new evidence for thrusting Hansen, A.R., and McCarley, L.A. . . . . . . . . . . . . . . . . . . . . . . . . . . . . . . . . . . . . . . . . . . . . . . . . . . . . . .71
6. Late Pleistocene and Holocene shoreline stratigraphy on Antelope IslandMurchison, S.B., and Mulvey, W.E. . . . . . . . . . . . . . . . . . . . . . . . . . . . . . . . . . . . . . . . . . . . . . . . . . . . . . . .77
7. Shorelines of Antelope Island as evidence of fluctuations of the level of Great Salt Lake Atwood, Genevieve, and Mabey, D.R. . . . . . . . . . . . . . . . . . . . . . . . . . . . . . . . . . . . . . . . . . . . . . . . . . . .85
8. Aragonite cementation and related sedimentary structures in Quaternary lacustrine deposits, Great Salt Lake, Utah - Burke, R.B., and Gerhard, L.C. . . . . . . . . . . . . . . . . . . . . . . . . . . . . . . . . . . . . . .99
9. The waters surrounding Antelope Island, Great Salt Lake, Utah Gwynn, J.W. . . . . . . . . . . . . . . . . . . . . . . . . . . . . . . . . . . . . . . . . . . . . . . . . . . . . . . . . . . . . . . . . . . . . . .117
10. Construction materials, Antelope IslandDavis, F.D. . . . . . . . . . . . . . . . . . . . . . . . . . . . . . . . . . . . . . . . . . . . . . . . . . . . . . . . . . . . . . . . . . . . . . .131
11. Hydrogeology of Antelope Island, Great Salt Lake, Utah Mayo, A.L., and Klauk, R.H. . . . . . . . . . . . . . . . . . . . . . . . . . . . . . . . . . . . . . . . . . . . . . . . . . . . . . . . . .135
12. Engineering geology considerations for park planning, Antelope Island State Park, Davis County, Utah Hecker, Suzanne, and Case, W.F. . . . . . . . . . . . . . . . . . . . . . . . . . . . . . . . . . . . . . . . . . . . . . . . . . . . . . .151

Miscellaneous Publication 00-1 The Geology of Antelope Island v

vi The Geology of Antelope Island Utah Geological Survey

Antelope Island, the largest of Great Salt Lake’s eightmajor islands, is about 15 miles (24 km) long and up to 5miles (8 km) wide, and covers approximately 40 square miles(104 km2). Frary Peak, the island’s highest point, is 6,597feet (2,010 m) above sea level and about 2,400 feet (730 m)above the lake’s historical average level. Although the islandis perhaps best known for its wildlife and relatively pristinecondition, the island is also fascinating from a geologicalstandpoint.
GEOLOGIC MAPPING
Captain Howard Stansbury, who explored the valley ofGreat Salt Lake in 1850, first described the geology of theisland (Stansbury, 1852). Stansbury turned his notes and rocksamples over to the prominent New York professor, JamesHall, who noted in an appendix to Stansbury’s report that therocks of the island “...consist of granite, or perhaps an alteredsedimentary quartz or siliceous sandstone” (Hall, 1852). Inthe 1870s, Clarence King, S.F. Emmons and Arnold Hague ofthe 40th Parallel Survey and other government surveyorsexplored and mapped much of the west (King, 1876, 1878;Hague and Emmons, 1877). Their geologic map of northernUtah showed the island as Archean rocks surrounded by Qua-ternary deposits (King, 1876). After climbing to the top ofFrary Peak, Hague and Emmons (1877) described theArchean rocks as “...mostly gneisses, with some quartzitesand mica-slates.”
George G. Bywater and Joseph A. Barlow (1909) pro-duced the first large-scale geologic map of Antelope Island (1inch = 1 mile). Their map included two Precambrian units -“granite” and “gneiss,” and four Cambrian units - “basal con-glomerate,” “limestone,” “slate,” and “quartzite and conglom-erate.” They also made note of the “shoreline of an ancientocean” (Pleistocene Lake Bonneville), marked by accumula-tions of sand and gravel deposits, and Paleozoic boulders.A.J. Eardley and R.A. Hatch (1940a, 1940b) divided the Pre-cambrian crystalline rocks into three lithologic units and dis-cussed overlying sedimentary rocks and quartzite at the northend of the island.
Willard Larsen (1957) produced a detailed study of thepetrology and structure of Antelope Island, and a 1:24,000-scale (1 inch = 0.379 miles) geologic map. He divided thePrecambrian crystalline rocks into three lithologic parts,
which he treated as stratigraphic units: the lower, mainly onthe west side of the island; the middle, including a majorshear zone, in the center of the island; and the upper, coveringall of the southern and most of the eastern part of the island.He also noted the presence of Tertiary rocks on the island.
In 1987, the Utah Geological and Mineral Survey (nowthe Utah Geological Survey), in cooperation with the UtahDivision of Parks and Recreation, began a multifaceted proj-ect to map the island, study mineral and water resources, andassess geologic hazards. This comprehensive study resultedin the following publications: Geology and Antelope IslandState Park, Utah (Doelling and others, 1988); Antelope IslandState Park - the History, the Geology, and Wise Planning forFuture Development (Doelling, 1989); and the Geologic Mapof Antelope Island, a 1:24,000-scale geologic map and accom-panying text booklet (Doelling and others, 1990), that wereused in developing the Antelope Island State Park MasterPlan. Doelling and others (1990) mapped the island’s rocksand sediments in greater detail than previous studies, showedscarps and faults, identified potential geologic hazards, anddiscussed engineering aspects. This new volume contains theresults of various technical studies completed as part of, or incooperation with, the UGS Antelope Island study begun in1987.
GEOLOGIC HISTORY
Some of Utah’s oldest and youngest rocks are preservedon the island. They consist of six formations separated byunconformities: Farmington Canyon Complex, Mineral ForkFormation, Kelley Canyon Formation, Tintic Quartzite, anunnamed Tertiary conglomeratic unit, and Salt Lake Forma-tion (figure 1) (Doelling and others, 1990).
The oldest rocks, the Farmington Canyon Complex, areexposed on the southern two-thirds of the island. Some ofthese rocks may be more than 2.5 billion years old, and wereoverprinted by high-grade metamorphism and intrusionsabout 1.7 billion years ago. Yonkee and others (this volume)describe these rocks.
The Mineral Fork Formation consists of diamictitedeposited about 750 million years ago (late Proterozoic) dur-ing continental glaciation. The slightly younger, but closelyassociated, Kelley Canyon Formation overlies the MineralFork rocks. The Kelley Canyon consists of slightly metamor-
INTRODUCTION TO THE GEOLOGYOF ANTELOPE ISLAND, UTAH
byGrant C. Willis, Jon K. King, and Hellmut H. Doelling
Utah Geological Survey

phosed dolomite and slate deposited in an ancient oceanbetween 600 and 700 million years ago. About 550 millionyears ago, during the early part of the Cambrian period, rocksof the Tintic Quartzite were deposited in lower coastal plainand shoreline environments near the margins of an ancientocean. Tintic rocks cover the northern part of the island.Yonkee and others (this volume) describe the Mineral Fork,Kelley Canyon, and Tintic Formations. During the LateJurassic to early Tertiary Sevier orogeny, island rocks wereinvolved in intense semi-brittle to brittle deformation inwhich they were folded, faulted, sheared, retrogressivelymetamorphosed, uplifted, and eroded (Doelling and others,1990; Yonkee, 1992). Hansen and McCarley (this volume)discuss some local Sevier orogeny and later basin-and-rangedeformation on Antelope Island.
The next group of rocks is middle Tertiary in age, andoverlies an unconformity representing about 500 millionyears. During the early Tertiary, about 40 to 50 million yearsago, very coarse conglomerate, sandstone, and mudstonewere deposited in the area. This unnamed conglomerate unitis exposed on the east side of the island. These rocks may beequivalent in part to the Wasatch Formation, Fowkes Forma-tion, or Norwood Tuff that are common in northeastern Utah.Large boulders in the conglomerate were eroded from Pre-cambrian and Paleozoic formations, most of which are no
longer preserved on the island, andsome clasts contain fossils of corals,brachipods, crinoids, and othermarine fauna.
After another interval of erosion,upper Tertiary rocks making up theSalt Lake Formation were deposited,probably 11 to 8 million years ago.They consist of sandstone, conglom-erate, mudstone, and volcanic ashdeposited in basins between moun-tain ranges. These rocks are nowsteeply tilted to the east and are fault-ed, reflecting late Cenozoic basin-and-range deformation that com-menced about 17 million years agoand created the island block. Willisand Jensen (this volume) discuss theTertiary rocks and their relationshipto rocks of similar age and lithologyin other parts of northern Utah. Thislatest phase of mountain buildingcontinues today. Deep basins, typi-cally with no external drainage,developed between the ranges andare filled with sediments transportedby rivers and streams from the sur-rounding mountains. Along with therest of the Great Basin, AntelopeIsland continues to be active geologi-cally. Movement occurs periodicallyalong bounding faults, tilting theisland more and changing the lakeand island elevations.
One of the latest influences toshape Antelope Island was Lake Bonneville, which was 1,000feet (300 m) deep and covered over 20,000 square miles(50,000 km2) of western Utah, eastern Nevada, and southernIdaho during the last ice age (Currey and others, 1984; Oviattand others, 1992). Lake Bonneville’s various shorelines areetched on Antelope Island, and sand and gravel were deposit-ed over most of the island by the lake’s strong wave action.Lake Bonneville expanded gradually from a small saline lakeabout 30,000 years ago to its highest level, the “Bonneville”level (at approximately 5,200 feet [1,585 m] in elevation)about 15,000 years ago. At this level it was nearly the size ofpresent Lake Michigan. This level was maintained untilabout 14,500 years ago when a breach at Red Rock Pass insouthern Idaho released a catastrophic flood into the SnakeRiver Plain, quickly lowering the water surface about 350feet (107 m) to the “Provo” level. This level, at about 4,820feet (1,469 m), was maintained until increased evaporationassociated with climatic changes caused the lake to nearly dryup about 12,000 years ago. Several other levels, includingthe “Stansbury” at approximately 4,450 feet (1,356 m), andthe “Gilbert” at about 4,250 feet (1,295 m), form less-promi-nent shorelines on the island (Oviatt and others, 1992). Overthe last 10,000 years, lake levels have fluctuated near thepresent level of Great Salt Lake.
The Geology of Antelope Island
Introduction to the geology of Antelope Island, Utah - Willis, King, Doelling
Utah Geological Survey2
CEN
OZO
ICM
ESO
ZOIC
PALE
OZO
ICPR
OTE
RO
ZOIC
ARC
HEA
N0 -
100 -200 -300 -400 -500 -600 -700 -800 -900 -1Bill -
2Bill -
3Bill -
0 -
10 -
20 -
30 -
40 -
50 -
FARMINGTON CANYON COMPLEXMAY CONTAIN DETRITAL MATERIAL2.7 TO 3.4 BILLION YEARS OLD
METAMORPHISM AND INTRUSION
FARMINGTON CANYON COMPLEX
TINTIC QUARTZITEKELLEY CANYON FORMATIONMINERAL FORK FORMATION
THRUSTINGAND ASSOCIATEDLOW-GRADEMETAMORPHISM
CONGLOMERATIC UNIT
BEGINNING OF BASIN-AND-RANGE- STYLE NORMAL FAULTING (WASATCH AND OTHER FAULTS)
SALT LAKE GROUP
ROCKS ON ANTELOPE ISLAND TILTED 25-45° EAST
LAKE BONNEVILLE DEPOSITS
Figure 1. Chart showing ages of for-mations and timing of major eventsaffecting rocks on Antelope Island.Sources of information: Hedge andothers (1986), Doelling and others(1990), Barnett and others (1993),and papers in this volume.

GREAT SALT LAKE
The present Great Salt Lake, approximately 40 miles (64km) wide and 80 miles (128 km) long, is the largest lake inthe U.S. after the Great Lakes. It is a shallow body of water -it is slightly over 30 feet (9 m) deep in the deepest part, andaverages just 13 feet (4 m) deep when at a “typical” lake sur-face elevation of 4,202 feet (1,280.8 m) above sea level.Because it has no outlet, variations in precipitation in thedrainage basin result in constant fluctuations in the lake level,size, and salinity. From 1850 until the present, the lake levelhas fluctuated more than 20 feet (6 m), from 4,191 to 4,212feet (1,277.4-1,283.8 m) above sea level, changing its areafrom 970 to 2,280 square miles (2,512-5,905 km2). When thelake is below a level of 4,200 feet (1,280 m), Antelope Islandis connected to the mainland by a broad mudflat. Duringthese fluctuations, lake salinity varies from 5 to over 25 per-cent. In contrast, ocean water contains a little over 3 percentsalt. Five major ions are present in the waters of the lake:sodium, magnesium, potassium, chlorine, and sulfate. Calci-um, lithium, bromine, and boron are present in lesser but sig-nificant quantities (Gwynn, 1997). Gwynn (this volume) dis-cusses the hydrology of Great Salt Lake. Just as Lake Bon-neville did before, the rising and falling Great Salt Lakeleaves shoreline traces on Antelope Island. Atwood andMabey (this volume), and Murchison and Mulvey (this vol-ume) present more information on historical and late prehis-toric Great Salt Lake shoreline features. Burke and Gerhard(this volume) discuss cementation and sedimentary structuresassociated with Great Salt Lake.
ROCK AND MINERAL RESOURCES
Slate was mined from outcrops in the Kelley CanyonFormation by the early pioneers. Over the years, prospectorssearched for copper and gold because the island is alignedwith the Oquirrh Mountains, the location of the productiveBingham mining district. Copper mineralization is prominenton some outcrops, but significant mineralization has not beendiscovered. Today, the chief resources of the island are sand,gravel, and quartzite boulders suitable for riprap, roadfill, andconcrete aggregate. In 1979 and 1980, approximately 16 mil-lion cubic yards (12 million m3) of sand and gravel wereexcavated from 2.5 square miles (6.5 km2) of alluvial fansand beach deposits in the southeast part of the island andtransported on a 13-mile-long (21-km) conveyor belt (thelongest in the world at the time) for use in the construction ofInterstate 80 between Saltair and Salt Lake City. The north-ern and western beaches have abundant deposits of fineoolitic calcium carbonate sand. Davis (this volume) discussesconstruction materials on the island.
SPRINGS AND GROUND WATER
Antelope Island has several springs, primarily foundabove an elevation of 4,400 feet (1,340 m) on the east side ofthe island. These springs are thought to be recharged by rainand snowmelt that percolates into fractured rocks at higherelevations. The water quality is good, but with higher sodiumand chloride concentrations than water flowing from springsin the Wasatch Range. Mayo and Klauk (1991; this volume)
evaluate water chemistry on the island. Locations of septicdrainfields and public facilities must be carefully evaluated toassure that the limited ground water is not polluted.
GEOLOGIC HAZARDS
Landslides, rock falls, and debris flows have createdscars and deposits that can be seen on the island, sand duneshave migrated onto recently constructed roads, and unpavedroads on steep hillsides consisting of loose material have con-tributed to erosion. Several major active faults are near theisland, and earthquake shaking could seriously damage ordestroy man-made structures, trigger landslides and rock falls,and cause damaging waves on Great Salt Lake. Unusuallyhigh precipitation in the early 1980s produced a harshreminder of the fluctuating levels of Great Salt Lake. A dras-tic rise in the lake level destroyed road access to AntelopeIsland, flooded beaches, destroyed public facilities, andcaused over $300 million in damage to facilities around thelake (mostly on the mainland). Any future development onthe island or on the causeway to the island should take intoaccount the natural fluctuations of Great Salt Lake. Heckerand Case (this volume) discuss geologic hazards and engi-neering geology of the island.
REFERENCES
Barnett, Daniel, Bowman, J.R., and Smith, H.A., 1993, Petro-logic and geochronologic studies in the FarmingtonCanyon Complex, Wasatch Mountains and AntelopeIsland, Utah: Utah Geological Survey Contract Report93-5, 34 p.
Bywater, G.G., and Barlow, J.A., 1909, Antelope Island,Great Salt Lake: Salt Lake City, University of Utah, B.S.thesis, 21 p., scale 1:63,360.
Currey, D.R., Atwood, Genevieve, and Mabey, D.R., 1984,Major levels of Great Salt Lake and Lake Bonneville:Utah Geological and Mineral Survey Map 73, scale1:750,000.
Doelling, H.H., 1989, Antelope Island State Park; the history,the geology and wise planning for future development:Utah Geological and Mineral Survey, Survey Notes, v.23, no. 1, p. 2-14.
Doelling, H.H., Willis, G.C., Jensen, M.E., Davis, F.D.,Gwynn, J.W., Case, W.F., Hecker, Suzanne, Atwood,Genevieve, and Klauk, R.H., 1988, Geology and Ante-lope Island State Park, Utah: Utah Geological and Miner-al Survey, in cooperation with Division of Parks andRecreation, Miscellaneous Publication 88-2, 20 p.
Doelling, H.H., Willis, G.C., Jensen, M.E., Hecker, Suzanne,Case, W.F., and Hand, J.S., 1990, Geologic map of Ante-lope Island, Davis County, Utah: Utah Geological andMineral Survey Map 127, 27 p. pamphlet, scale 1:24,000.
Eardley, A.J., and Hatch, R.A., 1940a, Pre-Cambrian crys-talline rocks of north-central Utah: Journal of Geology, v.48, p. 58-72.
Eardley, A.J. and Hatch, R.A., 1940b, Proterozic(?) rocks inUtah: Geological Society of America Bulletin, v. 51, p.795-844.
Introduction to the geology of Antelope Island, Utah - Willis, King, Doelling
The Geology of Antelope IslandMiscellaneous Publication 00-1 3

Gwynn, J.W., 1997, Brine properties, mineral extractionindustries, and salt load of Great Salt Lake, Utah: UtahGeological Survey Public Information Series PI-51, 2 p.
Hague, Arnold, and Emmons, S.F., 1877, Descriptive geolo-gy, in Report of the Geological exploration of the fortiethparallel: Professional Papers of the Engineer Department,U.S. Army, no. 18, v. II, 890 p.
Hall, J.E., 1852, Appendix E, a letter from professor JamesHall ...containing observations on the geology and pale-ontology of the country traversed by the expedition, inStansbury, Howard, Exploration and survey of the valleyof the Great Salt Lake, including a reconnaissance of anew route through the Rocky Mountains: Philadelphia,Lippincott, Grambo & Co., p. 401-414 (U.S. 32nd Con-gress, Special Session, Senate Executive Document 3)(reprinted in 1988 with the title “Exploration of the val-ley of the Great Salt Lake” by Smithsonian InstitutionPress, Washington, D.C., 421 p.)
Hedge, C.E., Houston, R.S., Tweto, O.L., Peterman, Z.E.,Harrison, J.E., and Reid, R.R., 1986, The Precambrian ofthe Rocky Mountain region: U.S. Geological Survey Pro-fessional Paper 1241-D, 17 p.
King, Clarence, 1876, Geological and topographical atlasaccompanying the Report of the geological explorationof the fortieth parallel: Professional Papers of the Engi-neer Department, U.S. Army, no. 18, 10 maps, scaleabout 1:250,000 for Utah area.
King, Clarence, 1878, Systematic geology, in Report of thegeological exploration of the fortieth parallel: Profession-al Papers of the Engineer Department, U.S. Army, no. 18,v. I, 803 p.
Larsen, W.N., 1957, Petrology and structure of AntelopeIsland, Davis County, Utah: Salt Lake City, University ofUtah, Ph.D. dissertation, 142 p., scale 1:24,000.
Mayo, A.L., and Klauk, R.H., 1991, Contributions to thesolute and isotopic groundwater geochemistry, AntelopeIsland, Great Salt Lake, Utah: Journal of Hydrology, v.127, p. 307-335.
Oviatt, C.G., Currey, D.R., and Sack, Dorothy, 1992, Radio-carbon chronology of Lake Bonneville, eastern GreatBasin, USA: Palaeogeography, Palaeoclimatology,Palaeoecology, v. 99, p. 225-241.
Stansbury, Howard, 1852, Exploration and survey of the val-ley of the Great Salt Lake, including a reconnaissance ofa new route through the Rocky Mountains: Philadelphia,Lippincott, Grambo & Co., 487 p. [U.S. 32nd Congress,Special Session, Senate Executive Document 3](reprintedin 1988 with the title “Exploration of the valley of theGreat Salt Lake” by Smithsonian Institution Press, Wash-ington, D.C., 421 p.)
Yonkee, W.A., 1992, Basement-cover relations, Sevier oro-genic belt, northern Utah: Geological Society of AmericaBulletin, v. 104, no. 3, p. 280-302.
The Geology of Antelope Island
Introduction to the geology of Antelope Island, Utah - Willis, King, Doelling
Utah Geological Survey4

ABSTRACT
Precambrian high-grade metamorphic and igneous rocksof the Farmington Canyon Complex exposed on AntelopeIsland provide a partial record of the early geologic history ofnorthern Utah. Rock types include: (1) layered gneiss; (2)biotite schist; (3) quartz-rich gneiss; (4) metamorphosed ultra-mafic rock; (5) hornblende-plagioclase gneiss; (6) bandedgneiss; (7) granitic gneiss; (8) granite and pegmatite; (9) chlo-ritic gneiss; and (10) phyllonite and mylonite.
Layered gneiss and intercalated lenses of biotite schistand quartz-rich gneiss probably represent a deformed sedi-mentary sequence. Hornblende-plagioclase gneiss and isolat-ed lenses of metamorphosed ultramafic rock probably repre-sent deformed mafic and ultramafic igneous rocks emplacedover a protracted history. Granitic gneiss and banded gneissprobably represent a deformed, complexly zoned plutonintruded during a main phase of metamorphism and deforma-tion. Non-foliated smaller granite plutons crosscut earlierstructures and were intruded after peak deformation. Peg-matite forms foliated concordant to non-foliated discordantdikes that were emplaced over a protracted history. Chloriticgneiss displays fractures and variable retrograde greenschistalteration that crosscut earlier high-grade structures. Phyl-lonite and mylonite within shear zones display pervasive ret-rograde alteration and concentrated plastic deformation.Chloritic gneiss, phyllonite, and mylonite formed duringdeformation associated with Mesozoic thrusting.
Layered gneiss contains biotite, garnet, sillimanite, K-feldspar, and cordierite, recording high temperatures (about700°C) and relatively low lithostatic pressures (about 3 to 5kilobar) during main-phase metamorphism. Compositions ofbanded and granitic gneiss are consistent with crystallizationat temperatures of 650 to 700°C from magma derived by par-tial melting of tonalitic to granodioritic gneiss. A dominantfoliation formed in the gneisses during main-phase deforma-tion and metamorphism, but complex fold interference pat-terns and multiple foliations in layered gneiss may record ear-lier deformation.
An interpretive geologic history has the following ideal-ized stages: (1) Archean (?) deposition of a supracrustalsequence; (2) Late Archean (?) metamorphism and deforma-tion; (3) Early Proterozoic granitic intrusion; (4) Early Pro-
terozoic main-phase metamorphism and deformation; (5) Pro-terozoic intrusion of late-stage granites; (6) Middle to LateProterozoic uplift and erosion; (7) Late Proterozoic to Meso-zoic deposition of sedimentary rocks; (8) Mesozoic deforma-tion and retrograde alteration; and (9) Cenozoic extension.
INTRODUCTION
High-grade metamorphic and igneous rocks are wellexposed on Antelope Island (figure 1), and provide a partialrecord of the Precambrian geologic history of northern Utah(Bryant, 1988a; Doelling and others, 1990). In this paper we
PETROLOGY AND GEOLOGIC HISTORY OF THE PRECAMBRIAN FARMINGTON CANYON COMPLEX,
ANTELOPE ISLAND, UTAH
by W. A. Yonkee1, G. C. Willis, and H. H. Doelling
Utah Geological Survey
1now at Department of GeosciencesWeber State University, Ogden, Utah
0 20 40 miles
0 20 40 kilometers
Trace of thrustfaultTrace of normalfaultPrecambrianbasement high-grade meta-morphic andigneous rocks
EXPLANATION
Santaquin
Tooele
40°N
111°W112°W
UTAH
UtahLake
Little WillowCanyon
Provo
UTA
HW
YO
MIN
G
DurstMountain
FarmingtonCanyonSalt Lake
City
AntelopeIsland
Great Salt Lake
Brigham City
ChT
AT
CTW
T
WN
WN
41°N
Area shown N
Figure 1. Index map showing tectonic setting and locations of Pre-cambrian basement outcrops in northern Utah. Major fault tracesare labeled: AT- Absaroka thrust system; CT- Crawford thrust; ChT-Charleston thrust system; OT- Ogden thrust system; WT- Willardthrust; WN- Wasatch normal fault zone. Modified from Hintze andStokes (1964) and Bryant (1988b).

discuss the outcrop and petrographic characteristics of base-ment rocks on Antelope Island. We also briefly discuss thegeochemistry, metamorphic conditions, and geochronology ofthese rocks. These data are used to interpret the origin of therocks, to develop a generalized geologic history for the area,and to regionally correlate basement rocks on Antelope Islandwith other Precambrian rocks exposed in the Rocky Mountainarea.
Crystalline basement with similar characteristics isexposed to the east in the Wasatch Range near FarmingtonCanyon (figure 1), and was named the Farmington CanyonComplex by Eardley and Hatch (1940). Limited exposures ofcrystalline basement are also found at Durst Mountain, at Lit-tle Willow Canyon near Salt Lake City, and near Santaquin,Utah (figure 1).
Previous workers outlined the general characteristics ofthe Farmington Canyon Complex. Bell (1951) did a detailed
study of basement rocks in part of the Wasatch Range, andLarsen (1957) conducted a geological study of AntelopeIsland. Bryant (1988b) discussed results of a reconnaissancestudy of the structure and geochemistry of the FarmingtonCanyon Complex, and Hedge and others (1983) conducted ageochronologic study of part of the complex. Basement andsedimentary rocks on Antelope Island were described andmapped in detail by Doelling and others (1990).
During the Precambrian, the Farmington Canyon Com-plex underwent a complicated history of deformation, intru-sion, and metamorphism (Hedge and others, 1983; Bryant,1988b). Late Proterozoic to Mesozoic sedimentary rockswere deposited unconformably over the crystalline basement.The basement and the sedimentary rocks were thrust eastwardand internally deformed in the Late Mesozoic during theSevier orogeny (Yonkee, 1990). An anastomosing network ofshear zones developed during thrusting and these zones over-
The Geology of Antelope Island
Petrology and geologic history of the Precambrian Farmington Canyon Complex - Yonkee, Willis, Doelling
Utah Geological Survey6
N
StillwaterComplex
Wind
River
Range
Big
Horn
Mountains
BlackHills
AntelopeIsland
GrouseCreekRange
RaftRiverRange
AlbionRange
Front
RangeW
asatch Range
Uinta Mountains
P r o t e r o z o i c
T e r r a n e s
Cheyenne
Belt
W y o m i n g
P r o v i n c e
Archean gneiss complexes
Archean supracrustal sequences
Archean layered mafic intrusion
Late Archean granitic intrusions
Early Proterozoic margin deposits
Proterozoic metasedimentary rocks
Proterozoic metavolcanic rocks
Proterozoic syndeformational granitic intrusions
Proterozoic post-deformational intrusions
Archean(?) and Proterozoic gneisses undivided
EXPLANATION
IDAHOUTAH
NEVADA
MONTANAWYOMING
COLORADO
NE
BR
AS
KA
SO
UT
H D
AK
OTA
?
?
?
Ag
As
Ai
Pm
Ps
Pv
Psi
Ppi
AP
AP
APAP
Pv
Pv
Ag
Ag
As AsAs
Ag
As
Ag
As
Ai
Ai
Ag
Ai
Ag
Ai
AgAi
As
Ai
Ai
Ag
AiAi
Ai
As
As
AsAi
Ag
Ai
AgAs
AsAi
As
As
AgPm
Pm
As
Pv
Psi
Ppi
Pv
Ppi Pv
PsiPpi
PpiPs
Ppi
Ps
PsiPsi
Ppi
Psi Ppi
PsPsi
PsPs
PpiPs
PsiPpi
PsiPs
Ppi
PsPsi
PsPsi
Pv
PsPsi
PpiPv Pv
PsPsi
Ps
Ps
PsPsi
Ps
Psi
Pm
Pv
Ag
As
Am
PpiPsi
Ppi
Pm Ag
Am
Figure 2. Locations of Precambrian basement terranes and rock types in the Rocky Mountain region. Approximate boundary of WyomingProvince indicated by dashed line. Modified from Karlstrom and Houston (1984), Hedge and others (1986), Tweto (1987), and Bryant (1988a).

printed Precambrian high-grade structures (Yonkee, 1992).Cenozoic normal faulting further modified structures and ispartly responsible for the current topography and exposure.
REGIONAL SETTING
The Rocky Mountain region contains several distinctPrecambrian terranes that are characterized by different ages,lithologies, and interpreted tectonic settings (Hedge and oth-ers, 1986; Tweto, 1987). Correlation of the FarmingtonCanyon Complex with these other terranes and interpretationof tectonic setting remain problematic, partly because of lim-ited petrologic and geochronologic data. We briefly summa-rize characteristics of Precambrian terranes in the RockyMountain region, and then discuss alternative correlations ofthe Farmington Canyon Complex.
An Archean terrane termed the Wyoming Province cov-ers a broad circular area within the north-central RockyMountains (figure 2) (Hedge and others, 1986). The terraneconsists principally of high-grade gneiss complexes, graniticto granodioritic plutons, and interspersed belts of supracrustalrocks. Gneisses in the central part of the province are as oldas 3,300 million years (Ma), but ages decrease overall towardthe margins of the province. Many areas underwent meta-morphism and intrusion of large granitic plutons between2,700 and 2,500 Ma (Hedge and others, 1986).
A belt of variably metamorphosed Early Proterozoic mar-gin deposits, now exposed in southern Wyoming and SouthDakota, accumulated along the southern and eastern edges ofthe Wyoming Province (figure 2) (Hedge and others, 1986).The belt contains thick sequences of quartzose to argillaceousmetasedimentary rocks and mafic meta-igneous rocks thatprobably accumulated along a rifted passive margin between2,300 and 1,800 Ma (Karlstrom and Houston, 1984).
A wide zone of deformation, called the Cheyenne belt(Karlstrom and Houston, 1984), juxtaposes Archean basementof the Wyoming Province and the overlying sequence ofEarly Proterozoic margin deposits on the north side againstterranes of strongly deformed Proterozoic metavolcanic andmetasedimentary rocks on the south side (figure 2). The beltis interpreted to record a collisional orogeny and accretion ofisland arc terranes onto the southern margin of the ArcheanWyoming Province between about 1,800 and 1,600 Ma (Karl-strom and Houston, 1984; Duebendorfer and Houston, 1987).
The Proterozoic terranes south of the Cheyenne belt arewell exposed in parts of Colorado and consist mostly of: (1)felsic and hornblendic gneisses that represent metamorphosedrhyolitic and basaltic volcanic rocks; (2) quartz-plagioclase-biotite gneiss and schist that represent metamorphosed sedi-mentary rocks including graywacke, sandstone, and shale;and (3) large granodioritic to granitic calc-alkaline intrusivecomplexes (figure 2) (Hedge and others, 1986; Tweto, 1987).Protoliths for meta-volcanic and meta-sedimentary rocksprobably accumulated in or near island arcs about 1,800 mil-lion years ago. Widespread metamorphism and intense defor-mation that affected these rocks peaked at about 1,700 Ma,synchronous with intrusion of the calc-alkaline granitic com-plexes, but the duration of the deformation is uncertain(Hedge and others, 1986; Duebendorfer and Houston, 1987).
The Cheyenne belt is well exposed in southeastern
Wyoming, but its westward extension is uncertain (figure 2).Early Proterozoic margin deposits of the Red Creek Quartziteare juxtaposed over gneisses of the Late Archean OwiyukutsComplex within the Uinta Mountains (Sears and others,1982), indicating that the southern margin of the WyomingProvince may continue westward in the subsurface beneaththe northern margin of the Uinta Mountains (Graff and others,1980; Bryant, 1988a). Crystalline gneisses in the Albion,Raft River, and Grouse Creek Ranges of northwestern Utahand southeastern Idaho may also contain Archean components(Armstrong, 1968; Compton and others, 1977). Mesozoicand Tertiary deformation and metamorphism have largelyobliterated evidence of the early history of these gneissessuch that the western margin of the Wyoming Province ispoorly constrained. Rocks of the Farmington Canyon Com-plex display similarities with both the Archean WyomingProvince and the Proterozoic terranes of Colorado and south-ern Utah.
GENERAL DESCRIPTION OFBASEMENT ROCK TYPES
We divide the crystalline basement rocks on AntelopeIsland into ten types based on petrographic and outcrop char-acteristics. These rock types roughly correspond to map unitsdiscussed by Doelling and others (1990). Basement rocktypes are: (1) layered gneiss, which corresponds to parts oftheir layered and mixed gneiss map units; (2) biotite schist,which forms lenses within layered gneiss; (3) quartz-richgneiss, which corresponds to their quartz-plagioclase gneissmap unit; (4) metamorphosed ultramafic rock, which formsisolated lenses within layered gneiss; (5) hornblende-plagio-clase gneiss, which corresponds to their amphibolite map unitand which also forms thin lenses in other units; (6) bandedgneiss, which corresponds to part of their mixed gneiss mapunit; (7) granitic gneiss, which corresponds to their redgranitic gneiss and migmatitic granitic gneiss map units; (8)granite and pegmatite, which correspond to their coarse-grained granite and pegmatitic granite map units and whichform small pods within other units; (9) chloritic gneiss; and(10) phyllonite and mylonite within shear zones. The last tworock types correspond to the chloritized gneiss, mylonite, andphyllonite map unit of Doelling and others (1990), and arecharacterized by Cretaceous retrograde alteration and defor-mation that overprint earlier structures (Yonkee, 1992).
Layered gneiss, with lenses of biotite schist and quartz-rich gneiss, and rare pods of metamorphosed ultramafic andmafic rock, forms elongate regions within the southern andcentral parts of the island (figure 3a). Hornblende-plagio-clase gneiss forms elongate pods in other units and is abun-dant within a large banded gneiss body in the central part ofthe island. Granitic gneiss is exposed in a large elliptical areaon the west-central part of the island and in a smaller area tothe northeast. Banded gneiss, the dominant rock type withinthe central and eastern parts of the island, surrounds thegranitic gneiss. Granite and pegmatite form small plutonsand stringers within other units and form several larger plu-tons on the eastern part of the island. Chloritic gneiss, phyl-lonite, and mylonite are found along shear zones, including amajor shear zone in the central part of the island, and near the
Petrology and geologic history of the Precambrian Farmington Canyon Complex - Yonkee, Willis, Doelling
The Geology of Antelope IslandMiscellaneous Publication 00-1 7

contact with the overlying sedimentary cover.Layered gneiss and lenses of biotite-schist and quartz-
rich gneiss are isoclinally folded and have a dominant north-to northeast-striking foliation related to a main phase ofdeformation (figure 3b). This foliation is parallel to axial sur-faces of most folds. However, these rocks locally displaycomplex fold interference patterns and multiple foliations insome fold hinges, probably recording an earlier period ofdeformation. Banded gneiss displays a single strong north- to
northeast-striking foliation related to main-phase deformation(figure 3b). Granitic gneiss displays a single weak to strongfoliation that defines an elliptical pattern parallel to the con-tact with the banded gneiss (figure 3b). These relations areinterpreted to record intrusion of a large pluton, now repre-sented by banded and granitic gneiss, approximately synchro-nous with main-phase deformation. Larger granite and peg-
The Geology of Antelope Island
Petrology and geologic history of the Precambrian Farmington Canyon Complex - Yonkee, Willis, Doelling
Utah Geological Survey8
XWc
Great
SaltLake
ElephantHead
T
T. 3 N.T. 2 N.
R. 4
W.
R. 3
W.
Xb
0
0 1 2 miles
1 2 kilometers
T. 2 N.T. 1 N.
BuffaloPoint
R. 4
W.
R. 3
W.
T. 4 N.T. 3 N.
N
T
Z-C-
Z-C-
Z-C-
Z-C-
Xg
Xp
XWh
XpXWl
Xp
Z-C-
XWh
XWh
XWh
Xg
XWc
XWhXWc
Xg
Xg
XWc
XWc
XWc
XWqXWu
XWq
XWl
XWb
Z--C
T
XWc
XpXgXb
XWh
XWqXWl
EXPLANATIONReverse fault
Normal fault
Tertiary deposits
unconformityProterozoic and Cambrianlow-grade metasedimentaryrocks
unconformityFARMINGTON CANYONCOMPLEX:
Chloritic gneiss, phyllonite,and mylonite
Granite and pegmatite
Granitic gneiss
Banded gneiss
Hornblende-plagioclase gneiss, amphibolite,and mafic gneiss bodies
Metamorphosed ultramafic and mafic rock
Quartz-rich gneiss
Layered gneiss with lenses of quartz-richgneiss, biotite schist, and metamorphosedultramafic rock
Weakly tomoderatelyfoliated red
granitic gneissof Doellingand others
(1990)
Moderately tostrongly foliated
migmatitic graniticgneiss of Doellingand others (1990)
XWh
XWc
XWu
Upper Proterozoic andCambrian low-grademetasedimentary rocks
Archean-Lower Proterozoiccrystalline rocks
Nonfoliated granite andpegmatite
Areas with abundant layeredgneiss
Great
SaltLake
ElephantHead
T
T. 3 N.T. 2 N.
R. 4
W.
R. 3
W.
0
0 1 2 miles
1 2 kilometers
T. 2 N.T. 1 N.
Z-C-
T
BuffaloPoint
R. 4
W.
R. 3
W.
T. 4 N.T. 3 N.
N
T
Z-C-
EXPLANATION
Foliation strike,dip >60°Foliation strike,dip <60°Form line
Reverse fault
Normal fault
Tertiarysedimentarydeposits
Figure 3a. Generalized geologic map of Antelope Island, illustrat-ing subcrop distributions of different rock types discussed in text.Modified from Doelling and others (1990).
Figure 3b. Strikes and dips of main-phase foliation and form linesparallel to general foliation strikes. Foliation is north- to northeast-striking except for elliptical pattern within granitic gneiss on thewestern part of the island. Areas of more complexly deformed lay-ered gneiss with lenses of biotite schist and quartz-rich gneiss areindicated by fine dotted pattern and areas of non-foliated graniteand pegmatite are indicated by coarse dotted pattern.
matitic intrusions are non-foliated, crosscut earlier structures,and were emplaced after main-phase deformation.
Basement rocks exposed to the east in the WasatchRange are similar to rocks on Antelope Island and form a het-erogeneous package that was intensely deformed and meta-morphosed to upper amphibolite facies during a complicatedPrecambrian history (Hedge and others, 1983; Bryant,1988b). Complexly deformed layered gneiss in the WasatchRange also contains lenses of biotite schist and quartz-richgneiss, and probably represents sedimentary rocks that under-went multiple periods of metamorphism and deformation.
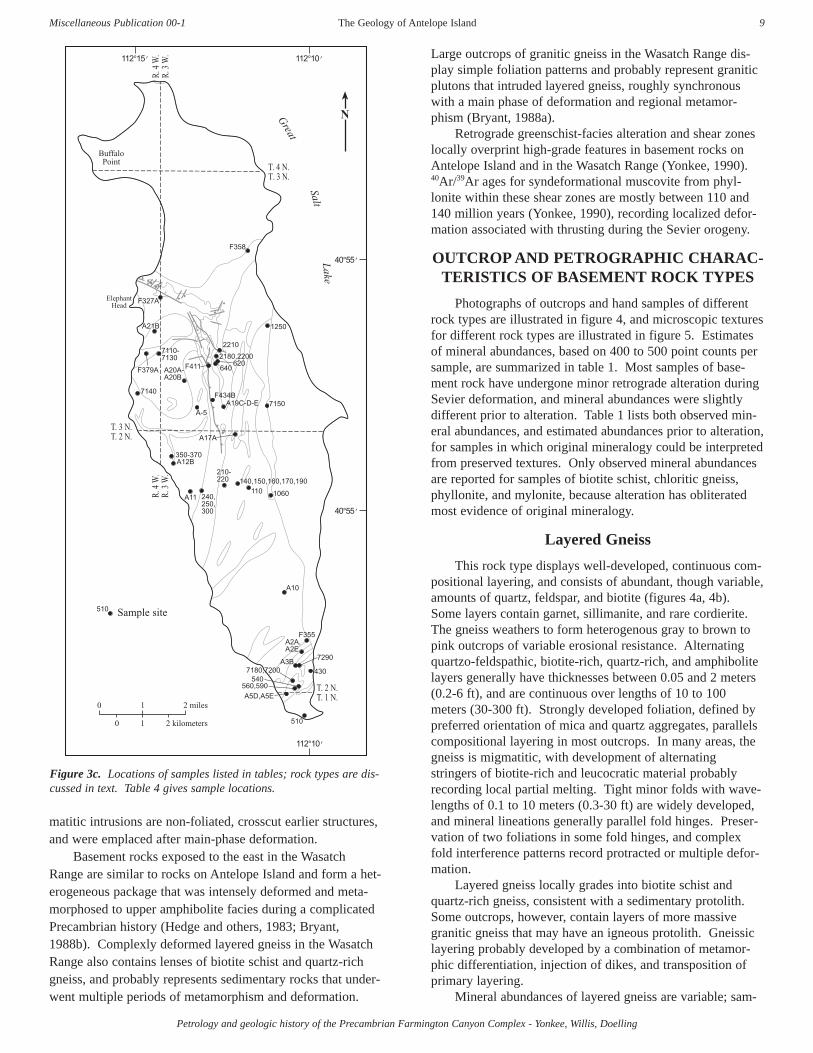
Large outcrops of granitic gneiss in the Wasatch Range dis-play simple foliation patterns and probably represent graniticplutons that intruded layered gneiss, roughly synchronouswith a main phase of deformation and regional metamor-phism (Bryant, 1988a).
Retrograde greenschist-facies alteration and shear zoneslocally overprint high-grade features in basement rocks onAntelope Island and in the Wasatch Range (Yonkee, 1990).40Ar/39Ar ages for syndeformational muscovite from phyl-lonite within these shear zones are mostly between 110 and140 million years (Yonkee, 1990), recording localized defor-mation associated with thrusting during the Sevier orogeny.
OUTCROP AND PETROGRAPHIC CHARAC-TERISTICS OF BASEMENT ROCK TYPES
Photographs of outcrops and hand samples of differentrock types are illustrated in figure 4, and microscopic texturesfor different rock types are illustrated in figure 5. Estimatesof mineral abundances, based on 400 to 500 point counts persample, are summarized in table 1. Most samples of base-ment rock have undergone minor retrograde alteration duringSevier deformation, and mineral abundances were slightlydifferent prior to alteration. Table 1 lists both observed min-eral abundances, and estimated abundances prior to alteration,for samples in which original mineralogy could be interpretedfrom preserved textures. Only observed mineral abundancesare reported for samples of biotite schist, chloritic gneiss,phyllonite, and mylonite, because alteration has obliteratedmost evidence of original mineralogy.
Layered Gneiss
This rock type displays well-developed, continuous com-positional layering, and consists of abundant, though variable,amounts of quartz, feldspar, and biotite (figures 4a, 4b).Some layers contain garnet, sillimanite, and rare cordierite.The gneiss weathers to form heterogenous gray to brown topink outcrops of variable erosional resistance. Alternatingquartzo-feldspathic, biotite-rich, quartz-rich, and amphibolitelayers generally have thicknesses between 0.05 and 2 meters(0.2-6 ft), and are continuous over lengths of 10 to 100meters (30-300 ft). Strongly developed foliation, defined bypreferred orientation of mica and quartz aggregates, parallelscompositional layering in most outcrops. In many areas, thegneiss is migmatitic, with development of alternatingstringers of biotite-rich and leucocratic material probablyrecording local partial melting. Tight minor folds with wave-lengths of 0.1 to 10 meters (0.3-30 ft) are widely developed,and mineral lineations generally parallel fold hinges. Preser-vation of two foliations in some fold hinges, and complexfold interference patterns record protracted or multiple defor-mation.
Layered gneiss locally grades into biotite schist andquartz-rich gneiss, consistent with a sedimentary protolith.Some outcrops, however, contain layers of more massivegranitic gneiss that may have an igneous protolith. Gneissiclayering probably developed by a combination of metamor-phic differentiation, injection of dikes, and transposition ofprimary layering.
Mineral abundances of layered gneiss are variable; sam-
Petrology and geologic history of the Precambrian Farmington Canyon Complex - Yonkee, Willis, Doelling
The Geology of Antelope IslandMiscellaneous Publication 00-1 9
Great
SaltLake
ElephantHead
T. 3 N.T. 2 N.
R. 4
W.
R. 3
W.
0
0 1 2 miles
1 2 kilometers
T. 2 N.T. 1 N.
BuffaloPoint
R. 4
W.
R. 3
W.
T. 4 N.T. 3 N.
N
F327A
A21B
7110-7130
F379A A20A-A20B
7140 F434BA19C-D-E
A-5
2210
2180,2200F411 620
640
7150
A17A
1250
F358
112°15’ 112°10’
112°10’
350-370A12B
A11 240,250,300
210-220
1060110140,150,160,170,190
A10
F355A2A,A2E
A3B7290
A5D,A5E
7180,7200
560,590540
510
430
40°55’
40°55’
Sample site510
Figure 3c. Locations of samples listed in tables; rock types are dis-cussed in text. Table 4 gives sample locations.

Petrology and geologic history of the Precambrian Farmington Canyon Complex - Yonkee, Willis, Doelling
a. Outcrop of layered gneiss on southern part of the island consistsof alternating gray quartzo-feldspathic, white quartz-rich, and darkbiotite-rich layers. Hammer located near core of tight fold in centerof photograph is 30 centimeters (12 in) long.
The Geology of Antelope Island Utah Geological Survey10
a b c
d
f
e
b. Alternating lighter quartz-rich and darker biotite-rich layers arelocally isoclinally folded on the southern part of the island. Ham-mer is 30 centimeters (12 in) long.
c. Outcrop of finely layered and folded biotite schist. Light-coloredconcordant pegmatitic layers in schist may represent partial melts.Coarse-grained, less deformed pegmatite body crosscuts layering.Hammer in central part of photograph is 30 centimeters (12 in)long.
d. Sample of dark biotite schist with micaceous foliation. Small gar-net grains appear darker gray. Scale bar is 2.5 centimeters (1 in)long.
e. Quartz-rich gneiss has milky white appearance and forms resist-ant, blocky outcrops. Pen in central part of photograph is 15 cen-timeters (6 in) long.
f. Sample of vitreous quartz-rich gneiss contains minor amounts ofdark oxides and creamy white plagioclase. Scale bar is 2.5 centime-ters (1 in) long.
Figure 4. Outcrop and sample photographs of different rock types.

Petrology and geologic history of the Precambrian Farmington Canyon Complex - Yonkee, Willis, Doelling
g. Outcrop of black hornblende-plagioclase gneiss. Light-coloredpegmatite veinlets cut the gneiss and are overall concordant withfoliation. Hammer in left part of photograph is 30 centimeters (12in) long.
The Geology of Antelope IslandMiscellaneous Publication 00-1 11
g h
h. Sample of hornblende-plagioclase gneiss from center of a dike.Sample has weak foliation and locally ophitic texture with interlock-ing light plagioclase and dark hornblende grains. Scale bar is 2.5centimeters (1 in) long.
i. Outcrop of banded gneiss displayswell-developed foliation and alternat-ing thin layers of gray granodioriticgneiss and white leucocratic material.Later, undeformed pegmatite dikescrosscut layering. Stereoscope forscale is 12.5 centimeters (5 in) long.
j. Sample of medium-grained bandedgneiss displays foliation defined bypreferred orientations of dark horn-blende and biotite grains. Stringers ofwhite leucocratic material are approx-imately parallel foliation. Scale bar is2.5 centimeters (1 in) long.
k. Alternating dark mafic layers andlight leucocratic pods definemigmatitic texture in complexly foldedbanded gneiss. Pencil in right part ofphotograph is about 15 centimeters (6in) long.
l. A set of subparallel leucocratic pods and stringers cut weakly foliated block of granitic gneiss. Dark mafic minerals are locally concentratedalong pod margins. Notebook is 22 centimeters (8.5 in) wide.
i j
k l

Petrology and geologic history of the Precambrian Farmington Canyon Complex - Yonkee, Willis, Doelling
m. Granitic gneiss forms light-colored, variably foliated, blocky out-crops on west side of island. Widely spaced, white pegmatitic vein-lets define crude banding.
n. Sample of medium- to coarse-grained granitic gneiss containsabundant light-colored quartz and feldspar, and minor dark horn-blende. Sample displays weak foliation and is cut by diffuse regionsof leucocratic material. Scale bar is 2.5 centimeters (1 in) long.
o. Nonfoliated, light-colored pegmatite surrounds angular blocks ofhornblende-plagioclase gneiss. Pegmatite forms resistant, knobbyoutcrops. Pack at bottom of photograph is about 0.5 meter (1.5 ft)tall.
p. Sample of red granite is composed dominantly of coarse-grained,fractured K-feldspar (gray), plagioclase (light gray), and quartz(white). Mafic minerals are rare and foliation is absent. Scale baris 2.5 centimeters (1 in) long.
q. A set of thin, diffuse pegmatitic veinlets is concordant to foliationin an outcrop of banded gneiss. The early veinlets are cut by anearly set of thicker, locally folded and foliated, pegmatite dikes.Later pegmatite dikes are planar, very coarse-grained, and crosscutfoliation.
r. Some pegmatite dikes cut and offset dark hornblende-plagioclasedike, but dark dike offsets other deformed pegmatite dikes, recordingmultiple periods of pegmatite and mafic intrusion within outcrop ofbanded gneiss. Brunton compass for scale in center of photograph.
The Geology of Antelope Island Utah Geological Survey12
m n
po
q
r

Petrology and geologic history of the Precambrian Farmington Canyon Complex - Yonkee, Willis, Doelling
s. Outcrop of darker chloritic gneiss is cut by en echelon arrays ofwhite, quartz-filled veins. Locally developed cleavage dips to theleft (west) parallel to parting. Outcrop is about 1.5 meters (5 ft)high.
t. Sample of chloritic gneiss is cut by anastomosing sets of darkfractures along which chlorite-epidote-sericite alteration is concen-trated. A darker chloritic shear zone cuts the base of the sample.Scale bar is 2.5 centimeters (1 in) long.
u. Quartz veins cut and surround fragments of fractured chloriticgneiss. Veins vary from undeformed and crosscutting, to beingrecrystallized and sheared. Pencil for scale.
v. Steeply dipping phyllonitic cleavage crenulates gently dippingPrecambrian foliation and compositional layering in outcrop ofchloritic gneiss. Abundant chlorite and minor hematite producedduring retrograde alteration give the outcrop a dark appearance.Brunton compass for scale.
w. Steeply dipping zone of phyllonite with pervasive alteration andwell-developed cleavage in right half of photograph crosscuts base-ment foliation and layering. Cleavage and alteration continueacross contact with overlying Late Proterozoic Mineral Forkdiamictite near top of dark exposures. Light outcrops at top of pho-tograph are dolomite of the Late Proterozoic Kelley Canyon Forma-tion. Pack in center part of photograph is about 0.5 meter (1.5 ft)high.
x. Mylonite sample displays cleavage defined by stretched pods oflight-gray quartz and preferred orientation of darker chlorite andsericite. More equant gray feldspar augen are fractured and haverecrystallized tails. Shear fractures locally offset cleavage. Scalebar is 2.5 cm (1 in) long.
The Geology of Antelope IslandMiscellaneous Publication 00-1 13
s
u
t
v
w
x

Petrology and geologic history of the Precambrian Farmington Canyon Complex - Yonkee, Willis, Doelling
a. Layered gneiss, viewed with uncrossed Nicols (non-polarizedlight), consists of medium-grained plagioclase, quartz, K-feldspar,biotite, and minor garnet. Subvertical preferred orientation ofbiotite is subparallel to macroscopic foliation.
b. Same view as (a) with crossed Nicols (polarized light). Plagio-clase is partly altered to sericite.
c. Sillimanite forms prismatic cross sections in biotite-rich layer inlayered gneiss.
The Geology of Antelope Island Utah Geological Survey14
Figure 5. Photomicrographs of different rock types. (Bars indicate scale.) Symbols are: Q- quartz, K- K-feldspar, P- plagioclase, B-biotite, H-hornblende, G-garnet, S-sillimanite, C-chlorite, M-fine-grained muscovite (sericite), Cp-clinopyroxene, Cd-cordierite.
d. Cordierite grain in layered gneiss is largely altered to pinite andcontains biotite inclusions.
e. Biotite schist, viewed with uncrossed Nicols, contains abundant,dark biotite aligned parallel to foliation, poikiloblastic garnet, andpolycrystalline ribbons of quartz. Some biotite grains contain smallsericite pseudomorphs after sillimanite.
f. Quartz-rich gneiss, viewed with crossed Nicols, displays polygo-nal aggregate of recrystallized quartz grains. Large grain of plagio-clase is partly altered to sericite.
a b
c d
e f
Q
K
S
S
Q
Q
P
G
B
B
Cd
B
P
Q
P
B
1mm 1mm
1mm1mm
0.1mm 0.1mm

g. Metamorphosed ultramafic rock, viewed with uncrossed Nicols,displays abundant anthophyllite and clinopyroxene. Secondarychlorite and serpentine replace orthopyroxene and olivine in upperright part of photograph.
h. Same view as (g) with crossed Nicols.
i. Hornblende-plagioclase gneiss, viewed with uncrossed Nicols,consists of partly altered plagioclase grains, hornblende withamphibole cleavage, and minor amounts of anhedral quartz.
The Geology of Antelope IslandMiscellaneous Publication 00-1 15
j. Same view as (i) with crossed Nicols.
k. Biotite locally replaces hornblende in sample of hornblende-pla-gioclase gneiss.
l. Clinopyroxene grains in weakly foliated sample of hornblende-plagioclase gneiss is partly replaced by hornblende.
l
j
k
i
g h
Petrology and geologic history of the Precambrian Farmington Canyon Complex - Yonkee, Willis, Doelling
1mm
1mm 1mm
1mm
1mm
0.5mm
H H
H
H
Cp
B
P
P
P
Q Q
P

Petrology and geologic history of the Precambrian Farmington Canyon Complex - Yonkee, Willis, Doelling
m. Banded gneiss, viewed with crossed Nicols, displays abundantquartz, partly sericitized plagioclase, and K-feldspar with gra-noblastic textures.
n. Banded gneiss, viewed with uncrossed Nicols, displays horn-blende and fine-grained biotite, stilpnomelane, and chlorite thatmay be replacing hornblende or pyroxene.
o. Granitic gneiss, viewed with crossed Nicols, displays granoblas-tic texture and contains abundant quartz, perthitic K-feldspar, andpartly sericitized plagioclase.
The Geology of Antelope Island Utah Geological Survey16
p. Granitic gneiss, viewed with uncrossed Nicols, displays largeraggregates of polygonal quartz grains, K-feldspar, and partlyaltered plagioclase.
q. Coarse-grained, red granite consists of quartz, perthitic K-feldspar, and plagioclase. Some larger feldspar grains are recrys-tallized along their boundaries.
r. Large grain of K-feldspar in pegmatite displays well-developedtartan twinning.
r
p
nm
o
q
1mm
1mm
1mm0.5mm
1mm
1mm
Q
K
K
Q
Q
P
P
K
Q
QP
K
H
K
Q
P
B
H

Petrology and geologic history of the Precambrian Farmington Canyon Complex - Yonkee, Willis, Doelling
s. Poikiloblastic grain of garnet with quartz inclusion, from sampleof garnet-muscovite-bearing granite.
t. Fine-grained, recrystallized feldspar and mica are concentratedalong grain boundaries (arrows) in chloritic gneiss, recording ini-tial influx of fluids. Plagioclase grains display widespread alter-ation to sericite.
u. Chloritic gneiss, viewed with uncrossed Nicols, displays numer-ous intragranular and intergranular fractures (arrows). Microscop-ic shear zone contains abundant sericite at base of photograph.Fractures filled with chlorite have dark appearance.
The Geology of Antelope IslandMiscellaneous Publication 00-1 17
v. Same view as (u) with crossed Nicols. Note recrystallization andalteration concentrated along crack network.
w. Mylonite, viewed with uncrossed Nicols, displays plasticallydeformed quartz ribbons that wrap around more equant feldsparaugen. Asymmetric tails and pressure shadows around augen indi-cate top-to-the-right simple shear.
x. Phyllonite, viewed with crossed Nicols, consists of very fine-grained recrystallized quartz and foliated aggregates of muscoviteand chlorite. Cleavage rakes to left and rotates toward a shearband in center part of photograph.
s
u
w x
v
t1mm
0.5 mm
1mmQ
K
G
Q
Q
M
K
0.5mm
K
Q
1mm
Q
KP
1mm
Q
M
M+C

The Geology of Antelope Island
Petrology and geologic history of the Precambrian Farmington Canyon Complex - Yonkee, Willis, Doelling
Utah Geological Survey18
Table 1. Mineral abundances in selected samples from Antelope Island (see figure 3c for sample localities.)
A. Layered Gneiss Sample 540 590 620 2200 A4D A5D A5E A19E mean±s.d(1)
Observed AbundancesQuartz 25.4 36.2 41.3 37.9 38.3 37.3 17.7 46.0 35.0±9.1Plagioclase 41.4 23.7 35.5 28.4 24.8 26.0 27.3 28.1 29.4±6.0K-feldspar 3.5 14.7 12.5 11.0 13.5 7.6 6.5 2.9 9.0±4.6Biotite 13.5 1.4 0.8 4.7 12.0 15.9 28.1 6.3 10.3±9.1Garnet 0.5 -- -- -- 1.2 3.5 8.5 6.5 2.5±3.3Cordierite P -- -- -- -- 0.8 P -- PSillimanite -- -- -- -- -- 1.4 5.4 -- POpaque minerals 1.0 3.8 3.8 2.7 2.1 0.4 0.8 P 1.8±1.5Sericite 8.2(3) 8.8 2.5 10.0 3.7 5.6(3) 5.2(3) 8.1 6.5±2.7Chlorite 5.7 3.7 2.9 4.0 0.6 1.2 P 0.7 2.4±2.0Epidote 0.6 6.3 0.5 0.4 3.2 -- -- 1.3 1.5±2.2
Pre-Alteration Abundances(4)
Quartz 25.4 37.1 41.3 37.9 38.3 37.3 17.7 46.0 35.1±9.1Plagioclase 42.5 34.8 38.0 37.9 31.2 26.8 27.9 35.1 34.3±5.4K-feldspar 3.5 15.6 12.5 11.5 13.5 7.6 6.5 2.9 9.2±4.8Fe-Mg silicate(5) 27.4 7.7 4.2 9.2 13.9 25.8 41.4 15.9 18.2±12.5Al silicate(6) -- -- -- -- -- 1.8 5.4 -- POxides 1.0 4.2 3.8 2.7 2.1 0.4 0.8 P 1.8±1.5
B. Other Gneiss and Schist Types Biotite Schist Quartz-Rich gneiss
Sample 560 A19C A19D 430 A2A A2EObserved Abundances
Quartz 15.7 15.5 1.0 93.0 94.0 79.1Plagioclase 1.0 1.9 -- 5.2 4.3 4.3K-feldspar -- -- -- -- -- PBiotite 54.5 38.4 49.4 P 0.4 PGarnet 4.2 0.5 1.4 -- -- --Muscovite(7) 4.7 6.6 3.8 1.2 0.8 3.4Sillimanite P 1.4 3.8 -- -- --Opaque minerals 1.2 P 0.4 P 0.2 0.9Carbonate -- -- -- -- P --Sericite 16.7 22.8 32.0 P 0.6 8.8Chlorite 2.1 12.9 8.5 0.6 P 3.6Epidote -- -- -- -- -- --

Petrology and geologic history of the Precambrian Farmington Canyon Complex - Yonkee, Willis, Doelling
C. Ultramafic and Hornblende-Plagioclase Gneiss Ultramafic Hornblende-Plagioclase Gneiss
Sample 7290 A3B 170 190 420 510 7140 A17A mean±s.d(1)
Observed AbundancesQuartz -- -- 3.6 3.1 17.2 13.6 -- 7.6 7.5±6.7Plagioclase -- – 35.2 22.8 38.0 19.3 30.8 37.6 30.6±7.9K-feldspar -- – 0.8 -- 1.0 -- -- 0.2 0.4±0.5Amphibole 33.3 31.0 42.5 57.2 15.5 31.7 55.2 32.3 39.1±15.8Biotite -- – 0.3 -- 2.0 16.1 -- POrthopyroxene 6.5 3.3 -- -- -- -- 0.5 --Clinopyroxene 7.7 8.8 P -- -- -- 5.7 --Opaque minerals 5.4 5.0 4.7 5.9 1.8 2.5 1.0 1.5 2.9±2.0Sericite -- -- 3.9 4.7 11.0 1.0 1.7 17.9 6.7±6.5Chlorite 41.7(8) 47.5(8) 7.0 4.7 3.3 1.7 P 1.3 3.0±2.6Epidote -- -- 1.3 P 10.0 12.8 5.0 1.8 5.1±5.2Talc 5.4 4.5 -- -- -- -- --
Pre-Alteration Abundances(4)
Quartz -- -- 3.6 3.1 17.2 13.6 -- 7.6 7.5±6.7Plagioclase -- -- 40.4 27.5 57.0 27.3 37.0 57.3 41.1±13.5K-feldspar -- -- 0.8 -- 1.0 -- -- 0.2 0.4±0.5Fe-Mg silicate(5) 94.6 95.0 50.3 62.7 22.8 55.3 61.9 33.6 47.8±16.2Oxides 5.4 5.0 4.2 5.1 1.8 2.5 1.0 1.5 2.7±1.6
D. Banded Gneiss Sample 110 140 150 160 210 220 300 A10 means±s.d(1)
Observed AbundancesQuartz 34.2 34.3 32.8 33.8 34.0 31.8 32.6 32.2 33.2±1.0Plagioclase 27.1 24.2 27.8 37.2 25.0 33.5 22.9 30.6 28.5±4.9K-feldspar 20.0 23.2 22.2 15.6 26.7 19.3 24.2 23.5 21.8±3.4Amphibole 6.7 P -- -- 6.0 9.5 -- 2.0 3.0±3.8Biotite(2) 2.0 0.8 0.4 -- 2.9 1.5 6.8 2.1 2.1±2.1Opaque minerals 3.8 3.0 1.8 3.5 1.3 2.3 1.1 2.3 2.4±1.0Sericite 4.1 9.2 9.0 0.5 3.5 1.5 4.3 4.3 4.6±3.1Chlorite 0.4 3.3 1.8 4.4 P -- 7.7 1.1 2.3±2.7Epidote 1.7 1.7 3.6 4.0 0.6 -- 0.4 1.4 1.7±1.5
Pre-Alteration Abundances(4)
Quartz 34.2 34.3 32.8 33.8 34.0 31.8 32.6 32.2 33.2±1.0Plagioclase 32.6 32.4 36.6 37.7 29.1 35.0 27.8 35.7 33.7±3.1K-feldspar 20.2 23.6 22.6 16.2 26.7 19.3 24.2 23.5 22.0±3.0Fe-Mg silicate(5) 9.1 6.4 6.0 8.0 8.9 11.0 14.0 5.8 8.6±1.9Oxides 3.8 3.0 2.0 3.5 1.3 2.3 1.6 2.3 2.5±0.9
The Geology of Antelope IslandMiscellaneous Publication 00-1 19

Petrology and geologic history of the Precambrian Farmington Canyon Complex - Yonkee, Willis, Doelling
The Geology of Antelope Island Utah Geological Survey20
E. Granitic Gneiss Sample 7110 7130 A20A A20B A21B 350 370 A12B A-11(9) A-5(9) mean±s.d(1)
Observed AbundancesQuartz 33.0 30.6 31.9 33.1 32.4 33.0 32.6 34.2 36.4 32.2 32.9±1.5Plagioclase 19.6 28.4 30.6 28.8 28.5 28.6 22.3 27.3 15.1 29.9 25.9±5.1K-feldspar 30.0 31.7 26.7 32.4 29.0 26.5 29.9 29.3 39.3 29.6 30.3±3.8Amphibole 1.0 1.7 1.9 2.8 0.7 3.5 2.0 2.4 -- 1.4 1.7±1.0Biotite(2) 2.9 3.8 2.6 0.6 4.2 1.8 4.6 2.1 -- 0.8 2.3±1.6Opaque minerals 2.9 1.6 3.3 1.6 2.0 2.1 2.6 2.4 2.6 3.5 2.5±0.7Sericite 8.9 0.8 0.4 0.2 0.7 1.2 2.8 0.5 -- -- 1.6±2.7Chlorite 0.8 -- -- -- 0.5 -- 0.2 1.4 0.6 -- 0.4±0.5Epidote 1.0 1.4 2.3 0.4 2.1 1.9 2.8 0.2 5.8 0.1 1.8±1.7
Pre-Alteration Abundances(4)
Quartz 33.0 30.6 31.9 33.1 32.4 33.0 32.6 34.2 36.4 32.2 32.9±1.5Plagioclase 28.5 29.9 32.2 29.2 29.7 30.9 27.1 28.0 18.0 29.9 28.3±3.9K-feldspar 30.5 31.7 26.7 32.4 29.0 26.9 29.9 29.3 39.3 29.6 30.5±3.6Fe-Mg silicate(5) 5.2 6.2 5.6 3.7 7.0 7.1 7.6 6.1 3.5 4.8 5.7±1.4Oxides 2.9 1.6 3.3 1.6 2.0 2.1 2.6 2.4 2.6 3.5 2.5±0.7
F. Granite and Pegmatite Garnet-Muscovite-
Pegmatitic Granite Bearing Granite Red Granite Mean±s.d.(1)
Sample 1060 2180 7150 640 1250 7180 7200 for all granitesObserved Abundances
Quartz 32.0 38.8 33.6 32.2 31.8 26.8 30.5 32.3±3.9Plagioclase 35.6 18.8 29.7 24.8 24.5 19.3 23.1 25.2±6.5K-feldspar 30.0 30.0 33.6 37.0 38.5 52.7 34.2 36.5±8.5Muscovite 0.4 -- 0.5 0.8 0.7 -- 0.8 0.6±0.3Garnet 0.2 -- -- P 2.0 -- --Biotite -- P -- 0.4 0.7 -- 1.2 --Opaque minerals -- -- -- -- -- -- P --Sericite 1.2 11.5 2.2 2.0 1.0 0.8 5.7 3.5±4.2Chlorite -- -- -- 2.8(10) -- P 0.5Epidote 0.4 0.3 0.5 P 0.7 0.5 4.0 1.0±1.4
Pre-Alteration Abundances(4)
Quartz 32.0 38.8 33.6 32.2 31.8 26.8 30.5 32.3±3.9Plagioclase 36.8 30.6 31.9 26.8 26.2 20.6 32.4 29.7±5.6K-feldspar 30.0 30.0 33.6 37.0 38.5 52.7 34.2 36.5±8.5Fe-Mg silicate(5) 0.2 P -- 3.2 2.7 P 2.1 0.8±1.2Al silicate(6) 0.4 0.3 0.5 -- 0.7 -- 0.8 0.5±0.3Oxides -- -- -- -- -- -- -- P --

Petrology and geologic history of the Precambrian Farmington Canyon Complex - Yonkee, Willis, Doelling
ples contain 18 to 46 percent quartz, 27 to 43 percent plagio-clase, 3 to 16 percent K-feldspar, and 4 to 32 percent biotite,after effects of minor alteration are removed (table 1A, figure6a). Some samples also contain garnet, sillimanite, andcordierite. Accessory minerals include zircon, allanite, andapatite. Layered gneiss has a lower average content of K-feldspar, and higher and more variable contents of plagioclaseand biotite than banded and granitic gneiss. Mineral abun-dances for layered gneiss on Antelope Island are similar toabundances reported by Bryant (1988b) for his gneiss andschist rock unit in the Wasatch Range.
Microscopically, layered gneiss displays granoblastic tex-tures with polygonal aggregates of quartz and feldspar (fig-ures 5a, 5b). Anhedral quartz grains have sizes mostlybetween 0.1 and 2 millimeters (0.004-0.08 in), and form poly-crystalline aggregates with long dimensions up to 5 millime-ters (0.2 in) that enclose feldspar and biotite grains. Anhedralto subhedral plagioclase grains, with sizes generally between0.1 and 5 millimeters (0.004-0.2 in), have compositions ofAn15 to An40. Many grains show patchy alteration tosericite (fine-grained muscovite), epidote, and albite.Anhedral K-feldspar grains, with sizes ranging from 0.1 to 4millimeters (0.004-0.16 in), vary from well-developed stringperthite to non-perthitic. Subhedral biotite grains, with longdimensions of 0.2 to 2 millimeters (0.008-0.08 in), are gener-ally subparallel to macroscopic foliation. Garnet forms sub-
hedral, locally poikiloblastic grains up to 3 millimeters (0.12in) in diameter. Some biotite-rich layers contain elongateprisms of sillimanite (figure 5c), and cordierite that is mostlyaltered to pinite (figure 5d).
Biotite Schist
Biotite schist, a distinctive rock type that forms lenses upto 2 meters (6 ft) wide within the layered gneiss unit, consistsof abundant biotite, variable amounts of quartz and mus-covite, and minor amounts of garnet and sillimanite (figures4c, 4d). The unit is relatively non-resistant, and weathers toform brown slopes and subdued ledges. Complex minorfolds and strong foliation, defined by preferred orientation ofmica, are widely developed. Intercalated thin layers and podsof granitic material may record partial melting of the schist.The schist probably represents metamorphosed pelitic materi-al and grades into layered gneiss.
Samples contain 38 to 55 percent biotite, 1 to 16 percentquartz, and 4 to 7 percent coarser-grained muscovite, 1 to 4percent garnet, and lesser amounts of sillimanite and highlyaltered cordierite(?) (table 1B). Samples also contain 17 to33 percent sericite produced by widespread alteration.
Microscopically, samples display schistose texturesdefined by preferred orientation of biotite (figure 5e). Subhe-dral grains of biotite, with long dimensions of 0.2 to 2 mil-
The Geology of Antelope IslandMiscellaneous Publication 00-1 21
G. Chloritic Gneiss, Phyllonite, and Mylonite Chloritic Gneiss Phyllonite Mylonite
F327A F358 F379A F355 F411 F434B 240 250______________________________________________________________________________________________
Observed Abundances
Quartz 35.9 39.0 38.7 40.4 51.0 42.3 28.8 39.7Plagioclase 19.7 6.7 15.0 -- 1.2 -- 14.1 11.0K-feldspar 16.1 12.9 15.0 -- -- 1.3 16.8 6.3Biotite(2) 11.6 -- 3.3 -- -- 2.0 -- --Opaque minerals(11) 1.8 2.4 1.7 1.8 1.6 2.3 2.0 3.5Sericite 6.7 26.6 17.3 35.3 24.7 30.5 6.1 15.7Chlorite 8.1 12.4 5.0 22.5 21.4 20.2 30.5 21.7Epidote P 1.4 0.7 -- -- -- 1.6 2.0
(1) mean±one standard deviation(2) includes fine-grained biotite, stilpnomelane, and oxidized chlorite that may have formed from alteration of hornblende and
pyroxene(3) includes penite alteration of cordierite(4) see text for method of calculating pre-alteration mineral abundances(5) includes biotite, hornblende, garnet, and pyroxene(6) includes primary sillimanite and muscovite(7) includes muscovite grains larger than 0.1 mm (.004 in) in long dimension(8) includes serpentine(9) data from Bryant (1988b)(10) produced by alteration of garnet(11) includes sphene
P present___________________________________________________________________________________________________________

Petrology and geologic history of the Precambrian Farmington Canyon Complex - Yonkee, Willis, Doelling
limeters (0.008-0.08 in), are mostly parallel to foliation.However, some grains randomly cut foliation and may bepost-kinematic, and some are kinked and rotated into minorfolds. Many biotite grains are partly altered to sericite andchlorite. Anhedral quartz grains form elongate aggregatesthat are up to 5 millimeters (0.2 in) in long dimension. Sub-hedral garnet grains, up to 5 millimeters (0.2 in) in diameter,are largely altered to chlorite. Coarser-grained muscovite,with sizes of 0.1 to 0.5 millimeters (0.004-0.2 in), and minoramounts of sillimanite are intergrown with biotite in mostsamples. These larger muscovite grains may have formed bysynmetamorphic crystallization or by retrograde mimeticgrowth. Small remnants of plagioclase are surrounded bysericite. Rare cordierite(?) is almost completely altered topinite.
Quartz-Rich Gneiss
Quartz-rich gneiss, another distinctive rock type thatforms concordant lenses ranging from 1 to 30 meters (3 to100 ft) wide within the layered gneiss, consists dominantly ofquartz, with lesser amounts of plagioclase, biotite, and oxides(figures 4e, 4f). The gneiss weathers to form vitreous, milkyto greenish-gray, fractured and resistant outcrops. Foliation,defined by preferred orientation of minor oxides and mica, isparallel to layering in adjacent gneiss, but is difficult to dis-cern in some outcrops. This rock type is interpreted to haveformed by metamorphism of quartz-rich sedimentary rocks.
Samples consist of 79 to 94 percent quartz, 5 to 12 per-cent plagioclase and its alteration products (sericite), and les-ser amounts of biotite and coarser-grained muscovite (table 1B,figure 6a). Accessory minerals include zircon and magnetite.
Microscopically, the gneiss consists of complex polygo-nal aggregates of quartz grains with dispersed grains of pla-gioclase, muscovite, biotite, and oxides (figure 5f). Anhedralquartz grains, with sizes mostly between 0.2 and 5 millime-ters (0.008-0.2 in), have planar to curved boundaries, proba-bly reflecting recovery after high-temperature deformation.Some grains display undulatory extinction, subgrains, andsutured boundaries, possibly reflecting younger plastic defor-mation. Many grains have abundant inclusions of very fine-grained oxides that produce a "dusty" appearance. Subhedralgrains of plagioclase, biotite, and coarser-grained muscoviteare weakly aligned parallel to macroscopic foliation.
Metamorphosed Ultramafic Rock
Metamorphosed ultramafic rock and surrounding horn-blende-rich gneiss form small isolated pods within layeredgneiss at the southern end of the island. Meta-ultramafic rockconsists of amphibole, pyroxene, and rare olivine that arevariably altered to chlorite, serpentine, and talc. This rocktype has a dark green to black color and weathers to formrusty brown surfaces. Foliation varies from weak in podcores to strong near pod margins that are bounded by horn-blendite and hornblende-plagioclase gneiss. Pods of ultra-mafic and mafic rock may represent highly deformed and dis-membered oceanic crust, komatiitic flows, or part of adeformed layered-mafic complex.
Metamorphosed ultramafic rock consists of about 30 per-cent anthophyllite and tremolite, 15 percent orthopyroxene
and clinopyroxene, minor olivine, and alteration mineralsincluding abundant chlorite, serpentine, and talc (table 1C).Accessory minerals include ilmenite, magnetite, and sphene.Original mineral abundances and textures are difficult todetermine due to alteration.
Ultramafic rock displays complex textures that are partlyrelated to retrograde alteration (figure 5g, 5h). Anthophylliteand tremolite grains are weakly aligned parallel to foliation.Orthopyroxene and light-green clinopyroxene grains are up to3 millimeters (0.12 in) in size. Anhedral olivine grains arecut by irregular fractures and are largely altered to serpentine.
Hornblende-Plagioclase Gneiss
This rock type consists of varying proportions of horn-blende and plagioclase, with lesser amounts of quartz, biotite,and rare pyroxene. Rock that is relatively rich in plagioclaseforms gray outcrops, whereas rock that is richer in horn-blende forms dark green to black, generally less resistant out-crops (figures 4g, 4h). Hornblende-plagioclase gneiss occursin two settings, as elongate pods in other units, and within alarge mafic gneiss body.
Pods of hornblende-plagioclase gneiss that cut other rockunits are generally 0.1 to 3 meters (0.3 to 10 ft) thick, but afew larger pods reach 30 meters (100 ft) in width. Manypods have sharp planar boundaries that locally crosscut com-positional layering in surrounding gneiss, and are interpretedto be metamorphosed mafic dikes. Foliation varies fromwell-developed to weak in different pods, probably recordingemplacement of dikes over a protracted history. Highlydeformed pods in layered gneiss are relatively old, and lessdeformed pods in banded and granitic gneiss are relativelyyoung.
Hornblende-plagioclase gneiss is also abundant within alarge mafic gneiss body in the central part of the island (fig-ure 3a). The mafic body consists of strongly foliated horn-blende- to plagioclase-rich gneiss interlayered with, and cutby, pods of granitic and pegmatitic gneiss. This body mayrepresent part of a mafic pluton that was later intruded bygranitic material or it may represent a metamorphosed vol-canic sequence.
Samples of gneiss consist of about 20 to 60 percent horn-blende, 30 to 60 percent plagioclase and its alteration prod-ucts, 0 to 15 percent quartz, and minor pyroxene (table 1C).Samples vary compositionally from gabbro to diorite totonalite (figure 6b). Accessory minerals include ilmenite,magnetite, and allanite.
Microscopically, the gneiss displays granoblastic todecussate textures with interlocking hornblende and plagio-clase grains (figures 5i, 5j). Elongate, subhedral grains ofhornblende, with long dimensions of about 0.5 to 4 millime-ters (0.02-0.16 in), are crudely aligned parallel to foliation.Hornblende is partly altered to chlorite and partly replaced bybiotite in some samples (figure 5k). Subhedral grains of pla-gioclase, with dimensions of about 0.3 to 2 millimeters(0.012-0.08 in), have compositions between An25 and An50.Plagioclase is variably altered to sericite and epidote. A fewsamples contain clinopyroxene and rare orthopyroxene (figure5l). Most pyroxene grains appear to be in disequilibrium,being partly replaced by hornblende. Anhedral quartz grains
The Geology of Antelope Island Utah Geological Survey22

Petrology and geologic history of the Precambrian Farmington Canyon Complex - Yonkee, Willis, Doelling
have sizes between 0.1 and 1 millimeters (0.004-0.04 in) andrarely form aggregates.
Banded Gneiss
This rock type displays well-developed compositionallayering and foliation that produce a banded appearance inoutcrop (figure 4i, 4j). Banded gneiss consists mostly of fine-
to medium-grained quartz and feldspar, with lesser amountsof hornblende. The gneiss weathers to form overall gray topink outcrops of varying resistance that are cut by irregularfractures. Planar to lenticular stringers of leucocratic materialwith widths mostly between 0.01 to 0.1 meters (0.4 in to 4 in)and variations in abundances of mafic minerals define layer-ing. Preferred orientation of hornblende and quartz aggre-
The Geology of Antelope IslandMiscellaneous Publication 00-1 23
(A) (B)
(C)
(E)
Tonalite
Quartz dioriteDiorite/gabbro
Gra
nodi
orite G
ranite
(D)
Gra
nodi
orite G
raniteG
rano
dior
ite Granite
QZ
PL
QZ
QZ QZ
QZ
PL KF KF
PL KF PL KF
PL KF
Figure 6.
Ternary plots for modal abundances of quartz (QZ), K-feldspar (KF), andplagioclase (PL) for basement rock samples. Abundances used in diagramshave been adjusted to remove effects of alteration as discussed in the text.
a. Layered gneiss (solid triangles) and quartz-rich gneiss samples (open tri-angles).
b. Hornblende-plagioclase gneiss samples. Fields for gabbro, diorite,quartz diorite, and tonalite from the International Union of Geological Sci-ences (IUGS) (1973) classification are indicated.
c. Banded gneiss samples. IUGS fields for granite and granodiorite indi-cated. Dotted line surrounds compositional range of most granitic rocks asgiven by Winkler (1976).
d. Granitic gneiss samples. IUGS fields for granite and granodiorite indi-cated. Dotted line surrounds compositional range of most granitic rocks asgiven by Winkler (1976).
e. Granite and pegmatite samples. Dotted line surrounds compositionalrange of most granitic rocks as given by Winkler (1976).

Petrology and geologic history of the Precambrian Farmington Canyon Complex - Yonkee, Willis, Doelling
gates define foliation that is rotated into ptygmatic folds insome outcrops. Banded gneiss is locally migmatitic, withalternating discontinuous layers of leucocratic and maficmaterial (figure 4k). The gneiss probably represents part of adeformed and metamorphosed granitic pluton with possibleenclaves of older gneiss.
Banded gneiss samples consist of 31 to 34 percentquartz, 28 to 38 percent plagioclase, 16 to 27 percent K-feldspar, and 6 to 12 percent hornblende, possible pyroxene,and biotite, after effects of minor alteration are removed(table 1D). Accessory minerals include zircon, allanite, andapatite. The samples are granitic to granodioritic in composi-tion (figure 6c).
In thin section, banded gneiss displays granoblastic tex-tures with polygonal aggregates of quartz and feldspar anddispersed mafic grains (figures 5m, 5n). Veinlets of leuco-cratic material define layering in some samples. Anhedralquartz grains, with sizes mostly between 0.1 and 1 millime-ters (0.004-0.04 in), are locally grouped into polygonal aggre-gates up to 3 millimeters (0.12 in) in length. Most grainshave uniform extinction and smooth to curviplanar bound-aries. Anhedral to subhedral plagioclase grains generallyhave sizes from 0.1 to 2.0 millimeters (0.004-0.08 in) andcompositions of An20 to An30. Many plagioclase grains arepartly altered to sericite, epidote, and albite, especially alonggrain margins. Anhedral K-feldspar grains, with sizes from0.2 to 3 millimeters (0.008-0.12 in), have complex perthiticintergrowths and local "tartan" twinning. Subhedral grains ofhornblende, with long dimensions up to 2 millimeters (0.08in), are preferentially aligned parallel to foliation. Biotite,chlorite, and stilpnomelane appear to have formed by alter-ation of horneblende and possible pyroxene.
Granitic Gneiss
Granitic gneiss consists mostly of medium-grained quartzand feldspar, with lesser amounts of hornblende and rarepyroxene. Granitic gneiss forms homogeneous, light-gray tolight-red outcrops (figures 4l, 4m, 4n), which appear to gradeinto outcrops of banded gneiss. Weakly to strongly devel-oped foliation is defined by preferred orientation of quartzaggregates and mafic minerals. Discontinuous pods andstringers of leucocratic material with widths generallybetween 0.025 and 0.15 meters (1 and 6 in) define composi-tional layering in some outcrops. Leucocratic pods andstringers consist dominantly of coarse-grained feldspar andquartz with minor amounts of hornblende and biotite concen-trated along their margins (figure 4l). Most pods andstringers are concordant with foliation and have gradationalboundaries, but later, less-deformed pegmatitic dikes crosscutfoliation. Widely spaced, generally planar fractures cut thegneiss, producing a blocky appearance in most outcrops.
Granitic gneiss samples contain 31 to 36 percent quartz,18 to 32 percent plagioclase, 27 to 39 percent K-feldspar, 4 to8 percent hornblende and rare pyroxene, after effects of minoralteration are removed (table 1e). Accessory minerals includeapatite, zircon, allanite, and sphene. Samples have graniticcompositions (figure 6d). Mineral abundances for graniticand banded gneiss overlap, but granitic gneiss has lower aver-age abundances of plagioclase and mafic minerals, and a
greater average abundance of K-feldspar.Doelling and others (1990) divided granitic gneiss into
two gradational units: a central body of weakly to moderatelyfoliated red granitic gneiss, and a surrounding body of moder-ately to strongly foliated migmatitic granitic gneiss (figure3a). Mineralogically, these two map units are indistinguish-able. Foliation traces define an elliptical pattern that is sub-parallel to contacts of the red granitic, migmatitic granitic,and banded gneiss map units (figure 3b) (Doelling and others,1990). These three units are interpreted to represent part of adeformed granitic pluton that underwent local partial meltingand injection of leucocratic dikes. The pluton may have beenzoned with slightly more mafic material, now represented bythe banded gneiss, along the margin.
Microscopically, granitic gneiss displays granoblastictextures, with medium- to locally coarse-grained aggregatesof quartz, feldspar, and dispersed mafic grains (figures 5o,5p). Anhedral quartz grains have sizes mostly between 0.1and 2 millimeters (0.004-0.08 in), and tend to form polygonalaggregates up to 6 millimeters (0.23 in) in length. Mostgrains have uniform extinction and smooth to curviplanarboundaries. Anhedral plagioclase and K-feldspar grains gen-erally have sizes between 0.3 and 3 millimeters (0.012-0.12in), but some grains are up to 10 millimeters (0.4 in) long.Samples from the red granitic gneiss map unit tend to beslightly coarser grained compared to samples from themigmatitic granitic gneiss map unit. Plagioclase compositionranges from An15 to An25 for most grains, but almost purealbite occurs along some grain margins. Some plagioclasegrains include smaller K-feldspar grains and myrmekiticintergrowths of quartz. Many K-feldspar grains display "tar-tan" twinning, most grains are perthitic, and some grainsinclude smaller plagioclase and quartz grains. Subhedral toanhedral hornblende grains have long dimensions up to 3 mil-limeters (0.12 in) and are weakly aligned parallel to foliation.Many biotite grains are randomly oriented and appear to haveformed by alteration of hornblende. Textural relations of rareclinopyroxene are difficult to discern due to extensive alter-ation to chlorite and fine-grained amphibole. The pyroxenemay be either of igneous or metamorphic origin.
Granite and Pegmatite
Granite and pegmatite consist of varying proportions ofcoarse-grained quartz and feldspar, with limited amounts ofmafic minerals and mica (figures 4o, 4p). This general rocktype includes: (1) pegmatitic granite that forms large bodieson the eastern part of the island; (2) garnet-muscovite-bearinggranite that forms small pods within and near layered gneiss;(3) red granite that forms small plutons on the southern endof the island; and (4) pegmatite that forms widespread dikesand pods (generally 0.01 to 1 meter [0.4 in to 3 ft] wide)within other units. Larger outcrops of granite and pegmatiteare generally white to gray to pink, variably fractured, andhave a knobby appearance. The red granite and some out-crops of pegmatitic granite display patchy red coloring causedby minor amounts of dispersed hematite. Pegmatitic graniteis massive to weakly foliated and is roughly concordant tobanded gneiss on a large scale. Pods of garnet-muscovite-bearing granite vary from approximately concordant and
The Geology of Antelope Island Utah Geological Survey24

Petrology and geologic history of the Precambrian Farmington Canyon Complex - Yonkee, Willis, Doelling
weakly foliated to crosscutting and nonfoliated, consistentwith derivation from local partial melting of nearby layeredgneiss late in the deformation history. Plutons of red graniteare discordant, nonfoliated, have sharp boundaries, and con-tain enclaves of surrounding wall rock, recording intrusionafter main-phase deformation. Pegmatite dikes vary fromfoliated and concordant to undeformed and mutually crosscut-ting, recording a protracted history or multiple periods ofintrusion and partial melting (figures 4q, 4r). Pegmatite dikesare generally leucocratic, with minor amounts of dark maficminerals concentrated along dike margins.
Granite and pegmatite samples consist of about 25 to 40percent quartz, 20 to 35 percent plagioclase, and 30 to 50 per-cent K-feldspar, and minor muscovite, garnet, and biotite(table 1f). All samples plot in the granite field (figure 6e).Accessory minerals include zircon, apatite, and tourmaline.Samples of pegmatite are too coarse-grained for point countsin thin section, but vary from quartz-, to plagioclase-, to K-feldspar-rich.
In thin section, most varieties of granite and pegmatitedisplay randomly oriented, coarse grains of feldspar andquartz (figure 5q). Quartz forms anhedral, equant grains withsmooth to curviplanar boundaries. Anhedral to subhedral pla-gioclase grains are albitic and display limited alteration tosericite. K-feldspar grains are anhedral and many grains areperthitic and display "tartan" twinning (figure 5r). Garnet, upto 3 millimeters (0.12 in) in size, forms subhedral grains insome samples (figure 5s). Grain sizes of quartz and feldsparvary considerably, ranging from less than 1 millimeter (0.04in) for some pods of garnet-muscovite-bearing granite, tobetween 1 and 10 millimeters (0.04-0.4 in) for the red granite,to locally greater than 1 centimeter (0.4 in) for pegmatite.
Chloritic Gneiss
Chloritic gneiss displays widespread fractures, veins, andalteration that overprint earlier high-grade structures of thepreviously described rock types (figures 4s, 4t). Mineralabundances of chloritic gneiss vary greatly, reflecting differ-ent protoliths and variable alteration. Most outcrops aregreen to black in color with widespread alteration of originalminerals to sericite, fine-grained chlorite, biotite, stilpnome-lane, epidote, and albite. Outcrops that contain abundantquartz veins are relatively resistant, but other areas are non-resistant. Quartz veins and pods have widths from less than1 centimeter (0.4 in) to greater than 3 meters (10 ft), and areassociated with minor shear zones (figure 4s) and net veinsystems that surround fragments of less-altered basement rock(figure 4u). Variably developed cleavage, defined by flat-tened aggregates of quartz and preferred orientation of mica,locally obliterates earlier fabrics, but most outcrops displaypatches where earlier high-grade structures are preserved (fig-ure 4v). Chloritic gneiss grades into phyllonite and mylonitewith increasing deformation intensity along the margins ofshear zones and near the contact between the basement andthe sedimentary cover.
Samples contain 7 to 27 percent sericite produced byalteration of feldspar, and 5 to 12 percent chlorite producedby alteration of mafic minerals (table 1G). Compared to pro-toliths, feldspar abundances are lower and mica abundances
are greater.Alteration in chloritic gneiss is concentrated along grain
boundaries and crack networks (figure 5t). Microscopically,chloritic gneiss is cut by numerous fractures, quartz- andmica-filled veinlets, and minor shear zones (figures 5u, 5v).Many quartz grains display widespread undulatory extinction,subgrains, and limited recrystallization concentrated alonggrain margins, recording localized plastic deformation. Wide-spread planar fluid inclusion trains in quartz grains are inter-preted to represent healed microcracks. Plagioclase grainsare partly altered to sericite, epidote, and recrystallized albite.K-feldspar grains are cut by microcracks and locally alteredto sericite. Mafic minerals are altered to chlorite and to finelyrecrystallized biotite and stilpnomelane. Alteration andrecrystallization produced grains with sizes generally lessthan 0.05 millimeters (0.002 in), resulting in overall grainsize reduction.
Phyllonite and Mylonite
This rock type displays pervasive alteration, well-devel-oped cleavage, and local vein networks (figures 4w, 4x).Phyllonite consists mostly of very fine-grained mica andquartz, and mylonite consists of recrystallized quartz,feldspar, and mica. Most outcrops are green to black, withareas having abundant quartz veins being relatively resistant,and mica-rich areas being relatively non-resistant. Phylloniteand mylonite are found in shear zones and in a broad regionnear the basement-cover contact. Flattened and ribbonedquartz pods and preferred orientation of mica define cleavage.Many shear zones also contain thin shear bands with veryfine grain size and high strain. Offset of sheared dikes andwell-developed cleavage record concentrated strain withinshear zones. Fractures and breccia zones locally offset cleav-age (figure 4x), but cleavage locally overprints fracturedgneiss, recording temporally overlapping alteration, plasticdeformation, and cataclasis.
Phyllonite and mylonite samples contain 6 to 35 percentsericite, 21 to 31 percent chlorite, 29 to 51 percent quartz, and0 to 30 percent total feldspar. Overall, mica contents aregreater and feldspar contents are lower than for chloriticgneiss and basement protoliths. Phyllonite samples havelower feldspar, slightly higher quartz, and higher sericite con-tents compared to mylonite samples.
Microscopically, mylonite consists of recrystallizedquartz ribbons and variably altered, fractured, and recrystal-lized feldspar augen (figure 5w). Phyllonite displays fine-grained, foliated aggregates of sericite and chlorite andrecrystallized quartz aggregates (figure 5x). Quartz occurs aselongate ribbons, subgrains, and recrystallized grains withsizes of about 5 to 50 microns (0.0002 to 0.002 in), recordingwidespread plastic deformation. Quartz augen, however, arelocally preserved. Some feldspar grains are cracked alongcleavage planes and grain edges, and some grains have pres-sure shadows and recrystallized tails of quartz, mica, andalbite. Elongate grains of sericite and chlorite with longdimensions of 5 to 50 microns (0.0002 to 0.002 in) are gener-ally parallel to cleavage. Variably deformed and recrystal-lized quartz veins record overlapping fracturing, fluid influx,quartz precipitation, and plastic deformation.
The Geology of Antelope IslandMiscellaneous Publication 00-1 25

Petrology and geologic history of the Precambrian Farmington Canyon Complex - Yonkee, Willis, Doelling
The Geology of Antelope Island Utah Geological Survey26
Q
G
A
Q
A
G
Al 2
O3
(w
t%)
(B)
Con
tinte
ntal
Orogenic
Calcalkaline
Gra
nodi
orite G
ranite
Komatiitic
Oce
an fl
oor
Tholeiitic
Calcalkaline
Tholeiitic
0 1 2 3 4 5
0
1
2
3
4
5
Na2O (wt%)
K2O
(w
t%)
0 1 2 3 4 5
0
1
2
3
4
5
K2O + Na2O + CaO (wt%)
FeOtot
Na2O + K2O MgO
Na2O + K2O MgO
FeOtot
FeOtot
QZ
Al2O3 MgO
PL KF
6
Komatiitic
(C)
(A)
Figure 7. Chemical characteristics of different rock types.
a. Chemical compositions for samples of layered gneiss (solid trian-gles), quartz-rich gneiss (open triangle), and biotite schist (opensquare). Solid circles are labeled for mean compositions of arkose (A),graywacke (G), and quartz arenite (Q), from Pettijohn and others(1973). Compositional range of paragneisses in Wasatch Rangereported by Bryant (1988b) outlined by dashed line.
b. Chemical compositions for samples of hornblende-plagioclase gneiss(solid triangles) and ultramafic rock (open triangle). Fields for oro-
genic, continental, and ocean floor basalts from Pearce and others(1977). Fields for tholeiitic and calc-alkaline rocks from Irvine andBarager (1971). General compositions of peridotitic komatiites alsoindicated.
c. Normative abundances of quartz (QZ), K-feldspar (KF), and plagio-clase (PL) for samples of banded gneiss (solid circles) and graniticgneiss (open circles). Abundances calculated using CIPW method(Cox and others, 1979). Corresponding chemical compositions of sam-ples also shown. Fields for tholeiitic and calc-alkaline rocks fromIrvine and Barager (1971).

Petrology and geologic history of the Precambrian Farmington Canyon Complex - Yonkee, Willis, Doelling
GEOCHEMISTRY
Whole-rock chemical analyses were completed for 20samples of basement rock from Antelope Island. Chemicalcompositions, in conjunction with petrographic and structuralrelations, are used to interpret the origin of some of the dif-ferent rock types. (All percentages in the following discus-sion are weight percent).
Chemical compositions of layered gneiss are highly vari-
able, with SiO2 contents ranging from 61 to 75 percent (table2). Samples contain abundant Al2O3, significant total FeO,and moderate amounts of alkalis. The broad range in compo-sitions for samples of layered gneiss, quartz-rich gneiss, andbiotite schist is similar to the range reported by Bryant(1988b) for his gneiss and schist unit in the Wasatch Range(figure 7a). Bryant (1988b) concluded that protoliths forthese rocks included graywacke, arkose, quartz arenite, andshale.
The Geology of Antelope IslandMiscellaneous Publication 00-1 27
Table 2. Whole-rock chemistry of selected samples from Antelope Island (see figure 3c for sample localities).
Qtz-Rich Biotite Ultra- Hornblende-Layered Gneiss Gneiss Schist Mafic Plagioclase Gneiss Granite Phyllonite
590 A5D A19E A2A 560 A3B 7140 A17A 1250 7150 F355 SiO2 69.1 61.3 75.1 96.4 55.7 37.7 48.7 54.4 72.9 72.1 74.4Al2O3 12.3 18.1 11.9 1.3 20.7 10.4 14.5 17.3 13.8 14.9 9.4K2O 2.3 3.1 1.6 0.46 4.6 0.11 0.90 2.6 6.7 7.5 2.4Na2O 3.1 3.5 2.4 0.25 0.36 0.42 3.4 3.9 2.9 3.5 0.20CaO 2.6 1.2 2.2 0.02 0.15 4.5 10.3 5.5 0.41 0.26 0.20Fe2O3 7.8 7.8 4.4 0.37 10.0 14.0 11.8 10.1 1.8 0.43 5.0MgO 1.0 2.8 0.62 0.07 3.0 23.1 6.6 3.1 0.18 0.15 4.0MnO 0.09 0.10 0.16 0.01 0.07 0.14 0.20 0.13 0.22 0.01 0.04TiO2 0.75 0.77 0.34 0.06 1.1 0.62 1.1 1.2 0.07 0.04 0.39P2O5 0.16 0.08 0.08 0.01 0.09 0.05 0.10 0.27 0.03 0.02 0.11LOI 1.0 1.3 1.0 0.54 4.5 6.8 1.0 1.5 0.39 0.23 2.9
Total 100.4 100.2 100.2 99.5 100.3 98.2 98.6 100.1 99.5 99.3 99.1
Banded Gneiss Granitic Gneiss 110 150 220 A10 Mean 7130 350 A12B A-11(1) A-5(1) Mean SiO2 69.6 71.4 69.0 71.7 70.4 72.2 71.3 72.5 72.3 69.2 71.5Al2O3 12.2 12.8 12.3 12.2 12.4 12.6 12.0 11.4 12.1 12.1 12.1K2O 4.0 4.0 3.0 4.3 3.8 5.4 4.8 4.6 4.8 4.4 4.8Na2O 3.2 3.9 3.6 3.2 3.5 3.5 3.2 3.1 2.7 3.2 3.1CaO 2.0 1.8 2.6 1.2 1.9 1.0 1.6 1.0 1.2 1.9 1.3Fe2O3 6.8 5.1 6.8 5.4 6.0 3.4 5.3 5.0 5.0 5.6 4.9MgO 0.47 0.36 0.70 0.42 0.49 0.14 0.41 0.41 0.21 0.42 0.32MnO 0.14 0.07 0.12 0.11 0.11 0.08 0.14 0.12 0.09 0.15 0.11TiO2 0.54 0.41 0.59 0.39 0.48 0.22 0.38 0.33 0.33 0.44 0.34P2O5 0.13 0.11 0.14 0.12 0.13 0.03 0.11 0.06 0.06 0.15 0.08LOI 0.39 0.54 0.31 0.77 0.50 0.23 0.54 0.23 0.47 0.35 0.36Ba 1700 1600 1200 1600 1900 1600 1700 ND 1498Nb 30 40 40 60 50 40 70 ND 30Rb 180 190 100 140 160 140 130 ND 140Sr 120 90 110 70 70 90 80 ND 80Zr 850 630 710 920 570 930 870 710 550
Total 99.8 99.8 99.5 100.2 99.1 100.0 99.2 99.3 98.5
Major oxides, LOI and Total in weight percentMinor elements in ppm (parts per million)LOI loss on ignitionND not determined(1) data from Bryant (1988b)
___________________________________________________________________________________________________________

Petrology and geologic history of the Precambrian Farmington Canyon Complex - Yonkee, Willis, Doelling
A lone sample of metamorphosed ultramafic rock had avery low SiO2 content (37.7 percent) and a very high MgOcontent (23.1 percent), consistent with a komatiitic composi-tion (table 2; figure 7b). Komatiitic textures are absent andthese ultramafic rocks have undergone metasomatism as indi-cated by widespread chlorite alteration.
Samples of hornblende-plagioclase gneiss have low SiO2
contents and relatively high total FeO contents (table 2).Samples plot in or near the tholeiitic field and basalts mayhave been emplaced in an oceanic or continental setting (fig-ure 7b). However, samples may have undergone metasoma-tism.
Banded and granitic gneiss have overlapping composi-tions with SiO2 ranging from about 69 to 73 percent (table 2).Granitic gneiss samples have slightly higher average contentsof SiO2 and K2O, and lower contents of CaO, total FeO, andMgO compared to banded gneiss. All samples have relativelylow Al2O3 contents, moderate alkali contents, and high totalFeO contents. Granitic gneiss in the Wasatch Rangedescribed by Bryant (1988b) is chemically similar to graniticgneiss on Antelope Island. Samples of granitic and bandedgneiss on Antelope Island contain 28 to 34 percent normativequartz, 30 to 39 percent normative plagioclase, 18 to 32 per-cent normative orthoclase, and 2 to 9 percent normative Fe-Mg silicates (table 3). Normative mineral abundances plotwithin the granite field for granitic gneiss and within thegranite and granodiorite fields for banded gneiss (figure 7c),similar to plots of observed modal abundances (figures 6c and6d). The limited range of chemical compositions lies alongthe boundary between the tholeiitic and the calc-alkalinefields.
Abundances of most elements for banded and graniticgneiss vary approximately linearly with increasing SiO2 con-
tents (figure 8), probably reflecting a common genesis for thetwo rock types. Contents of K2O increase, and contents ofCaO, FeO, MgO, and TiO2 decrease with increasing SiO2
content, possibly reflecting fractional crystallization ormagma mixing. The limited range of compositions andapparent clustering of SiO2 contents may reflect limited sam-pling.
Granitic and banded gneiss on Antelope Island displaychemical similarities with A-type granites as defined byWhite and Chappel (1983), including relatively low Al con-tents, high Fe contents, and enrichment in high-field-strengthelements (large ionic size and high charge) such as Zr andNb. Mineralogical similarities with A-type granites includethe presence of Fe-rich biotite and amphibole. White andChappel (1983) reported that many A-type granites wereemplaced after peak deformation, and were derived fromcrust previously depleted by extraction of partial melts.Creaser and others (1991), however, presented arguments forderivation of A-type granites by partial melting of non-deplet-ed tonalitic to granodioritic crust, implying that A-type gran-ites can form during peak deformation and metamorphism.Well-developed foliation and locally gradational contactsbetween granitic, banded, and migmatitic layered gneiss inthe Wasatch Range and on Antelope Island are consistent withigneous intrusion during peak metamorphism and deforma-tion. These intrusions may have formed by partial melting ofolder gneiss (Bryant, 1988a).
Normative compositions of banded and granitic gneissplot near the orthoclase-plagioclase-quartz cotectic line in thesystem quartz-albite-anorthite-orthoclase-H2O (figure 9). Therelative location of the cotectic line only changes slightlywith moderate changes in total pressure and water pressure,although temperatures along the line are higher for lowerwater pressures (see Winkler, 1976). Two features are note-
The Geology of Antelope Island Utah Geological Survey28
Table 3. Normative values of selected samples from Antelope Island (see figure 3c for sample localities). Calculations based on CIPW method(Cox and others, 1979).
Banded Gneiss Granitic GneissSample 110 150 220 A10 Mean 7130 350 A12B A-11(1) A-5(1) Mean Quartz 29.6 28.3 28.4 32.2 29.6 28.2 29.4 33.3 33.8 29.2 30.8Albite 27.1 32.8 30.1 27.3 29.3 29.5 26.7 26.0 24.2 26.7 26.8Anorthite 7.3 5.7 8.5 5.1 6.7 2.7 4.5 3.6 5.6 5.9 4.5Orthoclase 23.3 23.7 18.2 25.2 22.6 32.0 28.3 27.4 28.5 26.0 28.4Diopside 1.6 2.2 3.1 -- 1.7 1.8 2.3 1.0 -- 2.2 1.5Hypersthene 4.9 3.4 6.0 4.4 4.7 2.4 4.6 3.1 2.2 2.3 2.9Magnetite 3.6 2.5 2.8 3.0 3.0 1.7 2.2 3.2 3.7 4.6 3.0Ilmenite 1.0 0.8 1.1 0.7 0.9 0.4 0.7 0.6 0.7 0.8 0.6Corundum -- -- -- 0.4 0.1 -- -- -- 0.2 -- 0.1Apatite 0.3 0.3 0.3 0.3 0.3 0.1 0.3 0.1 0.1 0.4 0.2
Quartz 29.6 28.3 28.4 32.2 29.6 28.2 29.4 33.3 33.8 29.2 30.8Plagioclase 34.4 38.5 38.6 32.4 36.0 32.1 31.2 29.6 29.8 32.6 31.3K-feldspar 23.3 23.7 18.2 25.2 22.6 32.0 28.3 27.4 28.5 26.0 28.4Fe-Mg Silicates 6.5 5.6 8.8 4.4 6.4 4.2 6.9 4.1 2.2 4.5 4.4Oxides 4.6 3.3 3.9 3.7 3.9 2.1 2.9 3.8 4.4 5.4 3.6
(1) data from Bryant (1988b)___________________________________________________________________________________________________________

worthy: (1) The granitic gneiss probably crystallized alongthe cotectic line at temperatures between 650 and 800°C,depending on water pressure. This is similar to the estimatedtemperatures of metamorphism discussed in the next section.(2) If the granitic gneiss crystallized from a parent magma ofsimilar composition, then this magma would also lie near the
cotectic line. Such a parent magma could have been generat-ed at depths of 15 to 20 kilometers (9-12 mi) by melting gra-nodiorite or tonalite at temperatures of about 650 to 700°Cwith high water pressures, or by melting biotite-bearing gran-odiorite to tonalite at temperatures of about 750 to 800°Cwith reduced water pressures (see Winkler, 1976).
The Geology of Antelope IslandMiscellaneous Publication 00-1 29
2
4
6
K20
69 71 734
6
8
Fe0
tota
l
69 71 73
1
3
5
Na 2
0
69 71 730.2
0.6
1.0
Mg0
69 71 73
0
2
4
CaO
69 71 730.2
0.4
0.6Ti
0 2
69 71 73
10
12
14
Al 2
0 3
69 71 730.0
0.1
0.2
P20
5
69 71 73
OX
IDE
(w
t%)
SiO2 (wt%) SiO2 (wt%)
Figure 8. Harker variation plots for whole-rock chemical data for banded gneiss samples (solid circles) and granitic gneiss samples (open circles).Major element contents vary systematically with increasing SiO2 content as indicated by lines. Note that chemical compositions of the two rocktypes overlap.
Petrology and geologic history of the Precambrian Farmington Canyon Complex - Yonkee, Willis, Doelling

Petrology and geologic history of the Precambrian Farmington Canyon Complex - Yonkee, Willis, Doelling
Granite and pegmatite samples have SiO2 contentsgreater than 72 percent and relatively high Al2O3 contents(table 2). Overall, granite and pegmatite have higher con-tents of Al2O3 and K2O and lower contents of FeO, MgO,and TiO2 compared to banded and granitic gneiss. Composi-tions do not plot on linear trends defined by samples ofbanded and granitic gneiss on Harker variation plots, andthese granites probably had different origins than the banded
The Geology of Antelope Island Utah Geological Survey30
Table 4. Locations of samples.
Sample Lattitude LongitudeAI 540 40° 51' 27" 112° 10' 46"AI 590 40° 51' 27" 112° 10' 50"AI 620 40° 57' 55" 112° 12' 50"AI 2200 40° 58' 06" 112° 12' 53"AI A4D 40° 51' 06" 112° 10' 52"AI A5D 40° 51' 21" 112° 11' 02"AI A5E 40° 51' 21" 112° 11' 02"AI A19E 40° 57' 06" 112° 12' 40"
AI 560 40° 51' 28" 112° 10' 50"AI A19C 40° 57' 06" 112° 12' 40"AI A19D 40° 57' 06" 112° 12' 40"AI 430 40° 51' 47" 112° 10' 26"AI A2A 40° 52' 09" 112° 10' 38"AI A2E 40° 52' 09" 112° 10' 38"
AI 7290 40° 51' 53" 112° 10' 43"AI A3B 40° 51' 54" 112° 10' 44"AI 170 40° 55' 33" 112° 12' 20"AI 190 40° 55' 33" 112° 12' 20"AI 420 40° 56' 04" 112° 14' 03"AI 510 40° 50' 54" 112° 10' 34"AI 7140 40° 57' 21" 112° 14' 58"AI A17A 40° 56' 31" 112° 12' 23"
AI 110 40° 55' 27" 112° 12' 00"AI 140 40° 55' 33" 112° 12' 20"AI 150 40° 55' 33" 112° 12' 20"AI 160 40° 55' 33" 112° 12' 20"AI 210 40° 55' 30" 112° 12' 40"AI 220 40° 55' 30" 112° 12' 40"AI 300 40° 55' 24" 112° 13' 14"AI A10 40° 53' 22" 112° 11' 05"
AI 7110 40° 58' 09" 112° 14' 25"AI 7130 40° 58' 09" 112° 14' 25"AI A20A 40° 57' 35" 112° 13' 43"AI A20B 40° 57' 35" 112° 13' 43"AI A21B 40° 58' 36" 112° 14' 32"AI 350 40° 56' 04" 112° 14' 04"AI 370 40° 56' 04" 112° 14' 04"AI A12B 40° 55' 57" 112° 14' 04"AI A-11 See Bryant(1988b)AI A-5 See Bryant(1988b)AI 1060 40° 55' 18" 112° 11' 25"AI 2180 40° 58' 06" 112° 12' 52"AI 7150 40° 57' 06" 112° 11' 34"AI 640 40° 57' 56" 112° 12' 54"AI 1250 40° 58' 42" 112° 11' 31"AI 7180 40° 51' 41" 112° 10' 52"AI 7200 40° 51' 35" 112° 10' 50"
AI F327A 40° 59' 17" 112° 14' 22"AI F358 41° 00' 12" 112° 12' 04"AI F379A 40° 58' 09" 112° 14' 43"AI F355 40° 52' 24" 112° 10' 31"AI F411 40° 57' 56" 112° 13' 02"AI F434B 40° 57' 18" 112° 12' 59"AI 240 40° 55' 23" 112° 13' 15"AI 250 40° 55' 23" 112° 13' 15"
Granitic gneissBanded gneiss
PH2O = 5 kbar
Plagioclase+ quartz+ liquid
Plagioclase+ alkali feldspar
+ liquid
700°
685°
670°
E5’
E1
P
E4’
ORE6AB
E2’
QZ
AN ANPlagioclase
+ quartz + liquid
Alkali feldspar+ quartz + liquid
E1’
AB P’ OR
E3’
E5’ 700°
685°
670°
E2
AN
E5
E4E3
ORAB
E1
E6
P
Q2
Figure 9. Phase relations in the system quartz(QZ)-albite(AB)-anorthite(AN)-orthoclase(OR)-water for total pressure equal waterpressure equal 5 kilobar. Isotherms on cotectic surfaces, cotecticline (line P-E5), and eutectic points (labeled E1 to E6) projectedonto QZ-AB-OR and AN-AB-OR planes. Modified from Winkler(1976). Normative compositions of banded gneiss (triangles) andgranitic gneiss (squares) indicated.

Petrology and geologic history of the Precambrian Farmington Canyon Complex - Yonkee, Willis, Doelling
and granitic gneiss. Some granite samples have chemical andmineralogical similarities with S-type granites as defined byWhite and Chappel (1983), consistent with derivation by par-tial melting of nearby layered gneiss.
METAMORPHIC CONDITIONS
Mineral assemblages and textural relationships in layeredgneiss and biotite schist, combined with geothermobarometryreported by Barnett and others (1993), and empirically andthermodynamically derived mineral reactions, constrain meta-morphic conditions (figures 10a and 10b). Layered gneisscontains sillimanite, biotite, garnet, cordierite, and K-feldspar.Biotite schist contains sillimanite, biotite, garnet and possiblesyn-metamorphic muscovite. K-feldspar appears to be in tex-tural equilibrium with sillimanite in layered gneiss, whereasmuscovite may be in equilibrium with sillimanite in biotiteschist. Cordierite is associated with biotite, garnet, and silli-manite, although textural relations of cordierite were largelyobliterated during retrograde alteration. Barnett and others(1993) used compositions of coexisting biotite, garnet, andplagioclase to estimate peak metamorphic temperatures ofabout 650 to 750°C for samples of layered gneiss from Ante-lope Island and along Weber Canyon in the Wasatch Range,with a poorly constrained pressure estimate of about 4 kilo-bars for Antelope Island. Observed mineral assemblages andinterpreted mineral reactions described below are consistentwith these estimates.
The coexistence of garnet and cordierite in layeredgneiss indicates that lithostatic pressures were between about3 and 5 kilobar during metamorphism, based on stability ofthese minerals in other relatively iron-rich pelitic rocks (Win-kler, 1976). Thermodynamic relations also indicate thatcordierite will break down to garnet or biotite at pressuresbetween about 2 kilobar for highly Fe-rich cordierite and 7kilobar for highly Mg-rich cordierite, depending slightly onwater pressure (reactions 1a to 1d in figures 10a and 10b;Holdaway and Lee, 1977).
Metamorphic temperatures and water pressures aredefined by a more complicated set of reactions in the layeredgneiss and biotite schist. The presence of sillimanite andcordierite require temperatures greater than 550°C (reactions2a to 2c and 1e in figures 10a and 10b; Holdaway, 1971;Winkler, 1976). Some cordierite may have formed by thebreakdown of biotite and sillimanite, which would requiretemperatures greater than about 650°C, even for reducedwater pressures (reaction 1c in figure 10b). Muscovite is notstable in most layered gneiss samples, but may be locally sta-ble in biotite schist, possibly reflecting varying water pres-sure, which partly controls the breakdown of muscovite to K-feldspar and sillimanite. Muscovite is stable at temperaturesof about 650 to 700°C over a lithostatic pressure range of 3to 5 kilobar if water pressure equals lithostatic pressure (reac-tion 3 in figure 10a). However, K-feldspar is stable for thesame range of temperature and lithostatic pressure if waterpressure is reduced (reaction 3 in figure 10b). Thus both K-feldspar and muscovite can be stable in different areas at tem-peratures of about 700°C if water pressure is reduced in thelayered gneiss. In many high-grade gneiss terranes water
The Geology of Antelope IslandMiscellaneous Publication 00-1 31
Fe-BT+AS+Q
Fe-CD+MS (1a)
Fe-BT+AS+Q
Fe-CD+KF (1b)
KY (2a)
AD
KY (2b)
SL
CD
in (
1e)
Mg-BT+AS+Q
Mg-CD+MS (1a)
1
2
3
4
5
6
7
MS+
Q (3
)KF
+AS
P (
kbar
)
T (°C)500 600 700 800
L
Q+M
S+A
B
L
Q+KF+AB
(4)
SL (2c)AD
(A) PH2O = Ptotal
Fe-BT+AS+Q
Fe-CD+KF (1b)
Fe-GR+AS+QFe-CD (1d)
KY (2a)
AD
KY (2b)
SL
CD
in (
1e)
1
2
3
4
5
6
7
BT+A
S (1
c)G
R+C
D+K
F
P (
kbar
)
T (°C)500 600 700 800
L
Q+K
F+AB
(4)
SL (2c)AD
Mg-BT+AS+Q
Mg-CD+KF (1b)Mg-BT+AS+Q
Mg-CD+MS (1a)
(B) PH2O = 0.4Ptotal
MS
+Q (3
)K
F+A
S
Figure 10. Petrogenetic grids modified from Turner (1981) forPH2O=Ptotal and PH2O=0.4 Ptotal. Minerals are: AB-albite; AD-andalusite; AS-aluminosilicates; BT-biotite; CD-cordierite; GR-gar-net; KF-K-feldspar; KY-kyanite; L-silicate liquid; MS-muscovite; Q-quartz; and SL-sillimanite. Continuous reactions 1a to 1d fromHoldaway and Lee (1977) define breakdown of iron- and magne-sium-cordierite to biotite and garnet. Reaction 1e for first appear-ance of cordierite from Winkler (1976). Reactions 2a to 2c for alu-minosilicates from Holdaway (1971). Reaction 3 for breakdown ofmuscovite from Turner (1981). Reaction 4 for partial melting rela-tions from Winkler (1976). Shaded area gives preferred range ofmetamorphic temperature and pressure based on results reported byBarnett and others (1993) and observed mineral assemblages.

Petrology and geologic history of the Precambrian Farmington Canyon Complex - Yonkee, Willis, Doelling
pressure varied with position and was less than lithostaticpressure (Winkler, 1976; Turner, 1981).
Layered gneiss and biotite schist appear to have under-gone limited partial melting. Initial melting occurs at temper-atures of about 650°C for lithostatic pressures between 3 and5 kilobar if water pressure equals lithostatic pressure, and attemperatures greater than 700°C for reduced water pressures(reaction 4 in figures 10a and 10b). Water is preferentiallyincorporated into partial melts, and melting provides a mech-anism for locally reducing water pressures in the layeredgneiss (for example Turner, 1981). Biotite schist appears tohave undergone less melting and contains more abundanthydrous minerals, and may thus have maintained higher waterpressures.
Other terranes that contain coexisting biotite, sillimanite,cordierite, garnet, and K-feldspar also appear to have beenmetamorphosed at relatively high temperatures and low pres-sures (Schreurs and Westra, 1986; Young and others, 1989).For example, Young and others (1989) used quantitative geo-thermometry and geobarometry for a gneiss terrane in south-ern Nevada to estimate metamorphic temperatures of 590 to750°C, lithostatic pressures of 3 to 4 kilobar, and water pres-sures that were less than lithostatic pressures. Metamorphismin these other terranes and on Antelope Island probablyresulted from transient increases in heat flow, possibly due tolarge-scale igneous intrusion, crustal thickening, or increasedmantle heat flow.
Clinopyroxene in granitic gneiss and clinopyroxene andrare orthopyroxene in hornblende-plagioclase gneiss may alsorecord granulite-facies metamorphism. Textural relations are,however, ambiguous, and pyroxene grains may have formedduring primary igneous crystallization.
GEOCHRONOLOGY
Limited geochronologic data from the Wasatch Rangeand Antelope Island broadly constrain the geologic history ofthe Farmington Canyon Complex. Hedge and others (1983)and Bryant (1988a, 1988b) interpreted a possible period ofArchean crustal growth and metamorphism followed by aperiod of Early Proterozoic igneous intrusion, metamorphism,and deformation. Nd-Sm model ages (estimated crustal resi-dency ages) of 2,740 Ma to 3,430 Ma for three samples ofmigmatitic gneiss and amphibolite in the Wasatch Rangeprobably record a component of Archean crustal material(Hedge and others, 1983). Rb-Sr data for samples of layeredand migmatitic gneiss from the Wasatch Range do not definean isochron (Hedge and others, 1983), but these data havebeen interpreted as recording partial isotopic equilibration ofgneiss during late Archean metamorphism (Bryant, 1988a).Alternatively, the scatter in Rb and Sr isotopic values mayreflect varying initial 87Sr/86Sr ratios in the gneiss, or mobi-lization of Rb and Sr during Proterozoic metamorphism, inwhich case a unique interpretation of the data is impossible.Protolith and metamorphic ages for lithologically similar lay-ered gneiss on Antelope Island are currently uncertain.
Isotopic data provide evidence for early Proterozoicgranitic igneous intrusions (Hedge and others, 1983). Rb-Srdata for samples from a large granitic gneiss body in theWasatch Range define an isochron that yields a high 87Sr/86Sr
initial ratio of 0.769 and an age of 1,810 Ma, interpreted asthe age of synmetamorphic intrusion of a granitic pluton(Hedge and others, 1983). This initial ratio is significantlygreater than values reported for most granitic plutons (Faureand Powell, 1972), and if correct, requires long crustal resi-dence times for Rb-enriched material in the source region forthe pluton. Alternatively, the high initial ratio may reflectmobilization of Rb and Sr. Discordant U-Pb ages for thegranitic gneiss samples define a chord with an upper interceptof 1,790 Ma on a concordia diagram, but the scatter in dataabout the chord is greater than that expected from analyticalerror (Hedge and others, 1983).
The age of granitic gneiss on Antelope Island is less cer-tain. Discordant U-Pb ages for two zircon fractions ofgranitic gneiss from Antelope Island define a chord with anupper intercept of 1,990 Ma on a concordia diagram, whichwas interpreted as the age of synmetamorphic intrusion of agranitic pluton (Hedge and others, 1983; Bryant, 1988a).However, the geological accuracy of this date is uncertainbecause only two points were used to construct the chord.Discordant U-Pb ages for zircon fractions from a sample ofgarnet-biotite-quartz-feldspar gneiss obtained from a drillhole located about 8 kilometers (5 mi) west of AntelopeIsland define a chord with an upper intercept of 2,020 Ma(Hedge and others, 1983). Further isotopic studies are neededto confirm these possible igneous ages, which are unusual forthe western United States and which are different from agesof granitic gneiss in the Wasatch Range.
Barnett and others (1993 reported slightly discordant ura-nium lead ages of 1650 to 1700 Ma for metamorphic mon-azite from layered gneiss on Antelope Island and near WeberCanyon in the Wasatch Range. These ages may record cool-ing following peak metamorphism and intrusion of graniticplutons, or a metamorphic event slightly younger thangranitic intrusion. 40Ar/39Ar plateau ages of hornblende areabout 1,600 Ma and record cooling through temperatures ofabout 500° (Barnett and others, 1993).
CONCLUSIONS
Local Geology
Layered gneiss and lenses of biotite schist and quartz-rich gneiss exposed within the central and southern parts ofAntelope Island probably represent a metamorphosed andintensely deformed sedimentary sequence. Layered gneiss iswell foliated and consists mostly of quartz, plagioclase, K-feldspar, and biotite, with minor garnet, sillimanite, andcordierite. Biotite schist contains abundant biotite with lesseramounts of quartz, muscovite, garnet, and sillimanite.Quartz-rich gneiss contains abundant quartz with minor pla-gioclase, muscovite, and biotite. Isolated pods of metamor-phosed ultramafic rock within layered gneiss consist of vari-ably altered pyroxene, amphibole, and olivine, and may rep-resent part of highly dismembered oceanic crust.
Hornblende-plagioclase gneiss forms thin pods withinother units and is abundant within a mafic gneiss body in thecentral part of the island. The pods may represent maficdikes emplaced over a protracted history and the mafic bodymay represent a deformed pluton or extrusive sequence.
The Geology of Antelope Island Utah Geological Survey32

Petrology and geologic history of the Precambrian Farmington Canyon Complex - Yonkee, Willis, Doelling
The Geology of Antelope IslandMiscellaneous Publication 00-1 33
Shear zone
Low-grade cleavage
High-grade foliation
Late Proterozoic to Mesozoicsedimentary rocks
STAGE 1. Archean(?) deposition of surpracrustal sequence STAGE 5. Proterozoic intrusion of late-stage granites
STAGE 3. Early Proterozoic igneous intrusion, and STAGE 4.Early Proterozoic metamorphism and deformation
STAGE 6. Middle to Late Proterozoic erosion, and STAGE 7.Late Proterozoic to Mesozoic deposition of sedimentary rocks
STAGE 8. Mesozoic deformation and retrograde alteration
Late-stage granitic intrusions/ granite and pegmatite
Granitic to granodioriticintrusions / banded gneiss andgranitic gneiss
Possible early-stage intrusions
Mafic dikes and flows /hornblende-plagioclase gneiss
Surpracrustal sediments /layered gneiss, biotite schist,quartz-rich gneiss
Precambrian igneousand metamorphic rocks:
STAGE 2. Late Archean(?) metamorphism and deformation, andigneous intrusions
Figure 11. Schematic diagram of interpreted geologic history of Antelope Island. Stage 1- A supracrustal sequence of sediments and mafic dikesand flows is deposited. Stage 2- The supracrustal sequence undergoes Late Archean(?) metamorphism and deformation, with possible intrusion ofplutons. Stages 3 and 4- Large granitic to granodioritic plutons are intruded, approximately synchronous with Early Proterozoic main-phase meta-morphism and deformation that produce strong foliation. Stage 5- Late-stage granites are intruded and locally crosscut earlier structures. Stages6 and 7- Middle to Late Proterozoic uplift and erosion are followed by Late Proterozoic to Mesozoic deposition of sedimentary rocks. Stage 8-Mesozoic thrusting, deformation, and retrograde alteration produce shear zones and cleavage that overprint high-grade structures. Stage 9 (notillustrated)- Cenozoic extension, uplift, and erosion.

Petrology and geologic history of the Precambrian Farmington Canyon Complex - Yonkee, Willis, Doelling
Hornblende-plagioclase gneiss has gabbroic to tonalitic com-position and consists mostly of amphibole and plagioclase,with minor quartz and biotite, and rare pyroxene.
Well-foliated banded gneiss forms a broad belt on theeastern part of the island, and surrounds the margin of weaklyto well-foliated granitic gneiss on the western part of theisland. These two rock types have overlapping mineralogicaland chemical compositions, and may represent a granitic togranodioritic pluton. Banded and granitic gneiss consistsmostly of quartz, plagioclase, and K-feldspar, with lesseramounts of hornblende. A single weak to strong foliationdeveloped in banded and granitic gneiss during main-phasedeformation and high-grade metamorphism.
Coarse-grained granite forms plutons on the eastern andcentral part of the island and small bodies that crosscut olderstructures in other rock types, recording intrusion after peakdeformation. Pegmatite forms foliated concordant to non-foliated discordant dikes and lenses within most rock types,indicating a protracted history of intrusion. Granite and peg-matite consist of course-grained quartz, albitic plagioclase,and K-feldspar, with minor and variable amounts of mus-covite, biotite, and garnet.
Chloritic gneiss bounds shear zones and is widespreadnear the basement-cover contact. It displays variable retro-grade greenschist alteration and variably developed sets offractures, veins, and minor shear zones that crosscut earlierhigh-grade structures. Phyllonite and mylonite occur withinshear zones that display pervasive alteration and concentratedplastic deformation. Shear zones and fracture sets probablyaccommodated internal deformation of thrust sheets duringthe Sevier orogeny.
Layered gneiss contains biotite, garnet, sillimanite, K-feldspar, and cordierite, and has undergone local partial melt-ing consistent with high metamorphic temperatures (about700°C), relatively low lithostatic pressures (about 3 to 5 kilo-bar), and locally reduced fluid pressures. Rare pyroxene ingranitic and hornblende-plagioclase gneiss may reflect locallypreserved granulite facies metamorphism or primary igneouscrystallization. Normative mineral abundances of banded andgranitic gneiss are consistent with crystallization at tempera-tures of 650 to 700°C from a magma initially derived frompartial melting of granodioritic to tonalitic gneiss. A domi-nant foliation that formed during main-phase deformationcuts layered, banded, and granitic gneiss and generally strikesnorth to northeast. However, complex fold interference pat-terns and multiple foliations locally preserved within layeredgneiss may record an earlier period of deformation.
Regional Correlation
Rocks of the Farmington Canyon Complex display simi-larities with both the Archean Wyoming Province and EarlyProterozoic terranes of Colorado and southern Utah (figure2). Layered gneiss in the Farmington Canyon Complex ispetrologically similar to some paragneisses in the WyomingProvince and Nd-Sm model ages of layered gneiss in theWasatch Range probably record a component of Archean par-ent (Hedge and others, 1983). Bryant (1988a) thus suggestedthat the Farmington Canyon Complex represents a westernextension of the Wyoming Province. However, layered
gneiss in the Farmington Canyon Complex is also similar tosome metasedimentary rocks in Colorado and was stronglydeformed, metamorphosed, and remobilized during the EarlyProterozoic; a pattern that is only observed along the southernmargins of the Wyoming Province and farther southwest inthe Mohave Province (Bennett and DePaolo, 1987). Graniticgneiss in the Wasatch Range was emplaced and metamor-phosed at about 1,800 Ma, similar to ages of intrusion andmetamorphism along and south of the Cheyenne belt. Thus,older basement rocks, such as layered gneiss exposed onAntelope Island, may represent part of the Wyoming Provincethat was remobilized during Early Proterozoic intrusion,metamorphism, and deformation. However, further isotopicdata are needed to confirm this interpretation.
Geologic History
Basement rock within the Wasatch Range and on Ante-lope Island experienced a complex history of igneous intru-sion, partial melting, high-grade metamorphism, and defor-mation. A simplified hypothetical model of this history isillustrated in idealized stages (figure 11).
Stage 1- Archean(?) deposition of a supracrustal sequence.A sequence of sedimentary strata, including graywacke,
quartz-rich sandstone, and shale, now represented by layeredgneiss, quartz-rich gneiss, and biotite schist, was deposited.Mafic flows and dikes, now represented by pods of horn-blende-plagioclase gneiss, may also have been included inthis supracrustal sequence. The material upon which theserocks was deposited is uncertain, and may have been oceaniccrust now represented by isolated lenses of metamorphosedmafic and ultramafic rock. Evidence for the origin of thissupracrustal sequence has been largely obliterated by subse-quent metamorphism and deformation.
Stage 2- Late Archean(?) metamorphism and deformation.A period of metamorphism and deformation appears to
have affected the layered gneiss prior to main-phase deforma-tion, based on fold interference patterns and multiple folia-tions preserved in some fold hinges. The age and conditionsof this event are uncertain, with Hedge and others (1983) andBryant (1988a, 1988b) suggesting a period of Late Archeanmetamorphism. This event may have been synchronous withintrusion of igneous bodies. Pods of granitic gneiss withinlayered gneiss may represent early intrusion of granitic mate-rial, local partial melting, or may be related to later intrusionduring stage 3.
Stage 3- Early Proterozoic granitic intrusion.Large plutons of granitic material were probably intruded
between 2,000 and 1,800 million years ago, prior to or syn-chronous with main-phase deformation and metamorphism.Bodies of granitic and banded gneiss on Antelope Island andgranitic gneiss in the Wasatch Range may record regionalintrusion of granitic plutons, based on petrologic and chemi-cal similarities. However, limited available isotopic data indi-cate different ages for granitic gneiss on Antelope Island andin the Wasatch Range (Hedge and others, 1983).
Stage 4- Early Proterozoic main-phase metamorphism and
The Geology of Antelope Island Utah Geological Survey34

Petrology and geologic history of the Precambrian Farmington Canyon Complex - Yonkee, Willis, Doelling
deformation.Main-phase metamorphism and deformation, possibly
synchronous with granitic intrusion, produced weak to strongfoliation in banded and granitic gneiss, and tight to isoclinalfolds that largely obliterated earlier structures in layeredgneiss. Metamorphism was overall at upper amphibolite togranulite facies. Partial melting, injection of pegmatite dikes,and migmatization accompanied metamorphism. Estimatedmetamorphic conditions suggest a high geothermal gradientand locally reduced water pressures, perhaps related to heat-ing during regional intrusion of granitic to granodioritic plu-tons.
Stage 5- Proterozoic intrusion of late-stage granites.Coarse-grained granitic plutons and pegmatite dikes were
emplaced after peak metamorphism and deformation. Late-stage granitic bodies are much less deformed and crosscutmain-phase foliation and compositional layering. Some gran-ite was probably derived by partial melting of surroundinglayered gneiss after peak deformation.
Stage 6- Middle to Late Proterozoic uplift and erosion.Uplift and erosion of high-grade basement rocks fol-
lowed metamorphism and intrusion. Local retrograde meta-morphism may have accompanied uplift, but such metamor-phism would be difficult to distinguish from Mesozoic alter-ation.
Stage 7- Late Proterozoic to Mesozoic deposition of sedimen-tary rocks.
A late Proterozoic sequence of diamictite, dolomite,quartzite, and argillite was deposited over the basement. Alithologically similar but much thicker sequence of late Pro-terozoic rocks in the Willard thrust sheet contains basalt flowsand dikes, and may record rifting along the western margin ofthe North American craton (Christie-Blick and others, 1989).An overlying sequence of Paleozoic to Mesozoic carbonates,sandstone, and shale was deposited on the late Proterozoicstrata. This sequence is part of a westward-thickening wedgeof miogeoclinal strata deposited along the western margin ofNorth America.
Stage 8- Mesozoic deformation and retrograde alteration.Mesozoic deformation and greenschist-facies retrograde
alteration overprinted earlier Precambrian structures duringthe Sevier orogeny. Large thrust sheets were translated east-ward and basement and sedimentary cover rocks were locallyimbricated. Internal deformation of thrust sheets producedshear zones in basement rock, and cleavage and folds in thesedimentary cover.
Stage 9- Cenozoic extension.Large-displacement normal faults developed during
Cenozoic extension. Uplift and erosion of ranges betweennormal faults resulted in the current topography and expo-sures of the island.
ACKNOWLEDGMENTS
Jon King provided a detailed and thoughtful review of anearlier version of this manuscript. The Utah Division of
Parks and Recreation provided logistical support and accessduring the field work. Mark Jensen assisted in bedrock map-ping on Antelope Island that led to this study.
REFERENCES
Armstrong, R.L., 1968, Mantled gneiss domes in the AlbionRange, southern Idaho: Geological Society of AmericaBulletin, v. 79, p. 1,295-1,314.
Barnett, Daniel, Bowman, J.R., and Smith, H.A., 1993, Petro-logic and geochronologic studies in the FarmingtonCanyon Complex, Wasatch Mountains and AntelopeIsland, Utah: Utah Geological Survey Contract Report93-5, 34 p.
Bennett, V.C., and DePaolo, D.J., 1987, Proterozoic crustalhistory of the western United States as determined byneodymium isotopic mapping: Geological Society ofAmerica Bulletin, v. 99, p. 674-685.
Bell, G.L., 1951, Farmington Canyon Complex of north-cen-tral Wasatch: Salt Lake City, University of Utah, Ph.D.dissertation, 101 p.
Bryant, Bruce, 1988a, Evolution and early Proterozoic historyof the margin of the Archean continent in Utah, in Ernst,W.G., editor, Metamorphism and crustal evolution of thewestern United States: Englewood Cliffs, N.J., Prentice-Hall, p. 432-445.
Bryant, Bruce, 1988b, Geology of the Farmington CanyonComplex, Wasatch Mountains, Utah: U.S. GeologicalSurvey Professional Paper 1476, 54p.
Christie-Blick, Nicholas, Mount, J.F., Levy, Marjorie, Signor,P.W., and Link, P.K., 1989, Late Proterozoic and Cambri-an tectonics, sedimentation, and record of Metazoan radi-ation in the Western United States: 28th InternationalGeological Congress Field Trip Guidebook T331, 113p.
Compton, R.R., Todd, V.R., Zartman, R.E., and Naeser, C.W.,1977, Oligocene and Miocene metamorphism, folding,and low-angle faulting in northwestern Utah: GeologicalSociety of America Bulletin, v. 88, p. 1,237-1,250.
Cox, K.G., Bell, J.D., and Pankhurst, R.J., 1979, The interpre-tation of igneous rocks: London, George, Allen, andUnwin, 450 p.
Creaser, R.A., Price, R.C., and Wormland, R.J., 1991, A-typegranites revisited: assessment of residual-source model:Geology, v. 19, p. 163-166.
Doelling, H.H., Willis, G.C., Jensen, M.E., Hecker, Suzanne,Case, W.F., and Hand, J.S., 1990, Geologic map of Ante-lope Island, Davis County, Utah: Utah Geological andMineral Survey Map 127, 27 p, 1:24,000.
Duebendorfer, E.M., and Houston, R.S., 1987, Proterozoicaccretionary tectonics at the southern margin of theArchean Wyoming craton: Geological Society of Ameri-ca Bulletin, v. 98, no. 5, p. 554-568.
Eardley, A.J., and Hatch, R.A., 1940, Precambrian crystallinerocks of north-central Utah: Journal of Geology, v. 48, p.58-72.
Faure, Gunter, and Powell, J.L., 1972, Strontium isotopegeology: New York, Springer-Verlag, 188 p.
The Geology of Antelope IslandMiscellaneous Publication 00-1 35

Graff, P.J., Sears, J.W., and Holden, G.S., 1980, The Uintaarch project--investigations of uranium potential in Pre-cambrian X and older metasedimentary rocks in theUinta and Wasatch Ranges, Utah and Colorado: U.S.Department of Energy Open-File Report GJBX-170(80),180 p.
Hedge, C.E., Houston, R.S., Tweto, O.L., Peterman, Z.E.,Harrison, J.E., and Reid, R.R., 1986, The Precambrian ofthe Rocky Mountain region: U.S. Geological Survey Pro-fessional Paper 1241-D, p. 1-17.
Hedge, C.E., Stacey, J.S., and Bryant, Bruce, 1983,Geochronology of the Farmington Canyon Complex,Wasatch Mountains, Utah, in Miller, D.M., Todd, V.R.,and Howard, K.A., editors, Tectonic and stratigraphicstudies of the eastern Great Basin: Geological Society ofAmerica Memoir 157, p. 37-44.
Hintze, L.F., and Stokes, W.L., 1964, Geologic map of north-western Utah: Utah Geological and Mineral Survey map,unnumbered, 1:250,000.
Holdaway, M.J., 1971, Stability of andalusite and the alu-minum silicate phase diagram: American Journal of Sci-ence, v. 271, p. 97-131.
Holdaway, M.J., and Lee, S.M., 1977, Fe-Mg cordierite sta-bility in high-grade pelitic rocks based on experimental,theoretical, and natural observations: Contributions toMineralogy and Petrology, v. 63, p. 175-198.
Karlstrom, K.E., and Houston, R.S., 1984, The Cheyennebelt: analysis of a Proterozoic suture in southernWyoming: Precambrian Research, v. 25, p. 415-446.
International Union of Geological Scientists (Subcommissionon the Systematics of Igneous Rocks), 1973, Classifica-tion and nomenclature of plutonic rocks: Geotimes, v. 18,no. 10, p. 26-30.
Irvine, T.N., and Barager, W.R.A., 1971, A guide to the chem-ical and classification of common volcanic rocks: Cana-dian Journal of Earth Sciences, v. 8, p. 523-548.
Larsen, W.N., 1957, Petrology and structure of AntelopeIsland, Davis County, Utah: Salt Lake City, University ofUtah, Ph.D. dissertation, 142 p., map scale 1:24,000.
Pearce, T.H., Gorman, B.E., and Birkett, T.C., 1977, The rela-tionship between major element chemistry and tectonicenvironment of basic and intermediate volcanic rocks:Earth and Planetary Science Letters, v. 36, p. 121-132.
Pettijohn, F.J., Potter, P.E., and Siever, R., 1973, Sand andsandstone: New York, Springer-Verlag, 618 p.
Schreurs, J., and Westra, L., 1986, The thermotectonic evolu-tion of a Proterozoic low pressure, granulite dome, WestUusimaa, Finland: Contributions to Mineralogy andPetrology, v. 93, p. 236-250.
Sears, J.W., Graff, P.J., and Holden, G.S., 1982, Tectonic evo-lution of lower Proterozoic rocks, Uinta Mountains, Utahand Colorado: Geological Society of America Bulletin, v.93, p. 990-997.
Turner, F.J., 1981, Metamorphic Petrology: New York,McGraw-Hill, 524p.
Tweto, O.L., 1987, Rock units of the Precambrian basement
in Colorado: U.S. Geological Survey Professional Paper1321-A, 54 p.
White, A.R., and Chappell, B.W., 1983, Granitoid types andtheir distribution on the Lachlan fold belt, southeasternAustralia: Geological Society of America Memoir 159, p.21-33.
Winkler, H.G.F., 1976, Petrogenesis of metamorphic rocks:New York, Springer Verlag, 334 p.
Yonkee, W.A., 1990, Geometry and mechanics of basementand cover deformation, Farmington Canyon Complex,Wasatch Range, Utah: Salt Lake City, University of Utah,Ph.D. dissertation, 255 p.
Yonkee, W.A., 1992, Basement-cover relations, Sevier oro-genic belt, northern Utah: Geological Society of AmericaBulletin, v. 104, no. 3, p. 280-302.
Young, E.D., Anderson, J.L., Clark, H.S., and Thomas, W.M.,1989, Petrology of biotite-cordierite-garnet gneiss of theMcCullough Range, Nevada: Evidence for Proterozoiclow-pressure fluid-absent granulite-grade metamorphismin the southern Cordillera: Journal of Petrology, v. 30, p.39-60.
The Geology of Antelope Island Utah Geological Survey36

ABSTRACT
A thin stratigraphic section of Late Proterozoic and Cam-brian sedimentary and low-grade metasedimentary rocksunconformably overlies Archean(?)to Early Proterozoic high-grade metamorphic and igneous rocks on Antelope Island.The sedimentary and metasedimentary rocks are divided intothree formations, the Late Proterozoic Mineral Fork and Kel-ley Canyon Formations, and the Cambrian Tintic Quartzite.The Mineral Fork Formation is 0 to about 200 feet (0-60 m)thick and consists mostly of dark-colored diamictite. TheKelley Canyon Formation unconformably overlies the Miner-al Fork Formation, and is divided into a lower dolomite mem-ber and an upper slate member. The dolomite member is 20 to30 feet (6-9 m) thick and consists of light-gray to pink, fine-grained crystalline dolomite with minor amounts of calcare-ous slate. The slate member is 50 to 250 feet (15-75 m) thickand consists of purple, greenish-gray, and reddish-brown,thin-bedded slate and argillite with minor silty dolomite andfine-grained quartzite. The Tintic Quartzite is estimated to bein excess of 800 feet (250 m) thick and consists mostly of tanto greenish-gray, fine- to coarse-grained quartzite and quartz-pebble conglomerate.
Late Proterozoic strata are generally absent in outcropsdirectly east of Antelope Island, are thin on Antelope Island,and are as much as 12,000 feet (3,500 m) thick in theallochthonous, structurally overlying Willard thrust sheet,which was originally located to the west prior to thrusting.When restored to their pre-thrust positions, Late Proterozoicand Paleozoic strata form a westward-thickening sedimentarywedge, and the section on Antelope Island is transitionalbetween a thicker western section and a thinner eastern sec-tion. The configuration of this sedimentary wedge appears tohave partially controlled the location of Mesozoic thrustfaults.
INTRODUCTION
A thin stratigraphic section of Late Proterozoic to Cam-brian sedimentary and low-grade metasedimentary rocks ispreserved on Antelope Island. Lithologic and stratigraphiccharacteristics of this section provide an important link withsedimentary rocks of similar lithology and age exposed else-where in northern Utah (figures 1 and 2). In this paper we
describe the outcrop and microscopic characteristics of thissection, and then compare these characteristics with othersections to refine regional stratigraphic correlations and tobetter understand the Late Proterozoic to Cambrian geologichistory of northern Utah.
Two distinctive Late Proterozoic to Paleozoic stratigraph-ic sections are preserved in northern Utah, a thick westernsection and a thin eastern section (Levy and Christie-Blick,1989; Link and others, 1993; figure 1). The western section,preserved in the Willard thrust sheet, consists of up to 12,000feet (3,500 m) of Late Proterozoic strata and about 25,000feet (7,500 m) of Paleozoic strata (Hintze, 1988). The easternsection, preserved in thrust sheets to the east, includes about10,000 feet (3000 m) of Paleozoic strata that directly overlieArchean(?) to Early Proterozoic high-grade metamorphic andigneous rocks (Hintze, 1988).
The sedimentary and low-grade metasedimentary rockspreserved on Antelope Island mark a transition from the east-ern to western sections. These rocks were previouslydescribed by Larsen (1957) and Christie-Blick (1983), andwere mapped in detail by Doelling and others (1990) (figure2). These rocks consist of: (1) a lower unit of diamictite; (2)a middle unit of dolomite and interbedded slate, argillite, siltydolomite, and fine-grained quartzite; and (3) an uncon-formably overlying upper unit of quartzite and quartz-pebbleconglomerate (figure 3). Christie-Blick (1983) and Doellingand others (1990) assigned the lower diamictite unit to theLate Proterozoic Mineral Fork Formation. Christie-Blick(1983) assigned the middle unit to the Late Proterozoic Kel-ley Canyon Formation, and Doelling and others (1990) subdi-vided this formation into a lower dolomite member and anupper slate member. Doelling and others (1990) assigned theupper unit to the Early Cambrian Tintic Quartzite, based onlithologic similarities to rocks exposed in the Wasatch Range(Eardley, 1944). A measured section of the Late Proterozoicrocks is given in the appendix and summarized in figure 4.
Middle Cambrian through Mesozoic strata are not pre-served on Antelope Island, probably due to erosion, but clastsof Paleozoic rocks are preserved in unconformably overlyingTertiary conglomerates (Doelling and others, 1990; Willis andJensen, this volume). Tertiary conglomerate at the north endof the island (figure 2) contains abundant angular clasts ofshale and silty limestone that were probably eroded from the
PROTEROZOIC AND CAMBRIAN SEDIMENTARYAND LOW-GRADE METASEDIMENTARY ROCKS
ON ANTELOPE ISLAND
byW.A. Yonkee1, G.C. Willis, and H.H. Doelling
Utah Geological Survey
1now at Department of GeosciencesWeber State University, Ogden, Utah

Proterozoic and Cambrian sedimentary and low-grade metasedimentary rocks - Yonkee, Willis, Doelling
middle Cambrian Ophir Shale and Maxfield Limestone,which overlie the Tintic Quartzite. Tertiary conglomerate onthe southeastern side of the island (figure 2) contains clasts ofupper Cambrian to Mississippian quartzite, dolomite, andlimestone up to 11 feet (3 m) in maximum dimension. Clastsin these conglomerates were derived from nearby sources,indicating that early to middle Paleozoic rock must haveoverlain the Tintic Quartzite on or near the island area priorto Tertiary erosion.
Late Proterozoic and Cambrian sedimentary rocks onAntelope Island were internally deformed and metamor-phosed to low grades during the Mesozoic Sevier orogeny(Yonkee, 1992). Many of these rocks display weak to strongcleavage and some intervals display minor folds and faults(Doelling and others, 1990). Yonkee (1992) reported princi-pal strain ratios ranging mostly from about 1.5:1 to 3:1, withprincipal extension directions at moderate to low angles tobedding. Using this range in axial ratios and extension direc-tions, a unit originally 10 feet (3 m) thick before deformationwould range from about 6 to 12 feet (2 to 4 m) thick afterdeformation. Minor folding and faulting also produced local
changes in thicknesses. Thus, measured thicknesses of LateProterozoic and Cambrian strata include effects of deforma-tion that modified original thicknesses.
OUTCROP CHARACTERISTICS OFSEDIMENTARY ROCKS
Mineral Fork Formation
The Mineral Fork Formation on Antelope Island consistsmostly of massive, dark-colored diamictite, with minoramounts of interbedded argillite, quartzite, and conglomeratelocally present near the top of the unit (figure 4 and appen-dix). Clasts constitute 20 to 60 percent of the diamictite inmost areas, and sit within a micaceous, gritty matrix (figures5a and 5b). Cobble-sized clasts are abundant, but clast size ishighly variable, ranging up to boulders 7 feet (2 m) across(figure 5a). Clasts vary from angular to rounded, but manywere altered and flattened during Mesozoic deformation.Clast types include quartzo-feldspathic gneiss and granite,quartzite (including rare, but distinctive, chrome-green
The Geology of Antelope Island Utah Geological Survey38
0 20 km
0 10 miles
Willard
thru
st
Crawfor
d t
hrus
t
Wasatch fault
Absaroka
thrust
Pz
Pz
Mz
Mz
Mz
MzPrb
PzPr
Pz
Pcx
Mz
Pz
Pcx
Pcx
Pcx
Mz
Prw
PrwPzw
Pzw
Pzw Mz
Mz
MzPz
Prf
Pcx
Prw
Pz
Pzw
Prw
PzPcx
Pz
PrPz
Pcx
Fig. 2
Great SaltLake
Prw
FremontIsland
Pz
Willa
rd t
hrus
t
Prw
41°
112°
Pcx
Figure 1. Generalizedgeologic index map ofnorthern Utah showingregional setting of Ante-lope Island. Units in theeastern section pre-served in the Crawfordand Absaroka thrustsheets are Pcx-Archean(?) to EarlyProterozoic basementrocks, Prb- Middle toLate Proterozoic BigCottonwood Formation,Pr- thin stratigraphicsection of Late Protero-zoic strata, Pz- Paleo-zoic strata, and Mz-Mesozoic strata. Unitsin the western sectionpreserved in the Willardthrust sheet are Prf-Early Proterozoic FacerFormation, Prw- LateProterozoic strata, andPzw- Paleozoic strata.

Proterozoic and Cambrian sedimentary and low-grade metasedimentary rocks - Yonkee, Willis, Doelling
quartzite), schist, and amphibolite. Relative abundance ofclast types varies between outcrops. Gneiss and granite clastscomprise 70 to 95 percent of all clasts greater than 1/2 inch (1cm) in size; rounded to angular quartzite cobbles to bouldersconstitute 5 to 30 percent of the larger clasts, and amphiboliteclasts are rare. The matrix is black to dark green, micaceous,and contains variable amounts of sand-sized quartz andfeldspar. Most diamictite is massive and not sorted, but rareconcentrations of pebbles define crude bedding locally. Thediamictite has well-developed cleavage that formed duringMesozoic thrusting and is defined by subparallel partings inthe matrix and flattened clasts (Yonkee, 1992).
On Antelope Island, the Mineral Fork Formation uncon-formably overlies Archean(?) to Early Proterozoic crystallinebasement rocks, and is overlain sharply by dolomite of theKelley Canyon Formation. The Mineral Fork Formationvaries from 0 to 200 feet (60 m) thick, largely reflecting dep-osition on an irregular basement surface. A zone 1 to 3 feetthick (0.3-1 m), characterized by disaggregated grains ofbasement gneiss in a light-green chloritic matrix, is locallypreserved along the basement contact and may represent afossilweathering horizon.
Kelley Canyon Formation
The Kelley Canyon Formation on Antelope Island wasinformally divided into a lower dolomite member and anupper slate member by Doelling and others (1990). Totalthickness of this formation is about 70 to 260 feet (20 to 80m).
Dolomite Member
The dolomite member consists of fine-grained crystallinedolomite with interbeds of calcareous slate locally near thetop of the unit (figure 4 and appendix). The dolomite is lightgray to pink where fresh and weathers to form light-gray toyellowish-pink, resistant cliffs that contrast with the underly-ing diamictite (figure 6a). The member varies from finelylaminated to thick bedded, partly reflecting recrystallization(figure 6b). Laminations are locally wavy and define domalstructures. The dolomite is generally weakly deformed byfractures, thin quartz- and calcite-filled veins, and open folds.However, spaced cleavage and tight folds with inclined axialplanes are locally developed where this unit is more stronglydeformed. The member has a relatively uniform thickness of20 to 30 feet (6 to 9 m) where less deformed. The lower con-tact with the diamictite is sharp and shows local relief up to 3feet (1 m).
Slate Member
The slate member consists of thin-bedded, purple, green-ish-gray, and reddish-brown, slate, argillite, silty dolomite,and fine-grained quartzite (appendix, figures 4 and 7). Themember commonly forms smooth, covered slopes, but islocally well exposed. The lower half of the member consistsof multi-colored slate with interbedded calcareous slate andsilty dolomite. The upper half consists mostly of purplish toreddish slate and fine-grained quartzite. The member general-ly displays well-developed slaty cleavage, widespread minor
The Geology of Antelope IslandMiscellaneous Publication 00-1 39
Daddy Stum
p Ridge
?
C- t
XWf
XWf
TERTIARYClastic, volcani-clastic, and vitrictuff deposits
CAMBRIANTintic Quartzite
LATE PROTEROZOICKelley Canyon Fm.Mineral Fork Fm.
ARCHEAN(?)--EARLY PROTEROZOICFarmington Canyon Complex
Surficial deposits not shown
Reverse fault
Normal fault
C- t
XWf
XWf
Zmk
T
T
Zmk
T
C- t
BuffaloPoint
Zmk
Zmk
C- tZmk
measuredsection
0
0 1 2 miles
1 2 kilometers
T. 3 N.T. 2 N.
T. 2 N.T. 1 N.
R. 4
W.
R. 3
W.
T. 4 N.T. 3 N.
R. 4
W.
R. 3
W.
Great
SaltLake
N
ElephantHead
Figure 2. Generalized geologic map of Antelope Island. Late Pro-terozoic strata unconformably overlie Archean(?) to Early Protero-zoic basement, and are overlain by Cambrian quartzite. Tertiaryclastic and volcaniclastic deposits unconformably overlie olderunits. Location of measured section (appendix) is indicated. Qua-ternary deposits are not shown. Modified from Doelling and others(1990).
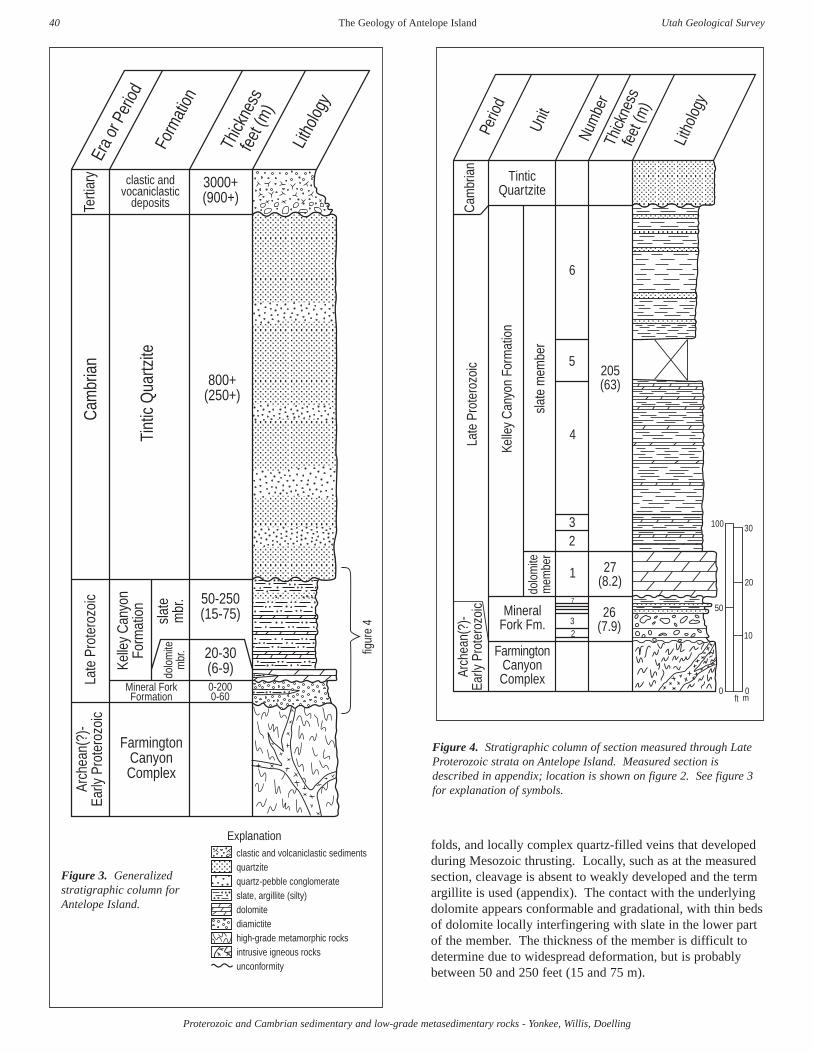
Proterozoic and Cambrian sedimentary and low-grade metasedimentary rocks - Yonkee, Willis, Doelling
folds, and locally complex quartz-filled veins that developedduring Mesozoic thrusting. Locally, such as at the measuredsection, cleavage is absent to weakly developed and the termargillite is used (appendix). The contact with the underlyingdolomite appears conformable and gradational, with thin bedsof dolomite locally interfingering with slate in the lower partof the member. The thickness of the member is difficult todetermine due to widespread deformation, but is probablybetween 50 and 250 feet (15 and 75 m).
The Geology of Antelope Island Utah Geological Survey40
800+(250+)
Tint
ic Q
uartz
ite
Cam
bria
n
50-250(15-75)sl
ate
mbr
.
Kelle
y C
anyo
nFo
rmat
ion
Late
Pro
tero
zoic
Mineral ForkFormation
20-30(6-9)do
lom
item
br.
0-2000-60
FarmingtonCanyonComplex
Arch
ean(
?)-
Early
Pro
tero
zoic
Era
or P
eriod
Form
ation
Thick
ness
feet
(m)
Litho
logy
3000+(900+)
Terti
ary clastic and
vocaniclasticdeposits
clastic and volcaniclastic sedimentsquartzitequartz-pebble conglomerateslate, argillite (silty)dolomitediamictitehigh-grade metamorphic rocksintrusive igneous rocksunconformity
Explanation
figur
e 4
Lith
olog
y
Unit
Num
ber
Perio
d
Thick
ness
feet
(m)
Cam
bria
n
TinticQuartzite
Kelle
y C
anyo
n Fo
rmat
ion
slat
e m
embe
r
Late
Pro
tero
zoic
MineralFork Fm.
FarmingtonCanyonComplexAr
chea
n(?)
-Ea
rly P
rote
rozo
ic
dolo
mite
mem
ber
27(8.2)
1
23
4
5205(63)
6
26(7.9)
2
7
3
mft
10
20
50
00
30100
Figure 3. Generalizedstratigraphic column forAntelope Island.
Figure 4. Stratigraphic column of section measured through LateProterozoic strata on Antelope Island. Measured section isdescribed in appendix; location is shown on figure 2. See figure 3for explanation of symbols.

Proterozoic and Cambrian sedimentary and low-grade metasedimentary rocks - Yonkee, Willis, Doelling
Tintic Quartzite
The Tintic Quartzite consists of tan to greenish-gray,fine- to coarse-grained quartzite, with interbeds of quartz-pebble conglomerate (figure 8). Quartzite layers vary fromquartz rich, to micaceous, to arkosic. Some quartzite layersare pebbly and grade into conglomerate that contains morethan 60 percent clasts. Clasts within conglomerate layersinclude tan, white, and red polycrystalline quartz, and havemaximum dimensions from 0.5 to 4 inches (0.01 to 0.1 m).Fine- to medium-grained quartzite is estimated to constituteabout 60 percent of the formation, pebbly quartzite about 20percent, and conglomerate about 20 percent. The TinticQuartzite is medium- to thick-bedded, and weathers to formledgy slopes and blocky cliffs. The quartzite is variablydeformed, with locally well-developed cleavage, quartz-filledveins, and minor folds. Cleavage is defined by stretched peb-bles and micaceous partings. The contact with the underlyingslate member of the Kelley Canyon Formation is sharp, local-ly marked by a basal conglomerate, and is probably uncon-formable. The top of the quartzite is not exposed. Wide-spread deformation and discontinuous exposures make deter-mination of thickness difficult, but the unit is probably inexcess of 800 feet (250 m) thick.
MICROSCOPIC CHARACTERISTICS OFSEDIMENTARY ROCKS
Mineral Fork Formation
The diamictite consists of variably deformed and alteredpolycrystalline clasts of quartzo-feldspathic gneiss and gran-ite, quartzite, schist, and amphibolite that lie in a variablyrecrystallized, micaceous matrix. Feldspar grains withinclasts are variably altered to fine-grained aggregates of mus-covite, quartz, and chlorite. Quartz grains within clasts dis-play undulatory extinction, subgrains, and local recrystalliza-tion. The matrix consists of fine-grained muscovite and chlo-rite, with dispersed, angular to rounded, variably stretchedquartz and altered feldspar grains. Minor iron oxide is com-mon in the matrix, and some samples contain minor second-ary calcite and siderite. Recrystallized quartz and micaaggregates within clasts and preferred orientation of mica andstretched quartz grains in the matrix define cleavage. Shearbands, marked by very fine-grained material with high strain,occur at acute angles to cleavage in some samples, and recordlocalized simple shear. Strain shadows filled with mica andquartz fibers occur around some clasts and larger grains in thematrix. These alteration and deformation features in thediamictite are similar to features observed within shear zonesin underlying Archean(?) to Early Proterozoic crystallinebasement rocks (Yonkee, 1992).
Kelley Canyon Formation
Dolomite MemberThis member consists of fine-grained, recrystallized
dolomite with widely dispersed quartz grains. Dolomite crys-tals are generally subequant, have sizes from about 0.005 to
0.01 inches (0.015 to 0.3 mm), and form interlockingmosaics. Some samples contain spaced seams enriched inquartz, mica, and iron oxides that define a spaced cleavage.
Slate MemberSlate and argillite of this member are composed of a mix-
ture of fine-grained primary quartz, mica, and feldspar that sitin a very fine-grained, partly recrystallized matrix. Beddingis defined at the microscopic scale by variations in grain sizeand matrix content. Cleavage crosscuts bedding and isdefined microscopically by closely spaced, thin seams thatare enriched in mica and iron oxides, and depleted in quartz.These cleavage seams bound less-deformed lozenges of rock.Some mica grains appear recrystallized along seams, andmany quartz grains have sutured boundaries adjacent toseams that are probably related to dissolution. Within thelozenges, mica varies from undeformed to kinked, and quartzgrains show limited undulatory extinction.
The Geology of Antelope IslandMiscellaneous Publication 00-1 41
Figure 5a. Diamictite of the Mineral Fork Formation with largeboulder of quartzite supported in dark, micaceous matrix. Mesozoiccleavage deflects around relatively undeformed quartzite boulder.Granitic and gneiss clasts derived from basement rocks are flattenedand altered such that they are difficult to distinguish from the matrix.Backpack (middle left) for scale. Photograph taken on ElephantHead.
Figure 5b. Relatively undeformed diamictite of the Mineral ForkFormation east of Elephant Head. Clasts in this photograph rangeto about 8 inches (20 cm) in diameter.
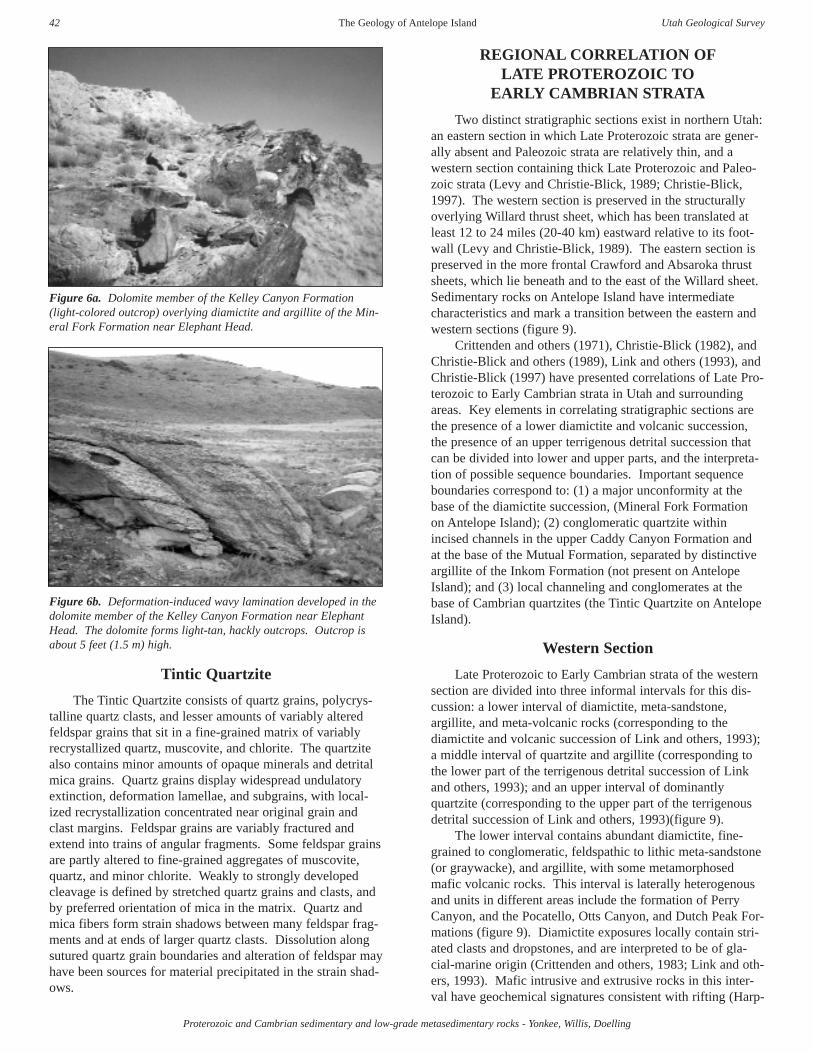
Proterozoic and Cambrian sedimentary and low-grade metasedimentary rocks - Yonkee, Willis, Doelling
Tintic Quartzite
The Tintic Quartzite consists of quartz grains, polycrys-talline quartz clasts, and lesser amounts of variably alteredfeldspar grains that sit in a fine-grained matrix of variablyrecrystallized quartz, muscovite, and chlorite. The quartzitealso contains minor amounts of opaque minerals and detritalmica grains. Quartz grains display widespread undulatoryextinction, deformation lamellae, and subgrains, with local-ized recrystallization concentrated near original grain andclast margins. Feldspar grains are variably fractured andextend into trains of angular fragments. Some feldspar grainsare partly altered to fine-grained aggregates of muscovite,quartz, and minor chlorite. Weakly to strongly developedcleavage is defined by stretched quartz grains and clasts, andby preferred orientation of mica in the matrix. Quartz andmica fibers form strain shadows between many feldspar frag-ments and at ends of larger quartz clasts. Dissolution alongsutured quartz grain boundaries and alteration of feldspar mayhave been sources for material precipitated in the strain shad-ows.
REGIONAL CORRELATION OFLATE PROTEROZOIC TO
EARLY CAMBRIAN STRATA
Two distinct stratigraphic sections exist in northern Utah:an eastern section in which Late Proterozoic strata are gener-ally absent and Paleozoic strata are relatively thin, and awestern section containing thick Late Proterozoic and Paleo-zoic strata (Levy and Christie-Blick, 1989; Christie-Blick,1997). The western section is preserved in the structurallyoverlying Willard thrust sheet, which has been translated atleast 12 to 24 miles (20-40 km) eastward relative to its foot-wall (Levy and Christie-Blick, 1989). The eastern section ispreserved in the more frontal Crawford and Absaroka thrustsheets, which lie beneath and to the east of the Willard sheet.Sedimentary rocks on Antelope Island have intermediatecharacteristics and mark a transition between the eastern andwestern sections (figure 9).
Crittenden and others (1971), Christie-Blick (1982), andChristie-Blick and others (1989), Link and others (1993), andChristie-Blick (1997) have presented correlations of Late Pro-terozoic to Early Cambrian strata in Utah and surroundingareas. Key elements in correlating stratigraphic sections arethe presence of a lower diamictite and volcanic succession,the presence of an upper terrigenous detrital succession thatcan be divided into lower and upper parts, and the interpreta-tion of possible sequence boundaries. Important sequenceboundaries correspond to: (1) a major unconformity at thebase of the diamictite succession, (Mineral Fork Formationon Antelope Island); (2) conglomeratic quartzite withinincised channels in the upper Caddy Canyon Formation andat the base of the Mutual Formation, separated by distinctiveargillite of the Inkom Formation (not present on AntelopeIsland); and (3) local channeling and conglomerates at thebase of Cambrian quartzites (the Tintic Quartzite on AntelopeIsland).
Western Section
Late Proterozoic to Early Cambrian strata of the westernsection are divided into three informal intervals for this dis-cussion: a lower interval of diamictite, meta-sandstone,argillite, and meta-volcanic rocks (corresponding to thediamictite and volcanic succession of Link and others, 1993);a middle interval of quartzite and argillite (corresponding tothe lower part of the terrigenous detrital succession of Linkand others, 1993); and an upper interval of dominantlyquartzite (corresponding to the upper part of the terrigenousdetrital succession of Link and others, 1993)(figure 9).
The lower interval contains abundant diamictite, fine-grained to conglomeratic, feldspathic to lithic meta-sandstone(or graywacke), and argillite, with some metamorphosedmafic volcanic rocks. This interval is laterally heterogenousand units in different areas include the formation of PerryCanyon, and the Pocatello, Otts Canyon, and Dutch Peak For-mations (figure 9). Diamictite exposures locally contain stri-ated clasts and dropstones, and are interpreted to be of gla-cial-marine origin (Crittenden and others, 1983; Link and oth-ers, 1993). Mafic intrusive and extrusive rocks in this inter-val have geochemical signatures consistent with rifting (Harp-
The Geology of Antelope Island Utah Geological Survey42
Figure 6a. Dolomite member of the Kelley Canyon Formation(light-colored outcrop) overlying diamictite and argillite of the Min-eral Fork Formation near Elephant Head.
Figure 6b. Deformation-induced wavy lamination developed in thedolomite member of the Kelley Canyon Formation near ElephantHead. The dolomite forms light-tan, hackly outcrops. Outcrop isabout 5 feet (1.5 m) high.

Proterozoic and Cambrian sedimentary and low-grade metasedimentary rocks - Yonkee, Willis, Doelling
er and Link, 1986). Although the Utah mafic rocks have notbeen dated, similar mafic rocks in other parts of theCordillera are dated at 780 to 720 Ma (Armstrong and others,1982; Devlin and others, 1988). The bottom of the interval isgenerally not exposed, but near Willard Peak, Utah, diamic-tite rests unconformably on metamorphic rocks of the EarlyProterozoic Facer Formation. Marine argillite, carbonate, andcalcareous siltstone of the Kelley Canyon Formation form theupper part of this interval, and may record sea level rise fol-lowing glaciation. Overall, this interval probably recordsglacially influenced, dominantly marine sedimentation in sub-siding, locally fault-bounded rift basins (Christie-Blick andothers, 1989; Link and others, 1993), followed by glacialmelting and sea level rise.
The middle interval consists of Late Proterozoic quartziteand argillite. Interbedded fluvial to shallow marine quartziteand argillite of the Caddy Canyon and Papoose Creek Forma-tions form the lower part of the interval (Christie-Blick andothers, 1989). Shallow marine argillite and micaceous, fine-grained quartzite of the Inkom Formation form a distinctivemarker in the middle part of this interval, and may record asecond pulse of glaciation, possibly at about 600 Ma(Christie-Blick, 1997). Distinctive gray-red to purple-red, flu-vial quartzite with local channels in the Mutual Formation
provide a regional marker in the upper part of the interval.The interval is locally capped by a thin sequence of sandstoneand basalt flows emplaced at 580 Ma (Bond and others,1985). This interval probably records sedimentation in riftbasins, prior to final formation of a passive margin (Link andothers, 1993).
The upper interval consists of latest Proterozoic(?) toEarly Cambrian shallow marine to fluvial quartzite andquartz-pebble conglomerate. Units in this interval have ratheruniform lithologies, but are referred to by a variety of names,including the Geertsen Canyon, Camelback Mountain, andProspect Mountain Quartzites. Quartzite layers are generallyfine- to coarse-grained, arkosic near the base of the interval,and grade into widespread pebbly conglomerate layers. Scol-ithus tubes occur locally within the upper part of the interval(Crittenden and others, 1971). Locally a conglomerate marksthe base of the interval where it channels into the underlyingMutual Formation, corresponding to an interpreted sequenceboundary (Link and others, 1993). The quartzite interval isoverlain by Middle Cambrian carbonate and shale. Depositionof this quartzite interval and thick overlying Cambrian stratamay mark onset of passive margin sedimentation (Link andothers, 1993).
Eastern Section
The eastern section is much thinner than the western sec-tion, but similarities between the two are apparent and theeastern section can be divided into three corresponding inter-vals. The eastern section includes: a rarely preserved, thin,lower interval of diamictite; a rarely preserved, thin, middleinterval of reddish to purplish quartzite; and a widespreadupper interval of quartzite.
The lower interval is represented by the Mineral ForkFormation, which is only locally preserved in the centralWasatch Range. This formation occurs as isolated lenses,locally on striated surfaces, and appears to be of glacial origin(Christie-Blick, 1983; Christie-Blick, 1997). This interval ismuch thinner, but lithologically similar to the lower part ofthe diamictite interval in the western section.
The middle interval is locally represented by a very thin
The Geology of Antelope IslandMiscellaneous Publication 00-1 43
Figure 7. Well-defined bedding within the slate member of the Kel-ley Canyon Formation exposed on north end of Daddy Stump Ridge.Mallet was used by early settlers to split slate for roofing and flag-stone.
Figure 8. Pebbly horizons in Tintic Quartzite east of Buffalo Point.Quartz pebbles are flattened in the plane of cleavage.
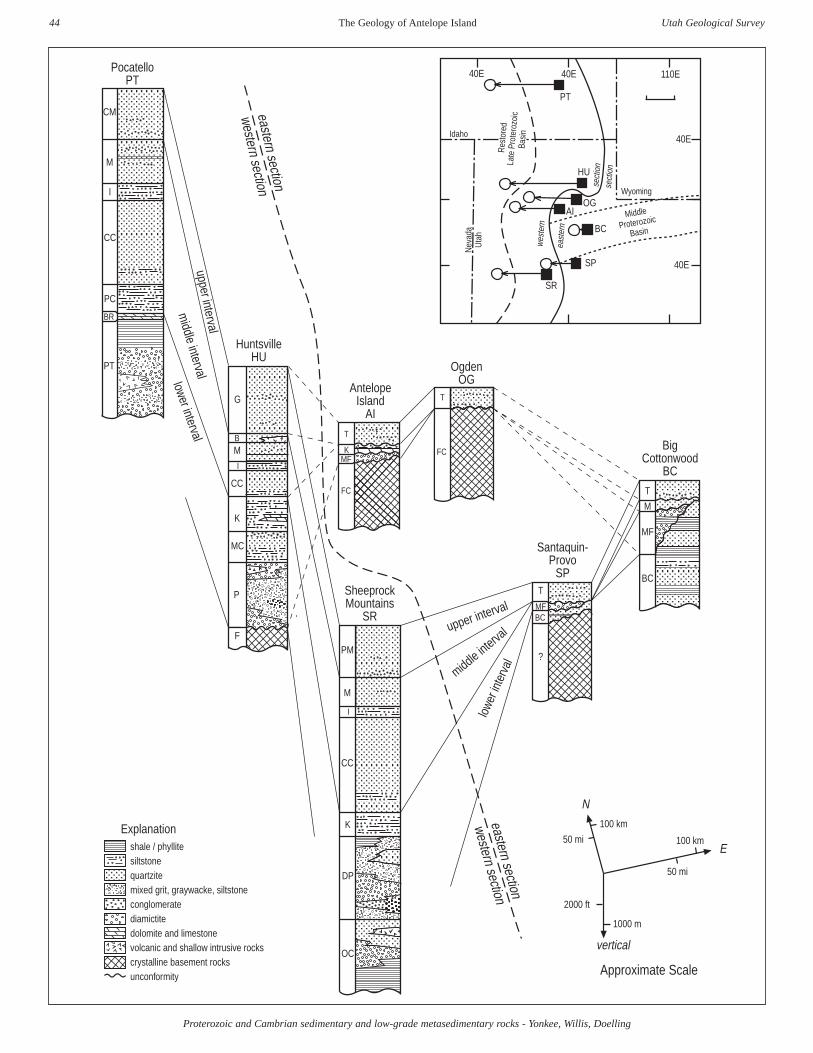
Proterozoic and Cambrian sedimentary and low-grade metasedimentary rocks - Yonkee, Willis, Doelling
The Geology of Antelope Island Utah Geological Survey44
CM
M
I
CC
PC
BR
PT
MB
G
K
CC
I
MC
P
F
T
M
MF
BCT
MF
?
BC
T
K
FC
MF
T
FC
I
PM
M
CC
K
DP
OC
PocatelloPT
HuntsvilleHU
AntelopeIsland
AI
OgdenOG
Santaquin-Provo
SP
BigCottonwood
BC
SheeprockMountains
SR
eastern section
western section
eastern section
western section
upper interval
middle interval
lowe
r int
erva
l
upper interval
middle intervallower interval
shale / phyllitesiltstonequartzitemixed grit, graywacke, siltstoneconglomeratediamictitedolomite and limestonevolcanic and shallow intrusive rockscrystalline basement rocksunconformity
Explanation
Approximate Scale
N
E100 km
50 mi
100 km
50 mi
1000 m
2000 ft
vertical
110E40E40E
40E
40E
Nev
ada
Uta
h
Idaho
Wyoming
Middle
Proterozoic
Basin
Res
tore
dLa
te P
rote
rozo
icBa
sin
PT
HU
OGAI
BC
SP
SR
wes
tern
sect
ion
sect
ion
east
ern
Proterozoic and Cambrian sedimentary and low-grade metasedimentary rocks - Yonkee, Willis, Doelling
stratigraphic section of red to purple quartzite, conglomerate,and variegated shale, which is restricted to the centralWasatch Range. These rocks were assigned to the MutualFormation by Crittenden and others (1952). This interval ismuch thinner, but lithologically similar to part of the middleinterval in the western section.
An upper interval of quartzite and quartz-pebble con-glomerate is widespread in the eastern section. This intervalcorresponds to the Early Cambrian Tintic Quartzite and isoverlain by Middle Cambrian shale and carbonate. The inter-val is lithologically similar to, but thinner than, the upperquartzite interval in the western section.
Correlation with Antelope Island
Metasedimentary and sedimentary rocks preserved onAntelope Island lie structurally just below the Willard thrustsheet (Yonkee, 1992). These rocks are transitional betweenrocks of the eastern and western sections and were assignedto the Mineral Fork Formation, Kelley Canyon Formation,and Tintic Quartzite by Doelling and others (1990).
Diamictite of the Mineral Fork Formation on AntelopeIsland is lithologically similar to, and regionally correlatedwith, the lower part of the diamictite interval preserved in thewestern section and locally in the eastern section. Diamictiteexposed on Antelope Island and in the Willard thrust sheet(western section) contain abundant granitic and rare but dis-tinctive chrome-green quartzite clasts, consistent with a com-mon source area. The thickness of the diamictite interval onAntelope Island, however, is less than 200 feet (60 m),whereas the thickness of the equivalent formation of PerryCanyon in the Willard thrust sheet is locally greater than3,300 feet (1,000 m) (figure 9) (Crittenden and others, 1983;Christie-Blick, 1985).
Dolomite, silty dolomite, slate, argillite, and fine-grained
quartzite of the Kelley Canyon Formation exposed on Ante-lope Island are about 70 to 260 feet (20 to 80 m) thick, andprobably correlate with the upper part of the lower interval ofthe western section, which is about 3,000 feet (900 m) thickin the Willard sheet (figure 9). Rocks of similar lithology arenot exposed in the eastern section in the Wasatch Range.
Strata equivalent to the middle interval have not beenidentified on Antelope Island. This interval, however, is about3,000 to 4,000 feet (900 to 1,200 m) thick in the Willardthrust sheet of the western section.
The Tintic Quartzite unconformably overlies the KelleyCanyon Formation on Antelope Island, and correlates withthe previously described upper quartzite intervals of the west-ern and eastern sections. The original thickness on AntelopeIsland is uncertain, but may have been intermediate betweenpreserved thicknesses of about 4,000 feet (1,200 m) in thewestern section and about 1,500 feet (450 m) in the easternsection.
DISCUSSION
Late Proterozoic strata thicken rapidly westward betweenthe restored positions of the Antelope Island and theHuntsville areas, and between the restored positions of theSantaquin-Provo and Sheeprock Mountain areas (figure 9).Late Proterozoic strata are absent or very thin in most of theWasatch Range to the east, but up to 15,000 feet (4,500 m) ofLate Proterozoic strata accumulated to the west. The zone ofrapid westward thickening marks the eastern boundary of aregional basin that initially formed during the Late Protero-zoic (Levy and Christie-Blick, 1989). Basalt flows in thelower part of the interval and fault-bounded sub-basins areconsistent with subsidence and deposition following an earlyperiod of rifting, probably at about 750 Ma (Link and others,1993). This early rift basin probably formed prior to Cambri-an rifting and development of a passive margin, and had anirregular boundary with a basement promontory near the lati-tude of Antelope Island.
The Early Cambrian quartzite interval also thickenstowards the west, but is more widespread than the Late Pro-terozoic units, marking an enlargement in the area of sedi-mentation from the Late Proterozoic to the Early Cambrian(figure 9). Basalt flows just below and a sequence boundaryat the base of the quartzite interval may mark a renewed peri-od of rifting at about 550 Ma, followed by rapid subsidenceand development of a passive margin along the western mar-gin of North America during the Cambrian (Link and others,1993).
The restored positions of the eastern and western sectionsindicate a basement promontory existed at the latitude of thecentral Wasatch Mountains (from the Ogden to the Santaquin-Provo sections) prior to Mesozoic thrusting (figure 9). Thisregion was the site of localized basement imbrication duringthe Sevier orogeny (Yonkee, 1992). The Willard thrust sheetcarried the thicker western section and a major thrust rampformed near the transition to the thinner eastern section. Ante-lope Island lies near this transition and experienced bothbasement imbrication and footwall deformation near a proba-ble ramp in the Willard thrust. Thus the configuration of thesedimentary wedge appears to have had important effects on
The Geology of Antelope IslandMiscellaneous Publication 00-1 45
Figure 9. Regional correlation of Late Proterozoic and EarlyCambrian stratigraphy. Inset shows: (1) current locations of areas,filled boxes: (2) restored positions after effects of Tertiary normalfaulting and Mesozoic thrusting have been removed, open circles;and (3) location of Middle to early Late Proterozoic Big Cotton-wood basin, dotted line. Dashed line on insert and fence diagramsshows approximate restored boundary between thin eastern sectionand thick western section. Units on the fence diagram are: Upperinterval, CM=Camelback Mountain Quartzite, G=Geertson CanyonQuartzite, PM=Prospect Mountain Quartzite, T=Tintic Quartzite;Middle interval, B=Browns Hole Formation, M=Mutual Formation,I=Inkom Formation, CC=Caddy Canyon Quartzite, PC=PapooseCreek Formation; and Lower interval, BR=Blackrock Canyon Lime-stone, PT=Pocatello Formation, K=Kelley Canyon Formation,MC=Maple Canyon Formation, P=formation of Perry Canyon,MF=Mineral Fork Formation, DP=Dutch Peak Formation,OC=Otts Canyon Formation. Other units are F=Facer Formation,BC=Big Cottonwood Formation, FC=Farmington Canyon Com-plex. Based on data from: Pocatello, Idaho (PT) (Crittenden andothers, 1971); Huntsville, Utah (HU) (Crittenden and others, 1971;Crittenden and Sorensen, 1985); Sheeprock Mountains (SR)(Christie-Blick, 1982); Antelope Island (AI) (this study; Doellingand others, 1990); Ogden, Utah (OG) (Eardley, 1944); and BigCottonwood Canyon (BC) (Crittenden and others, 1952; Christie-Blick, 1985); Santaquin-Provo, Utah (SP) (Hintze, 1962, 1978).

Proterozoic and Cambrian sedimentary and low-grade metasedimentary rocks - Yonkee, Willis, Doelling
development of Mesozoic thrust-related structures.
ACKNOWLEDGMENTS
Mark Jensen, John Hand, and Hellmut Doelling (co-author) measured the section described herein. NicholasChristie-Blick, Paul Link, and Martin Sorensen provided sug-gestions on nomenclature for Proterozoic rocks on AntelopeIsland. Doug Sprinkel and Jon King reviewed this manu-script and provided many helpful suggestions.
REFERENCES
Armstrong, R.L., Eisbacher, G.H., and Evans, P.D., 1982, Ageand stratigraphic-tectonic significance of Proterozoic dia-base sheets, Mackenzie Mountains, northwestern Canada:Canadian Journal of Earth Sciences, v. 19, p. 316-323.
Bond, G.C., Christie-Blick, Nicholas, Kominz, M.A., andDevlin, W.J., 1985, An early Cambrian rift to post-rifttransition in the Cordillera of western North America:Nature, v. 316, p. 742-745.
Christie-Blick, Nicholas, 1982, Upper Proterozoic and LowerCambrian rocks of the Sheeprock Mountains, Utah,Regional correlation and significance: Geological Societyof America Bulletin, v. 93, p. 735-750.
Christie-Blick, Nicholas, 1983, Glacial-marine and subglacialsedimentation, Upper Proterozoic Mineral Fork Forma-tion, Utah, in Molnia, B.F., editor, Glacial-marine Sedi-mentation: New York, Plenum Press, p. 703-775.
Christie-Blick, Nicholas, 1985, Upper Proterozoic glacial-marine and subglacial deposits at Little Mountain, Utah:Brigham Young University Geology Studies, v. 32, p. 9-18.
Christie-Blick, Nicholas, 1997, Neoproterozoic sedimentationand tectonics in west-central Utah, in Link, P.K., andKowallis, B.J., editors, Proterozoic to Recent stratigra-phy, tectonics, and volcanology, Utah, Nevada, southernIdaho and central Mexico: Brigham Young UniversityGeology Studies, v. 42, part 1, p. 1-30.
Christie-Blick, Nicholas, Mount, J.F., Levy, Marjorie, Signor,P.W., and Link, P.K., 1989, Late Proterozoic and Cambri-an tectonics, sedimentation, and record of Metazoan radi-ation in the Western United States: 28th InternationalGeological Congress Field Trip Guidebook T331, 113 p.
Crittenden, M.D., Jr., Sharp, B.J., and Calkins, F.C., 1952,Geology of the Wasatch Mountains east of Salt LakeCity, Parleys Canyon to Traverse Range, in R.E. Marsell,editor, Geology of the Central Wasatch Mountains, Utah:Utah Geological Society Guidebook, no. 8, p. 1-37.
Crittenden, M.D., Jr., Christie-Blick, Nicholas, and Link,P.K., 1983, Evidence for two pulses of glaciation duringthe late Proterozoic in northern Utah and southeasternIdaho: Geological Society of America Bulletin, v. 94, p.437-450.
Crittenden, M.D., Jr., Schaeffer F.E., Trimble, D.E., andWoodward, L.A., 1971, Nomenclature and correlation ofsome upper Precambrian and basal Cambrian sequencesin western Utah and southeastern Idaho: Geological Soci-ety of America Bulletin, v. 82, p. 581-602.
Crittenden, M.D., Jr., and Sorensen, M.L., 1985, Geologicmap of the Mantua quadrangle and part of the Willardquadrangle, Box Elder, Weber, and Cache Counties,Utah: U.S. Geological Survey Map I-1605, scale1:24,000.
Devlin, W.J., Brueckner, H.K., and Bond, G.C., 1988, Newisotopic data and a preliminary age for volcanics near thebase of the Windemere Supergroup, northeastern Wash-ington, U.S.A.: Canadian Journal of Earth Sciences, v.25, p. 1906-1911.
Doelling, H.H., Willis, G.C., Jensen, M.E., Hecker, Suzanne,Case, W.F., and Hand, J.S., 1990, Geologic map of Ante-lope Island, Davis County, Utah: Utah Geological andMineral Survey Map 127, 27 p., scale 1:24,000.
Eardley, A.J., 1944, Geology of the north-central WasatchMountains, Utah: Geological Society of America Bul-letin, v. 55, p. 819-894.
Harper, G.D., and Link, P.K., 1986, Geochemistry of UpperProterozoic rift-related volcanics, northern Utah andsoutheastern Idaho: Geology, v. 14, p. 864-867.
Hintze, L.F., 1962, Precambrian and Lower Paleozoic rocksof north central, in Hintze, L.F., editor, Geology of thesouthern Wasatch Mountains, Utah: Brigham Young Uni-versity Geology Studies v. 9, part 1, p. 8-16.
Hintze, L.F., 1978, Geologic map of the Y Mountains areaeast of Provo, Utah: Brigham Young University GeologyStudies Special Publication 5.
Hintze, L.F., 1988, Geologic history of Utah: Brigham YoungUniversity Geology Studies Special Publication 7, 202 p.
Larsen, W.N., 1957, Petrology and structure of AntelopeIsland, Davis County, Utah: Salt Lake City, University ofUtah, Ph.D dissertation, 142 p., map scale 1:24,000.
Levy, Marjorie, and Christie-Blick, Nicholas, 1989, Pre-Mesozoic palinspastic reconstruction of the eastern GreatBasin (western United States): Science, v. 245, p. 1454-1462.
Link, P.K., Christie-Blick, Nicholas, Stewart, J.M.G., Devlin,W.J., and Levy, Marjorie, 1993, Late Proterozoic strata ofthe United States Cordillera, in Reed, J.C., Bickford,M.E., Houston, R.S., Link, P.K., Rankin, D.W., Sims,P.K., and Van Schmus, W.R., editors, Precambrian: Con-terminous U.S.: Geological Society of America, TheGeology of North America, v. C-2, p. 537-595.
Yonkee, W.A., 1992, Basement-cover relations, Sevier oro-genic belt, northern Utah: Geological Society of AmericaBulletin, v. 104, no. 3, p. 280-302.
The Geology of Antelope Island Utah Geological Survey46

Proterozoic and Cambrian sedimentary and low-grade metasedimentary rocks - Yonkee, Willis, Doelling
APPENDIX. Measured section through Upper ProterozoicKelley Canyon and Mineral Fork Formations
on Antelope Island
Measured east of Mormon Rocks on the west-facingridge about 0.25 mile (0.4 km) east of the peak marked 5,576feet (SE1/4, SE1/4, section 19, T. 3 N., R. 3 W., AntelopeIsland 7.5' quadrangle). Measured November 2, 1987.
Tintic Quartzite (not measured)The upper contact of the slate member of the Kelley
Canyon Formation is poorly exposed; the slate member isoverlain by quartzite rubble.
Kelley Canyon Formation
Unit Thicknessfeet (meters)
Slate member(note: the primary term argillite is used in this measuredsection because slaty cleavage is only weakly developed)
6 Interbedded argillite and fine-grained quartzite; pale-green (10G6/2), very dusky red-purple (5RP2/2) anddark-gray (N3); laminated to thin-bedded; weathers tosharp, platy ledges; cleavage is N. 71° W., 25° NE.
79.0 (24.1)5 Covered slope; float is from unit 6. 25.0 (7.5)
4 Argillite, with minor, very thin interbeds of dolomite andcalcareous argillite; very dusky red-purple (5RP2/2) tograyish-red-purple (5RP4/2); yellowish-gray (5Y7/2)weathered; thinly laminated to thin-bedded; some bedscontain greenish reduction spots; light-brown (5YR 6/4)dolomitic beds increase in abundance above 40 feet (12m) from base of unit and become dominant near top ofunit; cleavage is N. 67° W., 14° NE. 79.0 (23.7)
3 Interbedded silty dolomite and argillite; greenish-gray(5GY6/1) weathered; finely laminated to thin-bedded;dolomitic layers slightly more resistant and stand as thinribs on cliff; contains hematite, malachite, and minorchalcopyrite and pyrite coating. 9.5 (2.9)
2 Interbedded dolomite and argillite; pinkish-gray(5YR8/1); weathers grayish orange (10YR7/4) to grayishred (5R4/2); thinly laminated to thin-bedded (laminationsless than 0.04 inch to about 3 inches [0.1-8 cm] thick);contains hematite blebs in dolomite beds. 12.3 (3.7)
Total thickness of slate member 204.8 (61.4)
Dolomite member1 Dolomite; pinkish-gray (5YR8/1); weathers to grayish
orange (10YR7/4); very finely crystalline; thin to medi-um wavy bedding; forms massive cliffs; appears finelyfractured; contains hematite blebs, some sandy beds, anddendritic pyrolusite; lower contact is sharp, with 2 ormore feet (0.6+ m) of local relief.
27.4 (8.2)
Total thickness of dolomite member 27.4 (8.2)Total thickness of Kelley Canyon Formation
232.2 (69.7)
Mineral Fork Formation
Unit Thicknessfeet (meters)
7 Interbedded argillite and quartzite; yellowish-gray(5Y7/2) to moderate yellowish-green (10GY6/2); weath-ers grayish yellow green (5GY7/2) to medium dark gray(N4); forms recess in cliff; beds in upper part of unit arethicker and quartzitic. 3.7 (1.1)
6 Quartzite; grayish-black (N2); weathers slightly lighter;medium- to coarse-grained; fines upward; indistinctlycross-bedded; forms a resistant blocky ledge. 1.7 (0.51)
5 Argillite; dark-gray (N3) with moderate-greenish-yellow(10Y7/2) silty partings; noncalcareous; appears to containripple marks; platy weathering. 2.1 (0.63)
4 Quartzite; medium-dark-gray (N4) and medium-gray(N5); weathers grayish orange (10YR7/4); fine-grained;well-indurated; contains clasts mostly less than 1 inch(2.5 cm) in diameter; thick-bedded; blocky; forms a smallledge; some clasts appear flattened; may be slightly chlo-ritic. 2.2 (0.66)
3 Diamictite; yellowish-gray (5Y7/2) weathered with ran-dom rust-colored spots on surface; matrix is very coarsegrained to gritty; well-indurated; clasts mostly subangularwith diameters up to 18 inches (45 cm); gneissic togranitic clasts are subangular; quartzite clasts are wellrounded; gneissic clast boundaries are indistinct; someclasts appear elongated; unbedded to indistinct bedding;forms weaker ledges than underlying unit; near top thisunit becomes platy and less resistant; contains manganeseand iron oxide coating along fractures. 9.7 (2.9)
2 Diamictite; yellowish-gray (5Y7/2) weathered; matrix ismedium grained to gritty (coarser than underlying unit);matrix supported; clasts range up to 9 inches (23 cm) inmaximum dimension; clasts and matrix are very poorlysorted to unsorted and clasts and matrix grade into eachother; forms resistant ledges; contains patches of reddishiron staining on surface. 5.7 (1.7)
1 Diamictite; medium-dark gray (N4) fresh; olive-black(5Y2/1) weathered; very fine- to fine-grained matrix;noncalcareous; clasts are mostly subangular and range insize from grit to 6 inches (21 cm); clasts consist ofquartzite (various colors), pegmatitic granitic gneiss, andred granitic gneiss; some clasts show chloritization; well-indurated; contains rusty minerals (possibly siderite) assmall blebs; rock shows evidence of shearing; lower con-tact is a sharp undulating surface locally showing up to 3feet (1 m) of relief; joints noted in underlying unit passacross contact without deviation, but the gneissic folia-tion stops at the contact. 1.5 (.45)
Total thickness of Mineral Fork Formation26.6 (8.0)
Farmington Canyon ComplexGranitic gneiss; blackish-red (5R2/2) fresh; grayish red(5R4/2) and dark reddish brown (10R3/4) on weatheredsurfaces; medium-grained; moderately foliated; massive;resistant; forms craggy outcrops; has local chloritic alter-ation; cut by fractures with orientations: N. 2° E., 62° E;N. 10° W., 80° NE; and N. 60° E., 48° NW; contact withoverlying diamictite is nonconformable.
The Geology of Antelope IslandMiscellaneous Publication 00-1 47

The Geology of Antelope Island Utah Geological Survey48

ABSTRACT
Stratified Tertiary rocks are exposed in two areas onAntelope Island. They are more than 2,000 feet (600 m)thick along the southeast side, and are up to 760 feet (230 m)thick at the north end. In addition, a few small felsic dikes ofassumed Tertiary age cut Precambrian rock near the south endof the island.
On the southeast side, Tertiary strata are divided intothree units: lower and upper members of a conglomeraticunit, and the Salt Lake Formation. The lower member con-sists of at least 510 feet (153 m) of: (1) basal conglomeratewith carbonate and quartzite clasts up to 11 feet (3.4 m) indiameter in a matrix of gritstone derived from the underlyingPrecambrian Farmington Canyon Complex, (2) conglomeratecomposed of metamorphic clasts and matrix from the Farm-ington Canyon, and (3) stratified bentonitic mudstone. Theupper member consists of at least 140 feet (42 m) of polymic-tic conglomerate with carbonate, quartzite, high-grade meta-morphic, and volcanic clasts interbedded with thin beds oflacustrine limestone and bentonitic mudstone. The Salt LakeFormation consists of at least 1,800 feet (550 m) of volcanicash, tuffaceous marl, mudstone, and minor conglomerate.
The strata at the north end of the island consist of con-glomerate and breccia with coarse, angular clasts of shale,limestone, dolomite, and quartzite, that are interbedded withthick beds of volcanic ash, and are mapped as Salt Lake For-mation.
Regional correlation suggests that the lower conglomer-atic member is late Paleocene to middle Eocene in age.Rounded volcanic clasts and stratified, biotite-bearing, ben-tonitic mudstone from the upper conglomerate member yield-ed biotite K-Ar ages of 42.9±1.7, 49.2±1.9, and 38.8±1.5 Ma(late Eocene), and were probably deposited during the lateEocene to middle Oligocene. Strata mapped as Salt LakeFormation are probably between 11 and 8 million years oldbased on chemical correlations of tephra samples using elec-tron microprobe analyses. The Salt Lake Formation stratapredate most structural tilting of the island.
Lithologic variations in the sedimentary clasts indicatethat most were derived from the lower plate of the Willardthrust fault. The Willard thrust, which was above rocks nowexposed on the island, may have formed a lateral ramp fromCambrian rocks near the north end of the island to Mississip-
pian rocks near the south end.
INTRODUCTION
Tertiary sedimentary and volcanic outcrops are scatteredthroughout northern Utah (figure 1). On Antelope Island,Tertiary strata are preserved in the southeast part of theisland, and on the north tip (figure 2). In addition, a fewsmall felsic dikes of assumed Tertiary age are exposed nearthe south tip of the island. In this study we measured,described, and attempted to date the Tertiary rocks and placethem in the context of the Tertiary geologic evolution ofnorthern Utah.
Data presented here were gathered as part of detailedgeologic mapping in 1987, 1988, and 1990 by the Utah Geo-logical Survey (Doelling and others, 1990) to provide geolog-ic information to the Utah Division of Parks and Recreationfor developing a master plan for Antelope Island State Park.
Antelope Island is a mountain range in the south GreatSalt Lake. The island is about 5 miles (8 km) wide and 15miles (24 km) long, and 15 miles (24 km) west of theWasatch Range of north Utah (figure 1). Exposed rocks areprimarily Precambrian high-grade metamorphic and intrusiverocks of the Farmington Canyon Complex (Yonkee, Willis,and Doelling, this volume [a]), overlain by about 1,000 feet(300 m) of Late Proterozoic and Cambrian strata (Yonkee,Willis, and Doelling, this volume [b]). Low-grade metamor-phism and related semi-brittle deformation associated withCretaceous thrust faulting deformed the Precambrian andCambrian rocks (Doelling and others, 1990; Yonkee, 1992).Locally, Tertiary strata were deposited on a major erosionalsurface cut across the older rocks. The island is part of astructural block that is bounded by normal faults of the Basinand Range physiographic province, and was tilted up to 45degrees eastward during late Cenozoic extension (figure 3).Adjacent basins are filled with as much as 15,000 feet (4,600m) of upper Tertiary and Quaternary sedimentary and vol-canic rock (Bortz and others, 1985). Much of the island ismantled by late Pleistocene Lake Bonneville lacustrinedeposits and post-Bonneville alluvial deposits.
Previous Work
Bywater and Barlow (1909) prepared a generalized geo-
TERTIARY ROCKS OF ANTELOPE ISLAND, DAVIS COUNTY, NORTHERN UTAH
byGrant C. Willis and Mark E. Jensen1
Utah Geological Survey
1now at Utah Department of Environmental Quality, Division of Drinking WaterP.O. Box 144830, 150 N., 1950 W.,Salt Lake City, Utah 84114-4830
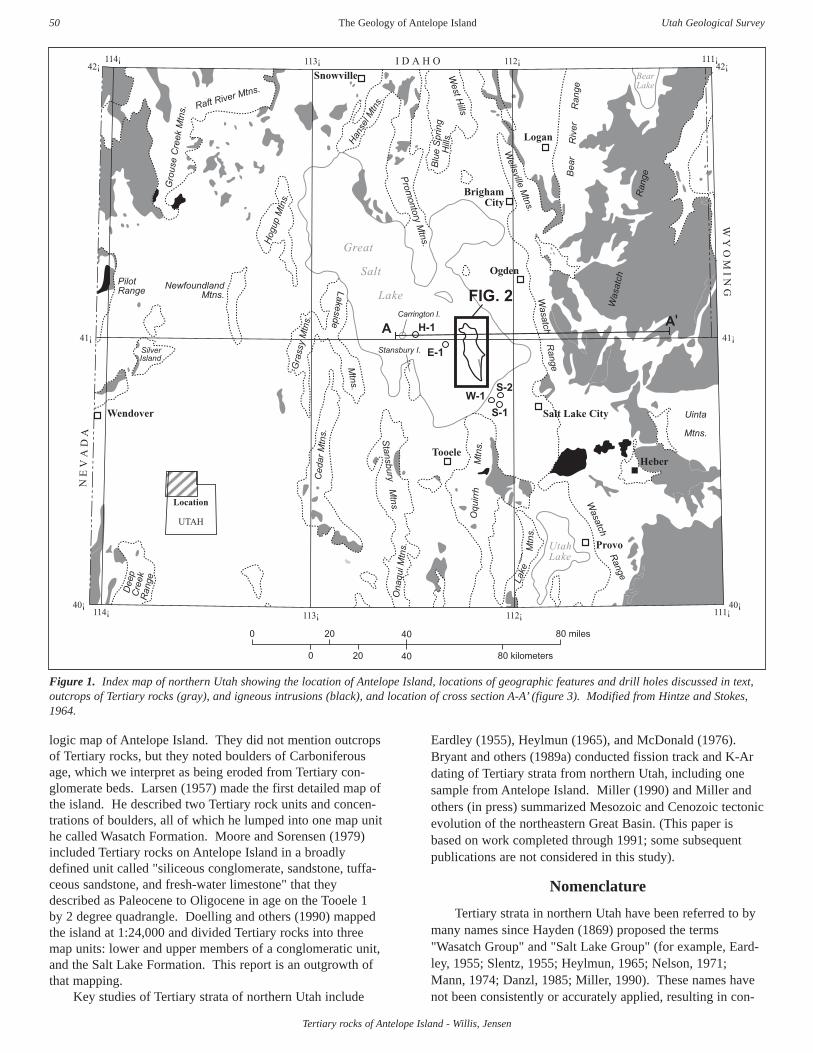
Tertiary rocks of Antelope Island - Willis, Jensen
logic map of Antelope Island. They did not mention outcropsof Tertiary rocks, but they noted boulders of Carboniferousage, which we interpret as being eroded from Tertiary con-glomerate beds. Larsen (1957) made the first detailed map ofthe island. He described two Tertiary rock units and concen-trations of boulders, all of which he lumped into one map unithe called Wasatch Formation. Moore and Sorensen (1979)included Tertiary rocks on Antelope Island in a broadlydefined unit called "siliceous conglomerate, sandstone, tuffa-ceous sandstone, and fresh-water limestone" that theydescribed as Paleocene to Oligocene in age on the Tooele 1by 2 degree quadrangle. Doelling and others (1990) mappedthe island at 1:24,000 and divided Tertiary rocks into threemap units: lower and upper members of a conglomeratic unit,and the Salt Lake Formation. This report is an outgrowth ofthat mapping.
Key studies of Tertiary strata of northern Utah include
Eardley (1955), Heylmun (1965), and McDonald (1976).Bryant and others (1989a) conducted fission track and K-Ardating of Tertiary strata from northern Utah, including onesample from Antelope Island. Miller (1990) and Miller andothers (in press) summarized Mesozoic and Cenozoic tectonicevolution of the northeastern Great Basin. (This paper isbased on work completed through 1991; some subsequentpublications are not considered in this study).
Nomenclature
Tertiary strata in northern Utah have been referred to bymany names since Hayden (1869) proposed the terms"Wasatch Group" and "Salt Lake Group" (for example, Eard-ley, 1955; Slentz, 1955; Heylmun, 1965; Nelson, 1971;Mann, 1974; Danzl, 1985; Miller, 1990). These names havenot been consistently or accurately applied, resulting in con-
The Geology of Antelope Island Utah Geological Survey50
Heber
Salt Lake City
Ogden
Logan
BrighamCity
ProvoUtahLake
Great
Salt
Lake
UTAH
Tooele
Snowville
Wendover
Hog
up M
tns.
Bea
r
Riv
er
Ran
ge
Was
atch
Ran
ge
BearLake
Wellsville M
tns.
West H
ills
Blu
e S
prin
gH
ills
Prom
ontory Mtns.
Han
sel M
tns.
Wasatch R
ange
Uinta
Mtns.
Wasatch R
ange
Oqu
irrh
Mtn
s.
Stansbury M
tns.
Lake
Mtn
s.
Ona
qui M
tns.
Ced
ar M
tns.
Stansbury I.
Mtns.
Lakeside
Gra
ssy
Mtn
s.
Gro
use
Cre
ek M
tns.
NewfoundlandMtns.
SilverIsland
Raft River Mtns.
PilotRange
Dee
pC
reek
Ran
ge
111¡114¡ 113¡ 112¡
111¡114¡ 113¡ 112¡
40¡
41¡
42¡
40¡
41¡
42¡
N E
V A
D A
I D A H O
W Y
O M
I N G
Location
0 20
0
40 80 miles
40 80 kilometers20
FIG. 2
H-1
E-1
W-1S-2
S-1
A A'Carrington I.
Figure 1. Index map of northern Utah showing the location of Antelope Island, locations of geographic features and drill holes discussed in text,outcrops of Tertiary rocks (gray), and igneous intrusions (black), and location of cross section A-A’ (figure 3). Modified from Hintze and Stokes,1964.

Tertiary rocks of Antelope Island - Willis, Jensen
fusion. For this reason, many workers have chosen to useinformal lithologic names rather than formal names for thestrata (for example: Heylmun, 1965; Oviatt, 1986; Van Hornand Crittenden, 1987; Doelling and others, 1990; Miller andothers, 1991).
The term "Wasatch Group" was first applied to variegat-ed sandstone and clay in southwest Wyoming that Hayden(1869) considered middle Tertiary in age. The term "WasatchFormation" (Veatch, 1907) is also used. In Utah, WasatchFormation and Group are used interchangeably for dominant-ly coarse clastic strata of assumed late Paleocene to Eoceneage. Typically in northwest Utah west of the Wasatch Range,the lower contact is an angular unconformity cut acrossMesozoic or older strata. East of the Wasatch front, theWasatch Formation typically conformably or disconformablyoverlies conglomerate and conglomeratic sandstone strata ofLate Cretaceous or Paleocene age (Ryder and others, 1976;Bryant and others, 1989b; Franczyk and others, 1990; Yon-kee, 1990, 1992). The upper contact is poorly defined inmost parts of northern Utah.
The term “Salt Lake Group” was used by Hayden (1869)for outcrops in the Morgan Valley area of northeast Utah.The term has since been applied in northern Utah and south-ern Idaho to strata of variable lithology and widely rangingage (Eardley, 1944). As with the Wasatch strata, the terms“formation” and “group” have been used interchangeably. Ingeneral, the Salt Lake Formation refers to lithologically vari-able silicic volcanic, lacustrine, and clastic extensional basinfill of assumed Miocene and Pliocene age. Because manyexposures are poorly dated, the term may have been locallyapplied to Eocene, Oligocene, or Pleistocene rocks.
In northern Utah, the interval between the Wasatch andSalt Lake Formations is represented by various volcanic, vol-caniclastic, clastic, and lacustrine deposits, or by an unconfor-mity. Some of these localized deposits have formal names,whereas most do not.
DESCRIPTION OF TERTIARY ROCKS ONANTELOPE ISLAND
More than 2,000 feet (600 m) of Tertiary rocks crop outon the southeast slope of Antelope Island, and about 760 feet(230 m) crop out on the north tip of the island (figure 2; fig-ure 4). Approximately half of the southeast exposures and allof the north exposures were created during excavation for fillduring the 1970s and 1980s. In many places in the southarea, excavations and later recontouring modified outcrops tothe extent that interpretations are difficult. Outside the exca-vations, Pleistocene Lake Bonneville deposits cover much ofthe Tertiary strata. The following descriptions and correla-tions are from five sections (S1 through S5) measured acrossthe outcrops (figures 2 and 4, and appendix).
Tertiary rocks on the island overlie the PrecambrianFarmington Canyon Complex and the Cambrian TinticQuartzite. The contact is not exposed, except in one smallequivocal location on the north end. However, the contact isprobably an unconformity in most areas rather than a faultsince basal Tertiary conglomerates contain locally derivedmetamorphic clast assemblages, and because the scatteredlocations of Tertiary outcrops would dictate a highly irregular
The Geology of Antelope IslandMiscellaneous Publication 00-1 51
Tsl
BuffaloPoint
0
0 1 2 miles
1 2 kilometers
R. 4 W. R. 3 W.
AITT 0440AITN 0820AITN 0830
5C
C- t
T. 4 N.T. 3 N.
Great
SaltLake
XWf
Zmk
C- t
ElephantHead
Zmk
Zmk
B'TulR
. 4 W
.R
. 3 W
.
Daddy Stum
p Ridge
XWf Zmk WW2
WW1
C- t AITT 0840
T. 3 N.T. 2 N.
B
Approximatecross section
locationsAITT 1020
4AI-81-1Bryantandothers,1989a
AITT 1030
TslTERTIARYSalt Lake Fm.
Unnamed con-glomeratic unit:
--Upper member
--Lower member
CAMBRIANTintic Quartzite
LATE PROTEROZOICKelley Canyon Fm.Mineral Fork Fm.
ARCHEAN(?)--EARLY PROTEROZOICFarmington Canyon Complex
Water well
Measured section location
Sample location
Tertiary outcrops
AITT 1200
3AITT 1220
AITT0700
AITT 1090
Tul
Tuu
?
C- t
XWf
Tsl
Zmk
Tuu
Tul
5
AITT 1200
WW1
XWf
T. 2 N.T. 1 N.
Surficial depositsnot shown
C'
2
1
AIGW0102
AITW0930
dike
Tuu
Tul
N
Figure 2. Simplified bedrock geologic map of Antelope Islandemphasizing Tertiary outcrops (after Doelling and others, 1990).Tertiary outcrops are outlined. Contacts between Tertiary units areshown with dashed lines. Tertiary units are: Tul-lower conglomer-atic member, Tuu-upper conglomeratic member, Tsl-Salt Lake For-mation. Labels S1 to S5 indicate locations of measured sections 1to 5. WW1 and WW2 mark the location of two water wells thatpenetrated Tertiary strata (figure 13). K-Ar, fission track, andtephrochronology sample localities discussed in the text are labeled.Approximate locations of schematic cross sections B-B’ and C-C’(figure 15) are shown.

Tertiary rocks of Antelope Island - Willis, Jensen
fault trace or a near bedding-plane-parallel fault, neither of
which are plausible.
SOUTHEAST EXPOSURES
Outcrops in the southeast area consist primarily of resist-
ant conglomerate beds and small exposures of less-resistant
mudstone, sandstone, and volcanic ash along gullies andwashes. Doelling and others (1990) divided the southeaststrata into three units: (1) conglomerate, breccia, and mud-stone that comprise the lower member of an unnamed con-glomeratic unit; (2) conglomerate with carbonate, quartzite,volcanic, and metamorphic clasts interbedded with mudstone,sandstone, and limestone that comprise the upper member of
The Geology of Antelope Island Utah Geological Survey52
upper
Willard
thrust
upper Ogden thrust
basal thrustW
illardthrust
basal thrust
A A'DurstMtn.
AntelopeIsland
WasatchRange
CarringtonIsland
Z
Z
East Gre
atSalt
Lake
normal fa
ult
Was
atch
norm
alfau
lt
Mor
gan
norm
alfa
ult
basal thrust
upper Ogden
Willard thrust lower
lower Ogden
LostCreek
GreatSalt LakeGreat Salt Lake
XWf
XWf
XWf
XWfXWf
XWf
XWfQ-T Q-T
XWf
Mzl
Pz
Pz Mzu
Mzl
0 10 Miles
0 10 KilometersVertical = Horizontal
Pz
Pz
Pz
Pz
Pz
Pz
Pz
Z
Ogdenthrust
EastAntelope
Island fault
Pz
Figure 3. Schematic regional cross section across Antelope Island from near Stansbury Island to the east flank of the Wasatch Range showingmajor thrust and low- and high-angle normal faults. Tertiary strata on Antelope Island dip about 35 degrees east. Antelope Island is on the westflank of the Wasatch culmination, a large anticlinal stack of thrust plates. Abbreviation: XWf - Archean? to Early Proterozoic Farmington CanyonComplex, Z - Late Proterozoic strata, Pz - Paleozoic strata, Mzl - lower Mesozoic strata, Mzu - upper Mesozoic strata, QT - Quaternary-Tertiarybasin-fill deposits. From W.A. Yonkee, written communication, 2000.
AITN0820AITT0440AITN0830
13
12
11
10
9
8
765
4
3
2
1 1 111
4
78
10
9
12
13
1415
16
17
2
3
4
5
6
2
45
8
10
14
2
1
3
4
5
Quartzite andmeta-conglomerate
Sedimentary-- mostly chert,sandstone, mudstone, shale
Volcanic
Carbonate
High-grade metamorphic
Clast Lithology
ComplexCanyonFarmingtonProterozoicrocks
Tintic Quartzite
(Faultedinterval)
AITW0930AIMJ0101
AIGW0102
AITT0700
AI-81-1
AITT1200
conglomeratic mbr
mbrconglomeratic
upper
lo
we
r
Salt Lake Formation
AntelopeIslandG
reatSalt
Lake
23
6
7
8
9
11
12
9
SOUTH
NORTH
1234
5
500
400
300
200
100
0
ft
0
m
50
100
150N
Figure 4. Lithologic columns and correlation diagram of measured Tertiary strata on Antelope Island. The pie diagrams show the variability inclast lithology of the major conglomerate beds. Correlations were made by hiking out beds where possible and by comparing stratigraphic posi-tion and lithologic composition.
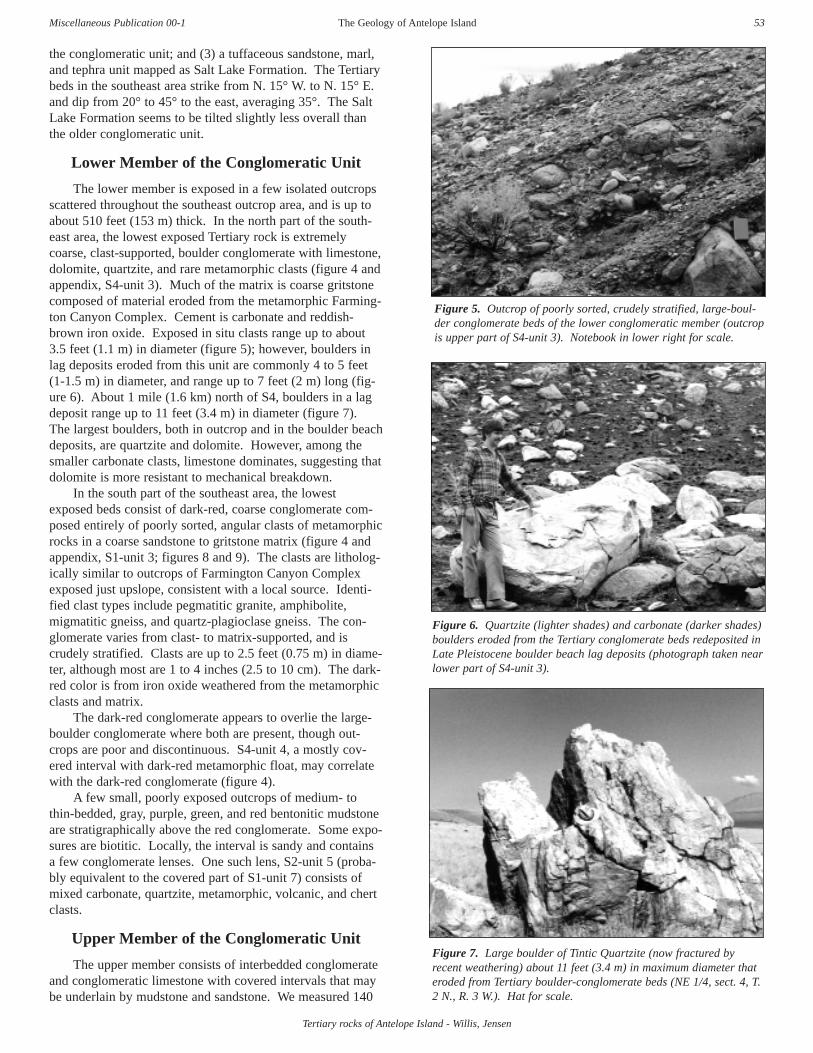
Tertiary rocks of Antelope Island - Willis, Jensen
the conglomeratic unit; and (3) a tuffaceous sandstone, marl,and tephra unit mapped as Salt Lake Formation. The Tertiarybeds in the southeast area strike from N. 15° W. to N. 15° E.and dip from 20° to 45° to the east, averaging 35°. The SaltLake Formation seems to be tilted slightly less overall thanthe older conglomeratic unit.
Lower Member of the Conglomeratic Unit
The lower member is exposed in a few isolated outcropsscattered throughout the southeast outcrop area, and is up toabout 510 feet (153 m) thick. In the north part of the south-east area, the lowest exposed Tertiary rock is extremelycoarse, clast-supported, boulder conglomerate with limestone,dolomite, quartzite, and rare metamorphic clasts (figure 4 andappendix, S4-unit 3). Much of the matrix is coarse gritstonecomposed of material eroded from the metamorphic Farming-ton Canyon Complex. Cement is carbonate and reddish-brown iron oxide. Exposed in situ clasts range up to about3.5 feet (1.1 m) in diameter (figure 5); however, boulders inlag deposits eroded from this unit are commonly 4 to 5 feet(1-1.5 m) in diameter, and range up to 7 feet (2 m) long (fig-ure 6). About 1 mile (1.6 km) north of S4, boulders in a lagdeposit range up to 11 feet (3.4 m) in diameter (figure 7).The largest boulders, both in outcrop and in the boulder beachdeposits, are quartzite and dolomite. However, among thesmaller carbonate clasts, limestone dominates, suggesting thatdolomite is more resistant to mechanical breakdown.
In the south part of the southeast area, the lowestexposed beds consist of dark-red, coarse conglomerate com-posed entirely of poorly sorted, angular clasts of metamorphicrocks in a coarse sandstone to gritstone matrix (figure 4 andappendix, S1-unit 3; figures 8 and 9). The clasts are litholog-ically similar to outcrops of Farmington Canyon Complexexposed just upslope, consistent with a local source. Identi-fied clast types include pegmatitic granite, amphibolite,migmatitic gneiss, and quartz-plagioclase gneiss. The con-glomerate varies from clast- to matrix-supported, and iscrudely stratified. Clasts are up to 2.5 feet (0.75 m) in diame-ter, although most are 1 to 4 inches (2.5 to 10 cm). The dark-red color is from iron oxide weathered from the metamorphicclasts and matrix.
The dark-red conglomerate appears to overlie the large-boulder conglomerate where both are present, though out-crops are poor and discontinuous. S4-unit 4, a mostly cov-ered interval with dark-red metamorphic float, may correlatewith the dark-red conglomerate (figure 4).
A few small, poorly exposed outcrops of medium- tothin-bedded, gray, purple, green, and red bentonitic mudstoneare stratigraphically above the red conglomerate. Some expo-sures are biotitic. Locally, the interval is sandy and containsa few conglomerate lenses. One such lens, S2-unit 5 (proba-bly equivalent to the covered part of S1-unit 7) consists ofmixed carbonate, quartzite, metamorphic, volcanic, and chertclasts.
Upper Member of the Conglomeratic Unit
The upper member consists of interbedded conglomerateand conglomeratic limestone with covered intervals that maybe underlain by mudstone and sandstone. We measured 140
The Geology of Antelope IslandMiscellaneous Publication 00-1 53
Figure 5. Outcrop of poorly sorted, crudely stratified, large-boul-der conglomerate beds of the lower conglomeratic member (outcropis upper part of S4-unit 3). Notebook in lower right for scale.
Figure 7. Large boulder of Tintic Quartzite (now fractured byrecent weathering) about 11 feet (3.4 m) in maximum diameter thateroded from Tertiary boulder-conglomerate beds (NE 1/4, sect. 4, T.2 N., R. 3 W.). Hat for scale.
Figure 6. Quartzite (lighter shades) and carbonate (darker shades)boulders eroded from the Tertiary conglomerate beds redeposited inLate Pleistocene boulder beach lag deposits (photograph taken nearlower part of S4-unit 3).

Tertiary rocks of Antelope Island - Willis, Jensen
feet (42 m) of upper member, but it may be considerablythicker in other areas. The contact between the lower andupper members is placed at the base of the lowest thick con-glomerate beds with interstitial lacustrine carbonate and,
where present, the base of the lowest conglomerate that con-tains abundant volcanic clasts (figure 4 and appendix)(Doelling and others, 1990).
The upper member is present in all the measured sec-tions; however, percentages of clast types, particularly of vol-canic clasts, are highly variable between outcrops only a fewhundred feet apart. Intervening beds are commonly covered.The variation may reflect different local sources, or that dif-ferent beds are exposed at different sites.
The basal beds of the upper member (S3-unit 5 and S4-unit 6), form a prominent ledge that varies from conglomerat-ic limestone to conglomerate (figure 10). Clasts rarelyexceed one foot (0.3 m) in diameter. Most clasts werederived from Paleozoic carbonates and quartzites, but a smallnumber were derived from the Farmington Canyon Complex,the Mineral Fork Formation, and the Kelley Canyon Forma-tion. The bed is pale gray to white with almost no iron oxide,unlike lower conglomerate beds.
The basal ledge may correlate with either unit 9, 11, or13 of S2, and with either unit 11 or 13 of S1 (figure 4). S2-unit 9 is white, calcareous conglomerate containing subangu-lar to subrounded quartzite and limestone cobbles that rarelyexceed 3 inches (8 cm) in diameter, interbedded with tuffa-ceous sandstone. S2-units 11 and 13 are mostly conglomeratewith metamorphic, quartzite, and carbonate clasts, mostly 1 to6 inches (2.5-15 cm), but up to 14 inches (36 cm), in diame-ter. Clasts are mostly purple, green, and white quartzite cob-bles derived from Proterozoic sources, with occasional sand-stone, shale, and black chert. No volcanic clasts were found.
S1-unit 11 contains almost 50 percent volcanic clasts. Itmay correlate with S2-unit 9, which contains no volcanicclasts, with S2-unit 5, which contains about 6 percent vol-canic clasts, or with the covered interval between. It mayalso correlate with S3-unit 5, which also does not contain vol-canic clasts. Regardless of which bed is correlative, volcanicclasts decrease rapidly in abundance towards the north.
The Geology of Antelope Island Utah Geological Survey54
Figure 9. Closeup of the outcrop shown in figure 8, showing size,sorting, and angularity of boulder clasts.
Figure 8. Dark-brownish-red conglomerate and breccia beds of thelower conglomeratic member consist of angular to subangularclasts of metamorphic rocks in a gritty matrix (outcrop is S1-unit 3).View to north. Hammer for scale.
Figure 10. Lacustrine conglomeratic limestone with abundantboulder clasts in the upper conglomeratic member (outcrop is S4-unit 6). Largest boulders are about 20 inches (50 cm) long. Shovelfor scale.

Tertiary rocks of Antelope Island - Willis, Jensen
Salt Lake Formation
Overlying the conglomeratic sequence is a thick intervalconsisting of fine-grained volcanic ash with greater than 95percent glass shards, tuffaceous sandstone, marl, mudstone,and a few thin pebble-conglomerate beds that Doelling andothers (1990) mapped as Salt Lake Formation (figures 11 and12).
The Salt Lake Formation is poorly exposed, but abundantpale-gray to white tuffaceous float and numerous small out-crops indicate that it is present under much of the Quaternarycover east of the conglomeratic outcrops. The more resistantoutcrops are tuffaceous sandstone, volcanic ash, and con-glomerate. Float suggests the unexposed parts of the forma-tion are poorly cemented sandstone, siltstone, marl, and ash.
The volcanic ash beds are light- to medium-gray on freshsurfaces and weather to a lighter gray. They are generally
very fine grained, noncalcareous, porous, moderately indurat-ed, laminated to thick bedded, and locally exhibit cross-bed-ding (figure 11). Angular glass shards comprise up to 100percent of the ash. In places the ash contains small specks ofdark iron oxide.
The upper part of the Salt Lake Formation is not exposedon the island, so the total thickness cannot be measured.Assuming no structural complexities and a uniform strike anddip, the formation is at least 1,800 feet (550 m) thick.
Drill Holes in the Southeast Outcrop Area
Two water wells were drilled in the southeast outcroparea by the Antelope Island Cattle Company, Inc. (part of theAnchutz Corporation) in 1975 and 1976 (S.B. Montgomery,Utah Division of Water Resources, written memorandum,1980). One hole located 1,650 feet (503 m) north and 100feet (30 m) west of the SE corner of section 33, T. 3 N., R. 3W. was drilled to a depth of 2,082 feet (635 m) (figures 2 and13). The other hole, located about 2,200 feet (660 m) to thewest approximately 1,600 feet (490 m) north and 2,300 feet(700 m) west of the same section corner, was drilled to adepth of 600 feet (180 m).
Well cutting descriptions on file with the Utah Divisionof Water Rights are brief. The shallower west hole penetrated"conglomerate" to 305 or 400 feet (93 or 120 m), and "black,white, and gray rock" in a small interval at the bottom of thehole (thickness was not stated); the intervening interval wasnot described. The description of the deeper east hole is alsobrief. It cut "clay, silt, sand, gravel, and boulders" to 1,213feet (370 m) and "hardpan, conglomerate, and bedrock" from1,213 to 2,082 feet (370 to 635 m).
We reinterpreted the penetrated intervals using the writ-ten descriptions and correlation with our surface mapping
The Geology of Antelope IslandMiscellaneous Publication 00-1 55
0
1,000
2,000
5000
500
0
2,000
M
FT
Horizontal = Vertical
1,000
pC-
TuTsl
Q
Q
WW1 WW2West East
D D'
Tu
Figure 11. Clean, planar-bedded, and cross-bedded volcanic ashin the Salt Lake Formation (outcrop is about 1/2 mile (0.8 km)northeast of S4). Shovel for scale.
Figure 12. Thin-section photomicrograph showing clean glassshards typical of ash beds in the Salt Lake Formation (matrix isepoxy cement). Bar in lower right equals 0.004 inches (0.1 mm).
Figure 13. Cross section through two water wells (WW1 and WW2,locations shown on figure 2). Tertiary strata dip about 35° to 45°east. Both wells penetrated bouldery Quaternary surficial deposits,then Tertiary strata, and may have bottomed in Precambrianbedrock. Q-undifferentiated Quaternary surficial deposits, Tsl-SaltLake Formation, Tu-undivided Tertiary conglomeratic units, pC- Pre-cambrian high-grade metamorphic rock.

Tertiary rocks of Antelope Island - Willis, Jensen
(table 1) to construct a cross section through the site (figure13). Late Pleistocene alluvial and lacustrine deposits are atthe surface at each site, but nearby outcrops indicate that bothholes primarily penetrated thick Tertiary strata. The east holecut the tuffaceous Upper Tertiary Salt Lake Formation, thenclasts of Paleozoic carbonate and quartzite contained in theunnamed Tertiary conglomeratic unit. It may have bottomedin metamorphic bedrock. The west hole penetrated surficialmaterials, then the conglomeratic unit, and then bottomed inmetamorphic bedrock.
Table 1. Our interpretation of rock penetrated by water wells in thesoutheast part of Antelope Island (all measurements are approxi-mate). Locations are shown on figure 2. Our interpretation isshown on figure 13. Number in parentheses is stratigraphic thick-ness after adjusting for 40° dip.
Interval (feet) Lithology(strat. thickness)
WW 1 (western)
0-100 Late Quaternary surficial alluvial and lacus-(77) trine deposits consisting of gneissic,
granitic, and quartzitic boulders, sand, andsilt.
100-550 Early Tertiary conglomeratic strata contain-(345) ing mostly Cambrian to Mississippian car-
bonate and quartzite clasts.
550-600 Precambrian gneissic and granitic bedrock.(38)
WW 2 (eastern)
0-100 Late Quaternary surficial alluvial and lacus(77) trine deposits consisting of gneissic,
granitic, and quartzitic boulders, sand, andsilt.
100-1,200 Late Tertiary Salt Lake Formation tuff, (843) tuffaceous sandstone, and conglomerate.
1,200-2,082 Early Tertiary conglomeratic unit consisting (676) of Cambrian to Mississippian carbonate and
quartzite boulder clasts. Depending on thedip used in the model, the hole may havebottomed in Precambrian metamorphicrock.
Our reconstruction shows that metamorphic rocks pene-trated in the upper part of the hole are actually boulders con-tained in surficial and Tertiary strata, and that Paleozoic car-bonate rocks in the lower part of the hole are large clasts inthe Tertiary boulder conglomerate. Dip of Tertiary beddingwithin one mile (1.6 km) of the holes varies from 20 to 45°(Doelling and others, 1990). Near the holes the dip is proba-bly about 40°, in which case the east hole penetrated onlyTertiary strata and the west hole penetrated about 450 feet(135 m) (345 feet [105 m] when adjusted for dip) of Tertiaryrock. Hansen and McCarley (this volume) present differentinterpretations of these holes.
NORTH EXPOSURES
A small, narrow belt of Tertiary outcrops is exposedalong the Great Salt Lake shoreline at the north tip of theisland (figures 2 and 14). These outcrops were first exposedwhen surficial gravel deposits were removed to construct acauseway to the island in the 1970s and 1980s. The Tertiaryrocks are primarily very poorly sorted sedimentary brecciaand conglomerate interbedded with gray volcanic ash andpale-reddish-gray mudstone and are up to 760 feet (230 m)thick (figure 4 and appendix S5). The rocks are strongly frac-tured and are cut by numerous faults. Though contacts aremostly covered, the Tertiary strata appear to unconformablyoverlie the Cambrian Tintic Quartzite in some locations andare faulted against it in others. The Tertiary beds strike fromN. 57° E. to N. 75° E. The beds apparently are part of anoverturned fold; they are overturned, dipping 67° SE, near theeast end of the outcrop, are vertical a short distance fartherwest, then gradually flatten, dipping about 15° to the NW inthe westernmost exposure. The fold and faults may beindicative of a larger, unexposed fault north of the island.
The basal contact of the Tertiary beds is a 1-foot (0.3 m)thick, yellowish-brown breccia with mostly Tintic Quartziteclasts. It may be either sedimentary or fault breccia. Medi-um-gray, thin- to thick-bedded volcanic ash overlies the brec-cia (figure 14). The ash consists primarily of glass shards,although it contains a few suspended angular clasts ofquartzite, shale, and small blebs of black obsidian. It is pres-ent in three intervals from 12 to 30 feet (4-9 m) thick that areinterbedded with sedimentary breccia (figure 4 and appendixS5). Two or more of the intervals may be the same bedrepeated by faults. The ash has been reworked and containsinterbedded sedimentary breccia as clots, stringers, and irreg-ular bodies. Contacts between the sedimentary breccia andthe ash vary from sharp to gradational.
The sedimentary breccia and conglomerate (figure 4 andappendix S5 - units 4, 6, 7, 9-13, 15, and 17) are very poorlysorted, with individual clasts as large as 3 feet (1 m) in diam-eter. Clasts are mostly very angular, olive-green shale in thelower beds, and mostly white- to pale-gray quartzite in themiddle and upper beds. Lesser amounts of silty, dolomitic
The Geology of Antelope Island Utah Geological Survey56
Figure 14. Faulted volcanic ash and coarse, angular conglomerateand breccia of the Salt Lake Formation on the north end of Ante-lope Island. Strata are near-vertical to overturned.

Tertiary rocks of Antelope Island - Willis, Jensen
limestone, micaceous argillite, and dark-gray to blackquartzite are also present. The angular nature, poor sorting,immature composition, and nonresistant nature of some of theclasts indicate that they were transported only a short distancefrom their source.
The north exposures cannot be correlated directly withTertiary rocks on the southeast part of the island. The abun-dant volcanic ash does indicate that they are part of the SaltLake Formation.
INTRUSIVE ROCKS
A few felsic dikes about 5 feet (1.5 m) wide cut Pre-cambrian metamorphic rock in SW 1/4, SW 1/4, SW 1/4 sec-
tion 34, T. 2 N., R. 3 W. Chemically, they are alkali-rich tra-chyte (table 2) and are not chloritized or altered by low-grademetamorphism as are the adjacent rocks. The dikes were notradiometrically dated, but they are probably late Eocene orOligocene, based on their proximity to Eocene and Oligoceneintrusions in the Oquirrh Mountains to the south (figure 1)(Tooker and Roberts, 1971; Moore and McKee, 1983), theirtrachyte composition, and the fact that they postdate Creta-ceous chlorite-grade metamorphism that affected the hostrocks (W.A. Yonkee, verbal communication, 1991).
AGE AND CORRELATION
The Tertiary rocks of Antelope Island have proven
The Geology of Antelope IslandMiscellaneous Publication 00-1 57
Horizontal surfaceat time of depositionof Tertiary strata
EAST
WESTShorelin
e of
Great Salt L
ake
Shoreline of
Great Salt L
ake B'
B
Farmington Canyon
Complex (XWf)
Farmington Canyon
Complex (XWf)
ANTELOPE ISLANDBamberger H
ill
EarlyTertiary
erosionalsurface
Modernerosionalprofile
Source of early Tertiary conglomerates
Modern horiz
ontal surfa
ce
0
0 0.5 1
0.5 1
Kilometer
Mile
Vertical = Horizontal
Tsl(later deposition)
Tu
Mississippian (M)
Devonian (D)
Cambrian
Late Proterozoic (Z)
Archean
and Early
Proterozoic
Doughnut Fm
Deseret and Humbug Fms--
includes Delle Phosphate Mbr
Gardison Ls
Stansbury Fm
Maxfield Ls (C-m)
Ophir Fm
(C- o)
Tintic Quartzite (C-t)
Mineral Fork and Kelley Canyon Fms
Pinyon Peak Fm
Willard thrust fa
ult
Late Proterozoic rocks
approximately 16,000 ft thick
of Late Proterozoic rocksApproximately 24,000 ft
of Paleozoic to
Cretaceous rocks
Lo
we
r Wi l l a
r d P
l at e
Up
pe
r
Wi
ll
ar
d
Pl
at
e
Figure 15. Schematic cross sections showing restoration of Antelope Island to about late Eocene time (prior to Neogene tilting). Note that thecross-section scales are different. Lines of section shown on figure 2.(A): East-west cross section B-B' across the middle of the island. The island block is tilted 35° to the west to restore Tertiary beds to horizontal.The likely location of the Willard thrust fault and of the source of Paleozoic boulders now found in the Tertiary sediments is indicated. The Willardthrust fault rides on Mississippian strata. The lower part of the upper plate rocks consists of several thousand feet of Late Proterozoic metasedi-mentary strata.(B): North-south cross section C-C' showing a postulated lateral ramp cutting up-section from Cambrian rocks near the north end of the island, toMississippian rocks near the central or south part of the island. Fault movement: A-away, T-toward.
Appproximately 16,000 feet of Late Proterozoic (Z)and 24,000 feet of Paleozoic and Mesozoic rocks
C C'
Profile of Antelope Island
SouthNorth
Shore
Willard thrust fault --
AT
AT
MDC- mC- oC- tZXwf
12,000
8,000
4,000
0
Feet
0
0 2 4 Kilometers
2 4 Miles
lateral ramp
B-B'
A
B

Tertiary rocks of Antelope Island - Willis, Jensen
difficult to date. We attempted to determine the ages of therocks using palynomorph identification, field constraints,radioisotopic dating, tephrochronology, and correlation withsurrounding areas. No indicative megafossils were found.Fred May of Palynex International examined five samples forpalynomorphs, but all were barren (written communication,1990).
Field ConstraintsField relationships, combined with the geologic history
of the area, provide some constraints on the timing of Tertiarydeposition. The Tertiary rocks overlie Precambrian and Cam-brian strata that were involved in intense structural and low-grade metamorphic changes during the Cretaceous Sevierorogeny (Doelling and others, 1990; Yonkee, 1992; Yonkee,Willis, and Doelling, this volume [b]). The conglomeraticstrata do not exhibit this deformation, but contain clasts thatwere deformed. Thus, the conglomerate postdates both thedeformation and the vast erosion necessary to denude thedeformed rocks. We estimate that at least 40,000 feet (13,000m) of rock must have been structurally and erosionallyremoved from what is now Antelope Island in order to exposethe source of some of the clasts and the Precambrian rocks onwhich they are deposited (figure 15). This denudation wasprobably not completed before late Paleocene or early Eocenetime.
Both the older unnamed rocks and the Salt Lake Forma-tion deposits are tilted as much as 45° on the southeast side ofthe island and are steeply dipping on the north end (figures 11and 14). No major angular unconformities exist within theTertiary strata. Thus, the exposed Tertiary strata predate mostof the faulting that tilted the island block during the lateCenozoic.
Radioisotopic Dating and TephrochronologySeveral bentonitic clay beds in the lower part of the
upper conglomerate member contain biotite amenable toradiometric potassium-argon (K-Ar) dating. In addition,some of the conglomerate beds near S1 and S2 contain abun-dant volcanic clasts with biotite and other datable minerals.We selected one sample from the bentonitic clay and two vol-canic clasts for K-Ar dating. They yielded ages of 42.9±1.9Ma, 38.8±1.5 Ma, and 49.2±1.7 Ma, respectively (table 3; fig-
The Geology of Antelope Island Utah Geological Survey58
SiO2 63.96 K2O 4.49 P2O5 0.06 Sr 20.ppmAl2O3 19.45 Fe2O3 2.94 LOI 0.54 Y 40.ppmCaO 0.18 MnO 0.03 Ba 240.ppm Zr 430.ppmMgO 0.57 Cr2O3 <0.01 Nb 180.ppmNa2O 8.09 TiO2 0.33 Rb 110.ppm TOT 100.4
CIPW Weight Normative Calculations*
Orthoclase 26.48 Olivine 2.49Albite 65.08 Ilmenite 0.63Anorthite 0.50 Magnetite 1.41Nepheline 1.74 Apatite 0.14Corundum 1.09
*Normalized on a 100% water-free basis and with the total iron corrected according to Irvine and Barager (1971).
Table 2. Geochemical X-ray fluorescence analysis and normative calculation of mineral content of Tertiary igneous dike in the south part of Ante-lope Island. Analyses in percent [no symbol] or parts per million [.ppm] Sample collected in SW1/4, SW1/4, SW1/4 section 34, T. 2 N., R. 3 W.
Sample: AIGW-0102Unit: Conglomeratic unit, lower member (volcanic clast)Location: 40°52'52"N., 112°10'25"W.Material Analyzed: Biotite concentrate, -80/+200 meshDATE ANALYZED: Nov. 13, 1987AGE: 42.9+-1.740*Ar/40K = 0.00252340*Ar (ppm) = 0.01991; 0.01983 Average = 0.0198740*Ar/Total 40Ar = 0.575; 0.512%K = 6.549; 6.654 Average = 6.60240K (ppm) = 7.876
Sample: AIMJ-0101Unit: Conglomeratic unit, upper member (bentonite)Location: 40°52'51"N., 112°10'28"W.Material Analyzed: Biotite concentrate, -80/+200 meshDATE ANALYZED: Oct. 28, 1988AGE: 49.2+-1.940*Ar/40K = 0.00289740*Ar (ppm) = 0.02014; 0.02024 Average = 0.0201940*Ar/Total 40Ar = 0.434; 0.347%K = 5.879; 5.806 Average = 5.84340K (ppm) = 6.970
Sample: AITW-0930Unit: conglomeratic unit, upper member (volcanic clast)Location: 40°52'48"N., 112°10'22"W.Material Analyzed: Phlogopite concentrate, -80/+200meshDATE ANALYZED: Oct. 28, 1988AGE: 38.8+-1.540*Ar/40K = 0.00227940*Ar (ppm) = 0.01966; 0.01906 Average = 0.0193640*Ar/Total 40Ar = 0.586; 0.392%K = 7.094; 7.147 Average = 7.12140K (ppm) = 8.495
Constants Used:λβ = 4.962x10⁻¹⁰/year (λe+λ'e) = 0.581x10⁻¹⁰/year 40K/K = 1.193x10⁻⁴g/g
Laboratory:Krueger Enterprises, Inc., Geochron LaboratoriesDivision, Cambridge, MA
Table 3. Analytical data on potassium-argon age determinationsfor samples collected on Antelope Island. Ages reported in millionsof years.

Tertiary rocks of Antelope Island - Willis, Jensen
ure 2), similar to reported ages from Eocene volcanic rocks ina belt to the south and west (Moore and McKee, 1983; Bryantand others, 1989a). The wide range in ages may be due todating of clasts from different sources, low radiogenic argon(table 3), or both. The dated materials were collected fromwater-lain beds reworked from the primary volcanic rocks, sothe dated materials were deposited later than the K-Ar ages,probably during the late Eocene or Oligocene (see “RegionalCorrelation”).
The volcanic ash beds in the Salt Lake Formation arecomposed of clean glass shards (vitric tuff) with minoramounts of incorporated chert and other sedimentary sandgrains (figure 12). We examined several samples but foundno minerals datable by standard K-Ar methods. Bryant andothers (1989a) dated a sample collected from approximatelythe middle of the Salt Lake Formation in the NW1/4, section15, T. 2 N., R. 3 W., in the southeast part of the island, by fis-sion track on zircon at 6.1±1.1 Ma (figure 2).
Michael E. Perkins and William P. Nash of the Universityof Utah conducted electron microprobe analyses on ten sam-ples of gray vitric tuffs from the Salt Lake Formation onAntelope Island (figure 2; table 4). They did the analyseswith a Cameca SX-50 electron microprobe using methodsPerkins and others (1995) described. They compared the
chemical analyses of these samples with similar analyses ofabout 2,200 samples of vitric tuffs from Neogene basins ofthe western U.S. in the University of Utah database. Com-parisons were based on titanium, iron, manganese, magne-sium, calcium, barium, and chlorine using the distance func-tion (Perkins and others, 1995; 1998).
Comparisons of electron microprobe analyses provideuseful preliminary correlations of tuffs (tephrochronology)and also provide information on the source of the tuffs. It isimportant to note, however, that high precision, trace-elementanalyses of the glass shard fraction of these tuffs are neededto confirm specific correlations discussed below. Using theclassification of Perkins and others (1998), the AntelopeIsland tuffs are gray metaluminous rhyolite tuffs and are with-in the glass shard compositional field of Snake River Plain-type tuffs. The available evidence firmly indicates that thetuffs are from sources in the Snake River Plain volcanicprovince (Yellowstone hotspot track) and are 11 to 8 millionyears old (late Miocene). Future analyses may prove some ofthe suggested correlations are in error, but they are unlikely toalter the overall age range now estimated for these tuffs. Pre-liminary (electron microprobe) correlations for nine of the tensamples are as follows (Michael Perkins written communica-tion, 1998, shown in table 4):
The Geology of Antelope IslandMiscellaneous Publication 00-1 59
Table 4. Results of electron microprobe analyses of volcanic tuff samples from Antelope Island. All amounts are in weight percent of oxides.
AITT- AITT- AITT- AITT- AITT- AITT- AITT- AITT- AITT- AITT-0440 0700 0820 0830 0840 1200 1020 1030 1090 1220
SiO2 72.9 72.5 72.8 72.6 73.3 72.7 72.1 71.0 70.8 72.3TiO2 0.22 0.21 0.20 0.25 0.16 0.17 0.26 0.40 0.37 0.28Al2O3 11.6 11.6 11.6 11.6 11.5 11.4 11.6 11.9 11.7 11.5Fe2O3 2.14 2.13 2.07 2.10 1.77 1.73 2.17 2.53 2.82 2.31MnO .035 .039 .026 .044 .030 .031 .041 .041 .046 .036MgO .051 .043 .049 .084 .064 .062 .111 .202 .182 .107CaO 0.66 0.66 0.65 0.62 0.51 0.53 0.70 0.93 1.01 0.74BaO 0.05 0.04 0.05 0.04 0.02 0.02 0.06 0.06 0.06 0.07Na2O 2.5 1.8 2.5 2.5 2.7 1.7 1.8 2.0 1.7 2.3K2O 5.5 5.6 5.6 5.6 5.3 6.4 6.2 5.9 5.1 5.5Cl .040 .043 .042 .033 .050 .054 .033 .026 .024 .038F 0.27 0.25 0.29 0.24 0.24 0.25 0.22 0.22 0.25 0.23H2O 4.7 6.4 4.9 4.5 5.5 5.6 5.6 5.5 6.8 5.4D- O 0.12 0.12 0.13 0.11 0.11 0.12 0.10 0.10 0.11 0.11Total 100.5 101.2 100.6 100.1 101.0 100.5 100.8 100.6 100.8 100.7
Note: Correlative samples grouped together. Comparisons based on contents of TiO2, Fe2O3, MnO, MgO, CaO, BaO, and Cl.
Locations: Sample Latitude LongitudeAITT-0440 41° 03' 35" 112° 14' 20"AITT-0700 40° 55' 36" 112° 10' 35"AITT-0820 41° 03' 35" 112° 14' 20"AITT-0830 41° 03' 35" 112° 14' 19"AITT-0840 40° 56' 36" 112° 10' 52"AITT-1200 40° 54' 32" 112° 10' 20"AITT-1020 40° 56' 00" 112° 11' 05"AITT-1030 40° 55' 59" 112° 11' 02"AITT-1090 40° 54' 08" 112° 10' 16"AITT-1220 40° 54' 38" 112° 10' 18"

Tertiary rocks of Antelope Island - Willis, Jensen
(1) Samples AITT-0440, AITT-0700, and AITT-0820 arefrom the same tuff. This tuff is likely the 10.94 ± 0.03Ma Cougar Point Tuff (CPT) XIII ash bed of Perkins andothers (1995; 1998). This ash bed can generally be iden-tified with confidence using electron microprobe analy-ses. The CPT XIII ash bed is present in sections acrossthe Basin and Range. In particular it is in the South Wil-low Creek section of the Salt Lake Formation on the eastflank of the Stansbury Range, Utah (Perkins and others,1998) to the south of Antelope Island.(2) Sample AITT-0830 possibly matches a fallout tuff atthe base of the 8.6 ± 0.20 Ma uppermost unit (unit 4?) ofthe tuff of McMullen Creek at the top of the TrapperCreek section in southern Idaho (Perkins and others,1995).(3) Samples AITT-0840 and AITT-1200 are likely fromthe same ash bed. They have a unimodal glass shardcomposition and likely match either the 7.9 ± 0.5 MaRush Valley, Utah ash bed of Perkins and others (1998)or an unnamed ash bed about 9.2 Ma. The 7.9 Ma RushValley ash bed and the unnamed 9.2 Ma ash bed cannotbe confidently differentiated using electron microprobeanalyses, hence the correlation uncertainty.(4) Sample AITT-1030 has glass shards with two com-positional modes. It appears to match an about 9.8 Mabimodal ash bed in southwest Montana.(5) Sample AITT-1090 has glass shards with four dis-crete compositional modes. This distinctive tuff is agood match with an unnamed about 9.8 Ma tuff justabove the 9.8 ± 0.20 Ma Hazen ash bed in western Neva-da of Perkins and others (1998).(6) Sample AITT-1220 contains glass shards with twodistinct compositional modes. It appears to match anabout 10.5 to 9.5 Ma bimodal tuff from the Mink Creekarea of southeast Idaho.
Only sample AITT-1020 is not matched to a specific tuffin the University of Utah database. However, sample AITT-1020 is in the compositional field of the group A tuffs of theTrapper Creek section (Perkins and others, 1995). Group Atuffs are mostly 10.5 to 8.6 Ma in age and none are knownthat are younger than about 8.0 Ma. The possibility of tuffsas young as about 6 Ma (fission track) on Antelope Island, asreported by Bryant and others (1989a), cannot be completelyruled out. However, several 11 to 8 Ma samples were collect-ed in the general area of the Bryant and others (1989a) sam-ple. This suggests that the 6.1 ± 1.1 Ma zircon fission trackdate reported by these workers may err on the young side.
Regional Correlation
Tertiary rocks are exposed in several ranges and valleys,and were penetrated by several drill holes in northwest Utah(figure 16A-C). Most are also poorly dated, but comparisonwith the Antelope Island outcrops provide some constraintson the Tertiary history.
Salt Lake SalientThe Salt Lake salient contains one of the thickest and
most complete sequences of Tertiary rocks in northern Utah
(figure 16A-C). However, the rocks are mostly coarse clas-tics that have yielded little datable material. Van Horn (1981)and Van Horn and Crittenden (1987) mapped six Tertiaryunits in the salient area: (1) a basal conglomerate (their "con-glomerate no. 1"), with limestone and quartzite clasts, whichthey correlate with the Wasatch Formation; (2) an overlyingsequence of tuffaceous siltstone, sandstone, and limestonedated at about 37 Ma, which they correlate with the NorwoodTuff; (3) andesite breccia dated at about 37 Ma, which theycorrelate with the Keetley Volcanics; (4) a sequence of over8,500 feet (2,650 m) of conglomerate (their "conglomerateno. 2") with clasts reworked from conglomerate no. 1 andmetamorphic clasts derived from the Farmington CanyonComplex; and (5) and (6) two upper units of probablePliocene age that consist of poorly consolidated conglomeratethat unconformably overlies the previously described units.
Their conglomerate no. 1 may correspond in age to thelower part of the lower conglomeratic member on AntelopeIsland. Their overlying tuffaceous and andesitic units andtheir conglomerate no. 2 may correspond with the bentoniticbeds or the upper conglomeratic member on the island. Theirupper two units probably do not correlate with strata exposedon Antelope Island.
Oquirrh MountainsTooker and Roberts (1961, 1971) mapped a small expo-
sure of coarse conglomerate overlain by a remnant of andesitebreccia in the north Oquirrh Mountains (figure 16A, B). Theconglomerate is poorly sorted, is stained reddish brown, andcontains boulders of limestone and quartzite, some of whichwere derived from exposures outside the Oquirrh Mountains.The overlying andesite breccia is comparable to rocks to thesouth that are about 38 million years old (Moore, 1973; usingrevised decay constants according to Dalrymple, 1979). Theconglomerate is similar to the lower conglomeratic sequenceon Antelope Island and the andesite may roughly correlatewith the bentonitic mudstone beds.
Slentz (1955) described outcrops of clastic, volcanic ash,and volcaniclastic deposits exposed in gravel pits and roadand railroad cuts in the foothills east of the Oquirrh Moun-tains, which he assigned to the Salt Lake Group (figure 16C).These outcrops form a key area for attempts to correlate vitrictuffs around the northeast Great Basin (see “Radiometric Dat-ing and Tephrochronology”) (Smith and Nash, 1976; Perkinsand others, 1998).
Stansbury MountainsRigby (1958) mapped reddish-brown pebble conglomer-
ate up to 400 feet (120 m) thick on the east flank of theStansbury Mountains (figure 16A). The conglomerate over-lies an unconformity cut across upper Paleozoic strata and isoverlain by volcanic strata that Moore and McKee (1983)dated at about 39 million years (figure 16B). The conglomer-ate contains locally derived boulders up to 2.5 feet (0.76 m)in diameter composed mostly of upper Paleozoic rocks. Thevolcanic sequence consists of interbedded latite flows, brec-cias, tuffs, and pebble conglomerate up to 1,800 feet (550 m)thick. Overlying the volcanic sequence is up to 1,300 feet(400 m) of interbedded tuffaceous sandstone and gritty pebbleto cobble conglomerate that may correlate with the Salt LakeFormation (figure 16C).
The Geology of Antelope Island Utah Geological Survey60

Tertiary rocks of Antelope Island - Willis, Jensen
Cedar MountainsMaurer (1970) described several hundred feet of sand-
stone to conglomerate with clasts up to 1.5 feet (0.56 m) indiameter on the west side of the Cedar Mountains (figure16A-C). The clasts were locally derived from the upper Pale-ozoic Oquirrh and younger formations. He also describedoutcrops of clayey and tuffaceous sandstone on the east sideof the range. Age control is limited, though he does reportfossils that are "...certainly Cenozoic, most probably latePaleocene or Eocene.”
North Promontory MountainsMiller and others (1991) and Miller and Schneyer (1994)
mapped "tuff and associated fine-grained sedimentarydeposits" that unconformably overlie the Pennsylvanian-Per-mian Oquirrh Formation in the North Promontory Mountains(figure 16C). Using experimental K-Ar methods, theyobtained radiometric ages on glass shards from near the baseof the unit of 17 to 18 Ma and about 9.6 Ma from near theerosionally truncated top. They indicated that the 17 to 18
Ma ages were from experimental methods and are probablytoo old (Miller and others, in press). Discordantly overlyingthe tuff are loess and alluvium older than 4.8 Ma (Nelson andMiller, 1990).
Other areasTertiary strata are exposed in numerous other areas
throughout northern Utah (figure 16A-C). The Grouse Creek- Raft River Mountains area is particularly important becauseof thick, well-exposed sections and better age control(Williams and others, 1982; Compton, 1983; Todd, 1983).Williams and others reported ages ranging from 11 to 7 Mafor the Salt Lake Group strata in that area. Also important areoutcrops in the Pilot Range (Miller, 1985; Miller andSchneyer, 1985; Miller, 1993), the Silver Island Mountains(Schaeffer, 1960), the Gold Hill area (north end of the DeepCreek Mountains) (Nolan, 1935; Dubiel and others, 1996),the north Wellsville Mountains (Adamson and others, 1955;Oviatt, 1986), and the northern Cache Valley area in southernIdaho (Danzl, 1985). Perkins and others (1998) and Miller
The Geology of Antelope IslandMiscellaneous Publication 00-1 61
Heber
Salt Lake City
Ogden
Logan
BrighamCity
ProvoUtahLake
Great
Salt
Lake
UTAH
Tooele
Snowville
Wendover
Hog
up M
tns.
Bea
r
Riv
er
Ran
ge
Was
atch
Ran
ge
BearLake
Wellsville M
tns.
West H
ills
Blu
e S
prin
gH
ills
Prom
ontory Mtns.
Han
sel M
tns.
Wasatch R
ange
Uinta
Mtns.
Wasatch R
ange
Oqu
irrh
Mtn
s.
Stansbury M
tns.
Lake
Mtn
s.
Ona
qui M
tns.
Ced
ar M
tns.
Stansbury I.
Mtns.
Lakeside
Gra
ssy
Mtn
s.
Gro
use
Cre
ek M
tns.
NewfoundlandMtns.
SilverIsland
Raft River Mtns.
PilotRange
Dee
pC
reek
Ran
ge
111°114° 113° 112°
111°114° 113° 112°40°
41°
42°
40°
41°
42°
N E
V A
D A
I D A H O
W Y
O M
I N G
Location
0 20
0
40 80 miles
40 80 kilometers20
AntelopeIsland
Figure 16A. Maps showing outcrops of Tertiary rocks in northern Utah divided into three groups (16A, B, C) by age (modified from Hintze andStokes, 1964): Paleocene to middle Eocene sedimentary strata that predate major volcanism in the area (primarily Wasatch Formation and relatedrocks). The Paleocene to Eocene highland in northwest Utah and associated deposition to the east is apparent.
A.
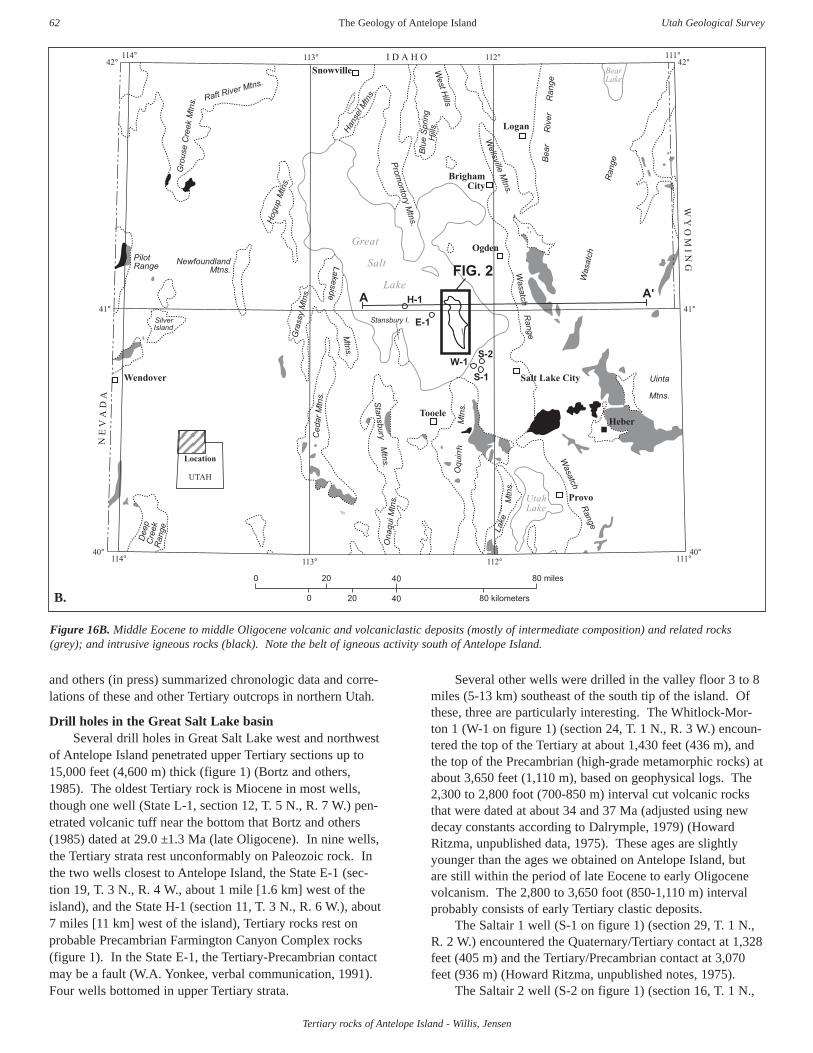
Tertiary rocks of Antelope Island - Willis, Jensen
and others (in press) summarized chronologic data and corre-lations of these and other Tertiary outcrops in northern Utah.
Drill holes in the Great Salt Lake basinSeveral drill holes in Great Salt Lake west and northwest
of Antelope Island penetrated upper Tertiary sections up to15,000 feet (4,600 m) thick (figure 1) (Bortz and others,1985). The oldest Tertiary rock is Miocene in most wells,though one well (State L-1, section 12, T. 5 N., R. 7 W.) pen-etrated volcanic tuff near the bottom that Bortz and others(1985) dated at 29.0 ±1.3 Ma (late Oligocene). In nine wells,the Tertiary strata rest unconformably on Paleozoic rock. Inthe two wells closest to Antelope Island, the State E-1 (sec-tion 19, T. 3 N., R. 4 W., about 1 mile [1.6 km] west of theisland), and the State H-1 (section 11, T. 3 N., R. 6 W.), about7 miles [11 km] west of the island), Tertiary rocks rest onprobable Precambrian Farmington Canyon Complex rocks(figure 1). In the State E-1, the Tertiary-Precambrian contactmay be a fault (W.A. Yonkee, verbal communication, 1991).Four wells bottomed in upper Tertiary strata.
Several other wells were drilled in the valley floor 3 to 8miles (5-13 km) southeast of the south tip of the island. Ofthese, three are particularly interesting. The Whitlock-Mor-ton 1 (W-1 on figure 1) (section 24, T. 1 N., R. 3 W.) encoun-tered the top of the Tertiary at about 1,430 feet (436 m), andthe top of the Precambrian (high-grade metamorphic rocks) atabout 3,650 feet (1,110 m), based on geophysical logs. The2,300 to 2,800 foot (700-850 m) interval cut volcanic rocksthat were dated at about 34 and 37 Ma (adjusted using newdecay constants according to Dalrymple, 1979) (HowardRitzma, unpublished data, 1975). These ages are slightlyyounger than the ages we obtained on Antelope Island, butare still within the period of late Eocene to early Oligocenevolcanism. The 2,800 to 3,650 foot (850-1,110 m) intervalprobably consists of early Tertiary clastic deposits.
The Saltair 1 well (S-1 on figure 1) (section 29, T. 1 N.,R. 2 W.) encountered the Quaternary/Tertiary contact at 1,328feet (405 m) and the Tertiary/Precambrian contact at 3,070feet (936 m) (Howard Ritzma, unpublished notes, 1975).
The Saltair 2 well (S-2 on figure 1) (section 16, T. 1 N.,
The Geology of Antelope Island Utah Geological Survey62
Heber
Salt Lake City
Ogden
Logan
BrighamCity
ProvoUtahLake
Great
Salt
Lake
UTAH
Tooele
Snowville
Wendover
Hog
up M
tns.
Bea
r
Riv
er
Ran
ge
Was
atch
Ran
ge
BearLake
Wellsville M
tns.
West H
ills
Blu
e S
prin
gH
ills
Prom
ontory Mtns.
Han
sel M
tns.
Wasatch R
ange
Uinta
Mtns.
Wasatch R
ange
Oqu
irrh
Mtn
s.
Stansbury M
tns.
Lake
Mtn
s.
Ona
qui M
tns.
Ced
ar M
tns.
Stansbury I.
Mtns.
Lakeside
Gra
ssy
Mtn
s.
Gro
use
Cre
ek M
tns.
NewfoundlandMtns.
SilverIsland
Raft River Mtns.
PilotRange
Dee
pC
reek
Ran
ge
111°114° 113° 112°
111°114° 113° 112°40°
41°
42°
40°
41°
42°
N E
V A
D A
I D A H O
W Y
O M
I N G
Location
0 20
0
40 80 miles
40 80 kilometers20
FIG. 2
H-1
E-1
W-1S-2
S-1
A A'
B.
Figure 16B. Middle Eocene to middle Oligocene volcanic and volcaniclastic deposits (mostly of intermediate composition) and related rocks(grey); and intrusive igneous rocks (black). Note the belt of igneous activity south of Antelope Island.

Tertiary rocks of Antelope Island - Willis, Jensen
R. 2 W.) bottomed at 3,207 feet (978 m), but the informationon the well is unreliable. The Utah Geological Survey sam-ple library holds two boxes of core from the Saltair 2 well,one labeled as the 1,721-1,740 foot (525-530 m) interval andthe other as the 3,200-3,207 foot (975-978 m) interval. Bothboxes contain only high-grade metamorphic rock. Based onour interpretation of the basin configuration, an examinationof geophysical well logs, and the description of the geologypenetrated in the nearby Saltair 1 well, we estimate the Ter-tiary-Precambrian contact is below the 3,000 foot (910 m)interval. We believe that the samples in the higher-intervalbox are mislabeled and are part of the lower-interval samples.Alternatively, the well may have penetrated a displaced sec-tion such as a slump block.
Summary of Regional Correlation
Tertiary deposits on Antelope Island have a lithologic
sequence similar to other Tertiary deposits in north Utah (fig-ure 16A-C) (Miller, 1990; Miller and others, in press). Thissequence consists of: (1) basal clastic, generally conglomerat-ic strata, commonly with red coloration, of probable latePaleocene to Eocene age that unconformably overlie Paleo-zoic or Precambrian rocks; (2) locally overlying and interfin-gering lacustrine beds in north Utah and east Nevada of latePaleocene to late Eocene age; (3) intermediate-compositionvolcanic and volcaniclastic deposits of mostly middle andlate Eocene age interlayered with, and overlying the lacus-trine beds, or overlying the conglomeratic beds where lacus-trine beds are absent; (4) generally limited or missing strataof known or assumed Oligocene age; and (5) overlyingcoarse fluvial to fine-grained lacustrine deposits, vitric tuffs,rhyolite, and locally, basalt, that range from Miocene toPleistocene in age. The Tertiary section on Antelope Island
conforms to this basic sequence.
The Geology of Antelope IslandMiscellaneous Publication 00-1 63
Heber
Salt Lake City
Ogden
Logan
BrighamCity
ProvoUtahLake
Great
Salt
Lake
UTAH
Tooele
Snowville
Wendover
Hog
up M
tns.
Bea
r
Riv
er
Ran
ge
Was
atch
Ran
ge
BearLake
Wellsville M
tns.
West H
ills
Blu
e S
prin
gH
ills
Prom
ontory Mtns.
Han
sel M
tns.
Wasatch R
ange
Uinta
Mtns.
Wasatch R
ange
Oqu
irrh
Mtn
s.
Stansbury M
tns.
Lake
Mtn
s.
Ona
qui M
tns.
Ced
ar M
tns.
Stansbury I.
Mtns.
Lakeside
Gra
ssy
Mtn
s.
Gro
use
Cre
ek M
tns.
NewfoundlandMtns.
SilverIsland
Raft River Mtns.
PilotRange
Dee
pC
reek
Ran
ge
111°114° 113° 112°
111°114° 113° 112°40°
41°
42°
40°
41°
42°
N E
V A
D A
I D A H O
W Y
O M
I N G
Location
0 20
0
40 80 miles
40 80 kilometers20
FIG. 2
H-1
E-1
W-1S-2
S-1
A A'
C.
Figure 16C. Miocene through Pliocene (and possibly some early Pleistocene) fluvial, lacustrine, and volcaniclastic strata, tuff and volcanic ash(mostly rhyolitic), and basalt. These rocks are commonly assigned to the Salt Lake Formation. Though not shown because of Quaternary cover,thousands of feet of rocks of this age also fill the basins between the faulted ranges. The outcrops shown on the map are relatively small remnantsof these "basin-fill" rocks preserved on the flanks of upthrown blocks.
Tertiary rocks of Antelope Island - Willis, Jensen
CONSTRAINTS ON THE WILLARD THRUST FAULT
The large-boulder conglomerate on the southeast part ofthe island and the breccia on the north end of the island aresignificant in reconstructing the structural geology of thearea. The fractured, easily broken, angular nature of some ofthe boulders and shale clasts, along with their size of up to 11feet (3.4 m) in diameter, dictate that they could only havebeen transported a short distance from their bedrock source.
Boulders in the southeast outcrops eroded from Cambri-an, Devonian, and Mississippian strata. Fossiliferous andphosphatic, oolitic limestone clasts from the MississippianLodgepole and Deseret Formations are particularly conspicu-ous. The identifiable boulder and cobble clasts on the northend of the island are from Cambrian or older formations,including olive-green shale derived from the Cambrian OphirFormation. None of these Paleozoic formations except theTintic Quartzite are now preserved on the island. A compari-son with outcrops along the Wasatch Front suggests that theboulders in both areas came from the footwall of the Willardthrust rather than from the upper plate (figure 3; figure 15)(W.A. Yonkee, verbal communication, 1991). Current direc-tion indicators are not apparent in the deposits, however, themost likely sources for clasts were beds once present on theisland block.
We postulate that the Willard thrust cut through Cambri-an strata near what is now the north end of the island, andramped up-section to the Mississippian (probably the Man-ning Canyon Shale), near the south part of Antelope Island(figure 15). This is similar to exposures in the WasatchMountains near Ogden, in which the Willard thrust fault cutsup-section to the south from Cambrian to Mississippian rocksalong a lateral ramp (Yonkee, 1992).
The north outcrops contain a small percentage of blackargillic quartzite clasts that are most similar to rocks of theHuntsville Group present just above the Willard thrust alongthe Wasatch Front (Crittenden, 1972). If these are from thehanging wall of the Willard thrust, it also supports a Cambri-an position for the thrust near the north end of the island.
SUMMARY AND CONCLUSIONS
More than 2,000 feet (600 m) of Tertiary strata areexposed on Antelope Island. They are divided into lower andupper members of an unnamed conglomeratic unit that are atleast 510 feet (153 m) and 140 feet (42 m) thick, respectively;and the Salt Lake Formation, which is over 1,800 feet (550m) thick. Conglomerate beds of the lower member containPaleozoic boulders up to 11 feet (3.3 m) in diameter andlocally abundant metamorphic clasts and matrix from theFarmington Canyon Complex. The upper conglomeratemember contains Paleozoic carbonate and quartzite, Tertiaryvolcanic, and Precambrian metamorphic clasts and isinterbedded with bentonitic mudstone and lacustrine lime-stone beds. The Salt Lake Formation consists of interbeddedvolcanic ash, marl, tuffaceous mudstone, conglomerate, andbreccia.
The lower conglomeratic member is probably late Pale-ocene to middle Eocene in age, and probably correlative with
the Wasatch Formation to the east and with other Tertiarybasal conglomeratic sequences in ranges to the south andwest. The coarse nature of the conglomerates suggests thatlocal uplift contributed to their deposition. The uplift may berelated to movement on thrust faults of the Sevier orogenicbelt, which were in their waning stages in the early Eocene(Bruhn and others, 1983).
The upper conglomerate member may be contemporane-ous with an east-west belt of middle Eocene to Oligoceneintermediate volcanism south of Antelope Island that blanket-ed the area with tuff, lavas, and volcaniclastic deposits. Ben-tonitic mudstone in the member yielded a K-Ar age of42.9±1.7 Ma, and welded tuff clasts yielded ages of 49.2±1.9and 38.8±1.5 Ma. Small dikes on the south part of the islandmay be the only direct record of this igneous event on Ante-lope Island.
No strata of late Oligocene through middle Miocene ageare recognized on Antelope Island, though some of the upperconglomeratic unit could be of this age.
Thick silicic volcanic ash of the Salt Lake Formation,mostly derived from eruptions in the Snake River Plain alongthe track of the Yellowstone hotspot in southwest Idaho, blan-keted northern Utah during the Miocene and Pliocene (Miller,1990; Perkins and others, 1998; Miller and others, in press).Volcanic ash beds on the island are probably between 11 and8 million years old. Interbedded, angular to subrounded,poorly sorted clasts indicate local topographic relief.
The older and younger Tertiary deposits on AntelopeIsland are tilted up to 45 degrees eastward as a unit. Strata ofthe Salt Lake Formation are parallel to, or are tilted slightlyless than older Tertiary rock, indicating that most fault-induced rotation of the island occurred after about eight mil-lion years ago. Structural deformation during the Oligoceneto middle Miocene was limited to broad warping (Miller andothers, in press).
Pre-Tertiary rocks exposed on Antelope Island were partof thick thrust sheets emplaced in a generally eastward-younging sequence across northern Utah (Armstrong, 1968;Royse and others, 1975; Doelling and others, 1990; Miller,1990; Yonkee, 1990; 1992). The Willard thrust sheet, inexcess of 40,000 feet (13,000 m) thick (Crittenden, 1972),passed just above rocks now exposed on Antelope Island (fig-ure 3) (Doelling and others, 1990; Yonkee, 1992). The islandrocks in turn were transported eastward on the Ogden thrust,which cuts rocks beneath the island. A later and even lowerthrust, the Absaroka, probably formed the basal detachment(figure 3). Most clasts in the conglomerate beds were derivedfrom the lower plate of the Willard thrust, which is now com-pletely eroded from the island. Distinctive suites of clasts onthe north and southeast parts of the island suggest that theWillard thrust was in Cambrian strata near the north end ofthe island, and ramped up to the Mississippian near the southpart of the island.
ACKNOWLEDGMENTS
The cooperation and logistical support of the UtahDepartment of Natural Resources, Division of Parks andRecreation made the field work for this study possible.Michael E. Perkins and William P. Nash of the University of
The Geology of Antelope Island Utah Geological Survey64
Tertiary rocks of Antelope Island - Willis, Jensen
Utah and Andrei Sarna-Wojcicki of the U.S. Geological Sur-vey analyzed tephra samples and aided in the interpretation ofresults. David M. Miller of the U.S. Geological Survey andW. Adolph Yonkee of Weber State University provided con-structive reviews and made many helpful comments and sug-gestions based on their extensive studies of the geology ofnorthwest Utah. This study benefitted from many conversa-tions with Hellmut H. Doelling of the Utah Geological Sur-vey.
REFERENCES
Adamson, R.D., Hardy, C.T., and Williams, J.S., 1955, Ter-tiary rocks of Cache Valley, Utah and Idaho in Eardley,A.J., editor, Tertiary and Quaternary geology of the east-ern Bonneville Basin: Utah Geological Society Guide-book to the Geology of Utah 10, p. 1-22.
Armstrong, R.L., 1968, Sevier orogenic belt in Nevada andUtah: Geological Society of America Bulletin, v. 19, p.429-458.
Bortz, L.C., Cook, S.A., and Morrison, O.J., 1985, Great SaltLake area, Utah, in Gries, R.R., and Dyer, R.C., editors,Seismic exploration of the Rocky Mountain region:Rocky Mountain Association of Geologists and DenverGeophysical Society, p. 275-281.
Bruhn, R.L., Picard, M.D., and Beck, S.L., 1983, Mesozoicand early Tertiary structure and sedimentology of thecentral Wasatch Mountains, Uinta Mountains, and UintaBasin, in Nash, W.P., and Gurgel, K.D., editors, Geologicexcursions in the overthrust belt and metamorphic corecomplexes of the intermountain region, Guidebook, PartI: Utah Geological and Mineral Survey Special Studies59, p. 63-105.
Bryant, Bruce, 1988, Evolution and early Proterozic historyof the margin of the Archean continent in Utah, in Ernst,W.G., editor, Metamorphism and crustal evolution of thewestern United States, Rubey volume 7: EnglewoodCliffs, N.J., Prentice Hall, p. 431-445.
Bryant, Bruce, Naeser, C.W., Marvin, R.F., and Mehnert,H.H., 1989a, Ages of late Paleogene and Neogene tuffsand the beginning of rapid regional extension, easternboundary of the Basin and Range Province near SaltLake City, Utah: U.S. Geological Survey Bulletin 1787-K, 11 p.
Bryant, Bruce, Naeser, C.W., Marvin, R.F., and Mehnert,H.H., 1989b, Upper Cretaceous and Paleogene sedimen-tary rocks and isotopic ages of Paleogene Tuffs, UintaBasin, Utah: U.S. Geological Survey Bulletin 1787-J, 22p.
Bywater, G.G. and Barlow, J.A., 1909, Antelope Island, GreatSalt Lake: Salt Lake City, University of Utah, B.S. the-sis, 21 p.
Compton, R.R., 1983, Displaced Miocene rocks on the westflank of the Raft River-Grouse Creek core complex,Utah, in Miller, D.M., Todd, V.R., and Howard, K.A.,editors, Structural and stratigraphic studies in the easternGreat Basin: Geological Society of America Memoir157, p. 271-279.
Crittenden, M.D., Jr., 1972, Willard thrust and the Cacheallochthon, Utah: Geological Society of America Bul-letin, v. 83, p. 2,871-2,880.
Dalrymple, G.B., 1979, Critical tables for conversion of K-Arages from old to new constants: Geology, v. 7, no. 11, p.558-560.
Danzl, R.B., 1985, Depositional and diagenetic environmentsof the Salt Lake Group at Oneida Narrows, southeasternIdaho: Pocatello, Idaho State University, M.S. thesis, 177 p.
Doelling, H.H., Willis, G.C., Jensen, M.E., Hecker, Suzanne,Case, W.F., and Hand, J.S., 1990, Geologic map of Ante-lope Island, Davis County, Utah: Utah Geological andMineral Survey Map 127, 27 p., scale 1:24,000.
Dubiel, R.F., Potter, C.J., Good, S.C., and Snee, L.W., 1996,Reconstructing an Eocene extensional basin - The WhiteSage Formation, eastern Great Basin, in Beratan, K.K.,editor, Reconstructing the history of basin and rangeextension using sedimentology and stratigraphy: Geolog-ical Society of America Special Paper 303, p. 1-14.
Eardley, A.J., 1944, Geology of the north-central Wasatchmountains, Utah: Geological Society of America Bul-letin, v. 55, no. 7, p. 819-849.
Eardley, A.J., 1955, Tertiary history of north-central Utah, inEardley, A.J., editor, Tertiary and Quaternary geology ofthe eastern Bonneville Basin: Utah Geological SocietyGuidebook to the Geology of Utah 10, p. 37-44.
Franczyk, K.J., Pitman, J.K., and Nichols, D.J., 1990, Sedi-mentology, mineralogy, palynology, and depositional his-tory of some uppermost Cretaceous and lowermost Ter-tiary rocks along the Utah Book and Roan Cliffs east ofthe Green River: U.S. Geological Survey Bulletin 1787-N, 27 p.
Hayden, F.V., 1869, Preliminary field report of the U.S. Geo-logical Survey of Colorado and New Mexico: U.S. Geo-logical and Geographical Survey of the Territory, 3rdAnnual Field Report, 155 p.
Heylmun, E.B., 1965, Reconnaissance of the Tertiary sedi-mentary rocks in western Utah: Utah Geological andMineralogical Survey Bulletin 75, 38 p.
Hintze, L.F. and Stokes, W.L., 1964, Geologic map of north-western Utah: Utah Geological and Mineralogical Sur-vey, scale 1:250,000.
Irvine, T.N., and Barager, W.R.A., 1971, A guide to the chem-ical classification of the common volcanic rocks: Canadi-an Journal of Earth Science, v. 8, p. 523-548.
Larsen, W.N., 1957, Petrology and structure of AntelopeIsland, Davis County, Utah: Salt Lake City, University ofUtah, Ph.D. dissertation, 142 p., scale 1:24,000.
Mann, D.C., 1974, Clastic Laramide sediments of theWasatch hinterland, northeastern Utah: Salt Lake City,University of Utah, M.S. thesis, 112 p.
Maurer, R.E., 1970, Geology of the Cedar Mountains, TooeleCounty, Utah: Salt Lake City, University of Utah, Ph.D.dissertation, 184 p.
McDonald, R.E., 1976, Tertiary tectonics and sedimentaryrocks along the transition-Basin and Range province to
The Geology of Antelope IslandMiscellaneous Publication 00-1 65
Tertiary rocks of Antelope Island - Willis, Jensen
plateau and thrust belt province, Utah, in Hill, J. G. edi-tor, Geology of the Cordilleran hingeline: Rocky Moun-tain Association of Geologists Symposium, p. 281-317.
Miller, D.M., 1985, Geologic map of the Lucin quadrangle,Box Elder County, Utah: Utah Geological and MineralSurvey Map 78, 10 p., scale 1:24,000.
Miller, D.M., 1990, Mesozoic and Cenozoic tectonic evolu-tion of the northeastern Great Basin, in Shaddrick, D.R.,Kizis, J.A., Jr., and Hunsaker, E.L., III, editors, Geologyand ore deposits of the northeastern Great Basin: Geolog-ical Society of Nevada, p. 43-73.
Miller, D.M., 1993, Geologic map of the Crater Island NWquadrangle, Box Elder County, Utah: Utah GeologicalSurvey Map 145, 13 p., scale 1:24,000.
Miller, D.M., Crittenden, M.D., Jr., and Jordan, T.E., 1991,Geologic map of the Lampo Junction quadrangle, BoxElder County, Utah: Utah Geological Survey Map 136,17 p., scale 1:24,000.
Miller, D.M., Nakata, J.K., Hillhouse, W.C., and Hamachi,Bette, in press, New K-Ar ages for Cenozoic volcanicrocks in the northeastern Great Basin and implicationsfor Cenozoic tectonics: U.S. Geological Survey Bulletin.
Miller, D.M. and Schneyer, J.D., 1985, Geologic map of theTecoma quadrangle, Box Elder County, Utah and ElkoCounty, Nevada: Utah Geological and Mineral SurveyMap 77, 8 p., scale 1:24,000.
Miller, D.M., and Schneyer, J.D., 1994, Geologic map of theSunset Pass quadrangle, Box Elder County, Utah: UtahGeological Survey Map 154, 14 p., scale 1:24,000.
Moore, W.J., 1973, Summary of radiometric ages of igneousrocks in the Oquirrh Mountains, north-central Utah: Eco-nomic Geology v. 68, p. 97-101.
Moore, W.J., and McKee, E.H., 1983, Phanerozoic magma-tism and mineralization in the Tooele 1- by 2-degreequadrangle, Utah, in Miller, D.M., Todd, V.R. andHoward, K.A., editors, Tectonic and stratigraphic studiesin the eastern Great Basin: Geological Society of Ameri-ca Memoir 157, p. 183-190.
Moore, W.J. and Sorensen, M.L., 1979, Geologic map of theTooele 1- by 2-degree quadrangle, Utah: U.S. GeologicalSurvey Miscellaneous Investigations Map I-1132, scale1:250,000.
Nelson, M.E., 1971, Stratigraphy and paleontology of theNorwood Tuff and Fowkes Formation, northeastern Utahand southwestern Wyoming: Salt Lake City, Universityof Utah, Ph.D. dissertation, 181 p.
Nelson, M.G., and Miller, D.M., 1990, A Tertiary record ofthe giant marmot Paenemarmota sawrockensis, in north-ern Utah: University of Wyoming, Contributions to Geol-ogy, v. 28, p. 31-37.
Nolan, T.B., 1935, The Gold Hill mining district, Utah: U.S.Geological Survey Professional Paper 177, 172 p., scale1:62,500.
Oviatt, C.G., 1986, Geologic map of the Cutler Dam quadran-gle, Box Elder and Cache Counties, Utah: Utah Geologi-cal and Mineral Survey Map 91, 7 p., scale 1:24,000.
Perkins, M.E., Brown, F.H., Nash, W.P., and Fleck, R.J.,1995, Fallout tuffs of Trapper Creek, Idaho--A record ofMiocene explosive volcanism in the Snake River plainvolcanic province: Geological Society of America Bul-letin, v. 107, no. 12, p. 1,484-1,506.
Perkins, M.E., Brown, F.H., Nash, W.P., McIntosh, William,and Williams, S.K., 1998, Sequence, age and source ofsilicic fallout tuffs in middle to late Miocene basins ofthe northern Basin and Range province: Geological Soci-ety of America Bulletin v. 110, no. 3, p. 344-360.
Rigby, J.K., 1958, Geology of the Stansbury Mountains, inRigby, J.K., editor, Geology of the Stansbury Mountains,Tooele County, Utah: Utah Geological Society Guide-book 13, p. 1-34.
Royse, Frank, Jr., Warner, M.A., and Reese, D.L., 1975,Thrust belt geometry and related stratigraphic problems,Wyoming, Idaho, northern Utah: Rocky Mountain Asso-ciation of Geologists Symposium, p. 41-54.
Ryder, R.T., Fouch, T.D., and Elison, J.H., 1976, Early Ter-tiary sedimentation in the western Uinta basin, Utah:Geological Society of America Bulletin, v. 87, no. 4, p.496-512.
Schaeffer, F.E., 1960, Stratigraphy of the Silver Island Moun-tains, in Schaeffer, F.E., editor, Guidebook to the Geolo-gy of Utah: Utah Geological Society Guidebook 15, p.15-113.
Slentz, L.W., 1955, Tertiary Salt Lake Group in the Great SaltLake Basin: Salt Lake City, University of Utah, Ph.D.dissertation, 58 p.
Smith, R.P. and Nash, W.P., 1976, Chemical correlation ofvolcanic ash deposits in the Salt Lake Group, Utah,Idaho, and Nevada: Journal of Sedimentary Petrology, v.46, p. 930-939.
Smith, R.B., and Bruhn, R.L., 1984, Intraplate extensionaltectonics of the eastern Basin-Range: Inferences on struc-tural style from seismic reflection data, regional tecton-ics, and thermal-mechanical models of brittle-ductiledeformation: Journal of Geophysical Research, v. 89, no.B7, p. 5,733-5,762.
Todd, V.R., 1983, Late Miocene displacement of pre-Tertiaryand Tertiary rocks in the Matlin Mountains, northwesternUtah: Geological Society of America Memoir 157, p.239-270.
Tooker, E.W., and Roberts, R.J., 1961, Preliminary geologicmap and sections of the north end of the Oquirrh Range,Tooele and Salt Lake Counties, Utah: U.S. GeologicalSurvey Mineral Investigations Field Map MF-240, scale1:24,000.
Tooker, E.W., and Roberts, R.J., 1971, Geologic map of theGarfield quadrangle, Salt Lake and Tooele Counties,Utah: U.S. Geological Survey Geologic Quadrangle MapGQ-922, scale 1:24,000.
Van Horn, Richard, 1981, Geologic map of pre-Quaternaryrocks of the Salt Lake City North quadrangle, Davis andSalt Lake Counties, Utah: U.S. Geological Survey Mis-cellaneous Investigations Map I-1330, scale 1:24,000.
The Geology of Antelope Island Utah Geological Survey66
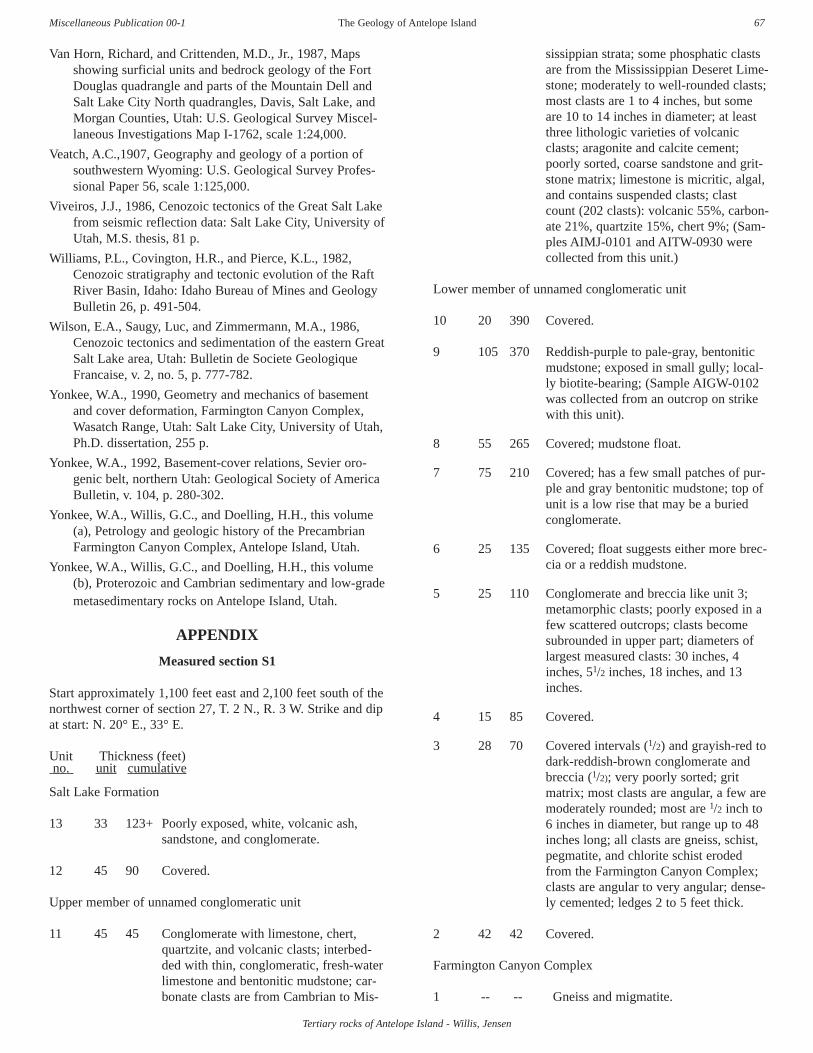
Tertiary rocks of Antelope Island - Willis, Jensen
Van Horn, Richard, and Crittenden, M.D., Jr., 1987, Mapsshowing surficial units and bedrock geology of the FortDouglas quadrangle and parts of the Mountain Dell andSalt Lake City North quadrangles, Davis, Salt Lake, andMorgan Counties, Utah: U.S. Geological Survey Miscel-laneous Investigations Map I-1762, scale 1:24,000.
Veatch, A.C.,1907, Geography and geology of a portion ofsouthwestern Wyoming: U.S. Geological Survey Profes-sional Paper 56, scale 1:125,000.
Viveiros, J.J., 1986, Cenozoic tectonics of the Great Salt Lakefrom seismic reflection data: Salt Lake City, University ofUtah, M.S. thesis, 81 p.
Williams, P.L., Covington, H.R., and Pierce, K.L., 1982,Cenozoic stratigraphy and tectonic evolution of the RaftRiver Basin, Idaho: Idaho Bureau of Mines and GeologyBulletin 26, p. 491-504.
Wilson, E.A., Saugy, Luc, and Zimmermann, M.A., 1986,Cenozoic tectonics and sedimentation of the eastern GreatSalt Lake area, Utah: Bulletin de Societe GeologiqueFrancaise, v. 2, no. 5, p. 777-782.
Yonkee, W.A., 1990, Geometry and mechanics of basementand cover deformation, Farmington Canyon Complex,Wasatch Range, Utah: Salt Lake City, University of Utah,Ph.D. dissertation, 255 p.
Yonkee, W.A., 1992, Basement-cover relations, Sevier oro-genic belt, northern Utah: Geological Society of AmericaBulletin, v. 104, p. 280-302.
Yonkee, W.A., Willis, G.C., and Doelling, H.H., this volume(a), Petrology and geologic history of the PrecambrianFarmington Canyon Complex, Antelope Island, Utah.
Yonkee, W.A., Willis, G.C., and Doelling, H.H., this volume(b), Proterozoic and Cambrian sedimentary and low-grademetasedimentary rocks on Antelope Island, Utah.
APPENDIX
Measured section S1
Start approximately 1,100 feet east and 2,100 feet south of thenorthwest corner of section 27, T. 2 N., R. 3 W. Strike and dipat start: N. 20° E., 33° E.
Unit Thickness (feet)no. unit cumulative
Salt Lake Formation
13 33 123+ Poorly exposed, white, volcanic ash,sandstone, and conglomerate.
12 45 90 Covered.
Upper member of unnamed conglomeratic unit
11 45 45 Conglomerate with limestone, chert,quartzite, and volcanic clasts; interbed-ded with thin, conglomeratic, fresh-waterlimestone and bentonitic mudstone; car-bonate clasts are from Cambrian to Mis-
sissippian strata; some phosphatic clastsare from the Mississippian Deseret Lime-stone; moderately to well-rounded clasts;most clasts are 1 to 4 inches, but someare 10 to 14 inches in diameter; at leastthree lithologic varieties of volcanicclasts; aragonite and calcite cement;poorly sorted, coarse sandstone and grit-stone matrix; limestone is micritic, algal,and contains suspended clasts; clastcount (202 clasts): volcanic 55%, carbon-ate 21%, quartzite 15%, chert 9%; (Sam-ples AIMJ-0101 and AITW-0930 werecollected from this unit.)
Lower member of unnamed conglomeratic unit
10 20 390 Covered.
9 105 370 Reddish-purple to pale-gray, bentoniticmudstone; exposed in small gully; local-ly biotite-bearing; (Sample AIGW-0102was collected from an outcrop on strikewith this unit).
8 55 265 Covered; mudstone float.
7 75 210 Covered; has a few small patches of pur-ple and gray bentonitic mudstone; top ofunit is a low rise that may be a buriedconglomerate.
6 25 135 Covered; float suggests either more brec-cia or a reddish mudstone.
5 25 110 Conglomerate and breccia like unit 3;metamorphic clasts; poorly exposed in afew scattered outcrops; clasts becomesubrounded in upper part; diameters oflargest measured clasts: 30 inches, 4inches, 51/2 inches, 18 inches, and 13inches.
4 15 85 Covered.
3 28 70 Covered intervals (1/2) and grayish-red todark-reddish-brown conglomerate andbreccia (1/2); very poorly sorted; gritmatrix; most clasts are angular, a few aremoderately rounded; most are 1/2 inch to6 inches in diameter, but range up to 48inches long; all clasts are gneiss, schist,pegmatite, and chlorite schist erodedfrom the Farmington Canyon Complex;clasts are angular to very angular; dense-ly cemented; ledges 2 to 5 feet thick.
2 42 42 Covered.
Farmington Canyon Complex
1 -- -- Gneiss and migmatite.
The Geology of Antelope IslandMiscellaneous Publication 00-1 67

Measured Section S2
Start at approximately 850 feet east and 700 feet north of thesouthwest corner of section 22, T. 2 N., R. 3 W. Strike anddip at start: N.10° E., 30° E.
Unit Thickness (feet)no. unit cumulative
Salt Lake Formation
14 305+ 305+ Covered; end section at road.
Upper member of unnamed conglomeratic unit
13 15 115 White, calcareous, pebbly sandstoneand conglomerate; subangular to sub-rounded; clast supported; sandy matrix;bedding is 6 inches to 5 feet thick;clasts to 5 inches near base, to 14 inch-es higher in bed (one notable large clastis a purple metaconglomerate, anotheris a limestone with crinoids); clast esti-mate: metaconglomerate and quartzite50%, metamorphic (gneiss, schist, peg-matite) 10%, carbonate 30%, sandstone5%, and other 5%.
12 15 100 Covered.
11 5 85 Conglomerate; subangular to subround-ed clasts; poorly sorted; from sand-sizeto 6 inches, most are 1 inch to 3 inches;clast estimate: quartzite 30%, carbonate30%, metamorphic 25%, chert 10%,sandstone 5%, and other trace.
10 55 80 Covered.
9 25 25 Very pale, grayish-orange conglomerateand gritstone; calcareous matrix; mostclasts less than 1 inch; a few up to 3inches; poorly sorted; immature; manyflat shale and mudstone clasts; clastestimate: quartzite 35%, metamorphic5%, carbonate 20%, and pale mud-stone, sandstone and chert 40%.
Lower member of unnamed conglomeratic unit
8 120 233 Covered.
7 3 213 Pale-gray, bentonitic mudstone;biotitic; plastic.
6 25 210 Conglomerate like unit 5; interbeddedwith variegated purple and gray ben-tonitic mudstone.
5 40 185 Medium-gray to pinkish-gray conglom-erate in a coarse grit to fine pebblematrix that comprises 50% of the rock;clasts to 16 inches in diameter; clast
count (108 counted): carbonate 32%,metamorphic 29%, quartzite 27%, chert7%, and volcanic 6%.
4 60 145 Covered; float suggests bentonitic mud-stone.
3 20 85 Mostly covered; small areas of poorlyexposed, dark-brownish-red breccia ofmetamorphic clasts from the Farming-ton Canyon Complex.
2 65 65 Covered.
Farmington Canyon Complex
1 -- -- Gneiss and migmatite.
Measured Section S3
Start approximately 900 feet west and 1500 feet south of thenortheast corner of section 16, T. 2 N., R. 3 W. No strike anddip available near start. Strike and dip on unit 5 is N. 5° W.,43° E.
Unit Thickness (feet)no. unit cumulative
Salt Lake Formation
13 98 1135+ Interbedded, pale-gray to white marland volcanic ash; mostly stratified;locally ash is nonstratified.
12 170 1037 Covered.
11 85 867 Interbedded, pale-gray to white marland volcanic ash; locally sandy; strati-fied; ash is mostly reworked; poorlyexposed; nonresistant.
10 197 782 Covered.
9 25 585 Volcanic ash; pale-gray; slightly strati-fied; poorly exposed in small gully.
8 560 560 Covered; scattered poor exposures ofvolcanic ash.
Upper member of unnamed conglomeratic unit
7 30 140 Covered; forms a small topographicrise covered with gravel float that wasdisturbed by gravel quarrying, thenrecontoured; may be a conglomeratebed.
6 75 110 Covered.
Offset south along cuesta about 300 feet.
5 35 35 Very pale-red, pebble and cobble con-
The Geology of Antelope Island
Tertiary rocks of Antelope Island - Willis, Jensen
Utah Geological Survey68

glomerate interbedded with pale-pink-ish-gray limestone; forms a prominent,resistant cuesta for about a mile alongstrike; clasts are angular to subangular;most less than 6 inches but largest to20 inches; largest clasts are quartziteand carbonate; gritstone and limestonematrix; smaller clasts and gritstonematrix are mostly from the FarmingtonCanyon Complex; limestone cementand bedded limestone are sandy, finelycrystalline to micritic, and containsome algal structures; interbeddedlimestone is about 2 feet thick; estimateof composition: matrix 50% (metamor-phic 50%, dolomite 20%, other 10%,limestone cement 20%) and clasts 50%(dolomite 45%, limestone 5%, quartzite40%, metamorphic 10%); clasts arenotable for the variety of lithologies(no volcanic clasts were found in spiteof a thorough search).
Lower member of unnamed conglomeratic unit
4 135 270 Covered.
3 45 135 Moderate- to dark-reddish-brown,muddy sandstone and conglomeratewith metamorphic clasts; very poorlyexposed; forms a few patches of red-dish float throughout interval.
2 90 90 Covered; topography suggests Tertiarybeneath cover.
Farmington Canyon Complex
1 -- -- Gneiss and migmatite.
Measured Section S4
Start at approximately 2,500 feet west and 1,600 feet south ofthe northeast corner of section 9, T. 2 N., R. 3 W. Strike anddip near start: N. 5° E. 37° E.
Unit Thickness (feet)no. unit cumulative
Upper member of unnamed conglomeratic unit
6 20 530+ Limestone and conglomerate; poorlyexposed; forms a small knoll; (this out-crop is the same as unit 5 of measuredsection S3).
Lower member of unnamed conglomeratic unit
5 220 510 Covered.4 20 290 Poorly exposed; dark-reddish-brown
slope with metamorphic grit mixedwith Paleozoic carbonate and quartzite
clasts; float is silty and has abundantmetamorphic materials.
3 190 270 Pale-gray conglomerate; very poorlysorted; subangular to subroundedclasts; up to 2-foot-diameter clastscommon in lower part; sandy to grittymatrix with some metamorphic gneissand pegmatite; bedding is poor toabsent; no imbrication could be found;clasts with corals, crinoids, and bra-chiopods are present, but most clastsare nonfossiliferous; clast count nearbase (102 counted): carbonate 74%,quartzite 20%, chert 4%, metamorphic1%, and other 1%; clast count near top(125 counted): carbonate 78%,quartzite 17%, chert 2%, metamorphic2%, and other 1%; limestone dominatesover dolomite among the smaller clasts,but all the larger carbonate clasts aredolomite; largest boulders (those over18 inches in diameter) are dolomite andquartzite; measured in-place boulders:40 inches, 15 inches, and 43 inches;boulders up to 7 feet in diameter arepresent in wash and on a boulder-cov-ered beach platform about a hundredfeet to the south that are believed tohave eroded from this unit.
2 80 80 Covered; float is mostly gravel andboulders deposited by Lake Bonnevillethat were reworked from Tertiary out-crops.
Farmington Canyon Complex
1 -- -- Gneiss and migmatite.
Measured Section S5
North tip of Ladyfinger. Start approximately 200 feet northand 500 feet east of the southwest corner of section 19, T. 4N., R. 3 W. Outcrops form narrow strip along shoreline.Stated thicknesses are questionable because the outcrops arefolded, units may be duplicated by several faults, and beddingis poorly defined.
Unit Thickness (feet)no. unit cumulative
Salt Lake Formation
18 -- -- Covered; top of exposed section.17 37 760+ Interbedded mudstone and sedimentary
breccia; pale-brown where wet, pale-orange-pink to light-brown where dry;crudely bedded; angular clasts; poorlysorted from clay to 1 foot diameterclasts; clasts are estimated at 90%light-colored quartzite, 10% other,
Tertiary rocks of Antelope Island - Willis, Jensen
The Geology of Antelope IslandMiscellaneous Publication 00-1 69

including micaceous shale, argillite,and dark quartzite; fine-grained inter-vals have abundant matrix-supportedangular clasts.
16 120 723 Covered.
15 45 603 Interbedded mudstone and breccia;pale-pinkish-gray; poorly sorted; mud-stone has scattered clasts to 6 inches;breccia has clasts to 18 inches.
14 60 558 Covered.
13 90 498 Sedimentary breccia like unit 10 with afew poorly sorted sandstone beds;quartzite clasts to 2.5 feet in diameter;clasts composition varies but averagesabout 90% quartzite, 5% limestone, 3%olive gray shale, and 2% dark gray toblack argillic quartzite.
strike and dip N. 45° E., 25° NW.
12 40 408 Sedimentary breccia like unit 10;white- to light-gray; clasts: quartzite95%, olive-gray shale 4%, darkquartzite, and other 1-2%; quartziteboulders to 2.75 feet in diameter.
11 15 368 Sandstone and breccia; poorly sorted;clasts to 3 inches, medium-gray; minorvolcanic ash; grades upward to a brec-cia with mostly quartzite clasts.
10 140 353 Sedimentary breccia; poorly sorted;clasts to 2 feet in diameter; similar tobreccia units below but has higher per-centage of quartzite clasts; clasts:quartzite 50%, shale 35%, limestone10%, and other 5%, in some bedsquartzite up to 90%; in this unitquartzite clasts are mostly white topale-gray, whereas in lower units someare dark gray, brownish gray, and red-dish gray.
9 28 213 Reddish-gray mudstone and siltstonewith interbedded sedimentary breccia;breccia has olive-gray shale, quartzite,and limestone clasts similar to unitsbelow.
8 42 185 Same as units 2 and 5; gray quartziteclasts dispersed throughout.
7 54 143 Coarse, brown breccia with silt andsandy matrix; similar to unit 6 but withfewer fine- bedded layers; clasts areangular to very angular and are up totwo feet in diameter; clasts are about70% olive-colored shale, 20%
quartzite, and 10% other; crude bed-ding.
6 12 89 Similar to unit 4; brown breccia (50%)interbedded with fine-grained siltstoneand sandstone (50%); most clasts in thebreccia are angular shale up to 8 inchesin diameter similar to those describedin unit 3; the fine-grained part of theunit has a few clasts up to 2 inches indiameter that make up about 5% of thetotal volume, and a few stringer andisolated "clots" similar to the coarserpart of the unit; the contact with unit 5is gradational.
5 29 77 Same as unit 3.
4 35 48 Sedimentary breccia; very poorly sort-ed, pale- to medium-brown mudstonewith silt and fine-grained sand matrix;clasts range up to 12 inches in diame-ter; clasts consist of very angular, light-to moderate-olive-gray, dusky-yellow,and light-olive-brown shale; silty,dolomitic limestone; and quartzite;shale clasts, which are dominant, areplaty and nonresistant; unit has crudebedding; clast estimate: shale 50%,quartzite 40%, limestone 8%, and blackargillic quartzite—less than 2%; unit iscut by numerous faults with displace-ments of up to a few feet.
3 12 13 Medium-gray, very fine-grained,reworked volcanic ash interbedded andinterfaulted with brown sedimentarybreccia; laminated but no partings; ashhas some layers that are medium tocoarse grained with a few angularclasts up to 2 inches in diameter; mostof unit is glass shards; has suspendedobsidian grains; breccia clasts are angu-lar, brown to grayish-green shale,quartzite, argillite, and micaceousshale; quartzite clasts are up to 15 inch-es in diameter; shale are up to about 3inches; cut by numerous faults, thusactual thickness is uncertain.
2 1 1 Breccia, pale-reddish-brown, sandymatrix, clasts mostly quartzite withminor greenish- gray shale.
Tintic Quartzite
1 -- -- Intensely fractured and brecciated;locally conglomeratic.
The Geology of Antelope Island
Tertiary rocks of Antelope Island - Willis, Jensen
Utah Geological Survey70

ABSTRACTThe logs and sample cuttings from the Anschutz #1
Orchard well, NW1/4 SW1/4 section 34, T. 3 N., R. 3 W., onAntelope Island and seismic reflection data across the islandmay indicate the presence of Paleozoic rocks below a thrustfault at a depth of 1,354 feet (410 m). Recently released dataare presented as evidence and brief arguments are given.
INTRODUCTION
Antelope Island, probably the best known island in thestate of Utah, is in the southeast part of Great Salt Lake. Theisland is 15 miles (24 km) long, and about 5 miles (8 km)wide with its highest peak reaching 6,597 feet (2,010 m), orabout 2,400 feet (730 m) above the lake level. The geologyof Antelope Island was first investigated in 1850 by HowardStansbury (1852) and later by others. Comprehensive geo-logic maps were prepared by Larsen (1957) of the Universityof Utah, and Doelling and others (1990) of the Utah Geologi-cal Survey. These investigations described metamorphosedand deformed Precambrian rocks that are disconformablyoverlain by Late Proterozoic and Cambrian metasedimentaryrocks, which in turn are unconformably overlain by early Ter-tiary rocks.
Antelope Island was previously shown in cross sectionwith high-angle normal faults (Larsen, 1957; Doelling andothers, 1990) devoid of thrusting. Recent data show thatthrusting is present at Antelope Island, with Precambrian andCambrian metamorphic rocks overlying a thick section ofPaleozoic and possibly Mesozoic sedimentary rocks.
During 1971 through 1983, the writer Hansen consultedwith The Anschutz Corporation of Denver, Colorado, coordi-nating various geological and geophysical work on the island.In 1981 the surface estate of the island was acquired by theState of Utah from Anschutz.
Appreciation is expressed to The Anschutz Corporationfor permission to publish this information, to Frank Owingsand Floyd Moulton who encouraged this study, and to anony-mous reviewers.
GEOPHYSICAL DATA
Forty miles (64 km) of heliportable shothole seismic wascompleted on Antelope Island in 1980. Record quality was
good and reflection events were imaged to 6.0 seconds after24-fold common-depth-point processing. We interpretedthrust planes between discordant reflectors, including a 3 to 4second “thick” sedimentary section. Magnetotelluric andmagnetic data were integrated with the seismic interpretation.We concluded that the depth to magnetic basement is nearly40,000 feet (12 km), and that Precambrian and Paleozoicrocks at the surface, near the #1 Orchard well, appear to beunderlain by a thick interval of low-resistivity rocks thatcould be Mesozoic in age.
In 1992, some of the seismic records were reprocessedusing Dip Moveout (DMO) and Wave Equation Migrationtechniques. A reinterpreted east-west DMO final stack sec-tion is shown in figure 1a and an unmarked version is provid-ed as figure 1b. Our geophysical interpretation shows imbri-cate east and southeast thrusting followed by low-angleextension and normal faulting, as shown in figure 2 cross sec-tion A-A'. The seismic-line location is shown on the indexmap.
GEOLOGIC DATA
In 1976, a water well on Antelope Island, the Anschutz#1 Orchard, NW1/4 SW1/4 section 34, T. 3 N., R. 3 W. (seeindex map in figure 2), was drilled and logged to a depth of2,077 feet (629 m). The well spudded in Cenozoic valley fill,consisting of granitic debris, quartzite, clay, black shale, vol-canic tuff, sand, and mica. This material was logged to adepth of 1,220 feet (370 m), where a granite or granite gneissand some tuffaceous rock were encountered. Beginning at1,354 feet (410 m), a limestone and dolomitic interval wasdrilled to the total depth. Figure 3 shows the electrical andgamma ray logs from the well.
The carbonate cuttings were examined in 1978 bymicropaleontologist Morris S. Petersen of Brigham YoungUniversity. Dr. Petersen reported, "It is my opinion that theserocks represent the Mississippian section in central Utah."The writers concur with this interpretation.
Doelling and others (1990) noted large boulders of Mis-sissippian carbonate rock 10 feet (3 m) or more in diameteron the east side of the island. In 1994 the writer McCarleywas directed by Doelling to an outcrop above MushroomSprings (figure 2) where carbonate boulders and abundantquartzite clasts were noted. The carbonates contain abundant
ANTELOPE ISLAND, NEW EVIDENCE FOR THRUSTING
byAlan R. Hansen1 and Lon A. McCarley2
1Consulting Geologist, Lakewood, Colorado2Consulting Geophysicist, Englewood, Colorado

Antelope Island, new evidence for thrusting - Hansen, McCarley
The Geology of Antelope Island Utah Geological Survey72
Figure 1.
East-w
est seismic section across A
ntelope Island to the eastern shoreline of the Great Salt L
ake. Both the interpreted version and the unm
arked section are given.
SE
ISM
IC T
IME
SE
CT
ION
: FIN
AL
DM
O S
TAC
KA
. Precam
brianB
. Paleozoic &
possible Mesozoic section w
ith thrust faults & low
-angle normal fault
C. R
ooted magnetic basem
entD
. Tertiary

Antelope Island, new evidence for thrusting - Hansen, McCarley
The Geology of Antelope IslandMiscellaneous Publication 00-1 73
Figure 2. East-west geologic cross section A-A' and index map showing the seismic line, Anschutz #1 Orchard well, the Amoco Utah State #1-Ewell, and major faulting. Cz = post-thrusting Cenozoic rocks and deposits, Mz-Pz = possible Mesozoic and Paleozoic sedimentary rocks, M = Mis-sissippian rocks, Pz = Paleozoic sedimentary rocks, pC- = Upper Proterozoic and Archean to Lower Proterozoic Farmington Canyon Complex.

Antelope Island, new evidence for thrusting - Hansen, McCarley
The Geology of Antelope Island Utah Geological Survey74
Figure 3. Electrical resistivity and gamma-ray logs of the Anschutz #1 Orchard well, NW1/4 SW1/4 section 34, T. 3 N., R. 3 W.

Antelope Island, new evidence for thrusting - Hansen, McCarley
crinoid debris and have been identified by Norman Silberling(Consulting Geologist, Lakewood, Colorado) and Peter Shee-han (Geologist of the Milwaukee Public Museum, Milwau-kee, Wisconsin) as being from the upper Ordovician FishHaven Dolomite. The quartzite is tentatively identified asbeing from the Ordovician Swan Peak Quartzite. This boul-der/clast material is probably erosional debris from an earlierthrust underlying the Precambrian granite.
CONCLUSIONS
Antelope Island is a topographic and structural high thathas been affected by multiple episodes of thrusting. Missis-sippian and older Paleozoic-age rocks underlie the alloctho-nous Precambrian section. Our geologic interpretation in fig-ure 2 shows that sedimentary rocks at least 30,000 feet (9.1km) thick may exist beneath the island.
REFERENCES
Doelling, H.H., 1989, Antelope Island State Park--The histo-ry, the geology, and wise planning for future develop-ment: Utah Geological and Mineral Survey, SurveyNotes v. 23, no. 1, p. 2-14.
Doelling, H.H., Willis, G.C., Jensen, M.E., Hecker, Suzanne,Case, W.F., and Hand, J.S., 1990, Geologic map of Ante-lope Island, Davis County, Utah: Utah Geological andMineral Survey Map 127, scale 1:24,000.
Larsen, W.N., 1957, Petrology and structure of AntelopeIsland, Davis County, Utah: Salt Lake City, University ofUtah, Ph.D. dissertation, 142 p.
Stansbury, Howard, 1852 (reprinted in 1988), Exploration andsurvey of the valley of the Great Salt Lake, including areconnaissance of a new route through the Rocky Moun-tains: Philadelphia, Lippincott, Grambo & Co., 487 p.[U.S. 32nd Congress, Special Session, Senate ExecutiveDocument 3](reprinted with the title “Exploration of thevalley of the Great Salt Lake” by Smithsonian InstitutionPress, Washington D.C. 421 p.).
The Geology of Antelope IslandMiscellaneous Publication 00-1 75

The Geology of Antelope Island Utah Geological Survey76

INTRODUCTION
The late Pleistocene and Holocene stratigraphy of GreatSalt Lake and the Great Salt Lake Desert is preserved at vari-ous lake-margin localities, including cored or trenched basindepositional sites, archeological sites, and islands (Murchi-son, 1989a). Antelope Island has been isolated during partsof this century due to lake rises, and has thus not been studiedin detail. The historic high level 4,211.85 feet (1,283.77 m),reached during the 1986-1987 lake rise, produced littoraldeposits and new exposures that were investigated betweenOctober 1 and December 6, 1987, as part of the Utah Geolog-ical Survey (UGS) Antelope Island Project. Our part of thestudy concerned Holocene geologic history, processes, andgeomorphology.
Age control on the stratigraphy of late Pleistocene andHolocene Great Salt Lake units was limited beforeresearchers obtained numerous radiocarbon age estimates onsamples collected at Antelope Island between 1986 and 1988.A new chronology of the hydrographic history of Great SaltLake was under investigation at the inception of the UGSAntelope Island project, and Antelope Island offered a uniqueopportunity for geographers and geologists to study semi-pristine littoral units. A wealth of chronostratigraphic infor-mation was extracted from three localities on the island (fig-ure 1).
The Island's conspicuous Lake Bonneville shorelines(Stansbury, Bonneville, and Provo Levels) have been, andcontinue to be studied, but relatively few researchers haveconcentrated on the post-Pleistocene (Holocene) history ofthe lake (see for examples Gilbert, 1890; Eardley and others,1957; Crittenden, 1963; Morrison, 1965; Scott and others,1983). Ross (1973) made some morphostratigraphic studiesof post-Bonneville lacustrine deposits at Lady Finger Point,White Rock Bay, and Bridger Bay (see figure 1), often erro-neously incorporating shorelines of earlier Lake Bonnevillefluctuations. Spencer (1983) conducted geochemical andMcKenzie and Eberli (1987) conducted isotope chronostrati-graphic studies on cores taken west of Antelope Island at 41°N., 112° 20' W. The geomorphic evidence and the geochemi-cal and isotope chronostratigraphic data from cores were uti-lized to estimate the timing of the late Holocene high lakelevel of 4,221 feet (1,286.5 m) (Currey and others, 1988a).
Atwood and Mabey (1988 and this volume) studied shorelinefeatures around Antelope Island produced by the 1986-1987lake rise, revealing littoral deposits and erosional cuts up toabout 6 feet above the static water line of 4,211.85 ft (1,283.7m).
LATE PLEISTOCENE AND EARLYHOLOCENE UNITS
Seagull Point contains a sequence of sediments whichrange in age from post-Provo (<14,200 14C yr B.P.) (Curreyand Burr, 1988) to late Holocene (figure 2). Pre-Gilbert redbeds discussed by Currey and others (1988b) lie uncon-formably over a groundwater(?)-stained boulder unit of theBonneville Alloformation. The red beds are calcareous muds(clays) and minor sands that were reddened off-site anddeposited basinward on newly exposed flats about 13,000 14Cyr B.P. (Currey and others, 1988b). The red beds range inthickness from 3 to 5 feet (0.9 to 1.5 m) with a 6.5 degreeeastward dip. This red-bed unit contains an oxidized ostra-code-rich red sand horizon averaging 0.75 inch (1.9 cm) thatis consistent and traceable throughout the exposure. Thissand is overlain by more red beds and the top of the red-bedunit is overlain unconformably by an ostracode-rich fine-sandlayer that is up to 0.3 inch (0.76 cm) thick (Murchison,1989a). It is assumed (Murchison, 1989a) that both of theseostracode-rich assemblages were probably deposited during ahiatus when the lake was lower than Seagull Point and salini-ties were higher, killing the ostracodes.
A Gilbert transgressive green sand unit 1 to 2 feet thick(0.3 to 0.6 m) overlies the pre-Gilbert red beds. The sandexhibits alternating color bands composed of fine, well-sortedquartz grains with rare silt and clay stringers. Some layershave been stained orange and brown, probably due to ground-water(?) oxidation. This green sand contains an assemblageof gastropods in the upper portion. It is therefore similar to,and correlated with, a green sand unit deposited at the PublicShooting Grounds, near Corrine, Utah, between 11,000 and10,000 14C yr B.P. (Murchison, 1989a). Both units containsimilar sand texture, color, and gastropod death assemblages.A Gilbert regressive sand unit unconformably overlies theGilbert transgressive green sands locally at Seagull Point.This regressive unit is composed of wave-rippled beds ofwell-sorted carbonate sands of coarse to medium texture,
LATE PLEISTOCENE AND HOLOCENE SHORELINE STRATIGRAPHY ON ANTELOPE ISLAND
by Stuart B. Murchison1 and William E. Mulvey2
1formerly Department of Geography, University of Utah2formerly Utah Geological Surveynow at 4408 Surry Ridge Circle
Apex, NC 27502

Late Pleistocene and Holocene shoreline stratigraphy on Antelope Island - Murchison, Mulvey
The Geology of Antelope Island Utah Geological Survey78
Figure 1. Aerial photograph of Antelope Island showing sites discussed in this paper and inserts of the sites.
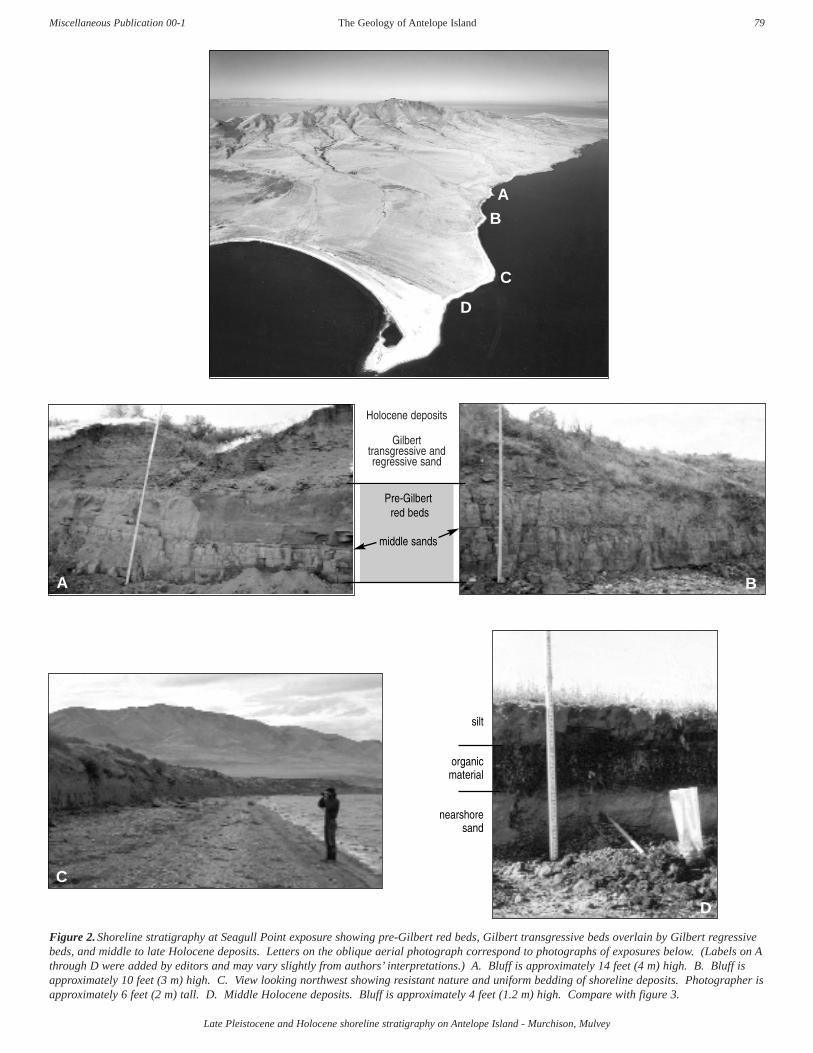
Late Pleistocene and Holocene shoreline stratigraphy on Antelope Island - Murchison, Mulvey
The Geology of Antelope IslandMiscellaneous Publication 00-1 79
Figure 2. Shoreline stratigraphy at Seagull Point exposure showing pre-Gilbert red beds, Gilbert transgressive beds overlain by Gilbert regressivebeds, and middle to late Holocene deposits. Letters on the oblique aerial photograph correspond to photographs of exposures below. (Labels on Athrough D were added by editors and may vary slightly from authors’ interpretations.) A. Bluff is approximately 14 feet (4 m) high. B. Bluff isapproximately 10 feet (3 m) high. C. View looking northwest showing resistant nature and uniform bedding of shoreline deposits. Photographer isapproximately 6 feet (2 m) tall. D. Middle Holocene deposits. Bluff is approximately 4 feet (1.2 m) high. Compare with figure 3.
A
B
C
D
Holocene deposits
Gilbert transgressive andregressive sand
Pre-Gilbertred beds
middle sands
silt
organicmaterial
nearshoresand
A
C
D
B

Late Pleistocene and Holocene shoreline stratigraphy on Antelope Island - Murchison, Mulvey
which are interlaminated with clays and silts (Murchison,1989a).
The sand unit that overlies the Gilbert regressive rippledbeds is fine to medium grained and lacks defined bedding.The 6 feet thickness (1.8 m), texture, and relatively low rippleindex suggests that this sand unit was deposited as a dunecomplex after the Gilbert regression sometime after 10,00014C yr B.P. (Murchison, 1989a).
A late Gilbert episode, documented by Rubin andAlexander's (1958) 9,730 ± 350 yr B.P. age estimation atHooper, Utah, is probably expressed as transgressive pebblesand cobbles that overlie the dune sand unit between 4,225and 4,228 feet (1,287 and 1,288 m). The pebbles and cobblesgrade into cemented sands lakeward as low as 4,224 feet(1,287 m). This coarse-grained material is interpreted as apost-Gilbert transgression to the 4,230 foot (1,289.3 m) levelseen as beach crests and berms around the lake (Murchison,1989a).
MIDDLE HOLOCENE UNITS
The middle Holocene, sometimes referred to as theAltithermal, has been described as a period of reduced mois-ture effectiveness and low lake levels in the western andsouthwestern United States (Antevs, 1955; Morrison, 1966;Currey 1980; Madsen, 1980; Currey and James, 1982;Mehringer, 1985). This arid environment was assumed tohave been prevalent at Great Salt Lake, although no directcorroborating radiometric evidence of lacustrine depositionhas been recovered. At Seagull Point, chronostratigraphicevidence supports and documents lower lake levels (Murchi-son, 1989a).
On the eastern end of Seagull Point, middle Holocenemarsh deposits crop out as wedge-shaped bodies of organicsediments. The organic sediments probably accumulatedbehind berms or barrier beaches and are thought to continuelaterally along strike throughout the length of the Point(Murchison, 1989a).
The oldest and most organic sediment sample (8.0 gm ofhumates) was taken from a 2-inch-thick (5 cm) bed at an ele-vation of 4,210 feet (1,283 m)(figure 3A). The sample wasoverlain by a 6-inch-thick (15 cm) oxidized coarse sand unitand a white-gray calcareous, medium-grained sand unit witha modern soil developed on it. The sample has a radiocarbonage of 7,650 ± 90 yr B.P. (- 26.4 0/00
13C; Beta 25290). Thehigh organic content suggests accumulation on a lagoon floorduring a protracted lake rise and stabilization level. The pres-ence of oxidized coarse sands overlying the organic sedimentinfers a drop in lake level and subaerial exposure after depo-sition (Murchison, 1989a), supporting the theory of Currey(1980) and Currey and James (1982) for partial desiccation inpost-Bonneville times.
West of the Beta 25290 sample, a 6-inch (15 cm) wedge-shaped organic bed is found at 4,211 feet (1,283 m)(figure3B). The radiocarbon age of a sample (2.5 gm of humates) ofthe organic marshy material is 5,890 ± 120 yr B.P. (-26.1 0/0013C; Beta 26629). This organic stratum overlies a coarse sandunit 10 inches (25 cm) thick and is conformably overlain by agraded, white to gray, medium clean sand unit 4 inches (10
The Geology of Antelope Island Utah Geological Survey80
ASE
BNW
SEAGULL POINTRADIOCARBON AGE SITES
1
4214 ft.
Beta 252893,450 ± 250 yr B.P.
Beta 266295,890 ± 120 yr B.P.
Beta 252907,650 ± 90 yr B.P.
0 feet
modern soil
silty sand
sand
oxidized sand
organic sediments
Legend
Figure 3. Stratigraphic columns on the eastern part of the SeagullPoint exposure (near figure 2D), with an explanation of symbolsand patterns (modified from Murchison, 1989a).
Figure 4. Aerial photograph of Unicorn Point showing surveyedshoreline features (from Murchison, 1989a).
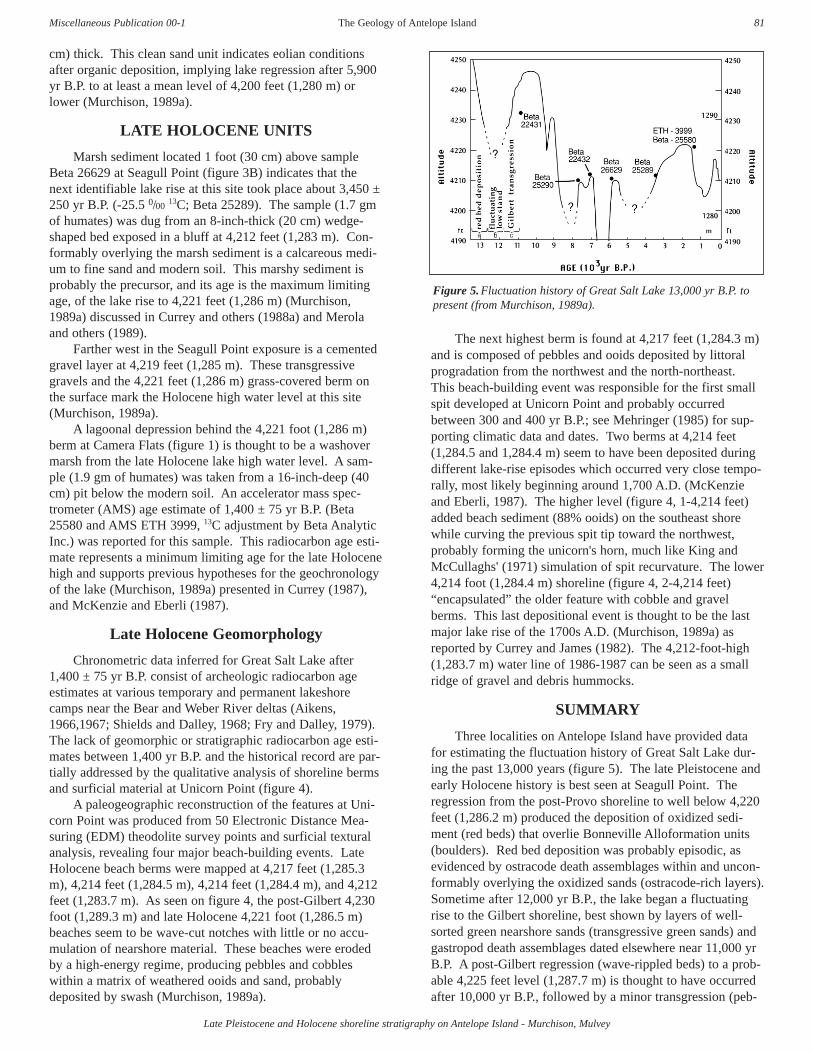
Late Pleistocene and Holocene shoreline stratigraphy on Antelope Island - Murchison, Mulvey
cm) thick. This clean sand unit indicates eolian conditionsafter organic deposition, implying lake regression after 5,900yr B.P. to at least a mean level of 4,200 feet (1,280 m) orlower (Murchison, 1989a).
LATE HOLOCENE UNITS
Marsh sediment located 1 foot (30 cm) above sampleBeta 26629 at Seagull Point (figure 3B) indicates that thenext identifiable lake rise at this site took place about 3,450 ±250 yr B.P. (-25.5 0/00
13C; Beta 25289). The sample (1.7 gmof humates) was dug from an 8-inch-thick (20 cm) wedge-shaped bed exposed in a bluff at 4,212 feet (1,283 m). Con-formably overlying the marsh sediment is a calcareous medi-um to fine sand and modern soil. This marshy sediment isprobably the precursor, and its age is the maximum limitingage, of the lake rise to 4,221 feet (1,286 m) (Murchison,1989a) discussed in Currey and others (1988a) and Merolaand others (1989).
Farther west in the Seagull Point exposure is a cementedgravel layer at 4,219 feet (1,285 m). These transgressivegravels and the 4,221 feet (1,286 m) grass-covered berm onthe surface mark the Holocene high water level at this site(Murchison, 1989a).
A lagoonal depression behind the 4,221 foot (1,286 m)berm at Camera Flats (figure 1) is thought to be a washovermarsh from the late Holocene lake high water level. A sam-ple (1.9 gm of humates) was taken from a 16-inch-deep (40cm) pit below the modern soil. An accelerator mass spec-trometer (AMS) age estimate of 1,400 ± 75 yr B.P. (Beta25580 and AMS ETH 3999, 13C adjustment by Beta AnalyticInc.) was reported for this sample. This radiocarbon age esti-mate represents a minimum limiting age for the late Holocenehigh and supports previous hypotheses for the geochronologyof the lake (Murchison, 1989a) presented in Currey (1987),and McKenzie and Eberli (1987).
Late Holocene Geomorphology
Chronometric data inferred for Great Salt Lake after1,400 ± 75 yr B.P. consist of archeologic radiocarbon ageestimates at various temporary and permanent lakeshorecamps near the Bear and Weber River deltas (Aikens,1966,1967; Shields and Dalley, 1968; Fry and Dalley, 1979).The lack of geomorphic or stratigraphic radiocarbon age esti-mates between 1,400 yr B.P. and the historical record are par-tially addressed by the qualitative analysis of shoreline bermsand surficial material at Unicorn Point (figure 4).
A paleogeographic reconstruction of the features at Uni-corn Point was produced from 50 Electronic Distance Mea-suring (EDM) theodolite survey points and surficial texturalanalysis, revealing four major beach-building events. LateHolocene beach berms were mapped at 4,217 feet (1,285.3m), 4,214 feet (1,284.5 m), 4,214 feet (1,284.4 m), and 4,212feet (1,283.7 m). As seen on figure 4, the post-Gilbert 4,230foot (1,289.3 m) and late Holocene 4,221 foot (1,286.5 m)beaches seem to be wave-cut notches with little or no accu-mulation of nearshore material. These beaches were erodedby a high-energy regime, producing pebbles and cobbleswithin a matrix of weathered ooids and sand, probablydeposited by swash (Murchison, 1989a).
The next highest berm is found at 4,217 feet (1,284.3 m)and is composed of pebbles and ooids deposited by littoralprogradation from the northwest and the north-northeast.This beach-building event was responsible for the first smallspit developed at Unicorn Point and probably occurredbetween 300 and 400 yr B.P.; see Mehringer (1985) for sup-porting climatic data and dates. Two berms at 4,214 feet(1,284.5 and 1,284.4 m) seem to have been deposited duringdifferent lake-rise episodes which occurred very close tempo-rally, most likely beginning around 1,700 A.D. (McKenzieand Eberli, 1987). The higher level (figure 4, 1-4,214 feet)added beach sediment (88% ooids) on the southeast shorewhile curving the previous spit tip toward the northwest,probably forming the unicorn's horn, much like King andMcCullaghs' (1971) simulation of spit recurvature. The lower4,214 foot (1,284.4 m) shoreline (figure 4, 2-4,214 feet)“encapsulated” the older feature with cobble and gravelberms. This last depositional event is thought to be the lastmajor lake rise of the 1700s A.D. (Murchison, 1989a) asreported by Currey and James (1982). The 4,212-foot-high(1,283.7 m) water line of 1986-1987 can be seen as a smallridge of gravel and debris hummocks.
SUMMARY
Three localities on Antelope Island have provided datafor estimating the fluctuation history of Great Salt Lake dur-ing the past 13,000 years (figure 5). The late Pleistocene andearly Holocene history is best seen at Seagull Point. Theregression from the post-Provo shoreline to well below 4,220feet (1,286.2 m) produced the deposition of oxidized sedi-ment (red beds) that overlie Bonneville Alloformation units(boulders). Red bed deposition was probably episodic, asevidenced by ostracode death assemblages within and uncon-formably overlying the oxidized sands (ostracode-rich layers).Sometime after 12,000 yr B.P., the lake began a fluctuatingrise to the Gilbert shoreline, best shown by layers of well-sorted green nearshore sands (transgressive green sands) andgastropod death assemblages dated elsewhere near 11,000 yrB.P. A post-Gilbert regression (wave-rippled beds) to a prob-able 4,225 feet level (1,287.7 m) is thought to have occurredafter 10,000 yr B.P., followed by a minor transgression (peb-
The Geology of Antelope IslandMiscellaneous Publication 00-1 81
Figure 5. Fluctuation history of Great Salt Lake 13,000 yr B.P. topresent (from Murchison, 1989a).
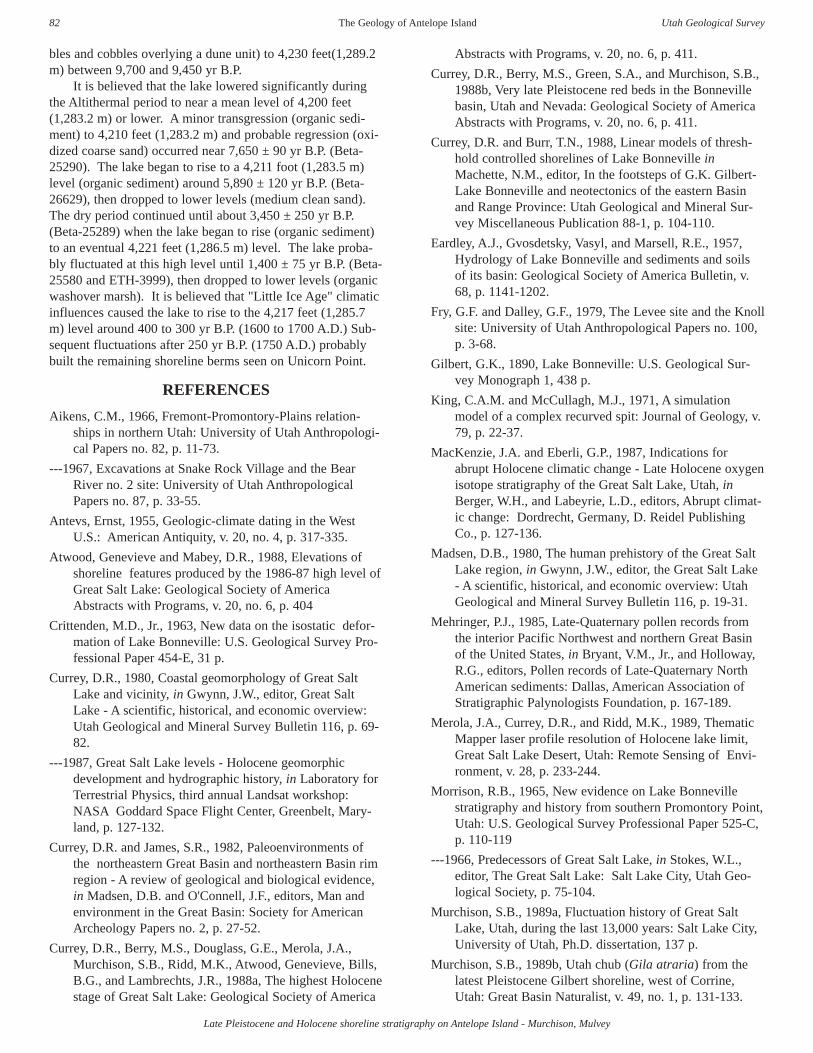
Late Pleistocene and Holocene shoreline stratigraphy on Antelope Island - Murchison, Mulvey
bles and cobbles overlying a dune unit) to 4,230 feet(1,289.2m) between 9,700 and 9,450 yr B.P.
It is believed that the lake lowered significantly duringthe Altithermal period to near a mean level of 4,200 feet(1,283.2 m) or lower. A minor transgression (organic sedi-ment) to 4,210 feet (1,283.2 m) and probable regression (oxi-dized coarse sand) occurred near 7,650 ± 90 yr B.P. (Beta-25290). The lake began to rise to a 4,211 foot (1,283.5 m)level (organic sediment) around 5,890 ± 120 yr B.P. (Beta-26629), then dropped to lower levels (medium clean sand).The dry period continued until about 3,450 ± 250 yr B.P.(Beta-25289) when the lake began to rise (organic sediment)to an eventual 4,221 feet (1,286.5 m) level. The lake proba-bly fluctuated at this high level until 1,400 ± 75 yr B.P. (Beta-25580 and ETH-3999), then dropped to lower levels (organicwashover marsh). It is believed that "Little Ice Age" climaticinfluences caused the lake to rise to the 4,217 feet (1,285.7m) level around 400 to 300 yr B.P. (1600 to 1700 A.D.) Sub-sequent fluctuations after 250 yr B.P. (1750 A.D.) probablybuilt the remaining shoreline berms seen on Unicorn Point.
REFERENCES
Aikens, C.M., 1966, Fremont-Promontory-Plains relation-ships in northern Utah: University of Utah Anthropologi-cal Papers no. 82, p. 11-73.
---1967, Excavations at Snake Rock Village and the BearRiver no. 2 site: University of Utah AnthropologicalPapers no. 87, p. 33-55.
Antevs, Ernst, 1955, Geologic-climate dating in the WestU.S.: American Antiquity, v. 20, no. 4, p. 317-335.
Atwood, Genevieve and Mabey, D.R., 1988, Elevations ofshoreline features produced by the 1986-87 high level ofGreat Salt Lake: Geological Society of AmericaAbstracts with Programs, v. 20, no. 6, p. 404
Crittenden, M.D., Jr., 1963, New data on the isostatic defor-mation of Lake Bonneville: U.S. Geological Survey Pro-fessional Paper 454-E, 31 p.
Currey, D.R., 1980, Coastal geomorphology of Great SaltLake and vicinity, in Gwynn, J.W., editor, Great SaltLake - A scientific, historical, and economic overview:Utah Geological and Mineral Survey Bulletin 116, p. 69-82.
---1987, Great Salt Lake levels - Holocene geomorphicdevelopment and hydrographic history, in Laboratory forTerrestrial Physics, third annual Landsat workshop:NASA Goddard Space Flight Center, Greenbelt, Mary-land, p. 127-132.
Currey, D.R. and James, S.R., 1982, Paleoenvironments ofthe northeastern Great Basin and northeastern Basin rimregion - A review of geological and biological evidence,in Madsen, D.B. and O'Connell, J.F., editors, Man andenvironment in the Great Basin: Society for AmericanArcheology Papers no. 2, p. 27-52.
Currey, D.R., Berry, M.S., Douglass, G.E., Merola, J.A.,Murchison, S.B., Ridd, M.K., Atwood, Genevieve, Bills,B.G., and Lambrechts, J.R., 1988a, The highest Holocenestage of Great Salt Lake: Geological Society of America
Abstracts with Programs, v. 20, no. 6, p. 411.
Currey, D.R., Berry, M.S., Green, S.A., and Murchison, S.B.,1988b, Very late Pleistocene red beds in the Bonnevillebasin, Utah and Nevada: Geological Society of AmericaAbstracts with Programs, v. 20, no. 6, p. 411.
Currey, D.R. and Burr, T.N., 1988, Linear models of thresh-hold controlled shorelines of Lake Bonneville inMachette, N.M., editor, In the footsteps of G.K. Gilbert-Lake Bonneville and neotectonics of the eastern Basinand Range Province: Utah Geological and Mineral Sur-vey Miscellaneous Publication 88-1, p. 104-110.
Eardley, A.J., Gvosdetsky, Vasyl, and Marsell, R.E., 1957,Hydrology of Lake Bonneville and sediments and soilsof its basin: Geological Society of America Bulletin, v.68, p. 1141-1202.
Fry, G.F. and Dalley, G.F., 1979, The Levee site and the Knollsite: University of Utah Anthropological Papers no. 100,p. 3-68.
Gilbert, G.K., 1890, Lake Bonneville: U.S. Geological Sur-vey Monograph 1, 438 p.
King, C.A.M. and McCullagh, M.J., 1971, A simulationmodel of a complex recurved spit: Journal of Geology, v.79, p. 22-37.
MacKenzie, J.A. and Eberli, G.P., 1987, Indications forabrupt Holocene climatic change - Late Holocene oxygenisotope stratigraphy of the Great Salt Lake, Utah, inBerger, W.H., and Labeyrie, L.D., editors, Abrupt climat-ic change: Dordrecht, Germany, D. Reidel PublishingCo., p. 127-136.
Madsen, D.B., 1980, The human prehistory of the Great SaltLake region, in Gwynn, J.W., editor, the Great Salt Lake- A scientific, historical, and economic overview: UtahGeological and Mineral Survey Bulletin 116, p. 19-31.
Mehringer, P.J., 1985, Late-Quaternary pollen records fromthe interior Pacific Northwest and northern Great Basinof the United States, in Bryant, V.M., Jr., and Holloway,R.G., editors, Pollen records of Late-Quaternary NorthAmerican sediments: Dallas, American Association ofStratigraphic Palynologists Foundation, p. 167-189.
Merola, J.A., Currey, D.R., and Ridd, M.K., 1989, ThematicMapper laser profile resolution of Holocene lake limit,Great Salt Lake Desert, Utah: Remote Sensing of Envi-ronment, v. 28, p. 233-244.
Morrison, R.B., 1965, New evidence on Lake Bonnevillestratigraphy and history from southern Promontory Point,Utah: U.S. Geological Survey Professional Paper 525-C,p. 110-119
---1966, Predecessors of Great Salt Lake, in Stokes, W.L.,editor, The Great Salt Lake: Salt Lake City, Utah Geo-logical Society, p. 75-104.
Murchison, S.B., 1989a, Fluctuation history of Great SaltLake, Utah, during the last 13,000 years: Salt Lake City,University of Utah, Ph.D. dissertation, 137 p.
Murchison, S.B., 1989b, Utah chub (Gila atraria) from thelatest Pleistocene Gilbert shoreline, west of Corrine,Utah: Great Basin Naturalist, v. 49, no. 1, p. 131-133.
The Geology of Antelope Island Utah Geological Survey82

Ross, D.S., 1973, Holocene fluctuations of Great Salt Lakewith special reference to evidence from the eastern shore:Salt lake City, University of Utah, M.S. thesis, 111 p.
Rubin, Meyer, and Alexander, Corrine, 1958, U.S. GeologicalSurvey radiocarbon dates IV: Science, v. 127, p. 1,476-1,487.
Scott, W.E., McCoy, W.D., Shroba, R.R., and Rubin, Meyer,1983, Reinterpretation of the exposed record of the lasttwo cycles of Lake Bonneville, western United States:Quaternary Research, v. 20, p. 261-285.
Shields, W.F. and Dalley, G.F., 1968, Excavations at BearRiver no. 3: University of Utah Anthropological Papersno. 22, p. 60-65.
Spencer, R.J., 1983, The geochemical evolution of Great SaltLake, Utah: Baltimore, MD, John Hopkins University,Ph.D. dissertation, 308 p.
Late Pleistocene and Holocene shoreline stratigraphy on Antelope Island - Murchison, Mulvey
The Geology of Antelope IslandMiscellaneous Publication 00-1 83

The Geology of Antelope Island Utah Geological Survey84
ABSTRACT
Well-preserved shorelines on Antelope Island record fluc-tuations of the level of Great Salt Lake over the past 10,000years. In 1986 and again in 1987 the seasonal high staticlevel of Great Salt Lake was about 4,212 feet (1,283.8 m)above sea level (asl), the same level as the earlier historichigh in the 1860s-70s. Elevations of 1986-87 and oldershorelines were measured along profiles at 19 locations dis-tributed around Antelope Island. The shorelines of 1986-87on Antelope Island range from approximately 0.5 feet (0.15m) to over 6 feet (1.8 m) above maximum static lake level.The exposure of shores to storms and the geometry of thelakebed affect shoreline development. Older shorelines indi-cate earlier static lake levels of 4,214; 4,215, 4,217; and4,220 feet (1,284.4; 1,284.7; 1,285.3; 1,286.3 m) asl. Wetperiods, such as those that caused the lake to rise to 4,212feet (1,285.3 m) asl in the 1860s-70s and again in 1986-87,are normal for the climate of the region, appear to occur onaverage about once every 100 years, and can drive the lake to4,217 feet (1,283.8 m) asl. The level to which the lake willrise in a particular wet period depends on the lake level at thestart of the cycle and the magnitude and duration of the wetperiod. With present climate, the static level of the lake willnot rise above 4,217 feet (1,285.3 m) asl. In response to wet-ter and/or cooler climate approximately 2,500 years beforepresent, the lake reached its highest level in the past 10,000years, a static lake level of 4,220 feet (1,286.3 m) asl. Plan-ners and engineers can use information concerning the fre-quency and magnitude of lake-level fluctuations and windset-up and wave run-up to mitigate damage from inundationand waves associated with high lake levels.
INTRODUCTION AND ACKNOWLEDGMENTS
The prominent shoreline patterns that ring AntelopeIsland range in elevation from 1 to 2 feet (0.3-0.6 m) abovethe surface of Great Salt Lake to elevations over 1,000 feet(300 m) above the lake. The higher and older features recordthe history of Lake Bonneville. The lowest shorelines recordthe fluctuations of Great Salt Lake and are the subject of thisreport.
Great Salt Lake influences many activities in northwest-
ern Utah. The inflow into the lake responds dramatically toclimatic conditions over this basin with resulting changes inlake volume, surface area, lake level, and salinity. Becausethe lakebed is nearly flat, changes in lake level result inextensive changes in the lake's surface area and dramaticmigrations of its shorelines. Fluctuations of the lake affectdevelopment in and around the lake and affect strategies forwater-resource development in the drainage basin. Theextraction of minerals from Great Salt Lake is an importantindustry, which is impacted by fluctuations in lake level andsalinity. Lake-level rises threaten interstate railroads andhighways, wastewater treatment facilities, low-lying residen-tial, recreational, and commercial development, and wildliferefuges. Lake-level fluctuations caused hundreds of millionsof dollars of damage during the 1980s and have the potentialto cause even greater damage in the future.
Historical records of lake level fluctuations began in themid-1800s. A longer prehistoric record will improve our abil-ity to predict the magnitude and frequency of future fluctua-tions. Prehistoric lake levels recorded by shorelines on Ante-lope Island can then be used to infer the magnitude and fre-quency of high lake levels over the past several thousandyears. The historical and prehistoric data on the lake levelcan then be used to develop generalized predictions on futurelake-level fluctuations for use by developers, planners, andpoliticians in making decisions relative to developments inand around the lake.
This study of Antelope Island's shorelines was one ofseveral geologic investigations of Antelope Island undertakenby the Utah Geological Survey (UGS) in cooperation with theUtah Division of Parks and Recreation. Hellmut H. Doellingcoordinated the program and his assistance as well as that ofemployees of the Division of Parks and Recreation in arrang-ing the field work is gratefully acknowledged. Bill D. Black(UGS) computed curves illustrating the relationship betweenvolume, surface area, and elevation of Great Salt Lake. Theauthors have benefitted both before and during this studyfrom many discussions with Donald R. Currey who generous-ly shared his extensive knowledge of Lake Bonneville andGreat Salt Lake with us. While we worked on AntelopeIsland, Stuart Murchison (1989) was engaged in a moreextensive study of Great Salt Lake shore features (Murchisonand Mulvey, this volume). Our study benefitted from infor-
SHORELINES OF ANTELOPE ISLAND AS EVIDENCE OFFLUCTUATIONS OF THE LEVEL OF GREAT SALT LAKE
byGenevieve Atwood and Don R. Mabey
Earth Science Education 30 U Street
Salt Lake City, UT 84103

Shorelines of Antelope Island as evidence of fluctuations of the level of Great Salt Lake - Atwood, Mabey
mation he made available to us. Technical reviews in 1990by Donald R. Currey, Suzanne Hecker, and Charles G. (Jack)Oviatt significantly improved the quality of this report. Wealso appreciate the persistence of the Utah Geological Surveystaff in completing this volume, specifically Grant Willis andJon King.
The research reported in this paper was the basis for twotechnical papers published in the interim: Atwood (1994) andAtwood and Mabey (1995). Both publications reference thispublication. The research reported on in this publication wascompleted in 1989. We have not rewritten this paper toinclude 1990s research by the senior author but we have mod-ified the paper slightly to reflect presently accepted chronolo-gies of Lake Bonneville and Great Salt Lake.
The lake-elevation data in this paper are the measure-ments of the elevation of Great Salt Lake gauged by the U.S.Geological Survey and the State of Utah during the 1980s.Since then, the datum for 1984-94 has been adjusted. Theseadjustments are now included in official data compilations forGreat Salt Lake available from the U.S. Geological Survey.During the field seasons reported on in this paper, 1986-89,the adjustment is a consistent -0.25 feet (-7.6 cm) (David V.Allen, Data Base Administrator, U.S. Geological SurveyWater Resources Division, Salt Lake City, personal communi-cation 12/1/97 and 2/1/96 memo to files concerning revisedrecords of lake surface elevations). This adjustment affectslake-level records used in this paper and the absolute eleva-tion of the datums of our surveyed profiles. The adjustmentdoes not change relative elevations and elevation differencesamong the shorelines, the subject of this paper.
FACTORS CONTROLLING THE LEVELOF GREAT SALT LAKE
Magnitude of Lake Level Fluctuations
Great Salt Lake is the largest terminal lake in the WesternHemisphere. It occupies the lowest area of a 23,000-squaremile (60,000 km2) drainage basin. Wetter and colder climatescause the lake in the basin to rise to levels much higher thanthe historical levels of Great Salt Lake (figure 1). The mostrecent of these dramatically higher level lakes, called LakeBonneville, began its rise about 28,000 years ago according
to Oviatt (1997) (all references to “years ago” and “yearsbefore present” are radiocarbon years before present - “pres-ent” by convention is the year A.D. 1950 ). About 15,000years ago Lake Bonneville reached a maximum depth of over1,000 feet (300 m). At that level, lake water flowed over therim of the Great Basin just north of Red Rock Pass in south-ern Idaho into the Portneuf River drainage and from thereinto the Snake River, the Columbia River, and on to thePacific Ocean. At this lake level, the Bonneville level, thelake covered approximately 20,000 square miles (52,000km2), including all but about 4 square miles (10 km2) ofAntelope Island.
The decline of Lake Bonneville began about 14,500years ago with a catastrophic failure of the lake's outlet. Lakewaters raced through the breach, cutting through the sedi-ments that had formed the divide. The lake dropped abruptlyabout 350 feet (107 m) from the Bonneville level to the Provolevel with its overflow threshold at Red Rock Pass, Idaho.Lake Bonneville remained near this level for about 500 yearsuntil the climate changed. By 12,000 years before present thelake had declined to levels as low or lower than historical lev-els (Currey, 1990). Between 12,000 and 10,000 years beforepresent the lake in the basin rose to the Gilbert level, formedshorelines up to about 50 feet (15 m) above the historic highlevel of Great Salt Lake, and then declined to historical lev-els. This marks the beginning of the consistently low-levellake of the Holocene epoch, Great Salt Lake. The climate ofthe region during the Holocene epoch (<10,000 years) hascontrolled the level of Great Salt Lake to no higher than4,221 feet (1,286.6 m) asl (Murchison, 1989; Murchison andMulvey, this volume). In historic time (1847 to present) thelake has fluctuated from a high of 4,212 feet (1,284.4 m) aslto a low of 4,191 feet (1,277.4 m) asl, with an average lakelevel of about 4,202 feet (1,280.8 m) asl (figure 2). Mini-mum lake levels during the Holocene epoch are more difficultto identify, but have been lower than the historical minimumof 4,191 feet (1,277.4 m) asl. Desiccation features suggestinglake levels of 4,180 feet (1,274.1 m) asl or lower described byCurrey (1980) have not been dated.
Climate
The level of Great Salt Lake fluctuates in response tovariations of precipitation and evaporation across its drainagebasin. Increased precipitation drives the level of Great SaltLake up. Inflow is about two-thirds from streams, one-thirdfrom precipitation directly on the lake, and a small contribu-tion from ground-water discharge into the lake (Arnow andStephens, 1990). The typical annual cycle of the lake beginsduring the winter when the lake rises gradually in response tomoderate precipitation and low evaporation. The lake levelrises more rapidly during spring when precipitation,snowmelt, and stream flows are high and evaporation is mod-erate. During the summer, lake level declines rapidly whenevaporation is high and precipitation is low. As evaporationdeclines during the cooler and wetter fall months the lakedeclines more slowly. Yearly seasonal fluctuations averageabout 1.5 feet (0.46 m) but have varied in historical timebetween no rise to a maximum rise of about 5 feet (1.5 m),and from no decline to a maximum decline of about 3 feet
The Geology of Antelope Island Utah Geological Survey86
Figure 1. Fluctuations in the level of Lake Bonneville and GreatSalt Lake. Sources: Bonneville fluctuations from Oviatt (1997);Holocene fluctuations from Murchison (1989) and Currey and oth-ers, (1984); historical fluctuations from U.S. Geological Surveydata.

Shorelines of Antelope Island as evidence of fluctuations of the level of Great Salt Lake - Atwood, Mabey
(0.9 m) (Arnow and Stephens, 1990).Annual inflow to the lake is determined primarily by pre-
cipitation across the drainage basin and outgo by evaporationfrom the lake. Evaporation is primarily a function of the sur-face area of the lake, although it is also influenced by theweather over the lake, and the temperature and salinity of thelake. When annual precipitation increases, inflow to the lakeincreases, and the level and surface area of the lake increase.The lake level stabilizes when the surface area of the lake isat a size that evaporation from the lake equals inflow to thelake.
Over the Great Salt Lake drainage basin, annual precipi-tation ranges from fewer than 10 inches (25 cm) in desertareas to more than 40 inches (100 cm) in the western UintaMountains and the Wasatch Range. No long-term precipita-tion records are available for stations on the lake. TheNational Weather Service record at the Salt Lake City Inter-national Airport, located 12 miles (19 km) east-southeast ofthe southern end of Antelope Island and a few miles from thelake begins in 1929. Annual precipitation at the airport aver-ages about 15 inches (38 cm) and ranged from 8 to 25 inches(20-64 cm) from 1929 to 1990. In the mountainous areas tothe east, where most of the surface inflow into the lake origi-nates, the variation from average increases and much of theprecipitation falls as snow. The annual percentage variationin stream flow into the lake is considerably greater than thatof the precipitation, ranging from 40 to 350 percent of aver-age (Arnow and Stephens, 1990).
Geometry of the Lakebed
In historical time, the surface area of the lake has rangedfrom 50 to 135 percent of average and the volume of water inthe lake from 50 to 175 percent of average. The lake leveltends to stabilize at elevations where the nearly flat topogra-phy of the lakebed results in large increases in the lake's sur-face area for small increases in lake level, greatly increasingevaporation per unit increase in elevation. Between 4,200(1,280.2 m) and 4,214 feet (1,284.4 m) asl the averageincrease in surface area for each two-foot rise in lake level is
120 square miles (310 km2). At a lake level of approximately4,215 feet (1,284.7 m) asl, the lake expands across a series ofthresholds and shallow basins south of the NewfoundlandRange into the Great Salt Lake Desert. In rising from 4,214.5(1,284.6 m) to 4,216.5 feet (1,285.19 m) asl the surface areaof the lake increases by 600 square miles (1,600 km2), dra-matically accelerating potential evaporation from the lake.
Human Activities on the Lake
Human activities artificially affect the level of Great SaltLake. The construction of causeways and dikes has restrictedthe movement of water in the lake and limited access to por-tions of the natural lakebed. Consumptive use of basin water,water diversions into or from the basin, removal of waterfrom the lake by pumping, and construction of in-lakeobstructions affect lake levels. The U.S. Geological Surveycalculated that by 1963 the consumptive use of water in thedrainage basin of Great Salt Lake had lowered the level of thelake 5 feet (1.5 m) below what it would have otherwise been(Whitaker, 1971). This translates into a volume deficit ofabout 3.8 million acre-feet (4.7 billion m3), about twice theaverage annual inflow from surface streams. The completionof the Southern Pacific Railroad causeway in 1960 restrictedthe movement of water between the main body of the lakeand Gunnison Bay north of the causeway. By 1984, thewater-level south of the causeway was almost four feet (1.2m) higher and the water much less saline than the water to thenorth. Opening a 300-foot (91-m) breach in the causeway in1984 reduced the water-level difference to less than 1 foot(0.3 m) (data from U.S. Geological Survey monitoringrecords). Construction of evaporation ponds on the lakebedhas affected the level of Gunnison, Gilbert, and Bear RiverBays. Diking projects proposed to stabilize shoreline levelsaround certain areas of the lake, such as the Lake Wasatchproposal of the 1980s, would increase fluctuations in the levelof the remaining lake (Gwynn, this volume).
The Central Utah Project (which transfers water from theColorado River drainage basin into the Great Salt Lakedrainage basin through a series of dams and tunnels) importscomparatively minor volumes of water into the Great SaltLake basin. Upon completion, it will import 100,000 to150,000 acre-feet (123 million-185 million m3) of waterannually into the lake's drainage basin, the equivalent of thevolume of the uppermost 1 inch (2.5 cm) of Great Salt Lakeat a lake level of 4,202 feet (1,280.8 m) asl. The West Desertpumping project, which pumped water from Great Salt Lakeinto an evaporation pond west of the Newfoundland Range toincrease total evaporation of lake water, could impact futurefluctuations of Great Salt Lake. Put into operation April 10,1987 after the lake had peaked April 1-15, 1987, it had nosignificant effect on the 1986-87 historic high levels of GreatSalt Lake.
Wind, Seiches, and Surges
Diurnal ocean tides and earth tides have no measurableeffect on Great Salt Lake. However winds and earthquakesmay significantly disturb the lake surface, producing windset-up, wave run-up, surges of water and seiches that raise orlower the level of the water along segments of the lake shore.
The Geology of Antelope IslandMiscellaneous Publication 00-1 87
Figure 2. Hydrograph of the historical fluctuations of Great SaltLake. The pre-1875 portion is based on traditional data compiled byGilbert (1890). The post-1875 portion is based on measurements bythe U.S. Geological Survey.

Shorelines of Antelope Island as evidence of fluctuations of the level of Great Salt Lake - Atwood, Mabey
Wind set-up is the wedge of water pushed above the staticelevation of the lake surface by sustained strong winds.When the winds die down suddenly, wind seiches can causeoscillations of water level. Surges of water are masses ofwater described as waves or walls of water. Storms andaccompanying winds frequently impact the lake surface. TheU.S. Army Corps of Engineers computed the combined windset-up and wave run-up against hypothetical dikes north andsouth of Antelope Island as input into the design for a pro-posed Great Salt Lake Inter-Island Diking Project (Rollins,Brown and Gunnell, Inc. and Creamer & Noble, Engineers,1987). The values that they computed for sustained windvelocities of 33 to 44 miles ( 53-70 km) per hour, at lake lev-els of 4,212 (1,283.8 m) to 4,216 feet (1,285.0 m) asl, and fordikes with a 1:1 slope, ranged from 4 to 8 feet (1.2-2.4 m).
Lin and Wang (1978) analyzed one wind-seiche event inJanuary 1969, recorded at two gaging stations on the lake.For about 12 hours the wind blew from the south at an aver-age velocity of about 25 knots (29 miles [46 km] per hour).The lake level declined 1.0 foot (0.3 m) at Black Rock at thesouth end of the lake and rose 0.8 feet (0.24 m) at Promonto-ry Point about 30 miles (78 km) to the north. When thevelocity of the wind dropped to less than 10 knots (11 miles[18 km] per hour) seiching started. On the first cycle the lakelevel at Black Rock rose about 2.5 feet (0.76 m) to a levelabout 1.5 feet (0.46 m) above the static lake level. AtPromontory Point the level dropped 1.8 feet (0.55 m) to 1.0feet (0.3 m) below the static lake level. Oscillations contin-ued for two days with a period of six hours and decreasingamplitude. The geometry of the lake determines the seicheperiod of the lake. Lin and Wang estimate the construction ofthe Southern Pacific Railroad causeway reduced the seicheperiod of Great Salt Lake from nine hours to six hours.
Earthquakes can produce sudden temporary or permanentchanges in the water level of Great Salt Lake. These earth-quake-induced changes can initiate seiching. An earthquakenear the northern end of the lake in 1909 reportedly produceda surge that sent water over the Southern Pacific Railroadcauseway and the bath-house pier at Saltair (Deseret News,October 6, 1909). Movement on one of several active faultsin or near the lake, including the Brigham City, Weber, andSalt Lake segments of the Wasatch fault zone, and the eastGreat Salt Lake fault, could permanently deform the lakebed,causing abrupt inundation of sections of the shore. The tec-tonic deformation that occurred during the Hebgen Lakeearthquake in Montana in 1959, when one shore of HebgenLake dropped 8 feet (2.4 m) below the water level, has beenused as a model for similar deformation of Great Salt Lake(Smith and Richins, 1984).
HISTORICAL FLUCTUATIONS OFGREAT SALT LAKE
Early Observations and the 1860s-70s Highstand
John C. Fremont made the first measurements of thelevel of Great Salt Lake in 1843 when he recorded severalobservations of the barometric pressure on the shores of the
lake. He wrote: "From a discussion of the barometricalobservations made during our stay on the shores of the lake,we have adopted 4,200 feet (1,280.2 m) for its elevationabove the Gulf of Mexico," (Jackson and Spence, 1970). Fre-mont's barometric observations cover a considerable range ofvalues and cannot be used to determine the exact level of thelake at that time. In 1845 he made a more useful observationwhen he recorded that as he rode his horse across the ford onthe bar that connects Antelope Island to the mainland, thewater nowhere reached above the saddle girths (Gilbert,1890). The elevation of the low point along the ford to theisland is about 4,200 feet (1,280.2 m) asl. Thus Fremont'sobservation suggests a lake level of about 4,202 (1,280.8 m)or 4,203 feet (1,281.1 m) asl.
In 1875-78, G.K. Gilbert, as part of his study of LakeBonneville, interviewed ranchers who had moved animals toand from the mainland to Stansbury and Antelope Islands todetermine their recollection of water depths during the periodfrom 1847 to 1875. Gilbert (1890) constructed a hydrographfor this period from these data.
Early U.S. Geological Survey published hydrographs ofthe lake for the 1850-1913 period differ significantly fromGilbert's hydrograph for the period before 1875 (Mabey,1986). These publications credit Marcus E. Jones for infor-mation for this early period. The exact year and elevation ofthe highstand in the 1860s-70s is not known. Gilbert statedthat the lake reached its highstand in the summers of 1872,1873, and 1874. Today the U.S. Geological Survey and mostothers use hydrographs based on Gilbert's early data. Thesehydrographs generally show the highstand in 1873 at about4,211.5 feet (1,283.7 m) asl. Our compilation shows an ele-vation of 4,211.85 feet (1,283.77 m) asl for each of the threehigh-stand years (figure 2).
In 1877, Gilbert measured the elevation of the debris lineformed on the eastern side of Antelope Island during thehighstand of the 1860s-70s wet period and related it to thegauged lake level. Adjusting Gilbert's observations to a sealevel datum provides an elevation of 4,213.5 feet (1,284.3 m)asl for the debris line (Mabey, 1986). This was the onlydirect measurement Gilbert recorded of the elevation of the1860s-70s wet-cycle shorelines.
Recorded Lake-Level Measurements and the 1986-87 Highstand
Recorded lake-level measurements began in 1875 withthe installation of a gauge at Black Rock. Since then the lakelevel has fluctuated over a range of 18.5 feet (5.64 m), requir-ing several relocations of lake gauges. In 1877, Gilbertacquired from Brigham Young a block of the granite beingused to construct the Salt Lake Temple and set it near BlackRock as a benchmark. By leveling, he determined the eleva-tion of the early, post-1875, gauges relative to this bench-mark. Later surveys by the U.S. Geological Survey tiedGilbert's benchmark and early gauges to a sea-level reference(Mabey, 1986).
For about 90 years following the high lake levels of the1860s-70s, the level of the lake generally trended downwarduntil it reached its historic low of 4,191.35 feet (1,277.52 m)asl in 1963 (figure 2). Gilbert and others thought that con-
The Geology of Antelope Island Utah Geological Survey88

Shorelines of Antelope Island as evidence of fluctuations of the level of Great Salt Lake - Atwood, Mabey
sumptive use of water and natural evaporation processeswould prevent the lake from rising again to the high lake lev-els of the 1860s-70s. The decline in lake level until 1963appeared to support this conclusion and a popular concernwas that the lake would dry up. During these years, numer-ous kinds of public and private construction, including resi-dential, industrial, recreational, and transportation, located onthe lakebed at elevations below the historic highstand. Stu-dents of the lake did not warn the public that another wetperiod similar to the period that produced the rapid lake-levelrise in the 1860s-70s should be expected and would produce asimilar rise in the level of the lake.
From 1963 until 1976 the lake level rose until it hadreached its historical average of 4,202 feet (1,280.8 m) asl.For the next six years, the lake level fluctuated a little belowthis level. A major wet period began in September 1982, her-alded by the wettest month in the history of observations atthe Salt Lake City International Airport (figure 3). From Sep-tember 1982 through June 1983, the lake rose a record 5.2feet (1.6 m) and increased in volume by 6 million acre-feet(7.4 billion m3), more than compensating for over 136 yearsof basin-wide consumptive use of water. During the succeed-ing four years, above-average precipitation occurred overmost of the Great Salt Lake drainage basin, with the SaltLake International Airport recording about 32 inches (81 cm)of excess precipitation above average or about 50 percentabove the average (weather data are from National WeatherService data files located at State Climatologist's Office, UtahState University). The level of Great Salt Lake rose rapidlyin response to this above-average precipitation and in thespring of 1986 reached its highest level, 4,211.85 feet(1,283.77 m) asl, since the first gauge was established in1875. The lake level peaked at this same elevation in 1987and then declined rapidly in response to lower than averageprecipitation across its drainage basin and the pumping ofwater from the lake into the Great Salt Lake Desert.
1986-88 FIELD WORK AND INTERPRETATIONS
During 1986, 1987, and 1988 the authors studied thelow-lying shorelines of Antelope Island. The purpose of thestudy was to better understand the recurrence intervals offlooding of Great Salt Lake. By documenting the deposition-al and erosional evidence of the highstands of the 1980s wehoped to better identify previous highstands of the lake. Doc-umentation of previous highstands, particularly if these eventscould be dated, could provide a context by which to evaluatethe frequency of wet cycles affecting Great Salt Lake. In1986, we compared shoreline evidence of the 1986 highstandwith that of the 1860s-70s. In 1987, our field work expandedto document the variety of geomorphic evidence produced bythe 1986-87 highstands of the lake at different locationsaround the island. It included surveying elevations of shore-lines formed during 1986-87 and surveying older, highershorelines. We limited the study to those shorelines at orbelow the Holocene highstand of Murchison (1989).
Antelope Island proved to be a superb field area for suchobservations. Discontinuous shorelines ring the island andreflect wave action from all directions. Relatively extensive
(longer than one-half mile [0.8 km]) beaches, unevenly dis-tributed around the entire island, represent a variety of beachconditions. Antelope Island's undisturbed shorelines providedrelatively easy identification of 1986-87 shorelines and excel-lent chances for recognizing older shorelines.
Field Observations
In the summer of 1986, after the lake had receded fromthe recorded high of 4,211.85 feet (1,283.77 m) asl, theauthors and Donald R. Currey measured the elevation of the1986 debris and gravel line at three locations on the easternside of Antelope Island. The research objective was to com-pare the 1986 shoreline and highstand with the 1860s-70sshoreline and highstand as documented by Gilbert (1890).Gilbert had made his measurement relative to the lake level in1877 somewhere on the eastern side of Antelope Island, a fewyears after the lake crested in the 1860s-70s. The averageelevation of the 1986 debris line and gravel ridge was 4,213.5feet (1,284.3 m) asl, the same as indicated by Gilbert's meas-urement of the 1860s-70s shoreline. The agreement of ourmeasurements with his suggests that the highstands of thelake in the two historic high lake cycles were approximatelythe same.
In November of 1987, we began documenting the 1980sand pre-1980s shorelines and surveying shoreline elevations.We surveyed shoreline profiles at 11 locations around Ante-lope Island. Three were surveyed with a hand level, the oth-ers with an electronic distance measuring device (EDM).Only the data determined by EDM measurements are includ-ed in this report. In August of 1989, we surveyed an addi-tional 11 profiles using the EDM equipment. Figure 4 showsthe locations of the surveyed profiles.
The level of Great Salt Lake as recorded at the U.S. Geo-logical Survey continuously recording lake gauge at theSaltair Marina eight miles (13 km) south of Antelope Islandprovided our survey datum. We were fortunate that on allexcept two days of surveying with the EDM equipment thelake surface was calm. Repeat measurements under theseconditions indicated that the lake surface provided a datum
The Geology of Antelope IslandMiscellaneous Publication 00-1 89
Figure 3. Level of Great Salt Lake compared to cumulative excessprecipitation measured at Salt Lake City International Airport 1975-1994. Data are from the U.S. Geological Survey and the NationalWeather Service.

Shorelines of Antelope Island as evidence of fluctuations of the level of Great Salt Lake - Atwood, Mabey
accurate to 0.1 feet (0.03 m). On the two days when winddisturbed the lake surface, the uncertainty of the elevationreadings was estimated to be about 0.5 feet (0.15 m).
Constructional shorelines formed during the 1986-87highstand were easily recognized in 1987 and 1988 by debrissuch as tires, lumber, and plastics. We measured profileswithin longer, straighter stretches of shorelines and deliber-ately avoided small pocket beaches where slope and shorelinegeometry magnifies wave run-up and builds super-elevatedshorelines. Erosional shorelines were easily distinguished in1987, but by 1988, vegetation reestablished itself on the moreprotected, finer grained, lower wave-energy shorelines and onshorelines where spring waters supported vegetation. Insome of the latter areas, only the presence of tires, railroadties, and other large wooden debris provided visible evidenceof the 1986-87 shoreline.
Because the lake fluctuates seasonally, highstands of thelake are relatively short-term events of late spring and early
summer and may or may not be documented by shorelinesconstructed by storms. The effects of individual storms areunevenly distributed around the island. Thus, although thelake provides a static water-level datum, the elevation ofwave-constructed shorelines depends on the level of the lakeat the time of the storm, the direction of storm winds, shore-line configuration (such as the shape and slope), and rough-ness of the shore.
Description of Shorelines
Shorelines on Antelope Island formed during 1986-87 can beclassified into four general types. Commonly two or more ofthese features occur together:
1) debris lines,
2) gravel ridges and beaches,
3) erosional steps,
4) vegetation lines.
Debris LinesThe high shorelines formed in 1986-87 are nearly every-
where marked by debris consisting mostly of wood butincluding considerable non-wood manufactured material,much of it made of plastic. Most of the debris clearly post-dates the 1870s but the possibility that some of the old woodwas deposited by the 1860s-70s highstand could not be ruledout. Some of the lighter debris could have been moved bywind as well as wave action. The debris lines are generallylocated upslope from the gravel ridges and beaches. Nodebris lines associated with older shorelines were identified atelevations higher than those of 1986-87 in the 1980s fieldwork. Debris lines formed after 1987 consist mostly of theremains of dead insects, with minor amounts of wood andother material.
Gravel Ridges and BeachesWave-constructed gravel ridges served as our primary
markers for shoreline elevations. These shorelines resemblethe geomorphic evidence of older highstands at the samelocations. We surveyed the crest of the gravel ridges relativeto the lake-level datum. These gravel ridges are generallywell sorted. In some areas, the 1986-87 shoreline consistsentirely of gravel, and in other areas almost entirely of cob-bles or sand. The 1986-87 shoreline gravels are bleachedwith no observable surface staining in contrast to older, high-er shoreline gravels. Lower, younger gravels are all bleached.At several locations, two or more gravel ridges of equal ele-vation formed a few to tens of feet apart. Initially we expect-ed that these repeated ridges might represent 1860s-70s andolder shorelines. We observed during storms of 1987 thatwaves broke across and modified several ridges and lagoonsconcurrently. Therefore, we determined that we could notdistinguish relative ages of ridges on the basis of elevationand spacial distribution alone.
Erosional StepsWhere waves or long-shore currents erode a shoreline in
relatively soft sediments, the shoreline level is marked by a
The Geology of Antelope Island Utah Geological Survey90
Figure 4. Antelope Island showing the location of measured shore-line profiles of table 1. Letter designations are those used in table 1and figure 5.
AN
TE
LO
PE
ISL
AN
D

Shorelines of Antelope Island as evidence of fluctuations of the level of Great Salt Lake - Atwood, Mabey
nearly vertical step. Debris or gravel has been deposited atthe base of some of these steps. The steps range in height upto more than 10 feet (3 m). The vertical faces formed in1986-87 in most areas began to slump and erode immediately.Step shorelines above the 1986-87 shorelines have been mod-ified to gentle slopes. Only in one area of no constructionalshorelines did we use erosional shoreline evidence. At thatlocation, MUF (figure 4), we measured the 1986-87 shorelinelevel at the debris line at the base of the erosional step.
Vegetation LinesVegetation changes mark some shorelines by zones of
distinctive vegetation, or changes in vegetation density ortype. Some shorelines appear to be marked only by subtlevegetation zones. The lake's saline water killed most plants itinundated and some shorelines of 1986-87 are marked by theupper limit of kill zones. A notable exception to the kill-zonephenomenon is where springs discharged fresh water at orbelow lake level and maintained plants that were partly orcompletely submerged by lake water.
Gilbert noted similar vegetative changes (Gilbert, 1890).A few years after the 1860s-70s highstand he noted a killzone below which he observed no sagebrush. He conjecturedthat it would take perhaps several hundred years for sage-brush to reestablish communities in the inundated zones.However the vegetation in the 1860s-70s inundation zoneappeared to have fully recovered in the period between 1877when Gilbert made his observations and the next high level in1986.
Some of the wave-constructed gravel ridges both at the1986-87 lake level and above are marked by plants such assunflowers that grow well in disturbed areas or areas withcoarse sediments. We did not consider vegetation alone assufficient evidence for identifying the 1986-87 shoreline.
Elevations of 1986-87 and Older Shorelines
Table 1 summarizes, and figures 5 and 6 illustrate, theGreat Salt Lake shoreline data collected on Antelope Islandduring 1987-88. Data are grouped into a sequence of high-stands. Elevation alone did not define shoreline groupings.Modern debris allowed easy identification of 1986-87 shore-lines (historic shoreline). The Holocene high studied byMurchison (1989) provided an upper limit for our surveys.Between these two features, intermediate shorelines indicateat least three additional highstands, perhaps more. We groupthese data into shorelines B, C, and D based on spatial rela-tionships to the 1986-87 shoreline and geomorphic evidencesuch as cross-cutting erosional features. Further work, suchas trenching lagoon deposits, could better define the numberand age of the events represented by these shoreline features.
Historical ShorelinesThe elevations of the gravel ridges formed during 1986-
87 range from 4,212.4 feet (1,283.9 m) asl (0.6 feet [0.18 m]above the highest static lake level) to 4,218.1 feet (1,285.7 m)asl (6.3 feet [1.9 m] above the highest static lake level). Theaverage elevation for 19 shoreline locations is 4,214.6 feet(1,284.6 m) asl. The elevations are generally higher on the
The Geology of Antelope IslandMiscellaneous Publication 00-1 91
Figure 5. Elevations of shorelines of Great Salt Lake on Antelope Island. Letter designations for locations are those used in table 1 and figure 4.Letter designations for shorelines are those used in text and table 1. Lines between locations indicate lateral correlations of shorelines.
D
D
D
D
D
D
B
B
B
B B
B
B
B
B
B
B
C
C
C
C
H
H
H
H
H
H
H
H

Shorelines of Antelope Island as evidence of fluctuations of the level of Great Salt Lake - Atwood, Mabey
southwestern shore of the island than on the eastern shore(figure 6). This is consistent with the U.S. Army Corps ofEngineers calculations of wind set-up and wave-run up forproposed dikes near Antelope Island (Rollins, Brown, andGunnell, Inc., and Creamer & Noble, Engineers, 1987). Theircalculations predicted that some site conditions on the west-ern side of Antelope Island could produce shoreline featuresat even higher elevations than we measured. Our data sug-gest that inundation and wave action can be expected 6.5 feet(2.0 m) above the static lake level at some locations depend-ing on exposure and configuration of the lakebed and may befurther amplified in pocket beaches. The 1986-87 shorelinesprovide a datum for recognizing potential wave damage onAntelope Island associated with a static lake level of about4,212 feet (1,283.8 m) asl. The range in elevations indicatesthe need to exercise caution when using elevations of prehis-toric shorelines to determine prehistoric static lake elevations.
The highstands of the 1860s-70s and 1986-87 wereapproximately 4,212 feet (1,283.8 m) asl. Most shoreline fea-tures produced on Antelope Island in the 1860s-70s were
reactivated or masked by 1986-87 events. Theoretically,older shorelines might be recognized after later highstands ifthe older shorelines contained prominent markers or datablematerial, but the primarily gravel shorelines associated withthe single- or multiple-storm events of recent highstands ofGreat Salt Lake are easily reactivated or masked. Underunusual circumstances, storm events of one lake highstandcan construct gravel ridges that are not reactivated by stormsof a subsequent highstand. At Ladyfinger Point (LFE) twogravel ridges, separated spatially but constructed at the sameelevation, differed in composition and staining. The oneformed in 1986-87 included trash and consisted of bleachedpebbles. The other consisted of stained pebbles and lackedmodern debris. We interpret the second feature as a possible1860s-70s shoreline. At the southernmost tip of the island(SOP) a stained gravel ridge lies inches above the 1986-87ridge and could be a 1860s-70s shoreline. But, with fewexceptions, the 1986-87 storms reactivated, masked, ordestroyed the surface expression of older and lower shore-lines including those of the 1860s-70s.
The Geology of Antelope Island Utah Geological Survey92
SHORELINE ELEVATIONS - ANTELOPE ISLAND(in feet above sea level)
Location HistoricShoreline
Height above4212.0
Relative heightH, M, L
ShorelineB
ShorelineC
ShorelineD
Shoreline HHolocene High
Static Water Elevation Meters
WRBBUPBUSLFWLFEBUBTLSCAFBOLSGNSGEMUFUNCUNP
SOW18SDRCRRC
4214.04217.14215.44215.64215.44218.1
42121238.8
Static Water Elevation Feet
SOP
4213.34212.94212.44214.24213.94213.64214.34213.54213.84214.34215.14215.24215.0 3.0
3.23.12.31.81.52.31.61.92.20.40.91.32.05.13.43.63.46.1
MMMMLLLLLLLLLLHHHHH
4216.8
4215.2
4216.04215.9
4214.74216.0
4216.04216.64217.54220.1
42141284.4 1284.7
4215
4219.14218.8
4216.2 4217.2
4219.8
4218.4
4221.1
42171285.3 1286.3
4220
4223.5
4224.34223.04221.8
4224.24222.2
4221.24224.0
Table 1. Elevations of shorelines of Great Salt Lake surveyed on Antelope Island. Profile locations are shown in figure 4 and letter designationsfor locations are those used in figures 4 and 5. Height above 4,212.0 feet (1,283.8 m) refers to the elevation difference of the 1986-87 shorelineversus the gauged static lake level. Relative height designations are L (low), M (moderate), and H (high). Height above 4,212.0 feet (1,283.8 m)and relative height are illustrated in figure 6. We estimate the following ages for the shorelines (present is defined as A.D. 1950):
Historic high shoreline: A.D. 1860s-70s and 1986-87Shoreline B: 250 years before presentShoreline C: 250 - 300 years before presentShoreline D: 300 - 400 years before presentHolocene-high shoreline (H): 2,300 – 2,500 years before present
Age estimates are based on Murchison (1989), Currey and others (1988), and Oviatt (1988).

Shorelines of Antelope Island as evidence of fluctuations of the level of Great Salt Lake - Atwood, Mabey
Intermediate ShorelinesThe next higher shoreline (shoreline B) above the his-
toric high shorelines was measured at ten locations. The ele-vation of these features ranges from 4,214.7 (1,284.6 m) to4,220.1 feet (1,286.3 m) asl and averages 4,216.5 feet(1,285.2 m) asl, 1.9 feet (0.58 m) higher than the historic highshorelines. We assign a static lake level of 4,214 feet(1,284.4 m) asl to this high cycle. The shoreline gravels arestained. The gravel ridges are distinct and little modified byerosion. This shoreline must be older than the approximately150-year historical record, but its lack of modification sug-gests that it is no more than a few hundred years old.
Murchison (1989) identified a dual-beach-forming highstandat 4,214 feet (1,284.4 m) asl, which he dated at roughly 250years before present, and we assume this is the age of shore-line B.
At three sites a shoreline slightly above shoreline B wasidentified. The average elevation of this feature, which isdesignated shoreline C, is 3.4 feet (1.04 m) above the averagehistorical shoreline on the island. It is assigned a static lakelevel of 4,215 feet (1,284.7 m) asl. This feature is more mod-ified than shoreline B, but is not dissected by debris-flow orstream channels. The age of this shoreline is not known but,based on spatial relationships, lies between the ages of shore-lines B and D.
At four locations, a third intermediate shoreline, desig-nated shoreline D, was surveyed. The gravels on this shore-line are stained. Drainage channels, including debris-flowchannels, cut this shoreline and do not cut lower shorelines.Therefore it is older than shorelines B and C. The elevationof this feature ranges from 4,217.2 (1,285.4 m) to 4,221.1 feet(1,286.6 m) asl which averages 4.5 feet (1.37 m) above the1986-87 shoreline and indicates a static lake elevation ofabout 4,217 feet (1,285.3 m) asl. Murchison (1989) identifieda shoreline at this elevation, which he roughly dated between400 and 300 years before present.
Holocene-High ShorelineThe Holocene-high shoreline was identified at seven
locations. An eighth location (RRC) with an elevation of4223.5 (1,287.3 m) could be an exceptionally high shorelineD or a Holocene-high shoreline. We have grouped it with theHolocene-high shoreline set based on its elevation. TheHolocene-high shoreline is considerably more modified thanthe lower shorelines. Its elevation averaged 8.4 feet (2.56 m)above the 1986-87 shoreline with a range of 3.1 feet (0.94 m).The wide range in elevation may be in part due to tectonicdeformation and the degree of difficulty in recognizing theshoreline as well as shoreline processes. Our measurements,corrected for wind set-up and wave run-up (figure 6), indicatea static lake level of 4,220 feet (1,286.3 m) asl for theHolocene highstand of Great Salt Lake. We correlate thisshoreline with Murchison's Holocene high, which he assignedan age range of 3,440 to 1,440 years before present (Murchi-son, 1989). Currey and others (1988) described evidence fora 2,000 to 2,500 year age for a shoreline at this elevation.Work by Oviatt (1988) suggested that 2,300 to 2,500 yearsbefore present age for a similar event of Lake Gunnison inthe Sevier River drainage basin.
IMPLICATIONS OF SHORELINE EVIDENCE
Shorelines provide evidence about elevations of highlake levels, recurrence intervals of high lake levels, and geo-morphic processes associated with storms. Therefore, shore-lines of Antelope Island provide information for determininghazards of flooding and storm damage.
Inundation Levels
Shorelines are excellent indicators of the elevation ofinundation associated with a specific static lake level. Ourprofiles substantiated the theoretical predictions of higher ele-
The Geology of Antelope IslandMiscellaneous Publication 00-1 93
Figure 6. Antelope Island showing profile locations, the height infeet of the 1986-87 shoreline above the static high level of the lake,and relative height of the shorelines, designated as L (low), M (mod-erate), and H (high). Also see table 1.
AN
TE
LO
PE
ISL
AN
D

Shorelines of Antelope Island as evidence of fluctuations of the level of Great Salt Lake - Atwood, Mabey
vations of wave action on the southwestern and westernshores of the island as a result of regional storm directions,intensity, and duration. Local conditions, such as the geome-try and roughness of the lakebed and shore, affect wave run-up. Based upon our profiles, combined wind set-up andwave run-up for Antelope Island result in construction ofgravel-ridge shorelines that are 0.6 feet to over 6 feet (0.18-1.8 m) above static water level.
Shoreline elevations can be excellent indicators of highstatic lake levels when corrections are made for wind set-upand wave run-up caused by storms and local conditions (fig-ure 6). Our profiles identified five highstand shorelines ofGreat Salt Lake with static lake levels of: 4,212; 4,214;4,215; 4,217; and 4,220 feet (1,283.8; 1,284.4; 1,284.7;1,285.3; and 1,286.6 m) asl.
Recurrence Intervals
Shoreline elevation data alone do not indicate the recur-rence interval of high lake levels. With few exceptions, the
wave action of each highstand masks or destroys the surfaceexpression of older, lower shorelines. Thus, the record oflake-level fluctuations preserved along a shore is restricted tosuccessively higher, older events. Thus, the number of shore-lines indicates only a minimum number of high lake cycles.For example, the 4,212-foot (1,283.8 m) level records at leasttwo highstands.
Additional stratigraphic, geochemical and climatologicdata can supplement shoreline data to provide recurrenceinformation. Sediments deposited in the lagoons associatedwith high lake cycles may record multiple inundations. If thesediments contain organic material, radiocarbon dating mayprovide a chronology of the lake cycles (Murchison, 1989).Analysis of the chemistry of lake sediments obtained fromcores and trenches in the lakebed can provide an indicationof the salinity of the lake when the sediment was deposited,and the salinity can be used to calculate relative levels of thelake (McKenzie and Eberli, 1985). Because lake cyclesoccur in response to changes in precipitation over the lake'sdrainage basin, statistical analyses of historic precipitation
The Geology of Antelope Island Utah Geological Survey94
4770feet above sea level
42204217
4212
4191
4180
4170
The elevation of Red Rock Pass, Idaho, on the rim of the Great Salt Lake Basin. This is themaximum level a lake can obtain before it spills into the Columbia River drainage. Thousandsof years and a dramatic change in climate are required for the lake to approach this level.
Highest level reached in the past 10,000 years. A significant change in climate is required forthe lake to rise to this level.Highest level reached in the past few hundred years. With the present climate the lake may riseto but should not exceed this level.Historic high level of Great Salt Lake. Lake levels of this elevation should be expected.
Historic low level of Great Salt Lake. Levels this low should be anticipated with current cli-mate and consumptive use of basin water.
Lowest levels in the past 10,000 years are not well documented. With the present climate, ifconsumptive use is greatly increased, or if human activities make major alterations in thelakebed, the lake may fall to this level.
The elevation of low portions of the lakebed. There is no conclusive evidence that the lakehas virtually dried up and become a dry playa lakebed.
Figure 7. Expected levels of Great Salt Lake and inferred relationship to climate.

data provide an indication of the frequency with which pre-cipitation events affecting lake cycles are likely to occur(Karl and Young, 1986). Tree-ring studies may provide infor-mation on prehistorical precipitation cycles in the Great SaltLake drainage basin.
The shoreline data obtained on Antelope Island combinedwith the age estimates of Murchison (1989) were used to con-struct figure 7. Historical data show two lake highstands ofapproximately 4,212 feet (1283.8 m) asl separated by about120 years. Our shoreline data indicate these two stands, plusa minimum of at least three additional, higher stands, haveoccurred since the Holocene high approximately 2,500 yearsbefore present.
Based on statistical analyses of historical weather data,Karl and Young (1986) determined that wet cycles haveoccurred about every 100 years. The two historic highstandsof Great Salt Lake resulted from a series of years of signifi-cantly above-average precipitation that caused the lake to riseabruptly. The level that the lake reaches in response to a wetperiod depends upon the lake level at the start of the precipi-tation cycle and the magnitude and duration of the event. The10-foot (3-m) rise of the lake from 4,202 to 4,212 feet(1,280.8-1,283.8 m) asl during 1982 to 1986 was a netincrease of 13 million acre-feet (16 billion m3) water. With-out the effect of 140 years of consumptive use of water thelevel of the lake would have been significantly higher; weestimate about 2 feet (0.6 m) higher (4,214 feet [1,284.4 m]asl). If the wet period had begun 20 years earlier when thelake level was lower, the highstand would have been about4,208 feet (1,282.6 m) asl. The highstand that the lake willreach during wet periods is also controlled by the geometry ofthe lakebed. Before the lake reaches an elevation of 4,217feet (1,285.3 m) asl it expands over a large area of the GreatSalt Lake Desert, greatly increasing its surface with a result-ing increase in evaporation from the lake surface. With theclimate that has existed for the past few hundred years thelake is not likely to exceed this elevation.
According to Murchison (1989), only once in theHolocene epoch (past 10,000 years) does the lake appear tohave reached a level of approximately 4,220 feet (1,286.3 m)asl. Such a high lake level requires a different climate fromthat of the past several hundred years to reduce the per-acreevaporation from the vastly expanded surface area of thelake, and/or to supply sufficient volumes of precipitation andrunoff to counter the increased evaporation. A rise of GreatSalt Lake to levels associated with Lake Bonneville (forexample to about 4,750 feet [1,447.8 m] asl at Red RockPass, Idaho) requires a dramatic change in climate.
Low levels of Great Salt Lake do not pose the samethreat as highstands, but they affect development in andaround the lake. Shorelines preserve evidence of high levelsof Great Salt Lake, but water and sediments cover evidenceof low lake levels. The historic low lake level of 4,191 feet(1,277.4 m) asl resulted from a long period that includedmany drier-than-average years. Similar dry-weather condi-tions, typical for the climate of Great Salt Lake drainagebasin in the past several hundred years, and consumptive useof water can lower the lake to this level again. The desicca-tion features on the lakebed possibly associated with lake lev-els at least 10 feet (3 m) have not been dated. Such low lake
levels require unusual, sustained changes in basin weather.
Effect of Human Activities
In our analysis, we have not attempted to compute theimpact of future human activities on lake level. Nor have weattempted to estimate the effect of human activities on local,regional, and global climate that affect lake level indirectly.Past human activities have had significant and complicatedimpacts on the level of Great Salt Lake. Consumptive use ofdrainage basin water has lowered lake level but has notaltered the basic pattern of lake fluctuations. Consumptiveuse makes low stands of the lake considerably lower thanthey would be naturally and highstands somewhat lower thanthey would be naturally. Diking and pumping brines intoevaporation ponds may raise or lower the level of the remain-ing portions of the lake. Lake pumping to an evaporationpond on the Great Salt Lake Desert provides the possibility oflimited control over fluctuations of the lake. Neither con-sumptive use nor pumping can prevent future highstands ofthe lake.
LAKE-LEVEL FLUCTUATIONS RELATED TO DEVELOPMENT OF
ANTELOPE ISLAND
Shoreline Facilities
Lake-level rises occur relatively slowly and are not life-threatening. Therefore, decisions concerning shoreline devel-opment of Antelope Island primarily concern property lossrather than life loss. Two exceptions are important: inunda-tion caused by earthquake-related waves or tectonic tilt, andflood hazards associated with failures of large diking projects.The danger from either of these phenomena is greatest whenthe lake level is high. Lake-level rises presently pose threatsto property; some proposed lake-level control dikes couldmake high lake levels a threat to lives.
Access to Antelope Island
Land access to Antelope Island depends upon roadwaysbuilt on the lakebed. Until the 1960s when the first road wasbuilt from the mainland near Syracuse to the north end of theisland, the only land access had been along the AntelopeIsland bar at the south end of the island. The bar is abovewater at lake elevations below 4,200 feet (1,280.2 m) asl.Over the past 100 plus years, the bar has been above lakelevel approximately 40 percent of the time. From about 1900to 1983 the island could be reached from the south by main-taining the road bed a few feet above the crest of the bar. Bylake-bed standards the bar provides a relatively firm founda-tion for a roadbed and there is no requirement to maintain apassage for lake water to move through the roadway. A roadthat would provide access to the south end of the island evenduring high lake periods would be relatively easy to con-struct.
The causeway from Syracuse to the north end of theisland encounters more difficult conditions. The minimumelevation of the lakebed along the route of the causeway is
Shorelines of Antelope Island as evidence of fluctuations of the level of Great Salt Lake - Atwood, Mabey
The Geology of Antelope IslandMiscellaneous Publication 00-1 95
about 4,190 feet (1,277.1 m) asl. Over the past 100 years, aportion of the route has been below water 100 percent of thetime. Soft sediments underlie much of the route. The cause-way must provide a passageway for a considerable volume oflake water and accommodate density and salinity differencesof the water on the two sides of the causeway. A roadwaymaintained at the level of the causeway in use before 1984would have been usable for over 90 percent of this century.A causeway that would be usable 100 percent of the time upto lake levels of 4,217 feet (1,285.3 m) asl would need to beabout 12 feet (4 m) higher. Due to adverse foundation condi-tions, costs of construction along the present route increasessubstantially with each foot of increased elevation of thecauseway.
Conclusions for Planners
Fluctuations of the level of Great Salt Lake are controlledprimarily by long-term weather that we do not presently havethe ability to predict accurately or control. Nevertheless, ourunderstanding of past lake fluctuations based on shoreline andother evidence provides sufficient information to be used indetermining the costs and benefits of development alterna-tives of Antelope Island and can minimize losses due tofuture high lake levels.
Recurrence of High Lake LevelsLake-level fluctuations that have occurred in the past few
hundred years can be expected in the next few hundred years.High lake cycles have occurred on average about once everyhundred years. The high lake levels of the 1860s-70s and1986-87 both reached approximately 4,212 feet (1,283.8 m)asl, but weather patterns normal for the Great Salt Lakedrainage basin can drive the level of the lake as high as 4,217feet (1,285.3 m) asl. Highstands at the 4,212 feet (1,283.8 m)asl level can be expected more frequently than highstands athigher lake levels such as at 4,214 feet (1,284.4 m) asl. The4,217 feet (1,285.3 m) asl lake level represents the higheststatic lake level associated with normal weather conditions.The last highstand of the lake at about 4,217 feet (1,285.3 m)asl occurred as recently as 400 to 300 years before present.
Low Lake LevelsLess information is available about the amplitude and
frequencies of extreme dry-weather periods. Evidence showsthat the lake has fallen to levels well below the historic lowof 4,191 feet (1,277.4 m) asl; to perhaps as low as 4,180 feet(1,274.1 m) asl.
Levels of Damage from Inundation and Wave ActionThe elevation of damage from inundation or wave action
at a particular site depends primarily on the static level of thelake and secondarily on the site's exposure, the geometry ofthe lakebed, and the geometry and roughness of the shorearea. The shorelines of 1986-87 on Antelope Island rangefrom approximately one-half foot to over 6 feet (0.15-1.8 m)static lake level. The 1986-87 shoreline elevation of a partic-ular site compared to the 1986-87 static high water level ofapproximately 4,212 feet (1,283.8 m) asl provides a roughapproximation of wind set-up and wave run-up for a givensite caused by storms.
REFERENCES
Arnow, Ted, and Stephens, Doyle, 1990, Hydrologic charac-teristics of the Great Salt Lake, Utah: 1847-1986: U.S.Geological Survey Water Supply Paper 2332, 32 p.
Atwood, Genevieve and Mabey, D.R., 1995, Flooding haz-ards associated with Great Salt Lake, in Lund, W.R.,Environmental and engineering geology of the Wasatchfront region: Utah Geological Association Publication24, p. 483-494.
Atwood, Genevieve, 1994, Geomorphology applied to flood-ing problems of closed-basin lakes… specifically greatSalt Lake, Utah, in Geomorphology and Natural Hazards,25th Binghamton Symposium in Geomorphology: Geo-morphology, v. 10, p. 197-219.
Currey, D.R., 1980, Coastal geomorphology of Great SaltLake and vicinity, in Gwynn, J.W. editor, Great SaltLake - A scientific, historical and economic overview:Utah Geology and Mineral Survey Bulletin 116, p. 69-82.
---1990, Quaternary palaeolakes in the evolution of semi-desert basins, with special emphasis on Lake Bonnevilleand the Great Basin, U.S.A.: Palaeogeography, Palaeo-climatology, Palaeoecology, v. 78, p. 198-214.
Currey, D.R., Atwood, Genevieve, and Mabey, D.R., 1984,Major levels of Great Salt Lake and Lake Bonneville:Utah Geological and Mineral Survey Map 73, scale1:750,000.
Currey, D.R., Berry, M.S., Douglass, G.S., Merola, J.A.,Murchison, S.B., Ridd, M.K., Atwood, Genevieve, Bills,B.G., and Lambrechts, J.R., 1988, The highest Holocenestage of Great Salt Lake: Geological Society of AmericaAbstracts with Programs, v. 20, p. 411.
Gilbert, G.K., 1890, Lake Bonneville: U.S. Geological Sur-vey Monograph 1, 438 p.
Jackson, Donald, and Spence, M.L., 1970, The Expeditions ofJohn Charles Fremont, Volume I, travels from 1838 to1843: University of Illinois Press, 854 p.
Karl, T.R., and Young, P.J., 1986, Recent heavy precipitationin the vicinity of Great Salt Lake; just how unusual?:Journal of Climate and Applied Meteorology, v. 25, p.353-363.
Lin, Anching, and Wang, Po, 1978, Wind tides of the GreatSalt Lake: Utah Geological and Mineral Survey, UtahGeology, v. 5, no. 1, p. 17-35
Mabey, D.R., 1986, Notes on the historic high level of GreatSalt Lake: Utah Geological and Mineral Survey, SurveyNotes, v. 20, no. 2, p. 13-15.
McKenzie, J.A., and Eberli, G.P., 1985, Late Holocene lake-level fluctuations of Great Salt Lake as deduced fromoxygen-isotope and carbonate contents of cored sedi-ments, in Kay P.A. and Diaz, H.F. editors, Problems ofand prospects for predicting Great Salt Lake levels: Cen-ter for Public Affairs and Administration, University ofUtah, p. 25-39.
Murchison, S.B., 1989, Fluctuation history of Great SaltLake, Utah, during the last 13,000 years: University ofUtah, Ph.D. dissertation, 137 p.
The Geology of Antelope Island
Shorelines of Antelope Island as evidence of fluctuations of the level of Great Salt Lake - Atwood, Mabey
Utah Geological Survey96

Oviatt, C.G., 1988, Late Pleistocene and Holocene lake fluc-tuations in the Sevier Lake Basin, Utah, USA: Journal ofPaleolimnology, v. 1, p. 9-21.
---1997, Lake Bonneville fluctuations and global climate:Geology, v. 25, no. 2, p. 155-158.
Rollins, Brown and Gunnell, Inc. and Creamer & NobleEngineers, 1987, Great Salt Lake inter-island diking proj-ect - final design report: prepared for the Utah Divisionof Water Resources, v. 1 and 2, variously paginated.
Smith, R.B., and Richins, W.D., 1984, Seismicity and earth-quake hazard of Utah and the Wasatch front - paradigmand paradox, in Hays, W.W., and Gori, P.L., editors,Evaluation of regional and urban earthquake hazards andrisk in Utah: U.S. Geological Survey Open-File Report84-763, p. 73-112.
Whitaker, G.L., 1971, Changes in the elevation of Great SaltLake caused by man's activities in the drainage basin, inGeological Survey Research, 1971: U.S. Geological Sur-vey Professional Paper 750-D, p. D187-189.
Shorelines of Antelope Island as evidence of fluctuations of the level of Great Salt Lake - Atwood, Mabey
The Geology of Antelope IslandMiscellaneous Publication 00-1 97

The Geology of Antelope Island Utah Geological Survey98
ABSTRACT
Cementation of Quaternary lacustrine shoreline sedi-ments around Great Salt Lake has modified the stratigraphyand produced a variety of interesting sedimentary features.Aragonite is precipitated as cements and laminar coatings in avariety of crystal morphologies that range in size from lessthan 1 micron to about 44 microns. Sediments are cementedto form very thin peloidal crusts, laterally extensive layers ofthin ooid grainstone beds, and vertically stacked thin bedsthat dip toward the lake to form beachrock. Early precipita-tion of cement contributed to the formation of a number ofsedimentary particles and structures including granules,clasts, flat pebble conglomerates, laminated crusts, and moreinterestingly, fossil bubbles and gas-eruption structures.Relict and actively forming gas-eruption structures are char-acterized by raised circular rims composed of flat clastsderived from broken cemented layers. Cemented layers arebroken not only by over-pressured gas trapped underneaththem but also by mechanical processes including wave action.Occurrence of most cements appears to be related to extremesof salinity locally mediated by soluble organic matter, organicactivity and gases within the sediment.
INTRODUCTION
Recognition of early precipitation of cement in sedimentsand the distribution and character of those cements is funda-mental to understanding the process of cementation and alsohas significant economic implications. Early precipitation ofminor amounts of cement between grains can prevent col-lapse of primary porosity during burial and provide potentialreservoir rocks for hydrocarbons. Alternatively, extensiveearly cementation of shoreline sediments can seal strata suffi-ciently to trap fluids or gases that later migrate up-dip fromthe depocenter of a sedimentary basin. Lacustrine depositsare known to be both hydrocarbon source and reservoir rocksin China, the United States and South America where theyproduce economic quantities of hydrocarbons (Lomando andothers, 1994; Dean and Fouch, 1983). Recognition of earlycementation in lacustrine rocks can thus be very helpful inmany aspects of hydrocarbon exploration and production.Furthermore, knowledge about the characteristics of earlyshoreline cements and about the sedimentary structures result-
ing from the cementation process is useful in distinguishinglacustrine deposits from their marine counterparts.
Synsedimentary carbonate cementation in lacustrineshoreline sediments has not been discussed in as much detailfor hypersaline lakes (Picard and High, 1972; Dean andFouch, 1983) as it has for marginal-marine hypersaline set-tings in the Persian Gulf (Taylor and Illing, 1969), in Aus-tralia (Davies, 1970), in the Red Sea (Friedman and others,1973), and in Texas (Freeman, 1962; Frishman and Behrens,1969). Most studies of hypersaline lakes focus on precipita-tion of evaporites (Eugester and Hardie, 1978), on marls intemperate alkaline lakes (Muller and others, 1972; Kelts andHsu, 1978), on the formation of ooids (for example, Eardley,1966; Kahle, 1974; Sandberg, 1975; Halley, 1977; Reitnerand others, 1997), or stromatolites (Halley, 1976). Morerecently significant advances in our understanding of thechemistry of precipitation of the carbonate cements inbiofilms have been made (Neuweiler, 1997) although othersemphasize the role of nannobacteria (Pedone and Folk,1996).
Most of our knowledge about penecontemporaneouscementation of shoreline and shallow water sediments comesfrom studies of normal marine environments. Lithification oftropical marine beach sediments has been studied by manyresearchers (for example, Ginsburg, 1953; Multer andHoffmeister, 1971; Moore, 1973; Hanor, 1978), but there arefew reports of submarine cementation of extensive layers ofsand (Taft, 1968; Shinn, 1969). Reports of contemporaneouslithification of beach sediments in lacustrine environments orof subaqueous cementation of extensive layers of lake sedi-ments also are sparse. Binkley and others (1980) reportedlow-magnesium calcite cementing pisolites into beds about 25cm (10 inches) thick to form beachrock in Ore Lake, Michi-gan, but there was little discussion about the extent of sub-aqueous cementation or of other sedimentary features associ-ated with the cementation process.
Cements precipitating in the form of radial fibrous ooidshave received the greatest attention from researchers workingon cementation in Great Salt Lake (for example, Eardley,1938; Carozzi, 1962; see others mentioned above). Cementa-tion of ooids along some Great Salt Lake beaches to form“hydrogenic shingle” and granule sand was recognized byEardley (1938) but he placed little emphasis on its occurrence
ARAGONITE CEMENTATION AND RELATED SEDIMENTARYSTRUCTURES IN QUATERNARY LACUSTRINE DEPOSITS,
GREAT SALT LAKE, UTAH
byR. B. Burke
North Dakota Geological Survey600 East Boulevard, Bismarck ND 58505-0840
and L. C. GerhardKansas Geological Survey
1930 Constant Ave., Lawrence KS 66047

Aragonite cementation and related sedimentary structures in Quaternary lacustrine deposits - Burke, Gerhard
or petrography. Reitner and others (1997) referred to hydro-genic shingle at Antelope Island as “ooid microbiolite chips”and attributed their cementation to cyanobacterial biofilms.In that paper they also distinguished another form of cement-ed sediments as “microbial crusts.” Descriptions of Reitnerand others’ microbial crusts sounds similar to the stromato-lites described by Pedone and Folk (1996) which they used toillustrate the role of nannobacteria in cementation.
We observed early cementation of sediment in March,1980 along the eastern and southern shoreline of Great SaltLake at four locations (figure 1). This was during earlyspring runoff and a rise in lake level following an extendedperiod of particularly low lake levels. This paper discussesthe occurrences and petrography of these cemented sedimentsand some related sedimentary features including granules,intraclasts, cemented layers, beachrock, gas-eruption struc-tures, and the formation of flat pebble conglomerates.
Setting
Great Salt Lake is an evaporated remnant of PleistoceneLake Bonneville. Today it is about 125 km (80 miles) longand 55 km (35 miles) wide with a maximum water depth lessthan 15 m (50 feet). The position of the shoreline shifts greatdistances with the slightest variation in water level becausethe lake is so shallow and has extremely low-gradient shore-lines. Salinity is tied directly to the level of the lake becauseit is a closed hydrologic system becoming more saline duringextended periods of evaporation and rising solely from riverinflux (Eardley, 1938; Eugester and Hardie, 1978). Dis-solved solids in the Great Salt Lake are more than seventimes that of sea water although ions are present in similarproportions. Lake water is slightly alkaline, but highly salinewith Na+ and Cl- as major ions. The northern part of the lakehas increased salinity in comparison to the southern endwhere the majority of freshwater enters the lake. Air temper-atures range from below freezing in the winter to over 100°Fin the summer.
Sediments around the shoreline during our samplingwere primarily ooids with minor amounts of clays and silici-clastic detritus. Ooids dominated at all the locations visitedby the authors except for the sandy (ooids) mud flats on thewest side of Stansbury Island. Radiocarbon dating of ooidsindicates they are less than 4,557 ± 133 years old (Halley,1977). Speculation by Neuweiler (1997) suggested cementa-tion occurred within the last few years and their histochemi-cal data suggest cementation is no older than the recentbiofilms. We are unaware of any C14 dating of these cements.
Study Area
Cementation was found at four of the six locations exam-ined; the exceptions were the beaches at Magna and WhiteRock Bay, and the backshore dunes at both locations on Ante-lope Island (figure 1). Cemented sediments were collected atfour locations: Promontory Point (location 1), Bridger Baynorth of Buffalo Point on Antelope Island (location 2), andtwo locations (4 and 5) on the western side of StansburyIsland. Bridger Bay is named on Utah Geological Surveygeologic maps, but is unnamed on the US Geological Survey7.5-minute quadrangle topographic map. No cementation
was encountered on Antelope Island dune or interdune sur-faces, or by shallow probing (approximately 0.5 meters [1.7feet]) into them. These aeolian dunes are composed primarilyof fine-grained ooids and occupy the backshore zone of thebeaches in both bays north and south of Buffalo Point.Although the ooid-dominated beach sediments at White RockBay appear identical with those north of Buffalo Point wherecementation was pervasive, no cementation was seen in thesurface sediments nor in several shallow cores (less than 0.5m [1.7 feet]) taken in the beach. The only difference betweenthese bays appears to be lower salinity in White Rock Baybecause of unrestricted circulation of lake waters.
CEMENTED SEDIMENTS AND SEDIMENTARY STRUCTURES
Promontory Point
Cemented sediments at Promontory Point were collectedfrom the bottom of an evaporator pond northwest of Saline(figure 1, location 1). Pond waters were hypersaline becauseinflow into the pond was manually controlled to concentratehypersaline brines sufficiently to precipitate economic quanti-ties of halite for mining.
Platy, pebble to cobble-size fragments of cementedoolitic sand (figure 2) were common around the evaporatorponds but no continuous layer of cemented sediment wasobserved. Fragments were relatively smooth on top and bot-tom and were subrounded to subangular in plan view. Theirsize ranged from 1 to 2 cm (0.4 to 0.8 inches) in thickness by5 to 20 cm ( 2 to 7.8 inches) in long dimension. It was near
The Geology of Antelope Island Utah Geological Survey100
Figure 1. Generalized map of Great Salt Lake, Utah, showinglocations referred to in text. BB = Bridger Bay; BP = BuffaloPoint; RP = Rozel Point; WRB = White Rock Bay.

Aragonite cementation and related sedimentary structures in Quaternary lacustrine deposits - Burke, Gerhard
here on the southwest coast of Promontory Point that Eardley(1938) noted several miles of shoreline, up to 0.8 km (0.5mile) wide, paved with these fragments of cemented sedi-ments, which he termed “hydrogenic shingle”. The mineralcementing the shingle was reported by Eardley (1938) to becarbonate, either aragonite or calcite.
Antelope Island
Shoreline sediments were examined at two locations onthe northwest corner of Antelope Island (figure 1, locations 2and 3). Fine-grained ooids are the primary type of sedimentforming the dunes and beaches in both bays. Significantoccurrences of cemented sediment were found only along theforeshore of Bridger Bay. No cementation was found in theforeshore sediments of White Rock Bay south of BuffaloPoint, nor in the backshore aeolian dunes of either bay.
Bridger Bay appeared to have restricted water circulationwhen viewed from Buffalo Point. A bar form parallel to theshore was present well offshore but within the confines of theheadlands of the bay. Several bar forms were dimly visiblethrough the water extending shoreward. White Rock Bayexhibited none of these structures, appearing to have unre-stricted circulation. Cementation occurred in Bridger Baywhich had restricted water circulation that caused increasedsalinity.
The areal extent of cemented sediments at Bridger Bay(figure 1, locations 2) seemed larger than that at PromontoryPoint and so was the size of many of the clasts (figure 3).Here layers of cemented sediment dipping toward the lakewere stacked so that the lowest layers were shoreward ofupper layers and formed a slightly submerged beachrock.The top of the cemented layers was relatively smooth and,where undisturbed, induration decreased downward culminat-ing in a blackened, irregular friable base. Black, hydrogensulfide-rich, sandy sediments were often encountered belowthe cemented zone. The beachrock was locally broken intolarge polygons up to 45 cm (18 inches) in diameter and gen-erally less than 7 cm (2.8 inches) thick. Clasts derived frombroken cemented layers were strewn over most of the lowerbeach face and extended some undetermined distance off-shore (figure 4). Generally, where the clasts had been rolledover, many were completely encased in a relatively smooth,glossy coating. Cemented layers around the beachrock wererecognized by probing into the sediment but their extent wasnot determined.
A variety of circular structures with raised margins wereobserved along the strandline and on a shoal about 2 meters(6 feet) from shore in the Bridger Bay (figure 4). An activelybubbling froth was present in some of the recent structures(figure 5). The structures ranged in size from 3 cm up to 140cm (1.2 inches to 4.6 feet) in diameter. Although circular,their shapes were preserved in cemented sediments andexpressed in a variety of forms from small domes to platyclasts arranged in somewhat imbricated concentric circles(figure 6). The structures were observed in different stages ofdevelopment and degradation ranging from relatively large,meter-sized circular structures filled with gas froth, to smallerrelict structures or fossil bubbles. Fossil gas-bubble struc-tures were most commonly preserved as circular upturned
The Geology of Antelope IslandMiscellaneous Publication 00-1 101
Figure 2. Cemented oolite crust fragments on beach at PromontoryPoint. Marker for scale is 13 cm (5 inches) long (see also figures14 and 16).
Figure 3. Relict eruption crater in high supra-strandline deposits atBridger Bay, Antelope Island, defined by large, polygonal fragmentsof ruptured cemented layers. Dotted outline roughly indicatesperimeter of structure which is filled with organic debris.
Figure 4. Panoramic view showing four gas-eruption craters(arrows) at Bridger Bay, Antelope Island, including froth-filledstructure in right corner, foreground (figure 5). Note small wavesbreaking, indicating a shoal on the lake side of the gas-eruptionstructures.

Aragonite cementation and related sedimentary structures in Quaternary lacustrine deposits - Burke, Gerhard
collars of cemented oolite grainstone, but sometimes occurredas round to oval, domed structures, often with an apical hole(figure 7). The cemented bubble structures ranged in sizefrom 3 to 9 cm (1.2 to 3.5 inches) in diameter and 1 to 2 cm(0.3 to 0.8 inches) in height. Larger, 40 to 140 cm wide (1.3to 4.6 foot wide), relict eruption craters occurred as circulardepressions defined by broken cemented sediment layersfilled with debris (figure 3). More recent gas-eruption struc-tures consisted of upturned cobble-size platy fragments of theruptured cemented layers that formed crude concentric ringsof roughly imbricated fragments (figure 6). The structureswere infilled with the surrounding sand and mud in additionto sediments carried up with the gas from below. Fourrecently active eruption craters and one large crater from amuch older eruption (figure 3) were observed within a fewtens of meters (around 65 feet) of each other (figures 3 and4). Gas was actively forming a bubbly froth in one structure.Eruption structures known to have been formed by thisprocess were only observed on Antelope Island, althoughlarge 1 to 2 meter (3.3 to 6.6 foot) circular structures at Stans-bury Island (discussed below) are possibly of similar origin.
Stansbury Island
Cemented sediments were examined at two locations onthe west side of Stansbury Island (locations 4 and 5, figure 1).The hydrologic setting of the west side of Stansbury Island isrestricted during low lake levels, like those during our study.High salinities are indicated by the precipitation of halite andother evaporites in isolated pools along the strandline (figures8 and 9).
The characteristics of the cemented sediment at eachlocation were significantly different from each other. Thetwo types of cemented sediment included different graintypes and different proportions of cement: 1) grainstoneclasts, and 2) peloid cementstone (primarily cement with fewgrains). At the northern location (figure 1, location 4) grain-stone intraclasts similar to those found at Antelope Islandwere abundant and strewn about the surface. They were com-posed primarily of cemented ooids with a thin laminated crustaround most of the clasts. In addition, a cemented oolite bed40 cm (15.7 inches) thick with several underlying thinnerbeds of cemented oolites was exposed in a trench previouslydug during construction (figure 10). These beds were about ameter (3.3 feet) above lake level and the ground-water table,and may represent beachrock cemented at previous high lakelevels.
Another form of cemented sediment collected at Stans-bury Island was granular sediment, or grapestone, rangingfrom 1 to 5 mm (0.04-0.2 in) in diameter (figure 11, location4). Granules were well rounded and irregular in shape havinglow sphericity with glossy smooth surfaces. Broken surfacesof most granules were opaque, although a few ooids andpeloids (1 to 4 grains) were seen in hand specimens of somegranules.
Farther south along the western shoreline of StansburyIsland (figure 1, location 5), fragments of peloid cementstonewere collected from the perimeter of large circular structures(figure 12 and 13). This second type of cemented sediment atStansbury Island was fragmented into polygons less than 3
The Geology of Antelope Island Utah Geological Survey102
Figure 5. Gas expulsion structure observed shortly after eruptionas indicated by bubbling froth. Structure is approximately 40 cm(16 inches) in diameter (13 cm marker for scale) and was seen atBridger Bay, Antelope Island. This structure is indicated in figure 4by the lower right arrow.
Figure 7. Gas-formed structures showing the variety of forms fromdomes (upper three samples) to upturned collars. Note the apicalhole in the upper left sample indicating rupture whereas the otherupper two domes did not experience rupture. Scale is 2.7 cm (1.1in).
Figure 6. Gas expulsion structure approximately 130 cm (4.3 feet)in diameter (13 cm marker in center for scale). Note concentricrings of semi-vertical, inward-leaning broken plates of layers ofcemented sediment. At least two different layers were ruptured froma minimum depth of 13 cm (5 inches). This structure is indicated infigure 4 by the left arrow.

Aragonite cementation and related sedimentary structures in Quaternary lacustrine deposits - Burke, Gerhard
The Geology of Antelope IslandMiscellaneous Publication 00-1 103
Figure 13. Domed circular structures approximately 2.8 meters (6ft) in diameter observed on west-central shoreline of StansburyIsland. Arrows indicate a few of the structures and one is outlinedby dots.
Figure 8. Unidentified evaporite minerals effloresce on the sandy(ooid) mud flats of central Stansbury Island (location 5, figure 1).Photo is about 15 cm (6 in) across.
Figure 9. Halite crystals on the surface of the sandy (ooid) mudflats of central Stansbury Island (location 5, figure 1).
Figure 10. Cemented oolite bed approximately 31 cm (1 foot) thickwith several thinner cemented zones below (arrow). Exposure is intrench at northwestern corner of Stansbury Island. See figures 24and 26 for photographs of thin sections of cemented oolites.
Figure 11. Granules, or grapestones, covered some of the surfaceat location 4 on northern Stansbury Island.
Figure 12. Close up of raised perimeter of ring structure with frag-ments of macro-laminated crust or peloid cementstone. See figures15 and 19 for photographs of thin sections of crusts and cement-stone.

Aragonite cementation and related sedimentary structures in Quaternary lacustrine deposits - Burke, Gerhard
cm (1.2 inches) in longest dimension by less than 1 cm (0.4inch) thick. Few grains were visible in these fragments. Inhand specimens the cemented sediment generally consisted ofthree thick laminae with two darker outer laminae sandwich-ing a very dense, opaque creamy-white lamina. The contactof the outer laminae with the inner lamina was irregular andthe thickness of outer laminae ranged from 1.2 to 2.5 mm(0.05-0.10 inch).
Numerous circular structures were observed at severallocations on the central-western side of Stansbury (figure 13).They were 1 to 2 meters (3.3 to 6.6 feet) in diameter and dis-tinguished by raised rims with cementstone clasts. The cen-ters of the circles were either slightly domed or depressed.Relief from the center to the raised rims was on the order of 2cm (0.8 inches), which appeared to be the same order of reliefof the rim above the surrounding sediment surface. Somewith depressed centers were filled with water.
CEMENT PETROGRAPHY
Aragonite is the only mineral found in the samples, pre-cipitating as cement in voids, between grains, and as coatings.Cementation occurs in a variety of fabrics including menis-cus, pendant, rinds, peloidal (clotted), epitaxial overgrowths,and laminated crusts. Two types of laminated crusts are dis-tinguished petrographically: a micro-laminated crust (figure14) common on beachrock, cemented layers, and intraclasts;and a macro-laminated crust (figure 15) forming the peloidcementstones of central Stansbury Island. Micro-laminatedcrusts average 211 microns in thickness with a range of 80 to480 microns and are comprised of individual laminae rangingbetween a few microns up to a few tens of microns in thick-ness (figure 16). Macro-laminated crusts are about 1 cm (0.4inch) in thickness and are comprised of laminae averaging1.9 mm (0.07 inch) thick with a range from 1.2 to 2.5 mm(0.05-0.10 inch). The different cement fabrics are comprisedby various crystal forms of aragonite, including: 1) sube-quant, anhedral submicrocrystalline grains and microcrystals;2) bundles of subhedral prisms to blades; 3) subequant,rounded stubby-blades; 4) equant, euhedral microcrystalline-prisms; and 5) needles. End members of these five forms arevery distinct although there is some gradation between theanhedral, submicrocrystalline grains and microcrystals.
Subequant, anhedral cements appear to have a bimodalsize distribution with submicrocrystalline grains less than 2microns as one size, and the other as microcrystals in the 10to 20 micron size range. The submicrocrystalline grainsoccur as rounded to subrounded particles in a variety of irreg-ular shapes (figures 17 and 18). In transmitted light theyappear clear or translucent golden brown (figure 16). Theterm “grain” is used following the reasoning of Loreau andPurser (1973) and Halley (1977) that some microcrystallinearagonite does not have the well-defined crystal faces ofeuhedral aragonite, rather it takes the shape of rods, blades,needles, or rounded particles and should not be confused withsedimentary grains. Submicrocrystalline grain cement is themost common type of cement in all of our samples occurringas individual grains, grain aggregates, rinds, peloids, and inmeniscus and laminated fabrics.
Individual anhedral microcrystalline grains and grain
aggregates occur in all of our sample types. Partial or com-plete rinds of variable to uniform thickness form on sedimen-tary grains in most of our samples but are rare or difficult todistinguish from the matrix of the outer laminae in the peloidcementstone crusts of Stansbury Island (figure 15). The outerlaminae of the macro-laminated crusts from Stansbury arecomprised mostly by these subequant, anhedral submicrocrys-talline grains where they define algal filaments (figure 19)and form the nucleus of most peloids. Peloids are most com-mon in these cementstones (figure 15). Meniscus cementsare most common in beachrock samples but are also present
The Geology of Antelope Island Utah Geological Survey104
Figure 14. Thin section of cemented oolite layer from AntelopeIsland. Two styles of aragonite cementation are present: laminated(right arrows) and meniscus (left arrow). Cements are dominantlytwo crystal forms: (1) subequant, anhedral, submicrocrystallinegrains, and (2) bundles of subequant prisms that provide the radialfabric. Ooids range in size from 0.9 mm to 1.9 mm (0.04 to 0.07inches). Note coated, broken grain (upper center arrow) in thismodern sample and compare with that of Mississippian-age examplein figure 30.
Figure 15. Thin section of cements in macro-laminated crust orpeloid cementstone from west-central Stansbury Island. Cementmorphologies dominated by subequant, anhedral submicrocrys-talline grains (bottom; less than 2 microns), grading into subequant,anhedral microcrystals (10 to 20 microns) in the upper left. Arago-nite needle meshes of both random and spherulitic textures are visi-ble in brighter portion of photo. Peloidal cements (dark subspheri-cal objects) give the clotted texture. Peloids are approximately 40microns (0.0016 inches) in diameter.

Aragonite cementation and related sedimentary structures in Quaternary lacustrine deposits - Burke, Gerhard
in some intraclasts (figures 14 and 20). These cements alsooccur in the micro-laminated crusts as laminations and inlaminae separating radial-fibrous bundles of prismatic crystalsfrom other laminae (figure 16). Some individual lamina arecontinuous around much of their substrate whereas others arelaterally discontinuous, possibly indicating distinct episodesof precipitation (figures 14 and 16). The micro-laminatedcrusts commonly drape between grain surfaces where theyform coatings on clasts and beachrock (figure 14). Thecements in the granules, or grapestones, of Stansbury Islandare dominated by subequant, anhedral submicrocrystalline
grains (figure 21) although needle cements occur in somevoids, and peloids may have outer laminae of radial fibrousbundles of prisms or blades (figure 15).
Microcrystals of subequant, anhedral cements (figures 15and 19) were observed in the macro-laminated crusts ofStansbury Island where they occur in the inner laminabetween the darker submicrocrystalline cements forming lam-inae on both sides. The contact between the two sizes of
The Geology of Antelope IslandMiscellaneous Publication 00-1 105
Figure 16. Thin section of radial fibrous fabric of aragonite cementseen forming laminae (left arrow). Submicrocrystalline aragoniteprecipitated in vug of Antelope Island intraclast (right arrow).Photograph is about 4 mm (in) across.
Figure 17. SEM photomicrograph of cemented ooids shown withless magnification in figure 23. Equant, euhedral microcrystallineprisms (rhombs; left arrow), submicrocrystalline grains (rightarrow) of aragonite, and bundles of subhedral prism cements bindooids; a few clay flakes fill in void space (x1,500).
Figure 18. SEM photomicrograph of cemented ooids in an intra-clast from Bridger Bay, Antelope Island. Meniscus cement com-prised of subhedral prisms and subequant, anhedral submicrocrys-talline aragonite grains that infill space between prisms and providea foundation for the prisms. Prisms range from 3 to 10 microns inlength. Box on lower image (x300) shows area of detail of upperimage (x3,000).
Figure 19. Thin section of algal filaments (arrow; probably Gloeo-capsa) defined by subequant, anhedral, submicrocrystalline arago-nite grains grading into microcrystals at the bottom. Sample frommacro-laminated crust from central Stansbury Island (location 5,figure 1). Note darker scattered clays and peloids. Photograph isabout 1 cm (0.4 inch) across.

Aragonite cementation and related sedimentary structures in Quaternary lacustrine deposits - Burke, Gerhard
anhedral crystals appears gradational and irregular (figures 15and 19). The microcrystal cements appear brighter and moreclear than the submicrocrystalline grains not only becausethey are larger, but also because they appear to contain fewerclay or algal impurities than the submicrocrystalline cements.
Bundles of subhedral prisms to bladed crystals range insize from 2 to 19 microns in length and from 1 to 2.5 micronsin width (figures 22 and 23). Prism-to-bladed aragoniteoccurs as microcrystalline prisms to stubby blades with anaverage width to length ratio of 1:1.6 microns with a range of1.1:1 to 1:2.7 microns. They grow perpendicular to theirfoundation in single layers of palisades of bundles or multiplelayers of prism to bladed bundles of epitaxial overgrowths(figure 22). Determining the length of longer single crystalscan be difficult because most have discontinuities perpendicu-lar to their c-axis (figure 22). The vertical position of the dis-continuities is at a similar height in the crystals and con-tributes a vaguely laminated or layered appearance to thecements. These discontinuities are irregular in shape and
appear to be dissolution features. These longer crystals gen-erally have rounded to subrounded terminations (figure 22)whereas shorter crystals in the range of 2 to 4 microns inlength have sharp straight terminations perpendicular to the c-axis of growth (figures17 and 18). The small size of the crys-tals and their occurrence in palisaded bundles result in a radi-al fibrous texture (figures 16 and 20). These cements occurin clasts and in the beachrock as coatings, meniscus, andisopachous fabrics. Prismatic cements represent the secondmost common crystal form of aragonite in our samples.
Subequant rounded stubby blades have average width tolength ratios of 1:1.5 microns and a range of 1:1.1 to 1:2microns (figure 24). Crystal size ranges from 16 to 32microns in height. They do not have crystal faces in SEMimages (figure 25) but in thin sections sharp boundariesbetween crystals are apparent and they grossly resemble blad-ed magnesium-calcite (figure 24). In transmitted light theyappear bright and clear. Subequant bladed aragonite occursas spectacular isopachous cements rimming ooid and peloidgrains in intraclasts (figure 26). Partial isopachous rims orisolated crystals are more common within intraclast pores andvugs between grains as very fine subequant crystals (figures27 and 16). These cements are most common in submergedsamples of clasts and cemented layers from Bridger Bay, butwere also found in samples of cemented layers from the
The Geology of Antelope Island Utah Geological Survey106
Figure 22. SEM photomicrograph of cements binding ooids in anintraclast from northern Stansbury Island, showing thick rim of lam-inations of subequant, anhedral microcrystalline grains overlain bypalisaded bundles of epitaxial overgrowths of subhedral, prismaticaragonite. Note the discontinuities (arrow) in the prisms that sug-gest laminations. We interpret these as dissolution features that maysupport the process of cementation proposed by Reitner and others(1997). Adjoining cements on ooid surface at bottom of micrographshow the terminations on the bundles of subhedral prisms of arago-nite (x1,200).
Figure 20. Thin section of meniscus cement (right arrow) beneathmicro-laminated crust on intraclast collected at Bridger Bay. Notehow crust drapes between grains and pendant gravity cement (leftarrow) forms between crust and underlying ooid. Pendant andmeniscus cements are characteristic of cementation in a vadoseenvironment. Photograph is about 2 mm (0.8 inches) across.
Figure 21. Granules 1 to 5 mm (0.04-0.2 inches) across in thin sec-tion viewed with polarized light show they are dominated by peloids,pellets, and submicrocrystalline aragonite with a few ooids (see fig-ure 29).

Aragonite cementation and related sedimentary structures in Quaternary lacustrine deposits - Burke, Gerhard
trench about a meter above the lake at the northern StansburyIsland site (figure 10, location 4).
Equant euhedral rhombs and prisms are about 4 micronswith sharp crystal faces (figure 17) that appear sharp andbright in transmitted light. They occur associated with theanhedral submicrocrystalline grains in meniscus and rimcements and in laminated crusts in spaces between prismaticcrystals binding ooids and other grains.
Needles have an average width-to-length ratio of 1:8.2microns and occur as meshes, radiating spherulites (figure 15)and solitary crystals (figure 27). Individual needles range inlength from 8 to 28 microns and in width from about 1 to 4microns. Meshes consist of randomly oriented tangles ofneedles, whereas spherulites are more organized clusters ofneedles radiating from a central point. In transmitted lightsolitary crystals appear clear and bright, meshes appear assmall, bright, irregular areas with diffuse boundaries, andspherulites appear as bright circular-spots. Needles are mostcommon in pores in granules and macro-laminated crusts(peloid cementstones) of central Stansbury Island, and morerarely in pores in intraclasts. Aragonite needles are seentogether with aragonite blades in a few samples (figure 27).In general, needle cements represent a small portion of all thecement morphologies in our samples.
Crusts, or coatings, consist of stacks of laminae of dif-ferent crystal types. Laminae of microcrystalline aragoniteintermittently alternate with laminae of palisades of bundlesof microcrystalline prismatic aragonite to form laminatedcrusts (figures 16 and 18). Some laminations in depressionsthin laterally indicating different episodes of precipitation(figure 16). The prismatic aragonite crystals generally showmultiple events of epitaxial overgrowth. Anhedral subequant
and equant submicrocrystalline grains occupy spaces betweenprismatic crystals and also form laminations (figure 17).Physical evidence of algae influencing the formation of themicro-laminated crusts is generally lacking among the uni-form laminations (figures 16 and 20) of our samples. How-ever, recent biogeochemical studies of the Antelope Islandclasts have documented that biofilms on their surface causecalcification (Neuweiler, 1997). The biofilms were dominat-ed by the cyanobacteria Gloeocapsa. Those coatings are dis-tinctively different than our peloid cementstones of central
The Geology of Antelope IslandMiscellaneous Publication 00-1 107
Figure 23. SEM photomicrograph of cemented ooids, middle ofStansbury Island, showing submicrocrystalline rim cements bindingooid laminae of large radial fibrous bundles of prisms (x300).
Figure 24. Thin section of aragonite isopachous cements (16 to 32microns thick) shown in figure 26. Note stubby-bladed habit ofcement with distinct crystal boundaries and the similarity of fabricsin the ooid cortexes with fabrics in the laminated cements in figure14 and 16.
Figure 25. SEM photomicrograph of ooid in an intraclast fromBridger Bay, Antelope Island, showing submicrocrystalline laminaeon broken ooid surface and rounded, stubby-bladed isopachouscements binding ooids together (x300). Figures 24 and 26 showthese cements in thin section.

Aragonite cementation and related sedimentary structures in Quaternary lacustrine deposits - Burke, Gerhard
Stansbury Island which show clear evidence of algal fila-ments (figure 19) and cements are composed of thick outerlaminations of anhedral submicrocrystalline grains with aninner lamination of 10 to 20 micron anherdral microcrystals(figure 15).
DISCUSSION
Cementation along the shoreline of Great Salt Lake isoccurring in a rigorous physical and chemical environmentthat is further stressed by great lateral fluctuations in thestrandline as lake levels change. The strandline is the centerof the shoreline which is comprised of several facies includ-ing subaqueous foreshore, beach, and subaerial backshore.The period and frequency of lake level fluctuations vary ondifferent scales: seasonal, historical, and geologic. With sea-sonal changes of lake levels as much as 0.9 m (3 feet) andover 7 m (23 feet) historically, shoreline facies have migratedmiles back and forth in recent times. Beachrock provides atemporal marker of a shoreline. Because of the low dip of theshoreline and strong seasonality, sediments are exposed to a
wide range of combinations of vadose and phreatic waterchemistries over a wide range of periods of time and frequen-cies. The conditions existing at the time samples are collect-ed may not be representative of the conditions under whichthey formed. Shorelines are dynamic environments withephemeral water levels, so with each fluctuation large vol-umes of sediment are mobilized over vast areas. The cement-ed layers we sampled and observed have not always beenexposed at the sediment surface as they were during our sam-pling. To assign a particular cement morphology to a particu-lar environment of deposition based on where we collectedthe samples could be misleading in this case, but the cementmorphologies and fabrics can help identify the conditions atthe time they precipitated. Cement morphologies and fabricsin conjunction with sedimentary structures like beachrockprovide a frame of reference for environmental reconstruc-tions of shorelines.
Cementation
The widespread distribution of cementation around GreatSalt Lake and the wide array of sedimentary structures andcrystal forms of cement provide insight not only for interpret-ing depositional environments in ancient rocks but also forunderstanding the complexity and variety of the cementationprocesses. The occurrence of beachrock is a particularly use-ful feature to recognize because its presence in ancient rocksestablishes the position of a shoreline. Knowing the positionof the shoreline is useful in discriminating between backshoreooid dunes and offshore ooid shoals. Cementation of theshoreline indicates that conditions conducive for precipitationof cements existed for an adequate period to allow for forma-tion and preservation of beachrock. In marine systems,Hanor (1978) determined that CO2 degassing from groundwa-ter at the marine phreatic contact in the beach resulted inrapid cementation and formation of beachrock in tropicalenvironments. Binkley and others (1980) favored a similarmechanism of degassing for formation of beachrock along amarl lake in Michigan. Degassing of phreatic waters may becontributing to cementation along Great Salt Lake shorelinesbut other mechanisms such as hypersalinity (Shinn, 1969;Friedman and others, 1973; Halley, 1977), organomineraliza-tion (Reitner and others, 1997; Neuweiler, 1997), and intersti-tial gases (Cloud, 1960; Reitner and others, 1997) are alsoknown to contribute to the precipitation of abundant cements.
The only place we found beachrock was in Bridger Bayon the northwestern shore of Antelope Island, just north ofBuffalo Point. In this bay cementation was extensive andpresent in a variety of forms. Also present were intraclasts,layers of cemented sediment, and fossilized gas structures.This locality, compared with the small bay just to the south ofBuffalo Point, illustrates the probable influence of extremehypersalinity on cementation rates.
South of this locality, in White Rock Bay, no cementationwas found. Several shallow cores (less than 0.5 m [<1.7 ft])were taken in the beach and no cementation was encountered,although the sediments were identical with those in the bay tothe north where massive cementation has taken place. Anoth-er locality where no cementation has apparently taken place isat Magna, a public beach.
The Geology of Antelope Island Utah Geological Survey108
Figure 27. Thin section of co-occurrence needle cement (arrow)and subequant, rounded, stubby bladed aragonite on outer marginof ooid on left. An aggregate of subequant, anhedral, microcrystalsround-off the pore at the contact of the two ooids. Crystals areabout 16 microns long.
Figure 26. Thin section of isopachous rim cements of blocky tostubby-bladed aragonite around ooid grains. Ooids are about 1.4mm (0.06 inch) in diameter.

Aragonite cementation and related sedimentary structures in Quaternary lacustrine deposits - Burke, Gerhard
Dunes flanking the beaches in both bays by Buffalo Pointare composed primarily of wind blown ooids from the beach.No cementation was encountered on the dune surfaces, in theinterdune areas, or by shallow probes (0.5 m [1.7 ft]) into thedunes.
The absence of cemented sediments at White Rock Bayis particularly interesting because of its proximity to cement-ed sediments in a geographic setting that suggests no majornatural differences of sediments between the two bays.Although no apparent differences in setting seemed to exist,observations of both bays from Buffalo Point suggest that thecementation occurs in a bay that has been barred so as toincrease salinity. Several bar forms confine circulation in thenortherly bay whereas White Rock Bay to the south appearsto have totally open circulation.
Regularity of the bar forms suggests that the northerlybay was made into a salt harvest pan and later abandoned. Itis possible that the bar forms are remains of former offshorebars, but their semi-grid like pattern suggests that they areman-made. Extreme hypersalinity within the probable saltpan is the distinguishing feature between the cement-occur-ring and non-cement occurring bays. If groundwaterdegassing was the sole cause of cementation one mightexpect it in both bays because of their similar topography andrecharge areas. Comparison of the other localities wherecemented sediments are located, such as the salt evaporator atPromontory Point, shows an apparent relationship of hyper-salinity and cement occurrence, leading us to suggest thatextreme hypersalinity is one control for cementation in GreatSalt Lake.
Three cement fabrics are characteristic of Great Salt Lakebeachrock: meniscus, pendant (figure 20), and laminated.Meniscus and pedant cements indicate deposition in a vadoseenvironment when pores are subject to filling with variousamounts of air during periods alternating between wet anddry (Moore, 1973; Longman, 1980). Subequant, anhedralsubmicrocrystalline aragonite is the dominant crystal form inthese different fabrics.
Organic Mediation of CementationTwo groups of authors have recently proposed organic
mediated mechanisms for the precipitation of laminatedcements in Great Salt Lake, Pedone and Folk (1996), andReitner and others (1997). Pedone and Folk (1996) studiedsamples of stromatolites from the southwestern side of Stans-bury Island and proposed an elegant explanation for the dif-ferent crystal forms. Based on physical evidence they pro-posed that consumption of brine shrimp egg cases by nan-nobacteria in the sediment alter the microchemical environ-ment to precipitate laminae of anhedral microcrystals. Afterthe organic matter has been consumed by bacterial respira-tion, the microcrystal laminae are overlain by inorganicallyprecipitated bundles of prismatic aragonite. This explains onepair of laminae but not multiple pairs of stacked laminationslike those in our crusts, or in ooids with nonorganic nuclei.Laminated cements on our beachrock are similar to thosefound on intraclasts at Antelope and northern Stansburyislands, and at Promontory Point.
Reitner and others’ (1997) description of laminatedcements on “ooid microbiolite chips” is similar to our micro-
laminated crusts on beachrock and the coated intraclasts atthree of our locations. They reported two types of clasts fromBridger Bay, Antelope Island. One they referred to as “ooidmicrobiolite chips,” and the other as “microbiolite crusts.”Their descriptions of microbiolite crusts are similar to ourmacro-laminated crusts from middle Stansbury Island that arediscussed below. The micro-laminated crusts are comprisedby laminae of anhedral microcrystalline grains intermittentlyalternating with a few laminae of bundles of anhedral prismsthat cause the fibrous texture. Using sophisticated biogeo-chemical analytical techniques, Reitner and others (1997)concluded that the veneers of laminated cement on the“chips” occurred at the base of thin biofilms dominated bythe cyanobacteria Gloeocapsa. They noted that the fabric ofthe laminated cements were “strikingly similar” to that of theooids and the cements between the ooids within the chips.
This is interesting because the focus of their work was onooids from which they concluded, via hydrocarbon analysis,that cyanobacteria played no role in the precipitation ofcements forming the ooids. Yet the fabric of the laminatedcements forming the ooids is “strikingly similar” to that ofthe chips. This may indicate that different organically medi-ated mechanisms produce similar crystal morphologies andfabrics. Ooid cements have fabrics similar to the micro-lami-nated crusts on the beachrock and intraclasts (Reitner andothers, 1997), and they proposed a process for the precipita-tion of ooid lamina within an organic-rich mucus thatexplains ooid fabrics and their different crystal morphologies.The mucus is a solution of organic macromolecules contain-ing few living organisms and dominated by waxy organiccompounds derived from insects and from terrestrial plants.
The cements and the process they describe for ooids iscompatible with the cements and fabrics of our laminatedcements except they do not adequately explain the multiplelaminations of prismatic bundles. Laminae of bundles ofprismatic crystal were rare in their chips. Reitner and others,(1997) proposed that an organic mucus covers most GreatSalt Lake sediments and other shoreline substrates where italso fills depressions and can be mixed with biofilms. Themucus is a semistratified solution in which micrite precipi-tates in the bottom layer, epitaxial overgrowths on fibrousprisms occur in the intermediate layer and dissolution occursat the tips of prismatic crystals in the upper acidic layer.Micrite can precipitate over fibrous palisades of crystals andform concentric layers. No calcification occurs in the upperlayer of the mucus which is more acidic than the lower layerwhere the tips of the fibrous crystals showed dissolution fea-tures (Reitner and others, 1997). Dissolution features (figures28 and 22) in some of our intraclast samples from mid-Stans-bury Island appeared as discontinuities within the epitaxialprisms not at the tips. These sublinear discontinuities suggestlaminations and possibly multiple growth events, but mayrepresent a nonuniform surface for crystal growth, nonuni-form crystal growth, or a zone of dissolution. The epitaxialovergrowths cements appear vaguely laminated, because ofsmall scale dissolution within the crystals (figure 22). Onecould interpret this as a CaCO3 recycling mechanism similarto that proposed by Reitner and others (1997) except ourobservations suggest that dissolution is occurring within the
The Geology of Antelope IslandMiscellaneous Publication 00-1 109
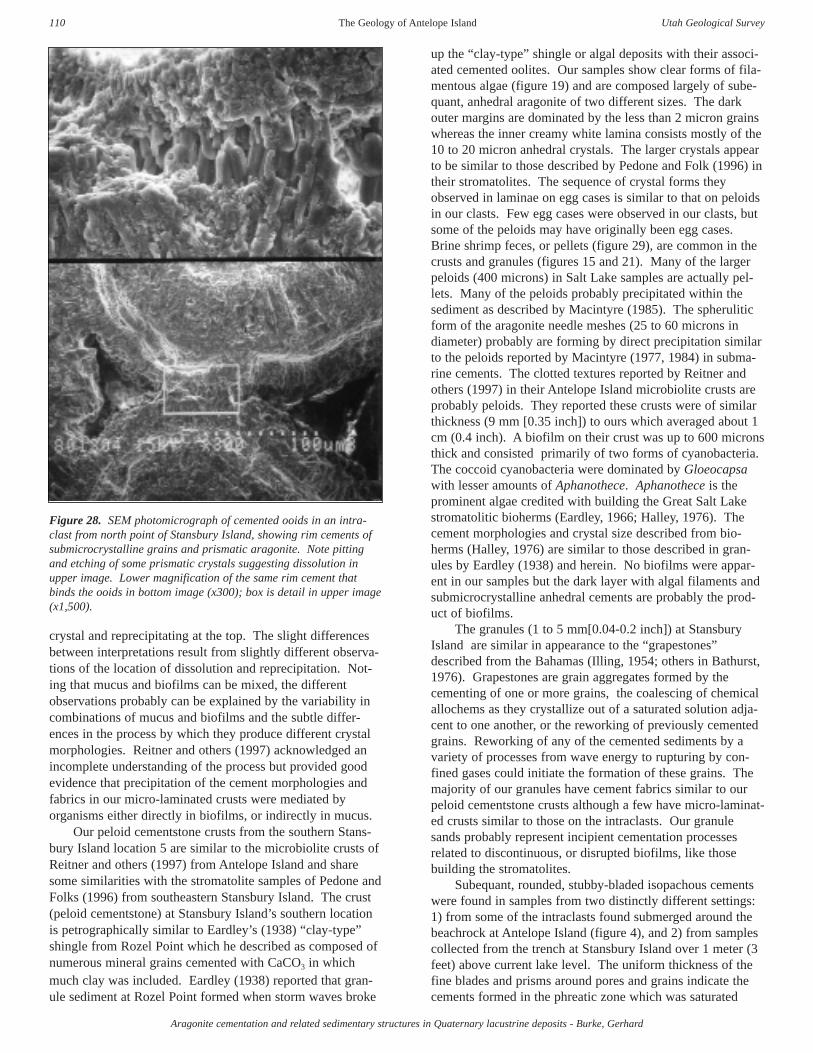
Aragonite cementation and related sedimentary structures in Quaternary lacustrine deposits - Burke, Gerhard
crystal and reprecipitating at the top. The slight differencesbetween interpretations result from slightly different observa-tions of the location of dissolution and reprecipitation. Not-ing that mucus and biofilms can be mixed, the differentobservations probably can be explained by the variability incombinations of mucus and biofilms and the subtle differ-ences in the process by which they produce different crystalmorphologies. Reitner and others (1997) acknowledged anincomplete understanding of the process but provided goodevidence that precipitation of the cement morphologies andfabrics in our micro-laminated crusts were mediated byorganisms either directly in biofilms, or indirectly in mucus.
Our peloid cementstone crusts from the southern Stans-bury Island location 5 are similar to the microbiolite crusts ofReitner and others (1997) from Antelope Island and sharesome similarities with the stromatolite samples of Pedone andFolks (1996) from southeastern Stansbury Island. The crust(peloid cementstone) at Stansbury Island’s southern locationis petrographically similar to Eardley’s (1938) “clay-type”shingle from Rozel Point which he described as composed ofnumerous mineral grains cemented with CaCO3 in whichmuch clay was included. Eardley (1938) reported that gran-ule sediment at Rozel Point formed when storm waves broke
up the “clay-type” shingle or algal deposits with their associ-ated cemented oolites. Our samples show clear forms of fila-mentous algae (figure 19) and are composed largely of sube-quant, anhedral aragonite of two different sizes. The darkouter margins are dominated by the less than 2 micron grainswhereas the inner creamy white lamina consists mostly of the10 to 20 micron anhedral crystals. The larger crystals appearto be similar to those described by Pedone and Folk (1996) intheir stromatolites. The sequence of crystal forms theyobserved in laminae on egg cases is similar to that on peloidsin our clasts. Few egg cases were observed in our clasts, butsome of the peloids may have originally been egg cases.Brine shrimp feces, or pellets (figure 29), are common in thecrusts and granules (figures 15 and 21). Many of the largerpeloids (400 microns) in Salt Lake samples are actually pel-lets. Many of the peloids probably precipitated within thesediment as described by Macintyre (1985). The spheruliticform of the aragonite needle meshes (25 to 60 microns indiameter) probably are forming by direct precipitation similarto the peloids reported by Macintyre (1977, 1984) in subma-rine cements. The clotted textures reported by Reitner andothers (1997) in their Antelope Island microbiolite crusts areprobably peloids. They reported these crusts were of similarthickness (9 mm [0.35 inch]) to ours which averaged about 1cm (0.4 inch). A biofilm on their crust was up to 600 micronsthick and consisted primarily of two forms of cyanobacteria.The coccoid cyanobacteria were dominated by Gloeocapsawith lesser amounts of Aphanothece. Aphanothece is theprominent algae credited with building the Great Salt Lakestromatolitic bioherms (Eardley, 1966; Halley, 1976). Thecement morphologies and crystal size described from bio-herms (Halley, 1976) are similar to those described in gran-ules by Eardley (1938) and herein. No biofilms were appar-ent in our samples but the dark layer with algal filaments andsubmicrocrystalline anhedral cements are probably the prod-uct of biofilms.
The granules (1 to 5 mm[0.04-0.2 inch]) at StansburyIsland are similar in appearance to the “grapestones”described from the Bahamas (Illing, 1954; others in Bathurst,1976). Grapestones are grain aggregates formed by thecementing of one or more grains, the coalescing of chemicalallochems as they crystallize out of a saturated solution adja-cent to one another, or the reworking of previously cementedgrains. Reworking of any of the cemented sediments by avariety of processes from wave energy to rupturing by con-fined gases could initiate the formation of these grains. Themajority of our granules have cement fabrics similar to ourpeloid cementstone crusts although a few have micro-laminat-ed crusts similar to those on the intraclasts. Our granulesands probably represent incipient cementation processesrelated to discontinuous, or disrupted biofilms, like thosebuilding the stromatolites.
Subequant, rounded, stubby-bladed isopachous cementswere found in samples from two distinctly different settings:1) from some of the intraclasts found submerged around thebeachrock at Antelope Island (figure 4), and 2) from samplescollected from the trench at Stansbury Island over 1 meter (3feet) above current lake level. The uniform thickness of thefine blades and prisms around pores and grains indicate thecements formed in the phreatic zone which was saturated
The Geology of Antelope Island Utah Geological Survey110
Figure 28. SEM photomicrograph of cemented ooids in an intra-clast from north point of Stansbury Island, showing rim cements ofsubmicrocrystalline grains and prismatic aragonite. Note pittingand etching of some prismatic crystals suggesting dissolution inupper image. Lower magnification of the same rim cement thatbinds the ooids in bottom image (x300); box is detail in upper image(x1,500).

Aragonite cementation and related sedimentary structures in Quaternary lacustrine deposits - Burke, Gerhard
with respect to aragonite. The subaerial samples are stillaragonite but they have aberrant crystal forms. Subaqueoussamples had some of the clear prism crystals, but they wererounded. Precipitation within the lake at an earlier, higherstand with lower salinities could explain the occurrence ofthese cements in both lake and supra-lake deposits. Thisinterpretation is compatible with historical lake levels andwater chemistries (Spencer and others, 1985). Aragonite isunstable at atmospheric conditions so one would expect thatcements above present lake levels would alter to low-magne-sium calcite or that the crystal habit would be modified with-in the meteoric phreatic zone (Longman, 1980). This mayexplain the more bladed appearance of the subaerial samplesas compared to the somewhat fibrous bundle appearance ofthe subaqueous intraclast samples. The early stages of recrys-tallization could eliminate the fibrous fabric and yet maintainthe bundles seen in SEM (figure 25), which in thin sectionwould look like the rounded stubby blades in figure 24.
Gas Mediation of CementationGas in the sediments is also contributing to the cementa-
tion process. Gas trapped by organic films in the water wasobserved forming a frothy foam in the center of a gas-erup-tion structure at Antelope island. Smaller sedimentary struc-tures of cemented ooids collected in the same area have theform of domes and upturned, arcuate collars around 8 cm (3inch) in diameter. Apical holes in some dome structures areinterpreted to result from gas pressure increasing until theconfining sediments rupture. Domes and collars rise about 2cm (0.8 inch) above a flat-base flange of cemented sediment,suggesting that gas was below the cemented area and bulgesformed in sediments that were weaker and/or more tensile.The collars are interpreted to form as a result of cementationof the sediments forming the walls of gas conduits or fromthe rupture of domed sediments before cementation was suffi-cient to preserve them as domes. Cementation had to beessentially contemporaneous with gas doming of the sedi-ments or these structures would not have been preserved.Cementation in beachrock has been shown to occur within 12hours by degassing of CO2 from ground water (Hanor, 1978).
Cloud (1960) briefly discussed the general role of gas ininducing cementation in sediments and more recently Reitnerand others (1997) provided convincing evidence that ooid for-mation in Great Salt Lake is related to strong sulfate reduc-tion in the sediments.
Oil seeps, black reducing sediments emitting a stronghydrogen sulfide smell, and frothy foams of bubbles all indi-cate the variety of sources and abundance of gases trapped inGreat Salt Lake sediments. Although a deep, ancient sourceof mature hydrocarbons cannot be excluded as a source forgases in the sediments, organic material in Great Salt Lake issufficiently abundant and the depositional conditions appro-priate to produce biogenic gas during the Pleistocene. Organ-ic deposits of animal, plant, and fecal material are of suchgreat abundance that they form windrows of debris for milesalong the beach where they decay and contribute a fetid odor(Eardley, 1938). Large amounts of organic matter areundoubtedly buried and incorporated into the sediment. Thisis indicated in numerous trenches dug into lake sediments thatcontained foul-smelling, sticky, impermeable clays (Seelosand others, 1975). Gas generation by decaying organismsproduces various gases including some combination of carbondioxide, methane, hydrogen, and hydrogen sulfide. The typeof gas generated at shallow depths is primarily a function ofthe type of bacteria present, the type of organic material, andthe occurrence of oxidizing or reducing conditions. Eardley(1938) concluded that the lake waters were a reducing envi-ronment and reported the emission of sulfurous fumes fromthe sediments. We believe gas generated in the sediments bythe decaying process contributes to the cementation processand formation of eruption structures.
Gas-formed sedimentary structures similar in size andshape to the domes and collars have been reported in associa-tion with algal mats and were referred to as gas blisters
The Geology of Antelope IslandMiscellaneous Publication 00-1 111
Figure 30. Mississippian-age ooids and coated broken grains(arrow) from the subsurface of the Williston Basin, North Dakota.Halley (1977) demonstrated that hypersaline ooids characterized byradial fibrous fabrics are more susceptible to breakage than marineooids with tangential fabrics, so coated, broken grains can indicatedeposition in hypersaline conditions. Lack of cementation indicatessubaqueous deposition distant from the strandline yet in a hyper-saline setting. Compare these fabrics with those in ooids andmicro-laminated crusts in figures 16 and 20, and with the coatedbroken grain in figure 14.
Figure 29. Pellets (arrow) in granules are probably brine shrimpfeces like those reported by Eardley (1938). Pellets are up to 400microns in size. Thin section photomicrograph taken with planetransmitted light.

Aragonite cementation and related sedimentary structures in Quaternary lacustrine deposits - Burke, Gerhard
(Black, 1933; Clarke and Teichert, 1946;Ginsburg and others,1954; Ginsburg, 1955; Kendall and Skipwith, 1968; andDavies, 1970). Algal gas blisters are generally preserved assmall millimeter-scale fenestral pores and birdseye structures(Shinn and others, 1965) but cementation of gas structures thesize of the domes reported here are rare. Laminated algalmats were not present at any of the locations we examinedbut they are not required for the formation of gas structures.Emery (1960) reported sand domes were formed in non-algalassociated marine beach sediments in southern California.He postulated that the fine sediment was sufficient to trap thegas that lifted the sediment into domes.
A variety of components contribute to the trapping of gasbeneath Great Salt Lake sediments, including algae, organicfilms, clays, and cements. The majority of our samplesshowed no evidence of algae in hand specimens, thin sectionor SEM images. Algal filaments are only seen in thin sec-tions of the peloid cementstone crusts of central Stansbury(location 5) and are one of the major factors distinguishingthem as a different crust type. A greenish cast on some of ourgrainstone samples was the only evidence for the presence ofalgae, biofilms or organic mucus. The heterotrophiccyanophytes described by Reitner and others (1997) probablycontribute to the greenish cast we observed on these samples.Algae are abundant in the lake (Eardley, 1938), but mostalgae are seasonal and their standing crop was probably lowduring our March collection.
Clays are present as a very minor constituent in ourgrainstone samples (estimated to be less than a few percent)but are visually more abundant in the peloid cementstonecrusts (figure 15 and 19). Eardley (1938) documented thatclays are one of three major sediment types in the lake. Incompiling a map of the distribution of the sediment types henoted clays are concentrated in the deeper portions of thebasin and in embayments with restricted wave energy. Imper-meable clays interbedded with potentially permeable brownsandy clays were reported in trenches dug at many locationsaround the lake (Seelos and others, 1975).
Carbonate cementation is widespread in Great Salt Lakesediments. Many processes are contributing to cementationin surface sediments, and in the vadose and shallow lacustrinephreatic environments. It is possible that some cementationis occurring at shallow depths within dysoxic sediment asNeuweiler (1997, p. 199) suggested for ooid formation.Beaches are dynamic and layers of sediment cemented nearthe surface could easily be buried. Trenches by others andour shallow probes have encountered buried cemented sedi-ments. The imbricated nature of the plates forming eruptioncraters and the fact that there were more plates than could bereconstructed into a single layer suggest that more than oneburied layer had been ruptured and the pieces had been forcedup through the sediment. The angular edges of the fragmentsindicate brittle fracture from substantial force.
We believe that the gas is generated by the biodegrada-tion of organic material; the gas is then trapped beneathimpermeable layers of either cemented beds or clays. Gasmoves up dip not only because of density differences, butalso because rising lake levels increase the hydrostatic pres-sure on the sediments compressing the gas, thereby forcingthe gas upwards along bedding planes. When the gas encoun-
ters a zone of weakness in poorly cemented sediment, orother types of seals, a bulge develops, or in some cases, thesurficial layers burst, forming gas-eruption craters or thesmaller circular upturned collars. A similar mechanism wasproposed by Emery (1960) to explain gas domes in unconsol-idated sediment. He postulated that the well-developed alter-nating laminae of coarse and fine sand allowed air to be driv-en by waves breaking on the beach to be forced along perme-able layers until the air was so compressed that it could liftseveral centimeters of sand to form the domes. A compres-sive strength of 330 kg/m2 (68 lbs/ft2) was measured on arag-onite-cemented sand layers of similar thickness in the PersianGulf (Shinn, 1969). Gas pressures of the magnitude neededto break cemented sediment of this strength also could pushfragments of cemented layers from shallow depths throughunconsolidated sediment and produce gas-eruption structuresin the form of upturned, imbricated plates of cemented sedi-ment like those we observed.
Another mechanism for the formation of crater-like struc-tures in Great Salt Lake was proposed by Eardley (1938) afterobserving “craterlets” formed along a bedrock sediment con-tact but he gave little information about their characteristics.No cemented sediments were described in association withhis structures. The “craterlets” were postulated to have beencreated by the expulsion of cold concentrated brines from thedewatering of clays following compaction initiated by anearthquake. This mechanism does not explain our observa-tions (e.g., bubbling froth and cemented gas domes) as wellas does our proposal of gas expulsion.
Related Sedimentary Structures
Flat-pebble ConglomeratesFragments of layers of cemented sediment were cement-
ed together to form flat pebble conglomerates. Most flat-peb-ble conglomerates are fine-grained laminated muds and siltsassociated with peristrandline deposits (Shinn and others,1965; Deffeyes and others, 1965). Because the available sed-iments are sand sized and cementation rates are so rapid,coarse-grain conglomerates are common. Other reports ofcoarse-grained flat-pebble conglomerate formation are fewand associated with other hypersaline deposits in the Red Sea(Friedman and others, 1973) and the Persian Gulf (Taylor andIlling, 1969). If one encountered intraclasts in ancient con-glomerates as large as those we report here, one would wantto be cautious about assigning energy conditions to the for-mation of such a deposit.
Circular StructuresCircular structures similar to those we observed in large
number on the west-cental side of Stansbury Island (figure13) were first reported by Eardley in the 1950s (in Seelos andothers, 1975, p. 91) but were not studied in detail until later(Stifel and Stokes, 1961; Stifel, 1964; and Seelos and others,1975). The latter authors reported structures with shapesranging from dumbbell to rounded with a size range from 0.3to 9.3 meters (3 to 30 feet) in diameter. Stifel (1964) reportedthe average diameter to be 1.8 meters ( 6 feet). Extensivetrenching by Seelos and others (1975) showed many of thestructures were sediment-filled depressions whereas others
The Geology of Antelope Island Utah Geological Survey112

Aragonite cementation and related sedimentary structures in Quaternary lacustrine deposits - Burke, Gerhard
were diapir-like. The average depth of the disturbed bedsshown in sketches of trenches through circular structures is0.58 meters (1.9 feet) (Seelos and others, 1975). The struc-tures are generally convex upward although near-vertical bedsin two trenches appeared to be possible piercement structuresand those examples had beds that extended to a depth greaterthan that of the trenches. It should be noted that at least threeof the trenches showed “calcium-cemented” oolites that were“similar to shingles on the surface” (Seelos and others, 1975).The convex-upward internal structure of the ring structuresmay be due to collapse of the overlying beds after expulsionof gas. Earlier descriptions of trenching reported by Eardley(1966) revealed concave-upward structures. These latterstructures and piercement structures are what one might pre-dict for gas-escape structures. No conclusion about the originof these structures was reached by previous authors althoughseveral theories were offered.
An alternative explanation may come from two types ofsedimentary structures described from Death Valley (Huntand others, 1966) that have similarities with the circularstructures at Salt Lake. One type might be mistaken for thegas-eruption craters, and the other may have formed byprocesses similar to the large circular ring structures at Stans-bury Island. The first is a circular collapse fracture systemdeveloped when salts are dissolved from below. The secondoccurs in areas of severe washing, where salts rise by capil-lary action to the surface, often forming circular spots. Thespots consist of salt efflorescence and are from 30 to 60 cm(1 to 2 feet) in diameter surrounded by concentric belts ofdamp mud of similar diameter (Hunt and others, 1966). Wealso observed efflorescence in areas adjacent to Salt Lake cir-cular structures (figure 8).
We suggest that there is more than one mechanism forforming the circular structures, but at least some of them mayhave formed by gas expulsion, as were the eruption craters inthe cemented layers. Seelos and others (1975) describedhighly permeable sediments between impermeable clays orcemented oolite zones in the trenches they dug through circu-lar structures at various locations around Salt Lake. Thestratigraphy they described provides the criteria necessary forthe formation of the eruption structures we observed; that isthe permeable beds would serve as channels for gas move-ment and the impermeable clay and cemented layers wouldconfine and trap the gas. When gas pressures become toohigh, gas structures can form in the confining beds. We knowgas structures range from microscopic birdseye to meter-scaleeruption craters. Cementation associated with gas seeping upalong permeable beds might explain the crusts we collectedon the perimeter of the circles we sampled and the concentricrings of pebbles Seelos and others (1975) reported in thesestructures at Dolphin Island.
Because cementation in Great Salt Lake appears to beassociated with extremes in hypersalinity, one might expectconcentrations of cemented sedimentary structures and con-stituents to be more common and widespread at low lakelevel stands during periods of highest salinity. Beachrockwould be a valuable indicator of the shoreline at those times.Concentrations of the associations of cemented sedimentarystructures and constituents described above can help in char-acterizing strata deposited during periods of hypersaline con-
ditions. As ancient basins like Great Salt Lake filled and theperiod and frequency of extreme hypersaline conditionsincreased, cemented horizons in time and space could becomemore common and cementation more thorough and pervasive.Hydrocarbon reservoir rock, traps and seals could all form bydifferent degrees of early cementation.
Throughout geologic history, there have been both largelakes and epicontinental seas that experienced periods ofhypersalinity. The recognition of the types of cements andtextural associations described above will aid in distinguish-ing between these different environments. Misidentifyinglacustrine hypersaline ooids as open-marine ooids can signifi-cantly affect paleoenvironmental interpretations (compare fig-ure 30 with 14; Gerhard and others, 1978).
CONCLUSIONS
Quaternary precipitation of aragonite cements in GreatSalt Lake has not only produced great volumes of sediments,but also a wide array of cement morphologies, fabrics, andsedimentary structures by a range of processes. Calcium car-bonate ions carried by rivers into the confined lake basinfrom surrounding Paleozoic carbonate terrain are concentrat-ed by evaporation to precipitate great volumes of aragoniteduring low lake levels when the salinity is highest.
Five distinct crystal morphologies were recognized insamples collected along the shoreline: (1) subequant, anhedralsubmicrocrystalline grains and microcrystals; 2) bundles ofsubhedral prisms to blades; 3) subequant, rounded stubby-blades; 4) equant, euhedral microcrystalline prisms; and 5)needles. These crystal morphologies, alone or in combina-tion, are present in many different fabrics including meniscus,pendant, rinds (partial and isopachous), peloidal (clotted),radial fibrous, epitaxial overgrowths, and laminated crusts.
Two forms of laminated crusts are present, micro-lami-nated with lamina on the scale of a few microns to a few tensof microns, and macro-laminated crusts with lamina on thescale of a few millimeters. Micro-laminated crusts are mostcommon on intraclasts and beachrock along the shoreline,whereas the macro-laminated crusts occurred as fragmentsassociated with large circular ring structures on sandy mudflats.
Several mechanisms are contributing to the precipitationof cements including aragonite-saturated hypersaline waters,direct organic mediation by cyanobacteria, indirect organicmediation by soluble organic matter, and interstitial gas.Unique gas-eruption structures result in part from this mecha-nism in the form of fossil bubbles (domes), upturned collars,and eruption craters. All of these structures are preserved incemented ooid grainstones in a range of forms and ages.Recent structures were observed bubbling gas from the centerof concentric circles of imbricated plates of ruptured cement-ed sediment, whereas relict structures were defined by circu-lar depressions in ruptured layers of cemented sediment thatwere often filled with debris.
Other structures formed because of the different cementa-tion processes include ooids, granules, intraclasts, flat-pebbleconglomerates, intraformational breccia, and beachrock.Cement fabrics and crystal morphologies associated withGreat Salt Lake beachrock have some similarities and differ-
The Geology of Antelope IslandMiscellaneous Publication 00-1 113

Aragonite cementation and related sedimentary structures in Quaternary lacustrine deposits - Burke, Gerhard
ences with beachrock in both normal-marine and marginal-marine hypersaline settings. Close examination of cementmorphologies should be helpful in discriminating betweenenvironments.
REFERENCES
Bathurst, R.G.C., 1976, Carbonate sediments and their diage-nesis: New York, Elsevier, Developments in Sedimentol-ogy, no. 12, 658 p.
Binkley, K.L., Wilkinson, B.H., and Owen, R.M., 1980,Vadose beachrock cementation along a southeasternMichigan marl lake: Journal of Sedimentary Petrology, v.50, no. 3, p. 953-962.
Black, M., 1933, The algal sediments of Andros Island,Bahamas: Royal Society of London, Philosophical Trans-actions, Series B, v. 222, p. 165-192.
Carozzi, A.V., 1962, Cerebroid oolites: Illinois State Acade-my of Science Transactions, v. 55, p. 239-249.
Clarke, E. de C., and Teichert, Curt, 1946, Algal structures ina western Australian salt lake: American Journal of Sci-ence, v. 244, p. 271-276.
Cloud, P.E., 1960, Gas as a sedimentary and diagenetic agent:American Journal of Science, Bradley Volume, v. 258-A,p. 35-45.
Davies, G.R., 1970, Algal laminated sediments, western Aus-tralia, in Logan, B.W., Davies, G.R., Read, J.F., andCebulski, D.E., editors, Carbonate sediments and envi-ronments, Shark Bay, western Australia: American Asso-ciation of Petroleum Geologists Memoir 13, p. 169-205.
Dean, W.E. and Fouch, T.D., 1983, Lacustrine environment inScholle, P.A., Bebout, D.G., and Moore, C.H., editors,Carbonate depositional environments: American Associa-tion of Petroleum Geologists Memoir 33, p. 98-130.
Deffeyes, K.S., Lucia, F.J., and Weyl, P.K., 1965, Dolomitiza-tion of Recent and Plio-Pleistocene sediments by marineevaporite waters on Bonaire, Netherland Antilles, in Pray,L.C. and Murray, R.C., editors, Dolomitization and lime-stone diagenesis: Society of Economic Paleontologistsand Mineralogists Special Publication 13, p. 71-88.
Eardley, A.J., 1938, Sediments of Great Salt Lake, Utah:American Association of Petroleum Geologists Bulletin,v. 22, no. 1, p. 1305-1411.
Eardley, A.J., 1966, Sediments of Great Salt Lake, in Stokes,W.L., editor, Guidebook to the Geology of Utah, no. 20:Utah Geological Society, p. 105-120.
Emery, K.O., 1960, The sea off southern California - A mod-ern habitat of petroleum: New York, John Wiley & Sons,Inc., 366 p.
Eugester, H.P. and Hardie, L.A., 1978, Saline lakes, in Ler-man, Abraham, editor, Lakes – chemistry, geology, andphysics: New York, Springer-Verlag, p. 273-293.
Freeman, Tom, 1962, Quiet water oolites from LagunaMadre, Texas: Journal of Sedimentary Petrology, v. 32, p.475-483.
Friedman, G.M., Amiel, A.J., Braun, M., and Miller, D.S.,1973, Generation of carbonate particles and laminates in
algal mates – examples from sea marginal hypersalinepool, Gulf of Aqaba, Red Sea: American Association ofPetroleum Geologists Bulletin, v. 57, p. 541-557.
Frishman, S.A. and Behrens, E.W., 1969, Geochemistry ofoolites, Baffin Bay, Texas (abstract): Geological Societyof America, Abstracts with Programs, v. 1, part 7, p. 71.
Gerhard, L.C., Anderson, S.B., and Berg, J., 1978, MissionCanyon porosity development, Glenburn field, NorthDakota, Williston Basin, in 1978 Williston Basin Sympo-sium: Montana Geological Society, p. 177-188.
Ginsburg, R.N., 1953, Beachrock in south Florida: Journal ofSedimentary Petrology, v. 36, no. 1, p. 85-92.
Ginsburg, R.N., 1955, Recent stromatolitic sediments fromsouth Florida: Journal of Paleontology, v. 29, no. 4, p.723-724.
Ginsburg, R.N., Isham, L.B., Bein, S.J., and Kuberg, J., 1954,Laminated algal sediments of south Florida and theirrecognition in the fossil record: Miami University Insti-tute of Marine Science, Marine Laboratories, unpub-lished report no. 54-21, 33p.
Halley, R.B., 1976, Textural variations within Great Salt Lakealgal mounds, in Walter, M.R., editor, Stromatolites:New York, Elsevier, Developments in Sedimentology,[no.] 20, p. 435-445.
Halley, R.B., 1977, Ooid fabric and fracture in the Great SaltLake and the geologic records: Journal of SedimentaryPetrology, v. 47, no. 3, p. 1099-1120.
Hanor, J.S., 1978, Precipitation of beachrock cements - mix-ing of marine and meteoric water versus CO2 degassing:Journal of Sedimentary Petrology, v. 48, p. 489-502.
Hunt, C.B., Robinson, T.W., Bowles, W.A., and Washburn,A.L., 1966, Hydrologic basin, Death Valley, California:U.S. Geological Survey Professional Paper 494-B, p.138.
Illing, L.V., 1954, Bahamian calcareous sands: AmericanAssociation of Petroleum Geologists Bulletin, v. 38, p. 1-95.
Kahle, C.F., 1974, Ooids from Great Salt Lake, Utah, as ananalogue for the genesis and diagenesis of ooids inmarine limestones: Journal of Sedimentary Petrology, v.44, p. 30-39.
Kelts, K., and Hsu, K.J., 1978, Freshwater carbonate sedi-mentation, in Lerman, Abraham, editor, Lakes – chem-istry, geology, physics: New York, Springer Verlag, p.295-323.
Kendall, C.G., St. C., and Skipwirth, Sir P.A. d’ E., 1968,Recent algal mats of a Persian Gulf lagoon: Journal ofSedimentary Petrology, v. 38, p. 1040-1058.
Lomando, A.J., Schreiber, B.C., and Harris, P.M., editors,1994, Lacustrine reservoirs and depositional systems:Society of Economic Paleontologist and MineralogistsCore Workshop no. 19, 381 p.
Longman, M.W., 1980, Carbonate diagenetic textures fromnear-surface diagenetic environments: American Associ-ation of Petroleum Geologists Bulletin, v. 64, p. 461-487.
Loreau, Jr., and Purser, B.H., 1973, Distribution and ultra-
The Geology of Antelope Island Utah Geological Survey114
Aragonite cementation and related sedimentary structures in Quaternary lacustrine deposits - Burke, Gerhard
structure of Holocene ooids in the Persian Gulf, in Purs-er, B.H., editor, The Persian Gulf: New York, SpringerVerlag, p. 279-328.
Macintyre, I.G., 1977, Distribution of submarine cements in amodern Caribbean fringing reef, Galeta Point, Panama:Journal of Sedimentary Petrology, v. 47, p. 503-516.
Macintyre, I.G., 1984, Extensive submarine lithification in acave in the Belize Barrier reef platform: Journal of Sedi-mentary Petrology, v. 54, no. 1, p. 221-235.
Macintyre, I.G., 1985, Submarine cements – The peloidalquestion, in Schneidermann, Nahum, and Harris, P.M.,editors, Carbonate cements: Society of Economic Pale-ontologists and Mineralogists Special Publication no. 36,p. 109-116.
Moore, C.H., 1973, Intertidal carbonate cementation, GrandCanyon, West Indies: Journal of Sedimentary Petrology,v. 43, p. 591-602.
Muller, G., Irion, G., and Forstner, U., 1972, Formation anddiagenesis of inorganic Ca-Mg carbonates in the lacus-trine environment: Naturwissenschaften, v. 59, p. 158-164.
Multer, H.G. and Hoffmeister, J.E., 1971, Holocene cementa-tion on skeletal grains into beachrock, Dry Tortugas,Florida, in Bricker, O.P., editor, Carbonate cements:Johns Hopkins University Studies in Geology, no. 19, p.25-26.
Neuweiler, F., 1997, Introduction - Part II - International Geo-logic Conference Proceedings No. 380, in Neuweiler, F.,Reitner, J., and Monty, C., editors, Biosedimentology ofMicrobial Buildups, International Geologic ConferenceProceedings Project No. 380, Proceedings of 2nd Meet-ing, 1996: Facies, v. 36, p. 195.
Pedone, V.A., and Folk, R. L., 1996, Formation of aragonitecement by nannobacteria in the Great Salt Lake, Utah:Geology, v. 24, no. 8, p. 763-765.
Picard, M.D. and High, L.R., 1972, Criteria for recognizinglacustrine rock, in Rigby, J.K. and Hamblin, W.K., edi-tors, Recognition of ancient sedimentary environments:Society of Economic Paleontologists and MineralogistsSpecial Publication 16, p. 108-145.
Reitner, J., Arp, G., Thiel, V., Gautret, P., Galling, U., andMichaelis, W., 1997, Organic matter in Great Salt Lakeooids (Utah, USA) - First approach to a formation viaorganic matrices, in, Neuweiler, F., Reitner, J., andMonty,C., editors, Biosedimentology of MicrobialBuildups - International Geologic Conference Proceed-ings Project No.380 - Proceedings of 2nd Meeting, 1996:Facies, v. 36, p. 210-219.
Sandberg, P.A., 1975, New interpretations of Great Salt Lakeooids and of ancient non-skeletal carbonate mineralogy:Sedimentology, v. 22, p. 497-537.
Seelos, A.G., Oldroyd, J.D., and Alton, D.R., 1975, Depres-sion structures in unconsolidated sediments of Great SaltLake, Utah: Utah Geological amd Mineralogical Survey,Utah Geology, v. 2, no. 2, p. 91-102.
Shinn, E.A., 1969, Submarine lithification of Holocene car-
bonate sediments in the Persian Gulf: Sedimentology, v.12, p. 109-114.
Shinn, E.A., Ginsburg, R.N., and Lloyd, R.M., 1965, Recentsupratidal dolomite from Andros Island, Bahamas, inPray, L.C. and Murray, R.C., editors, Dolomitization andlimestone diagenesis: Society of Economic Paleontolo-gists and Mineralogists Special Publication no. 13, p.112-123.
Spencer, R. J., Eugster, H. P., and Jones, B. F., 1985, Geo-chemistry of Great Salt Lake, Utah II - Pleistocene-Holocene evolution: Geochimica et Cosmochimica Acta,v. 49, p. 739-747.
Stifel, P.B., 1964, Geology of the Terrace and Hogup Moun-tains, Box Elder County, Utah: Salt Lake City, Universityof Utah Ph.D. dissertation, 174 p.
Stifel, P.B., and Stokes, W.L., 1961, Some unusual sedimenta-ry structures along the shores of Great Salt Lake(abstract): Proceedings, Utah Academy of Sciences, Arts,and Letters, v. 38, p. 131.
Taft, W.H., 1968, Yellow Bank, Bahamas: A study of modernmarine carbonate lithification (abstract): American Asso-ciation of Petroleum Geologists Bulletin, v. 52, p. 551.
Taylor, J.C.M. and Illing, L.V., 1969, Holocene intertidal cal-cium carbonate cementation, Qatar, Persian Gulf: Sedi-mentology, v. 12, p. 69-107.
The Geology of Antelope IslandMiscellaneous Publication 00-1 115

The Geology of Antelope Island Utah Geological Survey116

ABSTRACT
Antelope Island and its northern and southern causewaysto the mainland separate two distinctive and dynamic bodiesof water, both part of the Great Salt Lake system. The southcauseway from the island to the mainland was constructed inabout 1952. The Davis County causeway was constructed in1969 and rebuilt in 1992 after the 1980s flooding.
The salinity of the south arm fluctuates inversely withlake elevation. At lake elevations below the top elevations ofthe two causeways, Farmington Bay is isolated and its salini-ty is less than half that of the south arm. At lake elevationsabove the tops of the two causeways, Farmington Baybecomes one with the south arm and their salinity is aboutequal. Density stratification was observed in the south arm in1966 and existed there until mid-1991 when it disappeareddue to diminished heavy, deep return flow brine from thenorth arm through the Southern Pacific Railroad causeway.The ion ratios of the major ions and cations (sodium, potassi-um, magnesium, calcium, chloride and sulfate) are about thesame in both bodies of water. Farmington Bay acts as a bio-logical treatment lagoon for the plant nutrients nitrogen andphosphorus in the Jordan River. The biota in the two bodiesof water are significantly different because of their differentsalinities. Raw sewage was emptied into Farmington Bayfrom Salt Lake City for many years prior to the constructionof treatment plants during the 1950s to 1960s.
Six mineral-extraction industries presently operate onGreat Salt Lake, three each on the south and north arms.Products generated include sodium chloride, magnesiumchloride, potassium sulfate, magnesium metal, chlorine gas,and dietary supplements.
From the 1930s to the present, there have been numerousproposals to convert Farmington Bay or the entire eastembayment into freshwater bodies through diking betweenthe islands and the mainland. During the 1980s floodingperiod, diking proposals were aimed at protecting individualentities, such as sewage-treatment plants, or large areas ofshoreline from flooding. To date, none of the major proposalshas come to fruition, due mainly to high project costs, andenvironmental and health-issue concerns.
INTRODUCTION
Antelope Island is the largest of the four major islands inthe south arm of Great Salt Lake, covering about 23,850 acres
(figure 1). It is 15.5 miles in length, trending in a north-southdirection, with a maximum width of 4.5 miles. The island’shighest peak reaches an elevation of 6,596 feet above meansea level, or about 2,396 feet above a 4,200-foot nominal lakelevel (USGS, 1974). To the east of Antelope Island liesFarmington Bay, a shallow body of water having a maximumdepth of seven to eight feet at a lake elevation of 4,200 feet.Earth-fill causeways extend from the north and south ends ofthe island to the mainland; these causeways isolate Farming-ton Bay from the south arm of Great Salt Lake (GSL). Thesurface area enclosed by these two dikes, the eastern shore ofAntelope Island, and the mainland covers about 76,700 acres.The northern and western shores of Antelope Island borderthe main south-body arm of GSL, which covers about550,505 acres, and has a maximum depth of about 32 feet atthe 4,200-foot lake elevation (Waddell and Fields, 1977).Numerous Davis County communities lie along the narrow,densely populated strip of land between the east shore ofFarmington Bay and the Wasatch Range to the east.
The main body of the south arm, including Farmingtonand Bear River Bays, receives nearly all of the freshwaterinflow to the lake (figure 1). The Bear and Weber Riverscontribute about 79 percent of the total inflow (Arnow andStephens, 1990) and enter the Ogden Bay portion of the lake,located to the northeast of Antelope Island, and north ofFarmington Bay. The Jordan River contributes about 13 per-cent of the total inflow and empties into the southern end ofFarmington Bay. Numerous streams from the Wasatch Rangeenter the bay along its eastern shore (figure 1) and contributean additional five percent of the freshwater inflow. Mont-gomery (1984) summarizes the average annual surfaceinflows to the lake from 1931 to 1976 and for the wet year of1983.
The purposes of this paper are to: (1) present the basicchemistry and yearly changes in salinity of the main body ofthe south arm of the lake, (2) provide a brief history of thetwo causeways that isolate Farmington Bay and their influ-ence on the enclosed water, (3) recount the history of Farm-ington Bay as a receptacle for both untreated and treatedsewage, (4) summarize the basic chemistry and changes insalinity of Farmington Bay, (5) discuss the south-arm extrac-tive mineral industries, and (6) review the proposals to con-vert Farmington Bay into a body of freshwater. Discussion ofthe north arm of Great Salt Lake is minimal.
THE WATERS SURROUNDING ANTELOPE ISLANDGREAT SALT LAKE, UTAH
byJ. Wallace Gwynn
Utah Geological Survey

The waters surrounding Antelope Island, Great Salt Lake, Utah - Gwynn
SALINITY, STRATIFICATION, AND CHEMISTRY OF THE SOUTH ARM
South-Arm Salinity
Lake Elevation Versus SalinityVariation of the salinity of the south arm has an inverse
relationship with the fluctuation of lake-surface elevation;salinity is lower when the lake elevation is higher. Figure 2shows how both lake elevation and total dissolve solids(expressed in grams-per-liter g/L) vary annually between1966 and 1997. During the early 1960s, when the lake was atits historic low (4,191.35 ft), the south-arm waters were near-ly eight times saltier than typical ocean waters. During 1987,when the lake was at its historic high (4,211.85 ft), the south-arm waters were only 1.4 times saltier than ocean waters. Ata nominal south-arm elevation of 4,200 feet, south-armwaters contain about 130 grams-per-liter (11 to 12 percentsalt) and are about 3.3 times as salty as the ocean.
Stratified BrinesIn 1966, Utah Geological Survey (UGS) personnel
observed, through vertical-density profiling of the water col-umn, the existence of a stratified brine condition in the southarm. A dense, dirty, fetid brine was observed at the bottom ofthe lake, initially below an elevation of about 4,175 feet, butbelow an elevation of about 4,180 feet after about 1972.Above this dense brine lay a clean, lighter brine. Figure 3shows the area underlain by the dense brine at the 4,180-foottop elevation. This deep, dense brine originated from thereturn flow of heavy north-arm brine that migrated from northto south through the lower portion of the Southern PacificRailroad (SPRR) causeway which separates the south andnorth arms of the lake. South-arm stratification continuedthrough the 1980s flooding period until mid-1991 when it dis-appeared. The disappearance was caused in large measure bythe greatly reduced volume of heavy north-arm brine migrat-ing through the SPRR causeway into the depths of the southarm. This was due to a reduction in the causeway’s hydraulicconductivity, caused by the addition and compaction of fill
The Geology of Antelope Island Utah Geological Survey118
Jordan River
Mill CreekSalt Lake City
Sewage C
anal
Dolphin Island
GunnisonIsland
CarringtonIsland
AntelopeIsland
FremontIsland
GREAT SALT LAKE
N o r t hA r m
S o u t hA r m
Southern PacificRailroad Causeway
StansburyIsland
Kaysville
Farmington
Centerville
Bountiful
Woods Cross
North Salt Lake
Clearfield
Syracuse
FA
RM
IN
GT
ON
BA
Y
0 1 5 Miles
0 1 8 Kilometers
2 3 4
2 3 4 5 6 7
Base from Great Salt Lake and Vicinity Map, USGS, 1974Great Salt Lake elevation 4,200 feet
N
O G D E N B A Y
MAPAREA
DAV
IS
COUNTY CAUSEWAY
SOUTH
CAUSEWAY To Interstate 80
SO
UT
HA
RM
OF
GR
EA
TS
AL
TL
AK
E
Sea GullPoint
EggIsland
Howard Slough WaterfowlManagement Area
Farmington Bay WaterfowlManagement Area
Antelope IslandState Parkentrance
BRIDGE
CULVERT
112°00'112°00'
112°00'
Antelope
Island
Wasatch
Range
LOCATION MAP
Farm
ingt
onCre
ek
Ricks Cr.
Bea
r C
r.
Holmes
Cr.
Kays Creek
Figure 1. General location map of Antelope Island, Farmington Bay, the south arm of Great Salt Lake, South and Davis County causeways, andwaterfowl management areas.

The waters surrounding Antelope Island, Great Salt Lake, Utah - Gwynn
material used to raise the tracks six to eight feet during theflooding period (1983 to 1987). Without a sufficient flow ofnorth-arm brine southward, the volume of dense south-armbrine could not be maintained, and stratification disappearedthrough vertical mixing.
South-Arm Chemistry
While the salinity of the south arm changes with lake-surface elevation, its chemical composition (ion ratios)remains relatively constant. Table 1 shows the compositionof the dissolved salts in Great Salt Lake. The composition ofthe dissolved salts in typical ocean water, and water from theDead Sea are given for comparison.
Two earth-fill causeways provide access to AntelopeIsland but also isolate Farmington Bay from the main southarm of Great Salt Lake, especially when the lake’s elevationis below the top (4,206 ft) elevations of the two dikes (figure4). Because of this isolation, the bay’s physical, chemical,and biological properties have become different from those ofthe south arm.
South Causeway
Between 1951 and 1952, the south causeway (figure 5)was built over an existing trail on the mud flats from thesouth end of Antelope Island eastward to the mainland (Har-ward, 1996). The work was done as a cooperative projectbetween Davis County and the Island Improvement (Ranch-ing) Company to prevent raw sewage, then being dischargedinto Farmington Bay, from polluting the southernmost beach-
es of the south arm (R. Harward, island resident, verbal com-munication, September 1997). The causeway also providedsouthern access to the island. Starting in 1978, a conveyor-belt route was constructed by the S.J. Groves ConstructionCompany to move fill material from the island to the main-land for freeway construction. The conveyor belt was builtatop the existing causeway southeastward from the island fora distance of about 3 miles. The present top elevation of thecauseway is estimated to range from 4,205 (Clinton Baty,Great Salt Lake State Park harbor master, verbal communica-tion, October 1997) to 4,206 feet (Tim Smith, Antelope IslandState Park manager, verbal communication, August 1997).An elevation marker (USGS, 1972) on the causeway showsan elevation of 4,205 feet. Thus, when the lake-surface ele-vation is below about 4,205 to 4,206 feet, Farmington Bay isseparated from the main body of the south arm at the south-ern end; when the lake elevation is above this elevation, thereis some mixing of south arm and Farmington Bay waters.
The Geology of Antelope IslandMiscellaneous Publication 00-1 119
GREATSALT TYPICAL DEAD
ION LAKE OCEAN SEA
Sodium 32.1 30.8 12.3
Potassium 2.3 1.1 2.3
Magnesium 3.7 3.7 12.8
Calcium 0.3 1.2 5.2
Chloride 54.0 55.5 67.1
Sulfate 7.6 7.7 0.1
Totals 100.0 100.0 99.8
Figure 2. (Top) Annual variation of the surface elevation of southarm of Great Salt Lake, Utah (1966-1997). (Bottom) Annual varia-tion of the total-dissolved-solids of south arm of Great Salt Lake,Utah (1966-1997).
Table 1. Chemical composition of dissolved salts from Great SaltLake, typical ocean, and Dead Sea waters on a dry-weight-percentbasis (Gwynn, 1997).
CarringtonIsland
GR
EA
TS
AL
TL
AK
E
AntelopeIsland
FremontIsland
So
ut h
Ar m
FarmingtonBay
SPRR Causeway
NORTHWESTEXTENSION OF
DEEP BRINEPOOL
AREA OF DEEP, DENSE BRINE POOL
PromontoryPoint
StansburyIsland
SamplingSite RT4
SamplingSite FB2
SamplingSite RT2
SamplingSite AS2
Davis CountyCauseway
N
0 5 10 15 Miles
0 5 10 15 Kilometers
Figure 3. South arm of Great Salt Lake showing the main andnorthwestern areas of the pre-1992 deep, dense brine pool.
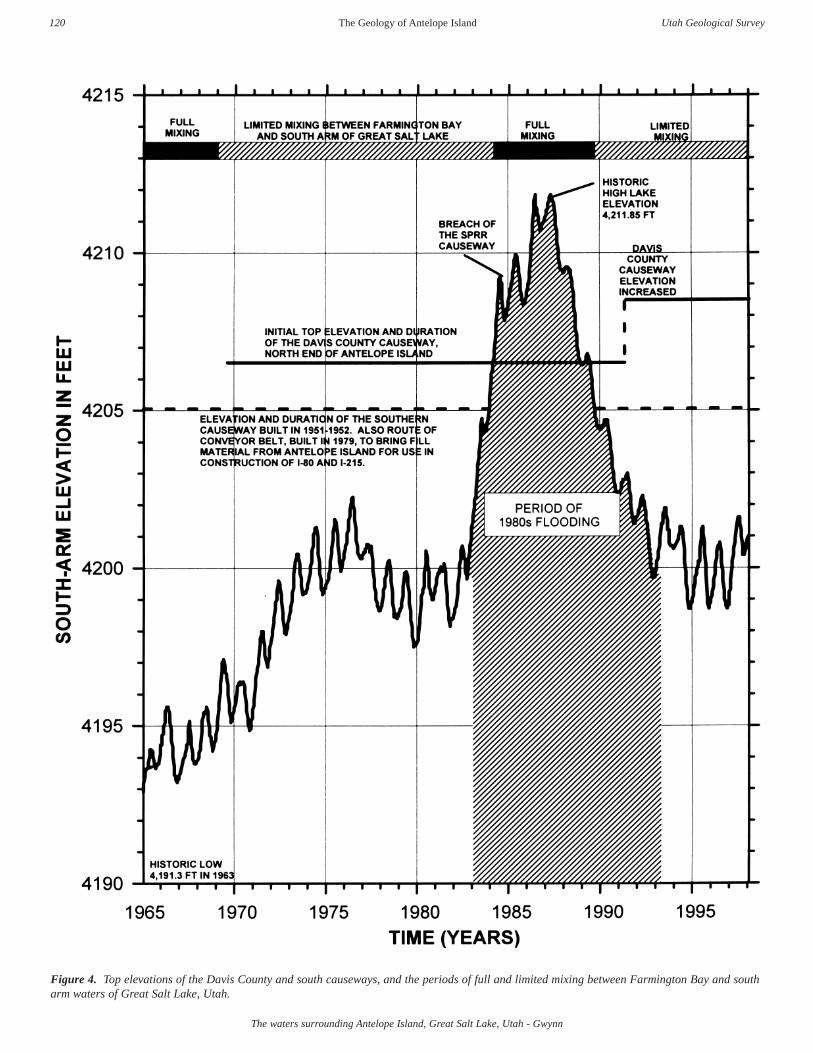
The waters surrounding Antelope Island, Great Salt Lake, Utah - Gwynn
The Geology of Antelope Island Utah Geological Survey120
Figure 4. Top elevations of the Davis County and south causeways, and the periods of full and limited mixing between Farmington Bay and southarm waters of Great Salt Lake, Utah.

The waters surrounding Antelope Island, Great Salt Lake, Utah - Gwynn
Davis County Causeway
Prior to 1969, there was no northern causeway separatingFarmington Bay and the main body of the south arm, thusallowing the free movement and mixing of water between thetwo areas. During 1969, an earth-fill causeway was con-structed by Davis County and the Utah Department of Trans-portation from the east shore of the lake, near Syracuse, west-ward to the northern end of Antelope Island (figure 6). Thecauseway separated Farmington Bay from the south armproper and restricted mixing between the two areas except forflow through one narrow bridged opening, consisting of 10precast box-culvert-type sections bolted together. The origi-nal top elevation of the northern causeway was about 4,206.5feet (Smith, 1997).
In early 1984, the Davis County causeway was floodedwhen the lake surface rose from about 4,200 feet in elevation(1983) to its historic high of 4,211.85 feet (1986-1987); itremained submerged until mid-1989 when the lake recededbelow 4,206.5 feet. During that time, it is assumed that thewaters of the south arm and Farmington Bay were free tomix; and that mixing was probably the greatest when the lakelevel was at its higher elevations. After 1989, when the lakelevel had receded, mixing again became restricted. In 1992,the causeway was rebuilt, through the combined efforts of theUtah Department of Transportation and Davis County, to anelevation of 4,208.5 feet along the eastern portion of thecauseway (Saunders, 1994, and Saunders and Smith, 1994).During the same year, a new bridge was built near AntelopeIsland at the west end of the causeway. The bridge has a con-crete deck supported by five 100-foot-long steel girders witha deck elevation of 4,213.5 feet. The road from the bridgewest to the island has a top elevation of about 4209.85 feet.For additional control of the waters between Farmington Bayand the main body of the south arm, a box culvert was con-structed about one mile from the east end of the causeway.This structure consists of two 10- by 15-foot box culvert sec-tions laid side by side.
FLOW OF RAW AND TREATED SEWAGEINTO FARMINGTON BAY
From the time that the first sewers were installed in SaltLake City (time uncertain) until the construction of sewagetreatment plants in the 1950s and 1960s (figure 7), Farming-ton Bay was the recipient of Salt Lake City’s raw sewage.Today, with rare exception, only treated effluent from sewagetreatment plants servicing Salt Lake County and Davis Coun-ty currently enters the bay. Under emergency conditions,individual sewage treatment plants are authorized by the UtahDivision of Water Quality (UDWQ) to temporarily dischargeraw sewage to the Jordan River or into Farmington Bay (ArneHultquist, UDWQ, verbal communication, 1997).
Numerous investigators have studied the water qualityand pollution of Farmington Bay caused by the introductionof both untreated and treated sewage. These include studiesby: the Utah Department of Health and Davis County HealthDepartment (1965), Bott and Shipman (1971), Carter andHoagland (1971), Colburn and Eckhoff (1972), Searle (1976),Ford Chemical Laboratory (1977), Maxell and Thatcher(1980), Sturm (1983), Israelsen and others (1985), Chadwickand others (1986), and Sorensen and Riley (1988). Studiesby these investigators include: types and distribution of pollu-tants in both water and sediments; types, distribution and sur-vival of bacteria; water chemistry and water quality includingthe presence and distribution of heavy metals, nutrients andorganics; odor-causing mechanisms; health and safety issues;and pollution-control measures.
SALINITY, STRATIFICATION, AND WATERCHEMISTRY OF FARMINGTON BAY
Farmington Bay Salinity
Salinity Changes Related to Lake ElevationThe overall salinity of Farmington Bay is affected by
lake level, much like the south arm of the lake; as the lake
The Geology of Antelope IslandMiscellaneous Publication 00-1 121
Figure 5. Aerial photograph of Davis County causeway betweenthe north end of Antelope Island eastward to the mainland.
Figure 6. Aerial photograph showing the Davis County causewaythat extends between the north end of Antelope Island and themainland.
AN
TE
LO
PE
ISLA
ND
ANTELOPE ISLAND
SYRACUSE
ANTELOPE
ISLAND
STATE PARK
DAVIS
COUNTY
CAUSEWAY
SOU
THC
AU
SEW
AY
FARMINGTONBAY
FARMINGTON BAY
BROWNS
ISLAND
BROWNS
ISLAND
GOOGIN DRAINGOOGIN DRAIN
SOUTH ARM OFGREAT SALT LAKE, UTAH
SOUTH ARM OFGREAT SALT LAKE, UTAH
SOURCE: NASA AMES RESEARCHPHOTOGRAPHY AB5 75 2131 515006/11/75, SCALE = 1:121,000
SOURCE: NASA AMES RESEARCHPHOTOGRAPHY AB5 75 2131 514906/11/75, SCALE = 1:121,000
N
N
0 1 2 3 miles0 1 2 3 miles
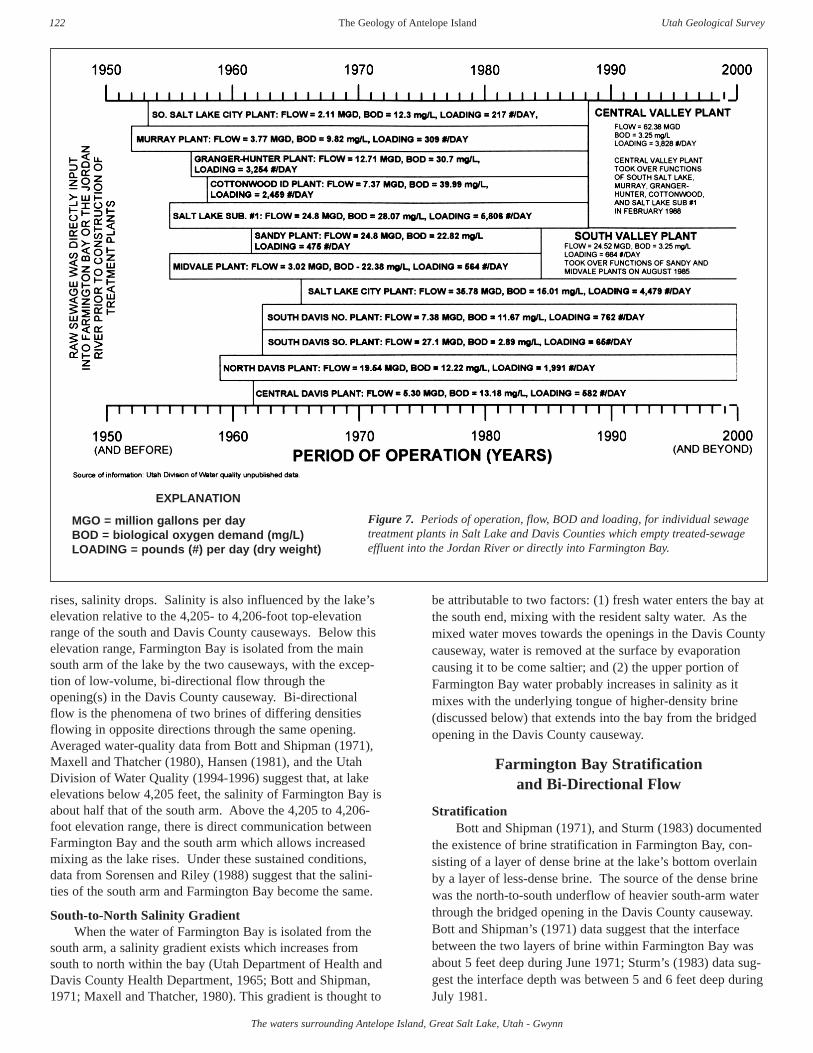
The waters surrounding Antelope Island, Great Salt Lake, Utah - Gwynn
rises, salinity drops. Salinity is also influenced by the lake’selevation relative to the 4,205- to 4,206-foot top-elevationrange of the south and Davis County causeways. Below thiselevation range, Farmington Bay is isolated from the mainsouth arm of the lake by the two causeways, with the excep-tion of low-volume, bi-directional flow through theopening(s) in the Davis County causeway. Bi-directionalflow is the phenomena of two brines of differing densitiesflowing in opposite directions through the same opening.Averaged water-quality data from Bott and Shipman (1971),Maxell and Thatcher (1980), Hansen (1981), and the UtahDivision of Water Quality (1994-1996) suggest that, at lakeelevations below 4,205 feet, the salinity of Farmington Bay isabout half that of the south arm. Above the 4,205 to 4,206-foot elevation range, there is direct communication betweenFarmington Bay and the south arm which allows increasedmixing as the lake rises. Under these sustained conditions,data from Sorensen and Riley (1988) suggest that the salini-ties of the south arm and Farmington Bay become the same.
South-to-North Salinity GradientWhen the water of Farmington Bay is isolated from the
south arm, a salinity gradient exists which increases fromsouth to north within the bay (Utah Department of Health andDavis County Health Department, 1965; Bott and Shipman,1971; Maxell and Thatcher, 1980). This gradient is thought to
be attributable to two factors: (1) fresh water enters the bay atthe south end, mixing with the resident salty water. As themixed water moves towards the openings in the Davis Countycauseway, water is removed at the surface by evaporationcausing it to be come saltier; and (2) the upper portion ofFarmington Bay water probably increases in salinity as itmixes with the underlying tongue of higher-density brine(discussed below) that extends into the bay from the bridgedopening in the Davis County causeway.
Farmington Bay Stratification and Bi-Directional Flow
StratificationBott and Shipman (1971), and Sturm (1983) documented
the existence of brine stratification in Farmington Bay, con-sisting of a layer of dense brine at the lake’s bottom overlainby a layer of less-dense brine. The source of the dense brinewas the north-to-south underflow of heavier south-arm waterthrough the bridged opening in the Davis County causeway.Bott and Shipman’s (1971) data suggest that the interfacebetween the two layers of brine within Farmington Bay wasabout 5 feet deep during June 1971; Sturm’s (1983) data sug-gest the interface depth was between 5 and 6 feet deep duringJuly 1981.
The Geology of Antelope Island Utah Geological Survey122
Figure 7. Periods of operation, flow, BOD and loading, for individual sewagetreatment plants in Salt Lake and Davis Counties which empty treated-sewageeffluent into the Jordan River or directly into Farmington Bay.
EXPLANATION
MGO = million gallons per dayBOD = biological oxygen demand (mg/L)LOADING = pounds (#) per day (dry weight)

The waters surrounding Antelope Island, Great Salt Lake, Utah - Gwynn
Bi-Directional FlowBi-directional flow exists at the Davis County causeway,
and is discussed by Carter and Hoagland (1971), Colburn andEckhoff (1972), Hansen (1981), and Sturm (1983). The north-to-south flow of denser south-arm brine through the DavisCounty causeway bridge is driven by hydrostatic pressure,while the south-to-north flows of overlying lighter waterthrough this opening are driven by the existing hydrostatichead. Sturm (1983) shows that the depth to the bi-direction-al-flow interface within the bridged opening, during 1982measurements, fluctuated between 4.75 feet and 6.25 feetunder calm conditions. Under south-wind conditions, thedepth to the interface became much deeper (8 to 10 feet), andthe upper, south-to-north flows greatly increased. Undernorth-wind conditions, the depth to the interface diminished,sometimes to nothing, and the deep, north-to-south flowsincreased.
Farmington Bay Chemistry and Nutrients(Nutrient section contributed by Doyle Stephens, USGS, 1997)
A comparison of a limited number of chemical analysesfrom Farmington Bay, mainly from the north end near theDavis County bridge, to analyses from the main south arm ofthe lake (figure 8), shows that there is no significant differ-ence between the major-ion ratios within the two bodies ofwater. This is because the main source of salt for FarmingtonBay comes from the south arm as return flow through thebridged opening.
Farmington Bay acts as a biological treatment lagoon forthe plant nutrients nitrogen and phosphorus in the JordanRiver. Typically, the Jordan River caries 3-4 mg/L of dis-solved nitrogen (as nitrate and ammonium) and 1-2 mg/L ofdissolved phosphorus into Farmington Bay. Most of thesedissolved nutrients are removed from the water by algae,aquatic macrophytes, and bacteria within Farmington Bay.Between January and August 1997, sampling in FarmingtonBay by the USGS at a site 5 miles south of the Davis Countycauseway found dissolved nitrate nitrogen always less thanthe reporting level (detection limit) of 0.05 mg/L, dissolvedammonia less than 0.02 mg/L, and total dissolved phosphorusless than 0.3 mg/L. Throughout the summer of 1997, therewere massive blooms of green algae and cyanobacteria (blue-green “algae”). Salinity, at 1-meter depth, ranged from 3.8percent in January to 6 percent in August.
South Arm and Farmington Bay Biota(Section contributed by Don Paul,
Utah Division of Wildlife Resources, 1997)
Great Salt Lake (GSL) biology varies between locationsthat have different salinities. Antelope Island and its cause-ways divide two locations of differing salinities, namely,Farmington Bay and the south arm of the lake (figure 1). Thebalance between inflow to, and evaporation from, the lakecoupled with the terminal (no outlet) nature of the GSL causefrequent shifts in lake elevation and salinity and, consequent-ly, the biology of various isolated lake locations.
Living organisms have difficulty coping with the osmoticstress of high concentrations of salt ions; only a few are suc-cessful. However, even with high salt concentrations, differ-
ent ecological systems can exist side by side where thesesalinities are locally variable. An excellent example of suchlocal variation is the south arm of GSL and Farmington Baywhich are separated by the Davis County causeway, asdescribed in the following examples. During May 1996, GSLelevation was 4,200.7 feet and the salinity of the south armwas 12.2 percent, whereas the salinity of Farmington Bay was5.6 percent (Doyle Stephens, USGS, personal communica-tion, November, 1997).
The south arm fosters a relatively simple system of some20 species of algae and 10 species of protozoa when thesalinities are at 115 g/L (Rushforth and Felix, 1982). Fourmacro invertebrates coexist with these microscopic species.These macro invertebrates include two species of brine flieswhich typically inhabit the area along the shoreline, smallnumbers of a corixid, and a species of brine shrimp that occu-pies the entire reach of the south arm. The constant shiftingof the GSL elevation and shoreline fosters macro inverte-brates that are reproductively flexible and seasonally abun-dant, that is, brine flies and brine shrimp. At salinities above115 g/L the south arm ecosystem is relatively predator freeand the brine shrimp and fly populations go unchecked,increasing within the limits of the algae production, whichseems to be nitrogen limited. The brine shrimp species inGSL, Artemia fransiscana, is an effective filter-feeder capableof reducing the algae in the south arm water column by mid-summer to an extent that the shrimp become food-stressed.
In contrast to 1997 salinity conditions, the high-lake-level conditions during the 1980s significantly reduced thesalinity to 50 g/L in the south arm. At that time, the south-arm biology was similar to that of the current (1997) Farm-ington Bay condition. These diluted conditions effectivelyreduced brine shrimp production and densities enough thatboth the avian species and the brine shrimp harvest industry,reliant on the Artemia resource, were nonplused in their activ-ities in the south arm. Insect predation (corixids), on whatfew brine shrimp were produced, was significant in nearshoreareas, especially around underwater structures. The ecologybecame more complex with dilution, shifting away from abrine shrimp- and brine fly-dominated system to a more com-petitive ecosystem in the south arm. North of the SouthernPacific Railroad causeway, conditions improved for somebrine shrimp production as salinities fell below 20% and con-sequently there was a limited brine shrimp harvest and someEared Grebe and Wilson’s phalarope use of the macro inver-tebrates in that region of the lake during high lake years.Bird-use estimates were considerably lower during theseyears for species keying on summer and fall populations ofbrine shrimp and flies at Great Salt Lake.
Farmington Bay, with its lower salinities, supports a larg-er number of species and a more complex interaction betweentrophic (nutrient) levels with many more checks and balances.The predacious corixid Trichocoixa verticalis is a flightedinsect that is known to prey on brine shrimp, especially thesmaller nauplii and sub-adults. This predator flourishes inlower salinities of 50 g/L. At these salinities, T. verticalismean densities were 52 individuals/m3 (Wurtsbaugh, 1992).In Farmington Bay during April 1997, T. verticalis individu-als numbered 100/m3 (Doyle Stephens, USGS, verbal l com-munication, 1997). Subsequently, the population of Artemia
The Geology of Antelope IslandMiscellaneous Publication 00-1 123

The waters surrounding Antelope Island, Great Salt Lake, Utah - Gwynn
The Geology of Antelope Island Utah Geological Survey124
Figure 8. Trilinear plot showing chemical compositions of waters from Farmington Bay and the south arm of Great Salt Lake.
EXPLANATION
DIAMONDS (Sample analyses from Utah Department of Health, unpublishedAverage of 8 samples from Farmington Bay, 100 feet south of the Antelope-Syracuse
causeway, 1977-1978.Average of 59 samples from Farmington Bay, at the Antelope-Syracuse causeway
bridge (south side), 1980-1982.Average of 6 samples from Farmington Bay, in the main deep channel, 1977-1978.Average of 8 samples from Farmington Bay, NE of Seagull Point, 1977-1978
CROSSES (Samples analyses from UGS-GSL database, unpublished)Average of 2 samples from Farmington Bay, south of Antelope-Syracuse bridge,
0.5 foot depth, 1976-1977.Average of 2 samples from Farmington Bay, south of Antelope-Syracuse bridge,
15 foot depth, 1976-1977.Average of 2 samples from Farmington Bay, south of Antelope-Syracuse bridge,
25 foot depth, 1976-1977.
CIRCLES (Sample analyses from UGS-GSL database, unpublished)Average of 48 samples from South Arm, sites AS2/FB2, 0.5 foot depth, 1977-1983.Average of 48 samples from South Arm, sites AS2/FB2, 15 foot depth, 1977-1983.Average of 48 samples from South Arm, sites AS2/FB2, 25 foot depth, 1977-1983.

The waters surrounding Antelope Island, Great Salt Lake, Utah - Gwynn
in Farmington Bay was suppressed by predation. In addition,predation by other macro invertebrates and zooplankton in theFarmington Bay complex ties up much of the available inver-tebrate food resources in the water column.
When the south arm is at 115 g/L salinity and the systemis brine-fly and brine-shrimp dominated, these invertebratesare released to the next trophic level and predatory oppor-tunists, the birds. Significant numbers of some species andsuites of species of birds depend upon these macro-halofiles(invertebrates). The Great Salt Lake was designated a Hemi-spheric Shorebird Reserve by the Western HemisphericShorebird Reserve Network in 1990 because it supports mil-lions of shorebirds. These shorebird numbers are supportedby significant wetland resources located on the east side ofthe lake, including Farmington Bay Wildlife Managementarea (figure 1), and by the copious halophiles of the GreatSalt Lake. Besides the recognition for shorebird populations,the Great Salt Lake ecosystem supports notably high numbersof other species as compared to continental, hemispheric, andworld populations. The waters surrounding Antelope Islandare often the producers of the food that fuels these birds.
MINERAL EXTRACTION INDUSTRIES
Common salt was extracted from Great Salt Lake bytrappers and explorers as early as 1825, and became the prin-cipal source of salt for the early Mormon settlers beginning in1847. Since that time, there have been numerous salt indus-tries on the lake (Clark and Helgren, 1980), mainly along thelake’s southern shore. Small operations were also located inSpring Bay on the extreme north end of the lake, at Promon-tory Point, and on the mud flats west of Syracuse (within thepresent bounds of Farmington Bay). Today, six active miner-al-extraction industries operate on the lake which contributesignificantly to the local economies. These companies, thesource of their brine (arm of the lake), and the products theyproduce, are shown in table 2.
Table 2. Active mineral-extraction industries on Great Salt Lake,Utah (after Gwynn, 1997).
CHRONOLOGY OF DIKING STUDIES ANDPROPOSALS RELATED TO THE SOUTH
ARM OF GREAT SALT LAKE
Studies, and Early Proposals for FreshwaterEmbayments (1930-1965)
Numerous proposals have been put forth over the yearsto create freshwater bodies out of the entire east embayment(the general area east and north of Antelope and FremontIslands), or out of Farmington Bay, through the constructionof dikes between the islands and the mainland. Richards(1965, 1972) reviews the past studies of the east embaymentas a freshwater reservoir, none of which have been imple-mented. The chronology and a short description of thesestudies up to 1972 are summarized in appendix A and illus-trated in figure 9.
Flooding Years (1983-1987)
Lake-Level Control AlternativesIn water year 1983, Great Salt Lake began its historic
rise from a low elevation of about 4,200 feet to its historichigh of 4,211.85 feet in 1986-1987. As the lake rose, exten-sive flooding occurred around the lake, causing many mil-lions of dollars in damage, mainly around the south arm.During this time, several lake-level control measures wereinvestigated, including upstream development, breaching theSPRR causeway, West Desert pumping, and diking (Allen andothers, 1983; and Utah Division of Water Resources, 1984).Of these alternatives, the SPRR causeway breach was con-structed in 1984, and West Desert pumping was implementedin 1987.
Diking AlternativesDiking alternatives were proposed during the flooding
years (1983-1987) mainly to protect large areas around theperimeter of the lake or to protect individual entities such assewage-treatment plants. A number of these proposalsincluded the construction of dikes between Antelope Islandand the mainland, or between Antelope and Fremont Islandsand the mainland. The major diking alternative proposalspresented during the flooding years include: Creamer and oth-ers (1985), Holland and Spiers (1985), Chadwick and others(1986), Rollins and others (1987), and Sorensen and Riley(1988). The lake began to drop after 1987, and none of theabove-listed diking schemes was implemented.
Some dikes were constructed within or in proximity toFarmington Bay (Anderson, 1985). For example, a dikearound the South Davis North Wastewater Treatment Plantwas built during 1985 and 1986. Two sections of dike wereconstructed through the eastern part of Farmington Bay westof Farmington and Centerville by Utah Power and LightCompany during late 1984 and early 1985. These dikes wereconstructed to protect power-transmission towers from iceloading. Phillips Petroleum also raised the dikes around itswastewater holding ponds west of Bountiful.
The Geology of Antelope IslandMiscellaneous Publication 00-1 125
COMPANY ARM NAME OF PRODUCTS
LAKE
Magnesium South Primary magnesiumCorporation metal, alloys, andof America chlorine gas
(MAGCORP) South Sodium chlorideCargill Salt productsCompany
Morton Salt South Sodium chlorideCompany products
IMC Kalium North Potassium sulfateOgden Corporation (fertilizer), magnesium
chloride products
IMC Salt North Sodium chloride products
North Shore Ltd. North Concentrated brinesPartnership - Mineral that are processed intoResources International dietary supplements

The waters surrounding Antelope Island, Great Salt Lake, Utah - Gwynn
The Geology of Antelope Island Utah Geological Survey126
East-Bay Areas Involved inIndividual Proposals
Fox and Keller (1930)(1) -Areas (A+B+C)Margetts (1932)(1) -Area ACaldwell, Richards and Sorenson (1965)(1) -
Areas (A+B+C)Montgomery (1984)(2)-Areas A, A+B, B+C,
and C consideredAntelope Island Diking (1985)(3) -Area AFarmington Bay Perimeter (1985)(4) -Area AChadwick (1986)(6) -Areas (A+B+C)Inter-Island Diking (1987)(6) -Areas (A+B+C)Lake Wasatch (1989)(7) -Areas (A+B+C)Davis County Pond (1990)(8) -Area ALake Davis (1993)(9) -Area ABonneville Bay (1995)(10) -Area A
Associated References(1)Richards (1965:1972)(2)Montgomery (1984)(3)Creamer and Noble/Rollins Brown and Gunnell (1985)(4)Holland and Spiers (1985)(6)Chadwick and others (1986)(6)Rollins, Brown and Gunnell (1987)(7)Johnson (1989)(8)Palmer and others (1990)(9)Rosebrook (1993)(10)Johnson (unpublished promotional literature)
Bear
Riv
er
AREA
ENLARGED
SPRR Causeway
SouthCauseway
Dike
Davis County Causeway Dike
DavisCountyPond
Area(s)
dike
dike
PromontoryPoint
0 5 10 Miles
0 5 10 15 Kilometers
FremontIsland
AntelopeIsland
South Arm of Great Salt Lake
BearRiverBay
Ogden Bay
Farmington Bay
AreaB
AreaA
AreaC
Willard Res.
Great Salt Lake Minerals(GSLM) evaporation ponds
GSLM
Ogden BayWaterfowl Management Area
Howard SloughWaterfowl Management Area
Bear RiverMigratory BirdRefuge
Farmington BayWaterfowl
Management Area
Web
er
Jordan River
River
N
0 5 10 15 Miles
0 5 10 15 Kilometers
Dolphin Island
GunnisonIsland
CarringtonIsland
Sta
nsbu
ryIs
land
AntelopeIsland
FremontIsland
GR
EA
T
SA
LT
L
AK
E
N o r t hA r m
S o u t hA r m
Southern PacificRailroad Causeway
Figure 9. Areas of east embayment involved in the various proposed diking schemes to create freshwater bodies, and the location of proposeddikes, solar-evaporation-pond areas, and waterfowl-management areas.

The waters surrounding Antelope Island, Great Salt Lake, Utah - Gwynn
Post-Flooding Years (1987-present)
After the flooding years, attention was again returned tothe creation of freshwater impoundments, within FarmingtonBay or the entire east bay, through various diking schemes.The first of these was proposed in 1989 by the Lake WasatchCoalition (Johnson, 1989). The proposed freshwater LakeWasatch would have been formed through diking from thesouth shore of the lake to the south tip of Antelope Island,from the north end of Antelope Island to the south tip of Fre-mont Island, and from the north end of Fremont Island toPromontory Point (figure 9). This proposal failed because ofthe high construction costs and concern about disrupting theGSL ecosystem (Woolf, 1993).
Also in 1989, The Utah Legislature, through the “GreatSalt Lake Development Authority Act” (Smedley and others,1989), formed the Great Salt Lake Development Authority(GSLDA) to investigate the technical, economic, and environ-mental feasibility of an inter-island diking project that wouldcreate the freshwater Lake Wasatch in the eastern half ofGreat Salt Lake. The recommendations of the GSLDA (GreatSalt Lake Development, 1990) were as follows:
(1) Development of “Lake Wasatch” through a Great SaltLake inter-island diking project, as defined in Utah CodeAnn. §17A-2-1603 (9), does not appear to be economi-cally or environmentally feasible.(2) Proposals to create small freshwater lake or waterstorage reservoir in Farmington Bay deserve furtherstudy.(3) Public access to Antelope Island should be restored asquickly as possible.In mid-1990, a preliminary design report was issued by
the Utah Division of Water Resources (Palmer and others,1990) for a diked water impoundment, called the DavisCounty Pond, as part of the Bear River Development Project.The purpose of the work was to study, test, and recommendan area or areas for final pond design. Two recommendedareas were: (1) the eastern end of Farmington Bay from theFarmington Bay Waterfowl Management area on the south toShepards Lane on the north, and (2) a triangular area alongthe northeastern shore of Farmington Bay, bounded on thesouth by a western extension of Shepards Lane and on thewest by a southerly extension of 1,000 West street in Syra-cuse (figure 9).
In January 1993, Davis Lake (figure 9) was proposed bythe Davis County Commission (Rosebrook, 1993). This pro-posed project, a scaled-down version of Lake Wasatch, wouldhave converted Farmington Bay into a freshwater body byusing the existing dikes at both the north and south ends ofAntelope Island.
In early 1995 (pre-February), the Bonneville Bay propos-al emerged, which called for the creation of a freshwaterreservoir similar to Davis Lake (figure 9). The unique featureput forth in this proposal was the use of new technology, the“Wasatch Wall Pile Dike System,” developed by Don D.Johnson in 1985, (promotional literature) in the constructionof both the north and south dikes.
To date, none of the proposals to change either Farming-ton Bay or the entire east embayment into freshwater reser-voirs has come to fruition. In spite of the many advantages
cited by the proponents of these projects, questions related tosediment pollution, health hazards, eutrophication potential,wastewater-treatment plant costs, water salinity, mosquitoproduction potential, and flooding issues (Chadwick and oth-ers, 1986; Sorensen and Riley, 1988; Stauffer and Austin,1995) remain understudied and unanswered.
REFERENCES
Allen, M.E., Christensen, R.K., and Riley, J.P., 1983, Somelake level control alternatives for the Great Salt Lake:Utah Water Research Laboratory, Utah State University,Water Resources Planning Series UWRL/P-83/01, 101 p.
Anderson, D.L., 1985, Executive summaries - Great SaltLake studies: Utah Department of Natural Resources,Division of Water Resources, 47 p.
Arnow, Ted, and Stephens, Doyle, 1990, Hydrologic charac-teristics of the Great Salt Lake, Utah- 1847-1986: U.S.Geological Survey Water-Supply Paper 2332, 32 p.
Bott, Cordell, and Shipman, S.T., 1971, Water chemistry andwater quality of Farmington Bay, in Carter, C.K., projectdirector, Some ecological considerations of FarmingtonBay and adjacent Great Salt Lake State Park: Universityof Utah, p. B1-B27.
Carter, James, and Hoagland, Timothy, 1971, Geological andhydrological characteristics of Farmington Bay, in Carter,C.K., project director, Some ecological considerations ofFarmington Bay and adjacent Great Salt Lake State Park:Salt Lake City, University of Utah, p. A1-A-27.
Chadwick, D.G., Jr., Riley, J.P., Seierstad, A.J., Sorensen,D.L., and Stauffer, N.E., Jr., 1986, Expected effects of in-lake dikes on water levels and quality in the FarmingtonBay and the east shore areas of the Great Salt Lake,Utah: Utah Water Research Laboratory, Utah State Uni-versity, 91 p.
Clark, J.L., and Helgren, Norman, 1980, History and technol-ogy of salt production from Great Salt Lake, in Gwynn,J.W., editor, Great Salt Lake - a scientific, historical andeconomic overview: Utah Geological and Mineral Sur-vey Bulletin 116, p. 203-217.
Colburn, A.A., and Eckhoff, D.W., 1972, Pollution input fromthe lower Jordan Basin to Antelope Island Estuary, inFalkenborg, Donna, editor, The Great Salt Lake andUtah’s water resources: Proceedings of the first annualconference of the Utah Section of the American WaterResources Association, Salt Lake City, Utah, November30, 1972, p. 104-120.
Creamer & Noble Engineers, and Rollins, Brown & Gunnel,Inc., 1985, Final design report for Great Salt Lake-Ante-lope Island diking, executive summary: Unpublishedconsultants report, prepared for the Utah Department ofTransportation, pp. I1-I24.
Ford Chemical Laboratory, 1977, An investigation of bacteriaconcentrations in specific areas of the Great Salt Lake:Ford Chemical Laboratory, Unpublished report preparedfor Utah State Division of Health, Department of SocialServices, 30 p.
Great Salt Lake Development Authority, 1990, Report of the
The Geology of Antelope IslandMiscellaneous Publication 00-1 127

The waters surrounding Antelope Island, Great Salt Lake, Utah - Gwynn
Great Salt Lake Development Authority to GovernorNorman Mangerter, Senator Arnold Christensen, and Representative Craig Moody: Great Salt Lake Develop-ment Authority Board of Directors (December 10), 5 p.
Gwynn, J.W., 1997, Brine properties, mineral extractionindustries, and salt load of Great Salt Lake, Utah: UtahGeological Survey Public Information Series 51, 2 p.
Hansen, D.E., 1981, A hydrologic model to determine waterquality management of the Farmington Bay and Farm-ington Bay bird refuge: Logan, Utah State University,M.S. thesis, 67 p.
Harward, M.R., 1996, Where the buffalo roam - life on Ante-lope Island: M.R. Harward, 382 W. 3300 S., Bountiful,Utah 84010, 87 p.
Holland, F.L., and Spiers, K.L.,1985, Farmington Bay areaperimeter diking alternative - final design report, execu-tive summary: James M. Montgomery Consulting Engi-neers, Inc. published report prepared for the Utah Divi-sion of Water Resources, Utah Department of NaturalResources, 15 p.
Israelsen, C.E., Sorensen, D.L., Seierstad, A.J., and Brennard,Charlotte, 1985, Preliminary identification, analysis, andclassification of odor-causing mechanisms influence bydecreasing salinity of the Great Salt Lake: Utah WaterResearch Laboratory, Utah State University, prepared forthe Utah Department of Natural Resources, Utah Divi-sion of Water Resources, 63 p.
Johnson, D.D., 1989, Lake Wasatch - the great freshwaterlake: 1071 E. 250 N., Bountiful, Utah , 97 p. (unpub-lished collection of promotional information packets onLake Wasatch).
Maxell, M.H., and Thatcher, L.M., 1980, Coliform bacteriaconcentrations in Great Salt Lake waters, in Gwynn,J.W., editor, Great Salt Lake - a scientific, historical andeconomic overview: Utah Geological and Mineral Sur-vey Bulletin 116, p. 323-335.
Montgomery, J.M., 1984, Great Salt Lake diking feasibilitystudy - volume I: James M. Montgomery, ConsultingEngineers, Inc. unpublished report prepared for UtahDepartment of Natural Resources, Project No. 1609.003,Utah Division of Water Resources, 293 p.
Palmer, Jim, Leeflang, Bill, Everitt, Ben, and Aubrey, Dan,1990, Preliminary design report for proposed reservoir inFarmington Bay of the Great Salt Lake: Utah Departmentof Natural Resources, Utah Division of Water Resources,125 p.
Richards, A.Z., Jr., 1965, A preliminary master plan for thedevelopment of the Great Salt Lake--over a period of thenext 75 years: Caldwell, Richards & Sorensen, Inc.,unpublished report prepared for the Great Salt LakeAuthority, 32 p.
-----1972, Review of past studies of the east embayment as afreshwater reservoir, in Falkenborg, Donna, editor, TheGreat Salt Lake and Utah’s water sources: Proceedings ofthe first annual conference of the Utah Section of theAmerican Water Resources Association, Salt Lake City,Utah, November 30, 1972, p. 180-189.
Rollins, Brown and Gunnell, Inc., and Creamer & NobleEngineers, 1987, Great Salt Lake inter-island diking proj-ect: unpublished consultants report, v. 1, section 1, 9 p.
Rosebrook, Don, 1993, Davis has fresh plans for AntelopeIsland: Deseret News, January 6-7 1993 edition, p (?).
Rushforth, S.R. and Felix, E.A., 1982, Biotic adjustments tochanging salinities in the Great Salt Lake, Utah: Micro-bial Ecology (US), v. 8, p. 157-161.
Saunders, G.E., 1994, Massive spread footing key to cause-way reconstruction: Roads & Bridges, August edition, p.26-27.
Saunders, G.E,. and Smith, S.W., 1994, Causeway reopeningbenefits people and wildlife: Public Works, February edi-tion, p. 34-36.
Searle, R.T., 1976, The Great Salt Lake: Office of LegislativeResearch, State of Utah, Research Report No. 7, 274 p.
Smedley, S.M., and Bain, Walt, Burningham, K.R., Wod-doups, M.G., and 24 other legislators, 1989, Great SaltLake Development Authority: 1989 General Session [ofthe Utah Legislature], H.B. No. 208, 57 p.
Smith, S.W., 1997, Memo from S.W. Smith, Director ofDavis County Public Works, to D.R. McConkie, DavisCounty Commissioner, 1 p.
Sorensen, D.L. and Riley, J.P., 1988, Great Salt Lake interisland diking-water quality considerations, final report:Utah Water Research Laboratory, Utah State University,prepared for Utah Department of Natural Resources,Division of Water Resources, 261 p.
Stauffer, Norm and Austin, Lloyd, 1995, Proposal to convertFarmington Bay into a freshwater bay: Memorandum toD. Larry Anderson, Director of Utah Division of WaterResources, dated July 17, 1995, 4 p.
Sturm, P.A., 1983, Farmington Bay project report: Utah Geo-logical and Mineral Survey Open-File Report 86, 56 p.
U.S. Geological Survey, 1972, Antelope Island South Quad-rangle, Utah: U.S. Geological Survey, 7.5 minute seriesorthophotomap (topographic), scale 1:24,000.
U.S. Geological Survey, 1974, Great Salt Lake and vicinity,Utah: U.S. Geological Survey topographic map, scale1:125,000.
Utah Division of Water Quality, 1994-1996, unpublished lab-oratory-analysis reports: Utah Division of Water Quality,Utah Department of Environmental Quality (20 analy-ses).
Utah State Department of Health and Davis County HealthDepartment, 1965, Preliminary investigation of pollutionof Great Salt Lake east of Antelope Island: Utah StateDepartment of Health and Davis County Health Depart-ment, unpublished report 13 p.
Waddell, K.M., and Fields, F.K., 1977, Model for evaluatingthe effects of dikes on the water and salt balance of GreatSalt Lake, Utah: Utah Geological and Mineral SurveyWater-Resources Bulletin 21, 54 p.
Woolf, Jim, 1993, Davis wants to convert bay into freshwaterreservoir: Salt Lake Tribune, January 7, 1993.
Wurtsbaugh, W.A., 1992, Food-web modifications by an
The Geology of Antelope Island Utah Geological Survey128

The waters surrounding Antelope Island, Great Salt Lake, Utah - Gwynn
invertebrate predator in the Great Salt Lake (USA):Oecologia., v. 89, p. 168-175.
APPENDIX A
Chronology and description of past studies of the eastembayment as a freshwater reservoir (modified from Richards1965, 1972)
May, 1930: L.E. Fox and T.L. Keller, in a work titled“Putting Great Salt Lake to work,” propose a three-partdike extending westerly from the mainland to the southend of Antelope Island, and northerly from the north endof Antelope Island to the south end of Fremont Island,and from the north end of Fremont Island to the Promon-tory Point (figure 9).
March, 1932: S.G. Margetts, in a work titled “Reporton proposed freshwater lake,” recommended a smallerfreshwater lake be developed in Farmington Bay bydamming the 146 square-mile area between the mainlandand the south end of Antelope Island and between thenorth end of Antelope Island and the mainland at Syra-cuse (figure 9).
June, 1933: R.A. Hart and N.E. McLaughlan, pub-lished a work titled “Abstract of report on laboratory testsof feasibility of freshening the proposed diked-off portionof Great Salt Lake.”
July, 1933: D.A. Lyon, published a work titled“Report of sub-committee appointed to investigate techni-cal problems that present themselves in connection withthe proposed diking of Great Salt Lake for the purpose ofcreating a body of fresh water.”
December, 1933: J.L. Crane, provided a summaryreport on Great Salt Lake diking project, and concludedthat the “smaller reservoir” known as the Farmington BayProject would be feasible from the standpoint of engi-neering construction. He recommended that the dikingproject be undertaken by the State of Utah.
July, 1935: T.C. Adams, reported to the Utah StatePlanning Board on additional engineering studies that hehad been commissioned to make by said board to sub-stantiate certain recommendations of the 1933 Cranereport.
1955: The Utah Legislature asked the Utah StateRoad Commission to initiate a study of the advisability ofconstructing the inter-island dikes, and particularly toaddress the availability of water.
1956: Dames & Moore and Caldwell, Richards &Sorensen, Inc, provided a joint report to the Utah StateRoad Commission on the availability of water.
1957: Caldwell, Richards & Sorensen, Inc. prepareda report for an advisory committee to the State RoadCommission titled “An engineering report and opinion onthe quantity and quality of water which may becomeavailable for use by industry, agriculture and forimproved recreation from the east embayment reservoirof Great Salt Lake if the inter-island dikes were to bebuilt.”
1963: The Utah State Legislature enacted the “GreatSalt Lake Authority,” with the responsibility to plan, for-mulate and execute a program for the development of themainland, the islands, the minerals, and the water withinGreat Salt Lake meander line as established by the UnitedStates Surveyor General for industrial, recreational, agri-cultural, industrial, and chemical purposes.
January, 1963: D.R. Mabey published an article inthe Utah Engineering and Science Magazine titled “Tail-ings--a new resource?” which addressed the possibility ofusing tailings from Kennecott Copper Corporation to con-struct the inter-island dikes.
January, 1965: Caldwell, Richards & Sorensen,under the direction of the Great Salt Lake Authority, pub-lished a report titled “Preliminary master plan for thedevelopment of Great Salt Lake over the next 75 years.”This plan envisioned constructing a massive landfill inthe southern half of Farmington Bay using Kennecott tail-ings, and through the construction of dikes, creating threefreshwater bays: (1) a south bay east of Antelope Island,(2) a central bay east of Fremont Island, and (3) a north-ern bay within the present Bear River Bay (figure 9).
The Geology of Antelope IslandMiscellaneous Publication 00-1 129

The Geology of Antelope Island
The waters surrounding Antelope Island, Great Salt Lake, Utah - Gwynn
Utah Geological Survey130
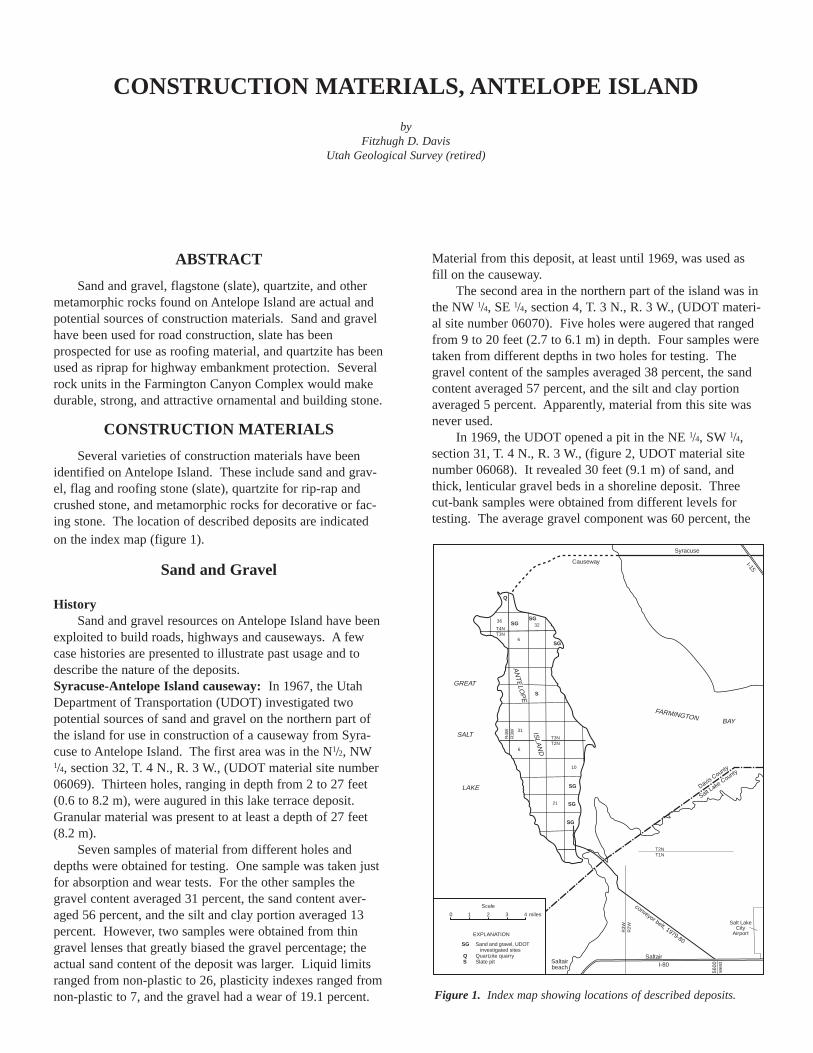
ABSTRACT
Sand and gravel, flagstone (slate), quartzite, and othermetamorphic rocks found on Antelope Island are actual andpotential sources of construction materials. Sand and gravelhave been used for road construction, slate has beenprospected for use as roofing material, and quartzite has beenused as riprap for highway embankment protection. Severalrock units in the Farmington Canyon Complex would makedurable, strong, and attractive ornamental and building stone.
CONSTRUCTION MATERIALS
Several varieties of construction materials have beenidentified on Antelope Island. These include sand and grav-el, flag and roofing stone (slate), quartzite for rip-rap andcrushed stone, and metamorphic rocks for decorative or fac-ing stone. The location of described deposits are indicatedon the index map (figure 1).
Sand and Gravel
HistorySand and gravel resources on Antelope Island have been
exploited to build roads, highways and causeways. A fewcase histories are presented to illustrate past usage and todescribe the nature of the deposits.Syracuse-Antelope Island causeway: In 1967, the UtahDepartment of Transportation (UDOT) investigated twopotential sources of sand and gravel on the northern part ofthe island for use in construction of a causeway from Syra-cuse to Antelope Island. The first area was in the N1/2, NW1/4, section 32, T. 4 N., R. 3 W., (UDOT material site number06069). Thirteen holes, ranging in depth from 2 to 27 feet(0.6 to 8.2 m), were augured in this lake terrace deposit.Granular material was present to at least a depth of 27 feet(8.2 m).
Seven samples of material from different holes anddepths were obtained for testing. One sample was taken justfor absorption and wear tests. For the other samples thegravel content averaged 31 percent, the sand content aver-aged 56 percent, and the silt and clay portion averaged 13percent. However, two samples were obtained from thingravel lenses that greatly biased the gravel percentage; theactual sand content of the deposit was larger. Liquid limitsranged from non-plastic to 26, plasticity indexes ranged fromnon-plastic to 7, and the gravel had a wear of 19.1 percent.
Material from this deposit, at least until 1969, was used asfill on the causeway.
The second area in the northern part of the island was inthe NW 1/4, SE 1/4, section 4, T. 3 N., R. 3 W., (UDOT materi-al site number 06070). Five holes were augered that rangedfrom 9 to 20 feet (2.7 to 6.1 m) in depth. Four samples weretaken from different depths in two holes for testing. Thegravel content of the samples averaged 38 percent, the sandcontent averaged 57 percent, and the silt and clay portionaveraged 5 percent. Apparently, material from this site wasnever used.
In 1969, the UDOT opened a pit in the NE 1/4, SW 1/4,section 31, T. 4 N., R. 3 W., (figure 2, UDOT material sitenumber 06068). It revealed 30 feet (9.1 m) of sand, andthick, lenticular gravel beds in a shoreline deposit. Threecut-bank samples were obtained from different levels fortesting. The average gravel component was 60 percent, the
CONSTRUCTION MATERIALS, ANTELOPE ISLAND
byFitzhugh D. Davis
Utah Geological Survey (retired)
Salt LakeCity
Airport
GREAT
SALT
LAKE
FARMINGTON BAY
Syracuse
Causeway I-15
Davis County
Salt Lake
County
conveyor belt, 1979-80
SaltairSaltairbeach I-80
5600
wes
t
0 1 2 3 4 miles
Scale
EXPLANATION
Sand and gravel, UDOT investigated sitesQuartzite quarrySlate pit
SG
Q S
SG
SG
SG
Q
SGSG
SG
T3NT2N
R4W
R3W
T4NT3N
3632
6
31
6
10
21
AN
TELO
PE
ISLA
ND
T2NT1N
R3W
R2W
S
Figure 1. Index map showing locations of described deposits.

Construction materials, Antelope Island - Davis
average sand content was 31 percent, and the average silt andclay portion was 9 percent. Liquid limits ranged from 18 to29, plasticity indexes ranged from non-plastic to 6, the swellwas zero on all samples, and the gravel wear averaged 38 per-cent.
During 1969 and again in early 1973, a total of 67 testholes were augured in this large deposit. The holes rangedfrom 3 to 30 feet (0.9 to 9.1 m) in depth and averaged about18 feet (5.5 m). Figure 2 shows a representative number ofthe test holes plus the corresponding logs. Also, the 1987 pitoutline is portrayed as well as the initial pit. From 1969 tothe spring of 1984, a large amount of material from this pit
was used as embankment on the causeway. However, by theend of 1973, all the gravel lenses had been excavated and allthat remained was sand and silt (Allen K. Hunsaker, UDOT,personal communication, December, 1987). Therefore, from1974 to 1984 a large quantity of sand and silt was used formaintenance of the causeway. During these years the pit, 35to 40 feet (10.7 to 12.2 m) deep, was extended to the east andsoutheast. Test logs 5, 24, and 67 had correctly depicted thetypes of material in the deposit.Interstate Highway 80: During 1975 and 1978 the UDOTinvestigated the alluvial fans and beach-sand deposits on thesoutheastern side of the island. A huge supply of embank-
The Geology of Antelope Island Utah Geological Survey132
TEST HOLE LOGS
0 200 400 ft.
SESW sec.31,T4N,R3W.
fenc
eN
olderpit
#45 #48 #64
4539
8
67
5
50
24
48
64
51
58
43
52
4
57
4380
4340
43604420
4440
34
4360
Modified from 1973 U.D.O.T. map.
#67#58#57#52#51#50#43#8#5#4 #24 #34 #39 GroundLine
5 feet
10 feet
15 feet
20 feet
25 feet
4400
silt sand gravel orboulders
clay
Figure 2. Map of Utah Department of Transportation material site 06068 on the north part of Antelope Island. Representative test holes and cor-responding logs are shown.

Construction materials, Antelope Island - Davis
The Geology of Antelope IslandMiscellaneous Publication 00-1 133
Figure 3. Air photo of southern Antelope Island (taken June 20, 1980 by U.S. Department of Agriculture) shows the extent of the excavation forinterstate highway construction material (bottom 2 arrows). Excavation eventually progressed northward (uppermost arrow).

Construction materials, Antelope Island - Davis
ment material was needed for interstate highway constructionbetween Redwood Road (just east of the Salt Lake City air-port) in Salt Lake City and Saltair Beach. The areas exam-ined were in sections 15, 22, and 27, T. 2 N., R. 3 W. (figure3).
During the two years 89 holes were augured and 20 holeswere rotary drilled in these sections. The holes ranged indepth from 2 to 105 feet (0.6 to 32 m) and enough granularmaterial was found to satisfy construction requirements.Sixty-one samples were obtained from different holes anddepths for testing. Thirty-one samples were A-1-b material(American Association of State Highway Officials classifica-tion), 16 samples were A-2-4 material, and the remainingsamples ranged from A-4(0) to A-7-5(12) material. In gener-al, the gravel content of the samples was between 10 and 20percent. The silt and clay percentages of the samples rangedfrom 7.3 to 95.9 percent, but sand was, by far, the largest vol-ume of material.
In 1979 and 1980 about 16 million cubic yards (12.2 mil-lion cubic meters) of material were excavated from this partof the island for interstate highway construction (John T.McCleary, UDOT, personal communication, July, 1987). Theexcavation essentially removed the upper 10 to 15 feet (3 to4.5 m) of the surficial deposits. The material was loadedonto a 13-mile-long (21 km) conveyor belt and carried south-easterly to a stockpile and loading facility near 5600 Westand the I-80 route west of Salt Lake City. At the time, thisconveyor belt system was the longest ever built in the world.The excavated areas were graded, contoured, and revegetated.
Antelope Island sand and gravel depositsWhile mapping the geology of the island, Doelling and
others (1990) examined many exposures, mostly in gullies, inthe alluvial fans (Doelling and others, 1990 map unit Qaf)and the lacustrine sand and gravel deposits (map unit Qlg)around the perimeter of the island. In general, the gravelcomponent ranges from 10 to 20 percent in nearly all the mapunits Qaf and Qlg deposits on the island. This contrasts withmost commercial gravel deposits that have a 45 to 60 percentgravel content. The following comments pertain to the largerareas of Qaf and Qlg on the west side of the island:Qaf in the W 1/2, section 20, T. 2 N., R. 3 W.: Eight feet(2.4 m) of alluvium is exposed in a gully. The gravel is 40percent gneiss, 30 percent quartzite, 5 percent amphibolite,and 25 percent other metamorphic rocks. This is a largeresource area, but sand comprises about 75 percent of thedeposit.Qaf in NE 1/4, section 18, T. 2 N., R. 3 W.: Five feet (1.5 m)of alluvium is exposed in a gully. The gravel is 90 percentgneiss, 5 percent quartzite, and 5 percent other metamorphics.The deposit, however, is mostly sand with very little silt andclay.Qaf in SW 1/4, section 6 and N 1/2, section 7, T. 2 N., R. 3W.: Ten feet (3 m) of sand and gravel are exposed in severalplaces. The clasts are 94 percent gneiss, 3 percent amphibo-lite, 2 percent red granitic gneiss, and 1 percent quartzite.Gravel is more abundant (25 to 30 percent) in this depositthan in any other on the west side of the island. This is alarge resource area and an average thickness of 20 feet (3 m)of sand and gravel seems reasonable.
Qlg and Qaf in NE 1/4, section 24, T. 3 N., R. 4 W. and NW1/4, section 19, T. 3 N., R. 3 W.: Twelve to 15 feet (3.7 to 4.6m) of alluvial and lacustrine deposits are exposed. The grav-el is 85 percent gneiss, 10 percent amphibolite, and 5 percentschist and quartzite. However, sand comprises 60 to 70 per-cent of the material; silt and clay about 6 to 8 percent.Qlg and Qaf in N 1/2, section 18, T. 3 N., R 3 W.: Fifteenfeet (4.6 m) of Qlg are exposed in a gully. The deposit isabout 80 percent beach sands. The clasts are 70 percentgneiss, 20 percent quartzite, 10 percent amphibolite, andcomprise 10 to 12 percent of the deposit.
Quartzite
Crushed quartzite makes an excellent aggregate for con-crete and bituminous mixtures. If a source is ever needed onthe island, the Tintic Quartzite is abundant and a quarry couldbe easily located.
The Tintic Quartzite has been quarried for riprap in theNW 1/4, NE 1/4, section 25, T. 4 N., R. 4 W. Large, durableblocks and slabs of the quartzite were used to protect thecauseway embankments.
Flagstone (slate)
In the west half of section 20 and the southeastern part ofsection 19, T. 3 N., R. 3 W., there are at least four slateprospects and one fair-sized slate pit in the upper part of theKelley Canyon Formation. The slate pit in the NE 1/4, NW 1/4,section 20, T. 3 N., R. 3 W., is about 40 feet wide and 90 feetlong. About 25 feet of thin-bedded, platy and laminated slateand hard shale are exposed. The rocks break into plates 1/4 to3 inches (0.6 to 7.6 cm) thick and the prospectors probablywere looking for flagstone and possibly roofing material.The rock colors change vertically each 1/8 to 4 inches (0.3 to10 cm) and they range through shades of brownish gray,grayish purple, light orange, light greenish gray, and mediumbrown. From the dump size adjacent to the pit, it appearsthat not too much slate was removed from the site. Muchflagstone remains at the site.
Ornamental and Building Stone
Strong, hard, durable, and attractive rocks are availableon the island for use as ornamental and building stone. Fac-ing on building exteriors, sills, trim, facings, and steps can befashioned in stone. Stone is used for interiors in flooring,wainscoting, steps, fireplaces, and baseboards. Three units inthe Farmington Canyon Complex have ornamental and build-ing stone potential: (1) quartz plagioclase gneiss (map unitXWfq), (2) red granitic gneiss (map unit XWfr), and (3)coarse-grained granite (map unit XWfc) (Doelling and others,1990). All three have pleasing colors and fabrics. Units (1)and (2) have an attractive gneissic texture.
REFERENCE
Doelling, H.H., Willis, G.C., Jensen, M.E., Hecker, Suzanne,Case, W.F., and Hand, J.S., 1990, Geologic map of Ante-lope Island, Davis County, Utah: Utah Geological andMineral Survey Map 127, 27 p., scale 1:24,000.
The Geology of Antelope Island Utah Geological Survey134

ABSTRACT
The 43 square-mile (110 km2 ) Antelope Island is pre-dominantly composed of Precambrian gneiss similar to rocksin the Wasatch Range 20 miles (32 km2) to the east. Threegeneral types of ground-water systems have been identifiedon the basis of aquifer composition and dissolved solute con-tent. The systems include ground waters which dischargefrom either crystalline or sedimentary rocks. Sedimentaryground-water systems contain ground water which is eitherNa-Cl rich or poor. All island ground water has anomalouslyhigh Na+, Cl-, or SO4
2- concentrations when compared toground waters that issue from similar bedrock in nearbyareas. Crystalline ground-water systems discharge up to1,400 feet (732 m) above lake level, and their combined dry-season discharge is estimated at 100 gallons/minute (400l/min). Island ground-water systems may be statistically dis-tinguished from each other and from other ground water inthe region.
The solute chemistry of island ground water cannot beaccounted for by the simple dissolution of aquifer minerals,and the water does not plot along fault-controlled thermal-water-precipitation or parent-aquifer-precipitation Cl-/SO4
2-
mixing lines. Discharge elevations and Cl-/SO42- data also
rule out mixing with residual salts from Pleistocene LakeBonneville or brines of the Great Salt Lake for most islandground water.
Tritium data (>40 tritium units) suggest island ground-water systems are primarily recharged from modern meteoricwater. Stable isotope deuterium and oxygen-18 data plotalong an evaporation line which indicates that recharge watercontains a component of evaporated Great Salt Lake water.Temporal variations in spring discharges, tritium concentra-tions, and discharge temperatures of less than 68°F (20°C)indicate short flow paths and shallow circulation. Excess Cl-
and SO42- concentrations are attributed to the deposition of
aerosols of windblown dust from nearby evaporate depositsand sea spray. Sulfur-34 isotope data suggest contributions tocrystalline systems of reduced sulfur from nearby smelterplumes or other industrial smoke stacks. Excess Na+ concen-trations may be attributed to Great Salt Lake Desert aerosolsfrom dust storms and precipitation events, to air-borne stormaerosols from lake sea spray, and to precipitation of salinelake water.
INTRODUCTION
Antelope Island, the largest island in Utah's Great SaltLake, is located about 20 miles (32 km) northwest of SaltLake City (figure 1). The island covers approximately 43square miles (110 km2), and has a length of 15 miles (24 km)and a maximum width of 5 miles (8 km). The highest peakreaches an altitude of 6,597 feet (2,010 m) and the maximumrelief above lake level is almost 2,400 feet (732 m).
As demonstrated by statistics, the chemical characters ofvarious island ground waters are compositionally differentfrom each other and from ground water in similar rock typesin adjacent areas. Discharges from the crystalline bedrocksources have solute concentrations 3.7 times greater thansolute concentrations in similar bedrock sources in theWasatch Range located 20 miles (32 km) to the east. Dis-charges from the island's sedimentary aquifers systems, pre-dominantly composed of Lake Bonneville sediments, alsohave anomalous concentrations of SO4
2-, Na+, and Cl- com-pared to similar non-island ground-water systems. The pur-pose of this investigation is to determine the origin of thehigh solute concentrations in the island's ground water.
HYDROGEOLOGY OF ANTELOPE ISLAND, GREAT SALT LAKE, UTAH
byAlan L. Mayo and Robert H. Klauk1
Department of GeologyBrigham Young University, Provo, Utah
1 now at Warzyn Engineering, Inc., Milwaukee, Wisconsin
Reprinted from Contributions to the solute and isotopic groundwater chemistry, Antelope Island, Great Salt Lake, Utah: Journal of Hydrology, v. 127, p. 307-335,published in 1991 with kind permission from Elsevier Science - NL, Sara Burgerhartstraat 25, 1055 KV Amsterdam, the Netherlands.
Figure 1. Map showing the location of Antelope Island and Weberdelta aquifer and southern Farmington Bay ground-water system.Sampling locations of hot springs, eolian dust and Wasatch Rangeground water are also shown.

Hydrogeology of Antelope Island, Great Salt Lake, Utah - Mayo, Klauk
Methods of Study
Water-quality data from island ground water were col-lected and correlated with published water-quality data fromsimilar rock sources in nearby terrains and from the GreatSalt Lake. Anomalies were identified and potential sourcesof island ground water solutes and isotopes were identified.
The field investigation included locating springs, measur-ing discharges, evaluating structural and stratigraphic rela-tionships, and collecting water samples. Geologic informa-tion was obtained from published sources. Temperature, pH,and HCO3
- concentrations were determined in the field. Ionswere analyzed by atomic absorption (AA), inductively cou-pled plasma (ICP), and specific ion methods. Water sampleswere collected and analyzed following U.S. EnvironmentalProtection Agency (1981) procedures. Solute data were plot-ted on a trilinear (Piper, 1944) diagram for visual inspection.Saturation indices were calculated with the computer programWATEQF (Plummer and others, 1976).
Ground-Water Systems Defined
The solute and isotopic compositions of ground and lakewaters from various sources located in the vicinity of south-eastern Great Salt Lake, Utah, will be discussed (figure 1).Only the Weber Delta aquifer has been formally defined as anaquifer (Feth and others, 1966). The less formal designationof "ground-water system" will be used for other ground-watersources. The sources and their designations are:
1. Wasatch Range systems: ground water supported byArchean-age crystalline rocks located along the westernedge of the Wasatch Range.
2. Weber Delta aquifer: ground water from the Weber Deltaaquifer.
3. Thermal ground water: ground water from hot springsand wells located near the Wasatch fault and in theWeber Delta aquifer.
4. Southern Farmington Bay systems: ground water sup-ported by off-shore Lake Bonneville deposits, locatedsouth of and adjacent to Farmington Bay, Great SaltLake.
5. Island crystalline systems: ground water supported byArchean-age igneous and younger metamorphic rocks onAntelope Island.
6. Island sedimentary systems: ground water supported byTertiary-age tuffs and by unconsolidated clays, sand, andgravels deposited on the flanks of Antelope Island fromLake Bonneville.
7. Water in the Great Salt Lake.
Both island sedimentary and southern Farmington Baysystems may be divided into two types on the basis of Na+
and Cl- concentrations. Although all ground waters in thesesystems have elevated Na+ and Cl- concentrations comparedto other systems in the region, ground waters from these sys-tems will be referred to as either Na-Cl poor or Na-Cl rich(based on local comparisons). Most ground-water dischargesin each system are Na-Cl poor.
Geologic and Hydrogeologic Setting
The oblong island (figure 2) has a bedrock core ofArchean-age gneiss with lesser amounts of fractured Protero-zoic slate and dolomite and Cambrian quartzite (Doelling andothers, 1990; Goode, 1978). Bedrock types found on theisland also crop out in the Wasatch Range. Antelope Islandand other islands in the lake, such as Stansbury Island locatedto the west, are Basin-and-Range-style horst blocks separatedfrom each other and from the Wasatch Range to the east by agraben containing as much as 13,000 feet (4,000 m) of detri-tus (Goode, 1978). A cover of Tertiary-age clastic sedimentsand Pleistocene-age Lake Bonneville unconsolidated clay,sand, and gravel deposits flank the bedrock core. Lake Bon-
The Geology of Antelope Island Utah Geological Survey136
Figure 2. Generalized geologic map of Antelope Island showingground-water systems and sampling locations.
Sedimentary(Bonneville)
SYSTEM
Sedimentary(Tuff)
Crystalline
Spring

Hydrogeology of A
ntelope Island, Great Salt L
ake, Utah - M
ayo, Klauk
The G
eology of Antelope Island
Miscellaneous P
ublication 00-1137
meq l-1 mg l-1
Sample1 Location2 Aquifer3 Discharge4 Elevation Temp pH δ18O δ2H δ13C δ34S 3H (gpm) (ft) (°C) Ca2+ Mg2+ Na+ K+ HCO3
- SO42- Cl- SiO2 (o/oo) (o/oo) (o/oo) (o/oo) (TU)
(SMOW) (SMOW) (PDB) (CD)
________________________________________________________________________________________________________________________________________________________
Island Crystalline Systems
1 T3N R3W 21bba Gneiss 3 4400 15 7.7 1.65 0.97 2.52 0.03 2.79 0.92 1.35 10 - - - - -2 T3N R3W 33abb Gneiss 4 4620 10 8.3 1.80 0.99 2.52 0.03 2.95 0.83 1.21 12 - - - - -3 T3N R3W 32bcd Gneiss 3 5360 14 7.7 1.80 0.90 2.57 0.03 2.39 0.98 1.72 7 - - - - -4 T2N R3W 5bcd Gneiss 3 4800 13 9.0 1.30 0.74 3.39 0.05 2.57 1.19 1.51 9 -14.7 -115.3 - - -5 T2N R3W 5dcb Gneiss <0.1 4900 20 9.2 2.20 1.23 5.22 0.05 3.31 2.06 3.17 - - - - - -6 T2N R3W 16aab Gneiss 4 4550 13 7.8 3.89 1.97 4.79 0.13 4.00 1.92 4.80 25 - - - - -7 T3N R3W 19add Metamorphic 3 5000 10 8.4 2.79 1.89 3.57 0.05 3.38 1.23 3.67 7 -15.1 -115.5 -12.9 +2.0 -8 T2N R3W 20cad Gneiss 0.3 4369 16 7.9 3.79 2.39 8.70 0.23 4.54 3.12 6.70 7 -13.7 -109.8 -11.7 +0.6 42.39 T3N R3W 33cab Granite 2.5 4800 13 8.1 2.10 1.48 2.78 0.03 3.25 1.17 1.83 8 -14.9 -113.6 - - 46.1
10 T2N R3W 16dcd Gneiss 20 4900 14 7.7 3.99 1.65 5.22 0.03 3.18 1.83 5.64 64 - - - - -11 T2N R3W 16adb Gneiss 2.5 4600 13 8.8 3.39 1.73 4.79 0.10 3.70 1.77 4.65 16 - - - - -12 T2N R3W 4bad Granite 1 4800 16 8.1 1.70 1.07 2.61 0.05 2.26 1.25 1.97 8 - - - - -
mean 4758 14 8.2 2.53 1.42 4.06 0.07 3.19 1.52 3.19 14.4 -14.6 -113.5 -12.3 +1.3 44.2
Island Sedimentary Systems
13 T3N R3W 21aca Bonneville <1 4240 13 8.1 3.54 1.56 5.22 0.05 3.02 0.75 6.35 - - - - - -14 T3N R3W 4bbc Bonneville 1 4280 15 8.2 2.05 0.91 2.52 0.08 2.03 1.66 2.17 6 -14.3 -112.5 -14.6 +4.2 -15 T2N R3W 27bca Tuff 4 4380 14 7.3 8.98 1.41 23.93 0.33 8.79 3.54 25.03 9 - - - - -16 T2N R3W 10aac Bonneville 2 4220 14 8.0 3.64 2.22 7.83 0.36 4.26 1.50 9.87 41 -14.5 -114.7 -12.9 +8.1 -17 T4N R4W 35adb Bonneville5 - 4230 9 9.9 4.99 3.04 10.44 0.33 7.08 2.08 9.17 15 - - - - -18 T2N R3W 9dda Tuff 13 4460 15 7.9 3.14 1.73 4.09 1.73 3.08 1.54 4.02 18 -14.8 -119.8 -12.0 +7.819 T2N R3W 3abc Bonneville5 >10 4240 15 8.6 1.95 1.40 5.66 0.23 4.47 0.73 3.81 9 - - - 20 T2N R3W 34bab Bonneville6 5 4230 14 7.9 8.48 5.43 23.49 0.26 4.06 3.12 27.50 14 - - - - -
mean (all sites) 4285 13.6 8.2 4.60 2.21 10.40 0.42 4.60 1.87 10.99 16 -14.5 -115.7 -13.2 +6.7 - mean (Na-Cl poor; w/o 15 and 20) 4278 13.5 8.4 3.22 1.81 5.96 0.46 3.99 1.38 5.90 17.8 mean (Na-Cl rich; with 15 and 20) 4305 14 7.6 8.73 3.42 23.71 0.30 6.43 3.33 26.27 11.5 - - - - -_____1 See Figure 2 for map locations.2 Reference Salt Lake Base Line and Meridian. Location is: T-Township, R-Range, section number, quarter section, quarter-quarter section, quarter-quarter-quarter section (a=northeast,
b=northwest, c=southwest, d=southeast).3 Bonneville: sand and gravel deposits from Lake Bonneville; Tuff: tuffaceous sandstone and conglomerate (Tertiary); Metamorphic: diamicite, dolomite and slate
(Late Proterozoic); Granite: granite gneiss (Early Proterozoic); Gneiss: gneiss, amphibolite, and schist (Archean). After Doelling and others, 1990. 4 Does not include base flow discharge from all island springs. 5 Thin Bonneville over Cambrian Tintic Quartzite.6 Thin Bonneville over gneiss.
Table 1. Physical and chemical characteristics of Antelope Island ground water, Great Salt Lake, Utah

Hydrogeology of Antelope Island, Great Salt Lake, Utah - Mayo, Klauk
The Geology of Antelope Island Utah Geological Survey138
Table 2. Physical and chemical characteristics of ground-water discharge from areas in the vicinity of Antelope Island.
meq l-1 mg l-1
Sample1 Location2 Temp pH δ18O δ2H δ13C δ34S(°C) Ca2+ Mg2+ Na+ K+ HCO3
- SO42- Cl- SiO2 (o/oo) (o/oo) (o/oo) (o/oo)
____________________________________________________________________________________________
Southern Farmington Bay Ground-Water Systems3
(all sites are wells)
21 T1N R1E 19baa 19 8.0 1.25 1.32 10.44 0.05 5.23 0.07 8.46 22 - - - -22 T1N R2E 24dac 27 8.2 0.65 0.32 6.96 0.10 4.14 0.05 4.23 32 - - - -23 T1N R2E 8abd 19.5 8.1 1.25 1.48 12.18 0.06 3.30 0.10 12.41 22 - - - -24 T1N R2E 15bcd 20 8.2 0.55 0.56 6.96 0.05 3.30 0.05 3.95 24 - - - -25 T1N R2E 21acd 21.5 8.0 0.80 0.49 9.14 0.16 4.48 0.04 6.21 53 - - - -26 T1N R2E 21cab 18 8.3 0.33 0.39 13.05 0.06 6.79 0.09 7.05 22 - - - -27 T1N R2E 22daa 15.5 8.0 1.00 1.32 12.62 0.07 5.80 0.07 10.16 22 - - - -28 T1N R2E 23bbd 16.5 8.2 0.65 0.90 14.79 0.06 6.25 0.10 9.87 22 - - - -294 T1N R2E 26cda 18 7.7 1.80 0.90 7.83 0.05 3.04 0.54 7.05 13 - - - -304 T3N R1W 25dab 16 7.4 2.99 1.23 7.83 0.06 3.80 0.07 8.75 25 - - - -31 T1N R2E 16caa 22.5 7.8 3.49 1.73 20.45 0.31 3.12 0.17 23.70 48 - - - -32 T1N R2E 7caa 17.5 7.8 4.59 7.49 41.76 0.09 4.88 0.46 50.78 22 - - - -33 T1N R2E 7ccc 13.5 8.0 3.64 6.83 73.95 0.11 3.54 7.08 73.35 21 - - - -344 T1N R1W 10aac 16 7.3 2.40 1.32 23.06 0.72 7.43 0.15 21.16 53 - - - -
mean (all sites) 18.6 7.9 1.81 1.88 18.64 0.14 4.65 0.65 17.65 28.6 - - - - mean (Na-Cl poor) 19.3 7.9 1.43 1.00 12.11 0.15 4.72 0.12 10.25 29.8 - - - -mean (Na-Cl rich 32 & 33) 15.5 7.9 4.12 7.16 57.95 0.10 4.21 3.77 62.07 21.5
Weber Delta Aquifer4
(all sites are wells)
35 T3N R1W 4bca 16.5 7.7 1.75 0.67 1.22 0.06 3.24 0.02 0.42 21 - - - -36 T3N R1W 5dda 18 7.7 1.40 0.45 1.31 0.07 2.78 0.05 0.39 32 - - - -37 T3N R1W 5ddb 17 7.3 2.00 1.15 2.00 0.16 5.28 0.08 0.48 29 - - - -38 T3N R1W 5ddb 18.5 7.9 1.40 0.62 1.48 0.06 2.78 0.01 0.48 22 - - - -39 T4N R1W 3ccd 12.5 7.4 3.09 1.23 0.70 0.04 3.92 0.50 0.56 16 - - - -40 T4N R1W 8dcd 14 7.7 2.45 0.90 0.65 0.03 3.16 0.33 0.37 17 - - - -41 T4N R1W 16bdd 15.5 7.8 1.50 0.54 0.52 0.02 2.08 0.10 0.28 17 - - - -42 T4N R2W 7bac 15.5 7.9 2.50 0.99 1.17 0.06 4.02 0.05 0.51 20 - - - -43 T4N R2W 20ada 16.5 8.0 2.10 0.90 0.83 0.08 3.34 0.02 0.34 21 - - - -44 T5N R1W 26bbc 16 7.6 2.64 1.07 1.17 0.04 3.92 0.29 0.85 19 - - - -45 T5N R1W 27dcc 12.5 7.5 3.49 1.32 0.70 0.04 4.30 0.50 0.68 12 - - - -46 T5N R1W 29bdb 11 7.4 3.49 1.48 0.74 0.05 4.62 0.58 0.56 12 - - - -47 T5N R1W 29bdc 11 7.3 3.54 1.56 0.91 0.06 5.04 0.54 0.56 12 - - - -48 T5N R1W 30ada 11.5 7.4 3.49 1.48 0.83 0.05 4.68 0.56 0.51 12 - - - -49 T5N R1W 35aaa 12.5 7.4 3.04 1.15 0.74 0.03 3.66 0.50 0.68 13 - - - -50 T5N R2W 22dcd 16.5 7.6 2.99 1.23 0.65 0.05 3.66 0.52 0.37 14 - - - -51 T5N R3W 25cdc 16 7.8 1.80 0.90 1.26 0.04 3.60 0.02 0.39 20 - - - -
mean 14.8 7.6 2.51 1.04 0.99 0.06 3.77 0.27 0.50 18.2 - - - -
Wasatch Range Ground-Water Systems5
(all sites are springs)
52 Little spg 12.5 7.5 0.95 0.66 0.74 0.05 1.61 0.46 0.25 - - - - -53 Baer spg 13 7.3 0.60 0.49 0.57 0.03 1.11 0.33 0.22 - - - - -54 Crooked spg 14.5 8.1 1.00 0.33 0.39 0.03 1.38 0.29 0.17 - - - - -55 Military spg 13 7.6 1.00 0.33 0.39 0.03 1.21 0.25 0.14 - - - - -
mean 13.3 7.7 0.97 0.45 0.52 0.03 1.42 0.35 0.20 - - - - -

Hydrogeology of Antelope Island, Great Salt Lake, Utah - Mayo, Klauk
The Geology of Antelope IslandMiscellaneous Publication 00-1 139
Thermal Ground Water6,7
(all sites are springs)
56 Wasatch spg 42 7.9 19.91 5.68 67.77 1.46 4.31 13.20 70.24 12 -16.0 -128 -6.7 +11.557 Beck spg 56 7.6 37.23 8.97 201.19 4.12 3.88 18.26 213.55 24 -16.8 -129 -4.4 -58 Utah spg 58 6.4 48.60 1.89 286.59 20.99 3.65 3.77 362.50 28 -15.1 -136 - -59 Ogden spg 56 7.0 15.72 0.49 130.02 8.05 4.00 2.00 139.08 41 -16.0 -136 - -60 Hooper spg 57 6.8 10.18 5.92 107.14 5.22 3.85 0.62 130.99 24 -15.8 -140 - -
mean 53.8 7.1 26.30 4.59 158.54 7.97 3.94 7.57 183.27 25.8 -15.9 -134 -5.6 +11.5
Causeway Well
618 T4N R3E 19caa3 - - 2.55 1.73 8.78 0.12 3.06 0.25 9.87 _____
1 See table 1 and figure 1 for locations.2 Reference Salt Lake City Base Line and Meridian. 3 Data from Seiler (1986). 4 Data from Plantz and others (1986). 5 Unpublished data, Utah Health Department (1988).6 Data from Cole (1983).7 δ13C and δ34S unpublished data by authors.8 Data from Bolke and Waddell (1972).
Table 3. Mean solute chemistry of ground water in the vicinity of Antelope Island.
meq l-1 mg l-1
Type1 Number of °C pH ___________________________________________________ samples Ca2+ Mg2+ Na+ K+ HCO3
- SO42- Cl- total SiO2
_____________________________________________________________________________________________________________Island crystalline systems 12 14.0 8.2 2.53 1.42 4.06 0.07 3.19 1.52 3.19 15.98 14.4Island sedimentary systems 8 13.6 8.2 4.60 2.21 10.40 0.42 4.60 1.87 10.99 35.09 16.0Na-Cl poor systems2 6 13.5 8.4 3.22 1.81 5.96 0.46 3.99 1.38 5.90 22.72 17.8Na-Cl rich systems3 2 14.0 7.6 8.73 3.42 23.71 0.30 6.43 3.33 26.27 72.19 11.5S. Farmington Bay systems 14 18.6 7.9 1.81 1.88 18.65 0.14 4.65 0.65 17.65 45.43 28.6Na-Cl poor systems4 12 19.3 7.9 1.43 1.00 12.11 0.15 4.72 0.12 10.25 29.78 29.8Na-Cl rich systems5 2 15.5 7.9 4.12 7.16 57.95 0.10 4.21 3.77 62.07 139.38 21.5Weber Delta aquifer 17 14.8 7.6 2.51 1.04 0.99 0.06 3.77 0.27 0.50 9.14 18.2Wasatch Range systems 4 13.3 7.7 0.97 0.45 0.52 0.03 1.42 0.35 0.20 3.94 - Thermal ground water 5 53.8 7.1 26.30 4.59 158.54 7.97 3.94 7.57 183.27 392.18 25.8
Type Number of log log saturation index (SI) samples PCO2 calcite dolomite gypsum halite quartz chalcedony mirabilite
________________________________________________________________________________________________________________
Island crystalline systems 12 -3.06 0.32 0.63 -1.99 -6.65 0.45 -0.28 -6.75 Island sedimentary systems 8 -2.99 0.75 1.23 -1.77 -5.89 0.54 0.10 -6.21 S. Farmington Bay systems 14 -2.63 0.16 0.31 -3.22 -5.11 0.75 0.24 -6.84 Na-Cl poor systems4 12 -2.63 0.13 0.21 -3.42 -5.26 0.76 0.25 -7.20Weber Delta aquifer 17 -2.33 0.07 -0.30 -2.86 -7.98 -0.63 0.11 -8.91 Wasatch Range systems 4 -2.81 -0.83 -2.00 -2.84 -8.69 - - -8.97Thermal ground water 5 -1.72 0.64 0.68 -1.21 -3.58 0.23 0.62 -5.55____
1 See figures 1 and 2 for aquifer locations.2 Excludes samples 15 and 20.3 Samples 15 and 20.4 Excludes samples 32 and 33.5 Samples 32 and 33.

Hydrogeology of Antelope Island, Great Salt Lake, Utah - Mayo, Klauk
neville never completely covered the island, and lake sedi-ments, commonly shoreline sands and clays, do not crop outabove approximately 5,300 feet (1,600 m).
In the southern Farmington Bay, near the present lakelevel on the east and south sides of the island, the Lake Bon-neville shoreline deposits grade into offshore deposits of sandand clay (Hintze, 1988; Marine and Price, 1964). Farther tothe east (East Shore), Lake Bonneville sediments of theFarmington Bay facies grade into Lake Bonneville shorelinedeposits at the base of the Wasatch Range. Northeast of theisland at the base of the Wasatch Range, the Farmington Bayfacies grade into several hundred feet of Weber Delta clasticsediments (Feth and others, 1966). The Weber Delta wasdeposited on the edge of Lake Bonneville by the Weber andOgden Rivers as they emerged from the Wasatch Range.Numerous shallow wells have been completed in the southernFarmington Bay ground-water system and the Weber Deltaaquifer. The spatial relationship between the various ground-water systems is illustrated in figure 1.
More than 80 cool-temperature, ephemeral, and perennialsprings have been located on the island (Vaughn Hansen andAssociates, 1976, unpublished report) Most perennial springsare located on the east side of the island and discharge fromfractures and joints along the bedrock backbone of the islandat elevations up to 5,360 feet (1,635 m) or along bedding con-tacts in the Lake Bonneville sediments that flank the bedrockcore. Many of the shallow wells (<300 feet [<100m]) devel-oped in the southern Farmington Bay ground-water systemare flowing artesian, whereas the Weber Delta aquifer isunconfined near the mountain front and confined elsewhere.
SOLUTE AND ISOTOPE GEOCHEMISTRY
Samples from 20 island springs were analyzed for majorions and stable isotopes (δ2H, δ18O, δ13C, δ34S, and 3H)(table1 and figure 2). Listed in table 2 are solute analyses and lim-
ited stable isotopic data of shallow ground-water samplesfrom the southern Farmington Bay (Marine and Price, 1964;Seiler, 1986; Smith, 1961; Waddell and others, 1987) andWasatch Range systems (Utah Department of Health, 1988,unpublished data), from the Weber Delta aquifer (Cole, 1982;Smith, 1961; Smith and Gates, 1963), and from thermalground water (Cole, 1981, 1983). Solute analyses are sum-marized in table 3.
Isotopes
The stable isotopic composition of environmental iso-topes, such as hydrogen and oxygen of the water, carbon ofbicarbonate, and sulfur, is expressed as the per mil (0/00) dif-ference in the ratio of the heavy/light isotope in the samplerelative to the ratio in the standard. For example, the stableisotopic composition of carbon is calculated as follows:
δ13C (0/00) = Rsample- Rstandard x 1000•Rstandard
where R= 13C/12C.
The stable environmental isotopes and reporting stan-dards of interest to this investigation are listed below:
Isotope analysis Ratio Standard
δ2H 2H/1H SMOW (standard mean ocean seawater)
δ18O 18O/16O SMOW (standard mean ocean seawater)
δ13C 13C/12C PDB (Pee Dee Belmintella)
δ34S δ34S/δ32S CD (Canyon Diablo)
Hydrogen-2 and Oxygen-18 (δ2H andδ18O)
δ2H and δ18O analyses for more than50 Weber Delta aquifer and thermalground waters (Cole, 1981, 1982, 1983)plot in figure 3 as three groups withrespect to the continental Meteoric WaterLine (MWL). Because Cole's WeberDelta aquifer numerical data were notpublished with location references, thosedata are not listed in table 2.
The MWL is defined as δ2H = 8δ18O+ 10 0/00 (Craig 1961). Cole (1981)identified three groups of stable isotopicdata with respect to the MWL:1. Weber Delta ground-water data
which plot near the MWL betweenδ2H of -136 and -110 0/00. Cole(1981) suggested some Weber Deltadata exhibit a possible evaporationtrend.
2. Thermal ground-water data (68 to104°F [20 to 40°C]) from sites
The Geology of Antelope Island Utah Geological Survey140
Figure 3. Plot of δ2H and δ18O of various ground waters in vicinity of Antelope Island, GreatSalt Lake, Utah. Salt Lake brine samples were collected west of the island and near shore at theWeber delta.

Hydrogeology of Antelope Island, Great Salt Lake, Utah - Mayo, Klauk
located near the Salt Lake Mining Company, which plotnear the MWL at about δ2H of -140 0/00.
3. Stable isotopic data for thermal ground water (>104°F[>40°C]) located along the Wasatch fault, which exhibit apositive δ18O shift of 2.5 to 3.5 0/00. Cole (1981) attrib-uted the δ18O shifts to high-temperature oxygen exchangebetween rocks and water at depth.
Island stable isotopic data plot along the proposed evapo-ration trajectory of Cole (1981) and lie along the evaporationtrajectory of Great Salt Lake brine (figure 3 and table 4). Theplot of island ground-water isotopic data along the evapora-tion trajectory suggests that evaporated lake water, from theso called "lake effect," is a component of island precipitation.The slopes of the evaporation trajectories are variable(Fontes, 1990). The slope of the trajectory in figure 3 falls inthe normal range of such trajectories. It is unlikely that thestable isotopic composition of island ground water can beattributed to soil zone evaporation, because steep islandslopes preclude surface ponding of meteoric water prior toinfiltration, and because standing bodies of surface water donot exist above spring-discharge elevations. As discussed indetail later, it is also unlikely that the location along the evap-oration trajectory is the result of direct mixing of islandground water with Great Salt Lake brine because plausiblemechanisms for mixing do not exist.
The "lake effect" is localized around the Great Salt Lake(Eubank and Brough, 1980), and it does not appear to influ-ence the chemical or isotopic composition of high-elevationprecipitation in the Wasatch Range. Stable isotopic composi-tions of high-elevation ground-water systems in the WasatchRange plot near the MWL about a mean δ2H of -132 0/00 .The high-elevation ground water is predominantly of the cal-cium carbonate type with low solute concentrations. Tritium(3H) concentrations in high Wasatch Range ground water alsoindicate modern recharge water (Loucks and others, 1989).
Tritium (3H)Island stable isotopic data and tritium concentrations
(>40 tritium units [TU]; table 1), suggest island groundwaters are of a modern meteoric origin. Because of atmos-pheric 3H contamination from post-1952 atmospheric testingof thermonuclear weapons, modern precipitation has 3H con-centrations >25 TU. Ground water recharged prior to 1952has 3H concentrations <4 TU. Modern recharge is consistentwith an island water budget in which annual surface dis-charge is only 2.1 percent of annual precipitation. The budgetis based on a mean annual precipitation of 16 inches (40.6
cm) and an island area of 43 square miles (110 km2) andincludes some spring discharge data not listed in table 1.
Carbon-13 and Sulfur-34 (δ13C and δ34 S)Stable carbon isotopic compositions of water samples
(table 1) from island crystalline (mean δ13C = 12.3 0/00) andsedimentary systems (mean δ13C = -13.2 0/00) suggest islandground waters acquire carbon from the congruent dissolutionof soil zone carbonate minerals in the presence of soil zoneCO2 (gas). The δ13C of all island ground water is consistentwith typical soil zone δ13C evolution where carbonate soilzone minerals (mean δ13C = 0 0/00; Craig, 1963; Truesdell andHulston, 1980; Muller and Mayo, 1986) are stoichiometrical-ly dissolved by soil-zone carbonic acid (mean δ13C = -26 to -20 0/00; Rightmire and Hanshaw, 1973; Fritz and others,1978).
When sulfate concentrations are very low, the sulfatemay be entirely of natural atmospheric sources. Sulfur con-centration levels in island ground water (table 3) suggestadditional bedrock or soil-zone sources or atmospheric con-tamination from sources such as smelter plumes and blowinggypsum dust. Sulfate belongs to two groups: 1) 34S-enrichedsulfate from the dissolution of evaporite minerals, and 2) 34S-depleted sulfate from reduced sulfur sources such as sulfiteminerals, pyrite, soil organic material, and anthropogenicsources. Sulfur fractionation tends to enrich the oxidized sul-fate species in 34S (i.e., δ34S becomes more positive) andtends to enrich the reduced species in 34S (i.e., δ34S becomesmore negative).
The isotopic composition of sulfate in ground waterreflects the isotopic composition of the sulfur source. Oxida-tion of sulfide minerals, the dissolution of gypsum and anhy-drite, smelter plumes, and sea spray are the potential sources
The Geology of Antelope IslandMiscellaneous Publication 00-1 141
Table 4. Isotopic analyses of Great Salt Lake brine.
Sample1 Sampling Date Depth δ18O δ2H δ13C δ34S(ft) (o/oo) (o/oo) (o/oo)) (o/oo)
_______________________________________________________ 1 7/25/89 0.25 -4.2 -69 -1.4 +17.12 7/25/89 0.25 -4.1 -68 -1.4 +14.632 - - -8.8 -98 - -_______________________________________________________ 1 Sample 1 collected 3.5 miles west-southwest of Antelope Island;
sample 2 collected 4 miles southwest of Antelope Island.2 Data from Cole (1983). Collected near shore at Weber Delta._______________________________________________________
Mineralogy (%) Sample Site
Aragonite1 Knolls2
Amphibole tr -Amorphous 7 1Aragonite 13 14Calcite 17 11Chlorite 1 -Cristobalite 4 -Dolomite 5 5Gypsum tr 25Illite/Smectite 5 2K-Feldspar 4 10Plagioclase 7 4Pyrite 1 1Quartz 34 27Smectite 2 tr
δ13C (o/oo) +1.5 +1.0
δ34S (o/oo) +9.8 +16.4
1Collected from north side of Aragonite I-80 exit at north end of Cedar Mountains (54 miles (86 km) east of Utah-Nevada state line).
2Collected at Knolls I-80 exit from great salt flats (38 miles (61 km) east of Utah-Nevada state line). tr = trace
Table 5. Bulk x-ray diffraction and bulk isotopic analyses of eoliandeposits collected from the West Desert, Utah.

Hydrogeology of Antelope Island, Great Salt Lake, Utah - Mayo, Klauk
of sulfur in island ground waters. The typical δ34S of mag-matic pyrite is about 0 0/00 (Faure, 1986), a mean value -2.20/00 has been reported for Park City District pyrite in the near-by Wasatch Range (Thode and others, 1961), and acid minedrainage in the Wasatch Range has a mean value of -1.1 0/00
(Nielsen and Mayo, 1989). The δ34S of evaporite rocks variesgreatly and generally corresponds to the geologic age of dep-osition. The δ34S of near-surface Great Salt Lake brine (meanδ34S = +15.9 0/00, table 4) is consistent with the anticipatedδ34S range (+10 to +20 0/00) of Paleozoic gypsum and anhy-drite sources in the central Wasatch Range (Holser andKaplan, 1966). Gypsum in wind-blown deposits in the GreatSalt Lake Desert (locally known as the West Desert) has δ34Svalues of +9.8 to +16.4 0/00 (table 5). The deposits contain upto 25 percent gypsum as identified by x-ray diffraction(XRD) analyses.
Although the mean SO42- concentrations in island sedi-
mentary system ground waters are similar to the mean con-centration in island crystalline system ground waters (table3), the δ34S data suggest different sulfur sources for crys-talline and sedimentary systems. The mean δ34S of two crys-talline system ground-water samples is +1.3 0/00, whereas themean δ34S of three sedimentary system ground-water samplesis +6.7 0/00 (table 1). The δ34S composition of the sedimentarysystem ground water is similar to the mean δ34S = +7.1 0/00 ofcarbonate aquifer ground waters in the Wasatch Range (Mayoand Loucks, 1992) and to the δ34S values in precipitation nearalpine lakes in the Rocky Mountains (Turk, 1990) and is con-sistent with isotopic fractionation accompanying the dissolu-tion of evaporate minerals. The δ34S of island crystalline sys-tem ground water (mean = +1.3 0/00) is closer to the δ34S(mean = -1.1 0/00) of mine drainage waters in the WasatchRange (Nielsen and Mayo, 1989) and appears to have a majorcontribution from a reduced sulfur source.
Solute Geochemistry
Ground waters from island crystalline and sedimentarysystems are distinguishable from each other and from non-island ground waters on the basis of the concentrations of oneor more of the following: Na+, Cl-, SO4
2-, and total solutes.Statistical differences in concentrations were determined witht-tests at a 95 percent confidence interval. Island crystallinesystem ground waters have mean Na+, Cl-, and total soluteconcentrations of 4.1, 3.2, and 16.0 milliequivalents/liter(meq 1-1), respectively, whereas Na-Cl poor island sedimenta-ry system ground waters have mean Na+, Cl-, and total soluteconcentrations of 6.0, 5.9, and 22.7 meq l-1, respectively(table 3). Na-Cl rich island sedimentary system groundwaters have mean Na+, Cl-, and total solute concentrations of23.7, 26.3, and 72.2 meq 1-1, respectively.
The chemical composition of island ground waters can-not be solely attributed to the dissolution of aquifer minerals.If lithology were the principal factor controlling solute com-position, island crystalline system ground water should bechemically similar to ground water in Wasatch Range systemsand island sedimentary system ground water should be chem-ically similar to Weber Delta aquifer or southern FarmingtonBay system ground water (table 3).
Island crystalline and Na-Cl poor sedimentary systems
ground waters have mean solute concentrations about 4 and2.5 times as great as those of ground waters in the WasatchRange system and Weber Delta aquifer, respectively. South-ern Farmington Bay system ground water is more saline thanNa-Cl poor island sedimentary system ground water. MeanNa+, Cl-, and SO4
2- concentrations of island crystalline groundwater are about 8, 16, and 4 times as great, respectively, asthose of ground water in the Wasatch Range crystalline sys-tem. Mean Na+, Cl-, and SO4
2- concentrations in Na-Cl poorisland sedimentary system ground waters are about 6, 12, and4 times as great, respectively, as those of ground waters fromthe Weber Delta aquifer. The Na-Cl poor island sedimentarysystem ground water has a mean SO4
2- content 11.5 times asgreat as that of Na-Cl poor southern Farmington Bay systemground water.
DISCUSSION
Factors which could contribute to the high Na+, Cl-, andSO4
2- concentrations in island ground waters include:1. Mixing with lake brines and/or the dissolution of residual
salts precipitated from Lake Bonneville or the Great SaltLake.
2. Contributions from deeply circulating thermal groundwater associated with the Wasatch fault zone or otherdeep-seated normal faults.
3. Contributions to island sedimentary systems from shal-lowly circulating non-thermal ground water movingwestward beneath the Great Salt Lake from the WasatchRange.
4. Evaporated soil water from recent precipitation.
5. Aerosol contribution of salts from meteoric rechargewater and from dry-fall aerosols.
Mixing with Lake Brine and/or Dissolution ofResidual Lake Salts
An estimated 4.4 x 10¹⁰ tons (4.5 x 10¹³ kg) of soluteswere removed from ancestral Lake Bonneville and the GreatSalt Lake by diffusion into lake bed sediments and by precip-itation of Na+, Cl-, and SO4
2- bearing minerals (Spencer andothers, 1985). However, it is unlikely that the dissolution ofresidual salts substantially affects the Na+ and Cl- content ofmost island crystalline system ground waters. One islandcrystalline system spring discharges above the highest LakeBonneville stage (Bonneville shoreline, 5,250 feet [1,600 m])and most island crystalline system springs discharge above4,430 feet (1,350 m) (table 1). At lake levels between theBonneville and Stansbury shorelines, 5,250 to 4,430 feet(1,600-1,350 m) (Doelling and others, 1990), Na+ and Cl-
were conserved in Lake Bonneville waters (Spencer and oth-ers, 1985); thus Na+ and Cl- concentrations in island crys-talline system ground waters cannot be directly attributed tolake sources.
At all lake levels, calcite precipitated and minor amountsof SO4
2- precipitated or diffused into lake sediments (Spencerand others, 1985). Supersaturation of most island groundwater with respect to calcite (tables 3 and 6) suggests that
The Geology of Antelope Island Utah Geological Survey142

Hydrogeology of Antelope Island, Great Salt Lake, Utah - Mayo, Klauk
The Geology of Antelope IslandMiscellaneous Publication 00-1 143
log
log
satu
ratio
n in
dex
(SI)
Sam
ple
PCO
2ca
lcite
do
lom
ite
gyps
um
hal
ite
qua
rtz
cha
lced
ony
mir
abili
te__
____
____
____
____
____
____
____
____
____
____
____
____
____
____
____
____
____
_
Ant
elop
e Is
land
Cry
stal
line
Gro
und-
Wat
er S
yste
ms
1
-2.5
4
-0.1
5
-0.5
3 -2
.23
-7.1
8
0.38
-0.1
4-7
.21
2
-3.1
50.
420.
56-2
.17
-7
.19
0.
42
-0.1
3
-7.1
13
-2
.52
-1
.11
-0
.54
-2.1
1
-6.9
9
0.25
-0
.28
-7
.12
4
-3.9
30.
891.
51-2
.18
-6
.92
0.
34
-1.8
8
-7.7
25
-4.0
71.
392.
63-1
.85
-6
.45
0.
19
-0.4
8
-6.5
36
-2.5
50.
330.
33-1
.62
-6
.30
0.
82
0.28
-6
.34
7
-3
.21
0.72
1.18
-1.9
0
-6.5
2
0.31
-0
.24
-6
.60
8
-2
.72
0.35
0.52
-1.4
8
-5.9
1
0.23
-0
.31
-5
.80
9
-2
.90
0.36
0.53
-2.0
0
-6.9
3
0.32
-0
.21
-6
.95
10
-2.5
10.
20
-0
.01
-1.6
3
-6.1
9
1.21
0.
20
-6.3
411
-3
.57
0.25
1.19
-2.6
5
-6.3
0
0.61
0.
07
-6.2
912
-3
.03
0.17
0.
15-2
.05
-6
.93
0.
27
-0.2
5
-7.1
0
mea
n
-3.0
60.
32
0.63
-1.9
9
-6.6
5
0.45
-0
.28
-6
.75
Ant
elop
e Is
land
Sed
imen
tary
Gro
und-
Wat
er S
yste
ms
13
-2.9
70.
490.
58-2
.04
-6.1
30.
320.
49-7
.74
14
-3
.05
0.41
0.47
-1.9
9-6
.90
0.16
-0.3
6-7
.10
15
-1
.70
0.44
0.56
-1.2
7-4
.94
0.81
0.29
-4
.94
16
-2
.69
0.55
0.87
-1.8
0 -5
.78
1.01
0.49
-6.1
017
-4.8
02.
16
4.06
-1.6
9
-5.6
9 0.
50
-0.0
5
-5.4
7 18
-2.7
10.
31
0.36
-1.7
8
-6.4
4 0.
640.
12
-6
.64
19
-3
.27
0.94
1.74
-2
.29
-6
.32
0.33
-0
.20
-6.6
620
-2.6
40.
68
1.16
-1
.33
-4
.91
0.55
0.02
-5.0
1
mea
n
-2.9
90.
75
1.23
-1.7
7
-5.8
9 0.
540.
10
-6
.21
Sout
hern
Far
min
gton
Bay
Gro
und-
Wat
er S
yste
ms
21
-2.5
60.
290.
65-3
.50
-5.7
3 0.
66
0.29
-7.3
522
-2.8
10.
260.
37-3
.84
-6.2
0 0.
69
0.22
-8
.14
23
-2.8
70.
180.
50-3
.42
-5.5
0
0.65
0.15
-7.1
524
-2
.95
0.00
0.08
-3.9
7
-6.2
1
0.68
0.18
-7.8
825
-2
.61
0.09
0.06
-3
.92
-5.9
2
1.00
0.51
-7.8
226
-2.5
60.
10
0.32
-4.0
0
-5.7
1
0.67
0.16
-7.0
227
-2.5
40.
170.
47-3
.64
-0
.56
0.
720.
17
-7
.05
28
-2
.71
0.22
0.60
-3.6
6
-5.5
1
0.70
0.18
-6.7
929
-3.1
9
-0.
08
-
0.41
-2.4
5
-5.9
2
0.45
-0.
06
-6
.67
30
-2
.13
-
0.10
-0.
58-3
.14
-5
.83
0.
770.
25
-7
.49
31
-2
.59
0.28
0.36
-2.4
7
-5.0
3
0.95
0.28
-6.7
032
-2.4
60.
411.
07-2
.50
-4
.42
0.
690.
18
-5
.58
33
-2
.84
0.22
0.70
-1.5
2
-4.0
3
0.74
0.21
-3.7
634
-2.0
40.
200.
15-3
.05
-5
.01
1.
100.
58
-6
.32
mea
n -2
.63
0.16
0.31
-3.2
2
-5.1
1
0.75
0.24
-6.8
4m
eanw
/o-2
.63
0.13
0.21
-3
.42
-5
.26
0.
760.
25
-7
.20
32 a
nd 3
3
log
log
satu
ratio
n in
dex
(SI)
Sam
ple
PC
O2
calc
ite
dol
omite
gy
psum
h
alite
q
uart
z c
halc
edon
y m
irab
ilite
____
____
____
____
____
____
____
____
____
____
____
____
____
____
____
____
____
___
Web
er D
elta
Aqu
ifer
35-2
.46
0.00
-0.4
0-3
.79
-7.9
20.
68
0.
17-9
.58
36
-2
.52
-
0.13
-0.7
1-3
.42
-7
.91
0.
84
0.
33
-9
.13
37
-1.8
5
-0.
16
-0.5
3 -3
.16
07
.66
0.
82
0.
30
-8
.57
38
-2
.72
0.07
-0.1
7 -4
.23
-7
.78
0.
67
0.
16
-9
.84
39
-2
.11
-
0.07
-0.5
9-2
.19
-8
.04
0.
63
0.
10
-8
.49
40
-2
.49
0.08
-0
.30
-2.4
3
-8.2
5 0.
63
0.
10
-8
.77
41
-2
.76
-
0.15
-0
.75
-3.0
7
-8.4
6
0.61
0.08
-9.4
942
-2.5
80.
40
0.
41
-3.2
8
-7.8
6
0.68
0.16
-9.1
943
-2.7
50.
38
0.
41-3
.79
-8
.18
0.68
0.38
-9.9
844
-2.2
90.
12-0
.14
-2.4
8
-7.6
4 0.
65
0.
13
-8
.44
45
-2
.17
0.11
-0.2
4-2
.15
-7
.96
0.
51
-
0.03
-8.5
146
-2.0
50.
02
-0.4
1-2
.09
-8
.01
0.53
-0.
01
-8.3
147
-1.9
1
-0.
04
-0.5
2-2
.12
-7
.92
0.
52
-
0.01
-8
.17
48
-2
.04
0.31
-0
.38
-2.1
1
-8.0
1 0.
52
-
0.02
-8
.26
49
-2
.14
-
0.10
-0
.68
-2.1
9
-7.9
3 0.
54
-
0.10
-8
.44
50
-2
.32
0.15
-0
.07
-2.1
9
-8.2
6 0.
51
-
0.01
-8
.73
51
-2
.52
0.14
-0
.01
-3
.85
-7
.93
0.67
0.1
4
-9.5
8
mea
n
-2.3
30.
07
-0.3
0 -2
.86
-7
.98
0.63
0.1
1
-8.9
1
Was
atch
Ran
ge G
roun
d-W
ater
Sys
tem
s52
-2
.58
-0.8
1-1
.82
-2.6
1-8
.33
-
-
-8
.37
53
-2
.53
-1.3
3-2
.79
-2.9
1
-8.4
9 -
-
-8.7
454
-3.3
3-0
.38
-1.2
9-3
.02
-9
.06
-
-
-9.5
955
-2.8
0-0
.78
-2.0
8-2
.82
-8
.86
-
-
-9
.19
mea
n-2
.81
-0.8
3-2
.00
-2.8
4
-8.6
9
-
-
-8
.97
The
rmal
Gro
und
Wat
er56
-2
.51
1.18
2.16
-0.7
2-4
.17
0.06
1.
18-4
.99
57
-2.2
3
1.
162.
03-0
.54
-3.3
2 0.
21
1.16
-4
.79
58
-1.0
1
0.11
-0.8
5-1
.20
-2.9
6 0.
28
-
0.09
-5
.35
59
-1.5
2
0.39
-0.3
9-1
.63
-3.6
6 0.
430.
06
-5.9
360
-1
.34
0.
380.
47-1
.97
-3.7
7 0.
19
0.81
-6
.68
mea
n
-1.7
2
0.64
0.68
-1.2
1-3
.58
0.23
0.
62
-5.5
5
____
_1
Satu
ratio
n: lo
g SI
= 0
.00
±0.
1
Tabl
e 6.
Cal
cula
ted
log
PC
O2
and
satu
rati
on i
ndic
es1
(SI)
of
wat
er s
ampl
es c
olle
cted
on
Ant
elop
e Is
land
and
adj
acen
t ar
eas.

Hydrogeology of Antelope Island, Great Salt Lake, Utah - Mayo, Klauk
factors other than calcite dissolution control the Ca2+ concen-trations. Possible controls are discussed later. Because thelake level has been below most island crystalline systemspring discharge elevations for the past 15,000 years (Spencerand others, 1984), ample time has passed for the more activebedrock ground-water flow systems to leach minor amountsof highly soluble residual material from fractures in the crys-talline rocks. Additionally, the mean δ34S of island crystallinesystem ground waters suggests a reduced sulfur source ratherthan the dissolution of an oxidized sulfur source such as gyp-sum.
Discharge elevations preclude modern brine from mixingwith island sedimentary system ground waters which dis-charge as springs. However, late Pleistocene and historicfluctuations of lake levels (Currey and others, 1984; Spencerand others, 1985; Doelling and others, 1990) could haveinfluenced the Na+, Cl-, and SO4
2- content of ground water inisland sedimentary and southern Farmington Bay systems bybrine diffusion, infiltration, or mineral precipitation. Bothhalite and mirabilite have precipitated from lake brine since
1930 (Eardley, 1966; Whelan, 1973; Butts,1980), and since 1955, halite precipitationhas controlled the lake's Cl- content (Spencerand others, 1985).
Solute data of water from both theWasatch Range system and the Weber Deltaaquifer tend to plot near the Ca-Mg-HCO3
domain in the trilinear diagram (figure 4).Southern Farmington Bay system groundwater is of the Na+ - Cl- type and island sed-imentary system ground water has an affini-ty for the Na+ - Cl- type (figure 4). The Na+
and Cl- concentrations and stable sulfur iso-topic data suggest interaction between south-ern Farmington Bay system ground waterand diagenetic mineral precipitates and/orlake brine and interactions between islandsedimentary system ground water and diage-netic mineral precipitates.
It is reasonable to assume that Cl- andSO4
2- are conservative ions in study areaground waters because all ground waters areundersaturated with respect to all mineralscontaining these species (table 3). Otherspecies, particularly cations, cannot be con-sidered conservative because of possible ionexchange reactions or precipitation due to
mineral supersaturation. Thus, the relationships betweenSO4
2- vs. Cl- concentrations in figure 5 may be used to evalu-ate both Cl- and SO4
2- sources. In the figure, island sedimen-tary and southern Farmington Bay system ground waters plotaway from the precipitation-brine mixing line, suggesting thatmixing with brine is minimal at most locations.
The relationship between island and southern FarmingtonBay system ground-water SO4
2- concentrations (figure 5) isalso worthy of note. The mean SO4
2- concentration of Na-Clpoor southern Farmington Bay system ground water is onlymarginally greater than the mean in Salt Lake City precipita-tion (Christensen and others, 1984) and is an order of magni-tude less than the mean SO4
2- concentration of island groundwaters (tables 3 and 7).
The low SO42- content of most southern Farmington Bay
system ground waters is an enigma because the ground waterflows through offshore Lake Bonneville sediments. Observedconcentrations suggest either a paucity of sulfate-bearingminerals in the ground-water system or sulfate reduction.
The Geology of Antelope Island Utah Geological Survey144
Figure 4. Trilinear diagram of ground-water analyses of water samples collected in thevicinity of Antelope Island.
meq l-1
_____________________________________________________________________ Location Ca2+ Mg2+ Na+ K+ HCO3
- SO42- Cl-
_____________________________________________________________________________________________Northern Sierra Nevada1 0.019 0.007 0.019 0.008 0.048 0.019 0.014Salt Lake City2 0.118 0.031 0.057 0.007 0.084 0.112 0.049_____1 After Feth and others (1964). 2 After Christensen and others (1984).
Table 7. Summary of solute concentrations in northern Sierra Nevada and Salt Lake City, Utah precipitation.

Hydrogeology of Antelope Island, Great Salt Lake, Utah - Mayo, Klauk
The ground-water system should contain sulfate-bearing min-erals but, to date, no field or laboratory data indicate sulfatereduction or another process in the ground-water systemwhich would reduce the sulfur content.
Contribution from Circulating Thermal Water
Thermal ground waters discharge 20 miles (32 km) eastof Antelope Island along normal faults at the base of theWasatch Range (Goode, 1978; Cole 1981, 1983). The ther-mal systems are believed to be recharged high in the WasatchRange and, based on geochemical thermometers, to attainwater temperatures as great as 248°F (120°C) and to circulateto depths as great as 2 miles (3 km) (Cole, 1981, 1983).Thermal discharges are of the Na+ - Cl- type (figure 4) andhave mean Na+, Cl-, SO4
2- concentrations of about 158.5,183.2, and 7.6 meq 1-1, respectively (table 3). Mixing of ther-mal ground waters with ground water from the overlying,shallow, cool-temperature Weber Delta aquifer has been notednear the base of the Wasatch Range (Cole, 1981).
Mixing of thermal fluids with island ground water is apossible source of the high Na+, Cl-, and SO4
2- concentrationsobserved in island ground waters. Thermal ground watercould migrate along sedimentary aquifers beneath the GreatSalt Lake or upward along normal faults cutting the island. Amean elevation difference >2,000 feet (>600 m) between the
crest of the Wasatch Range and the crest of theisland could provide an adequate hydraulic gradient.
The δ2H, δ18O, and δ34S compositions of islandground water do not preclude nor suggest mixingwith thermal ground water, because only smallamounts of thermal water are needed to mix withprecipitation to obtain the stable isotopic and totalsolute concentrations observed in island groundwaters. However, the following analysis suggeststhermal contributions are unlikely.
Neither island crystalline or sedimentary systemground waters plot along the thermal-precipitationwater mixing line in figure 5. PHREEQE (Parkhurstand others, 1980) calculations demonstrate that ther-mal ground waters will remain undersaturated withrespect to Cl- and SO4
2- bearing minerals whencooled to island ground-water discharge tempera-tures or when mixed with precipitation. Therefore,mineral precipitation cannot occur and the mixedwater must receive similar contributions of Cl- con-centrations in island crystalline, Na-Cl poor sedi-mentary and Na-Cl rich sedimentary system watersrequire thermal ground-water contributions of 1.6and 3.0 and 14.1 percent, respectively, whereasobserved mean SO4
2- concentrations require thermalground-water contributions of 15.5, 14.7, and 40.4percent, respectively. These percentages are basedon the assumption that unmixed island crystallineand sedimentary system ground waters are similarto their ground-water counterparts in WasatchRange systems and the Weber Delta aquifer. If thesouthern Farmington Bay system is the appropriatecounterpart for the island sedimentary system, mix-ing would require the unlikely proposition that ther-mal ground-water SO4
2- mixes and thermal ground-water Cl- does not.
Contribution From Non-thermal Ground WaterBeneath the Great Salt Lake
Ground-water systems in the East Shore area extendbeneath the Great Salt Lake and ground-water movement isgenerally eastward toward Antelope Island (Bolke and Wad-dell, 1972). The East Shore area is located between theWeber Delta and Salt Lake City. Bolke and Waddell (1972)identified a Na+ - Cl- type water from the 423 to 475 foot(129-145 m) depth interval in a flowing artesian well whichtapped the ground-water system beneath the lake. The wellwas located 0.5 miles (0.8 km) northeast of Antelope Islandand was constructed on the causeway connecting AntelopeIsland with the east shore mainland.
Based on a cursory examination of the water quality fromthe well and from springs located at the north end of theisland, Bolke and Waddell (1972) suggested that some Ante-lope Island ground water may contribute to ground-water sys-tems beneath the Great Salt Lake. Because the hydraulichead of the aquifer beneath the lake is above lake level, it ispossible that ground-water systems beneath the lake may con-tribute to island ground-water systems. In 1969 when thewater quality sample was collected, the well free flowed 280
The Geology of Antelope IslandMiscellaneous Publication 00-1 145
Figure 5. Plot of Cl- vs. SO42- concentrations in water samples collected in the vicin-
ity of Antelope Island. Dashed lines represent linear mixing of precipitation withgeothermal and lake-brine sources.

Hydrogeology of Antelope Island, Great Salt Lake, Utah - Mayo, Klauk
gallons/minute (gpm) (17.71s-1) and the static head rose to anelevation of about 4,250 feet (1,295 m), which is above thedischarge elevation of several island sedimentary systemsprings (table 1).
Although the Na+ and Cl- contents of the two ground-water systems are similar, SO4
2- data suggest that ground-water systems beneath the Great Salt Lake do not contributesignificant quantities of water to island sedimentary ground-water systems. The SO4
2- content of the well water is only0.25 meq l-1, whereas the mean SO4
2- island sedimentary sys-tem which discharges below 4,250 feet (1,295 m) is 1.64 meq1-1.
Evaporated Soil Water from Recent Precipitation
Mean Na+, Cl-, and SO42- concentrations in Salt Lake City
precipitation (table 7) are 0.057, 0.049, and 0.112 meq l-1,respectively (Christensen and others, 1984). Chemical com-position of precipitation data are not available for AntelopeIsland. Mean Na+, Cl-, and SO4
2- loads of Antelope Islandground waters are considerably greater than those of SaltLake City precipitation. It is not unreasonable to expect thesolute content of recharge water to be enriched with respectto precipitation due to the concentrating effect of evapotran-spiration (E-T). When the anticipated effect of aquifer miner-al dissolution is accounted for, the ratios of conservative ionsshould be similar in precipitation and recharge water. TheWasatch Range system and Weber Delta aquifer are theassumed counterparts for the island crystalline and sedimenta-ry aquifers, respectively. The southern Farmington Bay sys-tem is not appropriate because of its low SO4
2- content.Island bedrock, Na-Cl poor sedimentary, and Na-Cl rich sedi-mentary system ground waters have Na+ plus Cl- concentra-tions about 62, 98, and 458 times greater, respectively, thanSalt Lake City precipitation, whereas SO4
2- concentrations inrespective island ground waters are only about 10, 10, and 27times as great. Differences in mean Cl-/SO4
2- ratios furthersuggest that the E-T concentration of recharge precipitationalone cannot account for the high Na+, Cl-, and SO4
2- concen-trations observed in island ground waters. The ratios are 0.44in Salt Lake City precipitation, 2.1 in island bedrock systems,4.3 in Na-Cl poor island sedimentary systems, and 22.9 inNa-CI rich island sedimentary systems. Mean Na+/SO4
2-
ratios are similar to mean Cl- /SO42- ratios.
Meteoric and Aerosol Contributions
Snow in the northern Sierra Nevada Range has meanNa+, Cl-, and SO4
2- concentrations of 0.019, 0.014, and 0.019meq 1-1, respectively (Feth and others, 1964). Precipitationdata from 6 stations located at elevations below the Bon-neville shoreline near Salt Lake City show mean solute con-centrations up to 6 times of those in precipitation in the SierraNevada Range (table 7). Storm tracks affecting the Great SaltLake area are predominantly from the Pacific Ocean located600 miles to the west (Richardson, 1974). The Cl-/Na+ ratioin sea water is about 1.8. The Cl- /Na+ ratio in Pacific stormprecipitation decreases from about 1.4 along the California
coast to about 0.5 along the eastern edge of the Sierra NevadaRange. In the immediate area of the Great Salt Lake, anincrease in the ratio to about 1.0 is attributed by Junge andWerby (1958) to the effects of wind-blown dust and lakebrines. Island crystalline systems, Na-Cl poor island sedi-mentary systems, and Na-Cl rich island sedimentary systemshave Cl-/Na+ ratios of about 0.8, 1, and 1.1, respectively.
High Na+, Cl-, and SO42- concentrations in ground waters
have been attributed to cyclic salting (i.e., salt input to groundwater from precipitation containing ocean, saline lake andplaya-derived aerosols, sea spray, etc.) and dust-derivedaerosols associated with dry fall and precipitation. Precipita-tion from sea salt sources, such as the ocean or the Great SaltLake, tend to be enriched in Na+ and Cl- ions with respect torain from atmospheric moisture which is derived from freshwater sources. However, SO4
2- in precipitation tends to havea terrestrial rather than saline water origin (Berner and Bern-er, 1987; Munger, 1982). In Australia, Evans (1982),Hingston and Gailitis (1976), and Van Dijk (1969) demon-strated significant contributions to the Na+ and Cl- content ofground waters from cyclic salt in precipitation in low volumerecharge regimes and from sea spray in the form of dry fall.In the Edwards Aquifer, Texas, Rightmire and others (1974)attributed a mean ground-water SO4
2- concentration of 0.4meq 1-1 and concentrations as great as 1.7 meq 1-1 to dustaerosols.
Sources of cyclic salt and dust borne aerosols in islandrecharge water include dust blown off large salt flats and soilsdeveloped on Lake Bonneville evaporite-rich sediments in thedesert west of the Great Salt Lake, airborne salts released aswhite cap spray accompanying wind storms on the lake, andcyclic salt in precipitation originating as evaporated lakewater.
GEOCHEMICAL EVOLUTION
A geochemical evolution model of island ground watermust account for the observed solute and isotopic differencesbetween the island ground-water system types as well as dif-ferences between island ground water and their ground-watersystem counterparts located elsewhere. The δ2H, δ18O, and3H data indicate that island ground waters are recharged frommodern meteoric water containing a component of evaporatedGreat Salt Lake water. The δ13C data suggest island groundwaters acquire carbon from the congruent, stoichiometric dis-solution of soil zone carbonate minerals in the presence ofsoil zone CO2 (gas).
Solute and isotopic data suggest that the chemical evolu-tion of island ground water is dependent upon more than oneof the following mechanisms: 1. Dissolution of aquifer minerals.
2. Mixing with Great Salt Lake brine, geothermal water orshallow artesian aquifer ground water beneath the GreatSalt Lake.
3. The distribution of solutes in precipitation and wind-blown aerosols.
However, mixing lines (figure 5) suggest that it is unlike-ly that modern lake brines or geothermal fluids contribute sig-nificantly to the solute content of island ground water. The
The Geology of Antelope Island Utah Geological Survey146

Hydrogeology of A
ntelope Island, Great Salt L
ake, Utah - M
ayo, Klauk
The G
eology of Antelope Island
Miscellaneous P
ublication 00-1147
Table 8. Potential contribution of dissolved Cl- and SO42- in Antelope Island ground waters from the dissolution of aquifer minerals, precipitation, and wind-borne aerosols.
Chloride Sources
Meteoric and Aerosol Contributions
Alternative A2 Alternative B3 (X5) Alternative C4 (X10)Aquifer Contribution ____________________________________________________________________________________
Precipitation Blown Precipitation Blown Precipitation Blown Island Ground Mean Conc. Aerosol Aerosol Aerosol Water System (meq l-1) Source1 meq l-1 % meq l-1 % meq l-1 % meq l-1 % meq l-1 % meq l-1 % meq l-1 %
Crystalline 3.19 WR 0.20 6.3 0.05 1.6 2.94 92.1 0.25 7.8 2.74 85.9 0.49 15.4 2.50 78.3 Na-Cl Poor Sed. 5.90 WA 0.50 8.5 0.05 0.09 5.35 90.6 0.25 4.3 5.15 87.2 0.49 8.3 4.91 83.2 Na-Cl Poor Sed. 5.90 SFB 10.25 170.75 0 0 0 0 0 0 0 0 0 0 0 0
Sulfate Sources
Meteoric and Aerosol Contributions
Alternative A2 Alternative B3 (X5) Alternative C4 (X10)Aquifer Contribution ________________________________________________________________________________
Precipitation Blown Precipitation Blown Precipitation Blown Island Ground Mean Conc. Aerosol Aerosol Aerosol Water System (meq l-1) Source1 meq l-1 % meq l-1 % meq l-1 % meq l-1 % meq l-1 % meq l-1 % meq l-1 %
Crystalline 1.52 WR 0.35 23.0 0.11 7.2 1.06 59.8 0.56 36.9 0.61 40.1 1.12 73.7 0.05 3.3 Na-Cl Poor Sed. 1.58 WA 0.27 19.6 0.11 8.0 1.00 72.4 0.56 40.6 0.55 39.9 1.12 81.2 0 0 Na-Cl Poor Sed. 1.58 SFB 10.12 8.7 0.11 8.0 1.15 83.3 0.56 40.6 0.70 50.7 1.12 81.2 0.14 10.1
____1 Mean concentration in Wasatch Range systems (WR), Weber Delta aquifer (WDA), and southern Farmington Bay systems (SFB). 2 Contribution from precipitation as measured near Salt Lake City and wind-blown aerosols, when precipitation is not concentrated by E-T. 3 Contribution from precipitation as measured near Salt Lake City and wind-blown aerosols, when precipitation is concentrated by an E-T factor of 5.4 Contribution from precipitation as measured near Salt Lake City and wind-blown aerosols, when precipitation is concentrated by an E-T factor of 10.5 Potential contribution from aquifer source exceeds ground-water content, so alternatives not possible.

Hydrogeology of Antelope Island, Great Salt Lake, Utah - Mayo, Klauk
chemical evolution of island ground water must, therefore,involve the accumulation of ions from the dissolution ofaquifer minerals, solutes in precipitation, and wind-blowndust. It is not our intent to present a quantitatively uniquemechanism; rather, it is to demonstrate a plausible mix ofsolute sources consistent with observations.
The excess Cl- and SO42- content of island crystalline and
Na-Cl poor sedimentary system ground waters, with respectto their mainland and southern Farmington Bay system coun-terparts, can be accounted for by varying mixes of precipita-tion and aerosol sources (table 8). Contributions of Cl- andSO4
2- from the dissolution of aquifer minerals are assumed toequal the mean concentrations of their aquifer counterparts.The southern Farmington Bay system is a less likely miner-alogical counterpart than is the Weber Delta aquifer, becausethe southern Farmington Bay system contains appreciablequantities of lake-bottom sediments and the ground water inthe southern Farmington Bay system has a very low meanSO4
2- content and a mean Cl- content approximately two tothree times as great as the mean content of island groundwater.
Solutes in Salt Lake City precipitation, concentrated byan island E-T factor of 10, can account for most excess SO4
2-
and minor amounts of Cl- observed in island ground waters.Reducing the E-T concentration factor to 5 requires a sub-stantial percentage increase in windblown SO4
2- but a muchsmaller percentage increase in windblown Cl-. If solutes arenot concentrated by island E-T, approximately 90 percent ofthe excess Cl- and 60 to 70 percent of the excess SO4
2- mustbe accounted for by wind-blown dust and white cap spray,dry fall deposition, or precipitation of brine.
The lack of precipitation and dry-fall depositional datafrom the island makes it difficult to quantify the depositionalload that these sources contribute to island ground water.Wind storms often blow up clouds of salt dust from the WestDesert prior to precipitation events (Eubank and Brough,1980). When combined with light rain, the salt crystals forma precipitation brine responsible for dozens of power linefires each year in the West Desert. Because the island islocated closer to particulate and aerosol sources (i.e., the saltflats of the West Desert, the sea spray of Great Salt Lake, andindustrial smelter plumes) than are the precipitation/dry fallmonitoring stations near Salt Lake City, it is reasonable toexpect the depositional load on the island to be somewhatgreater than that observed in Salt Lake City.
Regardless of the E-T concentration factor, the calculatedcontribution attributed to windblown Cl- in the island sedi-mentary systems is about two times as great as that of islandcrystalline systems, whereas the windblown SO4
2- contribu-tion remains about equal in both ground-water systems. Theidea of greater windblown Cl- contributions to lower eleva-tion systems (i.e., the island sedimentary system) is consistentwith the anticipated stratification of sea spray and saltdustduring wind storms. The greatest concentration of large saltparticles and chloride-rich sea spray should be near lakelevel. However, stratification of windblown Cl- may nottotally explain the elevated Cl- content of island sedimentarysystem ground water. Most island sedimentary systems arelocated on the prevailing lee side (east side) of the island
where the effects of windblown Cl- stratification should bereduced. Some of the apparent excess Cl- may be the resultof brine diffusion, infiltration, or mineral precipitation whenlake levels were previously higher. The local occurrence ofNa-Cl rich island sedimentary ground-water systems, at thesoutheast edge of the island, suggests such sources.
Although a mix of precipitation, dry fall, and WestDesert wind storm dust contributions can account for mostexcess Cl- and SO4
2- concentrations in island ground waterand the δ34S (table 1) of island sedimentary systems (meanδ34S= +6.7 0/00), these sources cannot account for the δ34S ofisland crystalline system ground water (mean δ34S= +1.3 0/00).Because the SO4
2- content of island crystalline system groundwater is considerably greater than the non-island ground-water systems, the δ34S of island crystalline system groundwater requires more in situ sulfur dissolution than anticipatedor an external source of reduced sulfur in addition to the iso-topically heavy sulfur contributed from sea spray and WestDesert dust. Nearby smelter and other industrial plumes are apotential source of reduced sulfur. Greater contributions ofisotopically light sulfur to the island crystalline systems,which are located at the higher elevations, may result fromthe stratified deposition of sea spray, sea fog, and dust stormdeposited Cl- and SO4
2- and smelter plume sulfur. Theisland's higher elevations are more likely to intercept smelterplume gases than are the lower elevations.
Nonconservative cations, such as Na+, Ca2+, and Mg2+,are also found in greater concentrations in island groundwaters than in their aquifer counterparts located to the east.PHREEQE (Parkhurst and others, 1980) calculations atground-water discharge temperatures indicate that calcite anddolomite supersaturation of island ground waters cannot beattributed to the common ion and ionic strength effects asso-ciated with the introduction of windblown calcite, dolomite,gypsum, and halite. Observed supersaturation may be attrib-uted to wet and dry fall of more soluble saline lake mineralspecies such as epsomite (MgSO4
.7H2O), glauberite(Na2Ca(SO4)2), magnesite (MgCO3), mirabilite(Na2SO4
.10H2O), thenardite (Na2SO4), and tychite(Na6Mg2(SO4)(CO3)4), and to aerosol contamination fromindustrial stacks in the West Desert.
With existing data, it is not possible to assign percentagecontributions to natural and air pollution sources of theobserved differences in island crystalline and sedimentarysystem ground-water δ34S contents and to the apparent excessof nonconservative cations. The island's crystalline bedrockitself is not highly mineralized; however, the island is a linearfault block which is parallel to and tectonically related to thehighly mineralized fault blocks to the south. The island isalso located in the pathway of smelter and other industrialplumes originating in Magna and the West Desert which carrysulfur and other elements.
Quantification of the contribution to island ground-waterchemistry from natural and air pollution sources of aerosols,dust, and sea spray, requires additional study. Such a studywould entail soil sampling and synoptic snow, wet-fall anddry-fall monitoring on the island.
The Geology of Antelope Island Utah Geological Survey148

Hydrogeology of Antelope Island, Great Salt Lake, Utah - Mayo, Klauk
REFERENCES CITED
Berner, E.K., and Berner, R.A., 1987, The global water cycle:Prentice Hall, Englewood Cliffs, New Jersey, 397 p.
Bolke, E.L., and Waddell, K.M., 1972, Ground-water condi-tions in the East Shore area, Box Elder, Davis and WeberCounties, Utah 1960-1969: Utah Department of NaturalResources Technical Publication 35, 59 p.
Butts, D.S., 1980, Factors affecting the concentration of GreatSalt Lake brines, in Gwynn, J.W., editor, Great Salt Lake- A scientific, historical and economic overview: UtahGeological and Mineralogical Survey Bulletin 116, p.116-168.
Christensen, RC., Stephens, D.W., Pyper, G.E., McCormack,H.F., and Weigel, J.F., 1984, Quality and quantity ofrunoff and atmospheric deposition in urban areas of SaltLake County, Utah: U.S. Geological Survey Water-Resources Investigation Report 84-4011, 223 p.
Cole, D.R., 1981, Isotopic and ion chemistry of waters in theEast Shore area, northern Utah: Geothermal ResearchCouncil, Transactions, v. 5, p. 63-66.
Cole, D.R., 1982, Tracing fluid sources in the East Shorearea, Utah: Groundwater, v. 20, no. 5, p. 586-593.
Cole, D.R., 1983, Chemical and isotopic investigations ofwarm springs associated with normal faults in Utah:Journal of Volcanology and Geothermal Research, v. 16,p. 65-98.
Craig, H., 1961, Isotopic variations in meteoric waters: Sci-ence, v. 133, p. 1702-1703.
---1963, The isotopic geochemistry of water and carbon ingeothermal areas, in Nuclear geology on geothermalareas; Spoleto, Italy, September 9-13, 1963: Cons. Naz.Ric. (Nuclear Geology Laboratory), Pisa, 53 p.
Currey, D.R., Atwood, Genevieve, and Mabey, D.R., 1984,Major levels of Great Salt Lake and Lake Bonneville:Utah Geological and Mineralogical Survey Map 73, scale1:750,000.
Doelling, H.H., Willis, G.C., Jensen, M.E., Hecker, Suzanne,Case, W.F., and Hand, J.S., 1990, Geologic map of Ante-lope Island, Davis County Utah: Utah Geological andMineral Survey, Map 127, 27 p., scale 1:24,000.
Eardley, A.J., 1966, Sediments of Great Salt Lake, in Stokes,W.L., editor, Great Salt Lake: Utah Geological Society,Guidebook to Geology of Utah, number 20, p. 105-120.
Eubank, M.E., and Brough, R.C., 1980, The Great Salt Lakeand its influence on the weather, in Gwynn, J.W., editor,Great Salt Lake - A scientific, historical and economicoverview: Utah Geological and Mineralogical SurveyBulletin 116, p. 279-283.
Evans, W.R., 1982, Factors affecting water quality in aregional fractured rock aquifer: Australian WaterResearch Council, Conference on Groundwater in Frac-tured Rock, Conference Series 5, p. 57-69.
Faure, Gunter, 1986, Isotope Geology, 2nd edition: NewYork, Wiley and Sons, 589 p.
Feth, J.H., Rogers, S.M., and Roberson, C.E., 1964, Chemical
composition of snow in the northern Sierra Nevada andother areas: U.S. Geological Survey Water-Supply Paper1535-J, 39 p.
Feth, J.H., Barker, D.A., Moore, L.G., Brown, R.J., and Veirs,C.E., 1966, Lake Bonneville; geology and hydrology ofthe Weber Delta District, including Ogden, Utah: U.S.Geological Survey Professional Papers 518, 74 p.
Fontes, J.C., 1980, Environmental isotopes in groundwaterhydrology, in Fritz, P. and Fontes, J.C., editors, Hand-book on environmental isotope geochemistry, volume 1,The terrestrial environment: Elsevier, Amsterdam, p. 75-140.
Fritz, Peter, Reardon, E.J., Barker, J., Brown, R.M., Cherry,J.A., Killey, R.W.D., and McNaughton, D., 1978, Thecarbon isotope geochemistry of a small ground-watersystem in northeastern Ontario: Water ResourcesResearch, v. 14, no. 6, p. 1059-1067.
Goode, H.D., 1978, Thermal waters of Utah: Utah Geologi-cal and Mineral Survey Report of Investigations 129, 183p.
Hingston, F.J., and Gailitis, V., 1976, The geographic varia-tion of salt precipitated over Western Australia: Aus-tralian Journal of Soil Research, v. 14, p. 319-335.
Hintze, L.F., 1988, Geologic History of Utah: BrighamYoung University Geology Studies, v. 20, part 3, 181 p.
Holser, W.T., and Kaplan, I.R., 1966, Isotope geochemistry ofsedimentary sulfur: Chemical Geology, v. 1, p. 93-135.
Junge, C.E., and Werby, R.T., 1958, The concentration ofchloride, sodium, potassium, calcium and sulfate in rain-water over the United States: Journal of Meteorology, v.15, p. 417-425.
Loucks, M.D., Mayo, A.L., and Brimhall, W.H., 1989, Faultcontrol of groundwater flow in the central WasatchRange, Utah, evaluated by geochemical means: Geologi-cal Society of America Abstract with Programs, v. 21, no.5., p. 108.
Marine, I.W., and Price, D., 1964, Geology and ground-waterresources of the Jordan Valley, Utah: Utah Geologicaland Mineralogical Survey, Water Resource Bulletin 7, 68p.
Mayo, A.L., and Loucks, M.D., 1992, Ground-water flowsystems in the central Wasatch Range, Utah: Utah Geo-logical Survey, Contract Report 92-6, 116 p.
Muller, A.B., and Mayo, A.L., 1986, 13C variation in lime-stone on an aquifer-wide scale and its effects on ground-water 14C dating models: Radiocarbon, v. 28, no. 3, p.1041-1054.
Munger, J.W., 1982, Chemistry of atmospheric precipitationin the north central United States - Influence of sulfate,nitrate, ammonia and calcareous soil particulates:Atmospheric Environment, v. 16, no. 7, p. 1633-1645.
Nielsen, P.J., and Mayo, A.L., 1989, Chemical and isotopicinvestigation of the cause of acid and neutral mine dis-charges in the central Wasatch Range, Utah, in Cordy,G.E., editor, Geology and hydrology of hazardous-wastemining-waste, and repository sites in Utah: Utah Geo-
The Geology of Antelope IslandMiscellaneous Publication 00-1 149
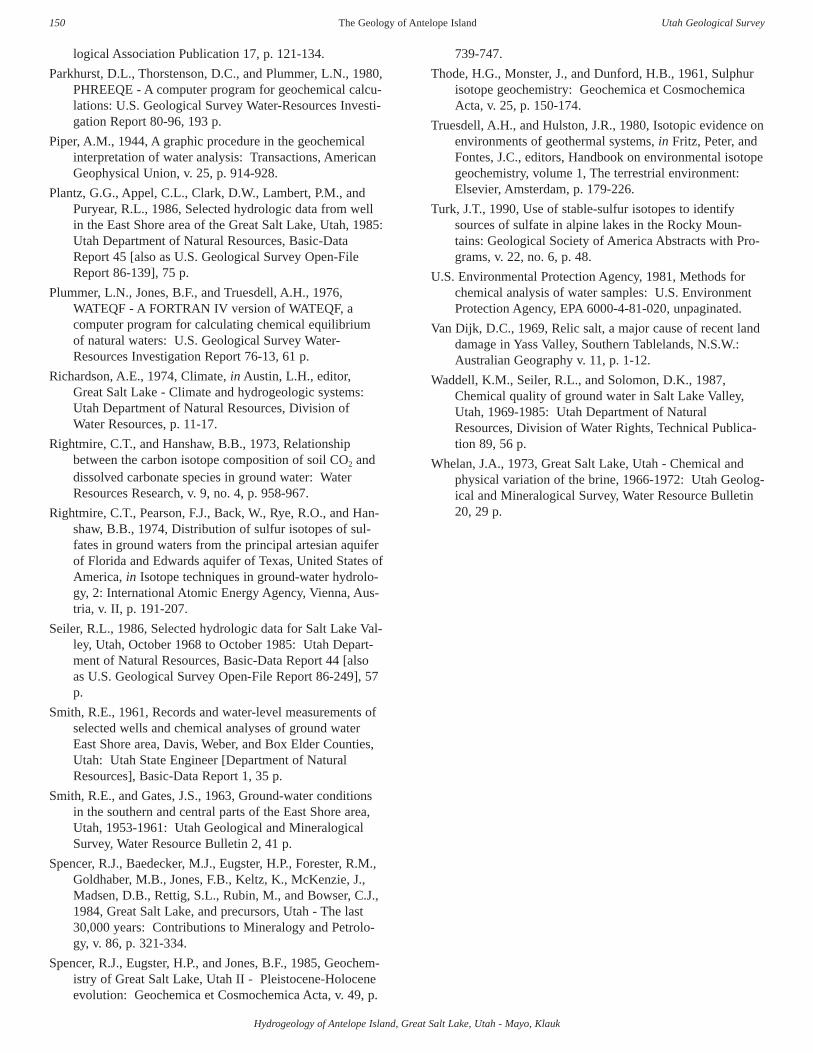
logical Association Publication 17, p. 121-134.
Parkhurst, D.L., Thorstenson, D.C., and Plummer, L.N., 1980,PHREEQE - A computer program for geochemical calcu-lations: U.S. Geological Survey Water-Resources Investi-gation Report 80-96, 193 p.
Piper, A.M., 1944, A graphic procedure in the geochemicalinterpretation of water analysis: Transactions, AmericanGeophysical Union, v. 25, p. 914-928.
Plantz, G.G., Appel, C.L., Clark, D.W., Lambert, P.M., andPuryear, R.L., 1986, Selected hydrologic data from wellin the East Shore area of the Great Salt Lake, Utah, 1985:Utah Department of Natural Resources, Basic-DataReport 45 [also as U.S. Geological Survey Open-FileReport 86-139], 75 p.
Plummer, L.N., Jones, B.F., and Truesdell, A.H., 1976,WATEQF - A FORTRAN IV version of WATEQF, acomputer program for calculating chemical equilibriumof natural waters: U.S. Geological Survey Water-Resources Investigation Report 76-13, 61 p.
Richardson, A.E., 1974, Climate, in Austin, L.H., editor,Great Salt Lake - Climate and hydrogeologic systems:Utah Department of Natural Resources, Division ofWater Resources, p. 11-17.
Rightmire, C.T., and Hanshaw, B.B., 1973, Relationshipbetween the carbon isotope composition of soil CO2 anddissolved carbonate species in ground water: WaterResources Research, v. 9, no. 4, p. 958-967.
Rightmire, C.T., Pearson, F.J., Back, W., Rye, R.O., and Han-shaw, B.B., 1974, Distribution of sulfur isotopes of sul-fates in ground waters from the principal artesian aquiferof Florida and Edwards aquifer of Texas, United States ofAmerica, in Isotope techniques in ground-water hydrolo-gy, 2: International Atomic Energy Agency, Vienna, Aus-tria, v. II, p. 191-207.
Seiler, R.L., 1986, Selected hydrologic data for Salt Lake Val-ley, Utah, October 1968 to October 1985: Utah Depart-ment of Natural Resources, Basic-Data Report 44 [alsoas U.S. Geological Survey Open-File Report 86-249], 57p.
Smith, R.E., 1961, Records and water-level measurements ofselected wells and chemical analyses of ground waterEast Shore area, Davis, Weber, and Box Elder Counties,Utah: Utah State Engineer [Department of NaturalResources], Basic-Data Report 1, 35 p.
Smith, R.E., and Gates, J.S., 1963, Ground-water conditionsin the southern and central parts of the East Shore area,Utah, 1953-1961: Utah Geological and MineralogicalSurvey, Water Resource Bulletin 2, 41 p.
Spencer, R.J., Baedecker, M.J., Eugster, H.P., Forester, R.M.,Goldhaber, M.B., Jones, F.B., Keltz, K., McKenzie, J.,Madsen, D.B., Rettig, S.L., Rubin, M., and Bowser, C.J.,1984, Great Salt Lake, and precursors, Utah - The last30,000 years: Contributions to Mineralogy and Petrolo-gy, v. 86, p. 321-334.
Spencer, R.J., Eugster, H.P., and Jones, B.F., 1985, Geochem-istry of Great Salt Lake, Utah II - Pleistocene-Holoceneevolution: Geochemica et Cosmochemica Acta, v. 49, p.
739-747.
Thode, H.G., Monster, J., and Dunford, H.B., 1961, Sulphurisotope geochemistry: Geochemica et CosmochemicaActa, v. 25, p. 150-174.
Truesdell, A.H., and Hulston, J.R., 1980, Isotopic evidence onenvironments of geothermal systems, in Fritz, Peter, andFontes, J.C., editors, Handbook on environmental isotopegeochemistry, volume 1, The terrestrial environment:Elsevier, Amsterdam, p. 179-226.
Turk, J.T., 1990, Use of stable-sulfur isotopes to identifysources of sulfate in alpine lakes in the Rocky Moun-tains: Geological Society of America Abstracts with Pro-grams, v. 22, no. 6, p. 48.
U.S. Environmental Protection Agency, 1981, Methods forchemical analysis of water samples: U.S. EnvironmentProtection Agency, EPA 6000-4-81-020, unpaginated.
Van Dijk, D.C., 1969, Relic salt, a major cause of recent landdamage in Yass Valley, Southern Tablelands, N.S.W.:Australian Geography v. 11, p. 1-12.
Waddell, K.M., Seiler, R.L., and Solomon, D.K., 1987,Chemical quality of ground water in Salt Lake Valley,Utah, 1969-1985: Utah Department of NaturalResources, Division of Water Rights, Technical Publica-tion 89, 56 p.
Whelan, J.A., 1973, Great Salt Lake, Utah - Chemical andphysical variation of the brine, 1966-1972: Utah Geolog-ical and Mineralogical Survey, Water Resource Bulletin20, 29 p.
The Geology of Antelope Island
Hydrogeology of Antelope Island, Great Salt Lake, Utah - Mayo, Klauk
Utah Geological Survey150

ABSTRACT
In the mid-1980s, historically high levels of Great SaltLake caused damage to park facilities on Antelope Island anddestroyed the causeway linking the park to the mainland.Information on the engineering geology of Antelope Islandcan be used to improve park facilities and reduce the riskfrom geologic hazards and poor construction conditions.
Certain characteristics of the geologic environment needto be considered in park planning. During wet cycles, GreatSalt Lake may reach static levels of 4,217 feet (1,285.3 m),and wave- and wind-elevated levels locally may reach 6.5feet (2 m) higher. A probabilistic assessment of the earth-quake ground-shaking hazard along the Wasatch Front indi-cates that peak ground accelerations of approximately 0.20 to0.30 g have a one-in-ten chance of being exceeded in 50years on the island. A slope-failure hazard exists locally incolluvial and Lake Bonneville deposits, along the modernshore, and beneath cliffs. Flash-flood and debris-flow haz-ards exist on alluvial fans. Areas in the southern two-thirdsof the island may have a relatively high potential for radonemission. Particular soil types on the island may be expan-sive, compressible, erodible, impermeable, or susceptible toliquefaction or hydrocompaction.
The distribution of most geologic hazards can be defined,and many locations on the island have conditions suitable forconstruction. Lacustrine sand and gravel deposits are wide-spread and have engineering characteristics that are generallyfavorable for foundations. However, facilities and roads builtclose to the modern shoreline may be susceptible to lakeflooding and erosion, slope failures, shallow ground water,and burial by active sand dunes. Well-graded (poorly sorted)alluvial-fan deposits are generally most suitable for waste-water disposal, although they may be subject to flooding orbe underlain by low-permeability, fine-grained lacustrinedeposits.
INTRODUCTION
The purpose of this study is to provide an overview ofthe geologic and hydrologic characteristics relevant to devel-opment of park facilities on Antelope Island. The informationis meant to be used as a guide for general planning. Adequatesite characterization for facilities would require more detailed
engineering geology studies. The scope of work for thisstudy consisted of a literature review, examination of aerialphotographs and topographic maps, field checking, and limit-ed soil sampling and testing. Much of the basic geologicinformation presented in this paper is based on mapping at1:24,000-scale by Doelling and others (1990).
Pre-existing shoreline park facilities at the north end ofAntelope Island were largely destroyed by rising levels ofGreat Salt Lake during the mid-1980s. Between 1982 and1986, the lake rose approximately 12 feet (3.7 m), to 4,212feet (1,283.8 m)(Arnow and Stephens, 1990), flooding picnicareas and destroying the causeway connecting the island withthe mainland. Following recession of the lake to below 4,205feet, the park was given $750,000 to restore damaged facili-ties on the island, and Davis County spent $3.8 million torebuild the causeway (Tim Smith, manager, Antelope IslandState Park, verbal communication, 1997). The informationpresented in this paper is intended for use in reducing thelikelihood that future lake-level rises and other potential haz-ards, as well as unfavorable construction conditions, willadversely impact future development of the park. Most ofthis report was written in 1990, prior to redevelopment ofpark facilities on Antelope Island.
GEOLOGY
Doelling and others (1990) divided the geologic units onAntelope Island into seven groups: 1) high-grade metamor-phic rocks of the Archean(?) and Lower Proterozoic Farming-ton Canyon Complex; 2) diamictite of the Upper ProterozoicMineral Fork Formation; 3) metasedimentary rocks of theUpper Proterozoic Kelly Canyon Formation; 4) the CambrianTintic Quartzite; 5) sedimentary rocks of an Eocene oryounger conglomeratic unit; 6) mostly tuffaceous rocks of theMiocene-Pliocene Salt Lake Formation; and 7) unconsolidat-ed to partly consolidated Quaternary deposits. As will be dis-cussed in subsequent sections, the various unit lithologies dif-fer in their significance for evaluating engineering geology onthe island.
Rock Units
The Farmington Canyon Complex, which has been divid-ed into eleven map units on Antelope Island (Doelling andothers, 1990), comprises the core of the island (figure 1). It
ENGINEERING GEOLOGY CONSIDERATIONS FOR PARK PLANNING, ANTELOPE ISLAND STATE PARK,
DAVIS COUNTY, UTAH
bySuzanne Hecker1 and William F. Case
Utah Geological Survey
1 now at U.S. Geological Survey, 345 Middlefield Rd., Menlo Park, CA 94025

Engineering geology considerations for park planning, Antelope Island State Park - Hecker, Case
consists dominantly of layered gneiss, migmatitic gneiss,granite, schist, and amphibolite, with steeply southeast-dip-ping foliation. These rocks show extensive ductile deforma-tion and have been locally intruded and silicified. In manyareas of the island, chloritization attributed to retrogrademetamorphism and intense shearing has affected rocks of theFarmington Canyon Complex and younger Proterozoic andCambrian metasedimentary rocks. The shear zones rangefrom a few feet (1 m) to nearly a mile (1.6 km) in width and
generally trend northeast. Joint sets are well developed inmany of the Farmington Canyon Complex rocks.
Upper Proterozoic and Cambrian rocks, found on thenorthern half of Antelope Island (figure 1), are only slightlymetamorphosed and have retained original sedimentary char-acteristics. The Mineral Fork Formation consists of diamic-tite and the Kelley Canyon Formation consists of a lowerdolomite member and an upper slate member. The TinticQuartzite consists of dense quartzite and lesser amounts ofmetaconglomerate. A number of faults have been mappedthat displace rocks of the Mineral Fork and Kelley CanyonFormations, and it is likely that similar faults cut the Farm-ington Canyon Complex and the Tintic Quartzite. Most faultson the island are small-displacement, high-angle normalfaults. Cretaceous(?) quartz veins, generally less than 10 feet(3 m) thick, are common in all of the Precambrian and Cam-brian rocks on Antelope Island (Doelling and others, 1990).
East-dipping Tertiary rocks are exposed along the south-east side (where surficial deposits have been excavated) andat the north tip of the island (figure 1). The conglomeratic
The Geology of Antelope Island Utah Geological Survey152
��������������
�����
�������
�
�
�
�
���� ����
����������������
��
��
�������
�������
�����
����
���
��������������
�
� � ������
� ����������
�
���������� �
�������
�������
��
��
��
�
��
�
�
��
��
��
��
��
��
��
��
��
��
���
��
��
� �
�
�!����� ��� ��� ��"��#�
$���#���%�� ��������
�� �%&��' ��� �
(� %"��� ����!����� �������
)������ ����"�� ���������
� ������������*��+���������������
,�����&��"��� �
������-�!� "�������!�� ���� ��.���� ���(�������
�� ��!�/����0��
)� ����(����� ��1��-�2� -� �(�������
(���� "�� �2� -� �2���3
������������
������������
.����0�
� ��������� ��!��
.�����������!����
�
�
��
����������
�
���� �����
��
����
��
��
��
�
�
�
�
�
Figure 1. General geology of Antelope Island, emphasizing distri-bution of unconsolidated deposits with significance for engineer-ing geology. Simplified from Doelling and others (1990).

Engineering geology considerations for park planning, Antelope Island State Park - Hecker, Case
unit is comprised of coarse conglomerate locally interbeddedwith mudstone, claystone, and limestone. The mudstone andclaystone beds are bentonitic. Rocks identified as the SaltLake Formation consist of tuffaceous sandstone, volcanic ash,tuff, conglomerate, and poorly consolidated sandstone(Doelling and others, 1990).
Unconsolidated Deposits
Unconsolidated Quaternary deposits mantle much ofAntelope Island. Lacustrine processes associated with latePleistocene Lake Bonneville and the much smaller HoloceneGreat Salt Lake deposited sediment and sculpted prominentshorelines up to an elevation of 5,250 ft (1,600 m), acrossroughly 90 percent of the island (Doelling and others, 1990).Four major shorelines (from highest to lowest: Bonneville,Provo, Stansbury, and Gilbert shorelines), which representstillstands of the fluctuating lake between about 27,000 and11,000 years ago, are generally well developed but locallydiscontinuous on the island.
Lacustrine sand and gravel deposits are widespread (fig-ure 1) and vary in grain size, sorting (grading), and cementa-tion. Sand is the most abundant grain-size fraction of mostdeposits. Concentrations of boulders characterize someshoreline deposits; locally well-developed tufa and calcium-carbonate-cemented sands and gravels (beachrock) discontin-uously cap some wave-cut platforms and beach deposits,mainly on and between the Stansbury and Provo shorelines(see Doelling and others, 1990 for shorelines).
Ooids (accretionary sand grains of calcium carbonate)are present in varying amounts in beach deposits of Holoceneage, but are especially abundant along the west side of theisland. In the Unified Soil Classification System(USCS)(table 1), these oolitic deposits are clean, poorly grad-ed (well sorted) sands (SP).
Fine-grained offshore sediments (mixtures of sand, silt,and clay) underlie various thicknesses of regressive beachdeposits and Holocene alluvial fans. These lacustrine fines,although locally exposed in various settings, typically lie at ornear the surface in wave-sheltered areas southeast of bedrockheadlands on the west side of the island (figure 1). Theresults of laboratory analyses of plastic and liquid limits forseveral samples of the finer of two facies of lacustrine finesindicate that the sediments are silt and clay (ML and CL; fig-ure 2).
Holocene lagoons and marshy areas surrounding springs,located mostly near the modern shore on the east side of theisland (figure 1), are sites where organic-rich sand, silt, andclay have accumulated. Typical lagoon and marsh depositsare probably OL soil (table 1), although laboratory data arenot available for these deposits.
Post-Bonneville surficial processes have redepositedlacustrine sediments (as well as sediments derived directlyfrom weathered bedrock) in alluvial fans, eolian dunes, land-slides, and colluvium. Poorly sorted (well graded), dominant-ly coarse-grained alluvium is found in channels of ephemeralstreams and in alluvial fans on broad, gently to moderatelysloping piedmont surfaces (figure 1). This alluvium has beendeposited in successive flash-flood and debris-flow eventsduring Holocene time.
Wind-blown sand is a component of Gilbert-age (about10,000 to 11,000 yr B.P.) and younger shore-zone deposits inbays along the northwestern side of the island (figure 1). Thesand (SP; table 1) is primarily derived from the TinticQuartzite; younger deposits along the present shoreline arerich in ooids. Holocene coastal dunes adjacent to the modernshoreline are sparsely vegetated and active.
The Geology of Antelope IslandMiscellaneous Publication 00-1 153
Major divisions Groupsymbols
Typical names
GW
GP
GM
GC
SW
SP
SM
SC
ML
CL
OL
MH
CH
OH
Pt
Well-graded gravels, gravel-sandmixtures, little or no fines
Poorly graded gravels, gravel-sandmixtures, little or no fines
Silty gravels, gravel-sand-siltmixture
Clayey gravels, gravel-sand-siltmixture
Well-graded sands, gravelly sands,little or no fines
Poorly graded sands, gravellysands, little or no fines
Silty sands, sand-silt mixtures
Clayey sands, sand-clay mixtures
Inorganic silts and very fine sands,rock flour, silty or clayey fine sands,or clayey silts with slight plasticity
Inorganic clays of low to mediumplasticity, gravelly clays, sandyclays, silty clays, lean clays
Organic silts and organic silty claysof low plasticity
Inorganic silts, micaceous ordiatomaceous fine sandy or siltysoils, elastic silts
Inorganic clays of high plasticity, fatclays
Organic clays of medium to highplasticity, organic silts
Peat and other highly organic soils
Clean gravels
(Little or no fines)
Gravel w
ith fines(A
ppreciable amounts
of fines)
Clean sands
(Little or no fines)S
ands with fines
(Appreciable am
ountsof fines)
Silts and clays
(Liquid limit less than 50)
Silts and clays
(Liquid limit greater than 50)
Highly
organicsoils
Gravels
(More than half of coarse fraction islarger than N
o. 4 sieve size)
Sands
(More than half of coarse fraction issm
aller than No. 4 sieve size)
Coarse-grained soils
(More than half of m
aterial is larger than No. 200 sieve size)
Fine-grained soils
(More than half of m
aterial is larger than No. 200 sieve size)
Table 1: Generalized Unified Soil Classification System.
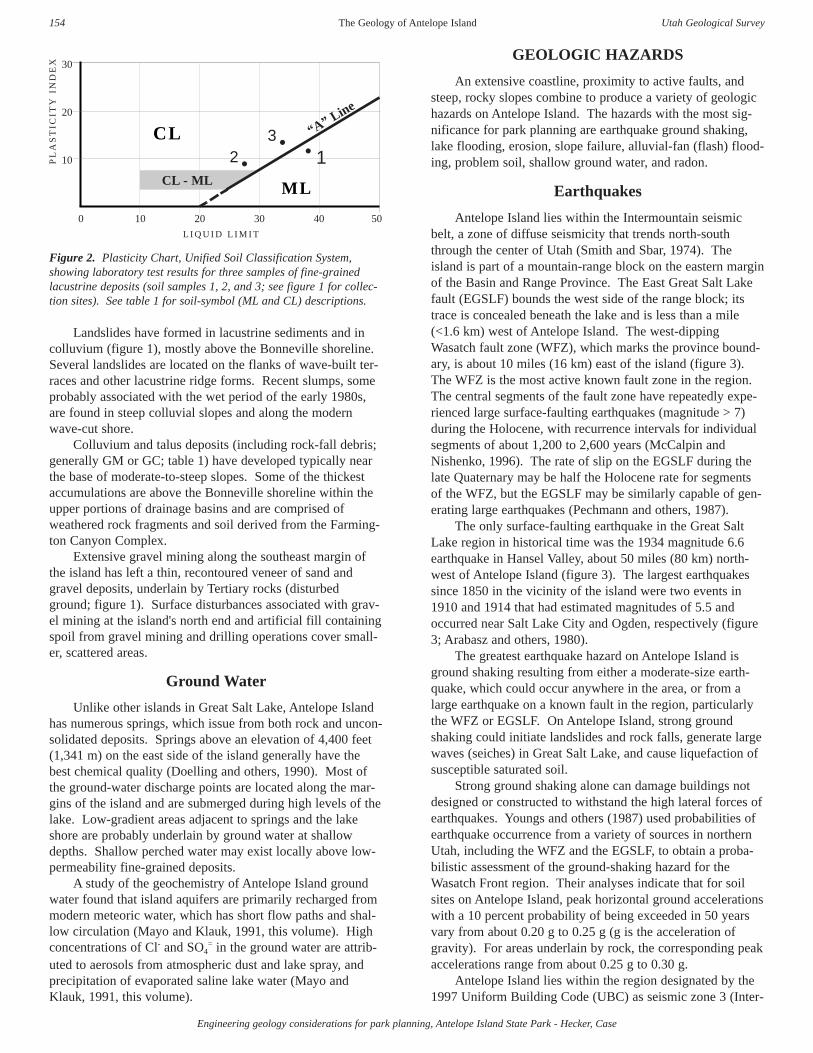
Engineering geology considerations for park planning, Antelope Island State Park - Hecker, Case
Landslides have formed in lacustrine sediments and incolluvium (figure 1), mostly above the Bonneville shoreline.Several landslides are located on the flanks of wave-built ter-races and other lacustrine ridge forms. Recent slumps, someprobably associated with the wet period of the early 1980s,are found in steep colluvial slopes and along the modernwave-cut shore.
Colluvium and talus deposits (including rock-fall debris;generally GM or GC; table 1) have developed typically nearthe base of moderate-to-steep slopes. Some of the thickestaccumulations are above the Bonneville shoreline within theupper portions of drainage basins and are comprised ofweathered rock fragments and soil derived from the Farming-ton Canyon Complex.
Extensive gravel mining along the southeast margin ofthe island has left a thin, recontoured veneer of sand andgravel deposits, underlain by Tertiary rocks (disturbedground; figure 1). Surface disturbances associated with grav-el mining at the island's north end and artificial fill containingspoil from gravel mining and drilling operations cover small-er, scattered areas.
Ground Water
Unlike other islands in Great Salt Lake, Antelope Islandhas numerous springs, which issue from both rock and uncon-solidated deposits. Springs above an elevation of 4,400 feet(1,341 m) on the east side of the island generally have thebest chemical quality (Doelling and others, 1990). Most ofthe ground-water discharge points are located along the mar-gins of the island and are submerged during high levels of thelake. Low-gradient areas adjacent to springs and the lakeshore are probably underlain by ground water at shallowdepths. Shallow perched water may exist locally above low-permeability fine-grained deposits.
A study of the geochemistry of Antelope Island groundwater found that island aquifers are primarily recharged frommodern meteoric water, which has short flow paths and shal-low circulation (Mayo and Klauk, 1991, this volume). Highconcentrations of Cl- and SO4
= in the ground water are attrib-uted to aerosols from atmospheric dust and lake spray, andprecipitation of evaporated saline lake water (Mayo andKlauk, 1991, this volume).
GEOLOGIC HAZARDS
An extensive coastline, proximity to active faults, andsteep, rocky slopes combine to produce a variety of geologichazards on Antelope Island. The hazards with the most sig-nificance for park planning are earthquake ground shaking,lake flooding, erosion, slope failure, alluvial-fan (flash) flood-ing, problem soil, shallow ground water, and radon.
Earthquakes
Antelope Island lies within the Intermountain seismicbelt, a zone of diffuse seismicity that trends north-souththrough the center of Utah (Smith and Sbar, 1974). Theisland is part of a mountain-range block on the eastern marginof the Basin and Range Province. The East Great Salt Lakefault (EGSLF) bounds the west side of the range block; itstrace is concealed beneath the lake and is less than a mile(<1.6 km) west of Antelope Island. The west-dippingWasatch fault zone (WFZ), which marks the province bound-ary, is about 10 miles (16 km) east of the island (figure 3).The WFZ is the most active known fault zone in the region.The central segments of the fault zone have repeatedly expe-rienced large surface-faulting earthquakes (magnitude > 7)during the Holocene, with recurrence intervals for individualsegments of about 1,200 to 2,600 years (McCalpin andNishenko, 1996). The rate of slip on the EGSLF during thelate Quaternary may be half the Holocene rate for segmentsof the WFZ, but the EGSLF may be similarly capable of gen-erating large earthquakes (Pechmann and others, 1987).
The only surface-faulting earthquake in the Great SaltLake region in historical time was the 1934 magnitude 6.6earthquake in Hansel Valley, about 50 miles (80 km) north-west of Antelope Island (figure 3). The largest earthquakessince 1850 in the vicinity of the island were two events in1910 and 1914 that had estimated magnitudes of 5.5 andoccurred near Salt Lake City and Ogden, respectively (figure3; Arabasz and others, 1980).
The greatest earthquake hazard on Antelope Island isground shaking resulting from either a moderate-size earth-quake, which could occur anywhere in the area, or from alarge earthquake on a known fault in the region, particularlythe WFZ or EGSLF. On Antelope Island, strong groundshaking could initiate landslides and rock falls, generate largewaves (seiches) in Great Salt Lake, and cause liquefaction ofsusceptible saturated soil.
Strong ground shaking alone can damage buildings notdesigned or constructed to withstand the high lateral forces ofearthquakes. Youngs and others (1987) used probabilities ofearthquake occurrence from a variety of sources in northernUtah, including the WFZ and the EGSLF, to obtain a proba-bilistic assessment of the ground-shaking hazard for theWasatch Front region. Their analyses indicate that for soilsites on Antelope Island, peak horizontal ground accelerationswith a 10 percent probability of being exceeded in 50 yearsvary from about 0.20 g to 0.25 g (g is the acceleration ofgravity). For areas underlain by rock, the corresponding peakaccelerations range from about 0.25 g to 0.30 g.
Antelope Island lies within the region designated by the1997 Uniform Building Code (UBC) as seismic zone 3 (Inter-
The Geology of Antelope Island Utah Geological Survey154
Figure 2. Plasticity Chart, Unified Soil Classification System,showing laboratory test results for three samples of fine-grainedlacustrine deposits (soil samples 1, 2, and 3; see figure 1 for collec-tion sites). See table 1 for soil-symbol (ML and CL) descriptions.
0 10 20 30 40 50
30
20
10
“A” Line
CL
ML
2 •
3 • • 1CL - ML
L I Q U I D L I M I T
PL
AS
TIC
ITY
IND
EX
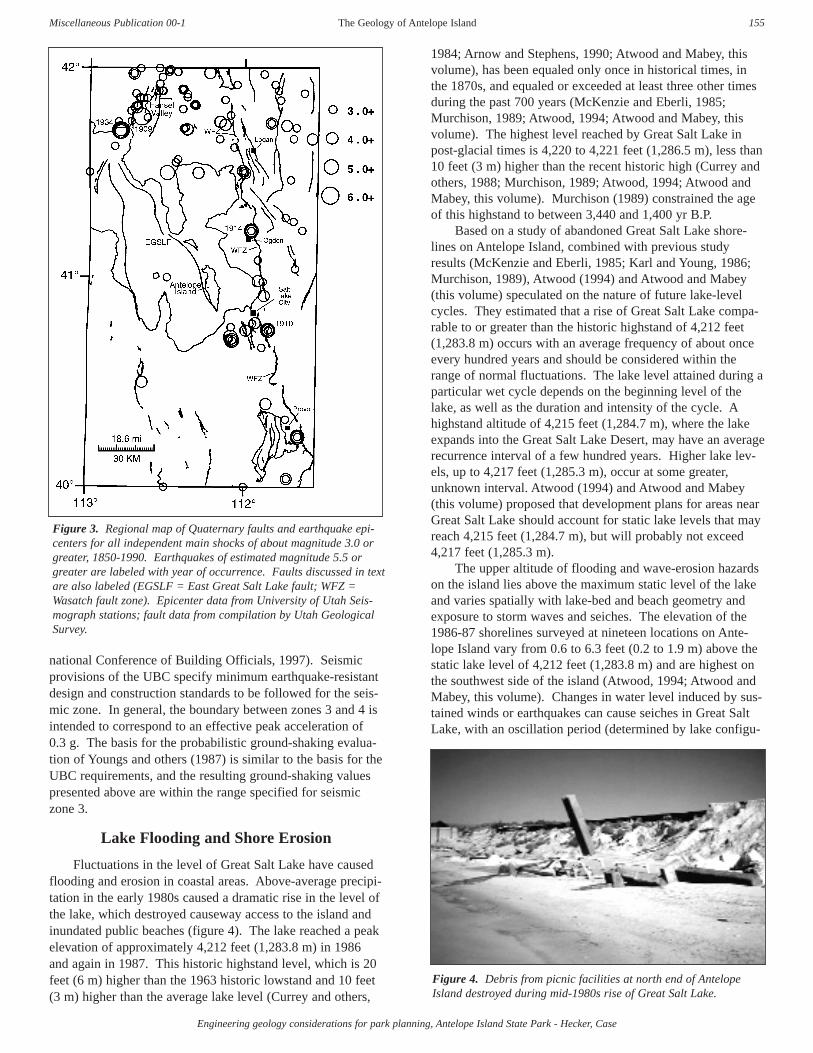
Engineering geology considerations for park planning, Antelope Island State Park - Hecker, Case
national Conference of Building Officials, 1997). Seismicprovisions of the UBC specify minimum earthquake-resistantdesign and construction standards to be followed for the seis-mic zone. In general, the boundary between zones 3 and 4 isintended to correspond to an effective peak acceleration of0.3 g. The basis for the probabilistic ground-shaking evalua-tion of Youngs and others (1987) is similar to the basis for theUBC requirements, and the resulting ground-shaking valuespresented above are within the range specified for seismiczone 3.
Lake Flooding and Shore Erosion
Fluctuations in the level of Great Salt Lake have causedflooding and erosion in coastal areas. Above-average precipi-tation in the early 1980s caused a dramatic rise in the level ofthe lake, which destroyed causeway access to the island andinundated public beaches (figure 4). The lake reached a peakelevation of approximately 4,212 feet (1,283.8 m) in 1986and again in 1987. This historic highstand level, which is 20feet (6 m) higher than the 1963 historic lowstand and 10 feet(3 m) higher than the average lake level (Currey and others,
1984; Arnow and Stephens, 1990; Atwood and Mabey, thisvolume), has been equaled only once in historical times, inthe 1870s, and equaled or exceeded at least three other timesduring the past 700 years (McKenzie and Eberli, 1985;Murchison, 1989; Atwood, 1994; Atwood and Mabey, thisvolume). The highest level reached by Great Salt Lake inpost-glacial times is 4,220 to 4,221 feet (1,286.5 m), less than10 feet (3 m) higher than the recent historic high (Currey andothers, 1988; Murchison, 1989; Atwood, 1994; Atwood andMabey, this volume). Murchison (1989) constrained the ageof this highstand to between 3,440 and 1,400 yr B.P.
Based on a study of abandoned Great Salt Lake shore-lines on Antelope Island, combined with previous studyresults (McKenzie and Eberli, 1985; Karl and Young, 1986;Murchison, 1989), Atwood (1994) and Atwood and Mabey(this volume) speculated on the nature of future lake-levelcycles. They estimated that a rise of Great Salt Lake compa-rable to or greater than the historic highstand of 4,212 feet(1,283.8 m) occurs with an average frequency of about onceevery hundred years and should be considered within therange of normal fluctuations. The lake level attained during aparticular wet cycle depends on the beginning level of thelake, as well as the duration and intensity of the cycle. Ahighstand altitude of 4,215 feet (1,284.7 m), where the lakeexpands into the Great Salt Lake Desert, may have an averagerecurrence interval of a few hundred years. Higher lake lev-els, up to 4,217 feet (1,285.3 m), occur at some greater,unknown interval. Atwood (1994) and Atwood and Mabey(this volume) proposed that development plans for areas nearGreat Salt Lake should account for static lake levels that mayreach 4,215 feet (1,284.7 m), but will probably not exceed4,217 feet (1,285.3 m).
The upper altitude of flooding and wave-erosion hazardson the island lies above the maximum static level of the lakeand varies spatially with lake-bed and beach geometry andexposure to storm waves and seiches. The elevation of the1986-87 shorelines surveyed at nineteen locations on Ante-lope Island vary from 0.6 to 6.3 feet (0.2 to 1.9 m) above thestatic lake level of 4,212 feet (1,283.8 m) and are highest onthe southwest side of the island (Atwood, 1994; Atwood andMabey, this volume). Changes in water level induced by sus-tained winds or earthquakes can cause seiches in Great SaltLake, with an oscillation period (determined by lake configu-
The Geology of Antelope IslandMiscellaneous Publication 00-1 155
Figure 3. Regional map of Quaternary faults and earthquake epi-centers for all independent main shocks of about magnitude 3.0 orgreater, 1850-1990. Earthquakes of estimated magnitude 5.5 orgreater are labeled with year of occurrence. Faults discussed in textare also labeled (EGSLF = East Great Salt Lake fault; WFZ =Wasatch fault zone). Epicenter data from University of Utah Seis-mograph stations; fault data from compilation by Utah GeologicalSurvey.
Figure 4. Debris from picnic facilities at north end of AntelopeIsland destroyed during mid-1980s rise of Great Salt Lake.

Engineering geology considerations for park planning, Antelope Island State Park - Hecker, Case
ration) of about 6 hours and a lake-level rise of perhaps twofeet or more (Lin and Wang, 1978; see Atwood, 1994 andAtwood and Mabey, this volume, for discussion). Seichesobserved during the 1909 magnitude 6 earthquake in HanselValley may have raised the water surface 12 feet (3.7 m) atthe Lucin cutoff railroad trestle north of Antelope Island(Lowe, 1990).
The West Desert pumping project, begun after the dra-matic rise of Great Salt Lake in 1986-87, was designed toincrease total lake evaporation by transferring water into anevaporation pond west of the Newfoundland Mountains.Pumping, as well as consumptive water use, may help reducethe severity of future lake-level maxima, but will not preventfuture high lake cycles or eliminate the threat of future flood-ing (Harty and Christenson, 1988; Atwood, 1994; Atwoodand Mabey, this volume).
Slope Failures and Alluvial-Fan Deposition
A slope failure hazard exists on Antelope Island in areasof wave erosion along the modern shore, on and beneathabandoned wave-built lake terraces, and on steep colluvialslopes above the Bonneville shoreline. The character andprobable cause of landsliding differs in different areas of theisland, although all mapped landslides (figure 1) appear tohave originated in slopes greater than about 20 percent.
The largest slope failure on the island is a prehistoricearth flow on the northwest side above White Rock Bay (fig-ure 1). Sand and gravel in the slide moved as far as one-halfmile or more (>0.8 km) across gentle to moderate (8 to 17percent) slopes. Overlapping lobes of material, low mounds,and levees along the margins suggest a failure mode thatprobably involved relatively fast-moving, water-saturatedmaterial.
Fine-grained lacustrine deposits that are exposed instream cuts just north of the earth flow are inferred to alsounderlie the slopes that failed. Layers of fine-graineddeposits create a zone of low permeability that during timesof prolonged or rapid infiltration may become saturatedand/or allow development of a perched water table in overly-ing deposits. These types of saturated conditions, perhaps inconjunction with earthquake ground shaking, may have con-tributed to initiation of the earth flow. The lacustrine fine-grained unit, as observed in exposures near the earth flow, iscomprised of a clean fine-sand facies overlying a more silt-and clay-rich (and less permeable) facies (figure 5). Assum-ing the necessary moisture conditions, it is possible thatstrong ground shaking during an earthquake caused the sandydeposits to liquify, resulting in the earth flow.
The earth-flow deposit has well-defined hummocky mor-phology uncut by shorelines, and thus is less than 13,000years old, the approximate time when Lake Bonnevilledropped below an elevation of 4,400 feet (1,341.1 m) duringits recession from the Provo shoreline (Currey and Oviatt,1985). The landslide is probably more than a few hundredyears old, based on the vegetation cover and the accumulationof ponded, fine-grained sediments at the head of the deposit.
The earth flow incorporated coarse-grained material fromthe outer edge of a Provo shoreline terrace. Along the marginof the terrace adjacent to the landslide main scarp, there are
arcuate lineaments and scarps with small offsets that appearto be the result of ground cracking and incipient landsliding.These features, which may have formed under the same con-ditions as the earth flow, indicate that the slope may be unsta-ble.
Several smaller landslides, mostly slumps, have occurredelsewhere on the island in Lake Bonneville and younger sandand gravel deposits (figures 1 and 6). One slump is locatedclose to the earth flow, having formed in the same lake ter-race deposit. Wave erosion and ground-water sapping alongthe modern shore have created other unstable slopes, leadingto recent slumping.
Above the Bonneville shoreline, extensive weatheringand erosion of gneiss, schist, and metasedimentary rock hasproduced locally thick mantles of colluvium on steep slopes.Weathering is especially pronounced in rocks that have beenmechanically and geochemically weakened by faulting, shear-ing, and chloritization. The largest landslide mapped abovethe Bonneville shoreline formed in colluvium at the north endof a major thrust fault near the crest of the island (the DaddyStump Ridge fault of Doelling and others, 1990). Approxi-mately one-third of the ~600-foot-long (180 m) landslidecomplex has recently reactivated as a shallow slide with sev-eral feet of down-slope movement (figure 7). This reactivat-ed slide is one of many small, fresh-looking slope failuresand tensional fractures in steep colluvial slopes on the island.
The Geology of Antelope Island Utah Geological Survey156
Figure 5. Exposure of fine-grained offshore deposits (sandy facies,S; silty facies, Si) and transgressive shore-zone gravels (G) of LakeBonneville. Collection site for soil sample 1 on figures 1 and 2.
Figure 6. Aerial view of a rotational landslide in lacustrine sandsand gravels (north of soil sample location 3, figure 1).
S
G
Si

Engineering geology considerations for park planning, Antelope Island State Park - Hecker, Case
These features are similar to the partially detached landslidemasses that formed during the wet years of the early 1980s inFarmington Canyon Complex colluvium in the WasatchRange (Wieczorek and others, 1983), and may have a poten-tial for further movement and perhaps mobilization as debrisflows and debris floods.
Numerous debris-flow and flood events during post-Bon-neville time have built extensive alluvial fans on both sides ofthe island (figure 1). Debris-slide scars and fresh, unvegetat-ed alluvial-fan deposits (figure 8), as well as active, unincisedfan surfaces, provide evidence that debris-flow and floodprocesses are ongoing. Areas of coalescing fans on the eastside of the island contrast with areas of "disturbed ground"(figure 1) at the southeast end, where extensive gravel mininghas removed most of the unconsolidated deposits. Despitethe removal of geologic information in these mined areas,debris-flow and flood hazards can be assumed to be presentbecause the topographic setting is similar to areas of fan dep-osition farther north and locally small debris flows haveflowed into the disturbed area.
A study of alluvial-fan deposits in Davis County foundthat sedimentation and flooding events on fans are character-ized by phases, corresponding to differences in sediment-to-water ratios and resulting flow processes (Keaton and Math-ewson, 1987). Plastic debris flows and viscous transitionalflows, with relatively high sediment concentrations, present ahazard due to impact and burial and occur in proximal (apex)and medial areas of fans. Hyperconcentrated sediment flowsand normal streamflows carry less sediment and are morecommon, but less damaging. They present a hazard of floodinundation and occur mainly on distal fan surfaces and instream channels (Keaton and others, 1988). While debrisflows and transitional flows are relatively rare, flooding andsedimentation from hyperconcentrated and normal stream-flows are likely during any normal snow-melt or cloudburst-storm event.
Accumulations of rock-fall debris are associated withsome of the higher elevation beach deposits containing largeboulders, and with bedrock promontories on the island's westside. A rock-fall hazard generally exists at the base of steepslopes beneath perched lacustrine boulders and outcrops of
sheared and fractured bedrock.
Problem Soil and Shallow Ground Water
Several types of soil conditions on Antelope Island maypose hazards to park development. Fine-grained lacustrinedeposits at variable depths beneath surficial sand and gravelmay create unstable ground conditions and present potentialengineering problems. Other deposits that may pose chal-lenges for engineering are compressible organic soils in shoreand spring areas, possible hydrocompactible soil on alluvialfans, and local expansive soil on fans, colluvial slopes, andcertain weathered bedrock.
Atterberg limits were determined for three samples oflacustrine fines from the north end and east side of the island(figure 1; samples 2 and 3 were collected from fine-graineddeposits exposed in drainage cuts). The test results (plasticityindices of 12.0, 8.0, and 13.0; corresponding to liquid limitsof 38.0, 27.6, and 33.3, for samples 1, 2, and 3, respectively)show the soils to be silt (ML; sample 1) and lean clay (CL;samples 2 and 3). However, the data for all three samplesplot close together near the "A" line separating clay-like andsilt-like materials on the plasticity chart (figure 2), whichindicates that fine-grained lacustrine soil from different areason the island may have similar engineering properties. Thetest results indicate a low shrink-swell potential, but ratherpoor soil drainage. Fine-grained organic soil on the islandhas not been laboratory tested, but is likely to be classifiedOL (table 1), having moderate-to-high compressibility, some
The Geology of Antelope IslandMiscellaneous Publication 00-1 157
Figure 7. Recent slope failure in older landslide and colluvialdeposits below crestline of the island (at north end of thrust fault,figure 1). View to the south. Arrows point to fresh main-scarp frac-tures (about 1989).
Figure 8. Recent alluvial-fan deposit on the east side of AntelopeIsland.

shrink-swell potential, and poor drainage.Soil on alluvial fans and on colluvial slopes probably has
a range of engineering properties, corresponding to variationsin local composition. Soil derived from Precambrian meta-morphic rocks may have low to moderate shrink-swell poten-tial, whereas soil derived from the Tintic Quartzite probablyhas low to very low shrink-swell potential. Soil derived fromtuffaceous rocks of the Salt Lake Formation and the ben-tonitic claystone and mudstone beds identified in the Tertiaryconglomeratic unit has the potential to be expansive. Certaintypes of alluvial-fan deposits may be susceptible to hydro-compaction, particularly dry, low-density, debris-flowdeposits near fan apices.
Other problem soil conditions on Antelope Island includesand-dune activity and soil erosion. Blowing sand fromsparsely vegetated dunes on the north end of the island (fig-ure 1) may be deposited on roads and may bury or be erodedfrom beneath structures (figure 9). Erosion is a hazard onsteep slopes underlain by surficial deposits, particularly whensurfaces and vegetation are disturbed, sediments are compact-ed, and runoff is channelized. This is evidenced by deep gul-lies that have developed along old off-road vehicle trails (fig-ure 10).
Shallow ground water, especially in combination withproblem soil types, presents several problems for develop-ment. Water less than 10 feet (3 m) deep can cause unstableslopes, unstable building foundations, and flooding of subsur-face facilities. Also, ground water less than about 30 feet (9m) deep in areas with susceptible soil creates a potential forliquefaction. In general, shallow ground water can be expect-ed in low-gradient areas near Great Salt Lake and in thevicinity of springs. Shallow ground water may also developlocally and intermittently above the low-permeability lacus-trine fines. This may be a particular problem if water is intro-duced by park development.
Radon
Radon, a common radioactive gas of geologic origin, ishazardous only when it becomes concentrated in buildings ornatural enclosures; outdoor radon concentrations never reachhazardous levels (see Sprinkel and Solomon, 1990; Black,1993 for discussion of radon hazards in Utah). A statewideassessment of relative radon-hazard potential (at 1:1,000,000-scale) identified the north end of Antelope Island (area under-lain mainly by Cambrian Tintic Quartzite) as having moderateindoor radon-hazard potential and the rest of the island(underlain mainly by the Farmington Canyon Complex) ashaving high radon-hazard potential (Black, 1993). Theassessment is based on a consideration of three geologic fac-tors that influence radon-hazard potential: uranium concentra-tion in source materials, soil permeability, and depth ofground water. Low soil permeability and shallow groundwater block the flow of soil gas and thereby reduce the radon-hazard potential. Higher radon-gas hazards are based on thegeneral association of mapped rock types with concentrationsof uranium-bearing minerals (Sprinkel, 1987). The Precam-brian Farmington Canyon Complex and Tertiary units such asthe Salt Lake Formation are known to contain uranium-bear-ing strata (Sprinkel, 1987).
A preliminary ground radiometric survey of equivalenturanium concentration on Antelope Island (Utah GeologicalSurvey, unpublished data) indicated that areas on the westside of the island underlain by granitic gneiss of the Farming-ton Canyon Complex have relatively high radon potential.Some areas of prominent shearing in the Farmington CanyonComplex appear to have similar potential. In other areas ofthe Farmington Canyon Complex, particularly along the highcentral portion of the island, the survey values seem anom-alously low. However, this result is consistent with the rela-tively low readings obtained in a survey of indoor radon con-centrations in areas underlain by soil derived from the Farm-ington Canyon Complex along the Wasatch Range front inWeber and Davis Counties (Sprinkel and Solomon, 1990).From the ground survey, the north end of the island, which iscomprised of Tintic Quartzite (figure 1), appears to have arelatively low potential for radon. Locally along the east sideof the island, relatively high radiometric concentrations corre-late with the Salt Lake Formation.
In a study of radon-hazard potential along the WasatchFront near Sandy and Provo, Solomon and others (1994)found that Quaternary deposits with the highest potential foran indoor-radon hazard are well-drained upper Pleistocenelacustrine sediments related to the transgressive phase ofLake Bonneville, as well as younger alluvial and colluvialdeposits overlying these transgressive sediments. Sedimentsbelow the Provo (regressive) level were found to be less well
The Geology of Antelope Island
Engineering geology considerations for park planning, Antelope Island State Park - Hecker, Case
Utah Geological Survey158
Figure 9. Wind-blown sand covering road in area of beach facili-ties at north end of Antelope Island.
Figure 10. Gullies and debris fans formed in lacustrine sands andgravels along old off-road vehicle trails on northeast side of island.

Engineering geology considerations for park planning, Antelope Island State Park - Hecker, Case
drained and to have lower hazard potential.
FACILITY SITING CONSIDERATIONS
Factors important in siting facilities include the bearingcapacity (shear strength and compressive strength) of earthmaterials and ease of excavation, as well as problem-soil,slope-stability, and other hazards previously discussed.Included below are summaries of these siting conditions asthey relate to buildings, roads, trails, shoreline facilities, andwaste-disposal facilities. These assessments of siting condi-tions are based on generalized characteristics of rock andunconsolidated deposits; local conditions may vary.
Foundation Conditions
Rock UnitsThe following characteristics of rock units are deduced
from brief excursions and generalized physical properties ofspecific rock types; no tests were run on Antelope Island rockunits.
Ledge-forming and slope-forming rock units present dif-ferent foundation conditions on Antelope Island. Ledge-forming rock units are strongly indurated, resist weathering,generally occur on steep slopes, and have high compressiveand shear strengths, except where they are fractured. Slope-forming rock units are weakly indurated, easily weathered,erode to gentle slopes, and have a wide range of compressiveand shear strength values.
Excavation of ledge-forming rock units requires rippingand blasting, subject to the extent and spacing of fractures.Slopes in hard rock are typically steep, except on the northend of the island where the Tintic Quartzite is exposed nearground level. Ground water is usually deep, except nearsprings along the base of the mountains, because of high frac-ture permeability. The ledge-forming rock units include:some Farmington Canyon Complex gneisses and granites; thedolomite member of the Kelley Canyon Formation; the TinticQuartzite; and tuffaceous sandstone, tuff, and conglomerate ofthe Salt Lake Formation.
The ease of excavation of slope-forming rock unitsdepends on the degree of weathering of the rock, extent offracturing, and rock strength. Slope-forming rock units mayrequire ripping and blasting below the weathered, surficiallayer. Slope-forming rock units include the following: schis-tose layers in gneiss, chloritized and hematitized gneiss, andamphibolite of the Farmington Canyon Complex; slate mem-ber of the Kelley Canyon Formation; Mineral Fork Formationdiamictite; and fine-grained strata of the Salt Lake Formation.
Unconsolidated DepositsUnconsolidated deposits include all Quaternary geologic
units. Some deposits are semi-consolidated where they arecemented by calcium carbonate (forming beachrock and tufa).Soil types on the island, classified using the Unified SoilClassification System, include well-graded sand and gravel(GW), poorly-graded sand (SP), silt (ML), and lean clay(CL).
Sand and gravel beach deposits, which consist predomi-nantly of granular materials, generally have low compressibil-ity. Shear strengths are generally high. These deposits are
relatively easy to excavate, except where they contain espe-cially large grain sizes. Excavation in tufa and beachrockmay also be difficult. Beach deposits are generally stable inslopes below the angle of repose, but are subject to ravelingin steeper slopes, and may be unstable at lesser slopes whenwet.
Wind-blown sand deposits and some beach deposits arecomposed of clean, poorly-graded sand (SP). Compactibilityof beach and dune sand is low; compressive strength is gener-ally high; and excavation is relatively easy. Sands are porousand permeable and, except near a source of water, are dry.Shrink-swell potential and susceptibility to frost heave arelow.
Alluvial-fan deposits and colluvium are well graded, con-taining gravel to clay-sized particles. Compressive and shearstrengths are variable, depending on the amount of gravel andfines in the deposit. Holocene alluvial-fan deposits may besubject to collapse by hydrocompaction; a laboratory consoli-dation test is necessary to determine the collapse potential ofa particular soil. Alluvial-fan and colluvial materials are rela-tively easy to excavate, except where boulders are common.Shrink-swell potential and susceptibility to frost heave arevariable, depending on the rock source and clay content ofthe deposit. Ground water may be locally shallow in alluvial-fan deposits.
Lagoon and marsh environments contain low-strength,compressible organic silts and clays (OL) subject to subsi-dence from oxidation and decomposition, providing generallypoor foundation conditions. Shallow ground water in theseenvironments can cause foundation-stability difficulties.
Deep-water, fine-grained Lake Bonneville sediments(ML and CL) may underlie many surficial deposits around theisland. Excavations in areas of unconsolidated deposits mayencounter the unit at depths ranging from near surface to per-haps more than 45 feet (14 m), the maximum known depth ofsand and gravel deposits measured in gully exposures(Fitzhugh D. Davis, Utah Geological Survey, verbal commu-nication, 1990). The deposit may be moderately difficult toexcavate because of the relatively high dry strength of clays.Atterberg limits determined for three samples (figure 2) indi-cate a low shrink/swell potential and poor soil drainage. Thedeposits are likely to impede ground-water infiltration, creat-ing local perched water tables. Slopes underlain by this unitmay be unstable, particularly when wet, as evidenced by thelarge earth flow on the north end of the island (see section onslope failure and alluvial-fan flooding).
Roads and Trails
The location of roads, and hiking and biking trails on theisland should be carefully planned, particularly on slopesunderlain by unconsolidated materials that are easily com-pacted and eroded. Existing roads and off-road vehicle trailshave caused severe erosion problems on the island. On steepslopes underlain by granular lake deposits, roads and trailsare deeply rutted (figure 10). Surface runoff concentrates andincreases erosion in the tire-compacted surfaces. The prob-lem has been worsened by vehicles that avoid the ruts andthereby expand the damaged area. Roads and trails must bedesigned and drainage must be controlled to mitigate exces-
The Geology of Antelope IslandMiscellaneous Publication 00-1 159

Engineering geology considerations for park planning, Antelope Island State Park - Hecker, Case
sive slope erosion.Other problems to be considered in siting roads and trails
include slope failures, wave erosion, and sand-dune migra-tion. Roads should be placed above and away from shorelineareas susceptible to erosion and slope failures caused by lake-level fluctuations, storm waves, and seiches (see GeologicHazards section). During the mid-1980s lake-level rise,waves eroded portions of the causeway. Wave erosion con-tinues to threaten some areas along the east-side road. Sanddunes have migrated onto roads at the north end of the island(figure 9).
Shoreline Facilities
Park facilities built along the shoreline may be suscepti-ble to the following hazards: 1) wave erosion; 2) slope fail-ure due to wave erosion and ground-water sapping; 3) sand-dune migration; 4) lake-level fluctuations; and 5) foundationsettlement due to compression of saturated organic soil (seeGeologic Hazards section). Any in-lake structures such aspiers, jetties, or groins will also be subject to lake-level fluc-tuations and perhaps worse foundation problems. In addition,these structures may impede the longshore drift of sediment,affecting deposition patterns and the stability of down-currentbeaches.
Wastewater Disposal
The suitability of an area for wastewater disposal in asoil absorption field is dependent on the soil permeability andclay content, slope, flood hazard, depth to ground water, anddepth to rock. Soil must have permeability that is highenough to allow wastewater to move through it, but not sohigh as to allow wastewater to discharge to the surface or mixwith ground water before being renovated. Percolation ratesmust be between 1 and 60 minutes/inch (0.39 and 23.6 min-utes/cm) and slopes must be less than 25 percent to meet statehealth department requirements. The soil-absorption fieldshould not be susceptible to flooding, erosion, or ponding ofsurface water. Drain lines are required to be at least 3 feet(0.9 m) above bedrock or impervious strata, at least 1 foot(0.3 m) below ground surface, covered by at least 1 foot (0.3m) of filter material, and at least 2 feet (0.6 m) above theanticipated highest level of ground water. This ground-waterlevel shall be at least 4 feet (1.2 m) below finished grade(Utah Department of Environmental Quality, 1996a). Thebest soil type is silty/clayey sand (SM/SC) with less than 25to 30 percent clay.
On Antelope Island, well-graded alluvial-fan deposits areprobably the most suitable material for soil-absorption fields.However, active portions of alluvial fans are susceptible todebris flows and floods, and may be underlain by shallowwater tables. Permeability may be low enough, and filteringand cation-exchange capacity of soils may be sufficient forrenovation of wastewater in these deposits. These factorsmay not be adequate in many other surficial deposits, such asdune and beach deposits. Fine-grained lacustrine deposits, ifpresent at shallow depths below a soil-absorption field, mayproduce a perched water table and flood the system. Waste-water may also move downslope through the subsurfacealong the top of the fine-grained unit and come to the surface
or flow into Great Salt Lake prior to being renovated.Wastewater disposal in sewage lagoons is possible on
Antelope Island, although careful consideration must be givento hazards and the potential for lake contamination. Most ofthe larger areas of gentle slopes required for lagoons are nearthe lake and are presumably underlain by less-permeable,fine-grained lacustrine deposits that may direct seepage froma lagoon into the lake. Liners would be required and,although some material of sufficiently low permeability for aclay liner may be found on the island, most material wouldlikely need to be imported. Most of the suitable areas forsewage lagoons are on the north and east sides of the island.
Landfills
Landfills are permanent solid-refuse holding sites andshould be sited to minimize transfer of materials from thelandfill into the environment. Solomon and Klauk (1989)listed the following considerations for landfill siting: (1) thesite should have workable geologic materials that can be eco-nomically excavated; (2) the host materials should be rela-tively impervious if the pit is unlined; (3) the geologic materi-al used for the cover should also be relatively impervious, aswell as compactable; (4) there should be no geologic hazards,such as flooding, erosion, or slope failure, that will exposewaste to the environment; (5) the slope of the ground surfaceshould be sufficiently gentle for ease of working the landfilland maintaining slope stability, yet steep enough to preventwater from ponding on the landfill; (6) ground-water qualityshould be continuously monitored, from the time of construc-tion and continuing after the landfill has been abandoned; and(7) the bottom of the landfill should be at least 5 feet (1.5 m)above the seasonally high ground-water level. According tothe Utah Department of Environmental Quality (1996b), alandfill site should not be located within 1,000 feet (305 m)of a national, state, or county park.
In general, the coarse-grained lake, eolian, and alluvial-fan deposits that dominate the surficial deposits of the islandare poorly suited as host or cover material for a landfill. Aliner would be required and fine-grained material would needto be blended with the sand and gravel to provide suitablecover. Some finer grained alluvial-fan and lake deposits maybe locally suitable for cover but, as with sewage lagoons,liner material would likely need to be imported. Areas offine-grained lake deposits and weathered soft rock, such asthat found in gravel excavations on the southeast side of theisland, may be suitable host material. However, expansiveclays found in the weathered rock may not be suitable forcover, both because such clay is not workable when wet andbecause it cracks excessively when dry. In all cases, geologichazards such as flooding and slope failure need to be identi-fied during siting studies, but in most cases hazards can beavoided or mitigated.
CONCLUSIONS
Geologic information is important to successful develop-ment and management of park resources on Antelope Island.Geologic hazards and difficult site conditions must either beavoided or accommodated in design and construction of facil-ities. Local variations in slope, materials, and processes can
The Geology of Antelope Island Utah Geological Survey160

Engineering geology considerations for park planning, Antelope Island State Park - Hecker, Case
influence suitability of sites for buildings, roads, or waste dis-posal.
Strong earthquake ground shaking may effect the entireisland and initiate landslides, rock falls, and liquefaction insusceptible material. Antelope Island is within seismic zone3 of the Unified Building Code, and probabilistic analyses ofground shaking in the region indicate that peak ground accel-erations of roughly 0.20 to 0.30 g (varying with locationbetween rock and soil sites) have a 10 percent chance ofbeing exceeded in 50 years on the island (Youngs and others,1987).
The margins of the island adjacent to Great Salt Lakemay be subject to flooding and erosion from earthquake- orwind-induced seiches of the lake, storm waves, or rising lakelevels. For planning purposes, the lake may be expected toreach static levels as high as 4,215 to 4,217 feet (1,284.7 to1,285.3 m), with wave-elevated levels up to 6.5 feet (2 m)higher, depending on site exposure and topography (Atwood,1994; Atwood and Mabey, this volume).
Slope-failure hazards exist in several different settings onthe island. Moderate to steep slopes in coarse-grained LakeBonneville deposits, particularly deposits underlain by a layerof low-permeability lake fines, may be unstable under condi-tions of excessive moisture and/or strong ground shaking.Landslides may also occur in colluvial slopes above the Bon-neville shoreline and in wave-eroded areas along the modernshoreline. A rock-fall hazard may be present in areas belowcliffs of fractured rock and below steep bouldery slopes.Debris flows and flash floods are a hazard on alluvial fans,which have been built from successive flow and flood eventsduring the past 10,000 years.
Shallow ground water and expansive, compressible,hydrocompactible, and erodible soils are found locally andpresent difficulties for development. Soils derived fromtuffaceous and bentonitic rocks of the Salt Lake Formationand Tertiary conglomeratic unit, or from metamorphic rocksof the Farmington Canyon Complex may have significantshrink-swell potential. The fine-grained lacustrine sedimentsthought to be widespread at shallow depths on the islandappear from laboratory testing to have low shrink-swellpotential, but poor soil drainage. Shallow ground water,found either perched above these fines or in the vicinity ofsprings or Great Salt Lake, may create unstable foundationconditions and flood underground facilities. Compressibleorganic soil is commonly found in areas of shallow groundwater and in marsh or lagoon environments. Holocenedebris-flow deposits on alluvial fans may be susceptible tohydrocompaction. Some sediments, notably lacustrine sandand gravel deposits on steep slopes and wind-blown sand, areeasily eroded when vegetation is removed or runoff is chan-nelized.
Indoor radon-hazard potential is considered to be highwithin the southern two-thirds of the island (Black, 1993).This area is underlain by the Farmington Canyon Complexand the Salt Lake Formation, map units that are known tocontain uraniferous strata (Sprinkel, 1987). In contrast, thenorth end of the island, where the Tintic Quartzite is exposed,appears to have moderate to low radon-hazard potential.
Few serious problems face construction of buildings,roads and trails, shoreline facilities, wastewater disposal sys-
tems, or landfills on Antelope Island. The ease of excavatingrock for building foundations ranges from relatively easy forslope-forming rock units to relatively difficult for ledge-form-ing rock units. Unconsolidated deposits present few excava-tion difficulties, unless they are cemented by calcium carbon-ate or contain boulders. Compressive and shear strengths ofrock units range from high for ledge-forming rock units tovariable for soft-rock units. Physical properties of unconsoli-dated deposits are a function of grain size and type of deposit.The compressive and shear strengths of sand and graveldeposits are generally high, whereas well-graded alluvial-fanand colluvial deposits, which contain silt and clay, have vari-able compressive and shear strengths.
Traffic on roads and trails that cross slopes underlain byunconsolidated materials may produce ruts and increase ero-sion. Properly engineered roadbeds and drainage will berequired to alleviate such erosion problems. Routes shouldconsider slope stability in siting and design, and those closeto shorelines should consider fluctuating lake levels, waveerosion, and active sand dunes, as should all shoreline facili-ties. The direction of longshore drift should be considered forin-lake facilities to avoid loss of sand at swimming beachesand filling of marina harbors. Structures near the shorelinemay also encounter problems with shallow ground waterand/or organic-rich soils.
Alluvial-fan deposits are probably the most suitableunconsolidated unit on the island for wastewater disposal insoil absorption systems. Clay content in the deposits may besufficient to maintain the percolation rates necessary to reno-vate wastewater. However, some alluvial-fan locations areunacceptable because of surface- and ground-water floodingpotential. Fine-grained lacustrine sediments or weatheredsoft-rock Tertiary units found on the southeast side of theisland may be most suitable as host materials for a landfill,although it is likely that imported liner material would berequired at any site. Some alluvial-fan sediments may besuitable as cover material for a landfill, but most other uncon-solidated materials are less suitable. Landfills must be sitedto avoid or designed to mitigate geologic hazards such asflooding, slope instability, and shallow ground water.
In planning park facilities, care should be taken to con-sider engineering geologic conditions. For all essential facili-ties or facilities for human occupancy, an engineering geolog-ic report assessing geologic hazards and foundation condi-tions should be performed to recommend appropriate avoid-ance and mitigation strategies. For waste-disposal systems,studies are required to assess site conditions with regard tohazards, soil permeability, potential to contaminate ground orsurface water (particularly the lake), and availability and suit-ability of local materials for liners and cover. Geologic haz-ards on the island are generally localized and for the mostpart can be mitigated. Sites well-suited for disposal ofwastes, particularly landfills or sewage lagoons, are probablyfew and should be carefully chosen and designed.
The Geology of Antelope IslandMiscellaneous Publication 00-1 161

REFERENCES
Arabasz, W.J., Smith, R.B., and Richins, W.D., 1980, Earth-quake studies along the Wasatch front, Utah -- Networkmonitoring, seismicity, and seismic hazards: Bulletin ofthe Seismological Society of America, v. 70, p. 1479-1499.
Arnow, Ted, and Stephens, Doyle, 1990, Hydrologic charac-teristics of the Great Salt Lake, Utah--1847-1986: U.S.Geological Survey Water Supply Paper 2332, 32 p.
Atwood, Genevieve, 1994, Geomorphology applied to flood-ing problems of closed-basin lakes...specifically GreatSalt Lake, in Geomorphology and Natural Hazards, 25thBinghamton Symposium in Geomorphology: Geomor-phology, v. 10, p. 197-219.
Black, B.D., 1993, The radon-hazard-potential map of Utah:Utah Geological Survey Map 149, scale 1:1,000,000.
Currey, D.R., and Oviatt, C.G., 1985, Durations, averagerates, and probable causes of Lake Bonneville expan-sions, stillstands, and contractions during the last deep-lake cycle, 32,000 to 10,000 years ago, in Kay, P.A., andDiaz, H.F., editors, Problems of and prospects for pre-dicting Great Salt Lake levels: Salt Lake City, Centerfor Public Affairs and Administration, University ofUtah, p. 9-24.
Currey, D.R., Atwood, Genevieve, and Mabey, D.R., 1984,Major levels of Great Salt Lake and Lake Bonneville:Utah Geological and Mineral Survey Map 73, scale1:750,000.
Currey, D.R., Berry, M.S., Douglas, G.E., Merola, J.A.,Murchison, S.B., Ridd, M.K., Atwood, Genevieve, Bills,B.G., and Lambrechts, J.R., 1988, The highest Holocenestage of Great Salt Lake, Utah: Geological Society ofAmerica Abstracts with Programs, v. 20, no. 6, p. 411.
Doelling, H.H., Willis, G.C., Jensen, M.E., Hecker, Suzanne,Case, W.F., and Hand, J.S., 1990, Geology map of Ante-lope Island, Davis County, Utah: Utah Geological Sur-vey Map 127, 27 p., scale 1:24,000.
Harty, K.M., and Christenson, G.E., 1988, Flood hazard fromlakes and failure of dams in Utah: Utah Geological andMineral Survey Map 111, 8 p., scale 1:750,000.
International Conference of Building Officials, 1997, Uni-form Building Code: Whittier, California, InternationalConference of Building Officials, variously paginated.
Karl, T.R., and Young, P.J., 1986, Recent heavy precipitationin the vicinity of Great Salt Lake; just how unusual?:Journal of Climate and Applied Meteorology, v. 25, p.353-363.
Keaton, J.R., and Mathewson, C.C., 1987, Proposed idealalluvial fan stratigraphy for risk assessment: GeologicalSociety of America Abstracts with Programs, v. 19, no. 7,p. 723.
Keaton, J.R., Anderson, L.R., and Mathewson, C.C., 1988,Assessing debris flow hazards on alluvial fans in DavisCounty, Utah, in Fragaszy, R.J., editor, Proceedings ofthe 24th symposium on engineering geology and soilsengineering, Coeur d'Alene, Idaho: Idaho Department of
Transportation, Boise, Idaho, p. 89-108.
Lin, Aching, and Wang, Lo, 1978, Wind tides of the GreatSalt Lake: Utah Geolgical and Mineralogical Survey,Utah Geology, v. 5, no. 1, p. 17-25.
Lowe, Mike, 1990, Earthquake-induced ground failure in sen-sitive clays, vibratory settlement, seiches, surface-drainage disruptions, and increased ground-water dis-charge, Davis County, Utah, in Gori, P.L., editor, Assess-ment of Regional Earthquake Hazards and Risk along theWasatch Front, Utah, volume IV: U.S. Geological Sur-vey Open-File Report 90-225, p. MM1-MM16.
Mayo, A.L., and Klauk, R.H., 1991, Contributions to thesolute and isotopic groundwater geochemistry, AntelopeIsland, Great Salt Lake, Utah: Journal of Hydrology, v.127, p. 307-335.
McCalpin, J.P., and Nishenko, S.P., 1996, Holocene paleo-seismicity, temporal clustering, and probabilities of futurelarge (M > 7) earthquakes on the Wasatch fault zone,Utah: Journal of Geophysical Research, v. 101, no. B3,p. 6233-6253.
McKenzie J.A., and Eberli G.P., 1985, Late Holocene lake-level fluctuations of the Great Salt Lake (Utah) asdeduced from oxygen-isotope and carbonate contents ofcored sediments, in Kay, P.A., and Diaz, H.F., editors,Problems of and Prospects for Predicting Great Salt LakeLevels: Salt Lake City, Center for Public Affairs andAdministration, University of Utah, p. 25-39.
Murchison, S.B., 1989, Fluctuation history of Great SaltLake, Utah, during the last 13,000 years: Salt Lake City,University of Utah, Ph.D. dissertation, 137 p.
Pechmann, J.C., Nash, W.P., Viveiros, J.J., and Smith, R.B.,1987, Slip rate and earthquake potential of the East GreatSalt Lake fault, Utah [abstract]: EOS, Transactions ofthe American Geophysical Union, v. 68, no. 44, p. 1369.
Smith, R.B., and Sbar, M.L., 1974, Contemporary tectonicsand seismicity of the western United States with empha-sis on the Intermountain Seismic Belt: Geological Soci-ety of America Bulletin, v. 85, no. 8, p. 1205-1218.
Solomon, B. J., and Klauk, R. H., 1989, Regional assessmentof geologic conditions for sanitary landfills in SevierCounty, Utah: Utah Geological and Mineral Survey Spe-cial Study 71, 15 p.
Solomon, B.J., Black, B.D., Nielson, D.L., Finerfrock, D.L.,Hultquist, J.D., and Linpei, Cui, 1994, Radon-hazard-potential areas in Sandy, Salt Lake County, and Provo,Utah County, Utah: Utah Geological Survey SpecialStudy 85, 49 p.
Sprinkel, D.A., 1987 (revised 1988), The potential radon haz-ard map, Utah: Utah Geological and Mineral SurveyOpen-File Report 108, 4 p., scale 1:1,000,000.
Sprinkel, D.A., and Solomon, B.J., 1990, Radon hazards inUtah: Utah Geological and Mineral Survey Circular 81,25 p.
Utah Department of Environmental Quality, 1996a, IndividualWastewater Disposal Systems, R317-501 through R317-513, Utah Administrative Code: Utah Department of
The Geology of Antelope Island
Engineering geology considerations for park planning, Antelope Island State Park - Hecker, Case
Utah Geological Survey162

Environmental Quality, Division of Water Quality, 59 p.
Utah Department of Environmental Quality, 1996b, ProposedAdministrative Rules, Solid Waste Permitting and Man-agement Rules, R315-301 through R315-320: Depart-ment of Environmental Quality, Division of Solid andHazardous Waste, 77 p.
Wieczorek, G.F., Ellen, Stephen, Lips, E.W., Cannon, S.H.,and Short, D.N., 1983, Potential for debris flow anddebris flood along the Wasatch Front between Salt LakeCity and Willard, Utah, and measures for their mitiga-tion: U.S. Geological Survey, Open-File Report 83-635,45 p.
Youngs, R.R., Swan, F.H., Power, M.P., Schwartz, D.P., andGreen, R.K., 1987, Analysis of earthquake ground shak-ing hazard along the Wasatch Front, Utah, in Gori, P.L.,and Hays, W.W., editors, Assessment of Regional Earth-quake Hazards and Risk along the Wasatch Front, Utah,volume II: U.S. Geological Survey Open-File Report 87-585, p. M1-M110.
Engineering geology considerations for park planning, Antelope Island State Park - Hecker, Case
The Geology of Antelope IslandMiscellaneous Publication 00-1 163

Jon K. King and Grant C. Willis, editors
ANTELOPE ISLANDT H E G E O L O G Y O F
D a v i s C o u n t y , U t a h
TH
E G
EO
LO
GY
OF
AN
TE
LO
PE
ISL
AN
D,
Dav
is Co
un
ty, Utah
Kin
g and W
illis
Miscellaneous Publication 00-1Utah Geological Surveya division of Utah Department of Natural Resources
����������������
���������� �


![I :@ f COIQBOQ # ]8A AY:8FO6 ]:collegecirculars.unipune.ac.in/sites/documents/NSS...I :@ f COIQBOQ # ]8A AY:8FO6 ]: ¿]8 AO ¿O/OB * OB * A #];* OCT PY7Q #JA:](https://static.fdocuments.net/doc/165x107/5fb194dcda39141ce24fd47a/i-f-coiqboq-8a-ay8fo6-i-f-coiqboq-8a-ay8fo6-8-ao-oob.jpg)