SYSTEMATIC REVIEW OF UIT PARAMETERS ON RESIDUAL …
134
Calhoun: The NPS Institutional Archive Theses and Dissertations Thesis Collection 2014-03 Systematic review of UIT parameters on residual stresses of sensitized AA5456 and field based residual stress measurements for predicting and mitigating stress corrosion cracking Haggett, Michelle E. Monterey, California: Naval Postgraduate School http://hdl.handle.net/10945/41385
Transcript of SYSTEMATIC REVIEW OF UIT PARAMETERS ON RESIDUAL …
Calhoun: The NPS Institutional Archive
Theses and Dissertations Thesis Collection
2014-03
Systematic review of UIT parameters on
residual stresses of sensitized AA5456
and field based residual stress
measurements for predicting and
mitigating stress corrosion cracking
Haggett, Michelle E.
Monterey, California: Naval Postgraduate School
http://hdl.handle.net/10945/41385

NAVAL POSTGRADUATE
SCHOOL
MONTEREY, CALIFORNIA
THESIS
Approved for public release; distribution is unlimited
SYSTEMATIC REVIEW OF UIT PARAMETERS ON RESIDUAL STRESSES OF SENSITIZED AA5456 AND FIELD BASED RESIDUAL STRESS MEASUREMENTS
FOR PREDICTING AND MITIGATING STRESS CORROSION CRACKING
by
Michelle E. Haggett
March 2014
Thesis Advisors: Luke N. Brewer Kim Ngoc Tran

THIS PAGE INTENTIONALLY LEFT BLANK

i
REPORT DOCUMENTATION PAGE Form Approved OMB No. 0704-0188 Public reporting burden for this collection of information is estimated to average 1 hour per response, including the time for reviewing instruction, searching existing data sources, gathering and maintaining the data needed, and completing and reviewing the collection of information. Send comments regarding this burden estimate or any other aspect of this collection of information, including suggestions for reducing this burden, to Washington headquarters Services, Directorate for Information Operations and Reports, 1215 Jefferson Davis Highway, Suite 1204, Arlington, VA 22202-4302, and to the Office of Management and Budget, Paperwork Reduction Project (0704-0188) Washington DC 20503.
1. AGENCY USE ONLY (Leave blank)
2. REPORT DATE
March 2014
3. REPORT TYPE AND DATES COVERED
Master’s Thesis
4. TITLE AND SUBTITLE
SYSTEMATIC REVIEW OF UIT PARAMETERS ON RESIDUAL STRESSES OF SENSITIZED AA5456 AND FIELD BASED RESIDUAL STRESS MEASUREMENTS FOR PREDICTING AND MITIGATING STRESS CORROSION CRACKING
5. FUNDING NUMBERS
6. AUTHOR(S) Michelle E. Haggett
7. PERFORMING ORGANIZATION NAME(S) AND ADDRESS(ES)
Naval Postgraduate School Monterey, CA 93943-5000
8. PERFORMING ORGANIZATION REPORT NUMBER
9. SPONSORING /MONITORING AGENCY NAME(S) AND ADDRESS(ES)
Mr. R. Hays OSD-Corrosion Policy and Oversight OSD(AT&L) CPO 3000 Defense Pentagon Washington DC 20301 Dr. K. Tran Naval Surface Warfare Center, Carderock Division 9500 MacArthur Blvd. West Bethesda, MD 20817
10. SPONSORING/MONITORING AGENCY REPORT NUMBER
11. SUPPLEMENTARY NOTES The views expressed in this thesis are those of the author and do not reflect the
official policy or position of the Department of Defense or the U.S. Government. IRB protocol number ____N/A____.
12a. DISTRIBUTION / AVAILABILITY STATEMENT
Approved for public release; distribution is unlimited
12b. DISTRIBUTION CODE
A
13. ABSTRACT (maximum 200 words)
This thesis focuses on the use of x-ray diffraction to measure residual stresses around welds in aluminum ship structures both in the laboratory and in the field. Tensile residual stresses are often generated during welding and, in sensitized aluminum structures, can cause extensive stress corrosion cracking. Peening techniques, such as ultrasonic impact treatment (UIT), can mitigate and even reverse these tensile residual stresses. This research uses x-ray diffraction to measure residual stresses around welds in AA5456 before and after UIT. In particular, we examined the importance of UIT parameters such as peening amplitude and pin size. We found that all combinations of UIT parameters removed the tensile residual stresses and resulted in compressive stress several hundred microns below the weld surface. The exact level of compressive residual stress was sensitive to the pin size used with a smaller, but measurable, dependence upon the displacement amplitude. In an effort to extend these measurement techniques to the field, we successfully performed the first x-ray residual stress measurements on a U.S. naval combatant.
14. SUBJECT TERMS SCC, stress corrosion cracking,AA5456, ultrasonic impact treatment,
UIT, XRD, residual stress
15. NUMBER OF PAGES
133
16. PRICE CODE
17. SECURITY CLASSIFICATION OF REPORT
Unclassified
18. SECURITY CLASSIFICATION OF THIS PAGE
Unclassified
19. SECURITY CLASSIFICATION OF ABSTRACT
Unclassified
20. LIMITATION OF ABSTRACT
UU
NSN 7540-01-280-5500 Standard Form 298 (Rev. 2-89) Prescribed by ANSI Std. 239-18

ii
THIS PAGE INTENTIONALLY LEFT BLANK

iii
Approved for public release; distribution is unlimited
SYSTEMATIC REVIEW OF UIT PARAMETERS ON RESIDUAL STRESSES OF SENSITIZED AA5456 AND FIELD BASED RESIDUAL STRESS
MEASUREMENTS FOR PREDICTING AND MITIGATING STRESS CORROSION CRACKING
Michelle E. Haggett Lieutenant, United States Navy
B.S., Old Dominion University, 2009
Submitted in partial fulfillment of the requirements for the degree of
MASTER OF SCIENCE IN MECHANICAL ENGINEERING
from the
NAVAL POSTGRADUATE SCHOOL March 2014
Author: Michelle E. Haggett
Approved by: Luke N. Brewer Thesis Co-Advisor
Kim Ngoc Tran Thesis Co-Advisor
Knox T. Millsaps Chair, Department of Mechanical and Aerospace Engineering

iv
THIS PAGE INTENTIONALLY LEFT BLANK

v
ABSTRACT
This thesis focuses on the use of x-ray diffraction to measure residual stresses
around welds in aluminum ship structures both in the laboratory and in the field.
Tensile residual stresses are often generated during welding and, in sensitized
aluminum structures, can cause extensive stress corrosion cracking. Peening
techniques, such as ultrasonic impact treatment (UIT), can mitigate and even
reverse these tensile residual stresses. This research uses x-ray diffraction to
measure residual stresses around welds in AA5456 before and after UIT. In
particular, we examined the importance of UIT parameters such as peening
amplitude and pin size. We found that all combinations of UIT parameters
removed the tensile residual stresses and resulted in compressive stress several
hundred microns below the weld surface. The exact level of compressive residual
stress was sensitive to the pin size used with a smaller, but measurable,
dependence upon the displacement amplitude. In an effort to extend these
measurement techniques to the field, we successfully performed the first x-ray
residual stress measurements on a U.S. naval combatant.

vi
THIS PAGE INTENTIONALLY LEFT BLANK

vii
TABLE OF CONTENTS
I. INTRODUCTION ............................................................................................. 1 A. MOTIVATION ....................................................................................... 1 B. LITERATURE REVIEW ........................................................................ 4
1. SCC in 5xxx Series Aluminum Alloys .................................... 5
a. Susceptibility ................................................................. 6 b. Corrosive Environment ................................................ 8 c. Tensile Stresses .......................................................... 13
2. Mitigating Stress Corrosion Cracking ................................. 16 3. Ultrasonic Impact Treatment ................................................ 18
4. X-ray Diffraction Measurements ........................................... 27
C. THESIS OBJECTIVES ....................................................................... 31
II. EXPERIMENTAL METHODS ....................................................................... 33 A. LABORATORY EXPERIMENTS........................................................ 33
1. Residual Stress Measurements ............................................ 33 2. Non-sensitized, Systematically Gas Tungsten Arc
Welded .................................................................................... 41 3. Sensitized, Systematically Ultrasonic Impact Treated,
Gas Metal Arc Welded ........................................................... 42
4. Non-sensitized, Various Ultrasonic Impact Treated Areas, Gas Metal Arc Welded ............................................... 45
5. Sensitized, Ultrasonic Impact Treated, Gas Metal Arc Welded .................................................................................... 46
6. Electrolytic Polishing ............................................................ 48 7. Microstructural Analysis ....................................................... 50
B. FIELD BASED EXPERIMENTS ......................................................... 51 1. Field Based Residual Stress Measurements ....................... 51 2. Shipboard, Sensitized, Gas Metal Arc Welded Aluminum
Alloy 5456 ............................................................................... 55
III. RESULTS ..................................................................................................... 59
A. NON-SENSITIZED, SYSTEMATICALLY GAS TUNGSTEN ARC WELDED ............................................................................................ 61
B. SENSITIZED, SYSTEMATICALLY ULTRASONIC IMPACT TREATED, GAS METAL ARC WELDED .......................................... 62
C. FIELD MEASUREMENT RESULTS .................................................. 81
IV. DISCUSSION ................................................................................................ 90
V. CONCLUSION .............................................................................................. 99
APPENDIX ROSENTHAL’S 3-D SOLUTION MATLAB CODE .............. 101
LIST OF REFERENCES ........................................................................................ 105
INITIAL DISTRIBUTION LIST ............................................................................... 113

viii
THIS PAGE INTENTIONALLY LEFT BLANK

ix
LIST OF FIGURES
Figure 1. Stress corrosion cracking in AA 5456-H116 (from [1]). ......................... 2 Figure 2. Aluminum magnesium phase diagram with 3 wt% Mg, AA5083, and
AA5456 highlighted (after [6]). .............................................................. 3 Figure 3. Venn diagram displaying the three factors required for stress
corrosion cracking. ............................................................................... 5 Figure 4. Depiction of sensitized 5000 series aluminum alloy (from [23]). ........... 8 Figure 5. Example of Pourbaix diagram for aluminum at 25°C in aqueous
solution (adapted from [24] by [12]). ..................................................... 9 Figure 6. Pure aluminum Pourbaix diagram with an overlay of the corrosion
modes for aluminum alloy 5083 determined experimentally in 0.5 M sodium chloride. Areas of corrosion and passivity are labeled (from [12]). ................................................................................................... 11
Figure 7. Residual stresses at multiple depths as a result of GMAW butt welds in AA5083 (from [31]).Measurements were conducted using synchrotron x-ray diffraction. .............................................................. 15
Figure 8. Intergranular stress corrosion cracking due to a sensitized material subject to tensile stresses and a corrosive environment (from [23]). .. 15
Figure 9. Diffraction measurements of residual stresses induced by friction stir welding of 6013Al-T4 as presented by Mishra and Ma (from [35]). ................................................................................................... 17
Figure 10. The schematic of the STRESSONIC principle shows the location of the various portions of the SONATS UIT device (from [54]). .............. 20
Figure 11. Sonats portable ultrasonic impact treatment machine (from [52]). ..... 21 Figure 12. XRD residual stress depth resolved measurements of varying
levels of exfoliated AA7075-T6511 following surface UIT. Lightly, moderately, and severely (AFL, BFM, and AFS, respectively) exfoliated specimen were tested for residual stresses before and after UIT (from [58]). ........................................................................... 25
Figure 13. Visual depiction of measuring lattice planes of a specimen using x-ray diffraction. This method is used to determine residual stresses in a material. ....................................................................................... 30
Figure 14. Regular (a,b) and irregular (c) d-spacing versus sin2ψ results (from [62]). The branching in (b) is indicative of out of plain strains εi3. ....... 30
Figure 15. Existing stress corrosion crack on the O4 Level of a United States Navy cruiser. ...................................................................................... 31
Figure 16. The Proto Manufacturing iXRD with close up of collimator used to collect residual stress values for AA5456 samples (after [64]). The high stress sample is pictured. ........................................................... 34
Figure 17. The Proto Manufacturing iXRD with each axis labeled. The X and Y axes had a range of ±50 mm from the zero position. The Z axis had a range of ±50 mm. The β axis had an arc from ±45°. The φ axis had a range of 0° to 180°.................................................................... 35

x
Figure 18. Results from a single exposure technique measurement of the aluminum powder standard. The region of interest is labeled and enclosed by the vertical dashed lines. The background fit is also labeled and depicted by the green horizontal line. ............................. 36
Figure 19. Profile of a single exposure technique measurement taken on the stress free aluminum powder standard. The blue horizontal line represents a well-matched gain. The red curve shows the diffraction signal from the aluminum, stress-free powder. .................. 37
Figure 20. Measured diffraction peak from single exposure technique measurement of the stress free aluminum powder standard. This bitmap exhibits a smooth peak with very little noise (the red curve) and is an ideal representation of expected data return. A two-peak Gaussian method in conjunction with the linear psi fit correction was used to fit the peaks and determine peak location. ..................... 38
Figure 21. D-spacing versus sin2ψ results from a multiple exposure technique measurement on the high stress aluminum standard. The slim ellipse was indicative of an acceptable out-of-plane shear and good system alignment................................................................................ 38
Figure 22. Optical macrographs of GTAW AA5456-H116 plate. The plate on the left was welded at a speed of 50.8 mm/min and the plate on the right was welded at 152 mm/min. ....................................................... 42
Figure 23. Two plates of sensitized, GMAW butt welded AA5456-H116 at various UIT conditions. Clockwise from top left: Surface A, Surface C, Surface D, and Surface B. Parameters given in Table 8. ............... 43
Figure 24. Two plates of non-sensitized, GMAW butt welded AA5456-H116. UIT is present at the toe of the weld and in a patch near the top left corner. ................................................................................................ 45
Figure 25. Sensitized AA5456-H116 removed from superstructure of USN cruiser. ................................................................................................ 47
Figure 26. Proto Electrolytic Polisher Model 8818-V3 used to remove surface material for depth resolve measurements. (image adapted from [65]) .................................................................................................... 48
Figure 27. Shipboard field setup of Proto iXRD and radiation safety equipment. Image (a) is the field configuration for position one. Image (b) is the field configuration for position two. Image (c) shows a broader view of the work area. ........................................................ 53
Figure 28. Absorption of the primary beam through aluminum substrate for the Proto iXRD (from [67]). ....................................................................... 54
Figure 29. Backscattered x-ray intensity levels determined by experimental measurements of the Proto iXRD (from [67]). .................................... 54
Figure 30. Shipboard sample location for residual stress measurements of field AA5456-H116. Sample position one is on the left (located at the rear corner of the air handler) and sample position two is on the right (located roughly at the midpoint of the air handler). .................... 56

xi
Figure 31. Sample d-spacing versus sin2ψ plot for the aluminum stress free powder standard. Stress and out-of-plane shear stress were determined to be [-2.9± 1.7 MPa] and [-2.9 ± 0.8 MPa] respectively. . 60
Figure 32. Sample d-spacing versus sin2ψ plots for the aluminum high stress standard. Stress and out-of-plane shear stress were determined to be [-282.9 ± 8.3 MPa] and [-1.9 ± 4.0 MPa], respectively. .................. 61
Figure 33. Residual stress measurements taken with the iXRD across the welds of the four GTAW welds on non-sensitized AA5456 plates. Measurements were taken parallel to the weld. ................................. 62
Figure 34. Longitudinal residual stresses measured as a function of distance perpendicular to GMAW on a surface without UIT. ............................ 63
Figure 35. Residual stresses for the four zones (1 mm, 3 mm, and 4 mm UIT pins) of Surface A (80 percent power input). ...................................... 64
Figure 36. Residual stresses for the four zones (1 mm, 3 mm, and 4 mm UIT pins) of Surface B (60 percent power input). ...................................... 65
Figure 37. Residual stresses for the four zones (1 mm, 3 mm, and 4 mm UIT pins) of Surface C (40 percent power input). ...................................... 66
Figure 38. Residual stresses for the four zones (1 mm, 3 mm, and 4 mm UIT pins) of Surface D (20 percent power input). ...................................... 67
Figure 39. Magnitude of residual stresses in ultrasonically treated base metal suggests dependence on pin size and possibly percent power. ......... 68
Figure 40. UIT induces compressive stresses to depths up to 0.6 mm. The power input and pin size do not create a great deal of variance. ........ 69
Figure 41. D-spacing results from seven measurements taken at the same location using identical parameters. These d-spacing values represent the data collected at the last point in the teach map. .......... 70
Figure 42. Stress measurements as calculated using the XRDWIN software based upon the data collected in the seven measurements at the same location using identical parameters. .......................................... 71
Figure 43. Variances in the stresses and the fitting errors at each point as determined by comparing the values obtained across all seven teach maps from the XRDWIN software. ............................................ 72
Figure 44. Images captured from the crown (a, b), HAZ (c, d), and base metal (e, f) of Surface C (40 percent power) in the 1 mm pin zone. Images (b), (d), and (f) are higher magnification versions of images (a), (c), and (e). ............................................................................................... 73
Figure 45. Higher magnification BSE image showing the deformation induced subgrain structure at a pin crater in Figure 44(b). ............................... 74
Figure 46. Inverse pole figure map determined using the electron backscatter diffraction. Displays the grain orientations at the surface and subsurface in a pin crater in the weld (a) and the base metal (b). ...... 75
Figure 47. Inverse pole figure of deformed region at the surface of the UIT pin crater in the crown region of the weld. ................................................ 76
Figure 48. Grain orientation spread found using electron backscatter diffraction for the weld (a) and base metal (b) at the surface and

xii
subsurface in a pin crater. The color scheme is in degrees. Red (20 degrees) denotes an area with a large amount of intragranular misorientation. Blue (0.1 degrees) denotes a region with very little intragranular misorientation. ............................................................... 77
Figure 49. Images captured 14.6 mm from the toe of the weld, illustrating intergranular cracking. Image (c) and (d) are higher magnifications of image (a) and (b). ........................................................................... 79
Figure 50. Optical microscopy images of sub-surface intergranular cracking in regions that have experience UIT with a 1 mm pin diameter. (a) 40 percent power at the toe of the weld, (b) 40 percent power in the HAZ, (c) 20 percent power at the toe of the weld, and (d) 20 percent power in the HAZ. .................................................................. 80
Figure 51. Optical microscopy images of sub-surface regions that have no UIT: (a) crown side of weld at the toe, (b) crown side in the HAZ, (c) root side of the weld at the toe, and (d) root side in the HAZ. ............. 81
Figure 52. D-spacing results from the successful field measurement of the stress free powder standard. Stress and out-of-plane shear stress were determined to be [6.8 ± 2.0 MPa] and [-12.6 ± 1.0 MPa], respectively. ....................................................................................... 82
Figure 53. D-spacing results from the successful field measurement of the high stress standard. Stress and out-of-plane shear stress were determined to be [-275.0 ± 9.1 MPa] and [-8.8 ± 4.3 MPa], respectively. ....................................................................................... 83
Figure 54. Position one located on the O4 deck of a U.S. Navy cruiser, polished for measurements. Location (a) was where the in situ metallography was conducted and location (b) was where the line profile was conducted from the weld towards the crack. .................... 84
Figure 55. D-spacing of the successful field measurement on the deck of a U.S. Navy cruiser following Dr. Bill Golumbfskie’s in situ polishing and subsequent microstructural observation using his field apparatus. Stress and out-of-plane shear stress values were determined to be [-131.2 ± 2.6 MPa] and [-8.9 ± 1.2 MPa], respectively. ....................................................................................... 85
Figure 56. Stress profile initiated at the center of the weld and moved towards the crack at position one. .................................................................... 86
Figure 57. Position two located on the O4 deck of a U.S. Navy cruiser. The line profile was set up from the center of the weld towards the anticipated base material shown by the red oval. ............................... 87
Figure 58. Stresses collected in position two ....................................................... 88 Figure 59. Image of spherical indenter used for comparison of the pin size
results. ................................................................................................ 94
xiii
LIST OF TABLES
Table 1. Weight percent of alloying elements in common aluminum alloys used for shipbuilding (from [5]). ............................................................ 2
Table 2. UIT parameters used in various studies. ............................................ 22 Table 3. Aluminum alloys and steels with reported values for compressive
stresses and fatigue improvments as a result of UIT. ......................... 26 Table 4. Acceptable values of stress measurements and stress
measurements collected for aluminum powder and high stress standards. ........................................................................................... 39
Table 5. Proto iXRD parameters for laboratory based residual stress measurements on AA5456-H116. ...................................................... 40
Table 6. GTAW parameters for non-sensitized AA5456-H116 plate ................ 42
Table 7. GMAW parameters for sensitized AA5456-H116 plates. .................... 44 Table 8. Ultrasonic impact treatment parameters conducted on sensitized
AA5456-H116 plates performed by SONATS. .................................... 44 Table 9. GMAW parameters for non-sensitized AA5456-H116. ....................... 46
Table 10. Solutions, voltages and times tested for electrolytic polishing with a description of the polish achieved. ..................................................... 50
Table 11. Proto iXRD parameters for field based residual stress measurements on shipboard AA5456-H116. ...................................... 55
Table 12. Stress and out-of-plane shear stress data collected for the final point of seven teach maps conducted in the same location Surface A (80 percent power), 3 mm pin zone using identical parameters. ..... 71
Table 13. Stress values at each point in the stress profile from the center of the weld towards the crack at position one. ........................................ 86
Table 14. Stress values determined for the teach map taken at position two. .... 88 Table 15. AA5456 material characteristics and atmospheric conditions
considered for solving Rosenthal’s 3-D solution. ................................ 90
Table 16. Comparison of physical measurements and residual stress measurements with those predicted by the 3-D Rosenthal’s solution. .............................................................................................. 91

xiv
THIS PAGE INTENTIONALLY LEFT BLANK
xv
LIST OF ACRONYMS AND ABBREVIATIONS
AA aluminum alloy
ARB accumulative roll bonding
ASTM American Society for Testing and Materials
AU Applied Ultrasonics
BSE backscatter electron
CCD charge coupled device
DOS degree of sensitization
EBSD electron backscatter diffraction
ECAE equal channel angular extrusion
FIB-SEM focused ion beam, scanning electron microscope
GMAW gas metal arc welding
GOS grain orientation spread
GPa gigapascal
GTAW gas tungsten arc welding
IGSCC intergranular stress corrosion cracking
M molar
MET multiple exposure technique
MPa megapascal
NAMLT nitric acid mass loss test
NSWCCD Naval Surface Warfare Center Carderock Division
SET single exposure technique
SCC stress corrosion cracking
SEOP standard and emergency operating procedures
SiC silica carbide
SPD severe plastic deformation
UIT ultrasonic impact treatment
USSP ultrasonic shot peening
wt% weight percent

xvi
THIS PAGE INTENTIONALLY LEFT BLANK

xvii
ACKNOWLEDGMENTS
I owe endless gratitude to several organizations and individuals for their
support of this research. Expressing that gratitude here is hardly sufficient, but it
is my hope that the research speaks for itself and all parties feel their time,
efforts, and funding were well spent. For anybody I forget, I offer my apologies.
This work is far reaching and the number of people involved is far reaching.
Professor Luke Brewer continually dedicates an unprecedented amount of
time and effort to his students and research. He ensured that this work was set
up for success every step of the way by coordinating permission, coordinating
funding, imparting knowledge, providing guidance, and so much more. I am
grateful for this opportunity to impact the future of the U.S. Navy.
Dr. Kim Tran at Naval Surface Warfare Center Carderock Division was
involved throughout my research with the provision of samples, funding, and
advice. I feel honored that she was willing to share her vast amount of knowledge
in this field of study. Between her and Professor Brewer, I could not have asked
for a better set of advisors.
I am very grateful for funding for this research provided by the Office of the
Secretary of Defense-Corrosion Policy and Oversight Office. Specifically, Mr. R.
Hays, Deputy Director, generously provided financial support and enthusiasm for
the approach, the instrument, and the labor needed begin this x-ray residual
stress approach.
Site visits were conducted at The Navy Yard in Philadelphia and onboard
USS Bunker Hill (CG52). The support of the personnel at each location was
astounding. A special thanks to Bobby Sparks, Alan Karpovitch, and David
Sparkuhl for making the visits educational and successful. Additionally, the crew
of the USS Bunker Hill was overwhelmingly supportive of our work and went out
of their way to aid our research. Dr. Bill Golumbfskie made a special site visit to
the location of our field work to offer the use of his in situ metallography

xviii
equipment, which will prove useful in future work. Thanks to all who made the
site visits a success.
Lastly, the process of obtaining permission to conduct open beam x-ray
diffraction was a giant hurdle we overcame in the process of conducting this
research. The guidance and support of the Naval Postgraduate School radiation
safety officer, Mr. R. J. Greve, is greatly appreciated.

1
I. INTRODUCTION
A. MOTIVATION
The United States Navy funds ship design and shipbuilding under the
expectation that a ship will remain active for the entire specified service life or
longer, typically several decades. This approach allows for proper budget
planning and a fully operational fleet. Life cycle maintenance plans are
developed in the design phase of a ship class. They act as a means of
prolonging ship life by providing a schedule for conducting major tasks onboard
including those that require dry docking. Under the current budget constraints,
ship maintenance is critical since the rate of shipbuilding is reduced. Despite
rigorous maintenance cycles, it is difficult to mitigate complications that each ship
design will encounter.
The Ticonderoga class cruisers represent one such challenge currently
facing the U.S. Navy maintenance community. Stress corrosion cracking (SCC)
plagues the superstructure of these cruisers (Figure 1) [1]. There were 27 total
cruisers built in this class with a designated service life of 35 years each [2]. The
class’s namesake, USS Ticonderoga (CG47), was commissioned in 1983 and
decommissioned a short 21 years later. The subsequent four ships in the class
(CG48-CG51) experienced similar periods of commission, causing the U.S. Navy
to lose roughly 15 years of service per vessel and decreasing the U.S. Navy’s
operational capability. These five ships were decommissioned early due to the
inferior defense capabilities as compared to the remaining cruisers in the class.
Twenty-two Ticonderoga class cruisers remain in service. The oldest remaining,
USS Bunker Hill (CG52), has been in service for 28 years; while the youngest,
USS Port Royal (CG73), has been in service for 20 years. It is imperative for
fiscal stability and operational capability that the remaining cruisers achieve the
35 year service life. The U.S. Navy has an interest in SCC solutions due to the
life cycle maintenance currently being conducted to sustain the remaining
Ticonderoga class cruisers to prolong their service life [1]. The U.S. Navy also

2
has concerns that relate to other ship classes including the littoral combat ship
that have since been constructed of similar material and may present SCC
problems in the future.
Figure 1. Stress corrosion cracking in AA 5456-H116 (from [1]).
The challenges of SCC are a present concern for the U.S. Navy due to
materials and strenuous operational environment [1, 3, 4]. SCC may lead to
problems with watertight integrity among other issues in U.S. naval vessels [1].
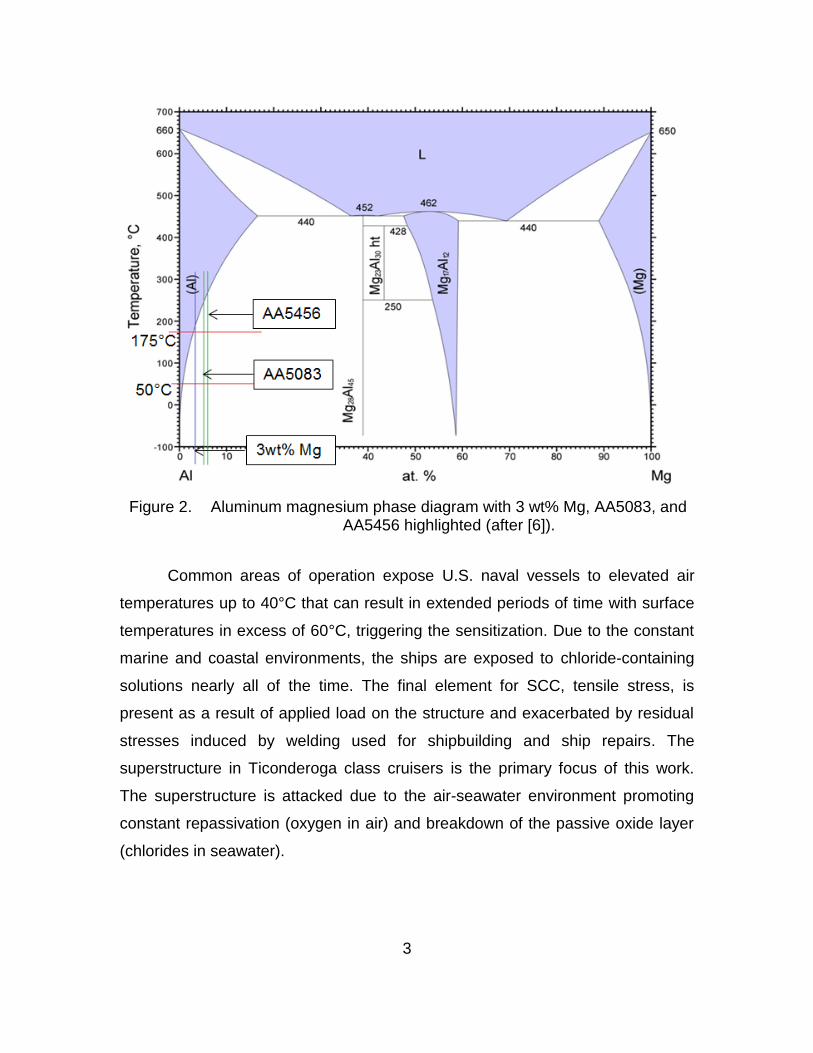
Both aluminum alloy (AA) 5456 and AA5083 are common alloys used in
shipbuilding and exceed the 3 weight percent (wt%) magnesium threshold over
which sensitization is a concern (compositions in Table 1 and phase diagram in
Figure 2).
Table 1. Weight percent of alloying elements in common aluminum alloys used for shipbuilding (from [5]).
3
Figure 2. Aluminum magnesium phase diagram with 3 wt% Mg, AA5083, and AA5456 highlighted (after [6]).
Common areas of operation expose U.S. naval vessels to elevated air
temperatures up to 40°C that can result in extended periods of time with surface
temperatures in excess of 60°C, triggering the sensitization. Due to the constant
marine and coastal environments, the ships are exposed to chloride-containing
solutions nearly all of the time. The final element for SCC, tensile stress, is
present as a result of applied load on the structure and exacerbated by residual
stresses induced by welding used for shipbuilding and ship repairs. The
superstructure in Ticonderoga class cruisers is the primary focus of this work.
The superstructure is attacked due to the air-seawater environment promoting
constant repassivation (oxygen in air) and breakdown of the passive oxide layer
(chlorides in seawater).

4
B. LITERATURE REVIEW
SCC is a type of environmentally assisted cracking. It results from a
combination of microstructural susceptibility, tensile stresses (residual and/or
applied), and a corrosive environment (commonly represented by the Venn
diagram in Figure 3). The environmental aspects that cause SCC depend on the
vulnerabilities of a specific material [7, 8]. SCC can initiate due to surface
discontinuities or corrosion pits and by intergranular corrosion or slip dissolution.
It should be noted that these conditions do not guarantee that SCC will occur. To
reiterate, SCC is a “synergistic stress-corrosion interaction” [8] and requires all
three conditions in Figure 3. Because the chemistry at the crack tip is significantly
different than that in the bulk conditions, crack propagation in SCC may occur
due to conditions that are different than those under which the crack initiated.
Two categories encompass all proposed crack propagation mechanisms for
SCC: chemical dissolution models and mechanical fracture models. For a single
instance of SCC, several mechanisms might drive SCC. The influence of
sensitization and the chemistry of corrosion environment will both affect the exact
mechanisms of SCC that are operative; however, the primary focus of this
research is the tensile stress aspect required for SCC.

5
Figure 3. Venn diagram displaying the three factors required for stress corrosion cracking.
1. SCC in 5xxx Series Aluminum Alloys
The 5xxx series aluminum alloys are ideal candidates for maritime use
because of their resistance to general corrosion (SCC is a result of localized
corrosion), relatively high strength, and weldability (vital for shipbuilding and
repairs) [9]–[11]. The primary alloying element, magnesium, provides the needed
strength without negatively impacting the general corrosion resistance, ductility,
and weldability [10, 11]. Additionally, in comparison to other shipbuilding
materials such as steel, aluminum is lightweight and workable [3, 10]. Finally,
5xxx series aluminum alloys form a particularly durable protective oxide layer in
high oxygen environments (i.e., the superstructure in air) [3, 12]. Nonetheless,
SCC remains a source of failure for 5xxx series aluminum alloys due to the

6
combination of operating temperatures, the marine environment, and both
loading stresses and stresses induced by welding.
a. Susceptibility
A material’s susceptibility to SCC is often described as sensitization.
Sensitization is a change in metallurgical or microstructural state that causes the
material to react with its environment in a transgranular or intergranular cracking
manner; appropriately termed transgranular stress corrosion cracking (TGSCC)
and intergranular stress corrosion cracking (IGSCC) [8]. The type of sensitization
(and subsequent cracking path) will depend on the material but may include
changes in one or more of the following ways due to environmental factors such
as pH, temperature, and solute concentration as discussed by Jones [8]:
Stability of the passive film and phase distribution
Alloying elements affecting local stability of passive film
Segregation of elements to the grain boundary, altering the chemistry compared to the local matrix
Additions to the matrix may affect the chemistry as the crack intersects and the environment reacts with them
Dealloying
Sensitization in 5xxx aluminum alloys is directly related to the magnesium
content used to strengthen the alloy and temperature (due operational
requirements and welding) [11, 13]. At temperatures above 50°C (122°F), Al-Mg
alloys containing greater than 3 wt% magnesium can become sensitized over
time as a result of the formation of a continuous secondary (or beta-Al3Mg2)
phase at the grain boundaries [10], [13]–[18]. Grain boundary sensitization
results from this change in grain boundary chemistry making the boundaries
anodic with respect to the grain interior [7]. This microstructural variance causes
the SCC to propagate preferentially along the grain boundaries, a phenomena
termed Intergranular stress corrosion cracking (IGSCC), because the boundaries
corrode more rapidly with the surroundings than the grain interior matrix. Holtz et
al. observed this phenomenon in AA5083-H131 at temperatures as low as 70°C

7
[19]. After roughly 1,000 hours, the β phase begins to precipitate on the grain
boundaries (Figure 4). When the distribution of β phase on the grain boundaries
becomes nearly continuous, the material is considered to be fully sensitized and
will be susceptible to both SCC and corrosion fatigue. This transformation has
been qualitatively observed using such methods as transmission electron
microscopy and quantitatively observed using the ASTM G67 nitric acid mass
loss test (NAMLT) [16, 19, 20].
The degree of sensitization, DOS, is most often measured using NAMLT
[21]. A sample of the sensitized aluminum material with known mass is placed in
nitric acid [22]. The nitric acid dissolves β phase precipitates and the mass of the
remaining sample is measured to determine the mass loss. The mass loss
normalized by the surface area exposed is an indicator of the degree of
sensitization. A safe and acceptable NAMLT value is less than or equal to 15
mg/cm2 [21]. This means that the level of sensitization is within a safe operational
limit. In the experiments conducted by Holtz et al, after only 1,000 hours at 70°C
they recorded NAMLT values of 30 mg/cm2 for AA5083-H131, which is
considered the critical degree of sensitization. At 3,000 hours, only 125 days, a
continuous β phase is present along the grain boundary resulting in a NAMLT
above 40 mg/cm2, which is considered severely degraded [19]. The process
occurs faster at higher temperatures. Additionally, for extended periods of
elevated temperatures, the continuous film will widen [20]. When conducting
fatigue testing, they found that the stress threshold is dependent on NAMLT
values, regardless of the temperature of sensitization. This suggests that
sensitization at lower temperatures may take longer, but the effects are equally
as detrimental.

8
Figure 4. Depiction of sensitized 5000 series aluminum alloy (from [23]).
b. Corrosive Environment
A corrosive environment is one in which a particular material oxidizes
resulting in deterioration. The environment that causes corrosion will vary based
on the material [8]. Not all detrimental combinations are known and at times the
‘known’ information can be misleading because of vast differences that may
occur between experimental and service conditions. The rate of deterioration and
the byproducts of the reaction are dependent upon the interaction between the
environment and specified material. Temperature, solution velocity, pH, and
solute species/concentration are examples of environmental factors that play a
role in the rate of material deterioration [7, 8]. In some cases, it is possible to
control these variables or to at least minimize their effect on the material. Proper
material selection and processing methods are required in instances when
controlling the environment is not an option.
An appropriate material for a given environment will have a stable, passive
oxide layer on its surface. The passive oxide layer acts as a nonreactive,
protective barrier between the base metal and environment. The layer is good for
the prevention of general and uniform corrosion [8]. It forms due to a reaction
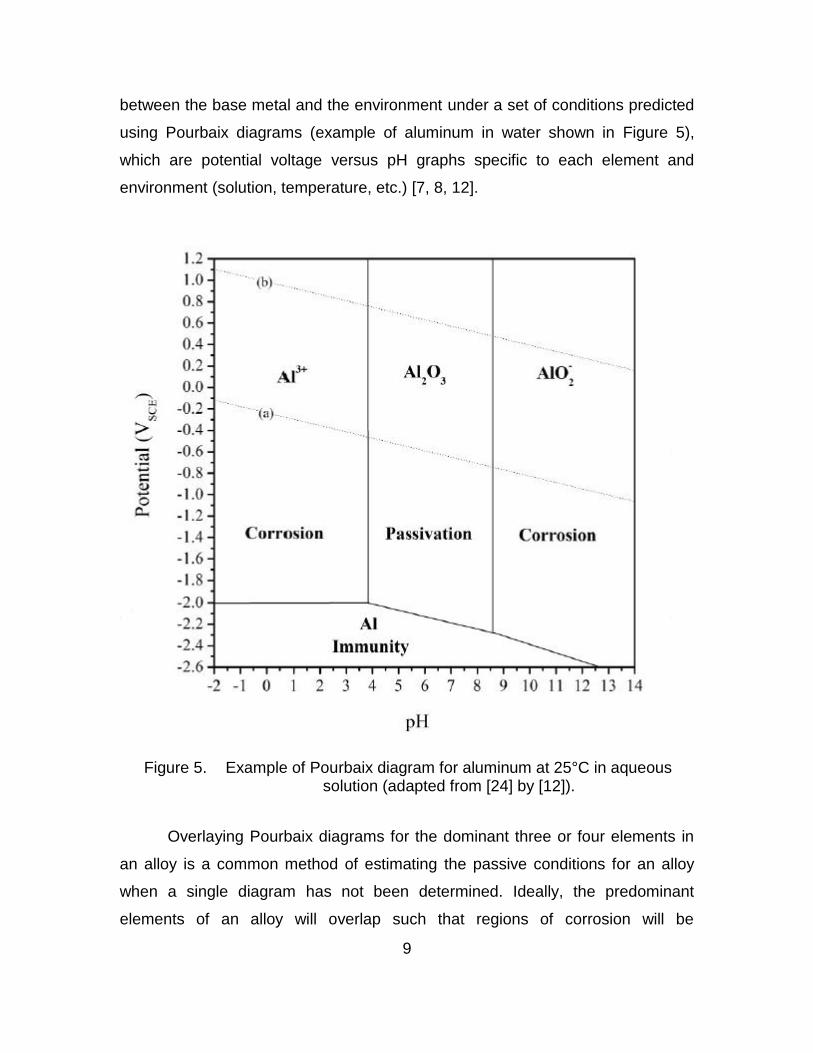
9
between the base metal and the environment under a set of conditions predicted
using Pourbaix diagrams (example of aluminum in water shown in Figure 5),
which are potential voltage versus pH graphs specific to each element and
environment (solution, temperature, etc.) [7, 8, 12].
Figure 5. Example of Pourbaix diagram for aluminum at 25°C in aqueous solution (adapted from [24] by [12]).
Overlaying Pourbaix diagrams for the dominant three or four elements in
an alloy is a common method of estimating the passive conditions for an alloy
when a single diagram has not been determined. Ideally, the predominant
elements of an alloy will overlap such that regions of corrosion will be
10
strengthened by regions of immunity or passivity of other elements allowing for a
broader region of passivity in the alloy as a whole (resulting in a smaller region of
reactivity). The applicability is limited due the experimental parameters as
compared to service conditions. The potential versus pH diagram for AA5083
was developed based on experimental data of the alloy in a 0.5 molar (M)
sodium chloride solution [12]. In the sodium chloride solution, the AA5083 oxide
layer becomes corrosive in regions where pure aluminum is passive in a solution
of water. This diagram offers a more comprehensive look at how 5xxx series
aluminum alloys will react in the presence of chloride (Figure 6), which more
closely represents that found in marine environments.

11
Figure 6. Pure aluminum Pourbaix diagram with an overlay of the corrosion modes for aluminum alloy 5083 determined experimentally in 0.5 M sodium chloride. Areas of corrosion and passivity are labeled (from
[12]).
The rate of corrosion is controlled by ionic transport across the passive
oxide layer. This layer is often quite thin, and in aluminum is only about 30
nanometers thick [25]. A slight scratch during service or a defect from
manufacturing (any surface discontinuity) exposes the base metal to the
surrounding corrosive environment [8]. In the ideal environment, damage to the
passive oxide layer will be healed by repassivation. The oxide layer will re-form
such that the base material is once again protected; even in a mildly reactive
solution (low concentration and activity), the concentration of the reactive species

12
(i.e., chloride ions) increases exponentially at the crack tip, causing an increased
breakdown of the passive oxide layer and continual removal of material. Thusly,
the presence of a passive oxide layer in an alloy cannot be the sole
determination of the alloy’s resistance to corrosion and can, in fact contribute to
SCC [7, 12].
Two predominant theories were found when researching the SCC
mechanisms in 5xxx series aluminum. Both theories are supported by Arnott,
Baxter, and Rouze who were able to discern that for AA7075-T6 higher rates of
repassivation result in more rapid cracking and lower rates of repassivation
results in slower crack propagation in SCC [25]. Several older studies suggest
that the film rupture of the passive oxide layer is a means by which SCC
propagates in aluminum alloys [7, 25, 26]. Under constant stress, the oxide layer
has an opportunity to repassivate in an oxygen rich environment (such as the air)
[3, 26]. The passive oxide layer offers protection, but tensile stresses disrupt the
layer at the crack tip, exposing base metal to the corrosive environment [25]. The
base metal will continue to repassivate, but the stress concentration at the crack
tip will cause the crack to continually propagate. Another SCC mechanism theory
suggests that a combination of the following steps causes SCC in aluminum
instead of film rupture [8, 18, 27]:
local anodic dissolution of the β phase
hydrogen uptake due to the production of hydrogen during dissolution
hydrogen embrittlement of local metallic material
crack extension along the grain boundary
further exposure of the beta phase to local anodic dissolution.
In this mechanism, surface defects and the presence of chlorides also cause
crack initiation and propagation. However, the chemical change and resultant
embrittlement makes the material less resistant to the tensile stresses present.
This process is not solely dependent upon the brittle nature of the passivating
oxide film as previously postulated [28].

13
c. Tensile Stresses
Tensile residual or applied stresses are the final requirement for SCC.
Applied stresses are due to loading induced as a result of the various weapons
systems, radars, etc. supported by the superstructure. Residual stresses are
those that exist when the material is not supporting a load. They are the result of
manufacturing, construction, and repairs. Applied stresses are those that exist
when a load is being supported by the material. Tensile yield stress is the total
tensile stress a material can withstand. Combined tensile stresses less than this
amount will be acceptable unless a flaw, such as a microcrack, exists in the
material. SCC is of particular interest because failure occurs under constant
loading conditions within the design capabilities of a material due to the
combination of residual stresses, corrosive environment, and susceptible
material [8].
Under the assumption that a flaw exists, it is necessary to consider the
stress intensity value, K. The equation below provides the simplest form of the
relationship between stress intensity, acting stress, and existing crack length,
where “Y” accounts for the crack geometry [7].
√ Equation 1.
The stress intensity determined using Equation 1 must be compared to the
material’s fracture toughness, KIC. Under inert conditions (i.e., no corrosion), K
must exceeds K1C, for crack propagation to occur. This can be due to the length
of the crack reaching the critical crack length, αc, under the given stresses or due
to the stress, σc, reaching a critical value for the given crack length. In a corrosive
environment, a modified, and usually significantly lower, stress intensity factor,
KISCC must be considered [7, 8, 14]. Theoretically, KISCC correlates with the stress
below which crack propagation will not occur [8]. KISCC is determined not only
based on material properties, but also based on the environment. This value is
used under the assumption that the size of the plastic zone at the crack tip is
small [8, 29].

14
While considered weldable, 5xxx aluminum-magnesium alloys can
possess substantial tensile residual stresses after welding. Welding is used in
both construction of and repairs to maritime vessels. Heat input and cooling rate
from welding affect the temperature gradient induced, which leads to the residual
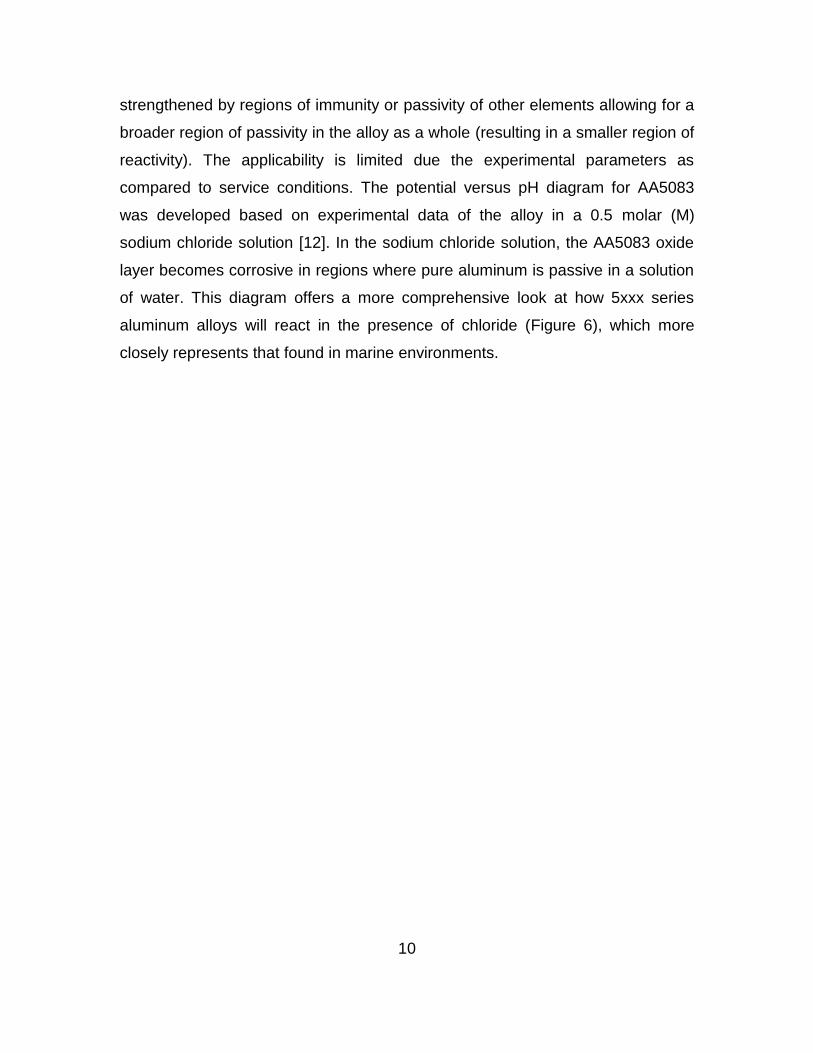
stresses that contribute to SCC as discussed above [3, 30]. James et al.
measured the residual stresses as a result of gas metal arc welded (GMAW) butt
welds in AA5083 using synchrotron x-ray diffraction (Figure 7) [31]. Their findings
show GMAW welding induces tensile residual stresses up to 100 megapascals
(MPa) to a depth 7 mm below the surface in the heat affected zone (HAZ).
Sanders and McDowell demonstrated that the parameters of the weld affect the
magnitude of the tensile stresses (e.g., geometry, orientation, and roughness of
weld) [3]. They concluded orienting the weld in the direction of the applied load
and lower angle at the toe of the weld increase fatigue life in AA5456 and
AA5083. It has been shown that excessive preheating prior to welding can cause
sensitization of AA5083 [13]. Previous reports about sensitization suggest that
there are concerns that heat input from repair welding on sensitized material may
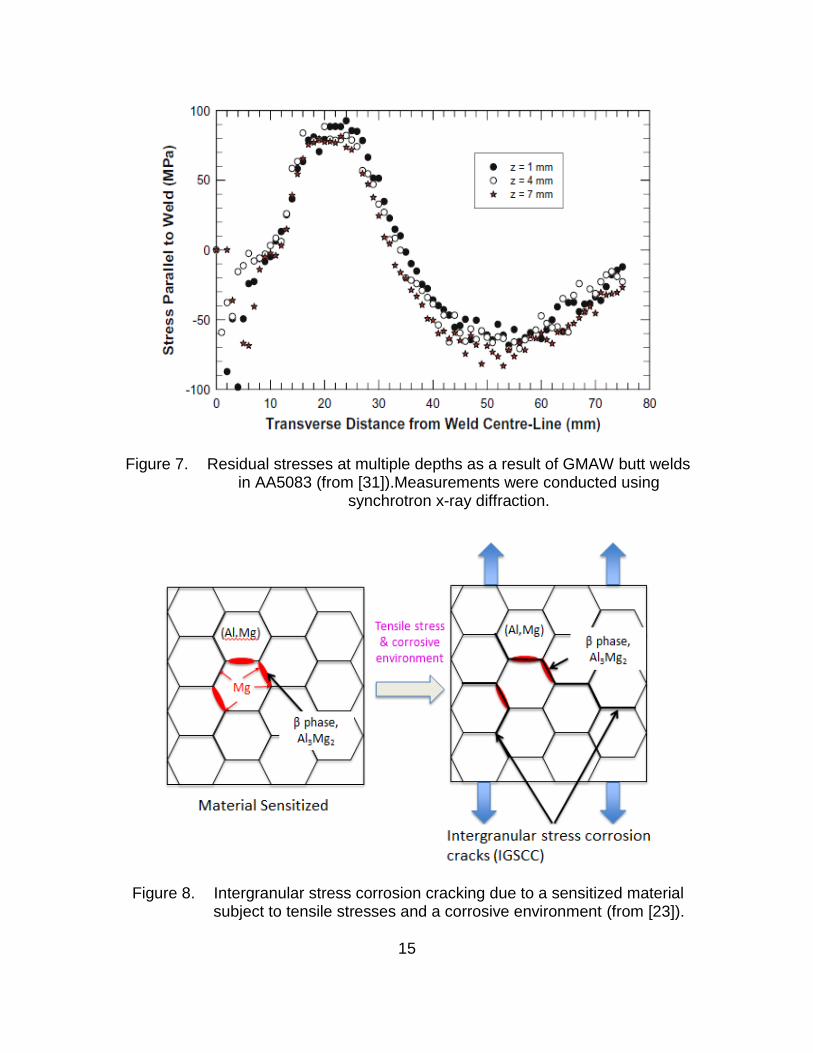
cause the material to further sensitize [13, 14, 17]. Once 5xxx series aluminum
sensitizes, tensile stresses in conjunction with the corrosive atmosphere leads to
IGSCC (Figure 8).
15
Figure 7. Residual stresses at multiple depths as a result of GMAW butt welds in AA5083 (from [31]).Measurements were conducted using
synchrotron x-ray diffraction.
Figure 8. Intergranular stress corrosion cracking due to a sensitized material subject to tensile stresses and a corrosive environment (from [23]).

16
2. Mitigating Stress Corrosion Cracking
In order to mitigate SCC, it is necessary to remove one of the three
elements: sensitization, corrosive environment, or tensile stresses. Local heat
treatment has been shown to locally reverse sensitization without further inducing
sensitization in the surrounding material [32]. The method was successfully used
in a portable configuration and appears to be a promising solution for returning
the sensitized AA5456-H116 to a non-sensitized condition. Doping was shown to
reduce SCC susceptibility in 7xxx series aluminum alloys by altering the
composition of the grain boundaries even in peak aged condition, suggesting the
sodium chloride environment no longer poses a severe corrosive threat because
there is no longer a susceptible microstructure [33]. Friction stir welded (FSW)
AA5083 showed improved stress corrosion resistance compared to GMAW
AA5083 because the precipitates are more uniformly distributed throughout the
grain instead of along the grain boundaries as required for IGSCC [34]. However,
FSW still produces a significant amount of heat input and resultant residual
stresses that will contribute to SCC if the material is exposed to a corrosive
environment and becomes sensitized due to other contributing factors (Figure 9)
[35]. The remaining discussion will focus on mitigating tensile stresses
associated with welding.

17
Figure 9. Diffraction measurements of residual stresses induced by friction stir welding of 6013Al-T4 as presented by Mishra and Ma (from [35]).
Reducing, or even reversing, the tensile residual stress on the surface of
aluminum alloys through peening approaches shows potential for mitigating
SCC. Peening has long been a method used in industry as a method to create
the compressive surface stresses needed to combat fatigue and SCC [36]–[47].
Over the years, the method has been refined, but the concept remains the same.
Each method seeks to bombard a surface with a specified component (e.g.,
hammer, small metallic spheres, lasers) that plastically deforms the surface and,
in turn, creates the compressive stresses needed to increase the life of the
material [29]. However, these processes can be quite complicated and imprecise
in anything less than ideal environment (i.e., laboratory). Laser peening, shot
18
peening, low plasticity burnishing, and ultrasonic impact treatment are just a few
peening methods shown to induce compressive stresses on the surface of a
material.
Each peening method presents its own set of advantages and
disadvantages. Laser peening tends to be the most costly due to the elaborate
technology and required operator skillset. A laser beam is aimed at the desired
location and generates a shockwave on the surface of the material, plastically
deforming it, and thus generating a compressive, elastic stress. Laser peening
offers superior control over parameters and minimal surface deformation [37].
Portable laser peening methods are available and used in primary water SCC
repairs in power plants [48]. Shot peening is a more basic process involving
projecting small spheres at high speed towards the surface of the material. Shot
peening reliably induces compressive stresses, but results in surface
deformations, a wider range of induced stresses, and compressive to depths of
only about 0.2 mm [49]. Portable shot peening is in use, but the equipment is
bulky and difficult to use in confined spaces. Low plasticity burnishing is a
process where a single ball with a force behind it is rolled across the surface of a
material [50]. It is a highly controlled process that produces compressive stresses
and leaves behind a “mirror finish” on the surface of the material. The system
configuration is not portable and appears to be a time consuming process due to
the use of a single rolling ball. The attributes of each of these will be briefly
compared to ultrasonic impact treatment, which was used in this research.
3. Ultrasonic Impact Treatment
Ultrasonic impact treatment is a portable, hand held, severe plastic
deformation (SPD) process that uses pins vibrating at an ultrasonic frequency to
induce compressive stresses [40, 43]. Other SPD methods include equal channel
angular extrusion (ECAE), accumulative roll bonding (ARB), and ultrasonic shot
peening (USSP). SPD methods are known for inducing high plastic strains at the
microstructural level, but preserving the overall dimensions of the material [45]. In

19
general, it is difficult or impractical to implement SPD in a field environment due
to the complexity of the requirement equipment. UIT is a notable exception. Not
only is it more cost effective than other SPD methods, but UIT mitigates the
portability complications presented by both SPD and other peening methods
because it is readily useable for field applications [45].
UIT has been successfully and commercially applied in the field by
Applied Ultrasonics-Esonix (AU) and by Empowering Technologies-Sonats to
increase fatigue resistance and reduce SCC in various metal structures [41]–[47],
[51]–[53]. The AU process involves the use of a pin tool that behaves like an
ultrasonic transducer that outputs continuous ultrasonic impulse or vibrations to
treat the material’s surface. The technology is based on converting the ultrasonic
oscillations of the transducer into impulses of ultrasonic impacts [47]. The output
end employs needle indenters, strengthened with hard materials such as carbide
containing alloys or artificial diamonds that are directed at the surface and are in
continuous contact with the surface of the material.
The SONATS process is based on a technology that is known as
STRESSONIC™. The STRESSONIC™ generator (Figure 10) creates a digital
sine wave with an ultrasonic frequency (generally 15, 20, or 40 kHz) that is
converted to a mechanical signal by a piezo-electric emitter. The mechanical
signal is amplified by a series of boosters and a sonotrode [54]. The mechanical
energy of the sonotrode is then transmitted to the indenters or shot peening
media. No ultrasonic waves are transmitted to the component to be treated but
rather just mechanical energy. The vibration amplitude of the sonotrode ranges
from 10 µm to 250 µm.

20
Figure 10. The schematic of the STRESSONIC principle shows the location of the various portions of the SONATS UIT device (from [54]).
Both machines include a generator box and a handheld tool that allows
the operator to apply UIT to the work piece (similar to Figure 11). Single or
multiples pins can be selected based on the size and location of the UIT area.
There are multiple pin sizes available for each tool. The amplitude, generator
frequency, impact frequency, load amplitude, feed rate, and pressure have all
been varied in laboratory experiments. A summary of these parameters is
provided in Table 2.

21
Figure 11. Sonats portable ultrasonic impact treatment machine (from [52]).

22
Table 2. UIT parameters used in various studies.

23

24
UIT has been shown to be a viable solution improving the material
properties of aluminum alloys and steels. UIT induces compressive stresses on
the order of -175 MPa in aluminum alloys and -500 MPa in steels, eliminating
tensile stresses from welding [42, 44, 46], [55]–[58]. On average the compressive
stresses reach depths ranging from 1.5 to 2 mm (Figure 12) [44], [56]–[58], but
have been shown to reach up to 4 mm in thick specimen [55]. These
compressive stresses have been shown to improve the fatigue life of materials
[42]–[44], [46, 47, 56, 57]. The number of cycles to fatigue is dependent upon the
material and the conditions under which the fatigue testing was conducted.
However, across the board, research suggests that UIT increases fatigue life as
shown in Table 3. The microhardness has been shown to be highest at the
treated surface and decrease to the match that of the base material at a depth 1–
2 mm in aluminum alloys [40, 44, 46, 56]. The severe impact caused by UIT led
to research about the effect on the surface and subsurface microstructure. UIT
impacts the material causing deformation at the surface. Crater depths have
been observed over a range of values from 0.5 to 2.5 µm in various aluminum
alloys [44, 46]. SEM images show that grain size decreases at the surface of the
material due to recrystallization but these smaller grains are not present below
the surface [45, 53]. Studies in surface and subsurface microstructural evolution
also revealed that UIT results in twinning, microbands, and micro-tearing in
various aluminum alloys [41, 45].

25
Figure 12. XRD residual stress depth resolved measurements of varying levels of exfoliated AA7075-T6511 following surface UIT. Lightly,
moderately, and severely (AFL, BFM, and AFS, respectively) exfoliated specimen were tested for residual stresses before and
after UIT (from [58]).

26
Table 3. Aluminum alloys and steels with reported values for compressive stresses and fatigue improvments as a result of UIT.
Several UIT parameters have been researched with respect to their effect
on fatigue life or microstructure. In research and practice, UIT is conducted at the
toe of the weld or over the entire surface of the region of concern for the material.
Mikheev et al. determined that using a single pin tool along the toe of the weld
(resulting in a single line of width equal to the diameter of the pin) and using a
multi pin tool on the surface of the butt joint was (resulting in a treated area
between 20-60 mm) both increased the fatigue life of the specimen, but the data
was inconclusive as to which method was ideal for fatigue life [43]. Various pin
sizes are available for the UIT handheld tool. Results obtained by Statnikov et al.
suggest that using a 3 mm pin results in a roughly 10 percent increase in fatigue
life compared to a 5 mm pin for structural steel [47]. An et al. compared other
parameters such as impact frequency, load amplitude, and feed rate for
microstructural variations in AA2024-T351 [45]. These combinations suggest that
slower feed rate/larger amplitude under load result in larger grain sizes at the
surface and smaller grain sizes at the subsurface. Castillo-Morales presents the
most comprehensive research found on UIT parameters [44]. Pin size, carrier
frequency, impact frequency, load amplitude, feed rate and pressure were varied
for UIT conducted on AA2024-T3. Based on their findings, the fatigue life was
reduced significantly where the treatment per area was highest. Of the research

27
conducted there has been little systematic testing of the various UIT parameters
and their relationship with the residual stresses inducted as a result of UIT.
In the decades since UIT was developed, only a few systematic
investigations into the advantages and disadvantages of UIT in 5xxx series
aluminum alloys have been conducted [40, 41, 53]. In order to be effective for
ship repairs, UIT must be shown to successfully mitigate SCC in sensitized 5xxx
aluminum without creating additional material concerns. Standardized, optimized
UIT parameters are needed for use during construction and repairs of 5xxx
aluminum alloys. Understanding the impact of individual parameters on residual
stresses and microstructure will fill a void where information is lacking. UIT has
been shown to mitigate the tensile stresses induced by welding, but the direct
connections between UIT process parameters and the resultant surface residual
stresses have not been determined for the 5xxx series alloys.
4. X-ray Diffraction Measurements
Since UIT and other peening methods depend upon compressive residual
stresses for mitigation of fatigue and SCC, the capability to measure surface
residual stresses is vital. Residual stresses can be measured by both destructive
(e.g., hole-drilling, slit-compliance) and non-destructive methods (e.g., x-ray,
synchrotron x-ray, neutron diffraction) [59]. X-ray and neutron diffraction have
both been used to measure residual stress distributions in aluminum welds. In
particular, James et al. have used synchrotron x-ray diffraction to measure the
residual stress distribution in GMAW welds of AA5083 (Figure 7), Tensile
Stresses section above). They observed tensile stresses as high as 100 MPa
parallel to the weld. While synchrotron x-ray and neutron diffraction are able to
measure three-dimensional distributions of residual stress through thick (10–30
mm thick) aluminum structures, they require large, special purpose facilities that
cannot be used to perform field measurements.
The comparison of residual stress measurements using x-ray diffraction,
synchrotron, and neutron diffraction has demonstrated good agreement between

28
these techniques (Figure 9) [35]. These results suggest that x-ray diffraction is a
practical method of measuring residual stresses in the laboratory. X-ray
diffraction has also been used to measure the residual stresses on the surface of
aluminum welds before and after UIT (Figure 12, above). This type of x-ray
diffraction has also been developed into a commercial diffraction instrument with
portable capabilities as proven by the successful use in a warehouse laboratory
as well as onboard a Canadian naval vessel [60, 61].
When using x-ray diffraction, the elastic strain level in the surface of the
sample is measured, and the stress is calculated based upon linear elasticity
theory (represented in Figure 13). The spacing between planes of atoms in the
crystalline lattice provides the fundamental length scale for these “atomic strain
gauge” measurements. This “d-spacing”, dhkl, can be related to the x-ray
diffraction angle through Bragg’s law (Equation 2).
Equation 2.
Lambda (λ) is the wavelength of the incident x-ray (cobalt for this
research) and theta (θ) is the Bragg diffraction angle. The lattice spacing, dϕψ, is
the measurement of the lattice spacing for a given {hkl} reflection at a given
sample orientation (ϕ) and a given x-ray source orientation (ψ). The strain
component perpendicular to the scattering vector, Q, is given by Equation 3.
Equation 3.
Where the unstrained lattice spacing (do) is determined from measurements
taken normal to the material’s surface. By measuring ε’33 for a series of ψ angles,
the strain components εij can be determined for a given sample orientation, ϕ, by
solving the following system of equations:
Equation 4.
Typically, ε13 and ε23 are assumed to be close to zero, thus Equation 4
becomes:

29
Equation 5.
which is linear in sin2ψ. If one assumes isotropic elastic properties and that the
stress normal to the sample surface, σ33, is zero (assumed in XRD because x-
rays do not penetrate more than a few microns [62]), then the measured strain
can be related to the stress as:
Equation 6.
At ϕ=0, the level of stress is simply the linear slope of ε’33 plotted against
sin2ψ. This behavior is termed “regular” sin2 behavior and is the basis for
traditional laboratory x-ray residual stress measurements (Figure 14) [62]. The
components of σ11, σ22, and σ12 can be measured independently by repeating
this measurement for different values of the sample orientation, ϕ.

30
Figure 13. Visual depiction of measuring lattice planes of a specimen using x-ray diffraction. This method is used to determine residual stresses in
a material.
Figure 14. Regular (a,b) and irregular (c) d-spacing versus sin2ψ results (from [62]). The branching in (b) is indicative of out of plain strains εi3.
31
C. THESIS OBJECTIVES
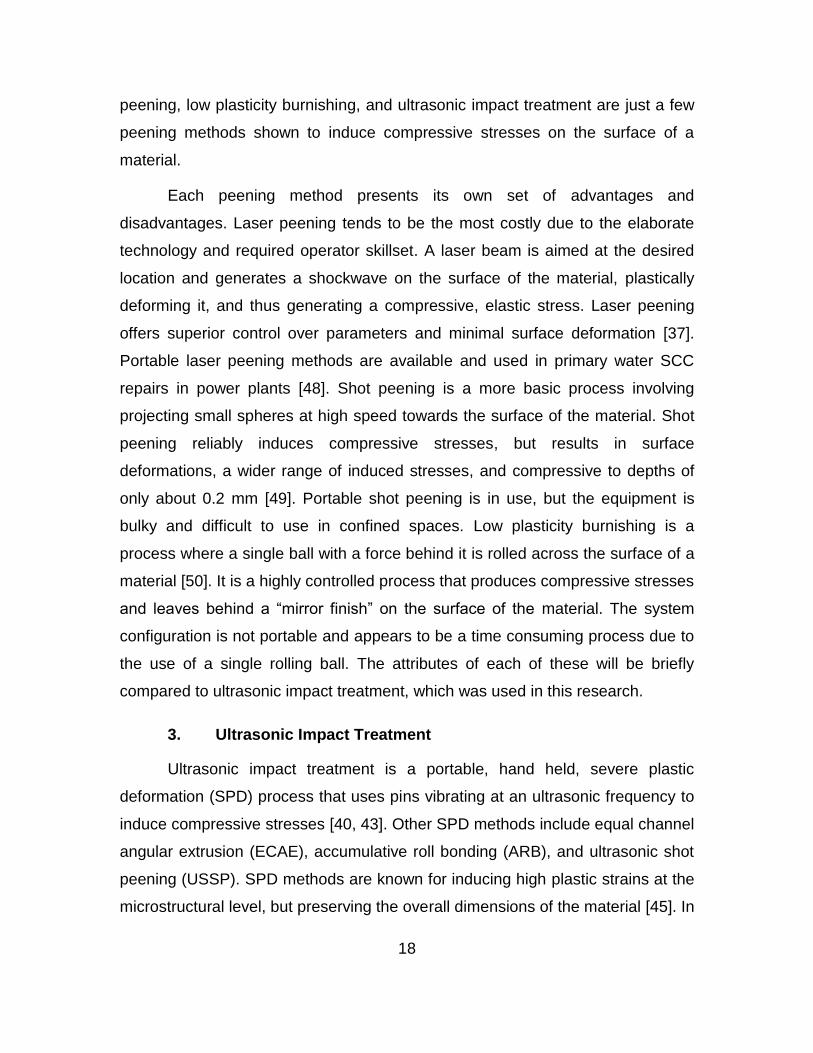
The purpose of this thesis is to investigate the residual stresses generated
by ultrasonic impact treatment on welded AA5456 plate material, both in the
laboratory and in the field. This information will lead to more effective means for
resolving SCC issues plaguing USN cruisers (Figure 15). The laboratory
experiments will provide a more comprehensive understanding of the processing-
microstructure-property relationships. These field measurements are the first
attempt to take this approach to analyzing aluminum structures on USN ships.
Figure 15. Existing stress corrosion crack on the O4 Level of a United States Navy cruiser.
The following objectives were established for research in this thesis:
Successfully use x-ray diffraction to measure residual stresses on welded and ultrasonically treated aluminum plates.
Explore the effects of UIT control parameters on the surface residual stresses generated in sensitized AA 5456 plate.
Perform x-ray residual stress measurements on a U.S. Navy cruiser.
Examine the effects of UIT on the weld microstructure.

32
THIS PAGE INTENTIONALLY LEFT BLANK

33
II. EXPERIMENTAL METHODS
Five sets of x-ray residual stress measurements were made on welded
aluminum alloy 5456 plates, representing a variety of plate and welding
conditions. One sample was a 32.43 mm (1.277 in) thick plate that was welded
using gas tungsten arc welding (GTAW). Two sample sets were comprised of
sensitized, shipboard material that was joined by gas metal arc welding (GMAW)
and then subsequently subjected to ultrasonic impact treatment (UIT). The final
sample was the aluminum deck of a U.S. Navy cruiser. Surface and depth-
resolved residual stress measurements were taken using x-ray diffraction (XRD).
Electrolytic polishing was conducted on various samples to determine the best
solution and, ultimately, conduct the depth-resolved measurements.
A. LABORATORY EXPERIMENTS
1. Residual Stress Measurements
The Proto iXRD Residual Stress Analyzer was used to measure the
residual stresses at various locations on each sample. This instrument is a
dedicated x-ray diffractometer, specifically designed for residual stress
measurements. The diffractometer remained in the manufacturer’s radiation
safety enclosure for the duration of all laboratory measurements. Startup was
conducted in accordance with the standard and emergency operating procedures
(SEOP) at the beginning of each day (or following any shut down period) [63].
Prior to collecting any data, the alignment of the equipment was verified using
stress free and high stress aluminum standards.
Stress free powder standards and high stress standards were used to
confirm alignment of the system. The 99.5 percent pure aluminum powder
standard was secured in position on the test stand using putty and leveled using
a simple bubble level. The iXRD collimator was adjusted in the ‘x’ and ‘y’
directions using the system motors (Figure 16). The manual focus or autofocus
option was used to determine the required “z” position of the collimator and
34
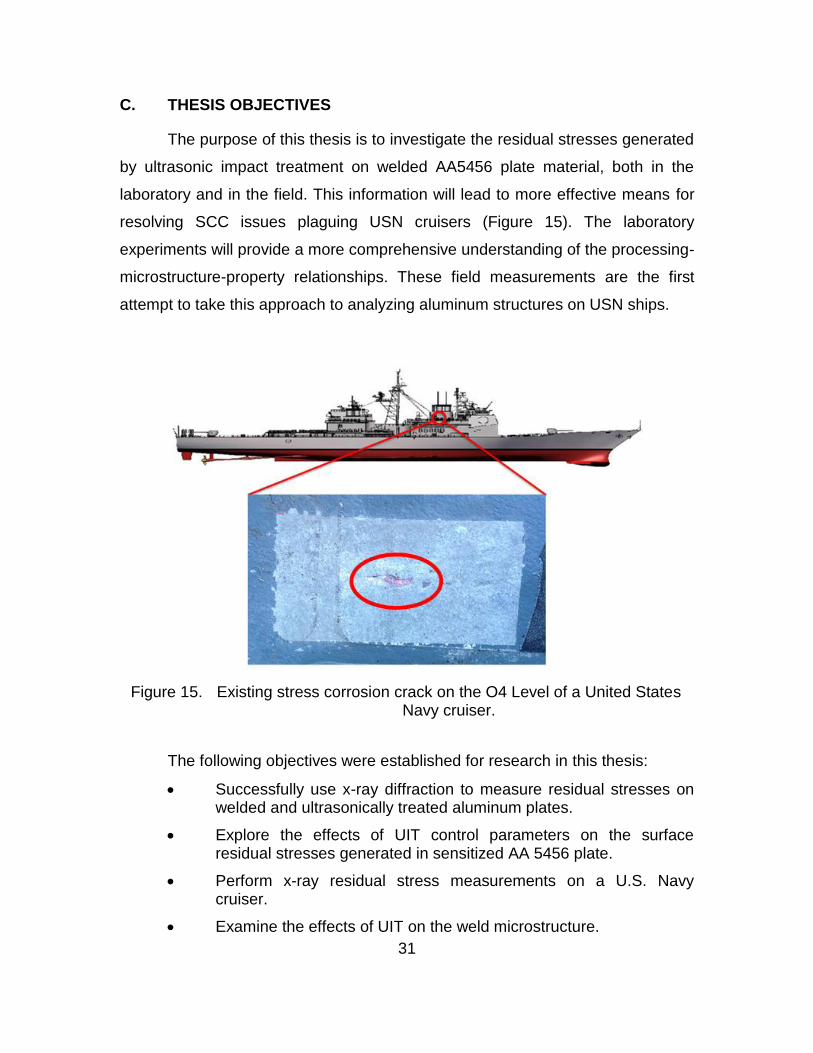
stored in the XRDWIN software. In order to conduct measurements, the pointer
was removed and the 2 mm aperture was placed in the collimator.
Figure 16. The Proto Manufacturing iXRD with close up of collimator used to collect residual stress values for AA5456 samples (after [64]). The
high stress sample is pictured.
A single XRD profile of the aluminum powder standard was collected
using the single exposure technique (SET). The beta and phi angles were set to
zero (Figure 17). To ensure that the full range of the peak was visible and that
there was room for peak broadening, the location of the diffraction peak on the
detectors was reviewed on the representative graphs in the profile window. If the

35
peaks were not centered, the detectors were moved to compensate for the shift
in peaks and additional SET measurements were collected. The background fit
and the region of interest (ROI) were adjusted to include only the region of the
peak desired (Figure 18).
Figure 17. The Proto Manufacturing iXRD with each axis labeled. The X and Y axes had a range of ±50 mm from the zero position. The Z axis had a range of ±50 mm. The β axis had an arc from ±45°. The φ axis had a
range of 0° to 180°.
36
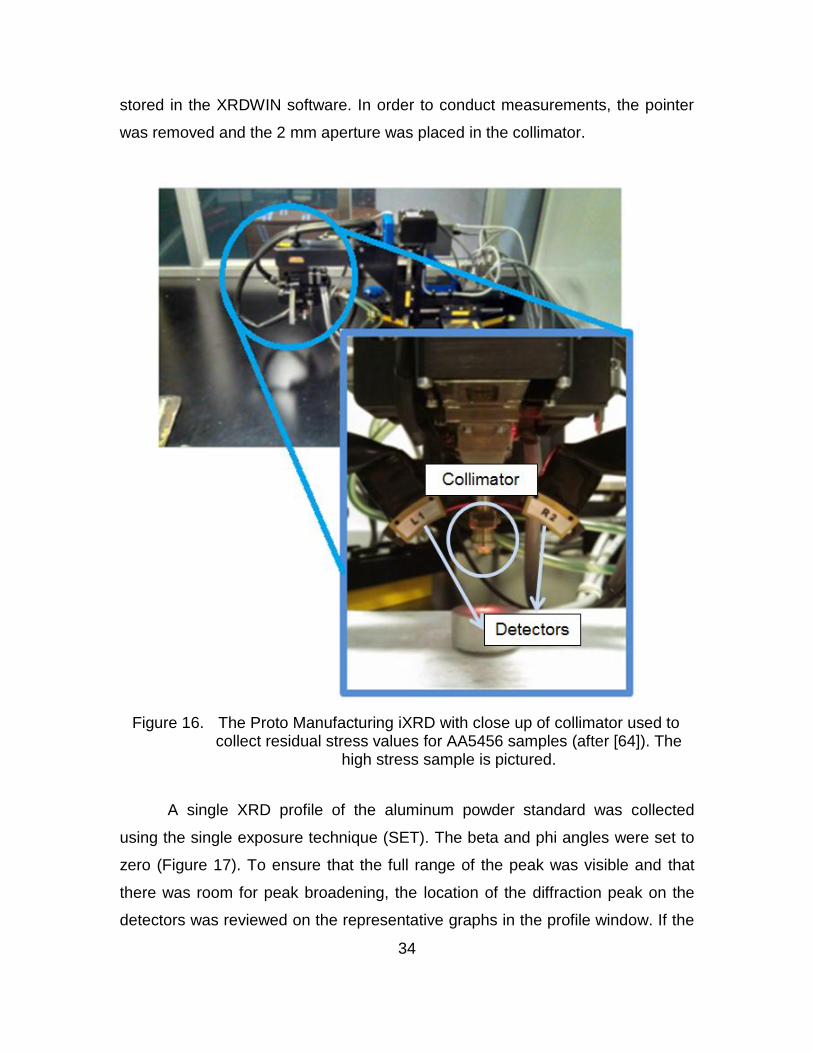
Figure 18. Results from a single exposure technique measurement of the aluminum powder standard. The region of interest is labeled and enclosed by the vertical dashed lines. The background fit is also
labeled and depicted by the green horizontal line.
Gain measurements were made to provide a background signal level on
the charge coupled device (CCD) detectors for the x-ray diffractometer. The gain
established a baseline that was used for background subtraction during the
diffraction peak analysis. A β-titanium gain shim was placed atop the aluminum
powder standard to collect the gain. If the data returned was not well matched
with the profile (Figure 19), the accelerating voltage on the x-ray was varied to
achieve better agreement. The gain voltage value remained at 10 kilovolts for the
majority of the measurements. The gain shim was removed to expose the
powder standard and take additional measurements.

37
Figure 19. Profile of a single exposure technique measurement taken on the stress free aluminum powder standard. The blue horizontal line
represents a well-matched gain. The red curve shows the diffraction signal from the aluminum, stress-free powder.
Three to five multiple exposure techniques (MET) were conducted to
determine the stress in the powder standard. The phi angle was set to zero and
eleven beta angles were examined, evenly spaced from 25 to -25 degrees. The
results were analyzed by reviewing the bitmaps of the diffraction peaks at each
beta angle for any inconsistencies (Figure 20). Measurement irregularities
included no return on the data (e.g., all noise in the graph and no peak), jagged
peaks, and lopsided peaks. These irregularities were a result of shadowing and
were encountered more often during sample data collection vice standards
measurements. The Background Fit and ROI were once again adjusted, but the
settings had to be generic enough to include the diffraction peaks from each beta
angle (visible when reviewing bitmaps). The d-spacing versus sin2ψ plot was
reviewed to verify low out-of-plane shear stress values were returned for the
aluminum standards (Figure 21). A wide ellipse (ψ-splitting) indicated high out-of-
plane shear strain values and, thus, a misalignment in the system when
measuring the standards [62]. Out-of-plane shear stress values were compared
to the baseline values returned during installation; a value that exceeded ±10
MPa was cause for concern.

38
Figure 20. Measured diffraction peak from single exposure technique measurement of the stress free aluminum powder standard. This
bitmap exhibits a smooth peak with very little noise (the red curve) and is an ideal representation of expected data return. A two-peak
Gaussian method in conjunction with the linear psi fit correction was used to fit the peaks and determine peak location.
Figure 21. D-spacing versus sin2ψ results from a multiple exposure technique measurement on the high stress aluminum standard. The slim ellipse was indicative of an acceptable out-of-plane shear and good system
alignment.

39
If acceptable data was returned for the aluminum powder standards, one
to three MET scans were conducted on the high stress aluminum standard. The
collimator was defocused, the powder standard was replaced by the high stress
standard, and the collimator was focused again. Measurements were taken and
analyzed in the same manner discussed above. However, in some cases the
stress and/or out-of-plane shear values initially achieved were outside the
acceptable range for one or both standards (standards and acceptable values
given in Table 4), and troubleshooting was required to realign the system.
Alignments were verified in the following order: beta arc, manual and autofocus
pointers, and tube placement. Realignments were conducted as necessary.
Table 4. Acceptable values of stress measurements and stress measurements collected for aluminum powder and high stress
standards.

40
Table 5. Proto iXRD parameters for laboratory based residual stress measurements on AA5456-H116.
For each of the measurements taken using the Proto iXRD, the surface of
the material was located using the manual or automatic pointer. Biaxial MET and
biaxial teach maps were the two primary types of measurements conducted
(using parameters in Table 5). Single point MET measurements were mostly
used for depth-resolved testing. The scans (conducted as discussed above for
the standards) were completed after each set of electrolytic polishing (as outlined
in the Electrolytic Polishing section). After each polish, the autofocus pointer was
used to locate the newly exposed surface of the material. Teach maps were
formed in the XRDWIN software for measurements taken across the various
welds and UIT areas of AA5456. The user selected the line where the
measurement was taken for each teach map. The number of points and the
spacing of points were entered into the software. The spacing was larger in the
base metal, but as the data points approached the estimated HAZ, the spacing

41
was shortened to 2 mm (the aperture used was 2 mm, thus shorter distances
would have been ineffective). The autofocus feature collected and stored the ‘Z’
value at each of the selected points. The pointer was removed and the scan was
initiated. The iXRD automatically moved from point to point collecting biaxial
measurements at each point.
2. Non-sensitized, Systematically Gas Tungsten Arc Welded
Sample set one was analyzed to confirm that the iXRD reliably measured
the residual stresses across welds in AA5456 plate. Sample set one consisted of
two 23.9 cm (9.41 in) wide, 21.7 cm (8.54 in) long, and 32.43 mm (1.277 in) thick
plates of AA5456-H116 welded perpendicular to the rolling direction using four
systematically different conditions of GTAW (Figure 22/Table 6). The plates were
procured from Sunshine Metals. The chemical composition of AA5456 is:
magnesium 5.07, manganese 0.64, iron 0.181, silicon 0.114, chromium 0.085,
titanium 0.0231, zinc 0.017, copper 0.012 and the remainder aluminum. The
compositions are given in weight percent and were certified by the American
Bureau of Shipping. Members of the NPS machine shop fabricated the “bead-on-
plate” welds with the gas tungsten arc welding (GTAW) process using the Miller
Syncrowave 300 power supply. The plates were autogeneously welded and 100
percent argon gas was used for shielding.
The residual stresses on these plates were analyzed using the teach map
feature discussed in the Residual Stress Measurements section. A teach map
was developed across each of the welds at 5 mm increments in the base metal
and 2 mm increments as the points approached the HAZ. The x-ray diffraction
measurements were performed using the conditions listed in Table 5. The
measurements were taken on the machined surfaces of the plates without any
surface preparation.

42
Figure 22. Optical macrographs of GTAW AA5456-H116 plate. The plate on the left was welded at a speed of 50.8 mm/min and the plate on the right
was welded at 152 mm/min.
Table 6. GTAW parameters for non-sensitized AA5456-H116 plate
Where power, Q, was determined using Equation 7 and heat input, H, was
determined using Equation 8 (scaling values used for conversion factor),
respectively:
Equation 7.
Equation 8.
3. Sensitized, Systematically Ultrasonic Impact Treated, Gas Metal Arc Welded
Sample set two consisted of two 37 cm (14.6 in) wide, 36 cm (14.2 in)
long, and 6.35 mm (0.25 in) plates composed of sensitized AA5456 plate
material cut from a U.S. Navy cruiser (Figure 23). The material was obtained

43
from the O4 level. Random ASTM G67 testing for degree of sensitization (DOS)
of material from the O4 level of a U.S. Navy cruiser indicate DOS levels that
range from 40 to >60 mg/cm2. The plates were butted together to form a 60
degree single-v groove joint. The welds were fabricated with 5556 filler metal by
the GMAW pulse process at the Naval Surface Warfare Center Carderock
Division (NSWCCD). Welding parameters are provided in Table 7.
Figure 23. Two plates of sensitized, GMAW butt welded AA5456-H116 at various UIT conditions. Clockwise from top left: Surface A, Surface C,
Surface D, and Surface B. Parameters given in Table 8.
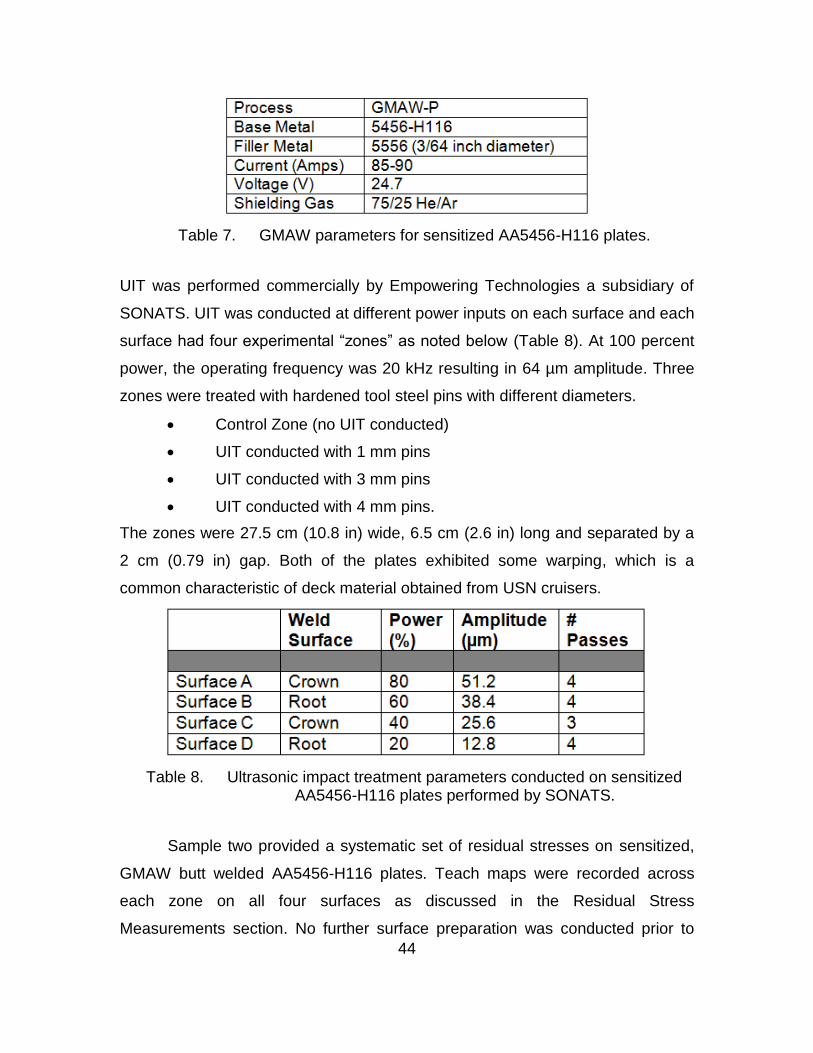
44
Table 7. GMAW parameters for sensitized AA5456-H116 plates.
UIT was performed commercially by Empowering Technologies a subsidiary of
SONATS. UIT was conducted at different power inputs on each surface and each
surface had four experimental “zones” as noted below (Table 8). At 100 percent
power, the operating frequency was 20 kHz resulting in 64 µm amplitude. Three
zones were treated with hardened tool steel pins with different diameters.
Control Zone (no UIT conducted)
UIT conducted with 1 mm pins
UIT conducted with 3 mm pins
UIT conducted with 4 mm pins.
The zones were 27.5 cm (10.8 in) wide, 6.5 cm (2.6 in) long and separated by a
2 cm (0.79 in) gap. Both of the plates exhibited some warping, which is a
common characteristic of deck material obtained from USN cruisers.
Table 8. Ultrasonic impact treatment parameters conducted on sensitized AA5456-H116 plates performed by SONATS.
Sample two provided a systematic set of residual stresses on sensitized,
GMAW butt welded AA5456-H116 plates. Teach maps were recorded across
each zone on all four surfaces as discussed in the Residual Stress
Measurements section. No further surface preparation was conducted prior to

45
measurement. On Surface A (80 percent power) in the 3 mm pin zone,
repeatability experiments were conducted by taking multiple teach maps across
the same area. Depth-resolved measurements were taken on Surface A (control,
1 mm, and 4 mm pin sizes) and Surface C (40 percent power, 4 mm pin size) at
a position in or near the HAZ and a position in the base metal. The areas were
electropolished using the “L1” solution as discussed in the Electrolytic Polishing
section below. Following each layer removal with electropolishing, depth was
determined and an MET measurement was taken (as discussed in the Residual
Stress Measurements section above) at each location.
4. Non-sensitized, Various Ultrasonic Impact Treated Areas, Gas Metal Arc Welded
Sample three consisted of two specimen of 9.525 mm (0.375 in) thick, as-
manufactured AA5456-H116 butt welded together parallel to the rolling direction
of the material (Figure 24). Dr. Tran provided sample three, which was welded at
NSWCCD using GMAW (welding parameters provided in Table 9). UIT was
conducted at the toe of the weld on both sides. A patch of UIT was also
conducted in the upper left corner of the plate. The UIT was conducted using a 3
mm diameter pin at a frequency of 20 kHz.
Figure 24. Two plates of non-sensitized, GMAW butt welded AA5456-H116. UIT is present at the toe of the weld and in a patch near the top left
corner.

46
Table 9. GMAW parameters for non-sensitized AA5456-H116.
Due to the non-systematic nature of sample three, it was used largely for
comparison of residual stresses on non-sensitized AA5456-H116 with and
without UIT. Residual stress measurements were taken via a teach map across
the weld as well as three METs at individual locations including: base metal, the
UIT patch, and the UIT line along the toe of the weld. No surface preparation was
conducted and data was collected using methods in the Residual Stress
Measurements section. Electropolish tests were conducted using various
parameters as discussed in the Electrolytic Polishing section (below) to
determine the best solution, time, and frequency parameters. A depth resolve
measurement was attempted on the UIT patch using a solution of equal parts
perchloric acid and Electrolyte ‘A’.
5. Sensitized, Ultrasonic Impact Treated, Gas Metal Arc Welded
Sample four was a single specimen of 19.5 cm (7.68 in) wide, 41 cm (16.1
in) long, and 6.35 mm (0.25 in) thick plate cut directly from the superstructure of
a U.S. Navy cruiser (Figure 25). This sample provided by Dr. Tran had a GMAW
butt weld parallel to the rolling direction and along the edge of the plate. The weld
was fabricated during original ship construction; therefore, the welding
parameters are unknown. UIT was conducted on the base metal and at the root
of the weld subsequent to removal from a U.S. Navy cruiser. Empowering
Technologies completed both treatments. The base metal UIT was performed
with a multi-pin (3 mm diameter each) tool at a frequency of 20 kHz. The UIT at

47
the root of the weld was conducted using a single 3 mm diameter pin tool at a
frequency of 20 kHz. The degree of sensitization for these samples ranged from
40 to >60 mg/cm2.
Figure 25. Sensitized AA5456-H116 removed from superstructure of USN cruiser.
Because sample four did not offer a systematic set of data, residual
stresses were measured to determine variances that occur due to UIT as well as
the condition of material following time in service. Two teach maps were
collected on the surface of the material: one across the root of the weld and one
from the crown of the weld into the base metal. No surface preparation was
conducted and data was collected using the methods described above in the
Residual Stress Measurements section. Electropolishing tests were conducted
on sample four using only ‘Electrolyte A’ to determine the best time and
frequency parameters, as discussed in the Electrolytic Polishing section. Depth
was determined and quality of polish was assessed for each instance of
electropolishing.

48
6. Electrolytic Polishing
The Proto Electrolytic Polisher Model 8818-V3 (Figure 26) was used to
systematically remove material from the surface of the samples in order to
produce depth-resolved residual stress measurements. Solution, polish time, and
voltage were determined based on a series of experiments conducted on sample
three and sample four. Solutions were mixed before being placed in the center
chamber of the stainless steel electrolytic tank. The ‘L1’ solution was placed in
the freezer prior to use and in between every couple uses to decrease the
temperature and maintain viscosity. Other solutions were used at room
temperature.
Figure 26. Proto Electrolytic Polisher Model 8818-V3 used to remove surface material for depth resolve measurements. (image adapted from [65])
A circuit and chemical reaction were required to conduct electrolytic
polishing. The 15 mm rubber tip was selected for the probe and pressed against
the surface of the material, supplying the electrolyte. The black banana plug was
placed into the probe (cathode) and the red banana plug was placed into a large
alligator clip, which was clamped to the edge of the selected sample (anode).
When the power supply was turned on, current was passed through the

49
electrolyte from the anode to the cathode. The electrolyte reacted with the
sample to remove material. The voltage and time were selected on the
electrolytic polisher main control panel.
Throughout the duration of tests conducted, the spots were closely
scrutinized for pitting, quality of polish, and depth attained. Residual stress
measurements were taken to compare the polishes from a solution of only
‘Electrolyte A’ and a solution of equal parts ‘Electrolyte A’ and perchloric acid.
Depths were measured as needed using the iXRD autofocus pointer. Polishing
times varied greatly for the tests for the sake of achieving desired depth. Table
10 organizes the parameters tested.

50
Table 10. Solutions, voltages and times tested for electrolytic polishing with a description of the polish achieved.
7. Microstructural Analysis
Electron microscopy was used to examine the microstructure of the
aluminum after UIT. Two cross-sectional samples were cut transverse to the
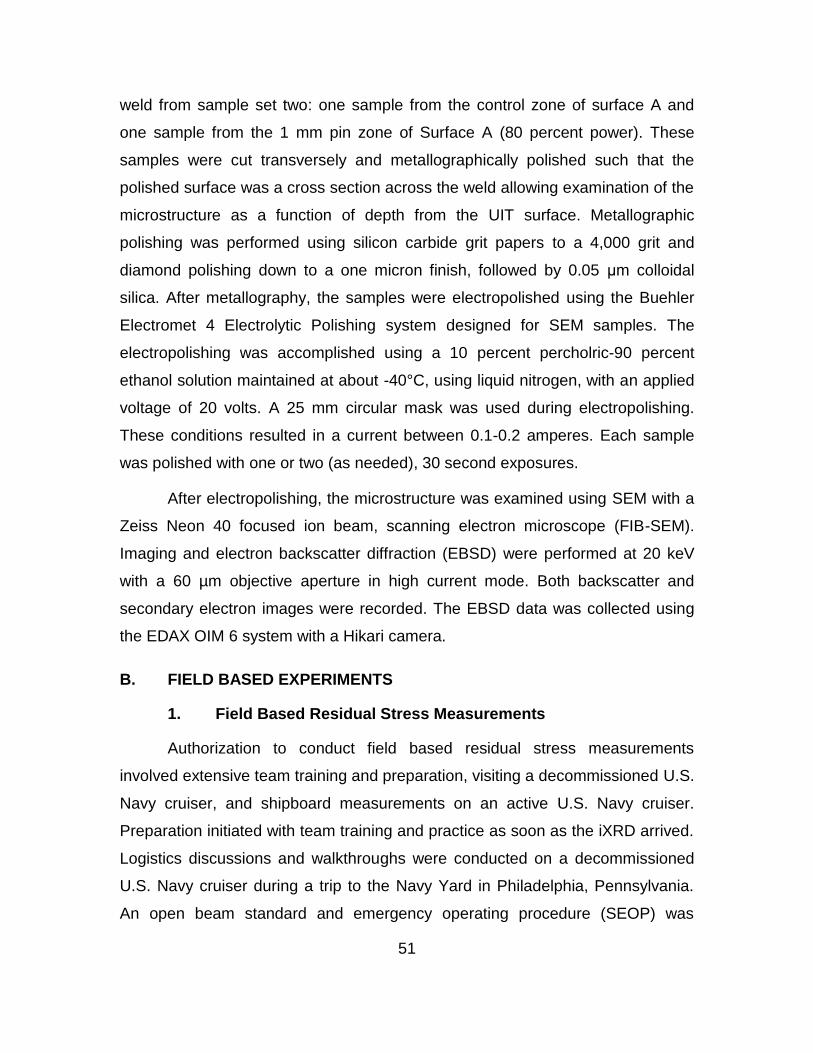
51
weld from sample set two: one sample from the control zone of surface A and
one sample from the 1 mm pin zone of Surface A (80 percent power). These
samples were cut transversely and metallographically polished such that the
polished surface was a cross section across the weld allowing examination of the
microstructure as a function of depth from the UIT surface. Metallographic
polishing was performed using silicon carbide grit papers to a 4,000 grit and
diamond polishing down to a one micron finish, followed by 0.05 μm colloidal
silica. After metallography, the samples were electropolished using the Buehler
Electromet 4 Electrolytic Polishing system designed for SEM samples. The
electropolishing was accomplished using a 10 percent percholric-90 percent
ethanol solution maintained at about -40°C, using liquid nitrogen, with an applied
voltage of 20 volts. A 25 mm circular mask was used during electropolishing.
These conditions resulted in a current between 0.1-0.2 amperes. Each sample
was polished with one or two (as needed), 30 second exposures.
After electropolishing, the microstructure was examined using SEM with a
Zeiss Neon 40 focused ion beam, scanning electron microscope (FIB-SEM).
Imaging and electron backscatter diffraction (EBSD) were performed at 20 keV
with a 60 µm objective aperture in high current mode. Both backscatter and
secondary electron images were recorded. The EBSD data was collected using
the EDAX OIM 6 system with a Hikari camera.
B. FIELD BASED EXPERIMENTS
1. Field Based Residual Stress Measurements
Authorization to conduct field based residual stress measurements
involved extensive team training and preparation, visiting a decommissioned U.S.
Navy cruiser, and shipboard measurements on an active U.S. Navy cruiser.
Preparation initiated with team training and practice as soon as the iXRD arrived.
Logistics discussions and walkthroughs were conducted on a decommissioned
U.S. Navy cruiser during a trip to the Navy Yard in Philadelphia, Pennsylvania.
An open beam standard and emergency operating procedure (SEOP) was

52
developed in accordance with the U.S. Navy radiation safety requirements (set
forth [66]) and NPS policies. All team members attained radiation worker
qualifications and one member attained his radiation safety officer qualification.
With final approval of the SEOP, an open beam field experiment was conducted
at NPS to practice the process. Paint removal and surface preparation methods
were also developed and tested prior to a shipboard visit. Initial shipboard field
measurements occurred on site in San Diego, California with a team consisting
of one student, one professor, and the NPS radiation safety officer.
The iXRD had to be assembled and disassembled daily due to
environmental exposure and storage limitations. The setup location each day
depended on the testing area (position one or position two). The iXRD field
based setup (Figure 27) and start-up were conducted in accordance with the
open beam SEOP and the Proto iXRD manual. To prepare the space, the
sample area was polished to a mirror finish as discussed below. For safety
considerations [66, 67]:
The thickness of the deck was confirmed using an ultrasonic transducer and compared to the plot in Figure 28. To verify safety of personnel passing beneath the work area. A minimum thickness of 2 mm (0.079 in) was required. The standard deck thickness in these field measurements was 6.35 mm (0.25 in).
The area was posted for radiation at the required 1 meter radius in all directions to achieve an x-ray exposure rate of <2 mrem/hr as shown in Figure 29.
A radiation survey was conducted.
All team members were required to wear personal dosimetry.

53
(a)
(b)
(c)
Figure 27. Shipboard field setup of Proto iXRD and radiation safety equipment. Image (a) is the field configuration for position one. Image (b) is the
field configuration for position two. Image (c) shows a broader view of the work area.
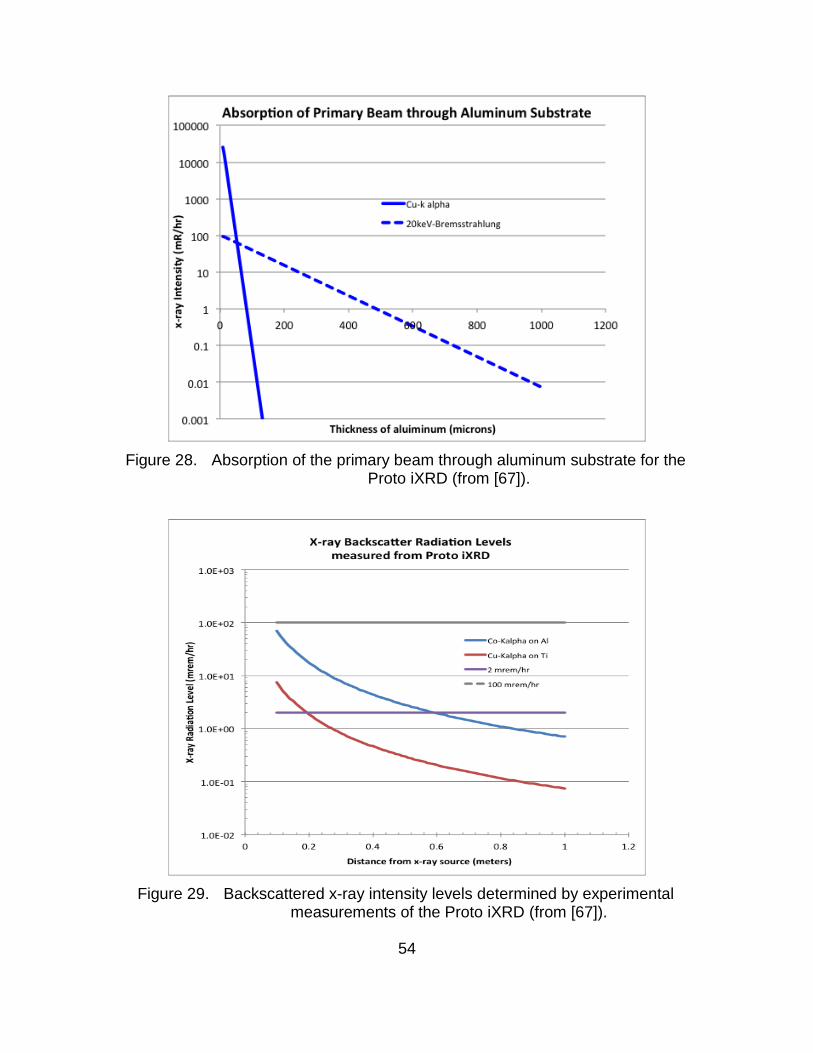
54
Figure 28. Absorption of the primary beam through aluminum substrate for the Proto iXRD (from [67]).
Figure 29. Backscattered x-ray intensity levels determined by experimental measurements of the Proto iXRD (from [67]).

55
Field based residual stress measurements were conducted following the
completion of the SEOP. The system alignment was verified using the aluminum
powder and high stress standards in the same manner as discussed in the
laboratory Residual Stress Measurements section. However, prior to entering the
posted area, a scan using the IM-231A ionization chamber RADIAC was required
to determine if the area was safe to enter. The Proto Residual Stress Analyzer
hardware manual was used for any required system realignments. The software
parameters were similar to the laboratory parameters (Table 11). For some of the
measurements, the beta angles had to be adjusted for the safety of the
equipment and personnel due to the warped deck (discussed below).
Table 11. Proto iXRD parameters for field based residual stress measurements on shipboard AA5456-H116.
2. Shipboard, Sensitized, Gas Metal Arc Welded Aluminum Alloy 5456
X-ray residual stress measurements were performed at two locations
onboard an active U.S. Navy cruiser. The analysis location was selected on the
fourth deck high of the ship (O4 level). More specifically it was on the forward
portion of the ship, starboard side, directly beside the rear corner and midpoint of

56
the air intake. This area included an existing, patched crack near a GMAW weld.
The area from the weld to the crack was used as sample position one an area
near a separate weld was used as sample position two (Figure 30). An Olympus
Ultrasonic Thickness Gage measured the deck thickness to be 6.35 mm (0.25
in). The deck was noticeably warped. Nonskid tape was recently replaced
throughout the O4 level in accordance with shipboard safety requirements;
however the sample area was cleared of nonskid tape for these measurements.
The maintenance process performed on the sample area and welding
parameters of the existing shipboard weld are unknown. There was no UIT in the
sample area.
Figure 30. Shipboard sample location for residual stress measurements of field AA5456-H116. Sample position one is on the left (located at the rear
corner of the air handler) and sample position two is on the right (located roughly at the midpoint of the air handler).
For these measurements, surface preparation was required due to the
primer, paint, and nonskid residue remaining on the deck. Electropolishing was
not cleared for use on board the ship, so a metallographic polishing method was
used to prepare the surface. Low grit sandpaper (60, 120, and 220 grit) was used

57
on a household 5 inch random orbit sander to remove the surface paint and
primer. This surface was then hand sanded using 400 grit and 600 grit
sandpaper consecutively. Microfiber bonnets and aluminum oxide (Al2O3) slurry
(5 µm and 3 µm) were used with a household 6 inch orbital buffer to polish the
surface.
One attempt was made to use the new in situ metallography procedure
developed by Dr. W. J. Golumbfskie at NSWCCD [68]. This process uses a
portable, high-speed rotary tool with a series of silicon carbide (SiC) abrasive
discs and diamond impregnated polishing cloths. The following steps were used
for this procedure:
120 grit SiC for ~2 minutes at speed setting #5 (repeat until surface is smooth)
240 grit SiC for ~75 seconds at speed setting #5
320 grit SiC for ~75 seconds at speed setting #4
600 grit SiC for ~75 seconds at speed setting #4
1000 grit SiC for ~75 seconds at speed setting #4
6 µm diamond on Struers MOL cloth for 2.5 minutes at speed setting #5
1 µm diamond on Buehler Microcloth (or Struers NAP cloth) for 2.5 minutes at speed setting #4
0.3 µm alumna slurry on Buehler Microcloth (or Struers NAP cloth) for 2.5 minutes at speed setting #4
After completing this procedure, the quality of the surface polish was inspected
by a portable optical microscope. The quality of the surface polish was
reasonably good for optical microscopy and was better than the primary process
described above.
Residual stress measurements were taken at position one and position
two as discussed in the previous section using teach maps. At position one a
teach map consisting of four points was collected starting at the crown of the
weld and working towards the existing crack. The following three points were at
positions 15 mm, 30 mm, and 50 mm from the initial point. Nine beta angles were

58
used for this measurement due to the geometry of the deck. The angles were
spaced evenly from 20.01 to -20.01 degrees. All other software parameters were
identical to Table 11. A three point teach map starting at the crown of the weld
was developed for position two. Point two was 18.5 mm from the crown of the
weld and point three was 60.34 mm from the weld crown. These points were
expected to be in the HAZ and base metal, respectively. Eleven beta angles
were used for this measurement and were evenly spaced from 25 to -25
degrees.

59
III. RESULTS
D-spacing versus sin2ψ plots demonstrated the data upon which all of the
measurements are based (Figure 31 and Figure 32). Data collected from the two
standard aluminum specimens was used on a regular basis to verify the
alignment of the system. A nearly horizontal line with little to no sign of an ellipse
is expected and observed for the stress free powder aluminum standard. A slope
to this line, or significant splitting between the red and green points, would
indicate system misalignment. More specifically, splitting or branching in the d-
spacing versus sin2ψ plot is caused by an out-of-plane shear strain. The data in
Figure 30 is typical for a well-aligned system. The high stress standard contains
a relatively large level of compressive stress (-274 ± 23 MPa); therefore the d-
spacing versus sin2ψ plots should exhibit negligible splitting and a negative
slope. Excessive branching in this plot is also indicative of a system
misalignment. The data in Figure 31 is typical for a well-aligned system.

60
Figure 31. Sample d-spacing versus sin2ψ plot for the aluminum stress free powder standard. Stress and out-of-plane shear stress were
determined to be [-2.9± 1.7 MPa] and [-2.9 ± 0.8 MPa] respectively.

61
Figure 32. Sample d-spacing versus sin2ψ plots for the aluminum high stress standard. Stress and out-of-plane shear stress were determined to
be [-282.9 ± 8.3 MPa] and [-1.9 ± 4.0 MPa], respectively.
A. NON-SENSITIZED, SYSTEMATICALLY GAS TUNGSTEN ARC WELDED
Stress profiles across each of the “bead on plate” GTAW welds on the
non-sensitized AA5456 plate showed tensile residual stresses exceeding 100
MPa as a result of welding. Higher power input resulted in a larger HAZ. The
broadened region of tensile stresses shown in the 200 A/16.8 V/3360 W welds as
compared to the 100 A/15.4 V/1540 W welds in Figure 33 indicated a wider HAZ.
The faster weld travel speed resulted in higher tensile stresses at the weld center
and a narrower distribution of tensile residual stresses across the weld. This is
seen when comparing the 152.4 mm/min weld data with the 50.8 mm/min weld

62
data (Figure 33). The error bars shown are from the fitting error of the d-spacing
versus sin2ψ plot for each point. The error is larger at the center of the weld due
to the large grain size developed during fusion.
Figure 33. Residual stress measurements taken with the iXRD across the welds of the four GTAW welds on non-sensitized AA5456 plates.
Measurements were taken parallel to the weld.
B. SENSITIZED, SYSTEMATICALLY ULTRASONIC IMPACT TREATED, GAS METAL ARC WELDED
The residual stress measurements taken across the control zones were
representative of the residual stresses induced by the fusion of sensitized plates
using GMAW (Figure 34). The results are expected to closely mimic those
produced during repairs conducted on sensitized shipboard material without UIT.
On the crown side of the weld, GMAW induced stresses near +80 MPa; whereas
the root of the weld exhibited stresses significantly less, around +10 MPa. The
large error bars at distance of less than 5 mm from the center of the weld are

63
most likely due to the large grain size in the fusion zone. This large grain size can
cause considerable scatter in the x-ray diffraction measurements.
Figure 34. Longitudinal residual stresses measured as a function of distance perpendicular to GMAW on a surface without UIT.
The residual stress distributions across the welds after UIT clearly showed
the effect of the peening process (Figure 35 through Figure 38). The data for
each plate showed that UIT induces compressive stresses from the weld to the
base material. The magnitude of the compressive stresses was in the range from
roughly -100 MPa to -200 MPa in each case. UIT induced nearly the same
magnitude of compressive stresses from the weld through the HAZ and into the
base metal. The tensile stresses associated with the HAZ were completely
removed by UIT. There were no longer the tensile regions that were clearly seen
in each of the control surfaces. Surface B (60 percent power) showed the

64
clearest difference in the effect of pin sizes. Based on the results of Surface B
(60 percent power), 1 mm pins induced the greatest magnitude of compressive
stresses, followed by 3 mm pins and 4 mm pins. The pin size dependence of the
residual stresses was not as clear for the other power levels; however, the 1 mm
pin consistently induced slightly more compressive stresses than the 3 mm or 4
mm pins at 20, 40, and 60 percent power. This trend is least obvious at 80
percent power. The difference between residual stresses induced by 3 mm and 4
mm pins is less distinguishable in all cases. The level of residual stress was not
strongly affected by the power level during UIT.
Figure 35. Residual stresses for the four zones (1 mm, 3 mm, and 4 mm UIT pins) of Surface A (80 percent power input).

65
Figure 36. Residual stresses for the four zones (1 mm, 3 mm, and 4 mm UIT pins) of Surface B (60 percent power input).

66
Figure 37. Residual stresses for the four zones (1 mm, 3 mm, and 4 mm UIT pins) of Surface C (40 percent power input).

67
Figure 38. Residual stresses for the four zones (1 mm, 3 mm, and 4 mm UIT pins) of Surface D (20 percent power input).
The comparison of pin size and power was made clearer by examining
only the residual stresses present in the base metal. The average residual stress
in the base metal was determined by taking the mean value for the longitudinal
residual stress at distances between 25-100 mm away from the weld center. The
pin size was more clearly shown to affect the magnitude of compressive stresses
induced at 20, 40, and 60 percent power (Figure 39). The 1 mm pin induced the
most compressive stresses at 20, 40, and 60 percent power. The 3 mm pin
induced the most consistent magnitude of stresses. The 4 mm pin induced the
least compressive stresses at 40 and 60 percent power. The difference between
the stresses induced by the 1 mm pin and the 4 mm pin ranged from about 20
MPa to 75 MPa (compressive). Overall, the results suggested that the residual
stresses induced have a dependence on the pin size. The trend was seen

68
particularly at 20, 40, and 60 percent power. There may be some dependence of
the residual stress level upon the percent power, but the dependence was not
strong.
Figure 39. Magnitude of residual stresses in ultrasonically treated base metal suggests dependence on pin size and possibly percent power.
The depth resolved results (Figure 40) suggested that the magnitude of
residual stresses induced is maintained to a depth of at least 0.6 mm below the
surface, regardless of percent power or pin size. Regions of interest to conduct
depth resolved measurements were established using the residual stress profiles
above. The locations selected on Surface A (80 percent power) and Surface C
(40 percent power) presented a wide array of data for comparison, to include:

69
Measurements for 1 mm, 3 mm, 4 mm pin sizes
Measurements for multiple power inputs
Measurements of HAZ and base metal
UIT induced compressive stresses of -150 MPa to -250 MPa to depths of at least
0.6 mm in the HAZ and base metal. The results showed that the magnitude of
stresses induced by UIT near the treated surface is comparable regardless of the
power input or pin size in the HAZ and base metal.
Figure 40. UIT induces compressive stresses to depths up to 0.6 mm. The power input and pin size do not create a great deal of variance.
The residual stress measurement repeatability was determined by taking
seven measurements were across the 3 mm pin zone on Surface A (80 percent
power input). The d-spacing versus sin2ψ plot for the final measurement (y=100
mm) in each teach map is provided in Figure 41. The overlapping of this data
demonstrates the repeatability of the residual stress measurements using the
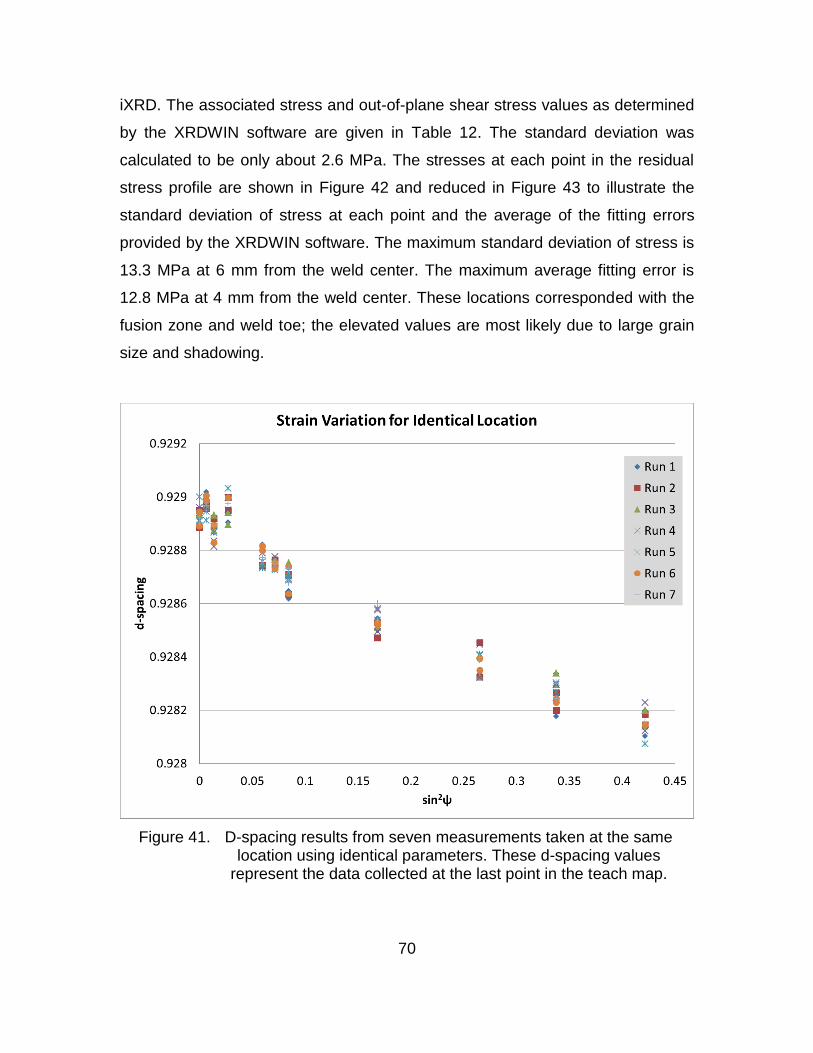
70
iXRD. The associated stress and out-of-plane shear stress values as determined
by the XRDWIN software are given in Table 12. The standard deviation was
calculated to be only about 2.6 MPa. The stresses at each point in the residual
stress profile are shown in Figure 42 and reduced in Figure 43 to illustrate the
standard deviation of stress at each point and the average of the fitting errors
provided by the XRDWIN software. The maximum standard deviation of stress is
13.3 MPa at 6 mm from the weld center. The maximum average fitting error is
12.8 MPa at 4 mm from the weld center. These locations corresponded with the
fusion zone and weld toe; the elevated values are most likely due to large grain
size and shadowing.
Figure 41. D-spacing results from seven measurements taken at the same location using identical parameters. These d-spacing values
represent the data collected at the last point in the teach map.

71
Table 12. Stress and out-of-plane shear stress data collected for the final point of seven teach maps conducted in the same location Surface A (80 percent power), 3 mm pin zone using identical parameters.
Figure 42. Stress measurements as calculated using the XRDWIN software based upon the data collected in the seven measurements at the
same location using identical parameters.
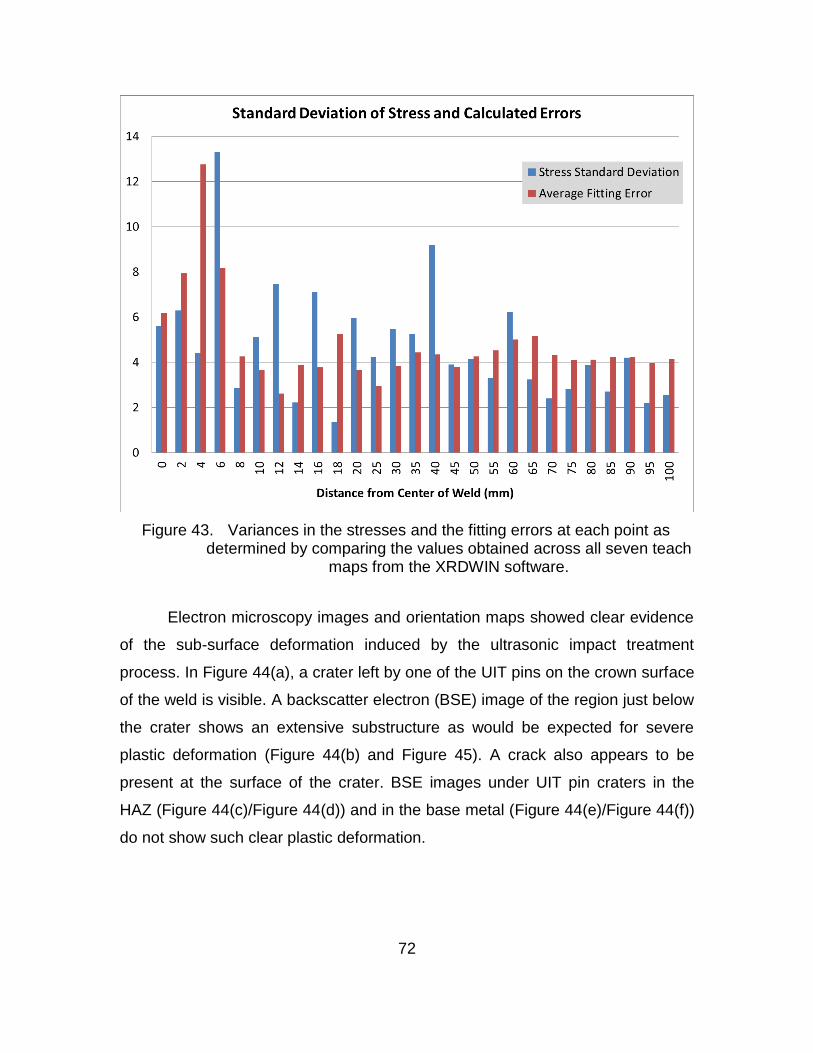
72
Figure 43. Variances in the stresses and the fitting errors at each point as determined by comparing the values obtained across all seven teach
maps from the XRDWIN software.
Electron microscopy images and orientation maps showed clear evidence
of the sub-surface deformation induced by the ultrasonic impact treatment
process. In Figure 44(a), a crater left by one of the UIT pins on the crown surface
of the weld is visible. A backscatter electron (BSE) image of the region just below
the crater shows an extensive substructure as would be expected for severe
plastic deformation (Figure 44(b) and Figure 45). A crack also appears to be
present at the surface of the crater. BSE images under UIT pin craters in the
HAZ (Figure 44(c)/Figure 44(d)) and in the base metal (Figure 44(e)/Figure 44(f))
do not show such clear plastic deformation.

73
(a)
(b)
(c)
(d)
(e)
(f)
Figure 44. Images captured from the crown (a, b), HAZ (c, d), and base metal (e, f) of Surface C (40 percent power) in the 1 mm pin zone. Images (b), (d),
and (f) are higher magnification versions of images (a), (c), and (e).

74
Figure 45. Higher magnification BSE image showing the deformation induced subgrain structure at a pin crater in Figure 44(b).
Figure 46 shows the grain size and shape under the UIT pin craters
shown in the weld and base metal (compliments Figure 44(a) and Figure 44(e)).
The average grain size in the fusion zone is approximately 40 µm, while the
average grain size in the base metal is approximately 20 µm. Some evidence of
the plastic deformation at the surface can be seen in these orientation maps from
the mottled appearance in the color scheme and the inability of the software to
consistently index the patterns. Mapping the orientation of the surface region
(Figure 47), reveals that the severe plastic deformation has refined the grain
structure such that the grains are only about 3 µm thick while closer to 30 µm in
length. In addition, there is a several micron thick band of highly deformed
material that cannot be systematically indexed with the collected EBSD data. It is
quite possible that this data comes from aluminum that has become
nanocrystalline after UIT.
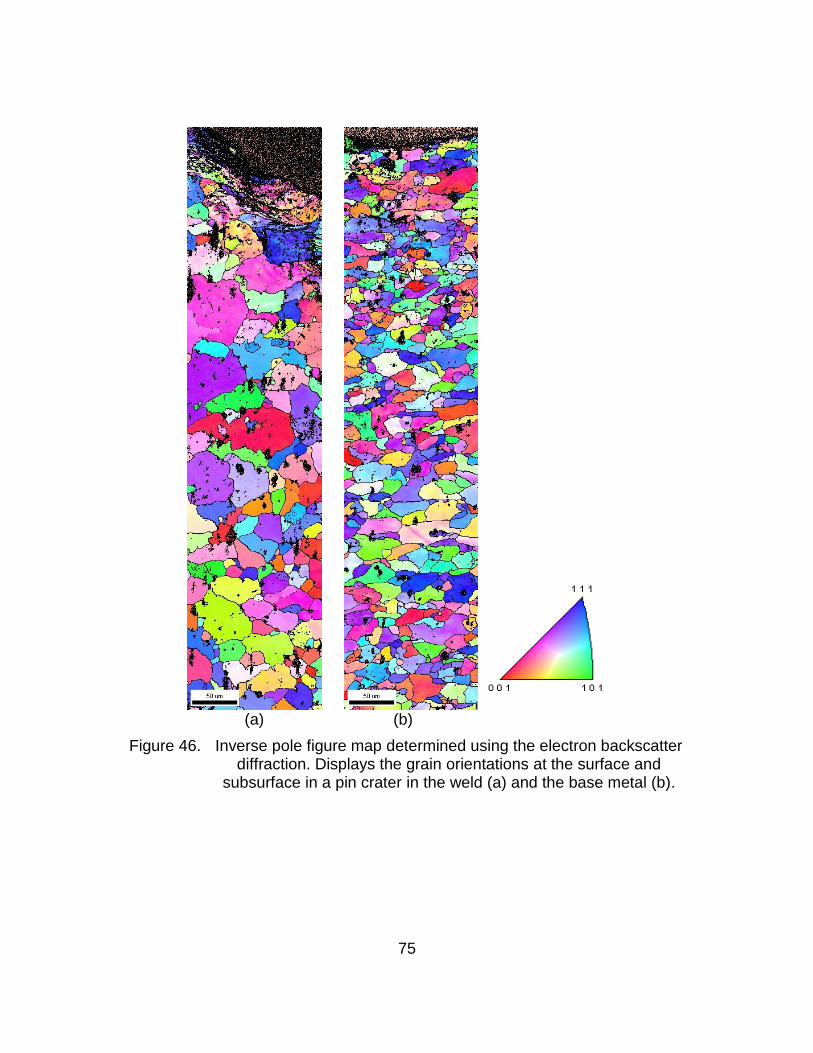
75
(a)
(b)
Figure 46. Inverse pole figure map determined using the electron backscatter diffraction. Displays the grain orientations at the surface and
subsurface in a pin crater in the weld (a) and the base metal (b).

76
Figure 47. Inverse pole figure of deformed region at the surface of the UIT pin crater in the crown region of the weld.
The extent of plastic deformation created by UIT can be further quantified
by mapping the degree of intragranular misorientation. There are several
methods for plotting intragranular misorientation, but the grain orientation spread
(GOS) was used here. The GOS first calculates the average orientation for each
identified grain and then plots the scalar misorientation between every point in
the grain and the average orientation. GOS values of 0.1-0.3 degrees are
indicative of crystalline material with little plastic deformation while values of one
degree and above demonstrate extensive plastic deformation. Maps of GOS
clearly show the level and extent of plastic deformation after UIT (Figure 48). The
crater in the crown region of the weld shows a zone of plastic deformation that
extends approximately 150 µm below the surface of the crater (Figure 48(a)).
The values of GOS are quite high and the grain to grain variation is also high. A
clear zone of plastic deformation is also visible under a UIT pin crater in the base

77
metal (Figure 48(b)). In this case, the GOS values are lower, as is the gradient in
GOS. The extent of plastic deformation seems qualitatively to extend for at least
200 µm below the surface.
(a)
(b)
Figure 48. Grain orientation spread found using electron backscatter diffraction for the weld (a) and base metal (b) at the surface and subsurface in a
pin crater. The color scheme is in degrees. Red (20 degrees) denotes an area with a large amount of intragranular misorientation.
Blue (0.1 degrees) denotes a region with very little intragranular misorientation.
20°
0.1°

78
Extensive intergranular cracking parallel to the UIT surface was observed
in the heat affected zone (Figure 49 and Figure 50). Starting at a distance of 14
mm from the weld toe on the root side (Surface D, 20 percent power, 1 mm pin
diameter), this intergranular cracking was visible throughout the HAZ to the end
of the sample, a distance of 20 mm from the weld toe. Even more extensive
intergranular cracking was observed on the crown side of the weld (40 percent
power, 1 mm pin diameter). This cracking started right at the weld toe and
continued throughout the HAZ to the end of the sample. The cracks were all
Intergranular, primarily parallel to the surface and occurred in multiple layers to a
depth between 100-200 μm below the surface. In contrast, no cracking was
observed on the crown or root sides of the control weld (Figure 51).

79
(a) (b)
(c) (d)
Figure 49. Images captured 14.6 mm from the toe of the weld, illustrating intergranular cracking. Image (c) and (d) are higher magnifications of
image (a) and (b).

80
(a) (b)
(c) (d)
Figure 50. Optical microscopy images of sub-surface intergranular cracking in regions that have experience UIT with a 1 mm pin diameter. (a) 40 percent power at the toe of the weld, (b) 40 percent power in the
HAZ, (c) 20 percent power at the toe of the weld, and (d) 20 percent power in the HAZ.

81
(a) (b)
(c) (d)
Figure 51. Optical microscopy images of sub-surface regions that have no UIT: (a) crown side of weld at the toe, (b) crown side in the HAZ, (c) root
side of the weld at the toe, and (d) root side in the HAZ.
C. FIELD MEASUREMENT RESULTS
After assembly on the deck of the U.S. Navy cruiser, the iXRD instrument
returned acceptable residual stress measurements for the stress free and high
stress aluminum standards (Figure 52 and Figure 53). The d-spacing versus
sin2ψ plot shows a horizontal trend for the stress-free aluminum powder sample
as expected. The d-spacing versus sin2ψ plot did exhibit some slight, but
systematic, branching. This branching was indicative of a small, out-of-plane

82
shear stress component. The calculated normal stress value was 6.8±2.0 MPa;
well below the 14 MPa limit for high quality measurements [69]. The value
determined for out-of-plane shear stress was -12.6±1.0 MPa, which is higher
than desired but also within the acceptable limits of ASTM-E-915 value of 14
MPa for acceptable alignment [69]. The diffraction measurements on the high-
stress standard returned even better results. The d-spacing versus sin2ψ plot
shows a relatively linear plot with a negative slope and little branching. The
measured normal stress was -275.0±9.1 MPa as compared to a standard value
of -274±23 MPa. The measured out-of-plane shear stress was -8.8±4.3 MPa.
Figure 52. D-spacing results from the successful field measurement of the stress free powder standard. Stress and out-of-plane shear stress
were determined to be [6.8 ± 2.0 MPa] and [-12.6 ± 1.0 MPa], respectively.

83
Figure 53. D-spacing results from the successful field measurement of the high stress standard. Stress and out-of-plane shear stress were determined to be [-275.0 ± 9.1 MPa] and [-8.8 ± 4.3 MPa],
respectively.
The measured residual stresses obtained from the deck of a U.S. Navy
cruiser were entirely compressive. Position 1(a), located outside the curved edge
of the weld, was prepared using in situ metallography (Figure 54). The residual
stress measurement returned a highly compressive value of -131.2 MPa (Figure
55). The surface in position 1(b) was prepared using a more basic metallographic
polishing method in order to take line map from the weld towards the crack (also
shown in Figure 54). The measurements collected at position 1(b) (Figure
56/Table 13) were the least compressive (-99 MPa) at the weld center. The
results trended towards higher magnitude compressive stresses as
measurements were taken away from the weld and closer towards the crack.
These results suggest position one is compressive across the area investigated.

84
Figure 54. Position one located on the O4 deck of a U.S. Navy cruiser, polished for measurements. Location (a) was where the in situ metallography
was conducted and location (b) was where the line profile was conducted from the weld towards the crack.

85
Figure 55. D-spacing of the successful field measurement on the deck of a U.S. Navy cruiser following Dr. Bill Golumbfskie’s in situ polishing and subsequent microstructural observation using his field apparatus.
Stress and out-of-plane shear stress values were determined to be [-131.2 ± 2.6 MPa] and [-8.9 ± 1.2 MPa], respectively.

86
Figure 56. Stress profile initiated at the center of the weld and moved towards the crack at position one.
Table 13. Stress values at each point in the stress profile from the center of the weld towards the crack at position one.
The final measurements, taken at position two (Figure 57), resulted in
compressive residual stresses of a similar magnitude (Figure 58/Table 14) as the
stresses obtained at position 1(a) and 1(b). However, the magnitude was largest
at the center of the weld, and decreased as measurements were taken further
from the weld center, which is the opposite trend as that shown for position 1(b)
(Figure 56/Table 13). It should be noted that sudden increase in material
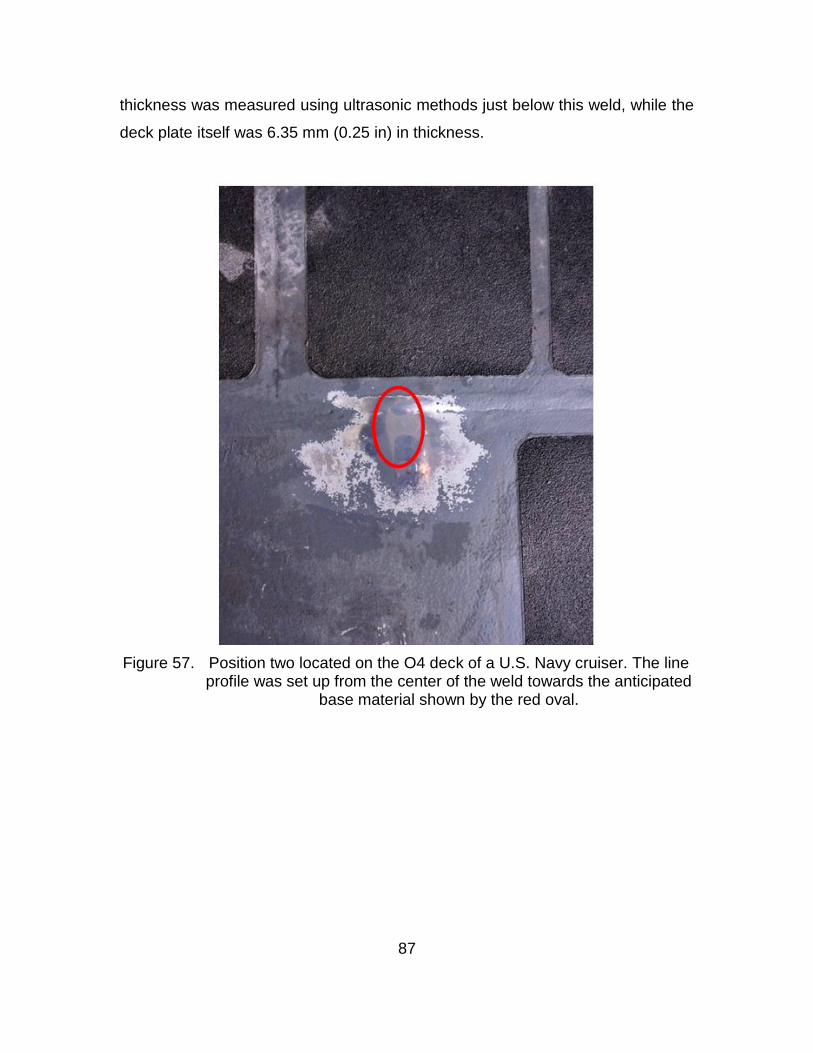
87
thickness was measured using ultrasonic methods just below this weld, while the
deck plate itself was 6.35 mm (0.25 in) in thickness.
Figure 57. Position two located on the O4 deck of a U.S. Navy cruiser. The line profile was set up from the center of the weld towards the anticipated
base material shown by the red oval.

88
Figure 58. Stresses collected in position two
Table 14. Stress values determined for the teach map taken at position two.

89
THIS PAGE INTENTIONALLY LEFT BLANK

90
IV. DISCUSSION
Using the three dimensional Rosenthal’s solution (Equation 9), it was
possible to predict the width of the expected fusion zone and HAZ for AA5456 at
the various parameters of GTAW based on the temperature gradient in the
material [30].The three-dimensional solution was used because the thickness of
the plate was much larger than the depth of the fusion zone (32.43 mm plate
thickness). The MATLAB code provided in the Appendix was used to determine
the fusion zone and HAZ for AA5456 [70]. The conditions in Table 15 were used
to solve Rosenthal’s solution and compared to the measured fusion zone and the
HAZ seen in the residual stress profiles (Table 16). The HAZ was determined
from the residual stress measurements as the point at which the values were no
longer tensile.
Equation 9.
Where
T = temperature
To = workpiece temperature before welding
k = workpiece thermal conductivity
Q = heat transferred from heat source to workpiece
V = travel speed
α = workpeice thermal diffusivity
R = radial distance from origin
I = current
V = voltage
Table 15. AA5456 material characteristics and atmospheric conditions considered for solving Rosenthal’s 3-D solution.

91
Table 16. Comparison of physical measurements and residual stress measurements with those predicted by the 3-D Rosenthal’s
solution.
The data collected in the GTAW, non-sensitized AA5456 plates
demonstrates a strong dependence of breadth of HAZ on heat input and a
dependence of the maximum tensile stress on weld travel speed. The agreement
between these measurements and the theoretical predictions from the Rosenthal
equations is close enough to demonstrate that x-ray diffraction is a valid method
for mapping residual stresses across welds. As heat input increased, a broader
the heat affected zone and region of tensile residual stresses were observed.
This increased in width was due to a lower thermal gradient. This width of the
tensile zone ranged from 8 mm for the two lower heat input conditions to 21 mm
for the largest heat input condition. Higher weld travel speed resulted in higher
peak residual stresses at the center of the weld, ranging from +100-150 MPa.
The scatter in the stress values within the fusion zone is significant because the
grain size becomes large. Kohandehghan et al. performed a combined finite
element model and experimental study of GTAW on the related alloy AA5251
using 2 mm thick plate with heat inputs ranging between 116-202 J/mm [71].
They predicted a maximum tensile, longitudinal residual stress of 140 MPa,
which is quite similar to the values measured here, despite the larger weld travel
speed and consequent lower heat input. They predicted a tensile, longitudinal

92
residual stress width of approximately 20 mm, but measured a width closer to 15
mm using the hole drilling technique. The Rosenthal solution consistently
returned larger values compared with measured values in this research as well.
By comparison, the longitudinal residual stresses from GMAW on
sensitized AA5456 plate had a greater breadth and a lower magnitude. The
breadth on the crown side of the weld was almost 40 mm and ranged in
maximum longitudinal stress value from 25-75 MPa. The heat input was 851
J/mm. It should be noted that some compressive stress was present in the base
plate itself, which likely lowered the observed tensile stresses in the HAZ. A
similar, but cleaner, result for longitudinal residual stresses after GMAW in
AA5083 is seen in Figure 7 by James et al. [31]. In this case, the maximum
longitudinal residual stress was displaced by approximately 20 mm from the weld
center. The heat input was 560 J/mm. The maximum observed longitudinal
residual stress was (+80-90 MPa).
The ultrasonic treatments reported in this thesis were all effective in
mitigating the tensile stresses induced by GMAW in sensitized AA5456. As
mentioned in the results section, the compressive stresses induced by UIT
removed all of the tensile residual stresses in the HAZ. The maximum tensile
stresses present in the control zones reached a measured value over +70 MPa in
the HAZ on the crown of the weld and +24 MPa on the root of the weld. The
average of the compressive stresses induced on all surfaces after UIT was ≤ -
140 MPa. The average compressive stresses induced on the crown side of the
plate was -154.3 ± 12.1 MPa and on the root side of the plate was -139.4 ± 23.5
MPa. The proximity of these two averages suggests that UIT induces a nearly
uniform compressive stress on AA5456 regardless of initial stress of the plate.
This conclusion with regards to crown and root compressive stresses has not
been reported in other research, but Liao et al. showed that for a single set of
UIT parameters tested on AA7075 at various levels of corrosion, the compressive
stresses induced on each surface were of a similar magnitude to a depth of 1
mm (Figure 12) [58].

93
The depth resolved measurements revealed that the compressive
stresses were present to a depth of 0.6 mm in several zones. Further depth
resolved measurements are needed to determine where the stresses end and
tensile stresses begin. Other reports suggest compressive stresses exist from
1.5 mm to 4 mm in various materials [55]–[58], [72]. Since both sides of the
roughly 6.35 mm plates were treated with UIT, it is expected that at a depth near
2 mm, the residual stresses would begin to turn tensile. Surface material was
removed using the “L1” solution with the electrolytic polisher. This solution did not
remove material at a steady rate in each zone. The solution was chilled for each
use, but still required varying amounts of time to achieve material removal in
each zone. The HAZ and base metal for the welded plate without UIT only
required about five minutes of electropolish, while other zones required up to 30
minutes and removed only 0.01 mm of surface material. Measurements were
collected at depths up to 0.6 mm in several zones, but a more regularized
material removal solution would be beneficial for clear depth resolved data.
The dependence of compressive residual stress on pin diameter might be
modeled based upon spherical indentation. Of the two parameters: pin diameter
and displacement amplitude (percent power), this research suggests that the
residual stresses induced have more dependence on the pin size than on the
percent power. This dependence may be explained by treating the UIT pins as
spherical indenters (Figure 59).

94
.
Figure 59. Image of spherical indenter used for comparison of the pin size results.
The mean pressure below a spherical contact with a flat surface is given
by Equation 10 [73].
Equation 10
Where
Pm = pressure underneath the pin contact
Er = reduced modulus
R = radius of UIT pin
a = contact radius between the pin and the sample surface
The reduced modulus, Er, is related to the elastic properties of the sample, Es
and νs (aluminum), and the indenter/UIT pin, Ei and νi (hardened steel) (Equation
11). For this research, these values can be taken to be 70 gigapascal (GPa),
0.35, 200 GPa, and 0.3 respectively.
[
]
Equation 11.
The contact radius, a, is related to the pin radius, R, and the imposed depth of
the indentation, h. The values of h are given in column four of Table 8 and are
directly related to the power used during UIT.

95
The relationship between a, R, and h is shown in Equation 12. The data in
√ Equation 12.
Figure 39 can be re-plotted as residual stress as a function of mean pressure
(Figure 60). A roughly linear decrease in longitudinal residual stress with
increasing contact pressure can be seen in this figure; however, two potential
outliers obscure the overall trend. The point with the highest contact pressure, 11
GPa, had a much lower residual stress value than expected. This data point
corresponds to the 80 percent power, 1 mm pin diameter measurement. In
Figure 36, the last several points for this UIT condition systematically decrease in
compressive residual stress, suggesting that the end of the UIT region had been
reached and that the residual stress values were transition back to the control
plate values. In addition, careful inspection of these shipboard plates shows a
significant amount of grinding and other sorts of damage marks that may have
influenced the measurements. These measurements will be repeated on non-
sensitized, laboratory plates in the future. The data from these plates may allow
for a much cleaner analysis of the residual stress and its relationship to contact
pressure.

96
Figure 60. Average longitudinal stress in the base metal versus the calculated spherical contact pressure.
The severe plastic deformation that imparts the large compressive
stresses on the surface of the plate clearly manifests itself in the microstructure.
The GOS maps from the 40 percent power, 1 mm pin surface clearly showed
plastic deformation up to 200 μm below the surface. This depth is supported by
other studies that suggest evidence of UIT on microstructural characteristics of
AA5456 to depths of at least 1.7 mm [40]. The EBSD data from just beneath the
pin crater strongly suggests the presence of a nanocrystalline region, about 10
μm thick; this region could not be indexed by EBSD (Figure 46). This observation
agrees with the recent work of Tran et al. who observed a nanocrystalline
deformation region 10–18 μm below the surface of ultrasonically treated AA5456.
Similar observations have also been made by An et al. after UIT on AA2024 [45].
97
Of greater concern is the extensive intergranular cracking observed in the
microstructure of the material treated at 20 and 40 percent power with a 1 mm
pin size. The cracks started at either the weld toe or about 14 mm away from the
weld toe and ran parallel through the rest of the HAZ. The estimated contact
pressure for these conditions is between 5–7 GPa. Other conditions in this study,
(i.e., 20 percent power, 3 mm pin size and 20 percent power, 4 mm pin size),
should have much lower contact pressures, about 3 GPa. In future work, cross
sections of these ultrasonically treated welds will be examined for Intergranular
cracking. Tran et al. also observed microstructural cracking or tearing in this alloy
system [41]. In this work, the material was also sensitized and used a pin size of
3 mm diameter and displacement amplitude of 22 μm. By the analysis used here,
the mean contact pressure would be approximately 4.6 GPa. Castillo-Morales et
al. also observed a decrement in fatigue life after UIT of AA2024 samples, which
they attributed to surface roughening and the nucleation of multiple cracks on the
surface [44]. It would seem that UIT certainly can mitigate tensile residual
stresses, but that care must be taken to not generate sub-surface cracking in the
process.
Successfully taking residual stress measurements onboard a U.S. Navy
cruiser was the most noteworthy objective achieved in this research. All of the
measurements taken suggest that compressive stresses are common at the
aluminum deck surface; which is the opposite of expectations, since tensile
stresses are required for both SCC and corrosion fatigue. It should be noted that
the compressive stresses measured were quite large and the data was clean.
These compressive stresses are likely not from x-ray diffractometer issues.
Several hypotheses might explain this outcome. It is possible that the relatively
coarse metallographic method of surface preparation generated compressive
stresses that were not removed during polishing. However, in situ metallography
was utilized on a small area of the deck, and the x-ray diffraction measurement
still returned a compressive stress of similar magnitude to those obtained in a
near location when the coarse metallographic method was used. Electropolishing

98
would mitigate this concern in future measurements, but it will require further
collaboration to address all chemical safety concerns. It is possible that
mechanical surface maintenance processes conducted by ships’ crew and
contractors may impart compressive residual stresses into the deck surface.
Deck crawlers, needle guns, and other methods that are used In an effort to
prepare the deck for painting, may induce compressive stresses on the surface
of the material. There tools leave behind evidence of use in the form grooves and
divots on the surface. The impact of these tools on residual stresses in aluminum
is largely unknown. Future laboratory testing would determine if this hypothesis is
true.

99
V. CONCLUSION
X-ray diffraction was used to measure residual stresses of welded and
ultrasonically treated, sensitized and non-sensitized AA5456. UIT parameters
were systematically varied to determine the effects of these parameters on
residual stresses and microstructure. The most notable accomplishment of this
research was the step taken towards gathering more information on the residual
stresses in ship structures by taking measurements onboard an active U.S. Navy
cruiser.
The following conclusions can be drawn from this work:
The iXRD was successfully able to measure residual stress distributions around gas tungsten arc and gas metal arc welds in AA5456. As expected, the breadth of tensile residual region increased with increasing heat input, while the maximum in tensile stress increased with increasing weld travel speed.
UIT parameters were systematically varied to study the effects of two control parameters, pin diameter and displacement amplitude, on the surface and subsurface residual stresses generated on in-service sensitized, GMAW AA5456 plates. All of the UIT parameter combinations induced significant compressive stresses that eliminated the tensile stresses in the HAZ caused by welding. Smaller pin sizes induced larger compressive stresses.
Welding results in grain growth in the fusion zone, which was subsequently deformed by the UIT processing. Substantial microscale plasticity was evident from the UIT process in the weld, HAZ, and base metal. Microvoids and microcracking were observed in the subsurface area for UIT performed at 20 and 40 percent power input, with a 1 mm pin size.
X-ray residual stresses were successfully performed on a U.S. Navy cruiser to determine the in service stresses located on the deck of the aluminum superstructure near welds and an existing crack. The measurements revealed compressive stresses on the surface of the deck in all locations tested. These stresses may be a result of surface preparation, surface processing (e.g., deck crawlers, needle gunning), or the geometric complexities of the deck structure.

100
The data collected and presented offers just a small contribution to the
knowledge base for AA5456, sensitization, and UIT. Additional research into
several aspects of this thesis is recommended. Further research should be
conducted regarding the microstructural changes as a function of each UIT
parameter combination in order to find the optimal parameters for mitigating SCC
in 5xxx series aluminum alloys. Further depth resolved measurements would
more fully characterize the residual stresses generated by UIT. Depth resolved
measurements on board an active ship would also prove beneficial, since the
measured residual stresses were shown to be quite complex. Additional
shipboard measurements to better understand the stresses throughout the
structure of in-service vessels are needed. This data would prove extremely
valuable in future ship designs and could validate finite element models of ship
structures.
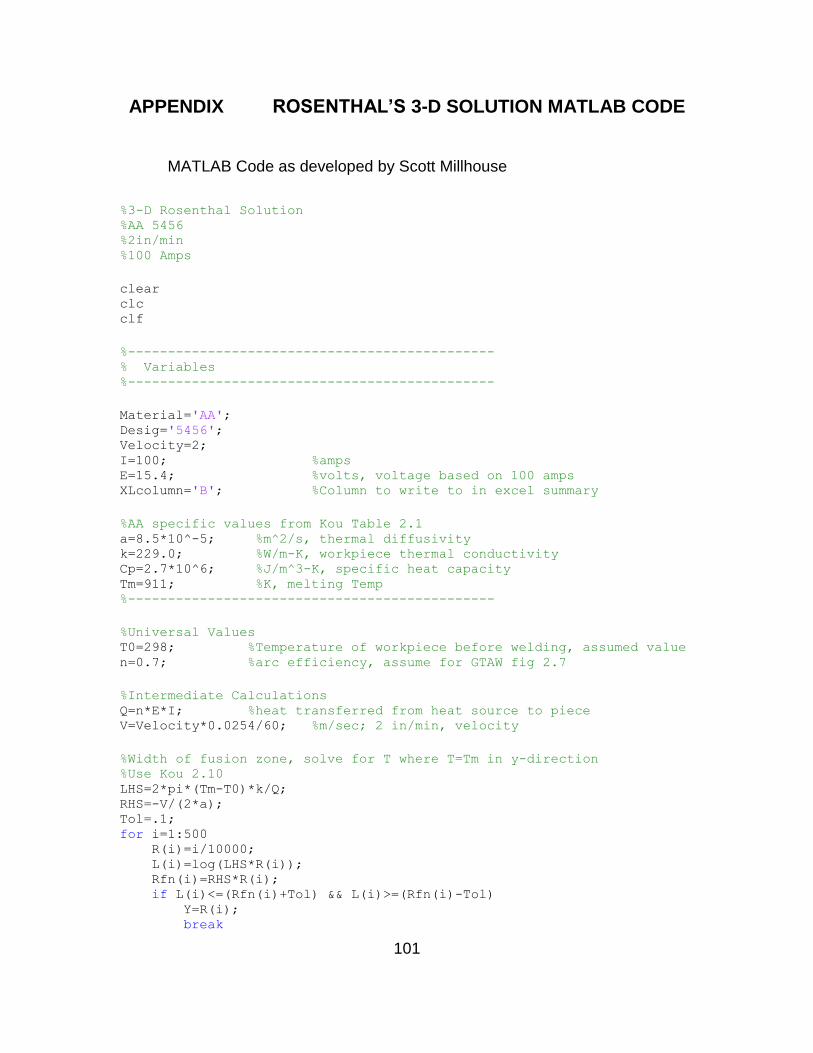
101
APPENDIX ROSENTHAL’S 3-D SOLUTION MATLAB CODE
MATLAB Code as developed by Scott Millhouse
%3-D Rosenthal Solution %AA 5456 %2in/min %100 Amps
clear clc clf
%---------------------------------------------- % Variables %----------------------------------------------
Material='AA'; Desig='5456'; Velocity=2; I=100; %amps E=15.4; %volts, voltage based on 100 amps XLcolumn='B'; %Column to write to in excel summary
%AA specific values from Kou Table 2.1 a=8.5*10^-5; %m^2/s, thermal diffusivity k=229.0; %W/m-K, workpiece thermal conductivity Cp=2.7*10^6; %J/m^3-K, specific heat capacity Tm=911; %K, melting Temp %----------------------------------------------
%Universal Values T0=298; %Temperature of workpiece before welding, assumed value n=0.7; %arc efficiency, assume for GTAW fig 2.7
%Intermediate Calculations Q=n*E*I; %heat transferred from heat source to piece V=Velocity*0.0254/60; %m/sec; 2 in/min, velocity
%Width of fusion zone, solve for T where T=Tm in y-direction %Use Kou 2.10 LHS=2*pi*(Tm-T0)*k/Q; RHS=-V/(2*a); Tol=.1; for i=1:500 R(i)=i/10000; L(i)=log(LHS*R(i)); Rfn(i)=RHS*R(i); if L(i)<=(Rfn(i)+Tol) && L(i)>=(Rfn(i)-Tol) Y=R(i); break

102
end
end yFZ=Y
%Thermal cycles (T vs time) for y=FZB, y=FZB+6mm, y=FZB+12mm
t=linspace(-10,25,1000); x=t.*V;
%y=FZB R=sqrt(x.^2+Y^2); d=R-x; TFZB=Q*exp(-V*d./(2*a))./(2*pi*k*R)+T0;
%y=FZB+6 R6=sqrt(x.^2+(Y+0.006)^2); d6=R6-x; T6=Q*exp(-V*d6./(2*a))./(2*pi*k*R6)+T0;
%y=FZB+12 R12=sqrt(x.^2+(Y+0.012)^2); d12=R12-x; T12=Q*exp(-V*d./(2*a))./(2*pi*k*R12)+T0;
TC=figure(1); plot(t,TFZB,'b',t,T6,'r',t,T12,'c') hleg1=legend('y=FBZ', 'y=FBZ+6mm', 'y=FBZ+12mm'); title(['Thermal Cycles ',num2str(Material),' ',num2str(Desig),... ' Velocity = ',num2str(Velocity),' in/sec Current = ',num2str(I),'
amps']) xlabel('Time, sec') ylabel('Temperature, K') filenameTC=['TC',num2str(Material),num2str(Desig),'_',... num2str(Velocity),'_',num2str(I)]; print(TC,'-djpeg',filenameTC)
%Cooling rate (dTdtx) for y=FZB, y=FZB+6mm, y=FZB+12mm dTdtx=2*pi*k*V*(max(TFZB)-T0)^2/Q; dTdtx6=2*pi*k*V*(max(T6)-T0)^2/Q; dTdtx12=2*pi*k*V*(max(T12)-T0)^2/Q;
%HAZ Width THAZ=0.45*Tm; for j=1:500 yHAZ(j)=j/10000; %assume x and z are zero and increase away from centerline in y %direction using Rosenthal's 3-d Eqn Ty(j)=Q*exp(-V*yHAZ(j)./(2*a))./(2*pi*k*yHAZ(j))+T0; if Ty(j)<=THAZ HAZ=yHAZ(j) break

103
end end
%output to excel file filename='summary.xlsx'; name=strcat(Material,Desig); data={name; Velocity; I; yFZ; dTdtx; dTdtx6; dTdtx12; HAZ}; sheet=1; xlRange=strcat(XLcolumn,'1'); xlswrite(filename,data,sheet,xlRange);
104
THIS PAGE INTENTIONALLY LEFT BLANK

105
LIST OF REFERENCES
[1] R. Schwarting et al., "Manufacturing techniques and process challenges with CG47 class ship aluminum superstructure modernization and repairs," BAE Systems, Norfolk, VA, 2011.
[2] United States Navy. (2013, Nov.). America's Navy. [Online]. Available: http://www.navy.mil/navydata/fact_display.asp?cid=4200&tid=800&ct=4US
[3] W. W. Sanders and K. A. McDowell, "Fatigue behavior of 5000 series aluminum alloy weldments in marine environment," in Welding Research Council Bulletin, no. 242, pp. 1–15, 1978.
[4] R. A. Sielski, "Ship structural health monitoring research at the Office of Naval Research," in Journal of the Minerals, Metals & Materials Society, vol. 64, no. 7, pp. 823–827, 2012.
[5] ASM Handbook on Properties and Selection: Nonferrous Alloys and Special-Purpose Materials, vol. 2. Materials Park, OH: American Society of Materials International, 2012, pp. 19–28.
[6] Y. Zhong. (2005). Alloy phase diagram database. [Online]. Available: http://www1.asminternational.org.libproxy.nps.edu/asmenterprise/APD/ViewAPD.aspx?id=101029
[7] M. G. Fontana, Corrosion Engineering. New York, NY: McGraw-Hill Book Company, 1987, pp. 820-824.
[8] ASM Handbook on Corrosion: Fundamentals Testing and Protection, vol. 13. Materials Park, OH, 2012, pp. 346-366: American Society of Materials International,
[9] Hydro. (2009, 26 Oct.). Alloy elements. [Online]. Available: http://www.hydro.com/en/Subsites/Tonder/Products-and-services/Aluminium-profiles/Choice-of-material/Alloys/Alloy-elements/
[10] ASM Handbook on Properties and Selection: Nonferrous Alloys and Special-Purpose Materials, vol. 2. Materials Park, OH: American Society of Materials International, 2012, pp. 3–14.
[11] ASM Handbook on Properties and Selection: Nonferrous Alloys and Special-Purpose Materials, vol. 2. Materials Park, OH: American Society of Materials International, 2012, pp. 29–61.

106
[12] N. Sukiman et al.,"Durability and corrosion of aluminum and its alloys: overview, property space, techniques and developments," in Aluminum Alloys—New Trends in Fabrication and Applications, 2013, pp. 47–97.
[13] D. Williams, "Stress corrosion cracking in an annealed 5083 aluminum alloy weldment," in Welding Journal, vol. 62, no. 8, pp. 25–27, 1983.
[14] R. L. Holtz et al., "Corrosion-fatigue behavior of aluminum alloy 5083-H131 sensitized at 448K," in Matallurgical and Materials Transactions, vol. 43A, pp. 2839–2849, Aug. 2012.
[15] J. Searles et al., "Stress corrosion cracking of sensitized AA5083 (Al-4.5Mg-1.0Mn)," in Metallurgical and Materials Transactions, vol. 32A, pp. 2859–2867, Nov. 2001.
[16] R. Goswami et al., "Microstructural evolution and stress corrosion cracking behavior of Al-5083," in Metallurgical and Materials Transactions, vol. 42A, pp. 348–355, Feb. 2011.
[17] L. Kramer et al., "Locally reversing sensitization in 5xxx aluminum plate," in Journal of Materials Engineering and Performance, vol. 21, no. 6, pp. 1025–1029, 2012.
[18] C. B. Crane and R. P. Gangloff, "Stress corrosion cracking of low temperature sensitized AA5083," presented at NACE International DOD Corrosion Conference, La Quinta, CA, Jul. 31–Aug. 5, 2011.
[19] R. Holtz et al., "Corrosion fatigue of AL 5083-H131 sensitized at 70, 100, and 175C and relation to microstructure and degree of sensitization," presented at NACE International DoD Corrosion Conference, La Quinta, CA, Jul. 31–Aug. 5, 2011.
[20] R. Goswami et al., "Precipitation of the beta phase in Al-5083," in Materials Science and Engineering Journal, vol. A, no. 527, pp. 1089–1095, 2010.
[21] Standard Specifications for High Magnesium Aluminum-Alloy Sheet and Plate for Marine Service and Similar Environments, ASTM B928, 2013.
[22] Standard Test Method for Determining the Susceptibility to Intergranular Corrosion of 5XXX Series Aluminum Alloys by Mass Loss After Exposure to Nitric Acid (NAMLT), ASTM G67, 2004.
[23] E. C. Cormack, “The effect of sensitization on the stress corrosion cracking of aluminum alloy 5456,” M.S. Thesis, Dept. Mech. Eng., Naval Postgraduate School, Monterey, CA, 2012.

107
[24] M. Pourbaix, Atlas of Electrochemical Equilibria, Houston, TX: National Association of Corrosion Engineers, 1974.
[25] D. R. Arnott et al., "Oxide film rupture, reanodization, and stress corrosion cracking in aluminum," in Journal of Electrochemical Science and Technology, vol. 129, no. 12, pp. 2660–2665, Dec. 1982.
[26] H. L. Logan, "Film rupture mechanism of stress corrosion," in Journal of Research of the National Bureau of Standards, vol. 48, no. 2, pp. 99–105, Feb. 1952.
[27] R. Jones, "The influence of hydrogen on the stress corrosion cracking of low strength Al-Mg alloys," in Journal of Minerals, Metals, and Materials, pp. 42–46, Feb. 2003.
[28] J. Farmer, “Lecture L3-types of corrosion,” unpublished.
[29] M. Meyers and K. Chawla, Mechanical Behavior of Materials, Cambridge, UK: Cambridge University Press, 2009, pp. 820–824.
[30] S. Kou, Welding Metallurgy, 2nd ed. Hoboken, NJ: John Wiley and Sons, Inc., 2003.
[31] M. N.James et al., "Residual stress and strain in MIG butt welds in 5083-H321 aluminum: as-welded and fatigue cycled," in International Journal of Fatigue, vol. 31, pp. 28-40, 2009.
[32] L. Kramer et al., "Locally reversing sensitization in 5xxx aluminum plate," in Journal of Materials Enginering and Performance, vol. 21, no. 6, pp. 1025–1029, 2012.
[33] M. B. Kannan and V. S. Raja, "Enhancing stress corrosion cracking resistance in Al-Zn-Mg-Cu-Zr alloy through inhibiting recrystallization," in Engineering Fracture Mechanics, vol. 77, no. 2, pp. 249–256, 2010.
[34] F. Zucchi et al., "Pitting and stress corrosion cracking resistance of friction stir welded AA5083," in Materials and Corrosion, vol. 52, pp. 853–859, 2001.
[35] R. Mishra and Z. Ma, "Friction stir welding and processing," in Materials Science and Engineering, vol. 50, pp. 1–78, 2005.
[36] H. Zoeller and B. Cohen, "Shot peening for resistance to stress corrosion cracking," in Metals Engineering Quarterly, pp. 16–20, Feb.1966.

108
[37] J. E. Rankin et al., "The effects of process variations on residual stress induced by laser peening," in Materials Science Forum, vol. 404, no. 407, pp. 95–100, 2002.
[38] B. Rouleau et al., "Characterization at a local scale of a laser shock peened aluminum alloy surface," in Applied Surface Science, vol. 257, pp. 7195-7203, 2011.
[39] K. A. Brandenburg et al., "Use of engineered compressive residual stresses to mitigate stress corrosion cracking and corrosion fatigue in sensitized 5xxx series aluminum alloys," in Proceedings of Department of Defense Virtual Corrosion Conference, Sept. 2013.
[40] C. Scheck et al., "Impact of ultrasonic impact treatment on a 5456 aluminum alloy characterized through microspecimen testing and x-ray tomography," in TMS 2011 Supplemental Proceedings Vol 2: Materials Fabrication, Properties, Characterization, and Modeling San Diego, 2011, pp.205–212.
[41] K. N. Tran and L. Salamanca-Riba, "Microstructural evolution of severely plastically deformed sensitized aluminum 5456-H116 treated by ultrasonic impact treatment," in Advanced Engineering Materials, vol. 15, no. 11, pp. 1105–1110, 2013.
[42] T. Okawa et al., "Effect of preload and stress ratio on fatigue strength of welded joints improved by ultrasonic impact treatment," in Weld World, vol. 57, pp. 235–241, 2013.
[43] P. Mikheev et al., "Effectiveness of ultrasonic treatment for increasing the fatiue resistance of welds," in Russian Ultrasonics, vol. 15, no. 4, pp. 70–75, 1985.
[44] M. Castillo-Morales and A. Salas-Zamarripa, "The effects of UIT in the fatigue life of Al 2024-T3," in Key Engineering Materials, vol. 449, pp. 15–22, 2010.
[45] X. An et al., "Study of the surface nanocrystallization induced by the Esonix ultrasonic impact treatment on the near-surface of 2024-T351 aluminum alloy," in Journal of Materials Engineering and Performance, vol. 15, no. 3, pp. 355–364, Jun. 2006.
[46] B. Mordyuk et al., "Enhanced fatigue durability of Al-6Mg alloy by applying ultrasonic impact peening: effects of surface hardening and reinforcement with AlCuFe quasicrystalline particles," in Materials Science and Engineering A, vol. 563, pp. 138–146, 2013.

109
[47] E. S. Statnikov et al., "Comparison of ultrasonic impact treatment (UIT) and other fatigue life improvement methods," in Welding in the World, vol. 46, no. 3, pp. 20–32, 2002.
[48] P. Crooker, “Materials seminar on peening technology for mitigating PWSCC,” presented at NPS, Monterey, CA, May 29, 2013.
[49] C. Rodopoulos et al., "Effect of controlled shot peening and laser shock peening on fatigue performance of 2024-T351 aluminum alloy," in Journal of Materials Engineering and Performance, vol. 12, no. 4, pp. 414–419, 2003.
[50] Lambda Technologies Group. (2012). Low plasticity burnishing. [Online]. Available: http://www.lambdatechs.com/low-plasticity-burnishing-LPB.html
[51] Applied Ultrasonics. (2011). Esonix UIT. [Online]. Available: http://www.appliedultrasonics.com/solutions.html
[52] Europe Technologies Group. (2009).Sonats needle peening objectives. [Online]. Available: http://www.sonats-et.com/page_23-needle-peening.html
[53] K. Tran, “Microstructural characterization of ultrasonic impact treated Al-Mg alloy,” Ph.D. dissertation, Dept. Mat. Sci., Univ. of Maryland, College Park, MD, 2012.
[54] Europe Technologies Group. (2013, Oct.). STRESSONIC principle. [Online]. Available: http://www.sonats-et.com/page_12-stressonic.html
[55] D. Goudar et al., "Measurement of residual stresses in surface treated stainless steel groove welds," in Materials Science Forum, vol. 681, pp. 49–54, 2011.
[56] C. Rodopoulos et al., "The effect of surface engineering treatments on the fatigue behavior of 2024-T351 aluminum alloy," in Journal of Materials Engineering and Performance, vol. 16, no. 1, pp. 30–34, 2007.
[57] X. Cheng et al., "Residual stress modification by post-weld treatment and its beneficial effect on fatigue strength of welded structures," in International Journal of Fatigue, vol. 25, pp. 1259–1269, 2003.
[58] M. Liao et al., "Effects of ultrasonic impact treatment on fatigue behavior of naturally exfoliated aluminum alloys," in International Journal of Fatigue, vol. 30, pp. 717–726, 2008.
[59] G. S. Schajer, Ed., Practical Residual Stress Measurement Methods. West Sussex, UK: John Wiley & Sons Ltd, 2013.

110
[60] S. Farrell et al., "Stress analysis on Canadian naval platforms using a portable miniature x-ray diffractometer," in Powder Diffraction, vol. 25, no. 2, pp. 119–124, 2010.
[61] D. Huff and K. Lynaugh, "Utilization of root cause failure analysis in the investigation of marine deck fitting failures," in Naval Engineers Journal, pp. 93–99, Winter 2001.
[62] C. E. Murray and I. C. Noyan, "Applied and residual stress determination using x-ray diffraction," in Practical Residual Stress Measurement Methods, West Sussex, UK, John Wiley & Sons Ltd., 2013, pp. 139–161.
[63] Standard and Emergency Operating Procedures for Proto iXRD Inside Laboratory Enclosure (NAVPGSCOL INST 6470.14), Naval Postgraduate School, Moneterey, CA, 2013.
[64] M. Bennett, “Characterization of Residual Stress as a Function of Friction Stir Welding Parameters in ODS Steel MA956,” M.S. thesis, Dept. Mech. Eng., Naval Postgraduate School, Monterey, CA, 2013.
[65] PROTO Electrolytic Polisher-Operating Manual Version 3.01, Proto Manufacturing Ltd., Taylor, MI.
[66] Naval Sea Systems Command, Radialogical Affairs Support Program Manual (SS0420-AA-RAD-010 Rev 1A). Washington Navy Yard, Naval Sea Systems Command, 2012.
[67] Naval Postgraduate School, NAVPGSCOL Instruction 6470.14: Standard and Emergency Operating Procedure for Proto iXRD during Field Use, Monterey: Naval Postgraduate School, 2013.
[68] W. Golumbfskie, private communication, “In situ metallography,” Mar.2014.
[69] Standard Test Method forVerifying the Alignment of X-ray Diffraction Instrumentation for Residual Stress Measurement, ASTM E915-10, 2012.
[70] S. Millhouse, “MATLAB code for 3-D Rosenthal's solution,” unpublished.
[71] A. R. Kohandehghan et al., "A study on residual stresses in gas tungsten arc welding of AA5251," in Materials and Manufacturing Processes, vol. 25, pp. 1242–1250, 2010.
[72] W. D. Callister and D. G. Rethwisch, Materials Science and Engineering an Introduction, Hoboken, NJ: John Wiley & Sons, 2010.

111
[73] A. C. Fischer-Cripps, Nanoindentation, 2nd ed., New York, NY: Springer, 2004.
[74] Manual for Stress Analysis-Software Manual. Ontario:Proto Manufacturing Ltd., Oldcastle, 2010.

112
THIS PAGE INTENTIONALLY LEFT BLANK

113
INITIAL DISTRIBUTION LIST
1. Defense Technical Information Center Ft. Belvoir, Virginia 2. Dudley Knox Library Naval Postgraduate School Monterey, California