Systematic Review of Oncological Outcomes Following Surgical
22
Review – Kidney Cancer Systematic Review of Oncological Outcomes Following Surgical Management of Localised Renal Cancer Steven MacLennan a , Mari Imamura a , Marie C. Lapitan b , Muhammad Imran Omar a , Thomas B.L. Lam a,c , Ana M. Hilvano-Cabungcal b , Pam Royle d , Fiona Stewart a , Graeme MacLennan e , Sara J. MacLennan a , Steven E. Canfield f , Sam McClinton c , T.R. Leyshon Griffiths g , Bo ¨rje Ljungberg h , James N’Dow a,c, *, UCAN Systematic Review Reference Group and the EAU Renal Cancer Guideline Panel a Academic Urology Unit, University of Aberdeen, Aberdeen, UK; b Department of Urology, UP-PGH Medical Centre, Manila, Philippines; c Department of Urology, Aberdeen Royal Infirmary, Aberdeen, UK; d Department of Public Health, University of Aberdeen, UK; e Health Services Research Unit, University of Aberdeen, UK; f Division of Urology, University of Texas Medical School at Houston, Houston, TX, USA; g Department of Urology, University Hospitals of Leicester NHS Trust, Leicester General Hospital, Leicester, UK; h Department of Surgical and Perioperative Sciences, Urology and Andrology, Umea ˚ University, Umea ˚, Sweden EUROPEAN UROLOGY 61 (2012) 972–993 available at www.sciencedirect.com journal homepage: www.europeanurology.com Article info Article history: Accepted February 16, 2012 Published online ahead of print on February 24, 2012 Keywords: Localised renal cancer Oncological outcomes Radical nephrectomy Adrenalectomy Lymphadenectomy Partial nephrectomy Nephron-sparing surgery Cryoablation Radiofrequency ablation HIFU Systematic reviews Meta-analysis Abstract Context: Renal cell carcinoma (RCC) accounts for 2–3% of adult malignancies. There remain uncertainties over the oncological outcomes for the surgical management of localised RCC. Objective: Systematically review relevant literature comparing oncological outcomes of surgical management of localised RCC (T1–2N0M0). Evidence acquisition: Relevant databases including Medline, Embase, and the Cochrane Library were searched up to October 2010, and an updated scoping search was per- formed up to January 2012. Randomised controlled trials (RCTs) or quasi-RCTs, pro- spective observational studies with controls, retrospective matched-pair studies, and comparative studies from well-defined registries/databases were included. The main outcomes were overall survival, cancer-specific survival, recurrence, and metastases. The Cochrane risk of bias tool was used to assess RCTs, and an extended version was used to assess nonrandomised studies (NRSs). The quality of evidence was assessed using Grading of Recommendations Assessment, Development, and Evaluation (GRADE). Evidence synthesis: A total of 4580 abstracts and 389 full-text articles were assessed. Thirty-four studies met the inclusion criteria (6 RCTs and 28 NRSs). Meta-analyses were planned but were deemed inappropriate due to data heterogeneity. There were high risks of bias and low-quality evidence across the evidence base. Open radical nephrectomy and open partial nephrectomy showed similar cancer-specific and overall survival, but when both open and laparoscopic approaches are considered together, the evidence showed improved survival for partial nephrectomy for tumours 4 cm. The overall evidence suggests either equivalent or better survival with partial nephrectomy. Laparoscopic radical nephrectomy offered equivalent survival to open radical nephrectomy, and all laparoscopic approaches achieved equivalent survival. Open and laparoscopic partial nephrectomy achieved equivalent survival. The issue of ipsilateral adrenalectomy or complete lymph node dissection with radical nephrectomy or partial nephrectomy remains unresolved. Conclusions: The evidence base suggests localised RCCs are best managed by nephron- sparing surgery where technically feasible. However, the current evidence base has significant limitations due to studies of low methodological quality marked by high risks of bias. # 2012 European Association of Urology. Published by Elsevier B.V. All rights reserved. * Corresponding author. Academic Urology Unit, University of Aberdeen, 2nd Floor, Health Sciences Building, Aberdeen AB25 2ZD, UK. Tel. +44 1224 438130; Fax: +44 1224 438165. E-mail address: [email protected] (J. N’Dow). 0302-2838/$ – see back matter # 2012 European Association of Urology. Published by Elsevier B.V. All rights reserved. doi:10.1016/j.eururo.2012.02.039
Transcript of Systematic Review of Oncological Outcomes Following Surgical

E U R O P E A N U R O L O G Y 6 1 ( 2 0 1 2 ) 9 7 2 – 9 9 3
avai lable at www.sciencedirect .com
journal homepage: www.europeanurology.com
Review – Kidney Cancer
Systematic Review of Oncological Outcomes Following Surgical
Management of Localised Renal Cancer
Steven MacLennan a, Mari Imamura a, Marie C. Lapitan b, Muhammad Imran Omar a,Thomas B.L. Lam a,c, Ana M. Hilvano-Cabungcal b, Pam Royle d, Fiona Stewart a,Graeme MacLennan e, Sara J. MacLennan a, Steven E. Canfield f, Sam McClinton c,T.R. Leyshon Griffiths g, Borje Ljungberg h, James N’Dow a,c,*,
UCAN Systematic Review Reference Group and the EAU Renal Cancer Guideline Panel
a Academic Urology Unit, University of Aberdeen, Aberdeen, UK; b Department of Urology, UP-PGH Medical Centre, Manila, Philippines; c Department of Urology,
Aberdeen Royal Infirmary, Aberdeen, UK; d Department of Public Health, University of Aberdeen, UK; e Health Services Research Unit, University of Aberdeen, UK;f Division of Urology, University of Texas Medical School at Houston, Houston, TX, USA; g Department of Urology, University Hospitals of Leicester NHS Trust,
Leicester General Hospital, Leicester, UK; h Department of Surgical and Perioperative Sciences, Urology and Andrology, Umea University, Umea, Sweden
Article info
Article history:
Accepted February 16, 2012Published online ahead ofprint on February 24, 2012
Keywords:
Localised renal cancer
Oncological outcomes
Radical nephrectomy
Adrenalectomy
Lymphadenectomy
Partial nephrectomy
Nephron-sparing surgery
Cryoablation
Radiofrequency ablation
HIFU
Systematic reviews
Meta-analysis
Abstract
Context: Renal cell carcinoma (RCC) accounts for 2–3%ofadultmalignancies. There remainuncertainties over the oncological outcomes for the surgical management of localised RCC.Objective: Systematically review relevant literature comparing oncological outcomes ofsurgical management of localised RCC (T1–2N0M0).Evidence acquisition: Relevant databases including Medline, Embase, and the CochraneLibrary were searched up to October 2010, and an updated scoping search was per-formed up to January 2012. Randomised controlled trials (RCTs) or quasi-RCTs, pro-spective observational studies with controls, retrospective matched-pair studies, andcomparative studies from well-defined registries/databases were included. The mainoutcomes were overall survival, cancer-specific survival, recurrence, and metastases.The Cochrane risk of bias tool was used to assess RCTs, and an extended version was usedto assess nonrandomised studies (NRSs). The quality of evidence was assessed usingGrading of Recommendations Assessment, Development, and Evaluation (GRADE).Evidence synthesis: A total of 4580 abstracts and 389 full-text articles were assessed.Thirty-four studies met the inclusion criteria (6 RCTs and 28 NRSs). Meta-analyses wereplanned but were deemed inappropriate due to data heterogeneity. There were high risks ofbias and low-quality evidence across the evidence base. Open radical nephrectomy andopen partial nephrectomy showed similar cancer-specific and overall survival, but whenboth open and laparoscopic approaches are considered together, the evidence showedimproved survival for partial nephrectomy for tumours �4 cm. The overall evidencesuggests either equivalent or better survival with partial nephrectomy. Laparoscopic radicalnephrectomy offered equivalent survival to open radical nephrectomy, and all laparoscopicapproaches achieved equivalent survival. Open and laparoscopic partial nephrectomyachieved equivalent survival. The issue of ipsilateral adrenalectomy or complete lymphnode dissection with radical nephrectomy or partial nephrectomy remains unresolved.Conclusions: The evidence base suggests localised RCCs are best managed by nephron-
re technically feasible. However, the current evidence base hass due to studies of low methodological quality marked by high risks
sparing surgery whesignificant limitation
of bias.sociation of Urology. Published by Elsevier B.V. All rights reserved.
# 2012 European As* Corresponding author. Academic Urology Unit, University of Aberdeen, 2nd Floor, Health SciencesBuilding, Aberdeen AB25 2ZD, UK. Tel. +44 1224 438130; Fax: +44 1224 438165.E-mail address: [email protected] (J. N’Dow).
0302-2838/$ – see back matter # 2012 European Association of Urology. Published by Elsevier B.V. All rights reserved. doi:10.1016/j.eururo.2012.02.039
E U R O P E A N U R O L O G Y 6 1 ( 2 0 1 2 ) 9 7 2 – 9 9 3 973
1. Introduction
Renal cell carcinoma (RCC) accounts for approximately
2–3% of all adult malignancies. More than 50% of all RCCs
diagnosed are a localised stage (ie, T1–T2N0M0 or stage I–II)
[1]. Open radical nephrectomy has been the standard curative
intervention for localised RCC for the past five decades [2].
There were controversies over whether radical nephrectomy
should be performed in conjunction with ipsilateral adrenal-
ectomy, as originally described by Robson, or if the
adrenal should be preserved [3–6] and whether ipsilateral
extended retroperitoneal lymphadenectomy or limited
hilar lymphadenectomy should be performed [7,8].
With the advent of minimally invasive surgery, laparo-
scopic radical nephrectomy has become an acceptable
alternative to open surgery for localised RCCs [6,7]. Another
recent controversy is the use of nephron-sparing surgery
(NSS; partial nephrectomy). NSS has been the accepted
mode of treatment when radical nephrectomy would
render the patient anephric or at high risk for subsequent
renal replacement therapy [9]. This organ-preserving
approach has recently emerged as a viable alternative for
small renal tumours (<4 cm or T1a) in patients with a
normal contralateral kidney, with encouraging short-term
and long-term oncological outcomes [10,11]. The era of
increasing use of NSSs has also witnessed the development
of minimally invasive nephron-sparing interventions such
as cryoablation, radiofrequency ablation (RFA), and high-
intensity focussed ultrasound (HIFU) for the treatment of
localised renal cancer [10,11].
Although various guidelines exist in relation to the
various interventions for localised RCC [6,12], it is impor-
tant to recognise that such guidelines were based on
reviews that were not undertaken systematically and often
used methodology that was not transparent, reproducible,
or robust. A systematic review of current evidence is
urgently needed to establish whether the outcomes of
competing treatment options are comparable. Methodo-
logical rigour is needed in assessing risks of bias and quality
of evidence in a standardised and transparent way to
highlight weaknesses in the evidence base and to make
recommendations for future research.
The objective of this systematic review was to compare
the oncological outcomes for all interventions relevant to
the management of localised RCC. This paper reports the
oncological outcomes, and a separate article reports the
surgical and quality-of-life outcomes from this systematic
review. There is also a full report published online with
extra methodological information and data for oncological
and surgical outcomes [13].
2. Evidence acquisition
2.1. Search strategy
The databases searched were Medline (1950 to October
2010) and Embase (1980 to October 2010), Cochrane
Library, all sections (Issue 4, 2010), Web of Science, with
Conference Proceedings (1970 to October 2010), and
American Society of Clinical Oncology meeting abstracts
(up to October 2010). The searches were not limited by
language. Auto-alerts in Medline were also run during the
course of the review. Reference lists of relevant articles
were also checked [13]. Two reviewers screened all
abstracts and full-text articles independently. Disagree-
ment was resolved by discussion, and where no agreement
was reached, a third independent party acted as an arbiter.
In addition, an updated scoping search was performed up to
January 2012.
2.2. Types of study design included
All relevant randomised controlled trials (RCTs) or quasi-
RCTs were included. Due to the small number of RCTs, we
also included nonrandomised studies (NRSs). Prospective
observational studies with controls, retrospective matched-
pair studies, and comparative studies from well-defined
registries/databases were also included. Studies with no
comparator group (eg, case series), nonmatched retrospec-
tive studies, and chart reviews were excluded.
2.3. Types of participants included
The study population was patients diagnosed with localised
RCC based on computed tomography scan or magnetic
resonance imaging, defined as clinical stage T1a–T2N0M0.
Studies that reported pathologic T3 cases were included so
long as the clinical staging was T1–2N0M0.
2.4. Types of interventions included
The following interventions were compared:
� R
adical nephrectomy� P
artial nephrectomy (NSS)� L
aparoscopic surgery for radical or partial nephrectomy� H
and-assisted laparoscopic surgery for radical or partialnephrectomy
� R
obot-assisted laparoscopic surgery for radical or partialnephrectomy
� C
omplete regional (extended) lymphadenectomy� P
artial regional (limited) lymphadenectomy� A
drenalectomy� R
FA� C
ryoablation� H
IFU.A valid comparator was no intervention or any of the
specified interventions (see full report for definitions of
interventions [13]).
2.5. Types of outcome measures included
The principal oncological measure of effectiveness was
overall survival rate at 5 and 10 yr. Other oncological
measures of effectiveness were considered such as cancer-
specific survival, local recurrence, metastasis, and positive

E U R O P E A N U R O L O G Y 6 1 ( 2 0 1 2 ) 9 7 2 – 9 9 3974
surgical margins (or tumour-free rates on ablative tech-
nique). Other outcome measures including surgical out-
comes (encompassing perioperative complications and
long-term adverse effects), impact on quality of life, patient
satisfaction, and cost effectiveness were considered and will
be reported in a separate paper. For long-term outcomes,
time to event data and categorical data were extracted. For
categorical data, we collected event rates at 5 and 10 yr
(prespecified), or if such data were not reported, we also
collected data at last follow-up.
2.6. Assessment of risks of bias
The risk of bias (RoB) in the included studies was assessed
using the Cochrane Risk of Bias Assessment tool for RCTs
[14]. This included sequence generation; allocation con-
cealment; blinding of participants, therapists, and outcome
assessors; completeness of outcome data; selective out-
come reporting; and other potential sources of bias. Two
reviewers independently assessed these domains. Any
differences of opinion were resolved by consensus or by
consulting a third party.
A modified version of the RoB assessment tool was used
in assessing NRSs with the addition of further items
(domains) to assess risk of bias through confounders [15].
The five most important potential confounders (prognos-
tic factors) for oncological outcomes identified a priori in
consultation with content experts (drawn from the British
Association of Urological Surgeons Section of Oncology and
European Association of Urology [EAU] Renal Cell Carcinoma
Guideline Panel) were tumour stage, tumour size, tumour
grade (Fuhrman), necrosis, and histologic cell type.
Each of the prespecified confounders was assessed on the
following four criteria:
� W
hether the confounder was considered by the research-ers (yes or no)
� P
recision with which confounder was measured� Im
balance between groups� C
are with which adjustment for confounder was carriedout.
Our guidelines, drawn up with clinical, statistical, and
methodological advice from members of the Cochrane Non-
Randomised Studies Methods Group and Grading of
Recommendations Assessment, Development, and Evalua-
tion (GRADE) Working Group, can be seen in the full report
[13].
2.6.1. Assessment of the quality of evidence
The GRADE evidence quality assessment tool was used to
assess patient-important outcomes across studies (full
report for GRADE evidence profiles [13]). Of the seven
outcomes chosen for GRADE quality assessment in consul-
tation with clinical content experts, two were oncological
outcomes and five were non-oncological outcomes. The two
chosen oncological outcomes for GRADE quality assessment
are reported in this review: overall survival and local
recurrence or progression.
2.7. Data analysis
A quantitative synthesis (meta-analysis) was performed for
trial data only. Heterogeneity of data made meta-analysis
inappropriate for NRSs. In analysing dichotomous outcomes
in the comparison of intervention effects, fixed-effect
models were used to derive relative risk (risk ratios) with
95% confidence intervals (CIs). In analysing continuous
outcomes, means and standard deviations were used to
summarise the data and compare interventions with
(weighted) mean difference and 95% CIs.
Heterogeneity between studies was assessed by visual
inspection of plots of the data, the chi-square test for
heterogeneity, and the I2 statistic [16]. Where meta-analysis
was not feasible, a narrative synthesis is provided [17].
Analysis was performed using Cochrane RevMan software.
Separate or subgroup analyses were planned for the
following groups of patients:
� T
hose in chronic renal failure� E
lderly patients (>65 yr of age)� T
hose with a solitary kidney or a solitary functioningkidney
� P
atients with disease predisposing them to renal tumours� D
ifferent American Society of Anaesthesiology grades� D
ifferent tumour stages.However, the data were not sufficient to address any of
these meaningfully.
3. Evidence synthesis
3.1. Risk of bias and quality assessment of the included studies
The study selection process is outlined in the Preferred
Reporting Items for Systematic Reviews (PRISMA) diagram
(Fig. 1). There were 44 studies that met inclusion criteria,
and 34 of them reported oncological outcomes (6 RCTs and
28 NRSs). The Cochrane risk of bias assessment can be
viewed in Appendix 1. The additional NRS risk of bias
assessment adjustment scores (outlined earlier) are dis-
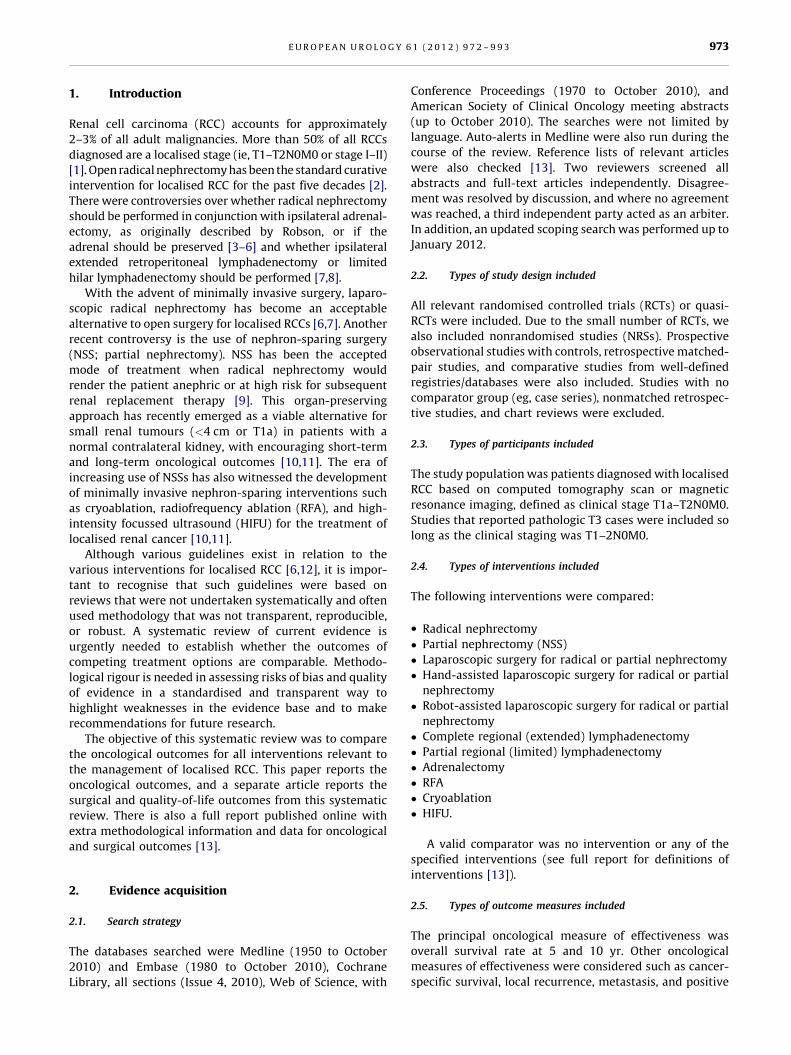
played in Table 1, which reports baseline characteristics (all
study designs) and adjustment scores (NRSs only).
3.2. Comparisons of intervention results
Principal results can be viewed in Table 2 and in the forest
plots in Figures 2 and 3. Further data can be viewed in the
full report of this systematic review [13].
3.2.1. Surgical (radical or partial nephrectomy) versus nonsurgical
management
One database review [18] assessed this comparison.
Nonsurgical management included pT1a patients who
had either observation or active surveillance only. The
analysis, which was based on a matched-pair population,
revealed that surgical management had a 5-yr cancer-
specific mortality benefit over nonsurgical (4.4% vs 12.4%)
(Table 2). However, even though this study was matched, it

[(Fig._1)TD$FIG]
Fig. 1 – PRISMA flow diagram.
E U R O P E A N U R O L O G Y 6 1 ( 2 0 1 2 ) 9 7 2 – 9 9 3 975
is marked by indication bias. That is, the surveillance group
members were indicated to that intervention and not
randomly allocated to it; surveillance patients were older
(mean: 73 vs 61.4 yr of age) (Table 1), and it is likely they
were generally more frail and less likely to be suitable
candidates for surgery. The study was marked by other
methodological flaws such as uncertain disease status in the
surveillance group (indicated by failing to measure and
control for two of the main prognostic confounders, ie,
Fuhrman grade and histologic cell type) (Table 1).
3.2.2. Technique of radical nephrectomy
3.2.2.1. Laparoscopic versus open radical nephrectomy. There were
no randomised studies assessing oncological outcomes. A
prospective cohort study [19] and a retrospective database
review [20], both of low methodological quality, found
similar oncological outcomes with 5-yr overall survival
for laparoscopic versus open radical nephrectomy
reported at 87.8% versus 88.7% ( p = 0.87), respectively,
in the study by Hemal et al. [19] (Table 2); and all-cause
deaths were 3 of 36 versus 1 of 37, respectively, in the
study by Gratzke and colleagues [20] (Fig. 2). There was
no evidence of any difference in cancer-specific and
recurrence-free survival at 5 yr reported in the study by
Hemal et al. [19] (Table 2).
3.2.2.2. Retroperitoneal versus transperitoneal radical nephrectomy.
Two randomised studies [21,22] and one quasi-randomised
study [23] compared retroperitoneal and transperitoneal
laparoscopic radical nephrectomy. Both approaches were
found to have similar oncological outcomes. No cancer-
specific deaths were reported by Nadler et al. [23] (Fig. 3),
and although Desai et al. [21] reported more all-cause deaths
in the retroperitoneal approach (4 of 52 vs 2 of 50) (Fig. 2),
the result was not statistically significant. A very low
number of metastatic events was reported across the studies:
Nadler et al. [23] and Nambirajan et al. [22] reported none,
whereas Desai et al. [21] reported 1 of 52 versus 3 of 50 for
retroperitoneal versus transperitoneal radical nephrectomy,
respectively (plot 2.4, full report). No incidences of positive
surgical margins were reported (plot 2.5, full report).
3.2.2.3. Hand-assisted laparoscopic radical nephrectomy versus stan-
dard laparoscopic radical nephrectomy. One RCT [23] and one

Table 1 – Baseline characteristics and oncological confounder adjustment scores
Study, design, and
adjustment
Interventions N FU (months)
mean (SD),
*median [range]
Age: Mean (SD),
*median [range]
Tsize (cm)
Mean (SD)
[range], *median
path Tstage T grade N
(Fuhrman unless
stated)
Histological
cell type
Necrosis
Zini 2009 [18];
matched pair
SM 430 *16 [0.1–146] 73 [unmatched;
n = 433]
2.8 [unmatched;
n = 433]
All pT1a NR NR NR
NSM 1545 *50 [0.1–203] 61.4 [unmatched;
n = 433]
2.8 [unmatched;
n = 433] ( p = 0.5)
All pT1a NR NR NR
Adjustment NA NA NA NA 1 1 5 5 5
Gratzke 2009 [20];
database review
(Ludwig-Maximilian and
Basel University)
LRN 36 22 [11–71] 67.8 (12.8) NR pT1a: 12 (33.3)
pT1b: 17 (47.2)
pT2: 0
pT3: 4 (11.1)
NR NR NR
ORN 37 22 [11–71] 61.1 (12.7) NR pT1a: 9 (24)
pT1b: 20 (54)
pT2: 8 (22)
pT3: 0
NR NR NR
Adjustment NA NA NA NA 5 5 5 5 5
Hemal 2007 [19];
prospective cohort
HALRN 41 51.4 [3–78] 52.5 (11.3) 9.9 (2.2) All T2 NR NR NR
SLRN 71 57.2 [4–80] 52.7 (11.8) 10.1 (3.2) All T2 NR NR NR
Adjustment NA NA NA 1 1 5 5 5
Nambirajan 2004
[22]; Q-RCT
RLRN 20 15 [6–26] 66.8 [43–82] 4.29 (1.83) pT1: 17
pT2: 0
pT3a: 2
pT3b: 0
Benign: 1
NR NR NR
TLRN 20 17 [6–16] 62.2 [41–80] 4.58 (1.56) pT1: 12
pT2: 2
pT3a: 2
pT3b: 3
Benign:1
NR NR NR
Nadler 2006 [23]; Q-RCT RLRN 11 Overall *20 [0–51] 61 [42–85] NR All cT1 NR NR NR
TLRN 11 63 [50–86] NR AllTc1 NR NR NR
Desai 2005 [21]; RCT RLRN 52 13.5 (11.9) [0.5–40] 64.5 (12.3) [29–89] 5 (2) [2–10.2] All cT1 G1: 5 (10)
G2: 17 (34)
G3: 12 (24)
G4: 5 (10)
RCC: 39 (75)
TCC: 0
Angiomyolipoma: 7 (11)
Oncocytoma: 1 (2) Other:
5 (10)
Clear cell: 25 (50)
Granular: 2 (4)
Sarcomatoid: 2 (4)
Papillary: 5 (10)
Mixed: 5 (10)
Other: 0
NR
TLRN 50 15 (6.2) [3–24] 62.8 (13.3) [30–38] 5.3 (2.8) [1.7–15] All cT1 G1: 7 (14)
G2: 16 (32)
G3: 13 (26)
G4: 6 (12)
RCC: 42 (84)
TCC: 0
Angiomyolipoma: 1 (2)
Oncocytoma: 4 (8)
Other: 2 (4)
Clear cell: 27 (54)
Granular: 1 (2)
Sarcomatoid: 0
Papillary: 8: (16)
Mixed: 2: (4)
Other: 4: (8)
NR
EU
RO
PE
AN
UR
OL
OG
Y6
1(
20
12
)9
72
–9
93
97
6
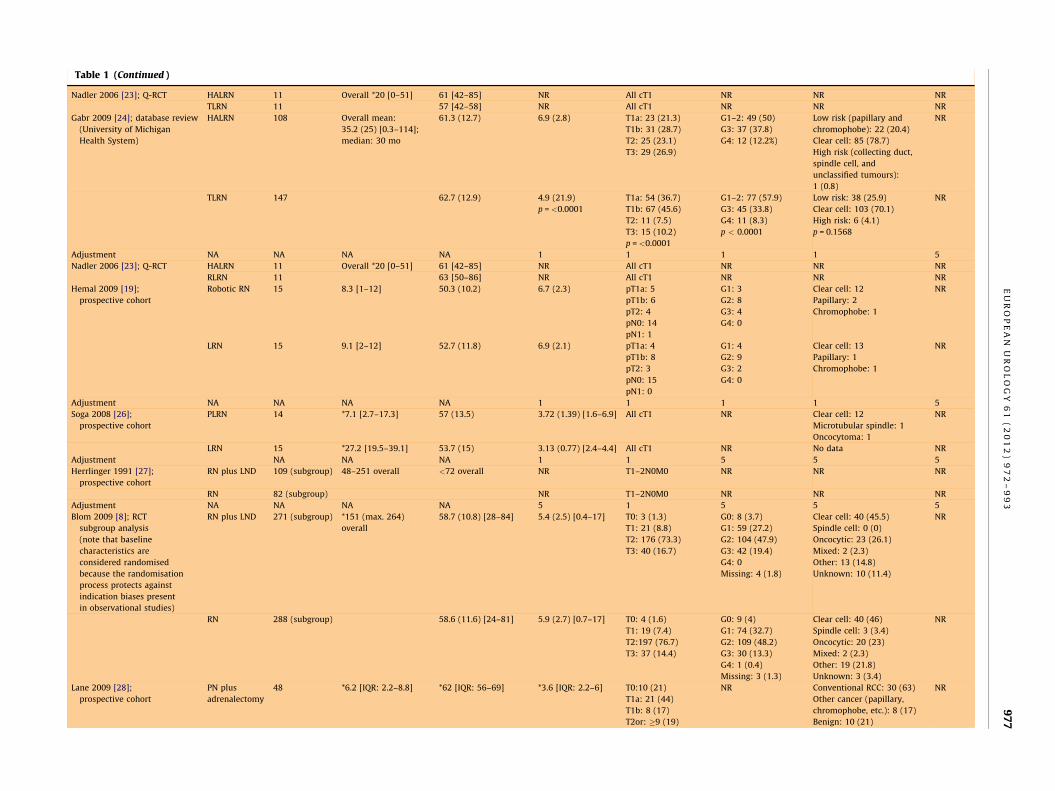
Table 1 (Continued )
Nadler 2006 [23]; Q-RCT HALRN 11 Overall *20 [0–51] 61 [42–85] NR All cT1 NR NR NR
TLRN 11 57 [42–58] NR All cT1 NR NR NR
Gabr 2009 [24]; database review
(University of Michigan
Health System)
HALRN 108 Overall mean:
35.2 (25) [0.3–114];
median: 30 mo
61.3 (12.7) 6.9 (2.8) T1a: 23 (21.3)
T1b: 31 (28.7)
T2: 25 (23.1)
T3: 29 (26.9)
G1–2: 49 (50)
G3: 37 (37.8)
G4: 12 (12.2%)
Low risk (papillary and
chromophobe): 22 (20.4)
Clear cell: 85 (78.7)
High risk (collecting duct,
spindle cell, and
unclassified tumours):
1 (0.8)
NR
TLRN 147 62.7 (12.9) 4.9 (21.9)
p = <0.0001
T1a: 54 (36.7)
T1b: 67 (45.6)
T2: 11 (7.5)
T3: 15 (10.2)
p = <0.0001
G1–2: 77 (57.9)
G3: 45 (33.8)
G4: 11 (8.3)
p < 0.0001
Low risk: 38 (25.9)
Clear cell: 103 (70.1)
High risk: 6 (4.1)
p = 0.1568
NR
Adjustment NA NA NA NA 1 1 1 1 5
Nadler 2006 [23]; Q-RCT HALRN 11 Overall *20 [0–51] 61 [42–85] NR All cT1 NR NR NR
RLRN 11 63 [50–86] NR All cT1 NR NR NR
Hemal 2009 [19];
prospective cohort
Robotic RN 15 8.3 [1–12] 50.3 (10.2) 6.7 (2.3) pT1a: 5
pT1b: 6
pT2: 4
pN0: 14
pN1: 1
G1: 3
G2: 8
G3: 4
G4: 0
Clear cell: 12
Papillary: 2
Chromophobe: 1
NR
LRN 15 9.1 [2–12] 52.7 (11.8) 6.9 (2.1) pT1a: 4
pT1b: 8
pT2: 3
pN0: 15
pN1: 0
G1: 4
G2: 9
G3: 2
G4: 0
Clear cell: 13
Papillary: 1
Chromophobe: 1
NR
Adjustment NA NA NA NA 1 1 1 1 5
Soga 2008 [26];
prospective cohort
PLRN 14 *7.1 [2.7–17.3] 57 (13.5) 3.72 (1.39) [1.6–6.9] All cT1 NR Clear cell: 12
Microtubular spindle: 1
Oncocytoma: 1
NR
LRN 15 *27.2 [19.5–39.1] 53.7 (15) 3.13 (0.77) [2.4–4.4] All cT1 NR No data NR
Adjustment NA NA NA 1 1 5 5 5
Herrlinger 1991 [27];
prospective cohort
RN plus LND 109 (subgroup) 48–251 overall <72 overall NR T1–2N0M0 NR NR NR
RN 82 (subgroup) NR T1–2N0M0 NR NR NR
Adjustment NA NA NA NA 5 1 5 5 5
Blom 2009 [8]; RCT
subgroup analysis
(note that baseline
characteristics are
considered randomised
because the randomisation
process protects against
indication biases present
in observational studies)
RN plus LND 271 (subgroup) *151 (max. 264)
overall
58.7 (10.8) [28–84] 5.4 (2.5) [0.4–17] T0: 3 (1.3)
T1: 21 (8.8)
T2: 176 (73.3)
T3: 40 (16.7)
G0: 8 (3.7)
G1: 59 (27.2)
G2: 104 (47.9)
G3: 42 (19.4)
G4: 0
Missing: 4 (1.8)
Clear cell: 40 (45.5)
Spindle cell: 0 (0)
Oncocytic: 23 (26.1)
Mixed: 2 (2.3)
Other: 13 (14.8)
Unknown: 10 (11.4)
NR
RN 288 (subgroup) 58.6 (11.6) [24–81] 5.9 (2.7) [0.7–17] T0: 4 (1.6)
T1: 19 (7.4)
T2:197 (76.7)
T3: 37 (14.4)
G0: 9 (4)
G1: 74 (32.7)
G2: 109 (48.2)
G3: 30 (13.3)
G4: 1 (0.4)
Missing: 3 (1.3)
Clear cell: 40 (46)
Spindle cell: 3 (3.4)
Oncocytic: 20 (23)
Mixed: 2 (2.3)
Other: 19 (21.8)
Unknown: 3 (3.4)
NR
Lane 2009 [28];
prospective cohort
PN plus
adrenalectomy
48 *6.2 [IQR: 2.2–8.8] *62 [IQR: 56–69] *3.6 [IQR: 2.2–6] T0:10 (21)
T1a: 21 (44)
T1b: 8 (17)
T2or: �9 (19)
NR Conventional RCC: 30 (63)
Other cancer (papillary,
chromophobe, etc.): 8 (17)
Benign: 10 (21)
NR
EU
RO
PE
AN
UR
OL
OG
Y6
1(
20
12
)9
72
–9
93
97
7
Table 1 (Continued )
Study, design, and
adjustment
Interventions N FU (months)
mean (SD),
*median [range]
Age: Mean (SD),
*median [range]
Tsize (cm)
Mean (SD)
[range], *median
path Tstage T grade N
(Fuhrman unless
stated)
Histological
cell type
Necrosis
PN 2017 *5.5 yr [IQR: 2.9–9] *61 [IQR: 51–70] *3.0 [IQR: 2.1–4.3] T0: 314 (19)
T1a: 940 (56)
T1b: 310 (19)
T2or: �100 (6)
NR Conventional RCC: 1150 (63)
Other cancer (papillary,
chromophobe, etc.): 351 (19)
Benign: 314 (17)
NR
Adjustment NA NA NA NA 1 5 5 1 5
D’Armiento 1997
[29]; RCT
OPN 19 70 (max. 98) 51.4 (13.7) [23–74] 3.34 (0.64) NR G1:11
G2: 7
G3:1
NR NR
ORN 21 70 (max. 97) 48.7 (14.7) [27–76] 3.21 (0.56) NR G1: 10
G2: 8
G3: 3
NR NR
Butler 1995 [30];
database review
(Cleveland Clinic)
OPN 46 40 (26) 60 (14) 2.5 (0.8) pT1: 13 (28)
pT2: 28 (61)
pT3a: 5 (11)
NR NR NR
ORN 42 66 (30) 64 (13) 2.7 (0.8) pT1: 9 (21)
pT2: 28 (67)
pT3a: 5 (12)
NR NR NR
Adjustment NA NA NA NA 1 1 5 5 5
Gratzke 2009 [20];
database review
(Ludwig-Maximilian
and Basel University)
OPN 44 Mean: 22 mo;
range: 11–71
60.7 (12.4) NR pT1a: 35 (80)
pT1b: 6 (14)
pT2: 1 (2)
pT3: 0
Missing: 2
NR NR NR
ORN 37 Mean: 22 mo;
range: 11–71
61.1 (12.7) NR pT1a: 9 (24)
pT1b: 20 (54)
pT2: 8 (22)
pT3: 0
NR NR NR
Adjustment NA NA NA NA 5 5 5 5 5
Lee 2007 [31];
matched pair
OPN 56 37.1 (26.1) 51.8 (11.7) 2.5 (0.8) Al pT1a G1: 3
G2: 34
G3: 19
NR NR
ORN 56 39 (20.37) 52.5 (11.0) 2.5 (0.8) Al pT1a G1: 2
G2: 37
G3: 17
NR NR
Adjustment NA NA NA NA 1 1 1 5 5
Simmons 2009 [32];
database review
LPN 35 *44 (27–85) 63.5 (12) 4.6 (4.1–7.5) pT1b: 29 (83)
pT2: 1 (3)
pT3a: 3 (9)
pT3b: 2 (6)
Mean (SD): 2.3 (0.6)
G 1: 2 (6)
G 2: 20 (57)
G 3: 12 (34)
G 4: 1 (3)
Clear cell: 23 (66)
Papillary: 12 (33)
Chromophobe: 0
Unspecified: 0
NR
LRN 75 *57 (27–79) 63.4 (12) 5.3 (4–7.3)
p = 0.026
pT1b: 43 (57)
p T2: 2 (3)
pT3a: 25 (33)
pT3b: 5 (7)
Mean (SD): 2.6 (0.6)
G1: 2 (3)
G2: 30 (40)
G3: 38 (51)
G4: 5 (6)
Clear cell: 63 (85)
Papillary: 7 (9)
Chromophobe: 4 (5)
Unspecified: 1 (1)
NR
Adjustment NA NA NA NA 5 5 5 5 5
Dash 2006 [39];
database review
(Sloan-Kettering)
O/LPN 45 *21 56.7 (13) 4.85 (0.94) pT1: 41 (91)
pT3: 4 (9)
G1–2: 35 (78)
G3–4: 9 (20)
Unknown: 1 (2)
All clear cell NR
ORN 151 *21 63.1 (11.5) 5.42 (0.89) pT1: 124 (82)
pT3: 27 (18)
G1–2: 107 (71),
G3 + 4: 43 (28),
Unknown: 1 (1)
All clear cell NR
EU
RO
PE
AN
UR
OL
OG
Y6
1(
20
12
)9
72
–9
93
97
8

Table 1 (Continued )
Adjustment NA NA NA NA 1 1 1 1 5
Huang 2009 [33];
SEER database review
O/LPN 556 43 overall; 48 in
patients who were
alive at end of
follow-up
66–69: 155 (28%)
70–74: 189 (34%)
75–79: 144 (26%)
80–84: 59 (11%)
85+: 9 (1%)
<4 cm All T1a NR NR NR
O/LRN 2435 *21 66–69: 536 (22%)
70–74: 747 (31%)
75–79: 671 (28%)
80–84: 364 (15%)
85+: 117 (4%)
<4 cm All T1a NR NR NR
Adjustment NA NA NA NA 1 1 5 5 5
Patard 2008 [36];
matched pair
(multi-institutional)
O/LPN 289 Mean: 54 overall 59.3 5.47 pT1a: 273 (94.5)
pT2: 16
G1–2: 234 (81) NR NR
O/LRN 257 61 5.5 pT1a: 241 (93.8)
pT2: 16
G1–2: 204 (79.4) NR NR
Adjustment NA NA NA NA 1 1 1 5 5
Patard 2004 [37];
database review
(7 international centres)
O/LPN 379:
pT1a 314;
pT1b 65
50.7 (40.3) 59.7 (12.3) T1a: 2.5 (0.8)
T1b: 5.3 (0.8)
pT1a: 314 (82.8)
pT1b: 65 (17.2)
G1–2:
T1a: 287 (91.7)
T1b: 57 (89.1)
Missing: 2/579
Clear cell: 310 (82.7)
Papillary: 46 (12.3)
Chromophobe: 19 (5)
NR
O/LRN 1075:
pT1a 499;
pT1b 576
66.6 (54.2) 60 (12.4) T1a: 3.2 (0.8)
T1b: 5.6 (0.8)
pT1a: 499 (46.4)
pT1b: 576 (53.6)
G1–2:
T1a: 439 (88)
T1b: 470 (89.1)
Missing: 2/1075
Clear cell: 909 (85.5)
Papillary: 123 (11.6)
Chromophobe: 27 (2.6)
NR
Adjustment NA NA NA NA 1 1 1 1 5
Weight 2010 [40];
matched pair
(SEER database)
(USA)
O/LPN 524 * 46 [IQR: 25–75] 63 [IQR: 53–71] 5.0 [IQR: 4.5–5.6]
(preoperative)
4.3 [IQR: 3.5–5]
(pathologic)
pT1: 394/447 (88.1)
�pT2: 53/447 (11.9)
G3–4: 170/423 (40.2) Of the malignant
tumours (n = 438):
Clear cell: 327 (74.5)
Papillary: 77 (17.6)
Chromophobe or
oncocytic neoplasm: 24 (5.4)
Other: 10 (3.1)
Benign: 86/524 (16.4)
NR
O/LRN 480 * 50 [IQR: 28–73] 65 [IQR: 56–73] 5.6 [IQR: 5–6.4]
(preoperative)
5.0 [IQR: 4.3–6.0]
(pathologic)
pT1: 324/452 (71.7)
�pT2: 128/452 (28.3)
G3–4: 213/406 (52.5) Of the malignant
tumours (n = 429):
Clear cell: 340 (79.2)
Papillary: 53 (12.4)
Chromophobe or
oncocytic neoplasm: 17 (4)
Other: 19 (4.4)
Benign: 51/480 (10.6)
NR
Adjustment NA NA NA NA 1 1 1 1 5
Zini 2009 [34];
matched pair
(SEER database)
O/LPN 1283 *35 59.6 2.5 All pT1a G1:352 (27.4)
G2:735 (57.3)
G3: 180 (14)
G4: 16 (1.2)
Clear cell: 1047 (81.6)
Papillary: 104 (8.1)
Other: 132 (10.3)
NR
O/LRN 3166 *46 61.3 2.8 All pT1a G1: 917 (29)
G2: 1805 (57)
G3: 412 (13)
G4: 32 (1)
Clear cell: 2699 (85.2)
Papillary: 152 (4.8)
Other: 315 (9.9)
NR
Adjustment NA NA NA NA 1 1 1 1 5
EU
RO
PE
AN
UR
OL
OG
Y6
1(
20
12
)9
72
–9
93
97
9

Table 1 (Continued )
Study, design, and
adjustment
Interventions N FU (months)
mean (SD),
*median [range]
Age: Mean (SD),
*median [range]
Tsize (cm)
Mean (SD)
[range], *median
path Tstage T grade N
(Fuhrman unless
stated)
Histological
cell type
Necrosis
Thompson 2008 [35];
database review
(Mayo Clinic)
O/LPN 358
(including 187
who were
younger than
age 65)
*67.2 [range:
8.4–211.2]
*64 [26–94] *2.5 [range: 0.2–4] All pT1a NR Clear cell RCC: 186 (52)
Papillary RCC: 75 (21)
Chromophobe RCC: 16 (4.5)
Collecting duct RCC: 1 (0.3)
RCC not otherwise
specified: 1 (0.3)
Benign: 79 (22.1)
NR
O/LRN 290
(including 140
who were
younger than
age 65)
*112.8 [range:
1.2–207.6]
*65 [24–85] *3 [range: 0.2–4]
p < 0.001
All pT1a NR Clear cell RCC: 191 (65.9)
Papillary RCC: 41 (14.1)
Chromophobe RCC: 10 (3.5)
Collecting duct RCC: 0
RCC not otherwise
specified: 5 (1.7)
Benign: 43 (14.8)
NR
Adjustment NA NA NA NA 1 1 5 1 5
Crepel 2010 [41];
matched pair
(SEER database)
O/LPN 163 34 (23) 61 [25–84] 5.2 (5) T1bN0M0 G1: 41 (25.2)
G2: 83 (50.9)
G3: 37 (22.7)
G4: 2 (1.2)
Unknown: 0
Clear cell: 131 (80.4)
Papillary: 23 (14.1)
Chromophobe: 7 (4.3)
Unclassified: 2 (1.2)
NR
O/LRN 636 39.4 (26.5) 61 [30–92] 5.2 (5) T1bN0M0 G1: 155 (24.4)
G2: 332 (52.2)
G3: 145 (22.8)
G4: 4 (0.6)
Unknown: 0
Clear cell: 592 (93)
Papillary: 29 (4.6)
Chromophobe: 10 (1.6)
Unclassified: 5 (0.8)
NR
Adjustment NA NA NA NA 1 1 1 1 5
Thompson 2009 [38];
database review (Mayo
Clinic and Sloan-Kettering)
O/LPN 286 *40.8 [0–204] <65: 164 (57%)
�65: 122 (43%)
4.1–5: 155 (61%)
5.1–6: 66 (23%)
6.1–7: 45 (16%)
pT1b: 277 (97)
pT3a: 11(4)
NR Clear cell: 155 (54)
Papillary: 60 (21)
Chromophobe: 32 (11)
Collecting duct: 0
Other RCC: 1 (0.4)
Benign: 38 (13)
NR
O/LRN 873 63.6 [0–228] <65: 422 (48%)
>65: 451 (52%)
4.1–5: 330 (38%)
5.1–6: 289 (33%)
6.1–7: 254 (29%)
pT1b: 815 (93)
pT3a: 9 (3)
NR Clear cell: 629 (72)
Papillary: 100 (12)
Chromophobe: 50 (6)
Collecting duct: 2 (0.2)
Other RCC: 7 (0.8)
Benign: 85 (10)
NR
Adjustment NA NA NA NA 1 1 5 5 5
Gill 2007 [42]; database
review (Cleveland Clinic,
Mayo Clinic, and Johns
Hopkins University)
LPN 771 *14.4 [0–84] 59.4 [range: 19–87] 2.6 [0.4–8]
(pathologic)
cT1b: 68/771 (8.8)
Otherwise cT1a
NR NR NR
OPN 1029 *33.6 [0–91.2] 61.6 [range: 25.7–94.0] 3.3 [0.13–9.0]
(pathologic)
cT1b: 323/1029 (31.4)
Otherwise cT1a
NR NR NR
Adjustment NA NA NA NA 5 5 5 5 5
Gong 2008 [44];
matched pair
LPN 76 21.7 (25.6) 60.1 (12.5) 2.87 (0.81) Benign: 21 (27.6)
pT1a: 53 (69.7)
pT1b: 2 (2.6)
pT2: 0
NR NR NR
EU
RO
PE
AN
UR
OL
OG
Y6
1(
20
12
)9
72
–9
93
98
0

Table 1 (Continued )
OPN 77 20.6 (23.1) 57.7 (13.6) 2.45 (0.87) Benign: 17 (22.1)
pT1a: 50 (64.9)
pT1b: 9 (11.7)
pT2:1 (1.3)
NR NR NR
Adjustment NA NA NA NA 1 1 5 5 5
Lane 2010 [43];
database review
(Cleveland clinic)
LPN 672 *4 yr [IQR: 3.3–6.8] *61 [IQR: 51–69] *2.6 [IQR: 2.0–3.4] pT1a: 425 (85)
pT1b: 42 (8.4)
pT2+: 32 (6.4)
G1–2: 332 (70)
G3–4: 148 (30)
Clear cell: 324 (48)
Papillary: (17)
Chromophobe: (8)
Other: (1.2)
Benign: 173 (26)
NR
OPN 944 *5.7 [IQR: 3.9–7.3] * 61 [IQR: 52–70] *3.5 [IQR: 2.5–4.5] pT1a: 510 (67)
pT1b: 193 (25)
pT2+: 58 (7.6)
G1–2: 481 (64)
G3–4: 286 (36)
Clear cell: 554 (59)
Papillary: (14)
Chromophobe: (6)
Other: (1.8)
Benign: 182 (19)
NR
Adjustment NA NA NA NA 1 1 1 1 5
Marszalek 2009 [45];
matched pair
LPN 100 44.4 (2.4) [19.2–110.4]
(mean, SE, range)
62.3 [range: 22.9–83.4] *2.8, [IQR: 2.0–3.2] All pT1a NR Of the malignant
tumours (n = 81):
Clear cell: 52 (64.2)
Papillary: 15 (18.5)
Other: 14 (17.3)
Benign = 19/100
NR
OPN 100 42 (2.4) [12–117.6]
(mean, SE, range)
62.5 [range: 21.9–84.6] *2.9, [IQR: 2.3–3.5] All pT1a NR Of the malignant
tumours (n = 66)
Clear cell: 49 (74.2)
Papillary: 10 (15.2)
Other: 7 (10.6)
Benign: 34/100
NR
Adjustment NA NA NA NA 1 1 5 1 5
Wu 2010 [46]; database
review (Northwestern
University of Feinberg
Medical School)
RF-RCPN 42 25.8 [range: 0.5–71.5] 56 [27–77] 2.8 [0.9–12] NR NR RCC: 32 (76.2)
Benign: 10 (23.8)
Other malignancy: 0
NR
LPN 36 7.8 [range:1.0–18.9] 58 [36–79] 2 [0.5–3.5] NR NR RCC: 24 (66.7)
Benign: 12 (33.3)
Other malignancy: 0
NR
Adjustment NA NA NA NA 2 5 5 1 5
Desai 2005 [47];
database review
Lap-Cryo 78
(89 tumours)
24.6 [1–60] 65.55 (12.69) [28–88] 2.05 (0.56) [0.6–3] All cT1 NR RCC: 56
Benign: 38
Inconclusive: 6
Of the RCC (n = 50):
Clear cell: 28
Papillary: 19
Other: 3
NR
LPN 153
(153 tumours)
5.8 [1–36] 60.59 (13.19) [17–87] 2.25 (0.67) [0.9–3] All cT1 NR RCC: 68
Benign: 32
Inconclusive: 0
Of the RCC (n = 104):
Clear cell: 64
Papillary: 32
Other: 8
NR
Adjustment NA NA NA NA 1 1 5 1 5
O’Malley 2007 [48];
matched pair
Lap-Cryo 15 11.9 (7.2) 76.1 (4.5) 2.7 (1.3) All cT1 NR NR NR
LPN 15 9.83 (8.8) 75.7 (4.6) 2.5 (1) All cT1 NR NR NR
EU
RO
PE
AN
UR
OL
OG
Y6
1(
20
12
)9
72
–9
93
98
1

Ta
ble
1(C
on
tin
ued
)
Stu
dy
,d
esi
gn
,a
nd
ad
just
me
nt
Inte
rve
nti
on
sN
FU(m
on
ths)
me
an
(SD
),
*me
dia
n[r
an
ge
]
Ag
e:
Me
an
(SD
),
*me
dia
n[r
an
ge
]
Tsi
ze(c
m)
Me
an
(SD
)
[ra
ng
e],
*me
dia
n
pa
thT
sta
ge
Tg
rad
eN
(Fu
hrm
an
un
less
sta
ted
)
His
tolo
gic
al
cell
typ
e
Ne
cro
sis
Ad
just
me
nt
NA
NA
NA
NA
11
55
5
Ko
20
08
[49
];
ma
tch
ed
pa
ir
Lap
-Cry
o2
02
7.3
(10
.8)
56
.3(1
1.5
)[2
4–
76
]2
.38
(1.6
7)
[1.0
–4
.0]
pT
1G
1:
3
G2
:1
2
G3
:6
G4
:0
No
n–
cle
ar
typ
e:
2(o
fth
ese
,1
is
pa
pil
lary
typ
e1
;
the
oth
er
is
pa
pil
lary
typ
e2
)
NR
OP
N2
02
8.7
(14
.9)
57
.6(1
0.9
)[4
4–
77
]2
.16
(1.0
8)
[1.3
–3
.9]
pT
1G
1:
4
G2
:1
5
G3
:0
G4
:1
No
n–
cle
ar
typ
e:
1(p
ap
illa
ryty
pe
2)
NR
Ad
just
me
nt
NA
NA
NA
NA
11
11
5
NA
=n
ot
ap
pli
cab
le;
NR
=n
ot
rep
ort
ed
;S
M=
surg
ica
lm
an
ag
em
en
t;N
SM
=n
on
surg
ica
lm
an
ag
em
en
t;H
ALR
N=
ha
nd
-ass
iste
dla
pa
rosc
op
icra
dic
al
ne
ph
rect
om
y;
SLR
N=
sta
nd
ard
lap
aro
sco
pic
rad
ica
ln
ep
hre
cto
my
;
RLR
N=
retr
op
eri
ton
ea
lla
pa
rosc
op
icra
dic
al
ne
ph
rect
om
y;
TLR
N=
tra
nsp
eri
ton
ea
lla
pa
rosc
op
icra
dic
al
ne
ph
rect
om
y;
Ro
bo
tic
RN
=ro
bo
tic
rad
ica
ln
ep
hre
cto
my
;LR
N=
lap
aro
sco
pic
rad
ica
ln
ep
hre
cto
my
;P
LRN
=p
ort
less
lap
aro
sco
pic
rad
ica
ln
ep
hre
cto
my
;R
N=
rad
ica
ln
ep
hre
cto
my
;R
N+
LND
=ra
dic
al
ne
ph
rect
om
y+
lym
ph
no
de
dis
sect
ion
;O
PN
=o
pe
np
art
ial
ne
ph
rect
om
y;
OR
N=
op
en
rad
ica
ln
ep
hre
cto
my
;LP
N=
lap
aro
sco
pic
pa
rtia
l
ne
ph
rect
om
y;
O/L
PN
=o
pe
no
rla
pa
rosc
op
icp
art
ial
ne
ph
rect
om
y;
O/L
RN
=o
pe
no
rp
art
ial
lap
aro
sco
pic
rad
ica
ln
ep
hre
cto
my
;R
F-R
CP
N=
rad
iofr
eq
ue
ncy
-ass
iste
dro
bo
tic
cla
mp
less
pa
rtia
ln
ep
hre
cto
my
;La
p-
Cry
o=
lap
aro
sco
pic
cry
oa
bla
tio
n;
RC
C=
ren
al
cell
carc
ino
ma
.
E U R O P E A N U R O L O G Y 6 1 ( 2 0 1 2 ) 9 7 2 – 9 9 3982
database review [24] compared hand-assisted and transper-
itoneal laparoscopic radical nephrectomy. There were no
cancer-specific deaths (Fig. 3), positive surgical margins, or
recurrences (plots 3.1–3.4, full report [13]) in the trial by
Nadler and colleagues [23] (which used the transperitoneal
approach only), but it should be noted that study numbers
were very low with only 11 patients in each arm, and follow-
up was short (median: 20 mo). Oncological outcomes were
comparable in the study by Gabr et al. [24] (which used
transperitoneal and retroperitoneal approaches). Estimated
5-yr overall survival (74% vs 79%; p = 0.69), cancer-specific
survival (87.2% vs 88.9%; p = 0.76), and recurrence-free
survival (81.3% vs 76.5%; p = 0.87) rates were comparable
between hand-assisted and standard laparoscopic radical
nephrectomy, respectively (Table 2). Reported hazard ratios
(HRs) favoured the hand-assisted procedure; however, the
estimated CIs were wide, indicating considerable uncertain-
ty. For example, the overall survival-adjusted HR was 0.407
(0.150–1.395) (Table 2).
3.2.2.4. Hand-assisted laparoscopic radical nephrectomy versus retro-
peritoneal laparoscopic radical nephrectomy. Only one small RCT
[23] (n = 22) compared hand-assisted and retroperitoneal
laparoscopic radical nephrectomy. There were no reported
cancer deaths, positive surgical margins, or recurrences
(plots 4.1–4.4, full report [13]), however, probably due to
the short follow-up time (median: 20 mo).
3.2.2.5. Robot-assisted laparoscopic radical nephrectomy versus
laparoscopic radical nephrectomy. Only one small prospective
cohort study (n = 30) compared robotic and laparoscopic
radical nephrectomy [25]. There were no local recurrences,
port-site, or distant metastases (plot 6.1–6.2, full report
[13]). The study groups were comparable, but sample size
was small and follow-up was <1 yr.
3.2.2.6. Single-port laparoscopic radical nephrectomy versus laparo-
scopic radical nephrectomy. One prospective cohort study
compared ‘‘portless’’ (n = 14) and three-port (n = 15)
laparoscopic radical nephrectomy [26]. There were no local
recurrences, but the study was small with a short follow-up
(especially in the portless group; mean: 7.1 mo; range:
2.7–17.3 mo) (plot 7.1, full report [13]).
3.2.3. Ipsilateral lymphadenectomy and ipsilateral adrenalectomy
3.2.3.1. Radical or partial nephrectomy with limited or extended
lymphadenectomy versus radical or partial nephrectomy alone. Blom
et al. [8] conducted a Europeanwide multicentre RCT
(n = 772) comparing radical nephrectomy with or without
complete lymph node dissection. The subgroup analysis of
the cT1 and cT2 population from this trial showed no
evidence of a difference between the groups (HR: 1.096
[0.81–1.47]; log-rank p = 0.55). However, the lymphadenec-
tomy in this trial was not standardised.
Herrlinger et al. [27] performed a retrospective observa-
tional study, comparing radical nephrectomy with either
extended lymphadenectomy or facultative lymphadenecto-
my (ie, no lymph node dissection or node sampling for

Table 2 – Results
Experimental (Exp) Control (Ctr) Author Outcome N at baseline Value Reported
P values
Note
Exp Ctr Exp Ctr
Non-surgical management Surgery Zini 2009 [18] Cancer-specific death at 5 yr 430 1545 12.4% 4.40% NR Matched for age, tumour size, and year
of diagnosis
Zini 2009 [18] Other-cause death at 5 yr 430 1545 57.4% 22.40% NR Matched for age, tumour size, and year
of diagnosis
Laparoscopic radical
nephrectomy
Open radical
nephrectomy
Hemal 2007 [19] Overall survival at 5 yr 41 71 87.8% 88.7% 0.87 Published KM estimate
Hemal 2007 [19] Cancer-specific survival at 5 yr 41 71 95.12% 94.36% 0.79 Published KM estimate
Hemal 2007 [19] Recurrence-free survival at 5 yr 41 71 92.6% 90.1% 0.91 Published KM estimate
Hand-assisted laparoscopic
radical nephrectomy
Standard
laparoscopic
radical
nephrectomy
Gabr 2009 [24] Overall survival 108 147 – – – HR: 0.407 (95% CI, 0.150–1.395)
Adjusted for specimen handling (intact/
morcellation), mass size, pathologic risk
(based on UCLA integrated staging), and
histologic subtype
Gabr 2009 [24] Cancer-specific survival 108 147 – – – HR: 0.385 (95% CI, 0.087–1.694)
Adjusted for specimen handling (intact
or morcellation), mass size, pathologic
risk (based on UCLA integrated staging,
inkling T stage), and histologic subtype
Gabr 2009 [24] Recurrence-free survival 108 147 – – – HR: 0.384 (95% CI, 0.122–1.209)
Adjusted for specimen handling (intact
or morcellation), mass size, pathologic
risk (based on UCLA integrated staging,
inkling T stage), and histologic subtype
Gabr 2009 [24] Overall survival at 5 yr 108 147 74% (95% CI,
63–85)
79% (95% CI,
68–90)
0.6864 Published KM estimate
Gabr 2009 [24] Cancer-specific survival at 5 yr 108 147 87.2 (95% CI,
79–95)
88.9% (95% CI,
81–97)
0.7589 Published KM estimate
Gabr 2009 [24] Recurrence-free survival at 5 yr 108 147 81.3% (95% CI,
72–91)
76.5% (95% CI,
64–89)
0.8663 Published KM estimate
Radical nephrectomy with
lymph node dissection
Radical
nephrectomy
Blom 2009 [8] Overall survival 271 288 – – – HR: 1.096 (95% CI, 0.81–1.47); log-rank
p = 0.55
Radical nephrectomy with
extended lymph node
dissection
Radical
nephrectomy
with facultative
lymph node
dissection
Herrlinger 1991 [27] Survival rates 109 82 80.2% (SD 12.5) 54% (SD 14.1) <0.01 Life table method
Partial nephrectomy with
ipsilateral adrenalectomy
Partial
nephrectomy
Lane 2009 [28] Overall survival at 5 yr 48 2017 82% 85% 0.56 Published KM estimate
Lane 2009 [28] Overall survival at 10 yr 48 2017 72.4% 68% NR Published KM estimate
Open partial nephrectomy
(<4 cm)
Open radical
nephrectomy
(<4 cm)
Butler 1995 [30] Overall survival at 5 yr 46 42 75% 80% NR Published KM estimate
Lee 2007 [31] Overall survival at 5 yr 56 56 98.2% 88.8% 0.63 Published KM estimate
Butler 1995 [30] Cancer-specific survival at 5 yr 46 42 100% 97% NR Published KM estimate
Lee 2007 [31] Cancer-specific survival at 5 yr 56 56 100% 97.9% 0.98 Published KM estimate (matched)
Lee 2007 [31] Disease-free survival at 5 yr 56 56 92.4% 95.6% 0.18 Published KM estimate (matched)
Laparoscopic partial
nephrectomy (>4 cm)
Laparoscopic
radical
nephrectomy
(>4 cm)
Simmons 2009 [32] Overall survival rate at 80 mo,
including pT3
35 75 74% (67–76) 72% (67–76) 0.660 Published KM estimate
Simmons 2009 [32] Cancer-specific survival rate
at 80 mo, including pT3
35 75 81% (74-87) 77% (75–80) 0.986 Published KM estimate
Simmons 2009 [32] Recurrence-free survival at
80 mo, including pT3
35 75 81% (74–87) 77% (74–79) 0.495 Published KM estimate
EU
RO
PE
AN
UR
OL
OG
Y6
1(
20
12
)9
72
–9
93
98
3

Table 2 (Continued )
Experimental (Exp) Control (Ctr) Author Outcome N at baseline Value Reported
P values
Note
Exp Ctr Exp Ctr
Open or laparoscopic
partial nephrectomy
(<4 cm)
Open or
laparoscopic
radical
nephrectomy
(<4 cm)
Huang 2009 [33] Overall survival 556 2435 – – – HR: 0.72 (95% CI, 0.59–0.88), p < 0.001
Adjusted for demographic
characteristics (age at diagnosis, race,
marital status, urban-rural location,
area level socioeconomic status), and
comorbidity
Unadjusted HR: 0.686, p < 0.001
Zini 2009 [34] Overall survival 1283 3166 – – – HR: 0.84, p = 0.048
Matched for age, tumour size, year of
surgery, and Fuhrman grade
Thompson 2008 [35] All-cause death (total population) 358 290 – – – RR: 1.2 (95% CI, 0.80–1.56), p = 0.52
Thompson 2008 [35] All-cause death (subgroup:
age <65 yr only)
187 140 – – – RR: 2.16 (95% CI, 1.12–4.19), p = 0.02
Adjusted for year of surgery (RR: 2.34
(95% CI, 1.17–4.69), p = 0.016),
preoperative creatinine (RR: 2.15 [95%
CI, 1.12–4.19), p = 0.027), Charlson-
Romano index (RR: 2.14 (95% CI,1.05–
4.35), p = 0.037), symptoms at
presentation (RR: 2.17 (95% CI, 1.11–
4.24), p = 0.023), diabetes at
presentation (RR: 2.23 (95% CI, 1.09–
4.56), p = 0.028), histology (RR: 2.32
(95% CI, 1.18–4.55), p = 0.015)
Thompson 2008 [35] Overall survival at 10 yr
(subgroup: age <65 yr only)
187 140 93% 82% NR Published KM estimate
Zini 2009 [34] Overall survival at 10 yr 1283 3166 70.9% 68.8% NR Matched for age, tumour size, year of
surgery, and Fuhrman grade
Huang 2009 [33] Overall survival at 5 yr 556 2435 74% 68% NR Published KM estimate
Zini 2009 [34] Overall survival at 5 yr 1283 3166 88.9% 85.5% NR Matched for age, tumour size, year of
surgery, and Fuhrman grade
Patard 2004 [37] Cancer-specific survival at
5 yr (T1a only)
314 499 97% 97% NR KM estimate from graph; chi-square
test p = 0.8, log-rank test p = 0.7
Open or laparoscopic
partial nephrectomy
(>4 cm)
Open or
laparoscopic
radical
nephrectomy
(>4 cm)
Thompson 2009 [38] Overall survival 286 873 – – – HR 1.06 (95% CI, 0.79–1.45), p = 0.665
Adjusted for age, Charlson index,
impaired renal function, tumour size,
tumour stage, and histologic subtype
(benign vs RCC)
Unadjusted HR 0.95 (95% CI, 0.71–1.28),
p = 0.8
Weight 2010 [40] Overall survival 524 480 – – – HR: 0.903 (95% CI, 0.56–1.5), p = 0.68;
PN vs RN
Multivariate models stratified according
to the propensity to undergo PN and
also including multiple predicting
variables, namely pathologic stage and
postoperative eGFR
HR from univariate analysis stratified
according to the propensity to undergo
PN = 0.62 (95% CI, 0.40–0.94), p = 0.030
Crepel 2010 [41] Cancer-specific survival 163 636 – – – HR: 0.8; log-rank p = 0.4
Matched for age, tumour size, year of
surgery, and Fuhrman grade
EU
RO
PE
AN
UR
OL
OG
Y6
1(
20
12
)9
72
–9
93
98
4

Table 2 (Continued )
Patard 2008 [36] Cancer-specific survival 289 257 – – – ‘‘Survival curves perfectly overlapped’’;
log-rank test p = 0.9
Thompson 2009 [38] Cancer-specific deaths 239 704 – – – HR 0.51 (95% CI, 0.24–1.09), p = 0.079
Adjusting for age, impaired renal
function, tumour stage, and tumour size
Unadjusted HR 0.46 (95% CI, 0.22–0.96),
p = 0.039
Weight 2010 [40] Cancer-specific survival
(pathologically malignant
tumours only)
438 429 – – – HR: 0.77 (95% CI, 0.41–1.42), p = 0.4
Multivariate regression analysis
including pathologic size, nuclear grade,
pathologic T stage, and final eGFR
HR from univariate analysis: 1.39 (95%
CI, 1.07–1.83), p = 0.01
Dash 2006 [39] Disease-free survival 45 151 – – – HR: 0.36 (95% CI, 0.05–2.82), p = 0.3
Adjusted for disease severity
(confounder score approach)
HR from the propensity score model:
1.75 (95% CI, 0.5–6.14), p = 0.4
Unadjusted HR: 0.22 (95% CI, 0.03–
1.66), p = 0.14
Weight 2010 [40] Overall survival at 5 yr 524 480 85% (95% CI,
81.4–88.6)
78% (95% CI,
73.7–82.3)
NR Published KM estimate
Crepel 2010 [41] Cancer-specific survival at 5 yr 163 636 90.1% 93.8% NR Published KM estimate
Patard 2004 [37] Cancer-specific survival at 5 yr
(T1b only)
65 576 96% 91% KM estimate from graph; chi-square
test, p = 0.6; log-rank test, p = 0.8
Weight 2010 [40] Cancer-specific survival at 5 yr 438 429 87.6% (95% CI,
84–91.2)
94% (95% CI,
91.3–96.7)
NR KM estimates
Dash 2006 [39]*
(open/lap vs open)
Disease-free survival at 5 yr 45 151 83% 71% NR Published KM estimate
Laparoscopic radical
nephrectomy
Open radical
nephrectomy
Hemal 2007 [19] Overall survival at 5 yr 41 71 87.8% 88.7% 0.87 –
Hemal 2007 [19] Cancer-specific survival at 5 yr 41 71 95.12% 94.36% 0.79 –
Hemal 2007 [19] Recurrence-free survival at 5 yr 41 71 92.6% 90.1% 0.91 –
Laparoscopic partial
nephrectomy
Open partial
nephrectomy
Lane 2010 [43] Overall survival (RCC with
minimum follow-up of 1 yr)
499 762 – – – HR: 0.69 (95% CI, 0.45–1.02), p = 0.07
Adjusted for age, gender, race, Charlson-
Romano Index, tumour size,
hypertension, preoperative GFR, and
oncological potential (calculated as
predicted risk of recurrence estimated
based on pathology, tumour size,
histologic subtype, pathologic stage,
and symptoms at presentation)
Marszalek 2009 [45] Overall survival at 5 yr (pT1 only) 81 66 96% (95% CI,
92–99)
85% (95% CI,
79–92)
0.1 Published KM estimate
Lane 2010 [43] Survival at 7 yr (subset: RCC with
minimum follow-up of 7 yr)
77 310 83.1% 83.5% NR Actual rate
Gill 2007 [42] Cancer-specific survival at 3 yr
(pathologic RCC only)
514 676 99.3% (95% CI,
98.0–100.0)
99.2% (95% CI,
98.4–100.0)
NR Published KM estimate
Lane 2010 [43] Cancer-specific survival at 7 yr
(RCC with minimum follow-up of 1 yr)
499 762 96.9% (95% CI,
94.3–99.5)
97.7% (95% CI,
96.3–99.1)
0.79 KM estimated
Lane 2010 [43] Cancer-specific survival at 7 yr
(subset: RCC with minimum
follow-up of 7 yr)
55 249 92.7% (51/55) 95.6% (238/249) – Actual rate
Marszalek 2009 [45] Recurrence-free survival at 5 yr
(local recurrence in pT1 only)
81 66 97% (95% CI,
94–99)
98v (95% CI, 95–100) – KM estimates; log-rank test p = 0.8
Marszalek 2009 [45] Recurrence-free survival at 5 yr
(distant recurrence in pT1 only)
81 66 99% (95% CI,
94–100)
96% (95% CI, 92–99) – KM estimates; log-rank test p = 0.2
EU
RO
PE
AN
UR
OL
OG
Y6
1(
20
12
)9
72
–9
93
98
5

Ta
ble
2(C
on
tin
ued
)
Ex
pe
rim
en
tal
(Ex
p)
Co
ntr
ol
(Ctr
)A
uth
or
Ou
tco
me
Na
tb
ase
lin
eV
alu
eR
ep
ort
ed
Pv
alu
es
No
te
Ex
pC
trE
xp
Ctr
Lan
e2
01
0[4
3]
Me
tast
ase
s-fr
ee
surv
iva
la
t7
yr
(RC
Cw
ith
min
imu
mfo
llo
w-u
po
f1
yr)
49
97
62
97
.5%
(95
%C
I,
95
.9–
99
.0)
97
.3%
(95
%C
I,
95
.9–
98
.7)
0.4
7K
Me
stim
ate
d
Lan
e2
01
0[4
3]
Me
tast
ase
s-fr
ee
surv
iva
la
t7
yr
(RC
Cw
ith
min
imu
mfo
llo
w-u
p
of
7y
ro
nly
)
55
24
99
0.9
%(5
0/5
5)
94
.8%
(23
4/2
49
)–
Act
ua
lra
te
Gil
l2
00
7[4
2]
Loca
lre
curr
en
cera
tea
t3
yr
(pa
tho
log
icR
CC
on
ly)
51
46
76
1.4
%(9
5%
CI,
0–
2.8
)1
.5%
(95
%C
I,
0.4
–2
.6)
–K
Me
stim
ate
s
Gil
l2
00
7[4
2]
Dis
tan
tre
curr
en
cera
tea
t3
yr
(pa
tho
log
icR
CC
on
ly)
51
46
76
0.9
%(9
5%
CI
0,
2.2
)2
.1%
(95
%C
I,
0.7
–3
.4)
–K
Me
stim
ate
s
NR
=n
ot
rep
ort
ed
;H
R=
ha
zard
rati
o;
KM
=K
ap
lan
-Me
ier;
RR
=ri
skra
tio
;C
I=
con
fid
en
cein
terv
al;
SD
=st
an
da
rdd
ev
iati
on
;e
GFR
=e
stim
ate
dg
lom
eru
lar
filt
rati
on
rate
.
E U R O P E A N U R O L O G Y 6 1 ( 2 0 1 2 ) 9 7 2 – 9 9 3986
staging purposes). Using the life table analysis method, the
authors reported an overall survival benefit at 10 yr (80.2% vs
54%; p = <0.01) with extended lymphadenectomy (n = 109)
compared with a facultative lymphadenectomy (n = 82).
However, the study did not report important baseline
information about Fuhrman grade and cell type (Table 1),
and these results should therefore be treated with caution
[25].
3.2.3.2. Radical or partial nephrectomy with ipsilateral adrenalectomy
versus radical or partial nephrectomy alone. One prospective NRS
met inclusion criteria [28] comparing partial nephrectomy
with ipsilateral adrenalectomy versus without adrenalec-
tomy. Using strict criteria based on radiographic (suspicious
nodule) and intraoperative assessment (adrenal involve-
ment) to justify adrenalectomy, of 2065 patients who
underwent partial nephrectomy, only 48 patients (2.3%)
underwent concurrent ipsilateral adrenalectomy of which
42 (87%) were histologically benign lesions. On multivariate
analysis, upper pole location was not predictive of adrenal
involvement (HR: 0.482 [0.050–1.043]; p = 0.08), but
tumour size was statistically significantly predictive of
adrenal involvement (HR: 0.262 [0.074–0.416]; p = 0.01).
After a follow-up of 5.5 yr, only 15 patients of 2017 (0.74%)
subsequently underwent ipsilateral adrenalectomy. There
was no evidence of a difference in overall survival at 5 yr
(82% with adrenalectomy vs 85% without adrenalectomy;
p = 0.56) or 10 yr (72.4% with adrenalectomy vs 68% without
adrenalectomy; p value not reported). However, this
observation should be interpreted with caution because it
remains unknown how adrenalectomy had an impact on
the survival of this patient population.
3.2.4. Nephron-sparing interventions
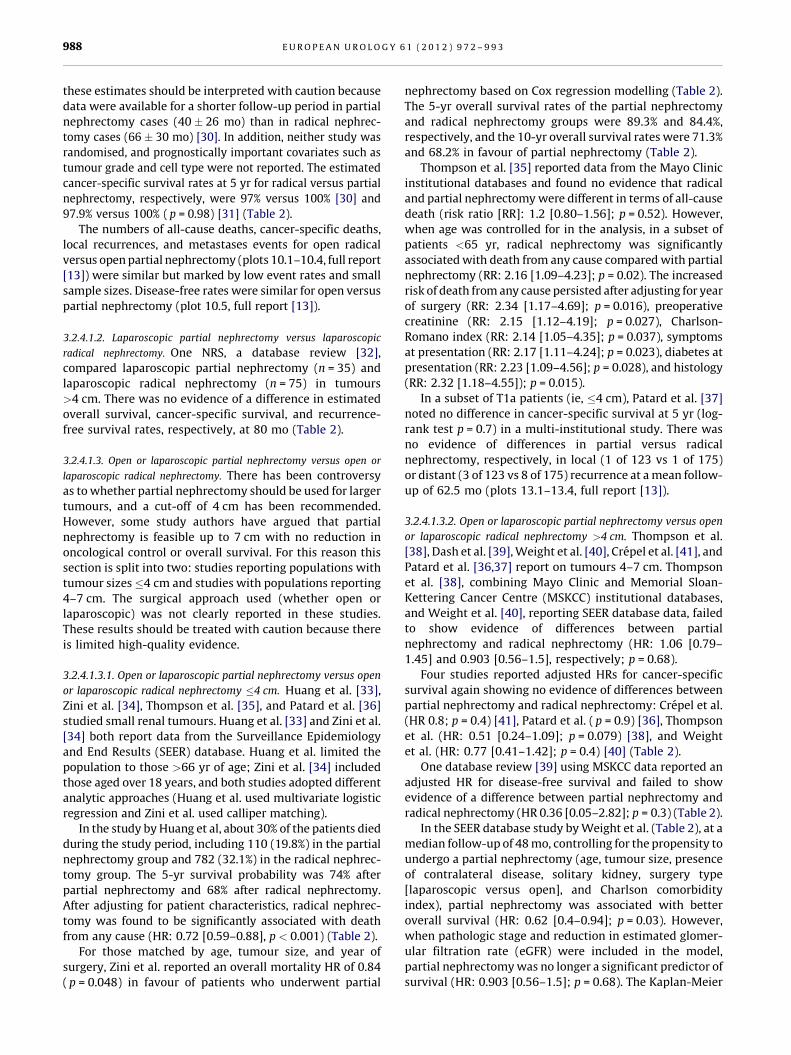
3.2.4.1. Partial nephrectomy versus radical nephrectomy
3.2.4.1.1. Open partial nephrectomy versus open radical nephrecto-
my. One RCT [29], a prospective cohort study [20], a
database review [30], and one retrospective matched-pair
study [31] were identified that compared various aspects of
the oncological effectiveness of open radical nephrectomy
with open partial nephrectomy. The study populations of
D’Armiento et al. [29], Butler et al. [30], and Lee et al. [31]
included only patients with tumour sizes<4 cm. The study by
Gratzke and colleagues does not give any information on
tumour size, but T1–T2 patients were included. However,
there were prognostically relevant baseline imbalances in
the radical versus partial nephrectomy tumour stages (see
Table 1). It is important to describe the tumour sizes in terms
of whether they are >4 cm or <4 cm because historically
there has been clinical uncertainty over whether partial
resection is appropriate for tumours >4 cm.
The RCT by D’Armiento et al. [29] reported an equal
median survival time of 96 mo, although HRs for survival or
survival rates were not available. Two NRSs reported the
estimated overall survival rates at 5 yr. There was an
inconsistency in the direction of effect: Butler et al. [30]
reported 75% versus 80%, whereas Lee et al. [31] reported
98.2% versus 88.8% ( p = 0.63; Table 2) for open partial
versus open radical nephrectomy, respectively. However,

[(Fig._3)TD$FIG]
Fig. 3 – Cancer-specific deaths during study period. CI = confidence interval; ctr = control; exp = experimental; M-H = Mantel-Haenszel; Q-RCT = quasi-randomised controlled trial; RCT = randomised controlled trial.
[(Fig._2)TD$FIG]
Fig. 2 – All-cause deaths during study period. CI = confidence interval; ctr = control; exp = experimental; M-H = Mantel-Haenszel.
E U R O P E A N U R O L O G Y 6 1 ( 2 0 1 2 ) 9 7 2 – 9 9 3 987
E U R O P E A N U R O L O G Y 6 1 ( 2 0 1 2 ) 9 7 2 – 9 9 3988
these estimates should be interpreted with caution because
data were available for a shorter follow-up period in partial
nephrectomy cases (40 � 26 mo) than in radical nephrec-
tomy cases (66 � 30 mo) [30]. In addition, neither study was
randomised, and prognostically important covariates such as
tumour grade and cell type were not reported. The estimated
cancer-specific survival rates at 5 yr for radical versus partial
nephrectomy, respectively, were 97% versus 100% [30] and
97.9% versus 100% ( p = 0.98) [31] (Table 2).
The numbers of all-cause deaths, cancer-specific deaths,
local recurrences, and metastases events for open radical
versus open partial nephrectomy (plots 10.1–10.4, full report
[13]) were similar but marked by low event rates and small
sample sizes. Disease-free rates were similar for open versus
partial nephrectomy (plot 10.5, full report [13]).
3.2.4.1.2. Laparoscopic partial nephrectomy versus laparoscopic
radical nephrectomy. One NRS, a database review [32],
compared laparoscopic partial nephrectomy (n = 35) and
laparoscopic radical nephrectomy (n = 75) in tumours
>4 cm. There was no evidence of a difference in estimated
overall survival, cancer-specific survival, and recurrence-
free survival rates, respectively, at 80 mo (Table 2).
3.2.4.1.3. Open or laparoscopic partial nephrectomy versus open or
laparoscopic radical nephrectomy. There has been controversy
as to whether partial nephrectomy should be used for larger
tumours, and a cut-off of 4 cm has been recommended.
However, some study authors have argued that partial
nephrectomy is feasible up to 7 cm with no reduction in
oncological control or overall survival. For this reason this
section is split into two: studies reporting populations with
tumour sizes�4 cm and studies with populations reporting
4–7 cm. The surgical approach used (whether open or
laparoscopic) was not clearly reported in these studies.
These results should be treated with caution because there
is limited high-quality evidence.
3.2.4.1.3.1. Open or laparoscopic partial nephrectomy versus open
or laparoscopic radical nephrectomy �4 cm. Huang et al. [33],
Zini et al. [34], Thompson et al. [35], and Patard et al. [36]
studied small renal tumours. Huang et al. [33] and Zini et al.
[34] both report data from the Surveillance Epidemiology
and End Results (SEER) database. Huang et al. limited the
population to those >66 yr of age; Zini et al. [34] included
those aged over 18 years, and both studies adopted different
analytic approaches (Huang et al. used multivariate logistic
regression and Zini et al. used calliper matching).
In the study by Huang et al, about 30% of the patients died
during the study period, including 110 (19.8%) in the partial
nephrectomy group and 782 (32.1%) in the radical nephrec-
tomy group. The 5-yr survival probability was 74% after
partial nephrectomy and 68% after radical nephrectomy.
After adjusting for patient characteristics, radical nephrec-
tomy was found to be significantly associated with death
from any cause (HR: 0.72 [0.59–0.88], p < 0.001) (Table 2).
For those matched by age, tumour size, and year of
surgery, Zini et al. reported an overall mortality HR of 0.84
( p = 0.048) in favour of patients who underwent partial
nephrectomy based on Cox regression modelling (Table 2).
The 5-yr overall survival rates of the partial nephrectomy
and radical nephrectomy groups were 89.3% and 84.4%,
respectively, and the 10-yr overall survival rates were 71.3%
and 68.2% in favour of partial nephrectomy (Table 2).
Thompson et al. [35] reported data from the Mayo Clinic
institutional databases and found no evidence that radical
and partial nephrectomy were different in terms of all-cause
death (risk ratio [RR]: 1.2 [0.80–1.56]; p = 0.52). However,
when age was controlled for in the analysis, in a subset of
patients <65 yr, radical nephrectomy was significantly
associated with death from any cause compared with partial
nephrectomy (RR: 2.16 [1.09–4.23]; p = 0.02). The increased
risk of death from any cause persisted after adjusting for year
of surgery (RR: 2.34 [1.17–4.69]; p = 0.016), preoperative
creatinine (RR: 2.15 [1.12–4.19]; p = 0.027), Charlson-
Romano index (RR: 2.14 [1.05–4.35]; p = 0.037), symptoms
at presentation (RR: 2.17 [1.11–4.24]; p = 0.023), diabetes at
presentation (RR: 2.23 [1.09–4.56]; p = 0.028), and histology
(RR: 2.32 [1.18–4.55]); p = 0.015).
In a subset of T1a patients (ie, �4 cm), Patard et al. [37]
noted no difference in cancer-specific survival at 5 yr (log-
rank test p = 0.7) in a multi-institutional study. There was
no evidence of differences in partial versus radical
nephrectomy, respectively, in local (1 of 123 vs 1 of 175)
or distant (3 of 123 vs 8 of 175) recurrence at a mean follow-
up of 62.5 mo (plots 13.1–13.4, full report [13]).
3.2.4.1.3.2. Open or laparoscopic partial nephrectomy versus open
or laparoscopic radical nephrectomy >4 cm. Thompson et al.
[38], Dash et al. [39], Weight et al. [40], Crepel et al. [41], and
Patard et al. [36,37] report on tumours 4–7 cm. Thompson
et al. [38], combining Mayo Clinic and Memorial Sloan-
Kettering Cancer Centre (MSKCC) institutional databases,
and Weight et al. [40], reporting SEER database data, failed
to show evidence of differences between partial
nephrectomy and radical nephrectomy (HR: 1.06 [0.79–
1.45] and 0.903 [0.56–1.5], respectively; p = 0.68).
Four studies reported adjusted HRs for cancer-specific
survival again showing no evidence of differences between
partial nephrectomy and radical nephrectomy: Crepel et al.
(HR 0.8; p = 0.4) [41], Patard et al. ( p = 0.9) [36], Thompson
et al. (HR: 0.51 [0.24–1.09]; p = 0.079) [38], and Weight
et al. (HR: 0.77 [0.41–1.42]; p = 0.4) [40] (Table 2).
One database review [39] using MSKCC data reported an
adjusted HR for disease-free survival and failed to show
evidence of a difference between partial nephrectomy and
radical nephrectomy (HR 0.36 [0.05–2.82]; p = 0.3) (Table 2).
In the SEER database study by Weight et al. (Table 2), at a
median follow-up of 48 mo, controlling for the propensity to
undergo a partial nephrectomy (age, tumour size, presence
of contralateral disease, solitary kidney, surgery type
[laparoscopic versus open], and Charlson comorbidity
index), partial nephrectomy was associated with better
overall survival (HR: 0.62 [0.4–0.94]; p = 0.03). However,
when pathologic stage and reduction in estimated glomer-
ular filtration rate (eGFR) were included in the model,
partial nephrectomy was no longer a significant predictor of
survival (HR: 0.903 [0.56–1.5]; p = 0.68). The Kaplan-Meier

E U R O P E A N U R O L O G Y 6 1 ( 2 0 1 2 ) 9 7 2 – 9 9 3 989
estimates of overall survival at 5 yr were 85% and 78.8% in
the partial and radical nephrectomy groups, respectively.
In a subset of T1b patients (ie, 4–7 cm), Patard et al. [37]
noted no difference in cancer-specific survival at 5 yr (log-
rank test p = 0.8) in a multi-institutional study. There were
no statistically significant differences in partial versus
radical nephrectomy, respectively, in local (1 of 28 vs 5 of
218) or distant (8 of 28 vs 34 of 218) recurrence at a mean
follow-up of 62.5 mo.
3.2.4.1.3.3. Minimally invasive ablative procedure versus
laparoscopic radical nephrectomy. There were no comparative
studies that reported on oncological outcomes.
3.3. Technique of partial nephrectomy
3.3.1. Laparoscopic partial nephrectomy versus open partial
nephrectomy
Two database reviews [42,43] and two matched-pair
analyses [44,45] compared laparoscopic and open techni-
ques of partial nephrectomy.
Lane and Gill [43] noted an overall survival benefit
estimate in laparoscopic versus open partial nephrectomy
patients when adjusting for age, gender, race, Charlson-
Romano index, tumour size, hypertension, preoperative
eGFR, and oncological potential (defined as predicted risk of
recurrence at 5 yr) in those patients with a minimum of 1-yr
follow-up (HR: 0.69 [0.45–1.02]; p = 0.07). At 7-yr follow-
up, there was no evidence of a difference between the two
groups. There were no differences in 3-yr cancer-specific
survival [42] and 5-yr overall survival [45] (Table 2).
Regarding the number of deaths during the study period, a
lower risk of all-cause death was shown in the laparoscopic
group (RR: 0.4 [0.28–0.59]; p = 0.0001) [43] (Fig. 2).
The studies by Gill et al. [42] and Marszalek et al. [45]
reported no statistically significant difference in the
recurrence patterns between laparoscopic and open partial
nephrectomy (Table 2).
It is important to note that the evidence base for this
comparison remains poor, with all studies suffering from
methodological flaws inherent in most NRSs.
3.3.2. Robotic partial nephrectomy versus laparoscopic partial
nephrectomy
There were no comparative studies that reported on
oncological outcomes.
3.3.3. Radiofrequency-assisted robotic clampless partial
nephrectomy versus laparoscopic partial nephrectomy
A database review by Wu et al. [46] compared patients who
underwent standard laparoscopic partial nephrectomy
(n = 36, but only 24 were RCCs) and radiofrequency-assisted
robotic laparoscopic partial nephrectomy (RFRCPN) (n = 42,
but only 32). The groups were comparable for positive
surgical margins (0 of 42 vs 1 of 36) and recurrence rates (1 of
34 vs 0 of 34) (plots 16.1–16.2, full report [13]) for the RFRCPN
and RFA-assisted robotic laparoscopic nephrectomy, but the
study was marked by very low event rates, a high number of
benign tumours, and lacked longer term survival data.
3.3.4. Partial nephrectomy versus minimally invasive ablative
procedures
3.3.4.1. Laparoscopic cryoablation versus laparoscopic partial ne-
phrectomy. Data were obtained from one database review
[47] and one matched-pair study [48]. For the cryoablation
and partial nephrectomy arms, respectively, 3 of 78 and 0
of 153 deaths were reported by Desai et al. [47] at last
follow-up (Fig. 3). Time to detection of local recurrence was
noted at a mean follow-up time of 5.8 mo among those who
underwent partial nephrectomy (1 of 153), and 24.6 mo
after cryoablation (2 of 78) [47] (plot 17.1, full report [13]).
No recurrences were reported in either treatment group
after a mean follow-up of 9.8 and 11.9 mo in the report by
O’Malley et al. [48] (plot 17.2, full report [13]). oncological
outcomes in terms of development of recurrence therefore
differed between the two studies. This may be a reflection of
different definitions and ways of establishing disease
recurrence following cryoablation. The study also includes
data on benign tumours and therefore should be treated
with caution. Determining local recurrence on imaging
alone is known to be subjective.
3.3.4.2. Laparoscopic cryoablation versus open partial nephrectomy.
Data were obtained from one matched comparison [49].
There were no local recurrences or metastases in either
group (plots 18.1–18.2, full report [13]). However, there
were only 20 patients in each arm, and follow-up was short
at 27–28 mo.
3.4. Discussion
3.4.1. Principal findings
Open radical nephrectomy and open partial nephrectomy
show no difference in either overall or cancer-specific
survival. However, if data from studies comparing open or
laparoscopic radical nephrectomy versus open or laparo-
scopic partial nephrectomy are considered, the evidence
base indicates improved survival for partial nephrectomy in
tumours �4 cm. However, there is no evidence of a
difference in tumours >4 cm. Recurrence rates and metas-
tases appear similar for all approaches. Although the
included studies differed in quality and outcomes reported,
overall the evidence suggests either equivalent or better
survival with partial nephrectomy, suggesting that NSS
should be applied when possible.
Laparoscopic radical nephrectomy appears to offer
equivalent survival to open radical nephrectomy, and all
laparoscopic approaches achieve equivalent survival. Open
and laparoscopic partial nephrectomy achieve equivalent
survival. Different laparoscopic and ablative techniques also
achieve similar survival, but studies are of low methodo-
logical quality.
There is no evidence to support removal of the ipsilateral
adrenal gland with radical nephrectomy. The performance of
complete lymph node dissection with radical nephrectomy
for localised RCC remains unanswered due to large incon-
sistencies in the data.
Although this systematic review compared surgical
management with nonsurgical management for renal
E U R O P E A N U R O L O G Y 6 1 ( 2 0 1 2 ) 9 7 2 – 9 9 3990
tumours, the evidence available falls short of proving that
surgery improves survival, due to the absence of high-
quality studies. However, from a practical point of view, this
is a question that could be answered for surveillance of
small renal masses but it is unlikely to be answered for
larger or more advanced tumours due to the ethical
implications of withholding treatment.
Since the last search update for this review (October
2010), several potentially relevant studies have been
published. An updated scoping exercise performed in
January 2012 returned 240 abstracts, from which 4 relevant
studies were identified, of which 2 are RCTs [50,51] and 2
are nonrandomised retrospective matched-pair analyses
[52,53]. The study by van Poppel et al. [50] was a
multicentre RCT of NSS versus radical nephrectomy for
T1–T2 renal cancers. Despite being an RCT, the study had
significant limitations (including premature closing of the
study due to poor accrual, a change in protocol, and being
significantly underpowered), a fact the authors acknowl-
edged. The results from the intention-to-treat analysis
showed a lower overall survival for NSS compared with
radical nephrectomy, although this difference becomes
insignificant if the analysis is restricted to the targeted
population of RCC patients and those who are clinically and
pathologically eligible. Given such methodological flaws
and uncertainty, the results from this study should be
interpreted cautiously. Yu et al. [51] conducted a RCT
comparing open partial nephrectomy versus open radical
nephrectomy, and similar oncological outcomes were
reported at a minimum of 5 yr. Klatte et al. [52] performed
a retrospective matched-pair study comparing laparoscopic
cryoablation with open partial nephrectomy for T1a renal
tumours only. The results showed substantially higher local
recurrence rate at 3 yr for laparoscopic cryoablation.
Antonelli et al. [53] conducted a retrospective analysis
comparing elective open partial nephrectomy with open
radical nephrectomy for clinical T1 tumours only. However,
patients with pathologic T2 and T3 tumours in the open
radical nephrectomy group were excluded from the
analysis. The results showed similar recurrence rate and
cancer-specific mortality for both procedures.
3.4.2. Strengths and limitations
The strength of this review is the systematic approach taken
to examine the evidence base using a methodologically
rigorous review process including Cochrane methodology
throughout, reporting standards such as PRISMA, using novel
tools to assess risks of bias in NRSs, and requesting peer
review throughout from a reference group of international
experts. A clinical care pathway identifying the major
comparisons of interest was formulated in consultation
with international experts. An in-depth description of
this consensus-building process was previously reported
[54].
The major limitation of this systematic review results
from the methodological concessions that needed to be
made to ensure the review reflects the current state of the
available evidence base. In particular, the inclusion criteria
had to be more inclusive of study designs from further down
the hierarchy of evidence than is desirable (full report [13]).
Another limitation is that NRSs have inherent biases,
meaning they should always be treated with caution. The
review has addressed this by using a methodologically
rigorous system of assessing risks of bias in NRS (see full
report [13]). In addition, it was not possible to perform
meta-analyses for all outcomes of interest, due to statistical
and trial design limitations. However, to derive the highest
possible level of evidence for the review, uncontrolled case
series (ie, nonrandomised studies without a control arm)
were excluded because such studies can provide level 4
evidence only at best [55] for comparative assessments of
interventions.
3.4.3. How this systematic review compares with other recent
systematic reviews and technology assessments by guideline panels
The current EAU and American Urological Association (AUA)
Renal Cancer Guidelines provide primary reference points
for the management of localised RCC. The review method-
ology underpinning both guidelines differ from that offered
in this systematic review mainly on the point of strict
inclusion criteria for primary reports and the assessment of
the methodological quality of those included reports (full
report [13]).
There are specific methodological limitations of the
research underpinning the AUA Renal Cancer Guidelines,
such as conduct of meta-analyses of observational studies.
The guideline itself acknowledged that it may not be
methodologically appropriate to do so [56,57]. The current
internationally recognised EAU Renal Cancer Guidelines
include many case series (ie, no comparator groups) that are
susceptible to selection biases. In coauthoring this system-
atic review, EAU Renal Cancer Guideline Panel members
and the UCAN Systematic Review Team used the most
rigorous research methods to assess the best evidence
available for the management of localised RCC. A compari-
son between this systematic review with two other reviews
[58,59] can be accessed in the full report [13]. Other reviews
were either not systematically performed [60] or were
based on noncomparative case series [61,62]; these are not
considered any further.
4. Conclusions
Patient and tumour characteristics permitting, the current
oncological outcomes evidence base suggests that localised
RCCs are best managed by NSS rather than by radical
nephrectomy irrespective of surgical approach. Where open
surgery is deemed necessary, open NSS oncological outcomes
are at least as good as open radical nephrectomy and should
be the preferred option when technically feasible. The
evidence around minimally invasive ablative technologies
is weak due to low methodological quality studies and mixed
patient populations that include benign renal lesions, making
judgements about effectiveness unsafe. In the absence of
obvious tumour involvement of the ipsilateral adrenal gland,
the evidence available does not support routine removal of
the adrenal gland. It remains unclear whether complete
lymph node dissection has any role in the management of

E U R O P E A N U R O L O G Y 6 1 ( 2 0 1 2 ) 9 7 2 – 9 9 3 991
localised RCC due to large inconsistencies in limited data, and
therefore on currently available evidence it is best not to offer
it to patients. Future research efforts must aim to rectify this
paucity of evidence with well-designed and well-reported
prospective studies, especially for newer interventions.
Studies should use predefined, ideally standardised, mea-
sures of outcome and be multicentre to ensure that the
studies give sufficiently precise estimates of the various
outcomes. Ideally, allocation should be randomised. There is
an urgent need for standardisation of outcome reporting in
RCC trials, observational studies, and registry databases. Such
standardisation will make it easier to compare, contrast, and
synthesise the results of such studies, reduce the risk of
inappropriate outcomes being measured, and reduce out-
come reporting bias.
Author contributions: James N’Dow had full access to all the data in the
study and takes responsibility for the integrity of the data and the
accuracy of the data analysis.
Study concept and design: N’Dow.
Acquisition of data: S. MacLennan, Imamura, Omar, Lapitan, Hilvano-
Cabungcal, Royle, Stewart.
Analysis and interpretation of data: Lapitan, Lam, Griffiths, S. MacLennan,
Imamura, McClinton.
Drafting of the manuscript: S. MacLennan, Imamura, Lam, Omar.
Critical revision of the manuscript for important intellectual content:
Canfield, McClinton, Griffiths, Ljungberg, EAU Renal Cell Carcinoma
Guideline Panel, N’Dow.
Statistical analysis: Canfield, G. MacLennan.
Obtaining funding: N’Dow.
Appendix 1. Assessment of risk of bias*
Study Randomised? Adequatesequence
generation?
Allocationconcealment
Blom 2009 [8] Yes Yes Yes
Butler 1995 [30] No No No
Crepel 2010 [41] No No No
D’Armiento 1997 [29] Yes Yes Unclear
Dash 2006 [39] No No No
Desai 2005 [21] Yes Yes Yes
Desai 2005 [47] No No No
Gabr 2009 [24] No No No
Gill 2007 [42] No No No
Gong 2008 [44] No No No
Gratzke 2009 [20] No No No
Hemal 2007 [19] No No No
Hemal 2009 [25] No No No
Herrlinger 1991 [27] No No No
Huang 2009 [33] No No No
Ko 2008 [49] No No No
Lane 2009 [28] No No No
Lane 2010 [43] No No No
Lee 2007 [31] No No No
Marszalek 2009 [45] No No No
Nadler (3 arm) 2006 [23] Yes No (quasi-RCT) No
Nambirajan 2004 [22] Yes Unclear Unclear
O’Malley 2007 [48] No No No
Patard 2004 [37] No No No
Patard 2008 [36] No No No
Simmons 2009 [32] No No No
Administrative, technical, or material support: Canfield (GRADE),
S.J. MacLennan.
Supervision: S.J. MacLennan.
Other (specify): UCAN Systematic Review Reference Group (Michael
Aitchison, Philipp Dahm).
Financial disclosures: I certify that all conflicts of interest, including
specific financial interests and relationships and affiliations relevant to the
subject matter or materials discussed in the manuscript (eg, employment/
affiliation, grants or funding, consultancies, honoraria, stock ownership or
options, expert testimony, royalties, or patents filed, received, or pending),
are the following: None.
Funding/Support and role of the sponsor: UCAN Cancer Charity
(www.ucanhelp.org.uk) and MacMillan Cancer Charity (www.ucanhelp
org.uk) helped design and conduct the study.
Acknowledgement statement: The UCAN systematic review team would
like to thank the EAU Guidelines on Renal Cell Carcinoma panel and Karin
Plass from the EAU for meeting with us to discuss the results from this
systematic review (in Amsterdam, February 2011) and for their invaluable
insights on how to strengthen the interpretation of the findings. We would
also like to thank Barney Reeves from the Cochrane nonrandomised
studies group for sharing with us a draft version of a Cochrane tool for
assessing risk of bias in nonrandomised studies, on which we based our
assessment. Philipp Dahm and Molly Neuberger also deserve thanks for
their methodological advice, particularly in using the GRADE tool.
Members of the EAU Renal Cancer Guideline Panel: B. Ljungberg,
A.S. Merseburger, J.J. Patard, M. Hora, M.A. Kuczyk, D.C. Hanbury,
P.F.A. Mulders, I.C. Sinescu.
Members of the UCAN Reference Group for Renal Cancer: Michael
Aitchison, Philipp Dahm.
?Blinding for
survivaloutcomes?
Incompleteoutcome data
addressed?
Free ofselective outcome
reporting?
Free ofother bias?
Unclear Yes Yes No
Unclear Yes Unclear Unclear
Unclear Unclear Unclear Unclear
Unclear No Yes Unclear
No Yes Unclear Unclear
No Yes Yes Unclear
No Unclear Unclear No
Unclear Yes Unclear Unclear
No No Unclear Unclear
No No Unclear Unclear
NA NA Yes Unclear
Unclear Unclear Unclear Unclear
NA NA Yes Unclear
No Yes Yes Unclear
No Unclear Unclear Unclear
No Yes Unclear Unclear
No Yes Yes Unclear
No Yes No Unclear
No Yes Unclear Unclear
No Yes Yes Yes
No Yes Yes Unclear
Unclear Yes Unclear Unclear
NA NA Yes Unclear
No Yes Yes Unclear
Unclear Unclear Unclear Unclear
Unclear Unclear Unclear Unclear
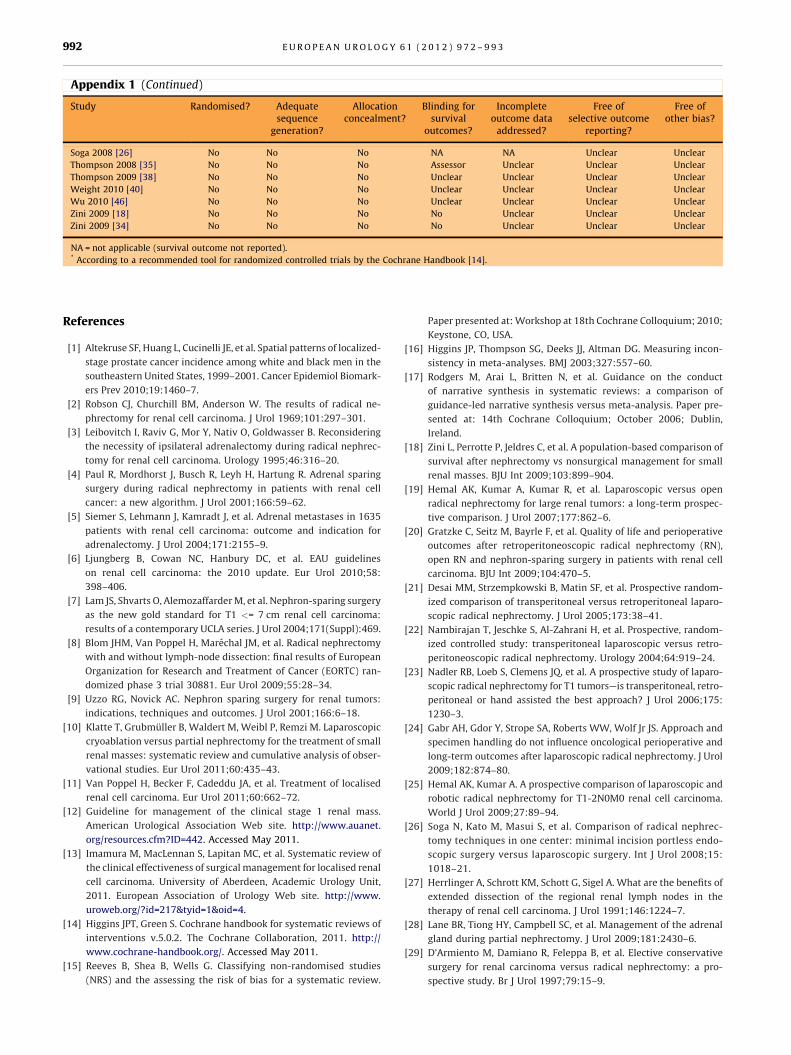
Appendix 1 (Continued)
Study Randomised? Adequatesequence
generation?
Allocationconcealment?
Blinding forsurvival
outcomes?
Incompleteoutcome data
addressed?
Free ofselective outcome
reporting?
Free ofother bias?
Soga 2008 [26] No No No NA NA Unclear Unclear
Thompson 2008 [35] No No No Assessor Unclear Unclear Unclear
Thompson 2009 [38] No No No Unclear Unclear Unclear Unclear
Weight 2010 [40] No No No Unclear Unclear Unclear Unclear
Wu 2010 [46] No No No Unclear Unclear Unclear Unclear
Zini 2009 [18] No No No No Unclear Unclear Unclear
Zini 2009 [34] No No No No Unclear Unclear Unclear
NA = not applicable (survival outcome not reported).* According to a recommended tool for randomized controlled trials by the Cochrane Handbook [14].
E U R O P E A N U R O L O G Y 6 1 ( 2 0 1 2 ) 9 7 2 – 9 9 3992
References
[1] Altekruse SF, Huang L, Cucinelli JE, et al. Spatial patterns of localized-
stage prostate cancer incidence among white and black men in the
southeastern United States, 1999–2001. Cancer Epidemiol Biomark-
ers Prev 2010;19:1460–7.
[2] Robson CJ, Churchill BM, Anderson W. The results of radical ne-
phrectomy for renal cell carcinoma. J Urol 1969;101:297–301.
[3] Leibovitch I, Raviv G, Mor Y, Nativ O, Goldwasser B. Reconsidering
the necessity of ipsilateral adrenalectomy during radical nephrec-
tomy for renal cell carcinoma. Urology 1995;46:316–20.
[4] Paul R, Mordhorst J, Busch R, Leyh H, Hartung R. Adrenal sparing
surgery during radical nephrectomy in patients with renal cell
cancer: a new algorithm. J Urol 2001;166:59–62.
[5] Siemer S, Lehmann J, Kamradt J, et al. Adrenal metastases in 1635
patients with renal cell carcinoma: outcome and indication for
adrenalectomy. J Urol 2004;171:2155–9.
[6] Ljungberg B, Cowan NC, Hanbury DC, et al. EAU guidelines
on renal cell carcinoma: the 2010 update. Eur Urol 2010;58:
398–406.
[7] Lam JS, Shvarts O, Alemozaffarder M, et al. Nephron-sparing surgery
as the new gold standard for T1 <= 7 cm renal cell carcinoma:
results of a contemporary UCLA series. J Urol 2004;171(Suppl):469.
[8] Blom JHM, Van Poppel H, Marechal JM, et al. Radical nephrectomy
with and without lymph-node dissection: final results of European
Organization for Research and Treatment of Cancer (EORTC) ran-
domized phase 3 trial 30881. Eur Urol 2009;55:28–34.
[9] Uzzo RG, Novick AC. Nephron sparing surgery for renal tumors:
indications, techniques and outcomes. J Urol 2001;166:6–18.
[10] Klatte T, Grubmuller B, Waldert M, Weibl P, Remzi M. Laparoscopic
cryoablation versus partial nephrectomy for the treatment of small
renal masses: systematic review and cumulative analysis of obser-
vational studies. Eur Urol 2011;60:435–43.
[11] Van Poppel H, Becker F, Cadeddu JA, et al. Treatment of localised
renal cell carcinoma. Eur Urol 2011;60:662–72.
[12] Guideline for management of the clinical stage 1 renal mass.
American Urological Association Web site. http://www.auanet.
org/resources.cfm?ID=442. Accessed May 2011.
[13] Imamura M, MacLennan S, Lapitan MC, et al. Systematic review of
the clinical effectiveness of surgical management for localised renal
cell carcinoma. University of Aberdeen, Academic Urology Unit,
2011. European Association of Urology Web site. http://www.
uroweb.org/?id=217&tyid=1&oid=4.
[14] Higgins JPT, Green S. Cochrane handbook for systematic reviews of
interventions v.5.0.2. The Cochrane Collaboration, 2011. http://
www.cochrane-handbook.org/. Accessed May 2011.
[15] Reeves B, Shea B, Wells G. Classifying non-randomised studies
(NRS) and the assessing the risk of bias for a systematic review.
Paper presented at: Workshop at 18th Cochrane Colloquium; 2010;
Keystone, CO, USA.
[16] Higgins JP, Thompson SG, Deeks JJ, Altman DG. Measuring incon-
sistency in meta-analyses. BMJ 2003;327:557–60.
[17] Rodgers M, Arai L, Britten N, et al. Guidance on the conduct
of narrative synthesis in systematic reviews: a comparison of
guidance-led narrative synthesis versus meta-analysis. Paper pre-
sented at: 14th Cochrane Colloquium; October 2006; Dublin,
Ireland.
[18] Zini L, Perrotte P, Jeldres C, et al. A population-based comparison of
survival after nephrectomy vs nonsurgical management for small
renal masses. BJU Int 2009;103:899–904.
[19] Hemal AK, Kumar A, Kumar R, et al. Laparoscopic versus open
radical nephrectomy for large renal tumors: a long-term prospec-
tive comparison. J Urol 2007;177:862–6.
[20] Gratzke C, Seitz M, Bayrle F, et al. Quality of life and perioperative
outcomes after retroperitoneoscopic radical nephrectomy (RN),
open RN and nephron-sparing surgery in patients with renal cell
carcinoma. BJU Int 2009;104:470–5.
[21] Desai MM, Strzempkowski B, Matin SF, et al. Prospective random-
ized comparison of transperitoneal versus retroperitoneal laparo-
scopic radical nephrectomy. J Urol 2005;173:38–41.
[22] Nambirajan T, Jeschke S, Al-Zahrani H, et al. Prospective, random-
ized controlled study: transperitoneal laparoscopic versus retro-
peritoneoscopic radical nephrectomy. Urology 2004;64:919–24.
[23] Nadler RB, Loeb S, Clemens JQ, et al. A prospective study of laparo-
scopic radical nephrectomy for T1 tumors—is transperitoneal, retro-
peritoneal or hand assisted the best approach? J Urol 2006;175:
1230–3.
[24] Gabr AH, Gdor Y, Strope SA, Roberts WW, Wolf Jr JS. Approach and
specimen handling do not influence oncological perioperative and
long-term outcomes after laparoscopic radical nephrectomy. J Urol
2009;182:874–80.
[25] Hemal AK, Kumar A. A prospective comparison of laparoscopic and
robotic radical nephrectomy for T1-2N0M0 renal cell carcinoma.
World J Urol 2009;27:89–94.
[26] Soga N, Kato M, Masui S, et al. Comparison of radical nephrec-
tomy techniques in one center: minimal incision portless endo-
scopic surgery versus laparoscopic surgery. Int J Urol 2008;15:
1018–21.
[27] Herrlinger A, Schrott KM, Schott G, Sigel A. What are the benefits of
extended dissection of the regional renal lymph nodes in the
therapy of renal cell carcinoma. J Urol 1991;146:1224–7.
[28] Lane BR, Tiong HY, Campbell SC, et al. Management of the adrenal
gland during partial nephrectomy. J Urol 2009;181:2430–6.
[29] D’Armiento M, Damiano R, Feleppa B, et al. Elective conservative
surgery for renal carcinoma versus radical nephrectomy: a pro-
spective study. Br J Urol 1997;79:15–9.

E U R O P E A N U R O L O G Y 6 1 ( 2 0 1 2 ) 9 7 2 – 9 9 3 993
[30] Butler BP, Novick AC, Miller DP, Campbell SA, Licht MR. Manage-
ment of small unilateral renal cell carcinomas: radical versus
nephron-sparing surgery. Urology 1995;45:34–40.
[31] Lee JH, You CH, Min GE, et al. Comparison of the surgical outcome
and renal function between radical and nephron-sparing surgery
for renal cell carcinomas. Korean J Urol 2007;48:671–6.
[32] Simmons MN, Chung BI, Gill IS. Perioperative efficacy of laparo-
scopic partial nephrectomy for tumors larger than 4 cm. Eur Urol
2009;55:199–208.
[33] Huang WC, Elkin EB, Levey AS, Jang TL, Russo P. Partial nephrec-
tomy versus radical nephrectomy in patients with small renal
tumors—is there a difference in mortality and cardiovascular out-
comes? J Urol 2009;181:55–61.
[34] Zini L, Perrotte P, Capitanio U, et al. Radical versus partial nephrec-
tomy: effect on overall and noncancer mortality. Cancer 2009;115:
1465–71.
[35] Thompson RH, Boorjian SA, Lohse CM, et al. Radical nephrectomy for
pT1a renal masses may be associated with decreased overall survival
compared with partial nephrectomy. J Urol 2008;179:468–71.
[36] Patard JJ, Bensalah KC, Pantuck AJ, et al. Radical nephrectomy is not
superior to nephron sparing surgery in PT1B-PT2N0M0 renal
tumours: a matched comparison analysis in 546 cases. Eur Urol
Suppl 2008;7:194.
[37] Patard JJ, Shvarts O, Lam JS, et al. Safety and efficacy of partial
nephrectomy for all T1 tumors based on an international multi-
center experience. J Urol 2004;171:2181–5.
[38] Thompson RH, Kaag M, Vickers A, et al. Contemporary use of partial
nephrectomy at a tertiary care center in the United States. J Urol
2009;181:993–7.
[39] Dash A, Vickers AJ, Schachter LR, et al. Comparison of outcomes in
elective partial vs radical nephrectomy for clear cell renal cell
carcinoma of 4-7 cm. BJU Int 2006;97:939–45.
[40] Weight CJ, Larson BT, Fergany AF, et al. Nephrectomy induced
chronic renal insufficiency is associated with increased risk of
cardiovascular death and death from any cause in patients with
localized cT1b renal masses. J Urol 2010;183:1317–23.
[41] Crepel M, Jeldres C, Perrotte P, et al. Nephron-sparing surgery is
equally effective to radical nephrectomy for T1BN0M0 renal cell
carcinoma: a population-based assessment. Urology 2010;75:271–5.
[42] Gill IS, Kavoussi LR, Lane BR, et al. Comparison of 1800 laparoscopic
and open partial nephrectomies for single renal tumors. J Urol
2007;177(Suppl):165.
[43] Lane BR, Gill IS. 7-year oncological outcomes after laparoscopic and
open partial nephrectomy. J Urol 2010;183:473–9.
[44] Gong EM, Orvieto MA, Zorn KC, et al. Comparison of laparoscopic
and open partial nephrectomy in clinical T1a renal tumors.
J Endourol 2008;22:953–7.
[45] Marszalek M, Meixl H, Polajnar M, et al. Laparoscopic and open
partial nephrectomy: a matched-pair comparison of 200 patients.
Eur Urol 2009;55:1171–8.
[46] Wu SD, Viprakasit DP, Cashy J, et al. Radiofrequency ablation-assisted
robotic laparoscopic partial nephrectomy without renal hilar vessel
clamping versus laparoscopic partial nephrectomy: a comparison of
perioperative outcomes. J Endourol 2010;24:385–91.
[47] Desai MM, Aron M, Gill IS. Laparoscopic partial nephrectomy versus
laparoscopic cryoablation for the small renal tumor. Urology 2005;
66(Suppl):23–8.
[48] O’Malley RL, Berger AD, Kanofsky JA, et al. A matched-cohort
comparison of laparoscopic cryoablation and laparoscopic partial
nephrectomy for treating renal masses. BJU Int 2007;99:395–8.
[49] Ko YH, Park HS, Moon DG, et al. A matched-cohort comparison of
laparoscopic renal cryoablation using ultra-thin cryoprobes with
open partial nephrectomy for the treatment of small renal cell
carcinoma. Cancer Res Treat 2008;40:184–9.
[50] Van Poppel H, Da Pozzo L, Albrecht W, et al. A prospective, random-
ised EORTC intergroup phase 3 study comparing the oncologic
outcome of elective nephron-sparing surgery and radical nephrec-
tomy for low-stage renal cell carcinoma. Eur Urol 2011;59:543–52.
[51] Yu HY, Chen BK, Zhang XJ, et al. A comparative study of nephrec-
tomy and radical nephrectomy for renal cell carcinoma [in Chi-
nese]. Zhonghua Yi Xue Za Zhi 2010;90:1120–2.
[52] Klatte T, Mauermann J, Heinz-Peer G, et al. Perioperative, oncologic,
and functional outcomes of laparoscopic renal cryoablation and
open partial nephrectomy: a matched pair analysis. J Endourol
2011;25:991–7.
[53] Antonelli A, Ficarra V, Bertini R, et al. Elective partial nephrectomy
is equivalent to radical nephrectomy in patients with clinical
T1 renal cell carcinoma: results of a retrospective, comparative,
multi-institutional study. BJU Int. In press. doi:10.1111/j.1464-410X.
2011.10431.x.
[54] Maclennan SJ, Maclennan SJ, Imamura M, et al. Urological cancer
care pathways: development and use in the context of systematic
reviews and clinical practice guidelines. World J Urol 2011;29:
291–301.
[55] CEBM (Centre for Evidence-Based Medicine) Levels of Evidence.
Centre for Evidence-Based Medicine Web site. http://www.cebm.
net/index.aspx?o=5653. Accessed January 2012.
[56] Guideline for management of the clinical stage 1 renal mass.
American Urological Association Web site. http://www.auanet.
org/resources.cfm?ID=442 [pp.13-4]. Accessed May 2011.
[57] Guideline for management of the clinical stage 1 renal mass.
American Urological Association Web site. http://www.auanet.
org/resources.cfm?ID=442 [p. 14]. Accessed May 2011.
[58] Hui GC, Tuncali K, Tatli S, Morrison PR, Silverman SG. Comparison of
percutaneous and surgical approaches to renal tumor ablation:
metaanalysis of effectiveness and complication rates. J Vasc Interv
Radiol 2008;19:1311–20.
[59] Nabi G, Cleves A, Shelley M. The necessity of adrenalectomy at the
time of radical nephrectomy: a systematic review. Cochrane Data-
base Syst Rev 2010:CD006579.
[60] Manikandan R, Srinivasan V, Rane A. Which is the real gold standard
for small-volume renal tumors? Radical nephrectomy versus neph-
ron-sparing surgery. J Endourol 2004;18:39–44.
[61] Kunkle DA, Uzzo RG. Cryoablation or radiofrequency ablation of the
small renal mass: a meta-analysis. Cancer 2008;113:2671–80.
[62] Kunkle DA, Egleston BL, Uzzo RG. Excise, ablate or observe: the
small renal mass dilemma—a meta-analysis and review. J Urol
2008;179:1227–33.