Systematic review of observational data on effectiveness of Haemophilus influenzae type b
76
1 Systematic review of observational data on effectiveness of Haemophilus influenzae type b (Hib) vaccines to allow optimization of vaccination schedules Charlotte Jackson, Andrea Mann, Punam Mangtani, Paul Fine London School of Hygiene and Tropical Medicine January 2013
Transcript of Systematic review of observational data on effectiveness of Haemophilus influenzae type b

1
Systematic review of observational data on effectiveness of Haemophilus influenzae type b
(Hib) vaccines to allow optimization of vaccination schedules
Charlotte Jackson, Andrea Mann, Punam Mangtani, Paul Fine London School of Hygiene and Tropical Medicine
January 2013

2
CONTENTS
ACKNOWLEDGEMENTS ...................................................................................................... 4!LIST OF FIGURES ................................................................................................................. 4!LIST OF TABLES .................................................................................................................... 4!LIST OF ABBREVIATIONS ................................................................................................... 5!EXECUTIVE SUMMARY ....................................................................................................... 6!1.! INTRODUCTION ............................................................................................................. 9!2.! METHODS........................................................................................................................ 9!
2.1. Data sources and search strategies ............................................................. 9!2.2. Inclusion criteria ........................................................................................... 10!2.3. Exclusion criteria .......................................................................................... 11!2.4. Screening of abstracts and full text ............................................................ 11!2.5. Data extraction .............................................................................................. 12!2.6. Analysis ......................................................................................................... 13!2.7. Studies using the screening method .......................................................... 14!2.8. Additional data on immunogenicity and carriage ...................................... 14!
3.! RESULTS ....................................................................................................................... 14!3.1. Case-control studies .................................................................................... 17!
3.1.1. Number of doses ................................................................................................ 18!3.1.2. Age at initiation of Hib vaccination .................................................................. 24!3.1.3. Interval between doses ..................................................................................... 25!3.1.4. Implications of a booster dose ......................................................................... 26!3.1.5. Implications of co-administration of Hib with other vaccines ....................... 26!3.1.6. Vaccine failures .................................................................................................. 27!3.1.7. Potential biases in included case-control studies ......................................... 28!
3.2. Cohort studies ............................................................................................... 30!3.2.1. Number of doses ................................................................................................ 33!3.2.2. Age at initiation of Hib vaccination .................................................................. 36!3.2.3. Interval between doses ..................................................................................... 37!3.2.4. Implications of a booster dose ......................................................................... 37!3.2.5. Implications of co-administration of Hib with other vaccines ....................... 38!3.2.6. Vaccine failures .................................................................................................. 38!3.2.7. Potential biases in included cohort studies .................................................... 39!3.2.8. Conclusions from cohort studies ..................................................................... 40!
3.3. Other study designs included in O’Loughlin review ................................. 41!3.4. Screening method studies ........................................................................... 42!3.5. Immunogenicity data .................................................................................... 44!

3
3.5.1. Number of doses in the primary series ........................................................... 44!3.5.2. Age at vaccination .............................................................................................. 46!3.5.3. Effect of a booster dose .................................................................................... 47!3.5.4. Type of conjugate vaccine ................................................................................ 47!3.5.5. Co-administration with other vaccines ............................................................ 48!3.5.6. Conclusions from immunogenicity data .......................................................... 49!
3.6. Effectiveness against carriage .................................................................... 50!4.! DISCUSSION ................................................................................................................. 53!
4.1. Summary of key findings ............................................................................. 53!4.2. Strengths and limitations of identified data ............................................... 54!4.3. Strengths and limitations of review methods ............................................ 56!4.4. Conclusions .................................................................................................. 58!
APPENDIX ............................................................................................................................. 63!

4
ACKNOWLEDGEMENTS We thank Ana Maria Henao Restrepo and Ximena Laurie for support in conducting
this review. We are grateful to Pippa Scott and colleagues at the University of Bern
for carrying out and sharing the results of the literature search and initial screening.
Kenda Cunningham, Rein Houben and John Bradley assisted with translations.
LIST OF FIGURES Figure 1: Identification of eligible studies...................................................................16
Figure 2: Dose-specific estimates, and results of meta-analysis, of vaccine
effectiveness against Hib meningitis from case-control studies ...............................19
Figure 3: Dose-specific estimates of vaccine effectiveness from case-control studies
against invasive Hib disease from case-control studies using community controls,
and the results of meta-analysis................................................................................21
Figure 4: Dose-specific estimates of vaccine effectiveness against radiologically
confirmed (all cause) pneumonia...............................................................................24
Figure 5: Estimates of three-dose vaccine effectiveness against invasive Hib disease
from cohort studies....................................................................................................36
Figure 6: Geometric mean anti-PRP antibody titres in children vaccinated with two
doses of PRP-OMP two months apart, beginning at different ages, in Arizona,
California, Michigan and Florida................................................................................45
Figure 7: Geometric mean anti-PRP antibody titre following vaccination of Alaska
Native infants with different Hib conjugate vaccines..................................................46
Figure 8: Prevalence of oropharyngeal carriage of Hib by Native American children,
by age and number of previous doses of PRP-OMP.................................................51
LIST OF TABLES Table 1: Median age at receipt of first, second and third doses of Hib vaccine for Hib
meningitis cases and controls, Uganda, 2002-2005..................................................25
Table 2: Median time in days between doses of Hib vaccine in cases of radiologically
confirmed pneumonia and controls, Colombia, 1998-2001.......................................26
Table 3: Summary of vaccines and schedules in cohort studies of Hib vaccine
effectiveness..............................................................................................................32
Table 4: Hib vaccine effectiveness against against invasive Hib disease from cohort
studies.......................................................................................................................34

5
LIST OF ABBREVIATIONS CI Confidence interval
CNS Central nervous system
CSF Cerebrospinal fluid
DTaP Diphtheria – tetanus – acellular pertussis vaccine
DTwP Diphtheria – tetanus – whole cell pertussis vaccine
EPI Expanded Programme on Immunization
EU European Union
GMC Geometric mean concentration
GMT Geometric mean titre
HbOC Polyribosylribitol phosphate – mutant diphtheria toxin conjugate
vaccine
Hib Haemoophilus influenzae type b
OR Odds ratio
PRP Polyribosylribitol phosphate
PRP-D Polyribosylribitol phosphate – diphtheria toxoid conjugate vaccine
PRP-OMP Polyribosylribitol phosphate – Neisseria meningitidis outer membrane
protein conjugate vaccine
PRP-T Polyribosylribitol phosphate – tetanus toxoid conjugate vaccine
RCT Randomised controlled trial
SES Socioeconomic status
VE Vaccine effectiveness
WBC White blood cell
WHO World Health Organization

6
EXECUTIVE SUMMARY Objective
The objective of this report is to summarise available evidence from observational
studies on the effectiveness of Hib vaccines against clinical outcomes, to support
decisions regarding optimising vaccination schedules.
Review methods
Electronic databases and trial registers were searched in June 2012. Studies were
eligible for inclusion in the review if they used an observational design and reported
the effectiveness of Hib vaccines as a function of number of doses, dosing interval,
age at initiation of vaccination, or co-administration with other vaccines or medical
preparations. Where appropriate, dose-specific estimates of vaccine effectiveness
(VE) were summarised using random effects meta-analysis, for PRP-OMP and other
vaccines separately. Some relevant data on immunogenicity and carriage following
different vaccination schedules are also presented.
Results
The literature search identified 3892 articles, of which 33 (reporting on 32 studies)
were included in the review: 20 case-control studies, 8 cohort studies and 4 studies
which estimated vaccine effectiveness using the screening method. Meta-analysis of
data from case-control studies using community controls produced effectiveness
estimates of 55% (95% CI 2-80%), 94% (95% CI 65-99%) and 94% (95% CI 18-
100%) after 1, 2 and 3 doses, respectively, against Hib meningitis. Based on hospital
controls, effectiveness against Hib meningitis was 53% (-14-81%), 92% (75-97%)
and 94% (65-99%) for 1, 2 and 3 doses. Based on case-control studies, VE against
invasive Hib disease (for vaccines other than PRP-OMP) was estimated as 59% (30-
76%) for 1 dose and 99% (77-100%) for 3 doses; insufficient data were identified to
allow meta-analysis of estimates of two-dose VE against invasive Hib disease. Dose-
specific data from cohort studies were more limited but the effectiveness of three
doses was estimated as 96% (93-98%). Estimates of effectiveness against
radiologically confirmed pneumonia were lower than those against Hib meningitis
and invasive Hib disease (�55% after three doses). No studies directly compared
different ages at vaccination or intervals between doses; comparisons were therefore

7
made between studies in which different schedules were used. Studies generally
reported the intended, rather than the actual, ages at vaccination; there was no clear
difference in estimates of dose-specific effectiveness related to the intended age at
initiation of vaccination. Limited evidence from cohort studies suggests that older age
at initiation may lead to higher VE against invasive Hib, although any effect was
slight and VE was high even when vaccination was begun at 6 weeks of age. Most of
the case-control studies used appropriate controls and adjusted for some important
confounders. Three of the 8 cohort studies included in the review were at least
moderately likely to be biased due to lack of control for confounding.
Data from two case-control studies in the UK suggested that Hib vaccine may be
less effective when administered with acellular pertussis vaccine than when given
with whole cell pertussis vaccine. Limited data from two cohort studies conducted in
Germany were consistent with a slight additional benefit of a booster dose when
given in addition to a full primary series, but the confidence intervals overlapped (VE
estimates were 98.5% [95% CI 94.5-99.6%] and 100% [95% CI 52.7-100%] for three
doses plus booster, compared to 96.7% [95% CI 87.7-99.1%] and 90.4% [95% CI
70.6-96.8%] for three doses without booster). One of these studies also suggested
that a booster may compensate at least to some extent for incomplete primary
vaccination.
Although not reviewed systematically in this report, immunogenicity data support the
conclusion from the clinical data that two or three doses of Hib conjugate vaccine are
more effective than one dose. One immunogenicity study suggested that the
antibody response to vaccination increased with age, but reported substantial rises
in antibody titres following vaccination even for children vaccinated at the age of 2-3
months. The response to a booster dose also appeared to increase with age.
Immunogenicity data are consistent with a lower effectiveness of Hib conjugate
vaccine administered with acellular (as compared to whole cell) pertussis vaccine.
Hib conjugate vaccines may be effective against carriage as well as clinical disease,
but the data identified in the course of this review do not suggest a dose-response
relationship or allow comparisons of different vaccination schedules.

8
Conclusions
Evidence from observational studies indicates that at least two doses of Hib vaccine
are required to achieve high effectiveness, typically reported as 85% or greater
against invasive Hib disease and Hib meningitis. The available observational data
allow only limited comparisons of different Hib vaccination schedules and do not
strongly favour any particular schedule. There is some evidence that DTaP-Hib
vaccines are less effective and less immunogenic than DTwP-Hib vaccines. Further
data are required relating vaccine effectiveness to age at initiation of vaccination and
dosing intervals.
9
1. INTRODUCTION This project forms part of the WHO/IVR initiative to assist in the optimisation of
vaccination schedules. Reviews have been commissioned by several groups to
review data on effectiveness drawn from clinical trials (University of Bern) and from
observational studies (this project, LSHTM), as well as data on Hib disease
epidemiology, Hib vaccine impact and on herd immunity induced by Hib vaccines.
The aim of this review is to summarise the published evidence on effectiveness of
Hib vaccines, drawn from observational studies, with reference to schedule-relevant
factors and clinical outcomes. In particular:
o Number of doses
o Age at initiation of Hib vaccine series
o Interval between doses
o Implications of a booster
o Implications of co-administration of other vaccines
o Timing of vaccine failures and implications for the administration of a
booster dose
Previous reviews have summarised estimates of overall and dose-specific
effectiveness of Hib vaccination from observational studies 1, 2 and randomised
controlled trials 2, 3. We add to these summaries by considering in more detail the
implications of and for different vaccination schedules. We also briefly review data on
the immunogenicity of Hib vaccines and their effectiveness against carriage, again
with reference to schedule-relevant factors.
2. METHODS 2.1. Data sources and search strategies The literature search was carried out by colleagues at the University of Bern. The
following databases were searched in May 2010 and again in June 2012: Medline,
the Cochrane Library, African Index Medicus, Indian Medlars Centre, Latin American
and Caribbean Health Sciences Literature.
10
The search strategy for each database included Medical Subject Headings or
keywords relating to Hib vaccines, the word “conjugate”, and combinations of
vaccination and Hib disease. No date or language restrictions were applied.
Clinical trial registries and regulatory authority dossiers were also searched. Data
published after the review was carried out, and publicly available surveillance
reports, were identified through further literature and internet searches. Investigators
who had conducted field studies on Hib incidence in countries which introduced Hib
conjugate vaccine before 2007 were contacted to identify unpublished data. Finally,
the reference lists of two reviews 1, 4 were hand searched.
Colleagues at the University of Bern also performed some of the initial abstract
screening. Further screening of abstracts and full text was carried out at LSHTM.
2.2. Inclusion criteria Study design: Case control and cohort studies were eligible for inclusion.
Population: We restricted this review to routine vaccination in general populations.
Intervention: Studies of currently licensed conjugate Hib vaccines were included a.
Comparison groups: We included studies which allowed assessment of vaccine
effectiveness as a function of type of Hib vaccine, number of doses, age at first dose,
interval between doses, receipt of a booster, or co-administration of other vaccines
or medical preparations.
Outcomes: Studies which estimated the effectiveness of conjugate Hib vaccine
against one or more of the following clinical outcomes were eligible: all cause
pneumonia, Hib pneumonia, bacteraemia / septicaemia, meningitis, invasive Hib
disease, all cause mortality, mortality due to Hib pneumonia, mortality due to
invasive Hib disease, epiglottitis. Studies which did not include estimates of vaccine
effectiveness, but presented sufficient data for it to be estimated, were also included. a One of the available hexavalent Hib-containing vaccines (Hexavac) has recently been withdrawn in the EU. One study in which this vaccine was used in some participants was included in the review.

11
(Vaccine effectiveness was defined as the reduction in incidence of the outcome as
a function of vaccination or a particular vaccination schedule as compared to no
vaccination or an alternative schedule.)
2.3. Exclusion criteria Study design: Ineligible study designs included both randomised and non-
randomised trials, vaccine probe studies and studies which estimated the impact of
vaccination at the population level (trials and impact studies are subjects of separate
independent reviews).
Population: Studies of special groups (e.g. children infected with HIV, re-vaccination
of immunocompromised children or adults) were excluded.
Intervention: Studies were excluded if they reported on the effects of polysaccharide
(non-conjugate) vaccine only, or if conjugate and non-conjugate vaccines were used
but it was not possible to separate the effects of these different vaccines. Similarly,
studies of only PRP-D vaccine (which is no longer used) were excluded, as were
studies reporting on both PRP-D and other conjugate vaccines in which the different
vaccines could not be separated.
2.4. Screening of abstracts and full text Initial screening of abstracts and full text classified the studies into likely
observational studies of conjugate Hib vaccines which were likely to meet the
inclusion criteria, controlled trials and other studies. The “other” group included
reviews, letters, summaries, guidelines, animal and laboratory studies, studies of
vaccination coverage or attitudes to vaccination, economic studies, studies in special
groups, and studies of organisms other than Hib such as non-typeable H. influenzae.
This screening was performed by one or two reviewers (for papers screened by the
LSHTM and University of Bern teams, respectively).
The observational studies were screened further (by the LSHTM team) using a rapid
electronic method: titles and abstracts were searched electronically for the following
12
terms (and variants) related to the target study designs: cohort, longitudinal, case-
control, prospective, retrospective, matched pair, comparative, follow up, non
randomised, observational. A 10% random sample of the observational studies
which did not pass electronic screening was manually screened to assess the
sensitivity of the method.
Rapid electronic screening used terms only in the English language. All identified
papers included a title in English; however some had abstracts in other languages
without English translations. Therefore papers with titles which appeared potentially
relevant to this review, and with abstracts in a language other than English, were
marked for retrieval in full.
Papers identified through this process (initial screening classifying abstracts as
observational, trials or other, followed by rapid electronic screening of observational
studies) were further assessed based on titles and abstracts, and the full text
retrieved if potentially eligible. Full text screening was performed by one reviewer,
with guidance from others on particular papers as necessary.
Papers which were not identified by the electronic screening, but which were
included in a previous review of observational studies of Hib vaccination 1, were also
included.
2.5. Data extraction Data were extracted by one reviewer and checked by a second. Extracted data
included information about the study population, vaccination schedules and
occurrence of the outcome of interest, for each comparison presented. Some
required information is presented in a similar format to the previous review 1; we also
extracted data on additional factors relevant to vaccination schedules.
The data extraction forms included questions, specific to case-control and cohort
studies, intended to inform judgement about of the potential for bias for each
included study. Due to the relatively small number of articles identified, we did not

13
exclude studies based on their potential for bias, but summarise key methodological
concerns in the text.
For studies which reported individual-level data on vaccine failures, we extracted
data on the age and the time since last dose at disease onset, in case such
information gave some hint of the waning of vaccine-derived immunity. The validity
of this approach is discussed in Section 4.3.
Forms for screening and data extraction were created in web-based systematic
review software (DistillerSR, Evidence Partners, Ottawa, Canada).
2.6. Analysis For each outcome against which dose-specific VE was reported by three or more
case-control studies, we performed random effects meta-analysis using the method
of DerSimonian and Laird 5 to calculate a pooled odds ratio (OR). The OR is related
to VE by the equation VE = 100×(1-OR). Studies were eligible for meta-analysis if
they reported VE for 1, 2 or 3 vaccine doses. Studies of PRP-OMP were analysed
separately from other vaccines, as there is evidence that this vaccine is more
immunogenic 6-8 than other Hib vaccines, especially after a single dose.
Heterogeneity was assessed using the I2 statistic, which measures the percentage of
variation between studies which is attributable to heterogeneity 9. Values of I2 of
25%, 50% and 75% are considered to represent low, moderate and high
heterogeneity, respectively 9. We identified insufficient data to stratify by vaccination
schedule.
The distributions of age at disease and time between last vaccine dose and disease
were summarized graphically (stratified, where possible, by type of pertussis vaccine
used in the vaccination schedule).
Statistical analysis was conducted using Stata 12.

14
2.7. Studies using the screening method Several studies included in the O’Loughlin review 1 used the screening methodb to
estimate vaccine effectiveness. We considered screening method studies to be of a
lower quality than case-control or cohort studies because the screening method does
not allow for adjusting for confounding beyond age and sex and because it may
produce biased estimates of VE (e.g. the population in which vaccine coverage is
measured may not be representative of the population from which the cases arose).
For completeness, we highlight the main points from each of the screening method
studies included in the O’Loughlin review as well as screening method studies we
identified by adding the terms “screening method” and “case population” to our rapid
electronic screen of abstracts from observational studies.
2.8. Additional data on immunogenicity and carriage The systematic component of this review focuses on clinical outcomes. In addition,
titles and abstracts of all papers identified in the initial search were further screened
electronically for the words “antibody”, “antibodies”, “immunogenicity”,
“immunogenic”, “carriage” and “colonisation”. Studies identified by these searches
are not included in the systematic component of this report, but some results
relevant to optimising schedules are presented in a non-systematic summary.
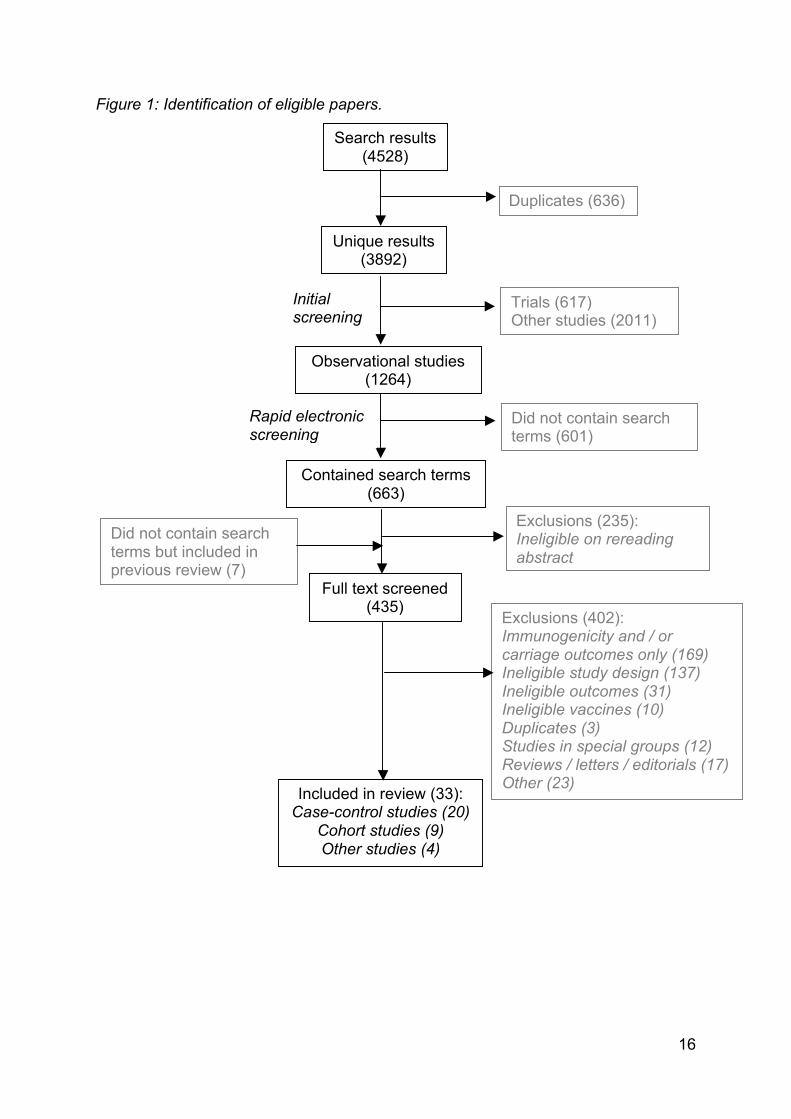
3. RESULTS After de-duplication, the literature search produced 3892 results. Our screening
process identified 26 eligible papers; 7 more were identified from the previous review 1. Therefore 33 papers (reporting 32 studies) were included: 20 case-control studies,
8 cohort studies and 4 others (Figure 1). We note that the total number of search
results reported in Figure 1 differs from that reported in the accompanying review of
trial data. This is due to subsequent filtering of the results of the 2012 search update
for RCTs: this review of observational studies includes only those studies not
identified as RCTs by this automated filtering.
b In screening method studies, vaccine effectiveness is calculated as 1-[PCV(1-PPV)]/[(1-PCV)PPV], where PCV is the proportion of the cases who are vaccinated and PPV is the proportion of the population vaccinated (i.e., vaccine coverage) 10. Orenstein, W.A., et al., Field evaluation of vaccine efficacy. Bull World Health Organ, 1985. 63(6): p. 1055-68.
15
Common reasons for exclusion were reporting of immunogenicity and / or carriage
rather than clinical outcomes, ineligible study designs (e.g. trials or impact
assessments), ineligible vaccines (PRP, PRP-D or studies in which individuals
vaccinated with one of these could not be separated from those vaccinated with
eligible vaccines) and ineligible outcomes (e.g. studies in which children received
several vaccines including Hib but the outcomes of interest were not related to Hib).
We focus on Hib meningitis, invasive Hib disease and radiologically confirmed
pneumonia, as these were the only outcomes for which VE estimates were available
for more than one schedule. We present VE estimates for 1, 2 and 3 doses in the
main text and include estimates for other numbers of doses (e.g. ≥1), and for other
outcomes in the Appendix.
16
Figure 1: Identification of eligible papers.
Unique results (3892)
Observational studies (1264)
Trials (617) Other studies (2011)
Did not contain search terms (601)
Contained search terms (663)
Exclusions (235): Ineligible on rereading abstract
Full text screened (435)
Included in review (33): Case-control studies (20)
Cohort studies (9) Other studies (4)
Exclusions (402): Immunogenicity and / or carriage outcomes only (169) Ineligible study design (137) Ineligible outcomes (31) Ineligible vaccines (10) Duplicates (3) Studies in special groups (12) Reviews / letters / editorials (17) Other (23)
Did not contain search terms but included in previous review (7)
Search results (4528)
Duplicates (636)
Initial screening
Rapid electronic screening

17
We did not identify any studies which directly compared schedules (e.g. directly
compared cohorts of children whose vaccination was initiated at either 6 weeks or 2
months). Several studies presented stratum specific estimates of VE by number of
doses received or by presence or absence of a booster dose but the reference group
was always an unvaccinated group. Many of the comparisons we make in this report
are between estimates of VE from different studies (separately for case-control and
cohort studies).
3.1. Case-control studies Characteristics of the 20 identified case-control studies are summarised in Appendix
Table 1. Six of these studies 11-16 were not included in the previous review 1. One of
the case-control studies was nested within an intervention study in which the primary
analysis included children who were not offered the vaccine and those whose
parents refused vaccination; we report only results from the nested case-control
study 12. Another was conducted during a non-randomised cluster trial of Hib-DTwP
vaccine (cases and controls were drawn from communities in which health centres
used the Hib-DTwP combination vaccine) 17. The remaining studies were standard
hospital- or population-based case-control studies.
Amongst the 15 case-control studies which reported the intended vaccination
schedule, 6 (conducted in Malawi 18, Bangladesh 17, Uganda 19, 20, Senegal 15 and
Rwanda 21) used the basic EPI schedule of 6, 10 and 14 weeks. Three studies from
the Dominican Republic 22, Brazil23 and Colombia 24 reported an intended schedule
of 2, 4 and 6 months, whilst two studies from the UK 13, 14 and one from The Gambia 25 used an intended schedule of 2, 3 and 4 months. In a study from the USA, the
intended schedules were 2, 4 and 12 months for PRP-OMP and 2, 4, 6 and 15
months for HbOC 26. The latter was the only schedule reported in a case control
study to include a fourth (booster) dose of Hib vaccine. Two other studies from the
USA reported intended schedules of 2, 4 and 6 months 12, 27. None of the identified
case-control studies directly compared the effectiveness of different vaccination
schedules.

18
3.1.1. Number of doses
The effectiveness of one dose of Hib vaccine was often relatively low (point
estimates were usually <65%, Figures 2-4). However, two studies carried out in the
USA, using only or mainly PRP-OMP, reported VE >90% against invasive Hib
disease after one dose 26 28. A study from Uganda reported VE as 87% (95% CI 42-
99%) or 88% (95% CI 19-99%) against Hib meningitis following one dose (PRP-T in
a pentavalent vaccine), based on community and hospital controls, respectively 19.
VE against Hib meningitis after two or more doses ranged from 65% (95% CI-190 to
100%) 17 to 99% (95% CI 92-100%) 19 (Figure 2). Excluding the estimate of 65%
(see below), the lowest reported effectiveness against Hib meningitis after 2 or 3
doses was 87% (95% CI 14-100%) 22.
Meta-analysis of studies using community controls produced estimates of VE against
Hib meningitis of 55% (95% CI 2-80%), 94% (95% CI 65-99%) and 94% (95% CI 18-
100%) for 1, 2 and 3 doses, respectively (Figure 2). The corresponding estimates
using hospital controls were similar (Figure 2): 53% (95% CI -14-81%), 92% (95% CI
75-97%) and 94% (95% CI 65-99%). There was no or very limited heterogeneity
between studies using community controls; in studies using hospital controls, the
one-dose estimates were moderately heterogeneous (I2 = 35.8%). All of these
studies used PRP-T vaccine.

19
Figure 2: Dose-specific estimates, and results of meta-analysis, of vaccine
effectiveness against Hib meningitis from case-control studies using community
controls (top) and hospital controls (bottom). For each point estimate, the size of the
box is proportional to its weight in the meta-analysis. Intended vaccination schedules
were: 6, 10, 14 weeks (Uganda, Bangladesh, Malawi); 2, 3, 4 months (The Gambia),
2, 4, 6 months (Dominican Republic).
.
.
.
1 dos e
Gam bia (Adegbola, 2005)
Dom in ican Republ ic (Lee, 2008)
Uganda (Lee, 2008)
Subtotal (I-s quared = 7.9%, p = 0.338)
2 dos es
Gam bia (Adegbola, 2005)
Uganda (Lee, 2008)
Dom in ican Republ ic (Lee, 2008)
Subtotal (I-s quared = 0.0%, p = 0.802)
3 dos es
Gam bia (Adegbola, 2005)
Bangladesh (Baqui, 2007)
Uganda (Lee, 2008)
Dom in ican Republ ic (Lee, 2008)
Subtotal (I-s quared = 0.0%, p = 0.888)
Study
0.65 (0.23, 1.84)
0.48 (0.12, 1.63)
0.13 (0.01, 0.58)
0.45 (0.20, 0.98)
0.07 (0.01, 0.58)
0.01 (0.00, 0.10)
0.13 (0.00, 0.86)
0.06 (0.01, 0.35)
0.04 (0.00, 0.53)
0.35 (0.00, 2.90)
0.02 (0.00, 0.11)
0.10 (0.00, 0.67)
0.06 (0.00, 0.82)
ratio (95% CI)
Odds
35 (-84 to 77)
52 (-63 to 88)
87 (42 to 99)
93 (42 to 99)
99 (90 to 100)
87 (14 to 100)
96 (47 to 100)
65 (-190 to 100)
98 (89 to 100)
90 (33 to 100)
effectivenes s (95% CI)
Vaccine
55 (2 to 80)
94 (65 to 99)
94 (18 to 100)
1.0001 .001 .01 .1 1 10
.
.
.
1 dose
Malawi (Daza, 2006)
Uganda (Lee, 2008)
Uganda (Lewis, 2008)
Subtotal (I-squared = 35.8%, p = 0.211)
2 doses
Malawi (Daza, 2006)
Uganda (Lee, 2008)
Uganda (Lewis, 2008)
Subtotal (I-squared = 0.0%, p = 0.854)
3 doses
Bangladesh (Baqui, 2007)
Uganda (Lee, 2008)
Uganda (Lewis, 2008)
Subtotal (I-squared = 0.0%, p = 0.937)
Study
0.89 (0.34, 2.51)
0.12 (0.01, 0.81)
0.37 (0.14, 1.00)
0.47 (0.19, 1.14)
0.11 (0.02, 0.57)
0.05 (0.00, 0.37)
0.07 (0.01, 0.58)
0.08 (0.03, 0.25)
0.14 (0.00, 1.08)
0.03 (0.00, 0.25)
0.06 (0.01, 0.52)
0.06 (0.01, 0.35)
ratio (95% CI)
Odds
11 (-151 to 66)
88 (19 to 99)
63 (0 to 86)
89 (43 to 98)
95 (63 to 100)
93 (42 to 99)
86 (-8 to 100)
97 (75 to 100)
94 (48 to 99)
effectiveness (95% CI)
Vaccine
53 (-14 to 81)
92 (75 to 97)
94 (65 to 99)
Odds ratio
1.0001 .001 .01 .1 1 10Odds ratio

20
The estimate of 65% effectiveness against Hib meningitis after three doses was an
outlier and had a very wide confidence interval (-190 to 100%) 17. This is partly due
to the small number of Hib meningitis cases: 15 in total, with no information on how
many had received three doses of vaccine. The estimate of 65% was based on
comparing cases to community controls; the study also estimated the three-dose VE
against Hib meningitis based on hospital controls as 86% (95% CI -8 to 100%). The
estimate of 65% may therefore be an underestimate of the effectiveness of three
doses. However, the choice of controls is unlikely to account fully for the low
estimate (65%), as the point estimates of one and two dose effectiveness were
similar whether based on hospital or community controls.
All of the case-control studies of invasive Hib disease used community controls.
Estimates of VE after two or more doses ranged from 86% (95% CI 16-98%) 27 to
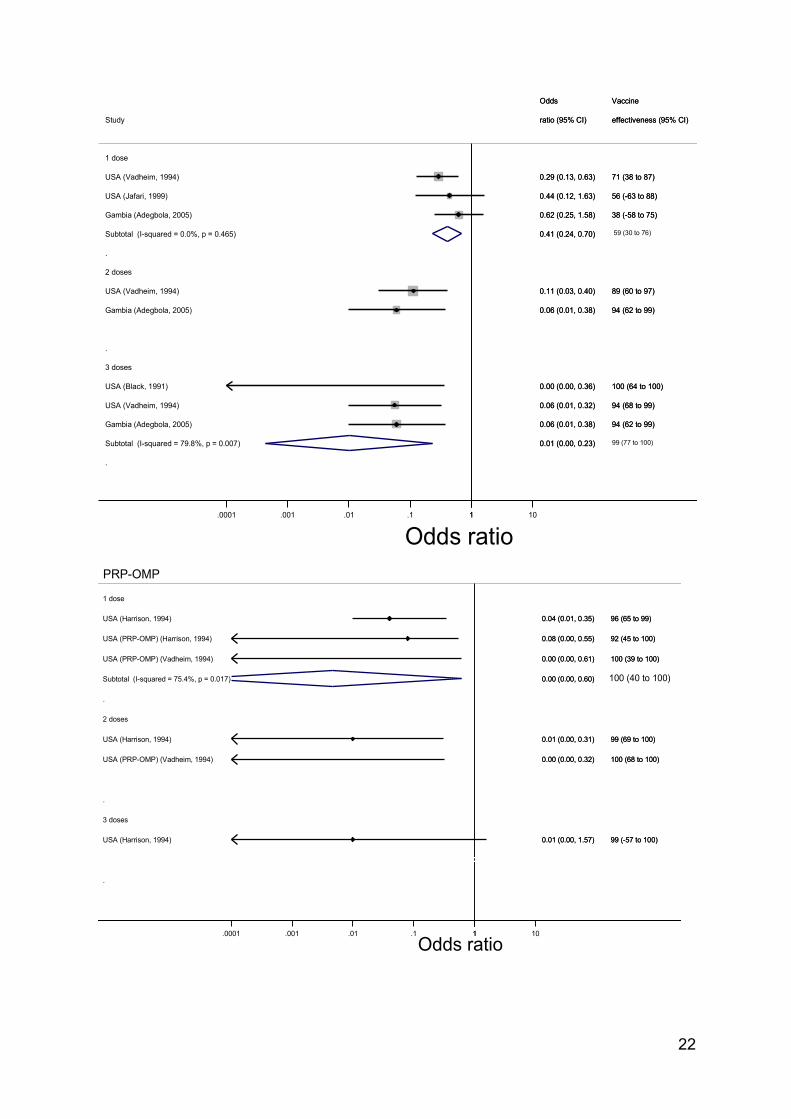
100% in two studies (95% CI 68-100% or 64-100%) 12, 26. The pooled estimates from
meta-analysis for vaccines other than PRP-OMP were 59% (95% CI 30-76%) for one
dose and 99% (95% CI 77-100%) for three doses (only two studies which used
vaccines other than PRP-OMP reported two-dose VE against invasive Hib disease,
so meta-analysis was not performed, Figure 3). There was high heterogeneity in the
three-dose estimates (I2 = 79.8%) but not in the one-dose estimates (I2 = 0%).
For PRP-OMP, one-dose VE was estimated as 100% (95% CI 40-100%) but with
high heterogeneity (I2 = 75.4%, Figure 3). The two estimates of two-dose VE for
PRP-OMP were 99% (95% CI 69-100%) and 100% (95% CI 68-100%) (Figure 3).
The one available estimate of VE following three doses of PRP-OMP was 99% (95%
CI -57-100%, Figure 3).

21
Figure 3 (overleaf): Dose-specific estimates of vaccine effectiveness from case-
control studies against invasive Hib disease from case-control studies using
community controls, and the results of meta-analysis. Top: studies which used
vaccines than PRP-OMP; bottom: studies which used mainly or exclusively PRP-
OMP. For each point estimate, the size of the box is proportional to its weight in the
meta-analysis. Intended vaccination schedules were 2, 4, 6, 15 months (Vadhiem
HbOC); 2, 4, 12 months (Vadheim PRP-OMP); 2, 4, 6 months (USA Jafari, USA
Black); 2, 3, 4 months (The Gambia); not stated (USA, Harrison). Hib vaccine was
intended to be given with DTwP in The Gambia; of the US studies, one was
conducted whilst only DTwP was available (Black) and the remainder were
conducted whilst both DTaP and DTwP were in use 29.
22
.
.
.
1 dose
USA (Vadheim, 1994)
USA (Jafari, 1999)
Gambia (Adegbola, 2005)
Subtotal (I-squared = 0.0%, p = 0.465)
2 doses
USA (Vadheim, 1994)
Gambia (Adegbola, 2005)
Subtotal (I-squared = 0.0%, p = 0.583)
3 doses
USA (Black, 1991)
USA (Vadheim, 1994)
Gambia (Adegbola, 2005)
Subtotal (I-squared = 79.8%, p = 0.007)
Study
0.29 (0.13, 0.63)
0.44 (0.12, 1.63)
0.62 (0.25, 1.58)
0.41 (0.24, 0.70)
0.11 (0.03, 0.40)
0.06 (0.01, 0.38)
0.09 (0.03, 0.26)
0.00 (0.00, 0.36)
0.06 (0.01, 0.32)
0.06 (0.01, 0.38)
0.01 (0.00, 0.23)
ratio (95% CI)
Odds
71 (38 to 87)
56 (-63 to 88)
38 (-58 to 75)
89 (60 to 97)
94 (62 to 99)
100 (64 to 100)
94 (68 to 99)
94 (62 to 99)
effectiveness (95% CI)
Vaccine
59 (30 to 76)
99 (77 to 100)
1.0001 .001 .01 .1 1 10
Odds ratio
.
.
.
1 dose
USA (Harrison, 1994)
USA (PRP-OMP) (Harrison, 1994)
USA (PRP-OMP) (Vadheim, 1994)
Subtotal (I-squared = 75.4%, p = 0.017)
2 doses
USA (Harrison, 1994)
USA (PRP-OMP) (Vadheim, 1994)
Subtotal (I-squared = 70.8%, p = 0.064)
3 doses
USA (Harrison, 1994)
Subtotal (I-squared = .%, p = .)
Study
0.04 (0.01, 0.35)
0.08 (0.00, 0.55)
0.00 (0.00, 0.61)
0.00 (0.00, 0.60)
0.01 (0.00, 0.31)
0.00 (0.00, 0.32)
0.00 (0.00, 0.28)
0.01 (0.00, 1.57)
0.01 (0.00, 3.96)
ratio (95% CI)
Odds
96 (65 to 99)
92 (45 to 100)
100 (39 to 100)
99 (69 to 100)
100 (68 to 100)
99 (-57 to 100)
effectiveness (95% CI)
Vaccine
100 (40 to 100)
PRP-OMP
1.0001 .001 .01 .1 1 10
Odds ratio

23
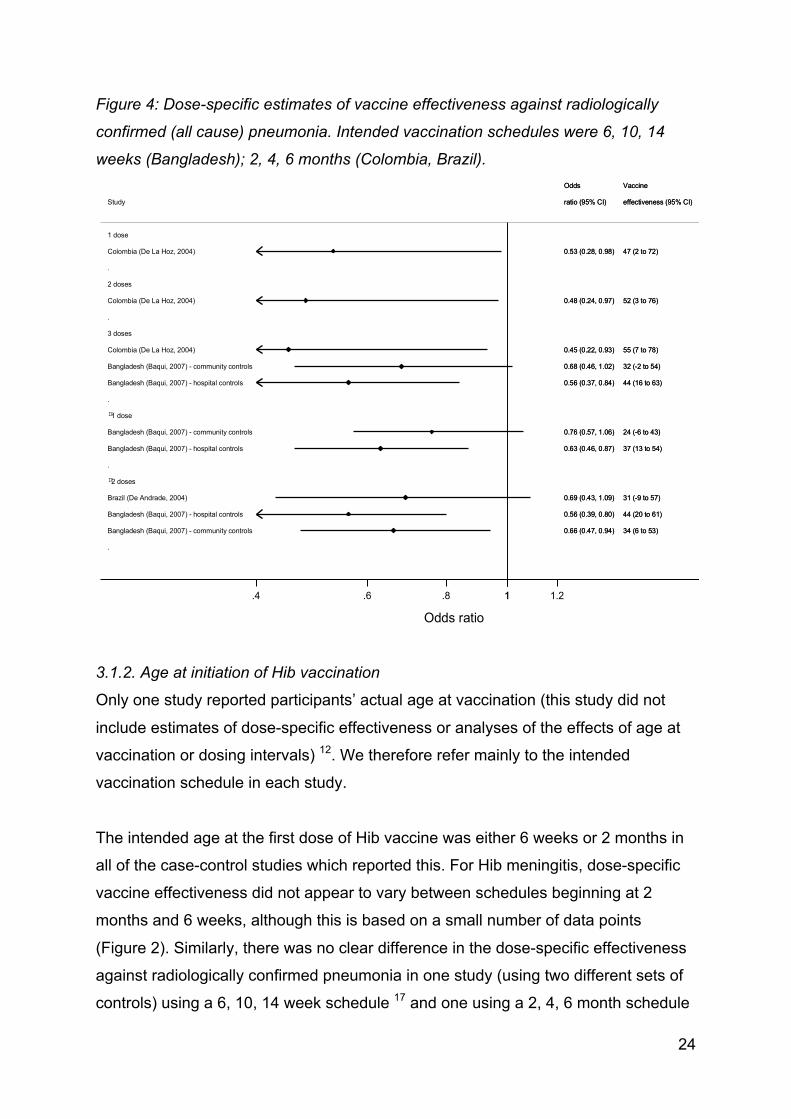
Three studies reported the effectiveness of three doses of Hib conjugate vaccine
against radiologically confirmed pneumonia (Figure 4). In a study in Colombia in
which PRP-T was intended to be given at 2, 4 and 6 months, effectiveness of three
doses was reported to be 55% (95% CI 7-78%) 24. In Bangladesh, three doses of
combined Hib-DTwP vaccine were estimated to be 44% (95% CI 16-63%) or 32%
(95% CI -2 to 54%) effective against radiologically confirmed pneumonia, based on
hospital and community controls, respectively 17. (These estimates are based on
cases of pneumonia diagnosed both by study personnel and by an independent
paediatrician who reviewed the radiograph. If the VE estimate is instead based on
cases diagnosed by only study personnel or by only the independent paediatrician,
then the estimate is lower than that stated above, potentially as low as 16% (95% CI
-11 to 37%) based on community controls diagnosis by the independent
paediatrician 17.)
One further study, from Brazil, reported the effectiveness of two or more doses
against radiologically confirmed pneumonia as 31% (95% CI -9 to 57%), based on
an intended schedule of 2, 4, 6 months and using HbOC 23. All of these estimates 17,
23, 24 of effectiveness against radiologically confirmed pneumonia are lower than
those of the effectiveness of two or three doses against invasive Hib disease and Hib
meningitis. This is of course expected, as the protection against all radiologically
confirmed pneumonia reflects the proportion of all pneumonia specifically
attributable to Hib, as well as the effectiveness of the vaccine.
Estimates of VE from case-control studies following imprecise numbers of doses are
summarised in Appendix Table 2.
24
Figure 4: Dose-specific estimates of vaccine effectiveness against radiologically
confirmed (all cause) pneumonia. Intended vaccination schedules were 6, 10, 14
weeks (Bangladesh); 2, 4, 6 months (Colombia, Brazil).
3.1.2. Age at initiation of Hib vaccination
Only one study reported participants’ actual age at vaccination (this study did not
include estimates of dose-specific effectiveness or analyses of the effects of age at
vaccination or dosing intervals) 12. We therefore refer mainly to the intended
vaccination schedule in each study.
The intended age at the first dose of Hib vaccine was either 6 weeks or 2 months in
all of the case-control studies which reported this. For Hib meningitis, dose-specific
vaccine effectiveness did not appear to vary between schedules beginning at 2
months and 6 weeks, although this is based on a small number of data points
(Figure 2). Similarly, there was no clear difference in the dose-specific effectiveness
against radiologically confirmed pneumonia in one study (using two different sets of
controls) using a 6, 10, 14 week schedule 17 and one using a 2, 4, 6 month schedule
.
.
.
.
.
1 dose
Colombia (De La Hoz, 2004)
2 doses
Colombia (De La Hoz, 2004)
3 doses
Colombia (De La Hoz, 2004)
Bangladesh (Baqui, 2007) - community controls
Bangladesh (Baqui, 2007) - hospital controls
!1 dose
Bangladesh (Baqui, 2007) - community controls
Bangladesh (Baqui, 2007) - hospital controls
!2 doses
Brazil (De Andrade, 2004)
Bangladesh (Baqui, 2007) - hospital controls
Bangladesh (Baqui, 2007) - community controls
Study
0.53 (0.28, 0.98)
0.48 (0.24, 0.97)
0.45 (0.22, 0.93)
0.68 (0.46, 1.02)
0.56 (0.37, 0.84)
0.76 (0.57, 1.06)
0.63 (0.46, 0.87)
0.69 (0.43, 1.09)
0.56 (0.39, 0.80)
0.66 (0.47, 0.94)
ratio (95% CI)
Odds
47 (2 to 72)
52 (3 to 76)
55 (7 to 78)
32 (-2 to 54)
44 (16 to 63)
24 (-6 to 43)
37 (13 to 54)
31 (-9 to 57)
44 (20 to 61)
34 (6 to 53)
effectiveness (95% CI)
Vaccine
1.4 .6 .8 1 1.2
Odds ratio

25
23, although a second study using a 2, 4, 6 month schedule reported slightly higher
effectiveness estimates 24. All studies which reported effectiveness against invasive
Hib disease used an intended vaccination schedule beginning at 2 months of age.
One study in Uganda provided the median age at each dose for cases and controls 19 (Table 1). The median age at receipt of the third dose was greater for vaccinated
cases than for controls, but the difference was not assessed formally, the number of
vaccinated cases was small, potential confounders of the relationship were not
considered, and the estimate of vaccine effectiveness in this study (97-98% against
confirmed Hib meningitis, depending on the source of controls) was not adjusted for
age at vaccination.
Table 1: Median age at receipt of first, second and third doses of Hib vaccine for Hib
meningitis cases and controls, Uganda, 2002-2005. Intended vaccination schedule
was 6, 10, 14 weeks. Source: Lee et al 19.
Median age [range] in weeks at vaccination (number vaccinated)
Dose 1 Dose 2 Dose 3
Cases 7 [5-25]
(5)
11 [10-25]
(3)
32 [27-66]
(3)
Neighbourhood controls
9 [3-64]
(27)
13 [7-69]
(35)
20 [12-52]
(42)
Hospital controls
8 [2-133]
(13)
13 [6-29]
(21)
17 [11-80]
(35)
3.1.3. Interval between doses
In most reported schedules, doses were separated by either one month (6, 10, 14
weeks and 2, 3, 4 months) or two months (2, 4, 6 months and 2, 4, 12 months).
There was no clear difference in effectiveness against Hib meningitis, invasive Hib
disease or radiologically confirmed pneumonia between studies using different
intended dosing intervals (Figures 2-4).
26
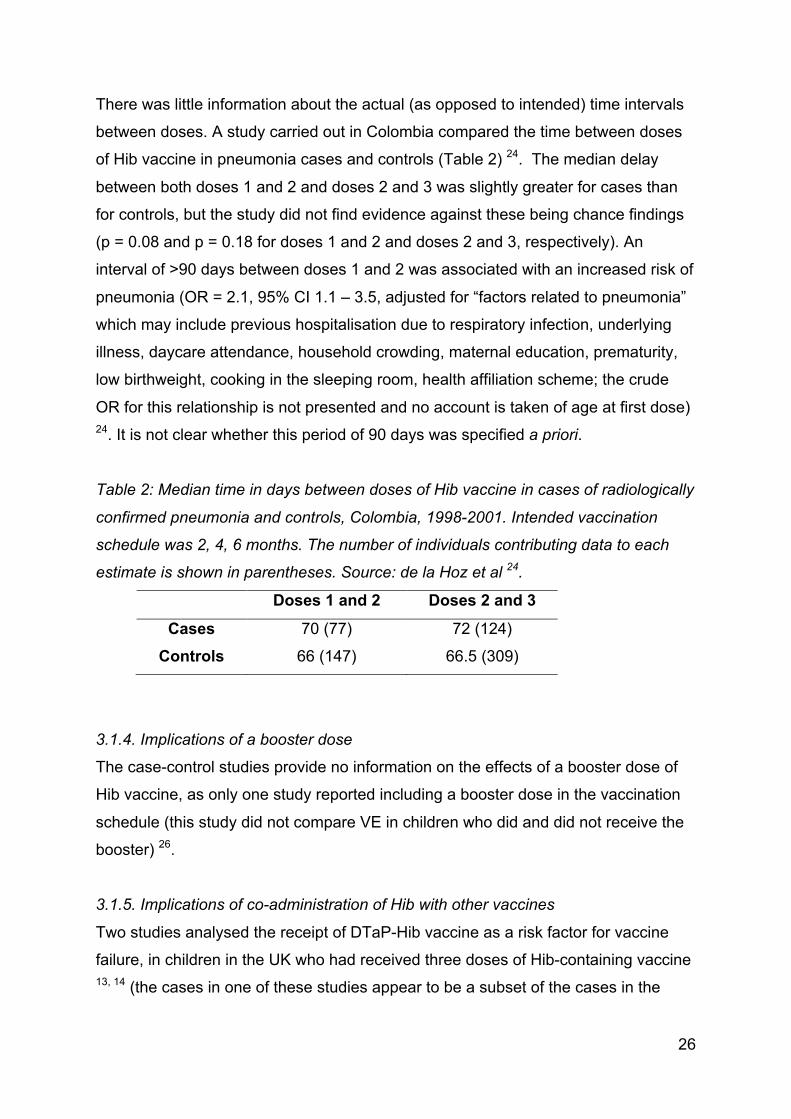
There was little information about the actual (as opposed to intended) time intervals
between doses. A study carried out in Colombia compared the time between doses
of Hib vaccine in pneumonia cases and controls (Table 2) 24. The median delay
between both doses 1 and 2 and doses 2 and 3 was slightly greater for cases than
for controls, but the study did not find evidence against these being chance findings
(p = 0.08 and p = 0.18 for doses 1 and 2 and doses 2 and 3, respectively). An
interval of >90 days between doses 1 and 2 was associated with an increased risk of
pneumonia (OR = 2.1, 95% CI 1.1 – 3.5, adjusted for “factors related to pneumonia”
which may include previous hospitalisation due to respiratory infection, underlying
illness, daycare attendance, household crowding, maternal education, prematurity,
low birthweight, cooking in the sleeping room, health affiliation scheme; the crude
OR for this relationship is not presented and no account is taken of age at first dose) 24. It is not clear whether this period of 90 days was specified a priori.
Table 2: Median time in days between doses of Hib vaccine in cases of radiologically
confirmed pneumonia and controls, Colombia, 1998-2001. Intended vaccination
schedule was 2, 4, 6 months. The number of individuals contributing data to each
estimate is shown in parentheses. Source: de la Hoz et al 24.
Doses 1 and 2 Doses 2 and 3
Cases 70 (77) 72 (124)
Controls 66 (147) 66.5 (309)
3.1.4. Implications of a booster dose
The case-control studies provide no information on the effects of a booster dose of
Hib vaccine, as only one study reported including a booster dose in the vaccination
schedule (this study did not compare VE in children who did and did not receive the
booster) 26.
3.1.5. Implications of co-administration of Hib with other vaccines
Two studies analysed the receipt of DTaP-Hib vaccine as a risk factor for vaccine
failure, in children in the UK who had received three doses of Hib-containing vaccine 13, 14 (the cases in one of these studies appear to be a subset of the cases in the

27
other, although the controls are different). In one study, after matching on date of
birth and restricting analysis to case-control sets who were “the same age” (precise
details are not given) at receipt of the third dose, the odds ratios for invasive Hib
disease comparing children who had received 1, 2 or 3 doses of DTaP-Hib (out of a
total of three Hib-containing vaccines received) to children who had received 3 doses
of DTwP were 1.13 (95% CI 0.54 – 2.39), 2.70 (95% CI 1.24 – 5.88) and 8.40 (95%
CI 3.77 – 18.68), respectively 14. The authors linked these results to other evidence
that DTaP-Hib is less immunogenic than Hib vaccine given with DTwP.
The results of the second study of DTaP-Hib are more difficult to interpret 13. In this
second study, attempts to match on age were only partially successful, leading the
authors to conduct both an unmatched analysis on all participants and a matched
analysis restricted to matched sets. The point estimates from the matched analysis
suggested an increasing relative risk of invasive Hib disease with an increasing
number of DTaP-Hib doses amongst children who had received three doses of Hib-
containing vaccine, with the baseline group being children who had received three
doses of Hib vaccine which did not include DTaP (this appears to comprise children
who had received three doses of DTwP-Hib). However, the confidence intervals
were wide and included 1. For example, the OR comparing children who had
received three doses of DTaP-Hib to those who had received three doses of other
Hib vaccines was 7.29 (95% CI 0.4 – 128). The authors note that the wide CIs are
due partly to the reduction in sample size resulting from restricting the analysis to
matched sets (the estimates are based on 45 observations; the breakdown into
cases and controls is not given) 13. In the unmatched analysis (based on 113
observations), there was no evidence of an increase in the risk of invasive Hib
disease with the number of DTaP-Hib doses.
3.1.6. Vaccine failures Two case-control studies presented data on children who developed Hib disease
despite having been vaccinated 19, 26. In one of these studies, from Uganda 19, three
children developed Hib meningitis after receiving two doses of Hib vaccine with
DTwP, all within one year of the second dose (Appendix Figure 1). Three children
who had received three doses developed Hib meningitis within three years of the
third dose. These six vaccine failures ranged in age from 17 to 157 weeks 19.

28
The second case-control study to include data on vaccine failures was from the USA
and reported 27 vaccine failures in total 26. Eighteen children were diagnosed with
invasive Hib disease after a single vaccine dose, all within one year of vaccination
(Appendix Figure 1). Six and three children developed disease after two and three
doses, respectively, again within one year of the most recent dose.
3.1.7. Potential biases in included case-control studies
Most (17 of 20) of the included studies used community controls, e.g. by identifying
potential controls from electronic registers or by door to door canvassing 11-17, 19, 22-28,
30, 31. In these studies, it seems likely that the controls came from the same
population as the cases.
Five studies used hospital controls 17-21 (two of these included both hospital and
community controls 17, 19). In three of these studies, in estimating vaccine
effectiveness against Hib meningitis, controls were children who were hospitalised
with pneumococcal meningitis 18, 20, 21 (all three studies were conducted before the
introduction of pneumococcal vaccine in the respective countries). Two of these
studies also estimated vaccine effectiveness against purulent meningitis and
aetiology-negative meningitis (i.e. purulent meningitis with no cause identified) 20, 21.
For purulent meningitis, the controls in both studies were children with <20 white
blood cells per µl of CSF (suggesting a viral CNS infection). For aetiology-negative
meningitis, the Uganda study again recruited controls with a possible viral CNS
infection 20 whilst the Rwanda study used controls with pneumococcal meningitis 21.
It is not clear whether the hospital controls in these two studies came from the same
population as the cases; however, the estimates of vaccine effectiveness against Hib
meningitis from these studies were similar to those from other studies (Figure 2,
Appendix Table 2).
The two other studies which used hospital controls recruited children who were
hospitalised with conditions other than pneumonia and meningitis 17 or conditions
other than meningitis, pneumonia, sepsis, bacteraemia, epiglottitis or otitis media
(i.e. conditions potentially caused by Hib) 19. If controls were admitted for vaccine-

29
preventable diseases, then they would be likely to not be vaccinated against Hib,
which would bias the estimate of vaccine effectiveness downwards. It is therefore
reassuring that both of these studies reported similar estimates of vaccine
effectiveness based on hospital and community controls 17, 19, and that in the only
one of these two studies to report controls’ reasons for admission, the most common
were malaria, gastroenteritis and anaemia 19.
All of the estimates from case-control studies were adjusted for one or more potential
confounders at the design and / or analysis stage, except for one study of the
effectiveness of vaccination against purulent meningitis in Rwanda 21. All of the other
studies either matched on or adjusted for age, and most took account of possible
confounding by socioeconomic status (e.g. by using controls matched to cases on
area of residence or by using hospital controls, see Appendix Table 1).
3.1.8. Conclusions from case-control studies
The identified case-control studies confirm previous results 1, 3 that 2 or 3 doses of
Hib vaccine are effective against various forms of Hib disease (estimates of
effectiveness against invasive Hib disease and Hib meningitis were typically >85%).
Although most studies found a single dose of Hib vaccine to have relatively low
effectiveness (≤63%), two studies reported high effectiveness against invasive Hib
disease (92% and 100%) after one dose of PRP-OMP 26, 28. This is consistent with
immunogenicity data showing higher anti-PRP antibody titres after a single dose of
PRP-OMP vaccine compared to other conjugate Hib vaccines 32.
None of the case-control studies directly compared vaccination schedules.
Comparison between studies was restricted by the limited variation in both age at
initiation and dosing intervals, but did not suggest that any one schedule was more
effective than others. The effects of a booster dose could not be assessed as only
one study included a booster dose in the intended vaccination schedule 26. One
study suggested that a lengthy delay between the first and second doses might be
detrimental for protection against pneumonia 24; however, that conclusion was based
on a possibly post hoc division into delays of ≤90 and >90 days. A second suggested
that Hib meningitis cases may have been older than controls at receipt of the third
dose 19, but this comparison was based on only 3 fully vaccinated cases, was not

30
assessed formally, and could be affected by confounders related to risk factors for
Hib meningitis and late presentation for vaccination. Two case-control studies, both
conducted in England and Wales and sharing some cases, concluded that
vaccination with DTaP-Hib is less effective against invasive Hib disease than
vaccination with DTwP-Hib 13, 14. The limited data on vaccine failures did not suggest
an optimum time at which to administer a booster dose.
3.2. Cohort studies Eight eligible cohort studies were identified (published in 9 papers), 6 of which
estimated vaccine effectiveness against invasive Hib disease33-39 , 1 which estimated
VE against Hib meningitis only40, and the final study which estimated rate ratios for
bacteraemia/septicaemia, meningitis, viral pneumonia and bacterial pneumonia
associated with Hib vaccination.41 Three of these 8 cohort studies36, 38, 40 were
included in the recent review of Hib vaccine effectiveness from case control and
other study designs1. One study from Australia compared incidence of invasive Hib
disease in the vaccination era to the pre-vaccination era, so that child years from the
vaccination era were for vaccinees only and for the pre-vaccination era were
historical, restricted to ages when children could have been vaccinated had the
programme existed 39. One study from Chile was a standard cohort design
comparing contemporaneous cohorts of vaccinated and unvaccinated children made
possible by phased introduction of Hib vaccination to health centres in the study area 36. One study from England & Wales compared incidence among vaccinees (1992-
99) to expected incidence informed by a survey in the pre-vaccination era (1985-90) 33. Two studies from Germany employed a technique of ascertaining all invasive Hib
cases in the country during the study period, conducting a vaccine coverage
telephone survey of a random sample of all children born in Germany during the
study period and employing cohort logic in the analysis, assuming no cases in the
random sample in which the vaccine coverage survey was carried out 34, 35. One
study from South Africa (reported in two papers) from 1997-2000 compared
incidence of invasive Hib disease between vaccinated children who were part of a
trial of pneumococcal vaccine which also had some children receiving DTwP-Hib
(PRP-HbOC) and incidence in a historical cohort 37, 38. Finally, there were 2 studies
from Denmark in the 1990s to 2001 which made use of population, vaccination and

31
hospitalisation registries linked by a common unique identifier to estimate VE against
Hib meningitis and other outcomes 40, 41. The 8 cohort studies reported on use of
PRP-OMP (1 study), PRP-T (5 studies), or PRP-HbOC vaccine (3 studies); Hib was
generally administered as quadrivalent vaccine with DTP but co-administered
vaccines were not always reported (Table 3). In the 6 studies which reported co-
administration of Hib vaccine with DTP, 3 used DTwP, 2 used DTaP and in one
study both DTaP and DTwP were used at different times over the study period.
The 8 studies reported on a variety of different dosing schedules. The Australia study
did not report the intended dosing schedule 39. The study from Chile reported the
intended schedule to be 2, 4, 6 months 36. The South African study reported on an
intended schedule of 6, 10 and 14 weeks 37, 38. The study from England & Wales
reported the intended schedule to be 2, 3, 4 months 33. The two studies from
Germany reported the intended schedule to be 2, 3, 4 months with a booster at 11
months or later 34, 35 while the two studies from Denmark reported that the schedules
over the study periods were variously 5, 6, months with a booster at 15 or 16
months, changing later to a 3 dose schedule of 3, 5, and 12 months40, 41. The
German and Danish studies were the only cohort studies of schedules which include
a booster dose. However, the Danish studies cannot inform the usefulness of a
booster dose because estimates of VE are not presented separately for schedules
with and without a booster dose. None of the identified cohort studies directly
compared the effect of different vaccination schedules on VE. Further details of the
studies are provided in Appendix Table 3. Estimates of vaccine effectiveness are
given in Table 4.

32
Table 3: Summary of vaccines and schedules in cohort studies of Hib vaccine
effectiveness
Country ref
Study period
Intended schedule
Hib vaccine Other vaccines co-administered with Hib
Invasive Hib disease Australia 39
1989-1996
Not stated. PRP-OMPC, PRP-HbOCc
Not stated.
Chile 36 1992-1995
2, 4, 6 mo PRP-T DTwP (quadrivalent), OPV
England & Wales 33
1992-1999
2, 3, 4 mo PRP-T, PRP-HbOCd Monovalent or quadrivalent with DTwP
Germany 35
1998-2002
2, 3, 4 +b11 (or later) mo
Conjugate molecule not stated.
DTaP (quadrivalent) or DTaP-IPV (pentavalent)
Germany3
4 2000-2005
2, 3, 4 +b11-14 mo
PRP-T DTaP-HBV-IPV (hexavalent)e
South Africa 37, 38
1997-200038; 1998-200437
6, 10, 14 w PRP-HbOC DTwP (quadrivalent)38; DTwP, OPV and HepB on same schedule; unclear whether any administered in same syringe37
Hib meningitis +/- other outcomes Denmark40 1991-
1999
May 1993 - 31 Dec 1995: 5, 6 mo + b16 mof; 1 Jan 1996-31 Dec 1996: 5, 6 mo + b15 mo; 1 Jan 1997 onwards: 3, 5, 12 mo
PRP-T
Not stated.
Denmark41 1990-2001
June 1993-1995: 5, 6, b16 mo; 1996: 5, 6, b15 mo; 1997-2001: 3, 5, 12 mo
PRP-T
wP (1990-1996: 0.5 dose with 5 w Hib); DT-IPV (1990-1996; 5, 6, 16 mo); DTaP-IPV (1997-2001; 3, 5, 12 mo)
c PRP-OMPC was used for the primary schedule in children born after 1 Dec 1992; in catch-up campaign (children born after July 1988), non-Aboriginal children were recommended PRP-HbOC while Aboriginal children were recommended PRP-OMP d During 1992-96, PRP-T (monovalent) was the primary vaccine and PRP-HbOC was used for catch-up in children >1 of age at first vaccination; from 1996 onwards: primary vaccination was mostly with PRP-T (quadrivalent with DTwP) but PRP-HbOC was also available for primary vaccination e One of the two hexavalent vaccines in use in Germany at the time of this study was withdrawn in the EU in 2012 f Routine Hib vaccination was introduced in May 1993 "with catch-up vaccination offered to all children less than 6 years of age"

33
3.2.1. Number of doses
There are limited data from cohort studies to inform the optimal number of doses.
The Danish study published in 2004 reports VE for 1, 2 or 3 doses 40 while the
German studies present separate estimates of VE for <3 doses and 3 doses 34, 35.
The Danish study published in 2005 estimated per dose rate ratios for each of
bacteraemia/septicaemia, meningitis, viral pneumonia and bacterial pneumonia
among Hib vaccinees (using various schedules and valency of vaccines over the
study period) which could inform this review but estimates are shown only in figures 41.
34
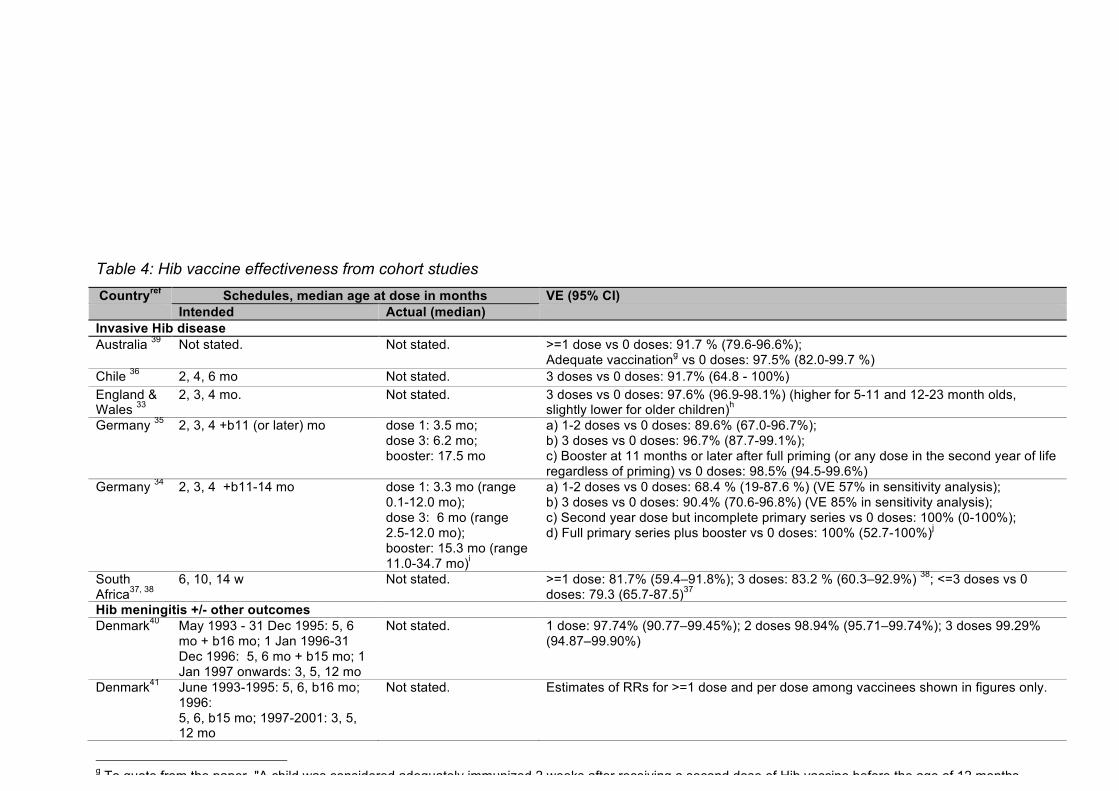
Table 4: Hib vaccine effectiveness from cohort studies Countryref Schedules, median age at dose in months VE (95% CI) Intended Actual (median) Invasive Hib disease Australia 39 Not stated. Not stated. >=1 dose vs 0 doses: 91.7 % (79.6-96.6%);
Adequate vaccinationg vs 0 doses: 97.5% (82.0-99.7 %) Chile 36 2, 4, 6 mo Not stated. 3 doses vs 0 doses: 91.7% (64.8 - 100%) England & Wales 33
2, 3, 4 mo. Not stated. 3 doses vs 0 doses: 97.6% (96.9-98.1%) (higher for 5-11 and 12-23 month olds, slightly lower for older children)h
Germany 35 2, 3, 4 +b11 (or later) mo dose 1: 3.5 mo; dose 3: 6.2 mo; booster: 17.5 mo
a) 1-2 doses vs 0 doses: 89.6% (67.0-96.7%); b) 3 doses vs 0 doses: 96.7% (87.7-99.1%); c) Booster at 11 months or later after full priming (or any dose in the second year of life regardless of priming) vs 0 doses: 98.5% (94.5-99.6%)
Germany 34 2, 3, 4 +b11-14 mo dose 1: 3.3 mo (range 0.1-12.0 mo); dose 3: 6 mo (range 2.5-12.0 mo); booster: 15.3 mo (range 11.0-34.7 mo)i
a) 1-2 doses vs 0 doses: 68.4 % (19-87.6 %) (VE 57% in sensitivity analysis); b) 3 doses vs 0 doses: 90.4% (70.6-96.8%) (VE 85% in sensitivity analysis); c) Second year dose but incomplete primary series vs 0 doses: 100% (0-100%); d) Full primary series plus booster vs 0 doses: 100% (52.7-100%)j
South Africa37, 38
6, 10, 14 w Not stated. >=1 dose: 81.7% (59.4–91.8%); 3 doses: 83.2 % (60.3–92.9%) 38; <=3 doses vs 0 doses: 79.3 (65.7-87.5)37
Hib meningitis +/- other outcomes Denmark40 May 1993 - 31 Dec 1995: 5, 6
mo + b16 mo; 1 Jan 1996-31 Dec 1996: 5, 6 mo + b15 mo; 1 Jan 1997 onwards: 3, 5, 12 mo
Not stated. 1 dose: 97.74% (90.77–99.45%); 2 doses 98.94% (95.71–99.74%); 3 doses 99.29% (94.87–99.90%)
Denmark41 June 1993-1995: 5, 6, b16 mo; 1996: 5, 6, b15 mo; 1997-2001: 3, 5, 12 mo
Not stated. Estimates of RRs for >=1 dose and per dose among vaccinees shown in figures only.
g To quote from the paper, "A child was considered adequately immunized 2 weeks after receiving a second dose of Hib vaccine before the age of 12 months or 2 weeks after receiving one dose of vaccine after the age of 12 months." h Sensitivity analysis doubling number of cases minimally affects VE estimates (overall estimate 96.4% (95.7-97.0%) i Ages at vaccination refer to coverage cohort only and are approx j Authors calculated VE assuming a doubling of the proportion unvaccinated in sub-cohort (since sub-cohort possibly overestimated vaccine coverage due to wealthier than average population): VE estimates for a) 57.0% b) 85.8% c) 100% d) 100%

35
The available evidence regarding VE against invasive Hib disease, from the Chilean,
English and German studies, suggests 3 doses provide higher protection than 1 or 2
doses, depending on the vaccine used (3-dose VE ranged from 90.4 to 97.6%; VE
for 1-2 doses ranged 68.4 to 89.6%) 34-36. The Australian study calculated VE against
invasive Hib after adequate vaccination, which they defined as “2 weeks after
receiving a second dose of Hib vaccine before the age of 12 months or 2 weeks after
receiving one dose of vaccine after the age of 12 months" and reported it to be
97.5% (82.0-99.7 %)39. This estimate cannot be directly compared to the Chilean,
English and German estimates of VE after 1-2 doses because the Australian
estimate is likely to be based on a mix of children receiving primary schedule and
catch-up vaccination (the schedule in use is not reported).
For Hib meningitis, the earlier of the two Danish studies (published in 2004 and using
data from 1991-1999), which used various schedules over the study period and
which did not specify what vaccines were used, presented dose specific VE which
suggest high VE was achieved after a single dose: VE 1 dose: 97.74% (90.77–
99.45%); 2 doses 98.94% (95.71–99.74%); 3 doses 99.29% (94.87–99.90%) 40.
Sufficient data for meta-analysis of vaccine effectiveness were identified only for
three doses against invasive Hib disease (Figure 5). The South African study
stratified VE estimates by HIV status; only the estimate for HIV-uninfected children is
included in the meta-analysis.The pooled VE estimate was 96% (95% CI 93-98%),
with moderate heterogeneity (I2 = 34.9%)

36
Figure 5: Estimates of three-dose vaccine effectiveness against invasive Hib disease
from cohort studies. Intended vaccination schedules were 6, 10, 14 weeks (South
Africa); 2, 4, 6 months (Chile); 2, 3, 4 months (UK); 2, 3, 4, 11 months (Germany).
Hib vaccine was given with DTwP in Chile, the UK and South Africa and with DTaP
in Germany
Appendix Table 4 summarises estimates of VE from cohort studies following
imprecise numbers of doses.
3.2.2. Age at initiation of Hib vaccination
There are limited data from cohort studies to inform the optimal age at which to
initiate Hib vaccination. In Denmark, the intended age at initiation of vaccination was
3 or 5 months of age, as opposed to 2 months of age in the other cohort studies
which reported the intended schedule40, 41. In the 2004 Danish study, 3-dose vs 0
dose VE for PRP-T (it is unclear what vaccines were co-administered with this)
.
3 doses
Chile (Lagos, 1996)
United Kingdom (Heath, 2000)
South Africa (Madhi, 2002)
Germany (Kalies, 2004)
Germany (Kalies, 2008)
Subtotal (I-squared = 34.9%, p = 0.189)
Study
0.08 (0.00, 0.35)
0.02 (0.02, 0.03)
0.04 (0.00, 0.26)
0.03 (0.01, 0.12)
0.10 (0.03, 0.29)
0.04 (0.02, 0.07)
ratio (95% CI)
Odds
92 (65 to 100)
98 (97 to 98)
97 (74 to 100)
97 (88 to 99)
90 (71 to 97)
effectiveness (95% CI)
Vaccine
0.08 (0.00, 0.35)
0.02 (0.02, 0.03)
0.04 (0.00, 0.26)
0.03 (0.01, 0.12)
0.10 (0.03, 0.29)
0.04 (0.02, 0.07)
ratio (95% CI)
Odds
92 (65 to 100)
98 (97 to 98)
97 (74 to 100)
97 (88 to 99)
90 (71 to 97)
effectiveness (95% CI)
Vaccine
96 (93 to 98)
1.0001 .001 .01 .1 1
Odds ratio

37
against Hib meningitis was 99.3% (94.87–99.90%) 40. In the South African study, in
which age at initiation of vaccination was intended at 6 wks, 3- dose vs 0 dose VE
against invasive Hib was estimated to be 83.2% (60.3–92.9%); there was a high
prevalence of HIV infection in the children in this study and effectiveness of 3 doses
vs none was estimated as 96.5% (74.4–99.5%) in children who were not HIV-
infected 38. The 3-dose (vs 0 dose) VEs against invasive Hib from the Chilean,
English and German studies, which all had intended age at initiation of 2 months
ranged from 90.4 to 97.6% 33-36.
3.2.3. Interval between doses
There are limited data from cohort studies to inform the optimal interval between
doses. The Chilean schedule has 2-month intervals: the VE for 3 doses vs 0 doses,
quadrivalent vaccine, was 91.7% (64.8 - 100%)36. The German, English and South
African schedules have 1-month intervals and report VE for 3 doses vs 0 doses
which ranges from 83.2% and 97.6 %33-35, 37. Since the VE estimate for a 2-month
interval is nested within the range of VE estimates for a 1-month schedule, there is
no strong evidence from cohort studies for a difference in VE according to dosing
interval.
3.2.4. Implications of a booster dose
There are data from only 2 cohort studies to inform the implications of a booster
dose on VE. Results from the German study of quadrivalent or pentavalent vaccines
are consistent with some small additional benefit of a booster dose at 11 months (or
later) to children who received all 3 doses in the primary schedule 35. VE against
invasive Hib disease comparing booster at 11 months or later after full priming (or
any dose in the second year of life regardless of priming) vs 0 doses was 98.5%
(94.5-99.6%) compared with a VE for 3 doses vs 0 doses of 96.7% (87.7-99.1%).
Results from the German study of hexavalent vaccine effectiveness are consistent
with an additional benefit of a booster dose to children who received all 3 doses in
the primary schedule: VE for the full primary series was 90.4% (70.6-96.8%),
compared to 100% (52.7-100.0%) for the primary series plus booster 34. The point
estimates from this study are also consistent with a booster compensating for an
incomplete primary series, although the confidence intervals are wide due to the
small number of cases. VE was 100% (95% CI 0 – 100%) for booster after

38
incomplete primary series vs 0 doses compared with VE of 68.4% (95% CI 19.0 –
87.6%) for incomplete primary series vs 0 doses.
3.2.5. Implications of co-administration of Hib with other vaccines
There are limited data from cohort studies to inform the implications with respect to
VE of co-administering Hib with other vaccines. Based on the Chilean, German and
South African studies, 3 doses of quadrivalent (DTwP-Hib in South Africa and Chile,
DTaP-Hib in Germany) or pentavalent (DTaP-IPV-Hib) vaccine (vs 0 doses) appear
to result in VE estimates against invasive Hib of 83% to 97%35, 36, 38 while the 3-dose
VE against invasive Hib afforded by hexavalent vaccine (DTP-IPV-HepB-Hib) (vs 0
doses) in the later German study was 90%34. These are small differences based on
small studies and therefore do not strongly indicate superiority of quadrivalent /
pentavalent over hexavalent vaccine. Comparing the VE point estimates from the
two German studies, 1-2 doses of quadrivalent/pentavalent vaccine appear more
effective (VE 89.6%, 95% CI 67.0 – 96.7%) 35 than the same number of doses of
hexavalent vaccine (VE 68.4%, 95% CI 19.0 – 87.6%) 34, though there is some
overlap in the confidence intervals for these two estimates 34, 35. The Chilean and
South African studies presented 3-dose VE against invasive Hib for Hib conjugate
vaccine co-administered with DTwP in the range of 83 to 92%36, 38. The German
studies, in which vaccines were co-administered with DTaP, reported 3-dose VEs
against invasive Hib disease of between 90 (hexavalent) and 97% (quadrivalent /
pentavalent). Since the range of VE estimates for vaccines co-administered with
DTaP overlaps the range of VE estimates for vaccines co-administered with DTwP,
there is no strong evidence from cohort studies for a difference in VE according to
whether Hib is co-adminstered with whole cell or acellular pertussis.
3.2.6. Vaccine failures
Three cohort studies included data on the time since the last vaccine dose in vaccine
failures 34, 35, 37, 38. In two of these studies (from South Africa and Germany), Hib
vaccine was given with DTwP 35, 37, 38. All children in the German study, and all but
one of the South African children not infected with HIV, developed disease within a
year of receipt of their final dose of Hib vaccine (irrespective of the total number of
doses, Appendix Figure 2). In the South African study, children infected with HIV
appeared to develop disease later than vaccine failures who were not HIV-infected,
39
e.g. four HIV-infected children developed disease ≥2 years after receiving two or
three doses 37, 38.
Amongst cohort studies in which Hib vaccine was given with DTaP 34, 35, almost all
vaccine failures occurred within two years of receipt of the last dose of vaccine
(Appendix Figure 3). Vaccine failures also occurred in two children who received two
doses of monovalent Hib vaccine (12-23 months after the second dose) and one
child who received two doses of DT-Hib (Appendix Figure 4).
The cohort study with the largest number of vaccine failures (96) did not report the
time between vaccination and disease but did present the age distribution of children
who developed invasive Hib disease after receiving three doses of Hib vaccine with
DTwP (the third dose was intended to be given at 4 months) 33. All of these children
were aged under 5 years; 37.5% were aged 12-23 months (Appendix Figure 2).
3.2.7. Potential biases in included cohort studies
The Australian study (which we draw on only in assessing optimal number of doses)
did not report the vaccines used nor the intended schedule 39. The authors did not
carry out any control for confounding. It was not clear if assessment of invasive Hib
disease was blind to exposure status. Nor was it clear if different exposure groups
had the same schedule of follow-up for invasive Hib disease. In the Chilean study,
the authors did not control for confounding 36.
In the English study, the surveillance method used to ascertain invasive Hib disease
changed in 1995: until 1995, paediatricians reported invasive Hib in vaccinees only;
from Nov 1 1995, paediatricians were asked to report all cases of invasive Hib
regardless of the vaccination status of the child 33. Thus, incidence of invasive Hib
was probably underestimated before Nov 1 1995. To determine how their results
could be affected by this, the authors reestimated 3 dose VE assuming a doubling of
the number of invasive Hib cases among those receiving 3 doses of vaccine and
found VE to be minimally affected (see footnote to Table 4).
40
In both German papers, it was unclear who was blinded to vaccination status of
cases; it appears that laboratory staff were blind but that clinicians were not (case
ascertainment was done using a combined system of hospital and laboratory
surveillance) 34, 35. An additional quality concern in the earlier of the two German
papers is that it was unclear how the vaccination status of cases was ascertained 35.
Presumably an issue in both German studies, in the later paper the authors state it
was possible the vaccine coverage of the non-cases from the telephone survey had
been overestimated due to the survey population being overrepresentative of
wealthier families34. The authors report the results of a sensitivity analysis assuming
twice as many non-cases were unvaccinated as in the main analysis; this brought
down estimates of VE for 1-2 doses vs 0 doses and 3 doses vs 0 doses (see
footnote to Table 4). If these lower estimates of VE are closer to the truth, this adds
weight to the tentative conclusions reached above that a) a booster dose of
hexavalent vaccine compensates for an incomplete primary series of hexavalent
vaccine and b) hexavalent vaccines provide lower VE than quadrivalent / pentavalent
vaccines.
In the South African study, the provenance of the unvaccinated cohort is unclear37, 38.
The authors do not state how vaccinated children were selected from the
pneumococcal vaccine trial for inclusion in the Hib vaccine cohort study. The
statistical methods used to estimate incidence were not described so that it is not
clear if or how account was taken of losses to follow-up. In addition, there was no
adjustment for confounding. The Danish studies did not report the rate of loss to
follow-up separately for vaccinees and for children in the pre-vaccination period 40, 41.
3.2.8. Conclusions from cohort studies
Cohort studies provide limited data from which to compare Hib vaccination
schedules. On number of doses, 3 doses appear to provide better protection against
invasive Hib disease than 1 or 2 doses. For Hib meningitis, evidence from 1 study
suggests high VE is achieved after 1 dose, but the authors did not state what
vaccine was in used in this study. Limited data would suggest older age at initiation
results in higher VE against invasive Hib. There is no strong evidence from cohort
studies for a difference in VE according to dosing interval.

41
Evidence from only 2 cohort studies informs the usefulness of a booster. These
studies suggest that among children receiving their full primary Hib course, there is
higher VE against invasive Hib with a booster compared to without. One of these
studies suggests in addition that a booster compensates at least to some extent for
an incomplete primary course. The optimum timing of a booster dose is not clear
from either the VE estimates or the limited data on vaccine failures.
Finally, on the question of co-administering Hib with other vaccines, we do not find
strong evidence to indicate superiority in general of quadrivalent or pentavalent over
hexavalant vaccines. Comparing estimates from 2 studies provides weak evidence
that DTaP-containing quadrivalent or pentavalent vaccines (Hib with DTaP +/- IPV)
provide higher 1-2 dose (vs 0 dose) and 3-dose (vs 0 dose) VE against invasive Hib
disease than hexavalent vaccine (which contains hepatitis B antigen in addition to
DTaP-IPV). The cohort studies identified provide no strong evidence for a difference
according to the pertussis antigen co-administered with Hib. Five of the included
cohort studies were judged to have a low risk of bias because they adjusted for
confounding33-35, 40, 41 and conducted sensitivity analyses around key potential biases
in their data sources33-35. The remaining 3 cohort studies are at least moderately
likely to be biased due to lack of control for confounding36-39. The evidence base for
optimising Hib vaccination schedules from cohort studies is limited.
3.3. Other study designs included in O’Loughlin review
Four studies included in the O’Loughlin review of Hib vaccine effectiveness under
“other” study designs appeared to estimate vaccine impact, not effectiveness 42-45. In
these studies, incidence in the vaccine era was compared to incidence in the pre-
vaccine era; incidence in the vaccine era did not take vaccine coverage into account
(i.e. child years in the vaccine era would have been a mix of children who did and
who did not receive Hib vaccination). We did not include these in our review because
vaccine effectiveness compares risk of an outcome of interest between vaccinated
and (presumed) unvaccinated children and because studies of vaccine impact are
being reviewed by others.

42
One study included in the O’Loughlin review of Hib vaccine effectiveness was
described (by the authors of the original paper) as a hamlet-randomised, controlled,
double-blind vaccine-probe study 4. This study was excluded from our review
because randomised controlled trials are the subject of another review.
3.4. Screening method studies
Three studies included in the previous review of Hib vaccine effectiveness1 used the
screening methodk to estimate vaccine effectiveness 46-48. We also identified one
further screening method study 49.
Based on the screening method, in England & Wales during 1993-2003, when the
intended schedule was 2, 3, 4 months, VE against invasive Hib disease for full
primary vaccination or a single catch-up dose at age ≥13 months was estimated to
be a low 57% (95% CI 42 to 67%), or 72% in a sensitivity analysis which assumed
that vaccination coverage in the population was 2% than reported 47. VE against
invasive Hib disease was only 49% (95% CI 32 to 64%) when vaccinees were
defined only as children who received their 3 primary doses. This study (by Ramsay
et al) 47 used the same surveillance sources for invasive Hib disease, over a similar
time period, as an earlier UK cohort study by Heath et al which we reviewed above 33. As an explanation for their low VE, Ramsay et al suggest that studies which
compare incidence among vaccinees to incidence in a historical cohort, as the Heath
paper did, will estimate the combined direct and indirect effects of vaccination (as
children in the vaccine era are afforded both direct and indirect protection while
children in the pre-vaccination era receive neither). In contrast, when VE is estimated
based on incidence in contemporaneous vaccinated and unvaccinated children, only
the direct effect is measured as all children benefit from indirect protection. The
Ramsay study included data from the period Jan 2000-Aug 2002 during which
approximately half of the Hib vaccinations given in England & Wales were co-
administered with DTaP (whereas in the rest of the study period, and in the entire
study period of the Heath paper, vaccines were either monovalent or co-
administered with DTwP). So the lower VE in the Ramsay paper may also partly
k In screening method studies, vaccine effectiveness is calculated as 1-[PCV(1-PPV)]/[(1-PCV)PPV], where PCV is the proportion of the cases who are vaccinated and PPV is the proportion of the population vaccinated (i.e., vaccine coverage)
43
reflect lower VE of Hib vaccines co-administered with acellular pertussis. In
additional analyses, Ramsay et al estimated that VE overall (full primary vaccination
plus catch up) and VE restricted to full primary vaccinees only were both higher
within two years of scheduled vaccination (66%, 95% CI 51-76%) than after two
years (37% 95% CI 3-62%). This is consistent with waning immunity, although the
CIs overlap. This Ramsay study also found that effectiveness was higher in children
vaccinated at 13 months or older (as part of the UK’s catch-up campaign) than in
those vaccinated during infancy, though this has limited relevance to routine infant
vaccination.
A German screening method study included in the previous review reported VE
against invasive Hib disease during 1998 and 1999, when the intended schedule
was DTaP-Hib or DTaP-IPV-Hib given at 2, 3 and 4 months followed by a booster at
11-15 months 48. VE estimates presented in this paper agree with the general
conclusion that 2 or 3 doses have similarly high effectiveness and that one dose has
potentially lower VE (VE estimates were 67.9% (95% CI 32.8; 84.0) for one dose,
95.4% (92.7; 97.2) for two doses and 98.9% (98.3;99.3) for three doses, compared
to 0 doses).
The third screening method study included in the previous review was from Australia
in the period 1993-1996 and presents an overall VE against invasive Hib disease of
89% (no confidence interval is given) 46. Vaccination was defined in any one of 10
ways based on vaccine used, number of doses and age at receipt and so it is not
possible to integrate this result with the rest of our review of Hib vaccine schedules.
The additional screening method study, in Spanish, which was not included in the
previous review, reported on invasive Hib disease in Valencia between Dec 1 1995
and Nov 30 1996 49. VE for ≥1 dose vs 0 dose was reported to be 91% (95% CI 28-
99%) based on two vaccinated cases (4.3% of all reported invasive Hib disease
cases) and vaccine coverage of at least one dose of 32.5%. The type(s) of Hib
vaccine in general use are not stated in the paper, but both of the vaccinated cases
had received HbOC.

44
3.5. Immunogenicity data Although we have not systematically reviewed observational data on the
immunogenicity of Hib vaccines, we present here some data relevant to schedule
decisions, related mainly to issues raised by the clinical evidence summarised
above. The studies included often summarised immunogenicity as the percentage of
vaccinated individuals whose anti-PRP antibody titre exceeded 0.15µg/ml or
1.0µg/ml, as these are often taken to be correlates of short- and long-term
protection, respectively 50.
3.5.1. Number of doses in the primary series
In a study of the immunogenicity of HbOC and PRP-D vaccines carried out in
Finland, 46 children received HbOC at ages 4 and 6 months, and 25 of these
received a booster dose at 14 months 6 (PRP-D vaccines are not considered in this
review). Blood samples were taken before each vaccination and one month after the
second and third doses, and anti-PRP antibody titres measured. There was no
increase in GMT after the first dose of HbOC (0.07µg/ml before, 0.09 µg/ml after);
after the second dose, GMT increased to 4.32µg/ml and all children had a titre
>0.15µg/ml 6. (The effects of the booster dose are described in a subsequent
section.)
In contrast, a study in the USA which used PRP-OMP vaccine did find an increase in
GMT after a single dose 7, including in those vaccinated at a similar age to, and
according to the same schedule as, the children in the Finnish HbOC study
described above 6 (Figure 6). In this study, 571 children were given two doses of
PRP-OMP two months apart; 223 of the children were aged 3-11 months at the time
of the first dose. For example, the GMT increased from 0.11 to 1.75µg/ml after a
single dose administered at the age of 2-3 months. The GMT increased further in all
age groups following the second dose, e.g. to 3.5µg/ml in those vaccinated at 2-3
months of age. The fold increases in GMT were 15-31, depending on age group after
the first dose and 2-3 after the second 7. There was little difference between age
groups in the percentage of children whose antibody titres reached 1.0µg/ml after the
first dose (76%, 75% and 72% of children aged 2-3 months, 4-5 months and 6-11

45
months at vaccination) or the second (91% of children aged <6 months and 92% of
children aged 6-11 months) 7.
Figure 6: Geometric mean anti-PRP antibody titres in children vaccinated with two
doses of PRP-OMP two months apart, beginning at different ages, in Arizona,
California, Michigan and Florida (n ≈70, 45 and 95 for the three age groups, varying
slightly between time points). Source: Shehab et al 7.
Another study, carried out in Alaska Native infants, compared three different Hib
conjugate vaccines and also found that geometric mean antibody titres were
increased after one dose of PRP-OMP intended to be given at the age of 2 months,
and increased further after a second dose intended to be given at 4 months (Figure
7) 8. However, vaccination with HbOC or PRP-T required 3 doses (intended to be
given at 2, 4 and 6 months) for a substantial rise in GMT, although the results in
Figure 7 are influenced by the timing of sample collection (samples were taken 2
months after doses 1 and 2, but 1 month after dose 3). Differences between the
types of conjugate vaccines are discussed further below.
0
1
2
3
4
5
6
7
8
Before/first/dose
Before/second/dose
1/month/after/second/dose
1/year/after/first/dose
GMT$(µg/ml)
Timing$of$blood$sample$collection
2:3/months
4:5/months
6:11/months
Age/at/initiation of/vaccination

46
Figure 7: Geometric mean anti-PRP antibody titre following vaccination of Alaska
Native infants with different Hib conjugate vaccines. Source: Bulkow et al 8.
3.5.2. Age at vaccination In the US study of PRP-OMP given in two doses two months apart 7 the GMT
following the first dose increased with age at first vaccination, being 1.75µg/ml,
1.93µg/ml and 2.56µg/ml for those aged 2-3, 4-5 and 6-11 months at vaccination,
respectively (Figure 6). The fold increase in GMT following one dose also increased
with age but was substantial in all groups, being approximately 15, 18 and 31 in the
three age groups. However, the percentage with titres ≥1.0µg/ml after the first dose
was similar in the three age groups (76%, 75% and 71%, respectively). Following the
second dose, the GMT increased 2-3 fold irrespective of age. GMTs were then
3.5µg/ml, 5.0µg/ml and 6.9µg/ml in the three age groups and the percentage with
titres ≥1.0µg/ml was 91% for those aged <6 months and 92% for those aged 6-11
months at the start of vaccination. One year after the first dose, the GMTs were
highest in those who had initiated vaccination later, but was reasonably high in all
age groups (e.g. 0.62µg/ml in those first vaccinated at 2-3 months). The percentage
of children with antibody titres ≥0.15µg/ml or ≥1.0µg/ml one year after the first dose
is not stated, but >90% of children in each age group had detectable antibody at this
time point (the lower limit of detection was 0.125µg/ml) 7.
0
2
4
6
8
10
12
14
16
Pre*vaccination After4dose41 After4dose42 After4dose43 7*104months4after4dose41
13*164months4after4dose41
GMT$(µg/ml)
Timing$of$blood$sample$collection
HbOC
PRP*OMP
PRP*T4(liquid)
PRP*T4(lyophilised)

47
3.5.3. Effect of a booster dose
A UK study recruited, through immunisation clinics, 388 children aged 6 months to 4
years who had previously received their full primary Hib vaccine series and were
given a booster dose in a catch-up campaign. Amongst these children, the GMC
before the booster decreased with time since vaccination, and thus age 51. Despite
this, the post-booster GMC increased with age at boosting: 29.87µg/ml, 68.41µg/ml
and 182.36µg/ml in each group one month after booster. All but one of the 344
participants who had a blood sample taken one month after the booster had a titre
≥0.15µg/ml one at that time, and all but three had a titre ≥1.0µg/ml.
In the Finnish study of 25 children given a primary series of HbOC at 4 and 6 months
with a booster at 14 months, the GMT immediately prior to the booster dose was
1.12µg/ml. This increased to 58.3µg/ml following the booster 6.
3.5.4. Type of conjugate vaccine The study of Alaska Native infants directly compared the immunogenicity of HbOC,
PRP-OMP, PRP-T (stratified into liquid and lyophilised formulations) and PRP-D (not
considered in this review), as children were given different vaccines depending on
changes in clinic policy over time (Figure 7) 8. PRP-OMP was intended to be given at
2 and 4 months, whilst the intended schedule for HbOC and PRP-T was 2, 4 and 6
months. The actual mean ages at receipt (considering all children, including those
given PRP-D) were 6.4 weeks for the first dose, 15.5 weeks for the second and 25.2
weeks for the third (when the third dose was given).
After 1 or 2 doses, the antibody response to PRP-OMP was greater than that to the
other vaccine types (Figure 7). However, after three doses, the GMT was highest
with HbOC, and this difference persisted up to 16 months following the initiation of
vaccination. 7-10 months after the first dose, >80% of the children in each group had
antibody titres ≥0.15µg/ml. At age 15-18 months (13-16 months after the first dose),
the percentage of children with titres ≥0.15µg/ml was substantial for all vaccines:
91% for HbOC, 71% for PRP-OMP, 86% for PRP-T (liquid) and 88% for PRP-T
(lyophilised) 8.
48
3.5.5. Co-administration with other vaccines In a further US study, 228 children received 3 doses of combined DTaP-Hib, 42
received two doses of combined vaccine and one dose of DTaP and Hib separately
(but simultaneously, at a separate site), and 50 received one dose of combined
vaccine and two doses as separate vaccines (depending on the study protocol at the
time of vaccination) 52. The schedule was 2, 4, 6 months. The GMT of anti-PRP
antibodies at age 7 months increased as the number of doses received as
combination vaccines decreased (2.68µg/ml, 3.32µg/ml and 5.25µg/ml; p<0.02). The
percentage of children with an antibody titre ≥0.15µg/ml one month after the third
dose was ≥93% in all three groups, but the percentage reaching ≥1.0µg/ml increased
as the number of doses received as combination vaccines decreased (75%, 86%
and 92% in the three groups, p<0.02). This suggests that the immunogenicity of Hib
vaccines is lower when administered in combination with DTaP than when DTaP and
Hib vaccines are given separately (this study did not assess immunogenicity of Hib-
DTwP combination vaccines). The comparisons were not adjusted for potential
confounders, but the three groups were similar with respect to age, sex and ethnicity 52.
A UK study also suggests relatively low immunogenicity of the DTaP-Hib
combination 51. In the UK, a catch-up campaign was initiated in 2003 to give a
booster dose of PRP-T to children aged 6 months to 4 years 51. A study of 388
children who had received their full primary series of three doses of Hib vaccine (of
whom 267 were aged 2-4 years and so could have received DTaP-Hib, DTwP-Hib or
a mixture of the two during their primary series) was conducted to assess the effects
of DTaP-Hib versus DTwP-Hib on antibody levels several years after vaccination and
on the response to a booster 51. In this study, the pre-booster GMC in 2-4 year olds
was lower (p<0.001) in those who had received 3 doses of DTaP-Hib for their
primary series (0.21µg/ml, 95% CI 0.16 – 0.29µg/ml) than in those who had been
vaccinated with 3 doses of DTwP-Hib (0.70µg/ml, 95% CI 0.49 – 1.00µg/ml). In
those who had received a mixture of DTaP-Hib and DTwP-Hib, the GMC was
intermediate between the two but very similar to the DTaP-Hib group (with
overlapping CIs). However, there were no differences between the groups in GMC
after the booster dose 51.

49
A similar, but separate, UK study also reported an inverse association between the
number of doses of DTaP-Hib received and anti-PRP GMC before administration of
the booster dose: the GMCs were 0.61µg/ml, 0.42µg/ml, 0.39µg/ml and 0.30µg/ml in
2-4 year olds who had received 0, 1, 2 or 3 doses of DTaP-Hib, respectively (p =
0.02) 53. In this second study, 86% of children who had received 0 or 1 doses of
DTaP-Hib had antibody titres ≥0.15µg/ml, compared to 64% of those who had
received 2 or 3 doses (p = 0.002).
3.5.6. Conclusions from immunogenicity data
PRP-OMP appears to be more immunogenic after a single dose, than the other
conjugate vaccines 8, all of which require more than one dose to elicit a strong
immune response. Antibody titres increase further after a second dose of PRP-OMP
(none of the included studies used a three-dose primary series of PRP-OMP) 7, 8.
HbOC and PRP-T seem to require two or three doses (this has varied between
studies) to stimulate a strong immune response. Three doses of HbOC appear to
elicit higher antibody levels in the long term than two doses of PRP-OMP.
Based on the results of a single study 7, GMTs (and increases following vaccination)
appear to increase with increasing age at first vaccination, although this was not
formally assessed. However, vaccinating children at 2-3 months of age resulted in a
large (15-fold) increase in GMT compared to their pre-vaccination titres.
The antibody response to a booster dose appears to be highest if given relatively
late (e.g. at the age of 2-4 years rather than 6-17 months) 51, but even early boosting
leads to antibody concentrations which are believed to be protective.
DTaP-Hib appears to be less immunogenic (with respect to the Hib component) than
either DTwP-Hib or separately administered DTaP and Hib vaccines. This does not
appear to affect the response to a single antigen Hib booster dose.

50
3.6. Effectiveness against carriage We did not systematically review studies reporting the effects of vaccination on
carriage of Hib. Nevertheless, we summarise here the results of several
observational studies of carriage, identified in the course of this review.
A case-control study conducted in three rural Alaskan villages found no evidence of
an effect of vaccination on carriage of Hib 54. Based on 16 carriers and 32 controls
(matched on age and village), 62% of carriers and 62% of controls had received at
least one dose of a Hib conjugate vaccine, implying 13% effectiveness of at least
one dose against carriage but with an extremely wide confidence interval (95% CI
-1000 to 93%). Restricting the analysis to children born after conjugate vaccine
became available in this setting, there was no evidence of an effect on carriage of
either PRP-OMP, HbOC or the time since last vaccination (<82 or �82 days, the
median value). However, the number of carriers and controls was small and the
confidence intervals wide.
A study in Turkey compared the prevalence of carriage in fully vaccinated, partially
vaccinated and unvaccinated children (the intended vaccination schedule was 2, 4, 6
and 18 months, using PRP-T) 55. 19/57 (33%) fully vaccinated children carried Hib in
the oropharynx, compared to none of 17 partially vaccinated and 46/85 (54%)
unvaccinated children. After adjusting for previous respiratory infection, having a
sibling aged <5 years, breastfeeding and recent antibiotic use, the OR comparing
unvaccinated to fully vaccinated children was 3.76 (95% CI 1.61 – 8.80). This implies
a VE of 73% (95% CI 38-89%). This estimate is not adjusted for age, time since
vaccination or socioeconomic status (although the authors state that there was no
association between carriage and parental job) 55.
A study in Native American children reported the prevalence of carriage in relation to
age and the number of doses of PRP-OMP received (intended to be given in 3 doses
at ages 2, 4 and 12-15 months) 56. Overall, 65% of carriers and 80% of non-carriers
had received at least one dose before the swab was taken; 13% of carriers and 36%
of non-carriers had received the intended number of doses for their age. The point
estimate of the prevalence of carriage was highest in unvaccinated children in all age

51
groups (Figure 8) but confidence intervals were wide (the number of carriers was
<10 in each group) and there was no apparent dose-response relationship. After
adjusting for age and the presence of a respiratory infection at the time of swabbing,
the OR comparing children who were not age-appropriately vaccinated to those who
were was 2.66 (95% CI 1.00 – 7.05, p = 0.05) 56. This implies a VE against carriage
of 62% (95% CI 0 – 86%).
Figure 8: Prevalence of oropharyngeal carriage of Hib by Native American children,
by age and number of previous doses of PRP-OMP. Error bars show 95% exact
binomial CIs (or one-sided 97.5% CIs if the point estimate is zero). Source: Takala et
al 56.
In the UK, carriage was assessed in 143 children (recruited via computerised
immunisation records) who had received three doses of Hib-containing vaccine in
relation to the number of doses given as DTaP-Hib 53. Only three carriers were
identified: one had received no doses of DTaP-Hib and two had received three
doses. These small numbers do not allow a comparison of the effects of DTaP-Hib
versus other vaccines on effectiveness against carriage.
0
5
10
15
20
25
30
35
40
45
50
3'5(n*=*479)
6'11(n*=*361)
12'14(n*=*307)
≥15(n*=*276)
Prevalen
ce)of)H
ib)carria
ge)(%
)
Age)at)swabbing) (months)
0*doses
1*dose
2*doses
3*doses
Number*of*previous*vaccinations*with PRP'OMP:

52
The studies included here which report the prevalence of carriage according to the
number of vaccine doses received did not suggest an obvious dose-response
relationship, but the number of carriers was usually small. However, these studies of
Hib vaccination indicate some reduction in carriage, perhaps with an effectiveness of
60-70%. They are thus consistent with population data showing dramatic impacts of
Hib vaccines against invasive disease in several populations.
53
4. DISCUSSION
4.1. Summary of key findings
At least two doses of Hib vaccine are needed to confer high levels of protection (with
the possible exception of the PRP-OMP vaccine, which may be effective after a
single dose). Meta-analysis of data from case-control studies using community
controls produced estimates of effectiveness after 1, 2 and 3 doses of 55% (95% CI
2-80%), 94% (95% CI 65-99%) and 94% (95% CI 18-100%), respectively, against
Hib meningitis. The corresponding estimates of VE against invasive Hib disease
were 59% (30-76%) and 99% (77-100%) for 1 and 3 doses (insufficient data were
identified to estimate two-dose VE). Based on studies which used hospital controls,
VE estimates against Hib meningitis were 53% (95% CI -14-81%), 92% (95% CI 75-
97%) and 94% (95% CI 65-99%) for one, two and three doses, respectively. Meta-
analysis of data from cohort studies gave a three-dose VE of 96% (95% CI 93-98%)
against invasive Hib disease. Although any additional benefit of three doses
compared to two may be small, in terms of protective effectiveness, other authors
have summarised arguments against recommending a two dose schedule 3: the
effectiveness of two doses may vary with vaccine type, dose-specific effectiveness
against carriage has not been assessed in detail, and a three dose schedule is
practical if Hib vaccine is administered with DTP (under current recommendations for
three primary doses of DTP) 3.
We did not identify any observational studies which directly compared different
vaccination schedules. Comparisons drawn between studies did not suggest an
optimum vaccination schedule. From the limited evidence base, it appears that Hib
vaccine administered with DTaP is less effective than Hib vaccine given with DTwP;
that older age at initiation of vaccination may slightly increase vaccine effectiveness;
that a booster dose enhances the effectiveness of vaccination and that a booster
compensates at least to some extent for an incomplete primary course. Each of
these findings is based on only one or two studies of either Hib meningitis or invasive
Hib disease, with the exception of the conclusion concerning the dosing interval (for
which the outcome of interest was radiologically confirmed pneumonia).
Immunogenicity data, although not reviewed systematically in this report, support an
increasing benefit of vaccination with an increasing number of doses. This seems to

54
be particularly important for vaccines other than PRP-OMP. Antibody titres following
vaccination appear to increase as age at vaccination increases, but responses
appear strong even at the age of 2-3 months; this is reassuring given the suggestion
that delayed administration was a risk factor for vaccine failure in one of the case-
control studies 19. Serological data also show a lower immunogenicity of DTaP-Hib
combination vaccines compared to DTwP-Hib vaccines or separately administered
DTaP and Hib vaccines.
From the evidence included in this report, the effects of vaccination on carriage of
Hib are less clear (partly due to the small number of carriers identified in the studies).
It appears that vaccination may have some effect in reducing carriage, but this
cannot be reliably quantified from the evidence included in this review.
4.2. Strengths and limitations of identified data
Although often considered inferior to data from randomised controlled trials,
observational data can provide more realistic estimates of the effects of vaccination
under field conditions. The case-control studies generally used appropriate controls
and controlled for some confounding factors in the design and / or analysis of the
study. Arguably the two most important confounders of the relationship between
vaccination status and Hib disease are age and socioeconomic status. All but one of
the case-control studies controlled for age, and most took some account of SES,
either by matching or in the analysis. Of the cohort studies, five controlled for age at
vaccination in the analysis but none controlled for SES (although one did control for
receipt of other vaccines, which might reflect SES).
There was substantial heterogeneity in the three estimates of three-dose VE against
invasive Hib disease from case-control studies (I2 = 79.8%) and moderate
heterogeneity in the five estimates of three-dose VE from cohort studies (I2 = 34.9%).
The practical implications of this statistical heterogeneity are unclear, as all of the
three-dose estimates which contributed to this pooled estimates were high (>90%).
Most of the estimates of dose-specific VE were based on only three, and all on ≤5,
studies, which limits the certainty with which conclusions can be drawn. The
screening method does not allow adjustment for confounding, so estimates from
studies using this method must also be treated cautiously.

55
An important limitation of the identified data (for clinical, carriage and immunological
outcomes) was the lack of information on the age at receipt of Hib vaccine and on
dosing intervals. We were therefore only able to compare (descriptively) the dose-
specific estimates of effectiveness under different intended schedules and could not
investigate in detail the effects of age at vaccination, or dosing interval, on
effectiveness.
Few of the included studies presented VE following a booster dose, although two
cohort studies suggested that a booster dose provided additional protection against
invasive Hib disease, compared to a three-dose primary series without booster 34, 35.
This is consistent with incidence data illustrating the impact of Hib vaccination on
invasive Hib disease in the UK 57. Hib vaccination was introduced in a 2, 3, 4 month
schedule (without a booster) in the UK and, together with a catch-up campaign,
substantially reduced disease incidence. Nine years after vaccine introduction,
incidence began to rise, leading to a booster campaign targeting children aged 6
months to 4 years. A routine booster dose at age 12 months was subsequently
introduced and the incidence of Hib disease in the UK has remained low 57.
However, other factors besides the absence of a booster dose (including the
temporary effects of the catch-up campaign and a change from DTwP-Hib to DTaP-
Hib) may have contributed to the observed increase in incidence 57. A booster dose
also appears to be important for HIV-infected children, as discussed in a recent
systematic review of Hib epidemiology and vaccination in children with HIV 58.
There were too few vaccine failures reported to support firm conclusions regarding
waning of immunity following the Hib primary series, and thus to inform the timing of
a booster. A screening study in the UK (covering periods of use of both DTaP-Hib
and DTwP-Hib) reported higher VE within two years of the intended age at the final
dose of the primary series than more than two years since vaccination 47. This
suggests that a booster may be best given within two years of the final dose of the
primary series.

56
There are several caveats to the interpretation of the immunogenicity data. Levels of
anti-PRP antibody of ≥0.15µg/ml and ≥1.0µg/ml are commonly taken to be correlates
of short- and long-term protection, respectively 50 and were used in the studies
included in this report. These values are based on studies of plain polysaccharide
vaccines; lower antibody concentrations may be adequate for protection following
vaccination with a conjugate vaccine 59. The antibody level required for protection
may also vary between populations 59. Therefore the percentage of individuals who
reach these specified antibody titres may not be equivalent to the percentage of
individuals who are protected from disease.
4.3. Strengths and limitations of review methods
This review was based on a thorough search of available literature which identified a
large number of potentially eligible studies. To manage this workload, we used a
rapid electronic screening method to identify eligible studies. This will have missed
any cohort or case-control studies which did not identify the study design in the title
or abstract, or which did not include an abstract. However, manual screening of a
10% random sample of observational studies which did not pass electronic
screening identified no additional eligible papers. Full text screening and much of the
abstract screening were done by a single reviewer; a second reviewer was consulted
when the eligibility of any study was unclear.
Many of the comparisons discussed are between studies. Possible differences in
study design and conduct, in adherence to intended vaccination schedules, and in
Hib epidemiology between settings mean that conclusions should be drawn
cautiously.
Data on vaccine failures were examined in case they provided an indication of
waning of protection over time following Hib vaccination. There are several caveats
to the use of such data in this way. Firstly, time since vaccination is confounded by
age. Secondly, the timing of disease onset in vaccinated children may simply reflect
periods of intense transmission in the community; comparable data on the timing of
disease in unvaccinated children would be needed to assess this. Thirdly,
immunisation (i.e. successful vaccination) of a proportion of the population reduces

57
the exposure of vaccinated and unvaccinated individuals to Hib; the extent of this
reduction increases with the population vaccination coverage and acts to increase
the average age at infection. Comparison of vaccine failures between settings in
which vaccine coverage may differ is therefore not straightforward. Finally, we did
not systematically identify papers which reported data on vaccine failures (e.g. case
series were not eligible for inclusion) but extracted data on vaccine failures from
those studies which met the inclusion criteria relevant to assessing VE. As discussed
above, the interpretation is further complicated by the small numbers of vaccine
failures reported in the included studies, which prevent us drawing firm conclusions
about the waning of vaccine-derived immunity and the optimum timing of a booster
dose.

58
4.4. Conclusions
The evidence summarised in this report shows that at least two doses of Hib vaccine
are required to achieve high effectiveness (e.g. >85%), particularly for vaccines other
than PRP-OMP. The evidence also indicates, albeit less strongly, that:
• A three dose primary series followed by a booster dose may confer slightly
better protection than the same primary series without a booster (based on
two cohort studies from Germany)
• A booster may also compensate for an incomplete primary series (based on
one cohort study from Germany)
• Hib vaccines administered in combination with DTaP appear to be less
effective against clinical outcomes than Hib vaccines administered with DTwP
(based on two case-control studies from the UK). This is consistent with data
suggesting lower immunogenicity of DTaP-Hib compared to DTwP-Hib
vaccines.
We note that these conclusions are tentative, being based on few studies which
often included small numbers of cases. The results of this review must be
considered together with results of trials and impact studies, as well as with
reference to programmatic considerations.
The review also highlighted several important gaps in the observational evidence
which limit the certainty with which we can draw conclusions:
• We identified no within-study comparisons of the effectiveness against clinical
outcomes of different ages at initiation of vaccination, different dosing
intervals or comparisons of schedules with and without a booster dose
• Most studies reported the intended vaccination schedule but not children’s
actual ages at vaccination

59
REFERENCES
1. O'Loughlin, R.E., et al., Methodology and measurement of the effectiveness of Haemophilus influenzae type b vaccine: systematic review. Vaccine, 2010. 28(38): p. 6128-36.
2. Theodoratou, E., et al., The effect of Haemophilus influenzae type b and pneumococcal conjugate vaccines on childhood pneumonia incidence, severe morbidity and mortality. Int J Epidemiol, 2010. 39 Suppl 1: p. i172-85.
3. Griffiths, U.K., et al., Dose-specific efficacy of Haemophilus influenzae type b conjugate vaccines: a systematic review and meta-analysis of controlled clinical trials. Epidemiol Infect, 2012. 140(8): p. 1343-55.
4. Gessner, B.D. and R.A. Adegbola, The impact of vaccines on pneumonia: key lessons from Haemophilus influenzae type b conjugate vaccines. Vaccine, 2008. 26 Suppl 2: p. B3-8.
5. Deeks, J.J., D.G. Altman, and M.J. Bradburn, Statistical methods for examining heterogeneity and combining results from several studies in meta-analysis, in Systematic reviews in healthcare: meta-analysis in context, M. Egger, G. Smith, and D.G. Altman, Editors. 2001, BMJ Books.
6. Kayhty, H., et al., Immunogenicity of Haemophilus influenzae oligosaccharide-protein and polysaccharide-protein conjugate vaccination of children at 4, 6, and 14 months of age. Pediatrics, 1989. 84(6): p. 995-9.
7. Shehab, Z.M., et al., Immunogenicity and reactogenicity of Haemophilus influenzae type b-meningococcus group B outer membrane protein conjugate vaccine in children 2-60 months of age. Scand J Infect Dis, 1991. 23(6): p. 763-9.
8. Bulkow, L.R., et al., Comparative immunogenicity of four Haemophilus influenzae type b conjugate vaccines in Alaska Native infants. Pediatr Infect Dis J, 1993. 12(6): p. 484-92.
9. Higgins, J.P., et al., Measuring inconsistency in meta-analyses. BMJ, 2003. 327(7414): p. 557-60.
10. Orenstein, W.A., et al., Field evaluation of vaccine efficacy. Bull World Health Organ, 1985. 63(6): p. 1055-68.
11. Wenger, J.D., et al., Efficacy of Haemophilus influenzae type b polysaccharide-diphtheria toxoid conjugate vaccine in US children aged 18-59 months. Haemophilus Influenzae Vaccine Efficacy Study Group. Lancet, 1991. 338(8764): p. 395-8.
12. Black, S.B., et al., Efficacy in infancy of oligosaccharide conjugate Haemophilus influenzae type b (HbOC) vaccine in a United States population of 61,080 children. The Northern California Kaiser Permanente Vaccine Study Center Pediatrics Group. Pediatr Infect Dis J, 1991. 10(2): p. 97-104.
13. McVernon, J., et al., Host and environmental factors associated with Hib in England, 1998-2002. Arch Dis Child, 2008. 93(8): p. 670-5.
14. McVernon, J., et al., Risk of vaccine failure after Haemophilus influenzae type b (Hib) combination vaccines with acellular pertussis. Lancet, 2003. 361(9368): p. 1521-3.
15. Fleming, J.A., et al., Effectiveness of haemophilus influenzae type B conjugate vaccine for prevention of meningitis in Senegal. Pediatr Infect Dis J, 2011. 30(5): p. 430-2.
16. Shapiro, E.D., Case-control studies of the effectiveness of vaccines: validity and assessment of potential bias. Pediatr Infect Dis J, 2004. 23(2): p. 127-31.
60
17. Baqui, A.H., et al., Effectiveness of Haemophilus influenzae type B conjugate vaccine on prevention of pneumonia and meningitis in Bangladeshi children: a case-control study. Pediatr Infect Dis J, 2007. 26(7): p. 565-71.
18. Daza, P., et al., The impact of routine infant immunization with Haemophilus influenzae type b conjugate vaccine in Malawi, a country with high human immunodeficiency virus prevalence. Vaccine, 2006. 24(37-39): p. 6232-9.
19. Lee, E.H., et al., Haemophilus influenzae type b conjugate vaccine is highly effective in the Ugandan routine immunization program: a case-control study. Trop Med Int Health, 2008. 13(4): p. 495-502.
20. Lewis, R.F., et al., Action for child survival: elimination of Haemophilus influenzae type b meningitis in Uganda. Bull World Health Organ, 2008. 86(4): p. 292-301.
21. Muganga, N., et al., Haemophilus influenzae type b conjugate vaccine impact against purulent meningitis in Rwanda. Vaccine, 2007. 25(39-40): p. 7001-5.
22. Lee, E.H., et al., Impact of Haemophilus influenzae type b conjugate vaccine on bacterial meningitis in the Dominican Republic. Rev Panam Salud Publica, 2008. 24(3): p. 161-8.
23. de Andrade, A.L., et al., Effectiveness of Haemophilus influenzae b conjugate vaccine on childhood pneumonia: a case-control study in Brazil. Int J Epidemiol, 2004. 33(1): p. 173-81.
24. de la Hoz, F., et al., Effectiveness of Haemophilus influenzae type b vaccination against bacterial pneumonia in Colombia. Vaccine, 2004. 23(1): p. 36-42.
25. Adegbola, R.A., et al., Elimination of Haemophilus influenzae type b (Hib) disease from The Gambia after the introduction of routine immunisation with a Hib conjugate vaccine: a prospective study. Lancet, 2005. 366(9480): p. 144-50.
26. Vadheim, C.M., et al., Protection provided by Haemophilus influenzae type b conjugate vaccines in Los Angeles County: a case-control study. Pediatr Infect Dis J, 1994. 13(4): p. 274-80.
27. Jafari, H.S., et al., Efficacy of Haemophilus influenzae type b conjugate vaccines and persistence of disease in disadvantaged populations. The Haemophilus Influenzae Study Group. Am J Public Health, 1999. 89(3): p. 364-8.
28. Harrison, L.H., et al., Postlicensure effectiveness of the Haemophilus influenzae type b polysaccharide-Neisseria meningitidis outer-membrane protein complex conjugate vaccine among Navajo children. J Pediatr, 1994. 125(4): p. 571-6.
29. Food and Drug Administration approval of use of diphtheria and tetanus toxoids and acellular pertussis vaccine. MMWR Morb Mortal Wkly Rep., 1991. 40(50): p. 881-2.
30. Loughlin, A.M., et al., Efficacy of Haemophilus influenzae type b vaccines in Massachusetts children 18 to 59 months of age. Pediatr Infect Dis J, 1992. 11(5): p. 374-9.
31. Bower, C., et al., Measuring the impact of conjugate vaccines on invasive Haemophilus influenzae type b infection in Western Australia. Aust N Z J Public Health, 1998. 22(1): p. 67-72.
32. Knuf, M., F. Kowalzik, and D. Kieninger, Comparative effects of carrier proteins on vaccine-induced immune response. Vaccine, 2011. 29(31): p. 4881-90.

61
33. Heath, P.T., et al., Antibody concentration and clinical protection after Hib conjugate vaccination in the United Kingdom. JAMA, 2000. 284(18): p. 2334-40.
34. Kalies, H., et al., Effectiveness of hexavalent vaccines against invasive Haemophilus influenzae type b disease: Germany's experience after 5 years of licensure. Vaccine, 2008. 26(20): p. 2545-52.
35. Kalies, H., et al., Four and one-half-year follow-up of the effectiveness of diphtheria-tetanus toxoids-acellular pertussis/Haemophilus influenzae type b and diphtheria-tetanus toxoids-acellular pertussis-inactivated poliovirus/H. influenzae type b combination vaccines in Germany. Pediatr Infect Dis J, 2004. 23(10): p. 944-50.
36. Lagos, R., et al., Large scale, postlicensure, selective vaccination of Chilean infants with PRP-T conjugate vaccine: practicality and effectiveness in preventing invasive Haemophilus influenzae type b infections. Pediatr Infect Dis J, 1996. 15(3): p. 216-22.
37. Madhi, S.A., et al., Immunogenicity and effectiveness of Haemophilus influenzae type b conjugate vaccine in HIV infected and uninfected African children. Vaccine, 2005. 23(48-49): p. 5517-25.
38. Madhi, S.A., et al., Reduced effectiveness of Haemophilus influenzae type b conjugate vaccine in children with a high prevalence of human immunodeficiency virus type 1 infection. Pediatr Infect Dis J, 2002. 21(4): p. 315-21.
39. Markey, P., et al., The effectiveness of Haemophilus influenzae type b conjugate vaccines in a high risk population measured using immunization register data. Epidemiol Infect, 2001. 126(1): p. 31-6.
40. Hviid, A. and M. Melbye, Impact of routine vaccination with a conjugate Haemophilus influenzae type b vaccine. Vaccine, 2004. 22(3-4): p. 378-82.
41. Hviid, A., et al., Childhood vaccination and nontargeted infectious disease hospitalization. JAMA, 2005. 294(6): p. 699-705.
42. Cowgill, K.D., et al., Effectiveness of Haemophilus influenzae type b Conjugate vaccine introduction into routine childhood immunization in Kenya. JAMA, 2006. 296(6): p. 671-8.
43. Dagan, R., et al., Effectiveness of a nationwide infant immunization program against Haemophilus influenzae b. The Israeli Pediatric Bacteremia and Meningitis Group. Vaccine, 1999. 17(2): p. 134-41.
44. Diez-Domingo, J., et al., Impact of non-routine vaccination on the incidence of invasive Haemophilus influenzae type b (Hib) disease: experience in the autonomous region of Valencia, Spain. J Infect, 2001. 42(4): p. 257-60.
45. van Alphen, L., et al., Effect of nationwide vaccination of 3-month-old infants in The Netherlands with conjugate Haemophilus influenzae type b vaccine: high efficacy and lack of herd immunity. J Pediatr, 1997. 131(6): p. 869-73.
46. Herceg, A., The decline of Haemophilus influenzae type b disease in Australia. Commun Dis Intell, 1997. 21(13): p. 173-6.
47. Ramsay, M.E., et al., Estimating Haemophilus influenzae type b vaccine effectiveness in England and Wales by use of the screening method. J Infect Dis, 2003. 188(4): p. 481-5.
48. Schmitt, H.J., et al., Haemophilus influenzae type b disease: impact and effectiveness of diphtheria-tetanus toxoids-acellular pertussis (-inactivated poliovirus)/H. influenzae type b combination vaccines. Pediatr Infect Dis J, 2001. 20(8): p. 767-74.

62
49. Morant Gimeno, A., et al., [Vaccination against Haemophilus influenzae type b in the Valencia Community: efficacy and failure of vaccinations]. An Esp Pediatr, 1998. 48(4): p. 352-4.
50. Kayhty, H., et al., The protective level of serum antibodies to the capsular polysaccharide of Haemophilus influenzae type b. J Infect Dis, 1983. 147(6): p. 1100.
51. Southern, J., et al., Immunogenicity of a fourth dose of Haemophilus influenzae type b (Hib) conjugate vaccine and antibody persistence in young children from the United Kingdom who were primed with acellular or whole-cell pertussis component-containing Hib combinations in infancy. Clin Vaccine Immunol, 2007. 14(10): p. 1328-33.
52. Daum, R.S., et al., Magnitude of interference after diphtheria-tetanus toxoids-acellular pertussis/Haemophilus influenzae type b capsular polysaccharide-tetanus vaccination is related to the number of doses administered. J Infect Dis, 2001. 184(10): p. 1293-9.
53. Johnson, N.G., et al., Haemophilus influenzae type b reemergence after combination immunization. Emerg Infect Dis, 2006. 12(6): p. 937-41.
54. Baggett, H.C., et al., Immunologic response to Haemophilus influenzae type b (Hib) conjugate vaccine and risk factors for carriage among Hib carriers and noncarriers in Southwestern Alaska. Clin Vaccine Immunol, 2006. 13(6): p. 620-6.
55. Arvas, A., et al., Haemophilus influenzae type b antibodies in vaccinated and non-vaccinated children. Pediatr Int, 2008. 50(4): p. 469-73.
56. Takala, A.K., et al., Vaccination with Haemophilus influenzae type b meningococcal protein conjugate vaccine reduces oropharyngeal carriage of Haemophilus influenzae type b among American Indian children. Pediatr Infect Dis J, 1993. 12(7): p. 593-9.
57. Ladhani, S.N., Two decades of experience with the Haemophilus influenzae serotype b conjugate vaccine in the United Kingdom. Clin Ther, 2012. 34(2): p. 385-99.
58. Mangtani, P., et al., Haemophilus influenzae type b disease in HIV-infected children: a review of the disease epidemiology and effectiveness of Hib conjugate vaccines. Vaccine., 2010. 28(7): p. 1677-83. doi: 10.1016/j.vaccine.2009.12.011. Epub 2009 Dec 22.
59. Kayhty, H., Difficulties in establishing a serological correlate of protection after immunization with Haemophilus influenzae conjugate vaccines. Biologicals, 1994. 22(4): p. 397-402.
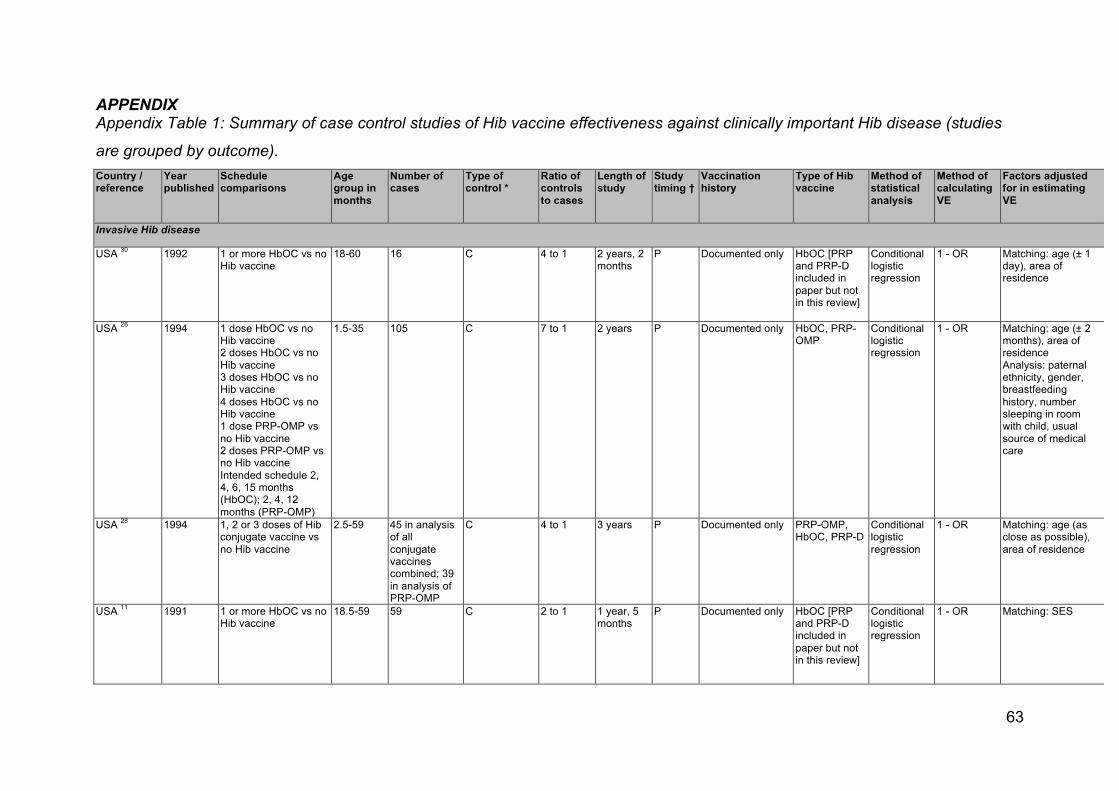
63
APPENDIX Appendix Table 1: Summary of case control studies of Hib vaccine effectiveness against clinically important Hib disease (studies
are grouped by outcome). Country / reference
Year published
Schedule comparisons
Age group in months
Number of cases
Type of control *
Ratio of controls to cases
Length of study
Study timing †
Vaccination history
Type of Hib vaccine
Method of statistical analysis
Method of calculating VE
Factors adjusted for in estimating VE
Invasive Hib disease
USA 30 1992 1 or more HbOC vs no Hib vaccine
18-60 16 C 4 to 1 2 years, 2 months
P Documented only HbOC [PRP and PRP-D included in paper but not in this review]
Conditional logistic regression
1 - OR Matching: age (± 1 day), area of residence
USA 26 1994 1 dose HbOC vs no Hib vaccine 2 doses HbOC vs no Hib vaccine 3 doses HbOC vs no Hib vaccine 4 doses HbOC vs no Hib vaccine 1 dose PRP-OMP vs no Hib vaccine 2 doses PRP-OMP vs no Hib vaccine Intended schedule 2, 4, 6, 15 months (HbOC); 2, 4, 12 months (PRP-OMP)
1.5-35 105 C 7 to 1 2 years P Documented only HbOC, PRP-OMP
Conditional logistic regression
1 - OR Matching: age (± 2 months), area of residence Analysis: paternal ethnicity, gender, breastfeeding history, number sleeping in room with child, usual source of medical care
USA 28 1994 1, 2 or 3 doses of Hib conjugate vaccine vs no Hib vaccine
2.5-59 45 in analysis of all conjugate vaccines combined; 39 in analysis of PRP-OMP
C 4 to 1 3 years P Documented only PRP-OMP, HbOC, PRP-D
Conditional logistic regression
1 - OR Matching: age (as close as possible), area of residence
USA 11 1991 1 or more HbOC vs no Hib vaccine
18.5-59 59 C 2 to 1 1 year, 5 months
P Documented only HbOC [PRP and PRP-D included in paper but not in this review]
Conditional logistic regression
1 - OR Matching: SES

64
Country / reference
Year published
Schedule comparisons
Age group in months
Number of cases
Type of control *
Ratio of controls to cases
Length of study
Study timing †
Vaccination history
Type of Hib vaccine
Method of statistical analysis
Method of calculating VE
Factors adjusted for in estimating VE
USA 27 1999 1, 2, 2 or more, 3, and 3 or more doses of Hib conjugate vaccines vs no Hib vaccine Intended schedule 2, 4, 6 months
2-18 57 C 3 to 1 3 years 6 months
P Documented only HbOC (1 case received PRP-OMP and 1 control a vaccine other than HbOC but the type is not stated)
Conditional logistic regression
1 - OR Matching: age (as close as possible), county of birth Analysis: single mother, household crowding
USA 12 1991 3 doses of HbOC (intended schedule 2, 4, 6 months, mean ages at receipt 2.6, 4.9 and 7.2 months) vs no Hib vaccine
1.5 - 12 25 total; 13 included in matched analysis
C ≥7 to 1 2 years, 5 months
P Documented only HbOC Conditional logistic regression
1 - OR Matching: month of birth, sex, zip code Analysis: daycare attendance, ethnicity, family income
USA 16 2004 1 or more doses vs no Hib vaccine. Intended schedule not stated.
≥18 months
29 total; unclear how many received PRP vaccine so are not included in the analysis of conjugate vaccine.
C 4:1 3 years P Documented only Not stated Conditional logistic regression
1 - OR Matching: age (±2 days), town of birth
The Gambia 25
2005 1, 2 or 3 doses vs no Hib vaccine Intended schedule 2, 3, 4 months but often given later
<72 46 C 10 to 1 4 years 8 months
P Documented only PRP-T Conditional logistic regression
Not stated Matching: age (± 2 weeks), area of residence
England & Wales 13
2008 Any Hib vaccine vs no Hib vaccine; 3 doses of Hib-containing vaccine with 0, 1, 2 or 3 administered as DTaP-Hib. Intended schedule 2, 3, 4 months
<51 138 (any Hib vaccine vs none) 95 (doses of DTaP-Hib)
C 5 to 1 5 years R Parental report Not stated Conditional logistic regression
Not presented
Matching: age (same DOB), region
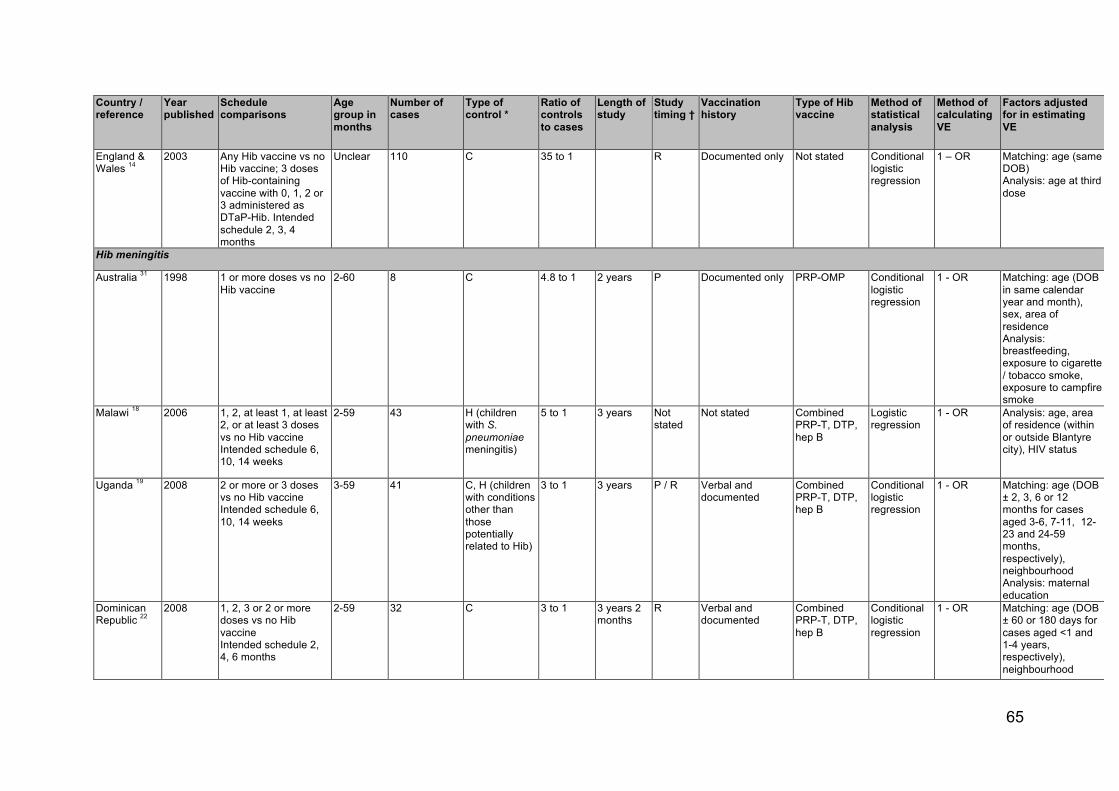
65
Country / reference
Year published
Schedule comparisons
Age group in months
Number of cases
Type of control *
Ratio of controls to cases
Length of study
Study timing †
Vaccination history
Type of Hib vaccine
Method of statistical analysis
Method of calculating VE
Factors adjusted for in estimating VE
England & Wales 14
2003 Any Hib vaccine vs no Hib vaccine; 3 doses of Hib-containing vaccine with 0, 1, 2 or 3 administered as DTaP-Hib. Intended schedule 2, 3, 4 months
Unclear 110 C 35 to 1 R Documented only Not stated Conditional logistic regression
1 – OR Matching: age (same DOB) Analysis: age at third dose
Hib meningitis
Australia 31 1998 1 or more doses vs no Hib vaccine
2-60 8 C 4.8 to 1 2 years P Documented only PRP-OMP Conditional logistic regression
1 - OR Matching: age (DOB in same calendar year and month), sex, area of residence Analysis: breastfeeding, exposure to cigarette / tobacco smoke, exposure to campfire smoke
Malawi 18 2006 1, 2, at least 1, at least 2, or at least 3 doses vs no Hib vaccine Intended schedule 6, 10, 14 weeks
2-59 43 H (children with S. pneumoniae meningitis)
5 to 1 3 years Not stated
Not stated Combined PRP-T, DTP, hep B
Logistic regression
1 - OR Analysis: age, area of residence (within or outside Blantyre city), HIV status
Uganda 19 2008 2 or more or 3 doses vs no Hib vaccine Intended schedule 6, 10, 14 weeks
3-59 41 C, H (children with conditions other than those potentially related to Hib)
3 to 1 3 years P / R Verbal and documented
Combined PRP-T, DTP, hep B
Conditional logistic regression
1 - OR Matching: age (DOB ± 2, 3, 6 or 12 months for cases aged 3-6, 7-11, 12-23 and 24-59 months, respectively), neighbourhood Analysis: maternal education
Dominican Republic 22
2008 1, 2, 3 or 2 or more doses vs no Hib vaccine Intended schedule 2, 4, 6 months
2-59 32 C 3 to 1 3 years 2 months
R Verbal and documented
Combined PRP-T, DTP, hep B
Conditional logistic regression
1 - OR Matching: age (DOB ± 60 or 180 days for cases aged <1 and 1-4 years, respectively), neighbourhood

66
Country / reference
Year published
Schedule comparisons
Age group in months
Number of cases
Type of control *
Ratio of controls to cases
Length of study
Study timing †
Vaccination history
Type of Hib vaccine
Method of statistical analysis
Method of calculating VE
Factors adjusted for in estimating VE
Uganda 20 2008 1, 2, 3 or 2 or more doses vs no Hib vaccine
0-59 Not stated H (children with S. pneumoniae meningitis)
Not stated 6 years Unclear Verbal and documented
Combined PRP-T, DTP, hep B
Logistic regression
1 - OR Analysis: age
Bangladesh 17
2007 1 or more, 2 or more or 3 doses vs no Hib vaccine Intended schedule 6, 10, 14 weeks
3-23 15 C, H (children with conditions other than pneumonia or meningitis)
Community: 4 to 1 Hospital: 2 to 1
3 years, 3 months
P Documented only Combined PRP-T DPT
Conditional logistic regression
Unclear Matching (community controls only): age (DOB ± 1 month), sex, season, distance from hospital Analysis: age, number of doses; household income
The Gambia 25
2005 1, 2 or 3 doses vs no Hib vaccine Intended schedule 2, 3, 4 months but often given later
<72 36 C 10 to 1 4 years 8 months
P Documented only PRP-T Conditional logistic regression
Not stated (presumably 1 - OR)
Matching: age (DOB ± 2 weeks), area of residence Analysis: unspecified covariates (data were collected on distance from health centre, overcrowding, mother's education)
Senegal 15 2011 1 or more or 2 or more doses vs no Hib vaccine. Intended schedule 6, 10, 14 weeks.
1.5-12 24 C 4 to 1 3 years 5 months
P Verbal and documented
Combined PRP-T or HbOC, DTP, hep B
Not stated 1 - OR Matching: age (± 28 days), neighbourhood Analysis: maternal education, number of children aged <5 years living in household
Purulent meningitis
Rwanda 21 2007 2 or 3 doses vs no Hib vaccine Intended schedule 6, 10, 14 weeks
0-59 45 H (children with <20 WBC per ml CSF, non-turbid and negative for Hib)
1.5 to 1 4 years 6 months
R Not stated Combined PRP-T, DTP, hepatitis B
Not stated 1 - OR None stated

67
Country / reference
Year published
Schedule comparisons
Age group in months
Number of cases
Type of control *
Ratio of controls to cases
Length of study
Study timing †
Vaccination history
Type of Hib vaccine
Method of statistical analysis
Method of calculating VE
Factors adjusted for in estimating VE
Uganda 20 2008 1, 2, 3 or 2 or more doses vs no Hib vaccine
0-59 Not stated H (children with <20 WBC per microlitre CSF, of unknown cause)
Not stated 6 years Unclear Verbal and documented
Combined PRP-T, DTP, hep B
Logistic regression
1 - OR Analysis: age
Bangladesh 17
2007 1 or more, 2 or more or 3 doses vs no Hib vaccine Intended schedule 6, 10, 14 weeks
3-23 41 C, H (children with conditions other than pneumonia or meningitis)
Community: 4 to 1 Hospital: 2 to 1
3 years, 3 months
P Documented only Combined PRP-T DPT
Conditional logistic regression
Unclear Matching (community controls only): age (DOB ± 1 month), sex, season, distance from hospital Analysis: age, number of doses; household income
Aetiology negative meningitis
Uganda 20 2008 1, 2, 3 or 2 or more doses vs no Hib vaccine
0-59 Not stated H (children with <20 WBC per microlitre CSF, of unknown cause)
Not stated 6 years Unclear Verbal and documented
Combined PRP-T, DTP, hep B
Logistic regression
1 - OR Analysis: age
Rwanda 21 2007 2 or 3 doses vs no Hib vaccine Intended schedule 6, 10, 14 weeks
0-59 13 H (children with S. pneumoniae meningitis)
1.5 to 1 4 years 6 months
R Not stated Combined PRP-T, DTP, hepatitis B
Not stated 1 - OR None stated
Radiologically confirmed pneumonia
Brazil 23 2004 2 or 3 doses (or 1 at age >12 months) vs 0 or 1 (at age <12 months) doses Intended schedule 2, 4, 6 months
2-24 427 C 2 to 1 1 year, 4 months
P Documented only HbOC Conditional logistic regression
1 - OR Matching: age (±4 months), neighbourhood Analysis: age, sex, daycare attendance, previous flu-like illness, smokers at home, home ownership, mother's education

68
Country / reference
Year published
Schedule comparisons
Age group in months
Number of cases
Type of control *
Ratio of controls to cases
Length of study
Study timing †
Vaccination history
Type of Hib vaccine
Method of statistical analysis
Method of calculating VE
Factors adjusted for in estimating VE
Colombia 24 2004 1, 2 or 3 doses vs no Hib vaccine Intended schedule 2, 4, 6 months
2-24 389 C 2 to 1 2 years, 7 months
P Documented only PRP-T Conditional logistic regression
1 - OR Matching: age (±1 month), sex, area of residence, SES Analysis: maternal education, maternal smoking, number of smokers in household, daycare attendance, cooking in the sleeping room, underlying illness, previous hospitalisation, crowding
Bangladesh 17
2007 1 or more, 2 or more or 3 doses vs no Hib vaccine Intended schedule 6, 10, 14 weeks
3-23 343 C, H (children with conditions other than pneumonia and meningitis)
Community: 4 to 1 Hospital: 2 to 1
3 years, 3 months
P Documented only Combined PRP-T DPT
Conditional logistic regression
Unclear Matching (community controls only): age (DOB ±1 month), sex, season, distance from hospital Analysis: age, number of doses; household income
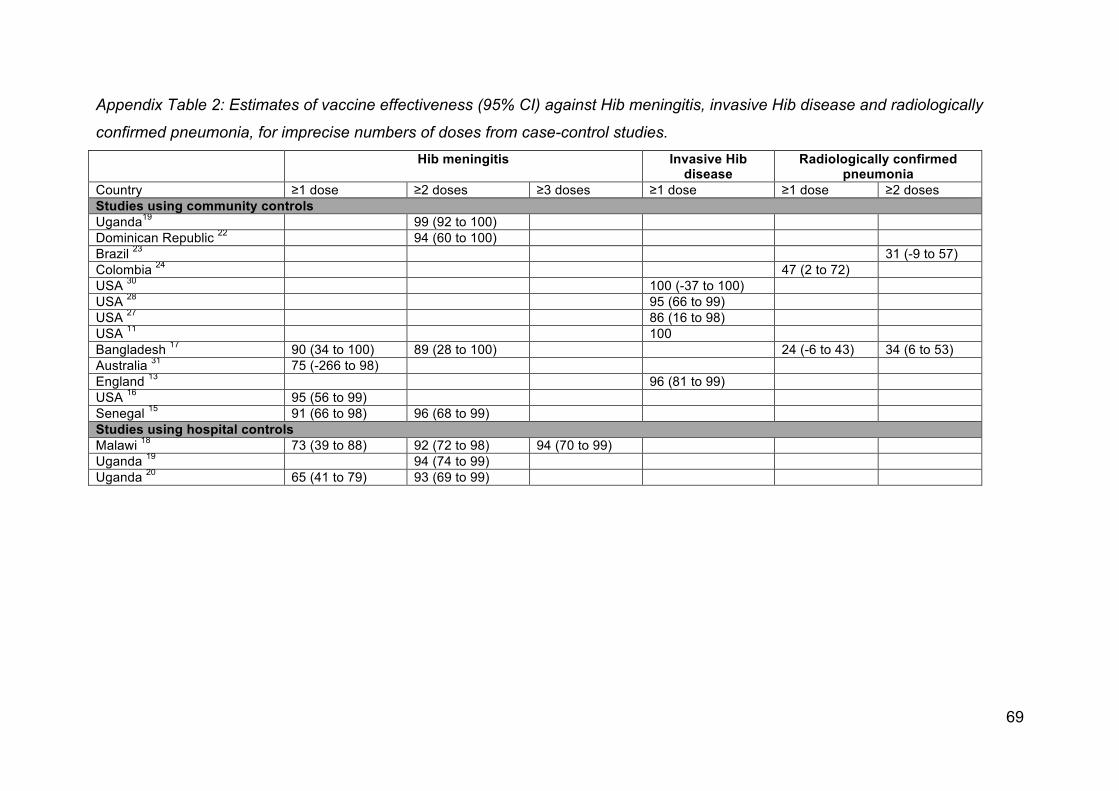
69
Appendix Table 2: Estimates of vaccine effectiveness (95% CI) against Hib meningitis, invasive Hib disease and radiologically
confirmed pneumonia, for imprecise numbers of doses from case-control studies. Hib meningitis Invasive Hib
disease Radiologically confirmed
pneumonia Country ≥1 dose ≥2 doses ≥3 doses ≥1 dose ≥1 dose ≥2 doses Studies using community controls Uganda19 99 (92 to 100) Dominican Republic 22 94 (60 to 100) Brazil 23 31 (-9 to 57) Colombia 24 47 (2 to 72) USA 30 100 (-37 to 100) USA 28 95 (66 to 99) USA 27 86 (16 to 98) USA 11 100 Bangladesh 17 90 (34 to 100) 89 (28 to 100) 24 (-6 to 43) 34 (6 to 53) Australia 31 75 (-266 to 98) England 13 96 (81 to 99) USA 16 95 (56 to 99) Senegal 15 91 (66 to 98) 96 (68 to 99) Studies using hospital controls Malawi 18 73 (39 to 88) 92 (72 to 98) 94 (70 to 99) Uganda 19 94 (74 to 99) Uganda 20 65 (41 to 79) 93 (69 to 99)

70
Appendix Table 3: Further details of cohort studies of Hib vaccine effectiveness against invasive Hib disease Country ref Number of
participants Method of
ascertainment of exposure
Assessment of clinical outcomes Method of statistical analysis
Factors adjusted for
Main quality concerns
Invasive Hib disease
Australia 39 Pre-vaccination era: 70254 to 72786 child-years under 5; Vaccination era, >=1 dose: 29546 to 41175 child-years under 5
Immunization register 1989 - Nov 1994: retrospective ascertainment from hospital laboratories and infection control records in five main towns in region; Dec 1994 - 1996: notifiable disease (via laboratories)
Rate ratio comparing incidence in those receiving vaccine (or in those adequately vaccinated) to pre-vaccination era incidence in children who would have received vaccine/been adequately vaccinated had the programme existed
None. No control for confounding. Not clear if assessment of clinical outcome was blind to exposure status. Not clear if different exposure groups had the same schedule of follow-up for outcome.
Chile 36 3 doses of DTP-Hib: 35 264; 3 doses of DTP only: 36 741
EPI clinic databases Passive surveillance, of laboratory reports from 11 hospitals in study region which would admit pediatric patients, to identify Hib cases among study participants in 17 months following last vaccine administered as part of this studyl
Rate ratio comparing incidence in vaccinated to unvaccinated cohort
None. No control for confounding.
England & Wales33
Estimated 4,368,200 children received 3 doses during study period
From child's GP or district child health immunization computer
Active surveillance of pediatricians, ?passive surveillance of microbiologists and consultants in communicable disease control (Oct 1, 1992-Oct 31 1995 - Hib conjugate vaccinees only; from Nov 1 1995 - all cases regardless of vaccination status) for outcome in children under 5 years of age
Incidence among vaccineesm (1992-1999) compared with expected incidence informed by survey in pre-vaccination era (1985-1990)
Age (stratification) Surveillance method for outcome changed in 1995 (to 1995, invasive Hib reported for vaccinees only; from Nov 1 1995, all cases of invasive Hib reported regardless of vaccination status) thus probably underestimated incidence before Nov 1 1995 (authors conducted sensitivity analysis).
Germany 35 Cases: 36; Non-cases: 667n
Cases: unclear.; Non-cases: Parents read from vaccination booklet during phone survey.
Nationwide passive hospital and laboratory surveillance for outcomes in children under 10 years of age
Multivariable Cox regression. Non-cases contribute follow-up time from birth or the start of surveillance period (whichever later). Cases contribute to the analysis cross-sectionally, on date of positive Hib culture, only.o
Age at vaccination; changing immunisation status of each non-case over-time
Blinding - lab staff apparently blind to vaccination status of cases, clinicians apparently not. Unclear how vaccination status of cases was ascertained
l The exposures assessed in this study (DTP-Hib vs DTP alone) were given between 1 Nov 1992 and 31 Oct 1993. Surveillance for invasive disease occurred between 1 Nov 1992 and 30 Apr 1995 m Follow-up time for non-cases in the vaccine era estimated using vaccine coverage figures and national birth and death rates n Cases are all those in Germany between Jan 1998 and Jun 2002, identified through nationwide surveillance, and non-cases are a random sample ("sub-cohort") of all children born in Germany between 1 Jun, 1996 and 31 Dec, 1998 (the sub-cohort was assumed to contain no cases) o Reference for method of statistical analysis: Moulton LH et al AJE 1995; 142 (9): 1000-1006.

71
Country ref Number of participants
Method of ascertainment of
exposure
Assessment of clinical outcomes Method of statistical analysis
Factors adjusted for
Main quality concerns
Invasive Hib disease
Germany 34 Cases: 32; Non-cases: 2893p
Cases: vaccination booklets or vaccinating paediatricians.; Non-cases: Parents read from vaccination booklet during phone survey.
Hospital / laboratory surveillance (presumably in children under 10 years of age, as for 35, but not stated)
Multivariable Cox regression. Non-cases contribute follow-up time from birth or the start of surveillance period (whichever later). Cases contribute to the analysis cross-sectionally, on date of positive Hib culture, only.o
Age at vaccination; changing immunisation status of each non-case over-time
Blinding - lab staff apparently blind to vaccination status of cases, clinicians apparently not. Possible overestimate of vaccination coverage from telephone survey due to survey population being overrepresentative of wealthier.
South Africa37, 38
Vaccinated cohort: 19 267; Unvaccinated cohort: approx. 22000
Not stated, but presumably trial records (this study nested within Phase III trial of 9-valent pneumococcal vaccine)
"Daily laboratory surveillance of culture-confirmed invasive Hib disease was undertaken from January, 1997. There was active case detection during prospective studies evaluating invasive bacterial disease in children between March, 1997, and September,2000" in children under 1 year of age
Risk ratio comparing incidence in vaccinated to unvaccinated cohortq
None. Provenance of unvaccinated cohort is unclear. Unclear how vaccinated children were selected from trial for inclusion in cohort study. Unclear what statistical methods used to estimate incidence; not clear how/if losses to follow-up were accounted for. No adjustment for confounding.
Hib meningitis +/- other outcomes
Denmark40 All children in Denmark who were liveborn between 1 June 1987 and 31 December 1998 (542,100 children)
Immunization register National Hospital Discharge Registry. All hospitalisations for children up to age 9 years between 1 Jan 1991 and 31 Dec 1999 were extracted
Log-linear multivariable Poisson regression to estimate rate ratio for association of outcome with 1, 2 or 3 doses of vaccine, relative to rate of outcome in pre-vaccination period
Ager Rate of loss to follow-up not reported by exposure group.
Denmark41 Unvaccinated: 922480 child years under 5; At least one dose: 1977983 child years under 5
Immunization register Linkage of information in hospitalization register to immunization register (exposure status) and population register for children under 5 years of age
Log-linear multivariable Poisson regression to estimate rate ratio for association of outcomes with >=1 Hib dose of Hib and per dose among vaccineess
Age, calendar period, and receipt of other vaccines; age and calendar period interaction.t
Rate of loss to follow-up not reported by outcome. Estimates of vaccine effectiveness give in figures only.
p Cases are all those in Germany between Aug 2000 and Dec 2004, identified through nationwide surveillance, and non-cases are a random sample ("sub-cohort") of all children born in Germany between 1 Aug, 2000 and 31 Dec, 2004 (the sub-cohort was assumed to contain no cases) q The calculation of the risk ratio for at least one dose was restricted to children <1; the unvaccinated cohort was restricted to children 6 weeks or older. The calculation of the risk ratio for fully vaccinated included children between 4.1 and 12.0 months of age in the unvaccinated cohort and all cases occurring at least 14 days after having received the third dose of Hib conjugate vaccine in the vaccinated cohort. r The authors checked and there was no evidence for confounding by birth weight, birth method, gestational age, season, birth order or gender. s This study was mainly about adverse effects of vaccines so the authors also presented associations with vaccination 14 d to 3 mo after receipt of any dose and greater than 3 mo after receipt of any dose. t The authors report no confounding by sex, place of birth, birth weight, mother’s country of birth, mother’s age at birth, birth order, or season.

72
Appendix Table 4: Estimates of vaccine effectiveness (95% CI) against invasive Hib disease for imprecise numbers of doses, from
cohort studies
Country ≥1 dose 1-2 doses ≤2 doses ≤3 doses Australia* 39 92 (80 to 97) Germany 35 90 (67 to 97) Germany 34 68 (19 to 88) South Africa 37, 38 82 (59 to 92)†
79 (66 to 88)‡ 79 (66 to 88)
* ≥2 doses before the age of 12 months, or ≥1 dose after the age of 12 months. † At age <1 year ‡ At age <2 year
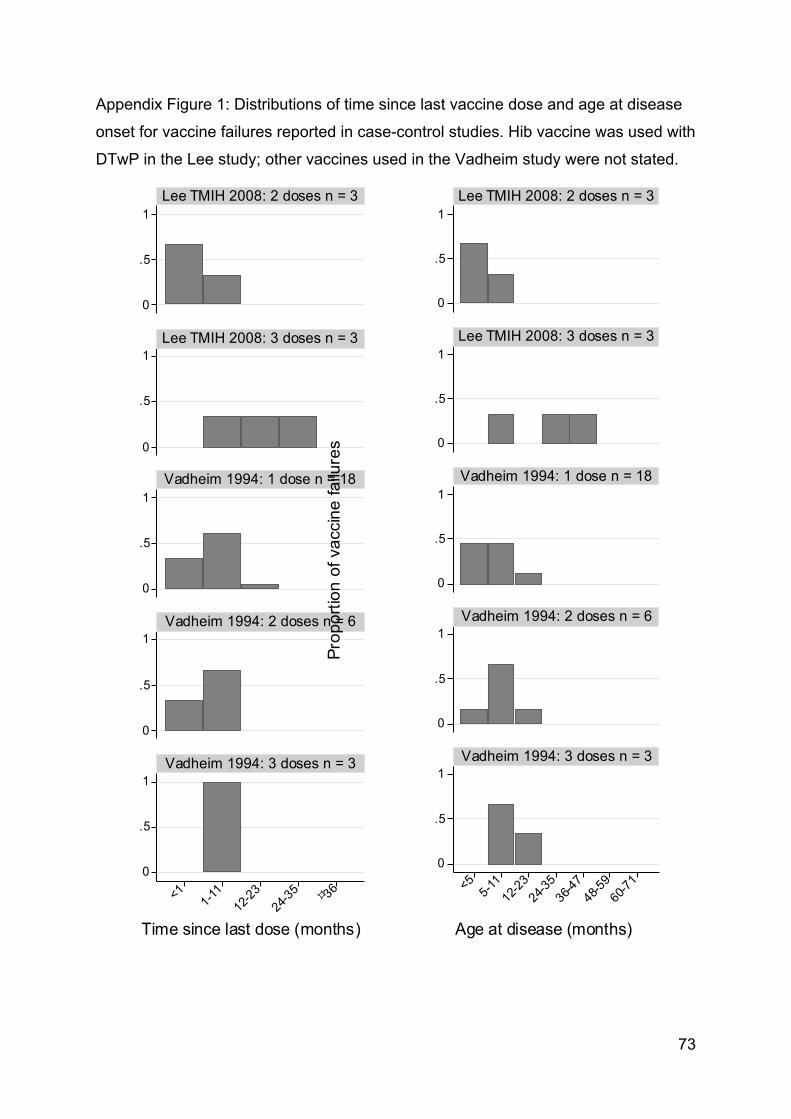
73
Appendix Figure 1: Distributions of time since last vaccine dose and age at disease
onset for vaccine failures reported in case-control studies. Hib vaccine was used with
DTwP in the Lee study; other vaccines used in the Vadheim study were not stated.
0
.5
1
0
.5
1
0
.5
1
0
.5
1
0
.5
1
<1 1-11
12-23
24-35 !36
Lee TMIH 2008: 2 doses n = 3
Lee TMIH 2008: 3 doses n = 3
Vadheim 1994: 1 dose n = 18
Vadheim 1994: 2 doses n = 6
Vadheim 1994: 3 doses n = 3
Prop
ortio
n of
vac
cine
failu
res
Time since last dose (months)
0
.5
1
0
.5
1
0
.5
1
0
.5
1
0
.5
1
<5 5-11
12-23
24-35
36-47
48-59
60-71
Lee TMIH 2008: 2 doses n = 3
Lee TMIH 2008: 3 doses n = 3
Vadheim 1994: 1 dose n = 18
Vadheim 1994: 2 doses n = 6
Vadheim 1994: 3 doses n = 3
Prop
ortio
n of
vac
cine
failu
res
Age at disease (months)
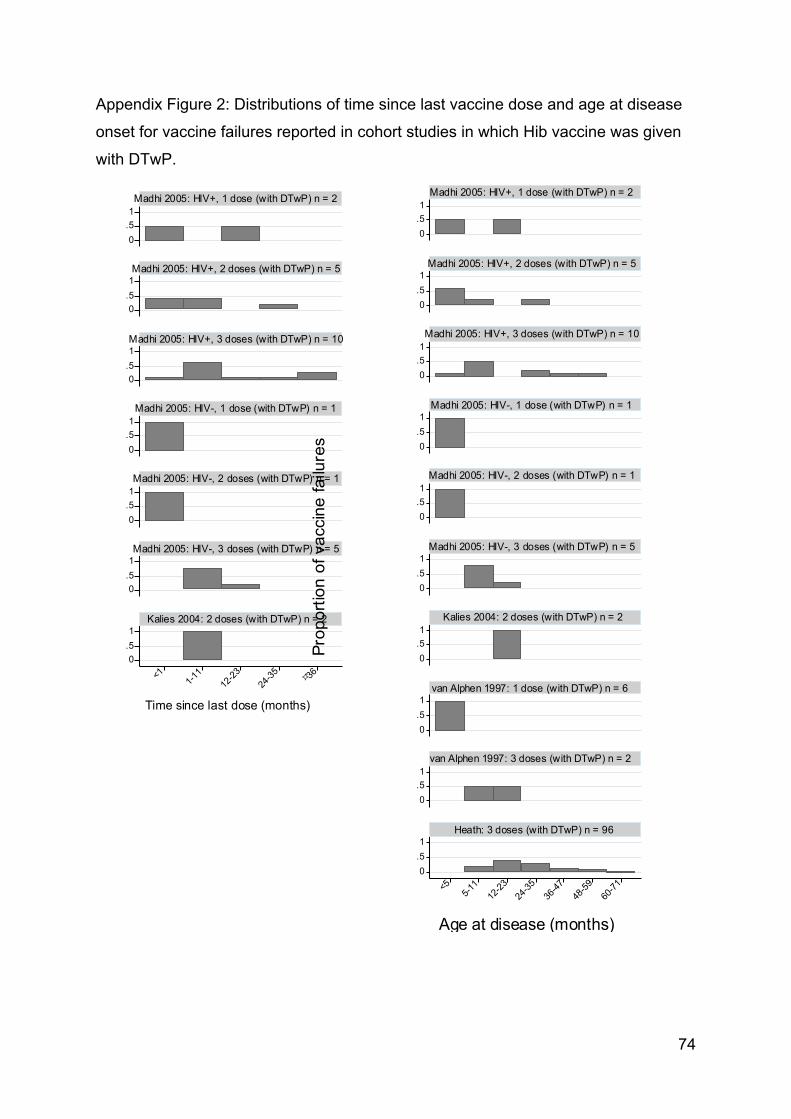
74
Appendix Figure 2: Distributions of time since last vaccine dose and age at disease
onset for vaccine failures reported in cohort studies in which Hib vaccine was given
with DTwP.
0.51
0.51
0.51
0.51
0.51
0.51
0.51
<11-1
112
-2324
-35 !36
Madhi 2005: HIV+, 1 dose (with DTwP) n = 2
Madhi 2005: HIV+, 2 doses (with DTwP) n = 5
Madhi 2005: HIV+, 3 doses (with DTwP) n = 10
Madhi 2005: HIV-, 1 dose (with DTwP) n = 1
Madhi 2005: HIV-, 2 doses (with DTwP) n = 1
Madhi 2005: HIV-, 3 doses (with DTwP) n = 5
Kalies 2004: 2 doses (with DTwP) n = 2
Pro
port
ion
of v
acci
ne fa
ilure
s
Time since last dose (months)
0.51
0.51
0.51
0.51
0.51
0.51
0.51
0.51
0.51
0.51
<55-1
112
-2324
-3536
-4748
-5960
-71
Madhi 2005: HIV+, 1 dose (with DTwP) n = 2
Madhi 2005: HIV+, 2 doses (with DTwP) n = 5
Madhi 2005: HIV+, 3 doses (with DTwP) n = 10
Madhi 2005: HIV-, 1 dose (with DTwP) n = 1
Madhi 2005: HIV-, 2 doses (with DTwP) n = 1
Madhi 2005: HIV-, 3 doses (with DTwP) n = 5
Kalies 2004: 2 doses (with DTwP) n = 2
van Alphen 1997: 1 dose (with DTwP) n = 6
van Alphen 1997: 3 doses (with DTwP) n = 2
Heath: 3 doses (with DTwP) n = 96
Prop
ortio
n of
vac
cine
failu
res
Age at disease (months)

75
Appendix Figure 3: Distributions of time since last vaccine dose and age at disease
onset for vaccine failures reported in cohort studies in which Hib vaccine was given
with DTaP.
0.51
0.51
0.51
0.51
0.51
0.51
0.51
<1 1-11
12-2
324
-35
!36
Kalies 2004: 1 dose(with DTaP, +/- IPV) n = 1
Kalies 2004: 2 doses(with DTaP, +/- IPV) n = 3
Kalies 2004: 3 doses(with DTaP, +/- IPV) n = 3
Kalies 2004: 4 doses(with DTaP, +/- IPV) n = 4
Kalies 2008: 1 dose(hexavalent - DTaP) n = 4
Kalies 2008: 2 doses(hexavalent - DTaP) n = 2
Kalies 2008: 3 doses(hexavalent - DTaP) n = 5
Pro
port
ion
of v
acci
ne fa
ilure
s
Time since last dose (months)
0.51
0.51
0.51
0.51
0.51
0.51
0.51
<5 5-11
12-2
324
-35
36-4
748
-59
60-7
1
Kalies 2004: 1 dose(with DTaP, +/- IPV) n = 1
Kalies 2004: 2 doses(with DTaP, +/- IPV) n = 3
Kalies 2004: 3 doses(with DTaP, +/- IPV) n = 3
Kalies 2004: 4 doses(with DTaP, +/- IPV) n = 4
Kalies 2008: 1 dose(hexavalent - DTaP) n = 4
Kalies 2008: 2 doses(hexavalent - DTaP) n = 2
Kalies 2008: 3 doses(hexavalent - DTaP) n = 5
Pro
port
ion
of v
acci
ne fa
ilure
s
Age at disease (months)

76
Appendix Figure 4: Distributions of time since last vaccine dose and age at disease
onset for vaccine failures reported in cohort studies in which Hib vaccine was given
alone or with pertussis vaccines other than DTwP or DTaP.
0
.5
1
0
.5
1
<11-
1112
-2324
-35 !36
Kalies 2004: 2 doses(monovalent) n = 2
Kalies 2004: 2 doses(with DT) n = 1
Pro
port
ion
of v
acci
ne fa
ilure
s
Time since last dose (months)
0
.5
1
0
.5
1
<55-
1112
-2324
-3536
-4748
-5960
-71
Kalies 2004: 2 doses(monovalent) n = 2
Kalies 2004: 2 doses(with DT) n = 1
Pro
port
ion
of v
acci
ne fa
ilure
s
Age at disease (months)


![Haemophilus Influenzae Y Otros Haemophilus Spp Exposicion [Modo De Compatibilidad]](https://static.fdocuments.net/doc/165x107/556b06f7d8b42ae47d8b4721/haemophilus-influenzae-y-otros-haemophilus-spp-exposicion-modo-de-compatibilidad.jpg)