Systematic gene silencing in Nicotiana benthamiana plants ...n.ethz.ch/~nielssi/download/4....
11
Systematic gene silencing in Nicotiana benthamiana plants Molecular analysis of transgenic Nicotiana benthamiana plants after systemic gene silencing (B, K) Authors: Niels Sievertsen, [email protected] Stefan Zeyen, [email protected] Connie M¨ uller, [email protected] Melanie Weis, [email protected] Assistant: Yvonne Steinbach, [email protected] 06. June 2013 1 Objective The goal of the two experiments was to study systemic gene silencing using RNAi and to use laboratory techniques such as polymerase chain reaction and gel electrophoresis to analyse the effect of gene silencing. 1
Transcript of Systematic gene silencing in Nicotiana benthamiana plants ...n.ethz.ch/~nielssi/download/4....
Systematic gene silencing in Nicotianabenthamiana plants
Molecular analysis of transgenic Nicotianabenthamiana plants after systemic gene
silencing
(B, K)Authors:
Niels Sievertsen, [email protected] Zeyen, [email protected]
Connie Muller, [email protected] Weis, [email protected]
Assistant:Yvonne Steinbach, [email protected]
06. June 2013
1 Objective
The goal of the two experiments was to study systemic gene silencing usingRNAi and to use laboratory techniques such as polymerase chain reactionand gel electrophoresis to analyse the effect of gene silencing.
1
2 INTRODUCTION
2 Introduction
2.1 B - Systematic gene silencing in Nicotiana ben-thamiana plants
In this experiment siRNA was locally expressed in plants to silence the phy-togene desaturase gene (PDS) and a gene coding for a green fluorescentprotein expressing gene (GFP). To silence a gene, one can either preventits transcription or silence its mRNA after transcription. To silence RNA,small other RNA molecules (siRNA or miRNA) are used to regulate geneexpression between the transcriptional and the translational steps of biosyn-thesis. The effectors influence the chromatin structure or the the stability ofthe RNA. The effectors for RNA silencing are small double stranded RNAmolecules. They are processed from large precursors. The precursors can begenerated in different ways. Either by expression of RNA capable to formdouble strands, by performing intramolecular base pairing (hairpin RNA) orby simultaneous expression of sense and anti-sense RNA. Often, such RNAmolecules exist in viruses. One of these strands directs a silencing Complexto the targeted sequence (RNA or DNA). siRNA is often created during RNAdegradation and initiates self-enhanced and self-maintained mechanisms likethe mobility of siRNA between cells and thereby within a plant via plasmod-esmata (systemic effects). To locally generate siRNA, leaves of Nicotianabenthamiana were incubated with the bacteria Agrobacterium tumefaciens.Agrobacterium tumefaciens is able to transfer a piece of a plasmid (T-DNA)into plant cells and is popular in transgenic plant experiments. To silencethe PDS gene, an Agro-TRV-PDS and an Agro-gffg bacterial strain wereused.. They contained a plasmid containing genes either against the PDS orthe GFP gene. This kind of treatment leads to a post-transcriptional genesilencing of the corresponding gene in the host.
2.2 K - Molecular analysis of transgenic Nicotiana ben-thamiana plants after systemic gene silencing
The purpose of this experiment was to detect the trans gene GFP in Nico-tiana benthamiana plants using polymerase chain reaction (PCR) and thenperforming a gel electrophoresis. The PCR starts by multiplying the DNAfrom N. benthamiana by incubating it with a DNA polymerase in a buffer.In this buffer, there are short DNA sequences (primers) which are comple-
2
3 METHODS
mentary to specific regions of the substrate. Next, there are three differenttemperatures used for the three steps of a PCR cycle: denaturation, hy-bridization and elongation. In the denaturation, the solution is heated upto 99◦C, so that the DNA strands separate. The separation is due to thefact, that at this high temperature the hydrogen bonds which keep the twoantiparallel DNA strands together, break apart. The hybridization consistsof the binding of specific primers flanking to the GFP sequence. That oc-curs only at lower temperatures (55◦C). The hydrogen bond forming that isnecessary for base pairing can only occur at such lower temperatures. Theprimers are present in excess, so the probability of primer binding is muchhigher and the overall yield of PCR is maximized. In the elongation phase,the DNA polymerase binds to the primer and starts synthesizing the comple-mentary strand. The optimal temperature for this step is about 72◦C for thepolymerase used (Taq polymerase). This cycle is repeated several times with2n copies of DNA after n cycles. To measure gene expression, the mRNA isfirst transcribed into its complementary cDNA by a reverse transcriptase. Ifthe PCR is stopped during its exponential amplification phase, the amountof cDNA is roughly proportional to the initial amount of mRNA present inthe cells. If the PCR runs to long, a saturation effect sets in and all signalswill appear the same. The strength of the signal can then be used as anapproximation for the initial expression strength. In our experiment the ex-pression of a TCTP gene serves as an internal standard, and the expressionof the PDS gene is observed with and without a siRNA against that gene.
3 Methods
3.1 B - Systematic gene silencing in Nicotiana ben-thamiana plants
The two different strains of Agrobacterium tumefaciens (Agro-TRV-PDS andAgro-gffg) were grown in LB medium over night. 25 ml of this suspensionwere centrifuged at 5000 g for 10 minutes at room temperature. The super-natant was then discarded into a beaker containing corrosive bleach. Thedeposit was than resuspended in MgCl2 Buffer (10 mM , 10 ml). A part ofthis solution was then diluted 1:10 (100 µl solution in 1 ml MgCl2). Theoptical density (at 600 nm) of this diluted solution was measured and theremaining cell suspension diluted with the MgCl2 buffer to an optical den-
3
3.1 B - Systematic gene silencing in Nicotiana benthamiana plants3 METHODS
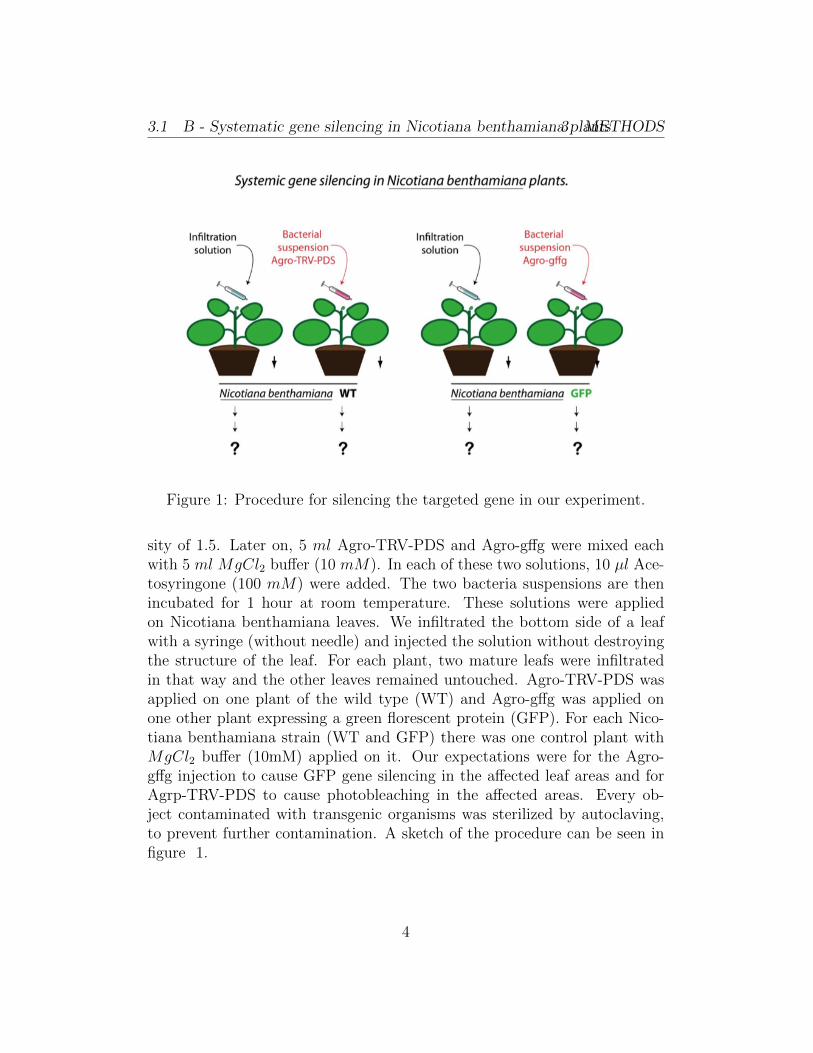
Figure 1: Procedure for silencing the targeted gene in our experiment.
sity of 1.5. Later on, 5 ml Agro-TRV-PDS and Agro-gffg were mixed eachwith 5 ml MgCl2 buffer (10 mM). In each of these two solutions, 10 µl Ace-tosyringone (100 mM) were added. The two bacteria suspensions are thenincubated for 1 hour at room temperature. These solutions were appliedon Nicotiana benthamiana leaves. We infiltrated the bottom side of a leafwith a syringe (without needle) and injected the solution without destroyingthe structure of the leaf. For each plant, two mature leafs were infiltratedin that way and the other leaves remained untouched. Agro-TRV-PDS wasapplied on one plant of the wild type (WT) and Agro-gffg was applied onone other plant expressing a green florescent protein (GFP). For each Nico-tiana benthamiana strain (WT and GFP) there was one control plant withMgCl2 buffer (10mM) applied on it. Our expectations were for the Agro-gffg injection to cause GFP gene silencing in the affected leaf areas and forAgrp-TRV-PDS to cause photobleaching in the affected areas. Every ob-ject contaminated with transgenic organisms was sterilized by autoclaving,to prevent further contamination. A sketch of the procedure can be seen infigure 1.
4
3.2 K - Molecular analysis of transgenic Nicotiana benthamiana plantsafter systemic gene silencing 3 METHODS
3.2 K - Molecular analysis of transgenic Nicotiana ben-thamiana plants after systemic gene silencing
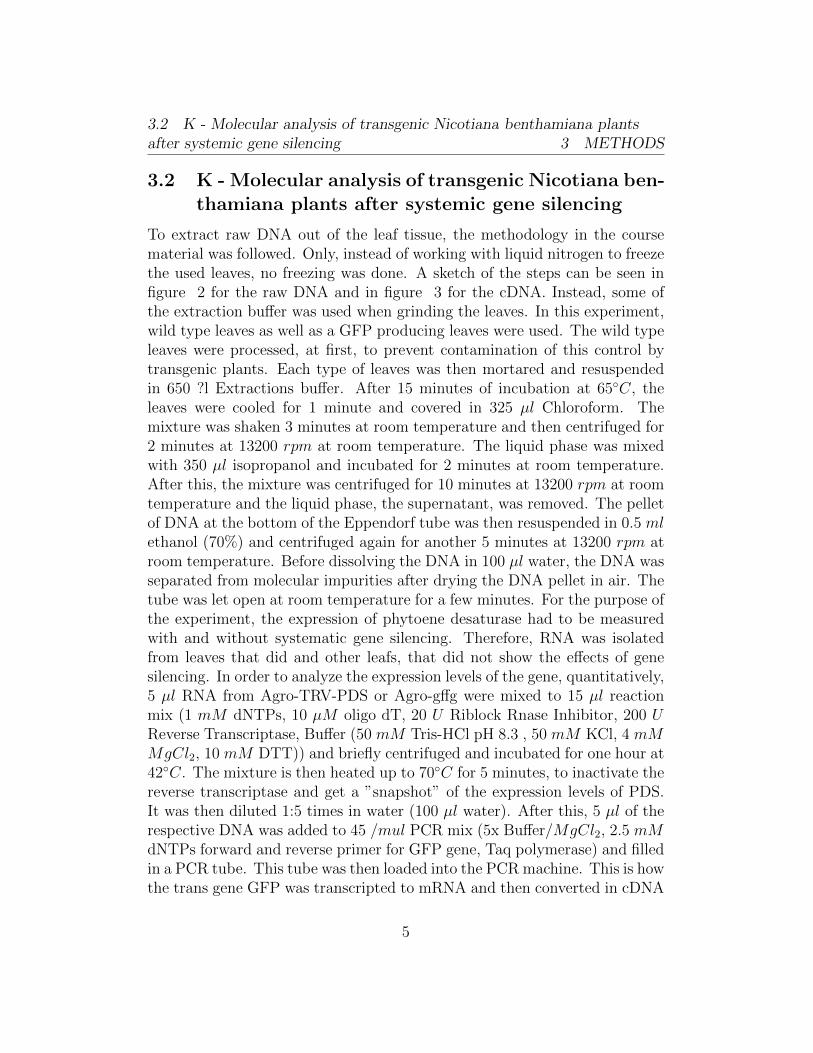
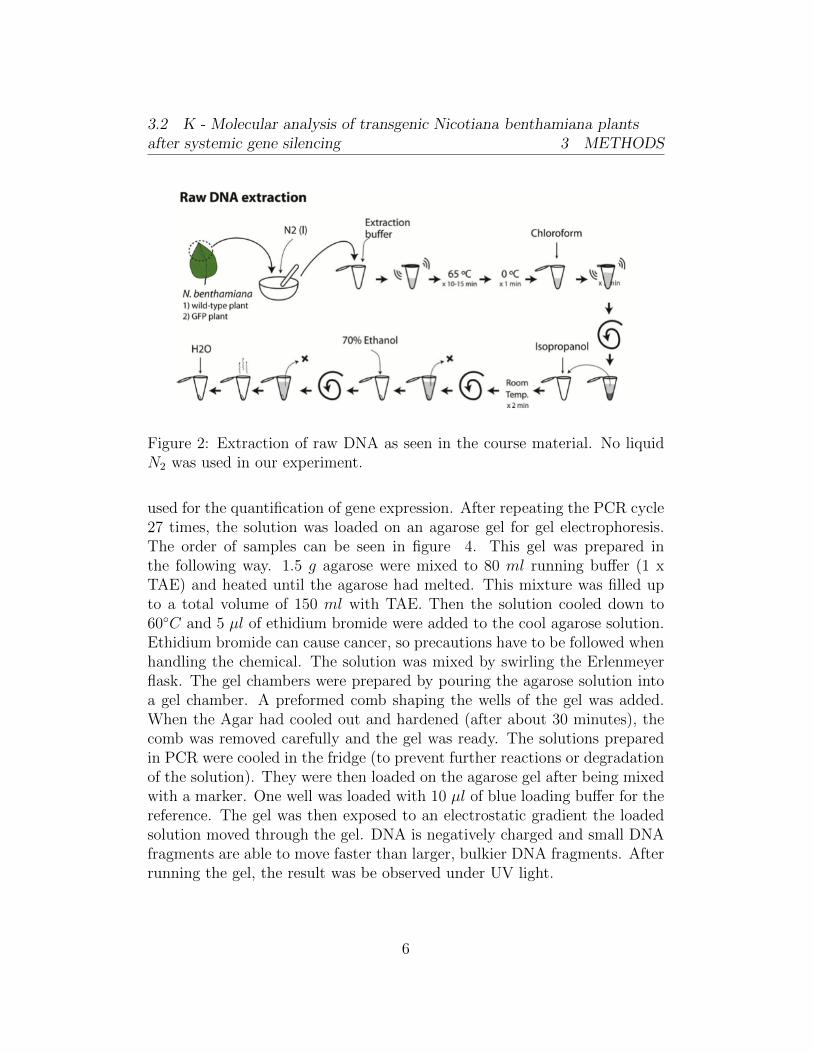
To extract raw DNA out of the leaf tissue, the methodology in the coursematerial was followed. Only, instead of working with liquid nitrogen to freezethe used leaves, no freezing was done. A sketch of the steps can be seen infigure 2 for the raw DNA and in figure 3 for the cDNA. Instead, some ofthe extraction buffer was used when grinding the leaves. In this experiment,wild type leaves as well as a GFP producing leaves were used. The wild typeleaves were processed, at first, to prevent contamination of this control bytransgenic plants. Each type of leaves was then mortared and resuspendedin 650 ?l Extractions buffer. After 15 minutes of incubation at 65◦C, theleaves were cooled for 1 minute and covered in 325 µl Chloroform. Themixture was shaken 3 minutes at room temperature and then centrifuged for2 minutes at 13200 rpm at room temperature. The liquid phase was mixedwith 350 µl isopropanol and incubated for 2 minutes at room temperature.After this, the mixture was centrifuged for 10 minutes at 13200 rpm at roomtemperature and the liquid phase, the supernatant, was removed. The pelletof DNA at the bottom of the Eppendorf tube was then resuspended in 0.5 mlethanol (70%) and centrifuged again for another 5 minutes at 13200 rpm atroom temperature. Before dissolving the DNA in 100 µl water, the DNA wasseparated from molecular impurities after drying the DNA pellet in air. Thetube was let open at room temperature for a few minutes. For the purpose ofthe experiment, the expression of phytoene desaturase had to be measuredwith and without systematic gene silencing. Therefore, RNA was isolatedfrom leaves that did and other leafs, that did not show the effects of genesilencing. In order to analyze the expression levels of the gene, quantitatively,5 µl RNA from Agro-TRV-PDS or Agro-gffg were mixed to 15 µl reactionmix (1 mM dNTPs, 10 µM oligo dT, 20 U Riblock Rnase Inhibitor, 200 UReverse Transcriptase, Buffer (50 mM Tris-HCl pH 8.3 , 50 mM KCl, 4 mMMgCl2, 10 mM DTT)) and briefly centrifuged and incubated for one hour at42◦C. The mixture is then heated up to 70◦C for 5 minutes, to inactivate thereverse transcriptase and get a ”snapshot” of the expression levels of PDS.It was then diluted 1:5 times in water (100 µl water). After this, 5 µl of therespective DNA was added to 45 /mul PCR mix (5x Buffer/MgCl2, 2.5 mMdNTPs forward and reverse primer for GFP gene, Taq polymerase) and filledin a PCR tube. This tube was then loaded into the PCR machine. This is howthe trans gene GFP was transcripted to mRNA and then converted in cDNA
5
3.2 K - Molecular analysis of transgenic Nicotiana benthamiana plantsafter systemic gene silencing 3 METHODS
Figure 2: Extraction of raw DNA as seen in the course material. No liquidN2 was used in our experiment.
used for the quantification of gene expression. After repeating the PCR cycle27 times, the solution was loaded on an agarose gel for gel electrophoresis.The order of samples can be seen in figure 4. This gel was prepared inthe following way. 1.5 g agarose were mixed to 80 ml running buffer (1 xTAE) and heated until the agarose had melted. This mixture was filled upto a total volume of 150 ml with TAE. Then the solution cooled down to60◦C and 5 µl of ethidium bromide were added to the cool agarose solution.Ethidium bromide can cause cancer, so precautions have to be followed whenhandling the chemical. The solution was mixed by swirling the Erlenmeyerflask. The gel chambers were prepared by pouring the agarose solution intoa gel chamber. A preformed comb shaping the wells of the gel was added.When the Agar had cooled out and hardened (after about 30 minutes), thecomb was removed carefully and the gel was ready. The solutions preparedin PCR were cooled in the fridge (to prevent further reactions or degradationof the solution). They were then loaded on the agarose gel after being mixedwith a marker. One well was loaded with 10 µl of blue loading buffer for thereference. The gel was then exposed to an electrostatic gradient the loadedsolution moved through the gel. DNA is negatively charged and small DNAfragments are able to move faster than larger, bulkier DNA fragments. Afterrunning the gel, the result was be observed under UV light.
6
3.2 K - Molecular analysis of transgenic Nicotiana benthamiana plantsafter systemic gene silencing 3 METHODS
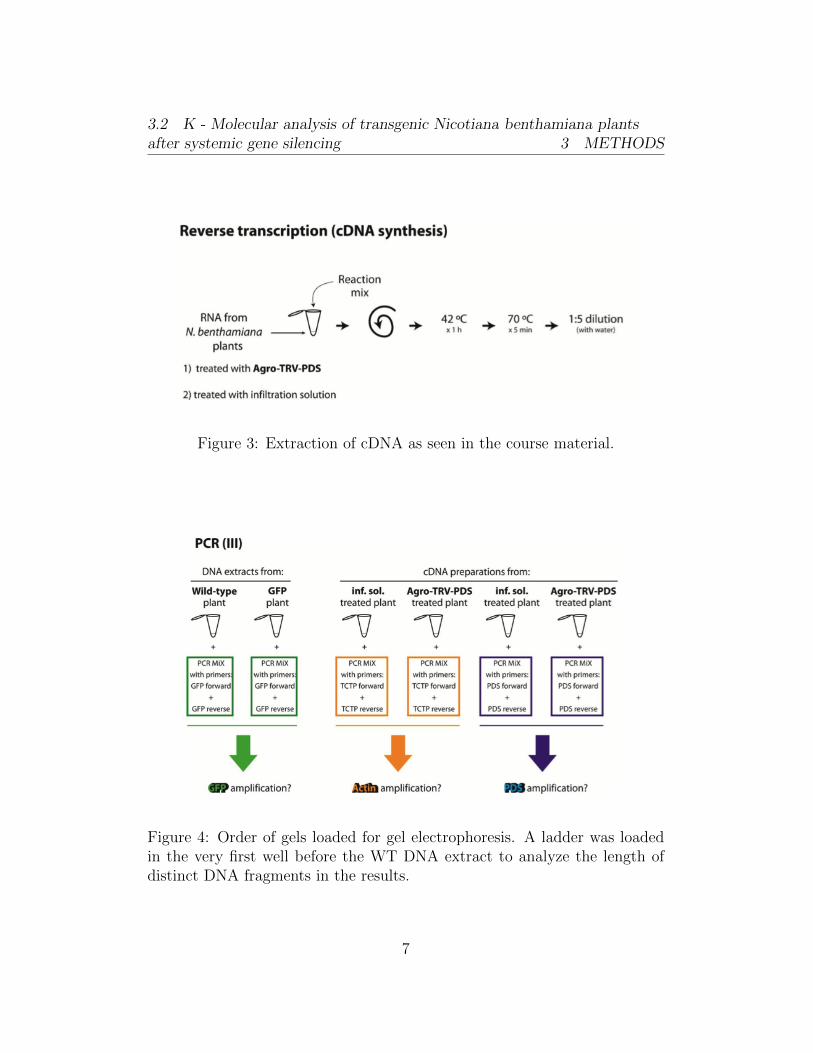
Figure 3: Extraction of cDNA as seen in the course material.
Figure 4: Order of gels loaded for gel electrophoresis. A ladder was loadedin the very first well before the WT DNA extract to analyze the length ofdistinct DNA fragments in the results.
7
4 RESULTS
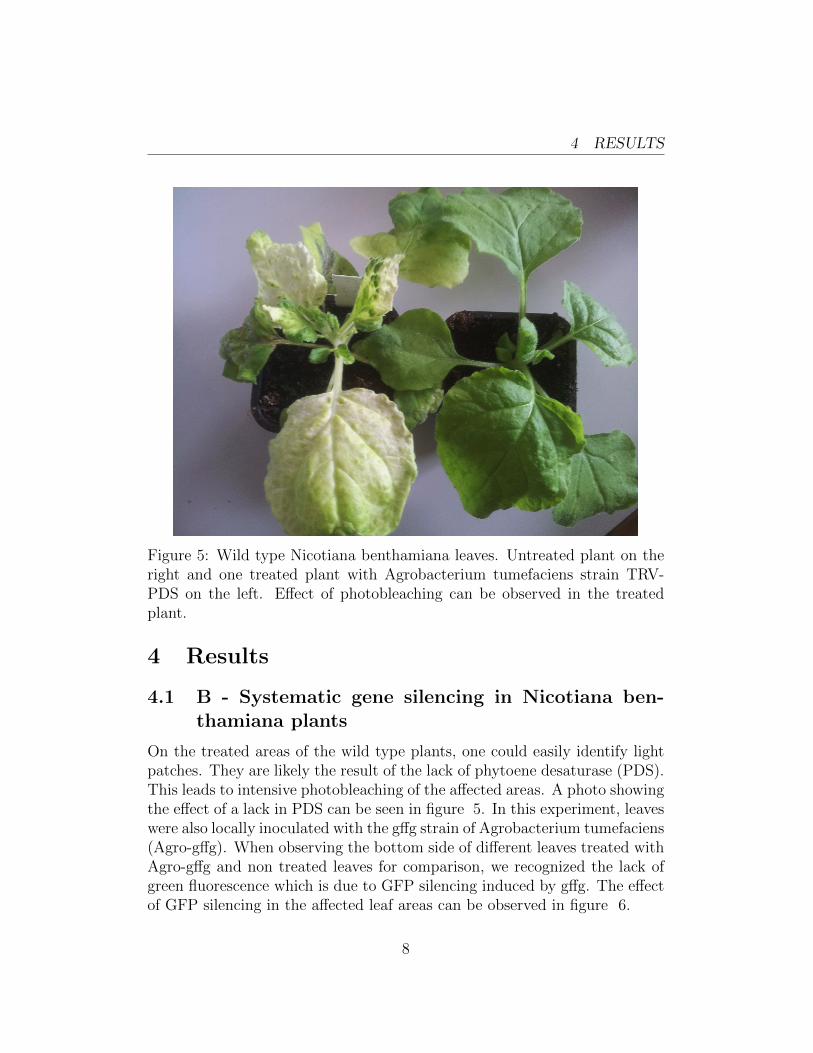
Figure 5: Wild type Nicotiana benthamiana leaves. Untreated plant on theright and one treated plant with Agrobacterium tumefaciens strain TRV-PDS on the left. Effect of photobleaching can be observed in the treatedplant.
4 Results
4.1 B - Systematic gene silencing in Nicotiana ben-thamiana plants
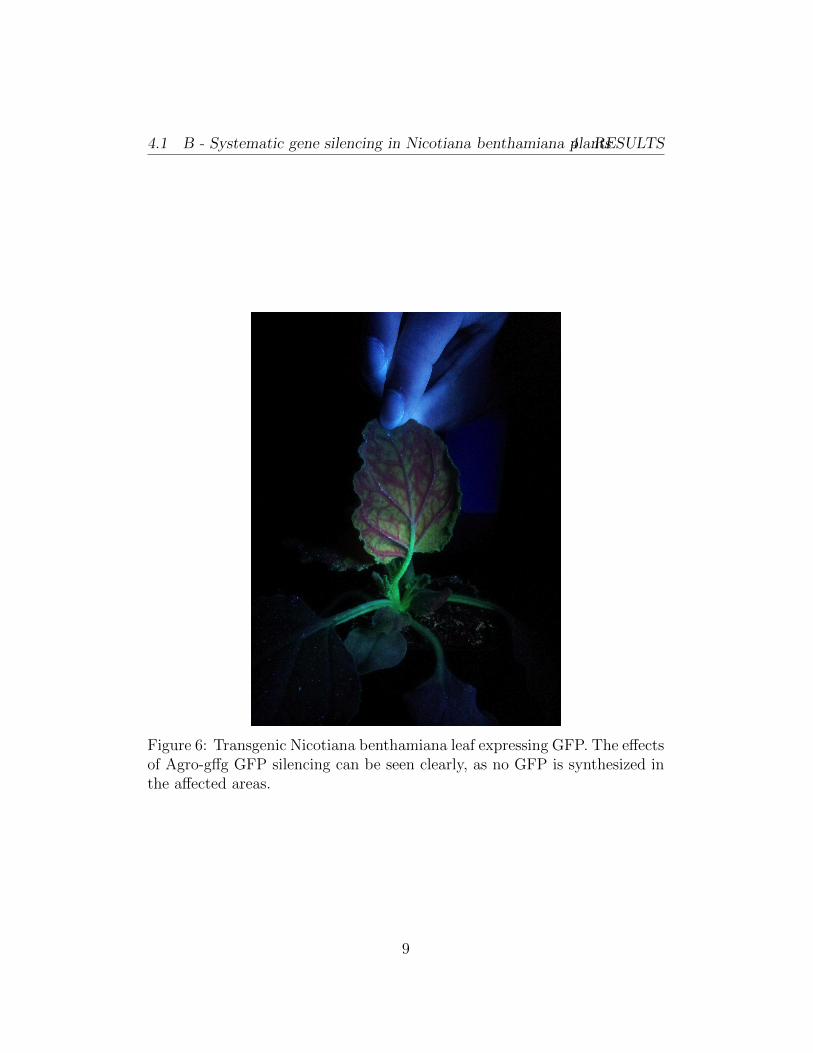
On the treated areas of the wild type plants, one could easily identify lightpatches. They are likely the result of the lack of phytoene desaturase (PDS).This leads to intensive photobleaching of the affected areas. A photo showingthe effect of a lack in PDS can be seen in figure 5. In this experiment, leaveswere also locally inoculated with the gffg strain of Agrobacterium tumefaciens(Agro-gffg). When observing the bottom side of different leaves treated withAgro-gffg and non treated leaves for comparison, we recognized the lack ofgreen fluorescence which is due to GFP silencing induced by gffg. The effectof GFP silencing in the affected leaf areas can be observed in figure 6.
8
4.1 B - Systematic gene silencing in Nicotiana benthamiana plants4 RESULTS
Figure 6: Transgenic Nicotiana benthamiana leaf expressing GFP. The effectsof Agro-gffg GFP silencing can be seen clearly, as no GFP is synthesized inthe affected areas.
9
4.2 K - Molecular analysis of transgenic Nicotiana benthamiana plantsafter systemic gene silencing 4 RESULTS
4.2 K - Molecular analysis of transgenic Nicotiana ben-thamiana plants after systemic gene silencing
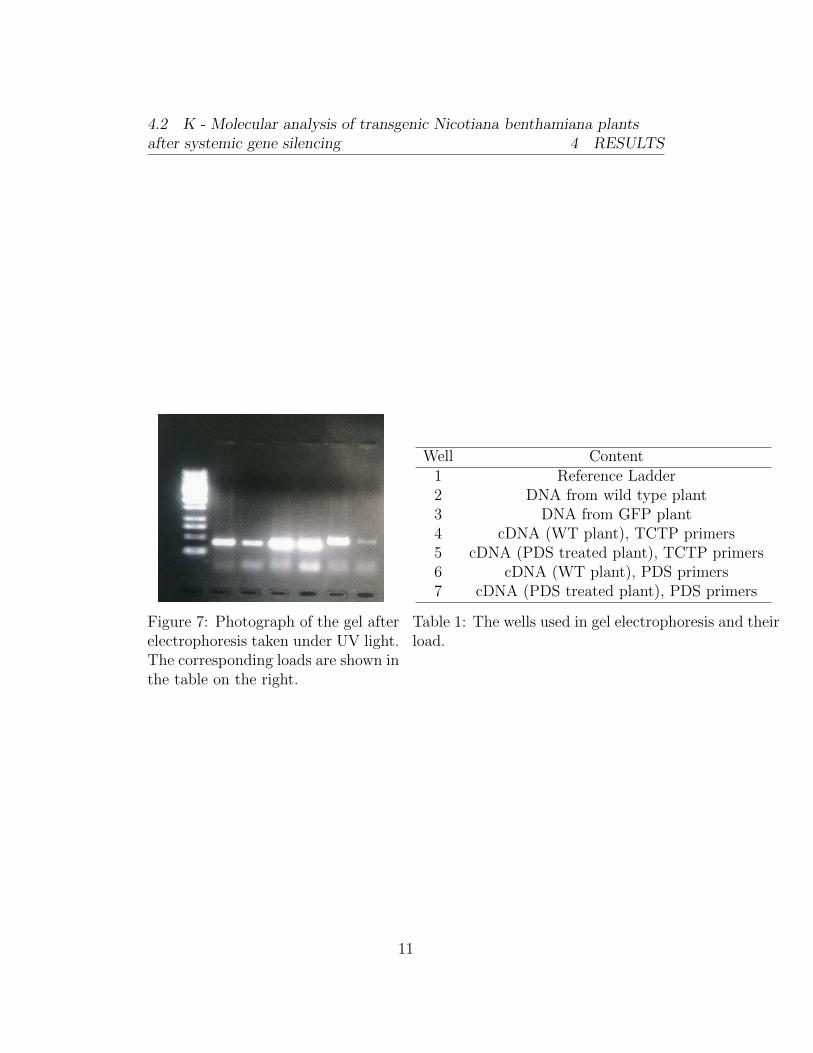
The PCR products were loaded onto a gel for a gel electrophoresis experimentand separated by their size during 30 minutes at a potential difference of 150V . The resulting gel after runtime can be seen in figure CCCC along withthe corresponding well per sample. The strongest bands were identified ataround 500 bp for the two housekeeping genes in wells 4 and 5. The weakestsignal is given in well 7, where a PDS silenced sample was incubated withPDS primers during real time PCR. In contrast, a PDS expressing sample inwell 6 did produce PDS cDNA which was amplified during PCR. Thus, theeffect of Agro-TRV-PDS as an inhibitor of PDS synthesis by silencing wasconfirmed in this experiment. The weakest bands at the bottom of the gel arelikely to represent unused primers from PCR, which, because of their smallsize, ran through the entire gel in the incubation time of gel electrophoresis.However, we also made an unusual observation concerning the DNA extractsfrom the WT and transgenic GFP expressing plants. In our experiment,wells 2 and 3 both showed a clear band at around 500 bp. Both samples weresupposed to be incubated with GFP primers during PCR and the WT plantshould therefore not have any band. We assume the reason to be, that weused transgenic plants for both raw DNA extracts instead of 1 WT and 1GFP plant. Alternatively, it is possible, that loading of the wells went wrongand we added the DNA extract from the transgenic plant in both wells andno DNA extract of the wild type, at all.
10
4.2 K - Molecular analysis of transgenic Nicotiana benthamiana plantsafter systemic gene silencing 4 RESULTS
Figure 7: Photograph of the gel afterelectrophoresis taken under UV light.The corresponding loads are shown inthe table on the right.
Well Content1 Reference Ladder2 DNA from wild type plant3 DNA from GFP plant4 cDNA (WT plant), TCTP primers5 cDNA (PDS treated plant), TCTP primers6 cDNA (WT plant), PDS primers7 cDNA (PDS treated plant), PDS primers
Table 1: The wells used in gel electrophoresis and theirload.
11