
System Noise Prediction of the DGEN 380 Turbofan Engine · Light jet programs under development...
12
AIAA Aviation 2015 22-26 June 2015, Dallas, Texas 21st AIAA/CEAS Aeroacoustics Conference AIAA 2015-0000 This material is declared a work of the U.S. Government and is not subject to copyright protection in the United States. System Noise Prediction of the DGEN 380 Turbofan Engine Jeffrey J. Berton * NASA Glenn Research Center, Cleveland, Ohio 44135 The DGEN 380 is a small, separate-flow, geared turbofan. Its manufacturer, Price Induction, is promoting it for a small twinjet application in the emerging personal light jet market. Smaller, and producing less thrust than other entries in the industry, Price Induction is seeking to apply the engine to a 4- to 5-place twinjet designed to compete in an area currently dominated by propeller-driven airplanes. NASA is considering purchasing a DGEN 380 turbofan to test new propulsion noise reduction technologies in a relevant engine environment. To explore this possibility, NASA and Price Induction have signed a Space Act Agreement and have agreed to cooperate on engine acoustic testing. Static acoustic measurements of the engine were made by NASA researchers during July, 2014 at the Glenn Research Center. In the event that a DGEN turbofan becomes a NASA noise technology research testbed, it is in the interest of NASA to develop procedures to evaluate engine system noise metrics. This report documents the procedures used to project the DGEN static noise measurements to flight conditions and the prediction of system noise of a notional airplane powered by twin DGEN engines. Nomenclature c = speed of sound D = directivity distribution function f = frequency F = Fresnel number G = tip-Mach-dependent fan noise term H = spool-speed-dependent shaft noise term k = convective amplification exponent L = noise level M = Mach number m ˙ = mass flow rate N = shaft speed n = jet noise velocity term exponent O = optimization function p = pressure S = spectral distribution function T = temperature V = velocity w = objective function weighting factor x = empirical calibration variable = jet convection correlation factor = Fresnel number characteristic length = polar (yaw) emission angle, zero at inlet = wavelength = density = jet noise density term exponent Subscripts: c = convective e = effective f = flight i = one-third octave band frequency index H = high pressure spool I = shielding insertion loss L = low pressure spool r = relative I. Introduction ASA uses a phased approach to develop propulsion noise reduction technologies. Early in the process, candidate ideas are screened for practicality, viability and safety, and their effectiveness is typically assessed analytically. More attractive technologies may be selected for further maturation using higher-order computational tools and, when appropriate, model-scale component testing in small laboratory facility rigs. When resources permit, the most promising technologies and concepts may be selected for additional testing in major facilities such as acoustic wind tunnels, static outdoor acoustic tests on a large engine, or even on experimental flight tests. Aerospace industry may choose to develop these technologies into service if a successful business case for the concept can be made. * Aerospace Engineer, Propulsion Systems Analysis Branch, MS 5-11, senior member AIAA. N https://ntrs.nasa.gov/search.jsp?R=20160001354 2018-06-08T14:40:59+00:00Z
-
Upload
nguyenxuyen -
Category
Documents
-
view
215 -
download
0
Transcript of System Noise Prediction of the DGEN 380 Turbofan Engine · Light jet programs under development...

AIAA Aviation 2015
22-26 June 2015, Dallas, Texas
21st AIAA/CEAS Aeroacoustics Conference
AIAA 2015-0000
This material is declared a work of the U.S. Government and is not subject to copyright protection in the United States.
System Noise Prediction of the DGEN 380 Turbofan Engine
Jeffrey J. Berton*
NASA Glenn Research Center, Cleveland, Ohio 44135
The DGEN 380 is a small, separate-flow, geared turbofan. Its manufacturer, Price
Induction, is promoting it for a small twinjet application in the emerging personal light jet
market. Smaller, and producing less thrust than other entries in the industry, Price Induction
is seeking to apply the engine to a 4- to 5-place twinjet designed to compete in an area currently
dominated by propeller-driven airplanes. NASA is considering purchasing a DGEN 380
turbofan to test new propulsion noise reduction technologies in a relevant engine environment.
To explore this possibility, NASA and Price Induction have signed a Space Act Agreement and
have agreed to cooperate on engine acoustic testing. Static acoustic measurements of the
engine were made by NASA researchers during July, 2014 at the Glenn Research Center. In
the event that a DGEN turbofan becomes a NASA noise technology research testbed, it is in
the interest of NASA to develop procedures to evaluate engine system noise metrics. This
report documents the procedures used to project the DGEN static noise measurements to
flight conditions and the prediction of system noise of a notional airplane powered by twin
DGEN engines.
Nomenclature
c = speed of sound
D = directivity distribution function
f = frequency
F = Fresnel number
G = tip-Mach-dependent fan noise term
H = spool-speed-dependent shaft noise term
k = convective amplification exponent
L = noise level
M = Mach number
m = mass flow rate
N = shaft speed
n = jet noise velocity term exponent
O = optimization function
p = pressure
S = spectral distribution function
T = temperature
V = velocity
w = objective function weighting factor
x = empirical calibration variable
= jet convection correlation factor
= Fresnel number characteristic length
= polar (yaw) emission angle, zero at inlet
= wavelength
= density
= jet noise density term exponent
Subscripts:
c = convective
e = effective
f = flight
i = one-third octave band frequency index
H = high pressure spool
I = shielding insertion loss
L = low pressure spool
r = relative
I. Introduction
ASA uses a phased approach to develop propulsion noise reduction technologies. Early in the process, candidate
ideas are screened for practicality, viability and safety, and their effectiveness is typically assessed analytically.
More attractive technologies may be selected for further maturation using higher-order computational tools and, when
appropriate, model-scale component testing in small laboratory facility rigs. When resources permit, the most
promising technologies and concepts may be selected for additional testing in major facilities such as acoustic wind
tunnels, static outdoor acoustic tests on a large engine, or even on experimental flight tests. Aerospace industry may
choose to develop these technologies into service if a successful business case for the concept can be made.
*Aerospace Engineer, Propulsion Systems Analysis Branch, MS 5-11, senior member AIAA.
N
https://ntrs.nasa.gov/search.jsp?R=20160001354 2018-06-08T14:40:59+00:00Z

21st AIAA/CEAS Aeroacoustics Conference – 22-26 June 2015
American Institute of Aeronautics and Astronautics
2 of 12
A small turbofan such as Price Induction’s DGEN could serve as an experimental testbed and provide valuable
information midway through NASA’s technology maturation process. Its small size would imply relatively low
acquisition and operating costs, adaptability to operate in multiple facilities, and flexibility in changing or adapting
hardware (e.g., inlet, fan, duct, or nozzle components). A small engine testbed could also be used to aid research in
disciplines other than noise, such as engine control systems, engine health monitoring, aeroelasticity experiments, and
dynamic response, materials or hybrid-electric research. Indeed, a test bench of the DGEN 380 digital engine-control
unit has already been acquired by Glenn for engine controls research. Data from this control system model is used for
this task.
The DGEN 380 is a twin-spool, unboosted, separate-flow geared turbofan with a static thrust of up to 570lb at sea
level. The design fan pressure ratio is low enough to allow a very high bypass ratio (7.6) for an engine this small. The
14in diameter fan is geared, and fan tip speeds are subsonic. The core turbomachinery consists of a radial compressor
and high- and low-pressure axial turbines. The inlet and bypass exhaust ducts are hardwall with no acoustic treatment.
The engine exhausts through a coannular plug nozzle. A cutaway view of the engine is shown in Figure 1.
Price Induction is promoting
DGEN 380 and 390 series turbofans
for a small twinjet application in the
emerging light jet market. DGEN
engines are smaller and produce less
thrust than other entries offered, such
as the Williams International FJ33 and
the Pratt & Whitney PW600 series
engines. Nomenclature for these new
light jets seems ill-defined as of this
writing; they are called Very Light
Jets (VLJs) by some and Personal
Light Jets (PLJs) by others, depending
on characteristics such as gross
weight, payload and performance.
Available light jets are Eclipse
Aviation’s 500/550, Cessna’s 510
Citation Mustang, and Embraer’s
Phenom 100, while Honda’s HA-420 HondaJet is expected to be fully certified by the time this report is published.
Light jet programs under development include Cirrus Aircraft’s Vision SF50, and Diamond Aircraft’s D-Jet (although
the development of the D-Jet has been suspended). Price Induction intends to claim the PLJ market as their own since
no other manufacturer offers a turbofan designed for aircraft operating in the regime currently dominated by propeller-
driven airplanes under 25,000ft and 250ktas. Price Induction hopes to create a niche market with relatively affordable
lightweight airplanes that are accessible to private pilots. Price induction is also targeting sales to aircraft engine
maintenance schools as well as aerospace research organizations within government and academia.
Price Induction took a DGEN 380 on a promotional U.S. tour in July, 2014. The engine and its operating controls
were mounted on a mobile flatbed truck platform and driven cross country. Prior to the tour, NASA and Price Induction
Inc.,* signed a Space Act Agreement1 and agreed to cooperate on engine acoustic testing. By the time the engine
reached AIAA’s Propulsion and Energy Forum and Exposition in Cleveland, Ohio, preparations had been made for a
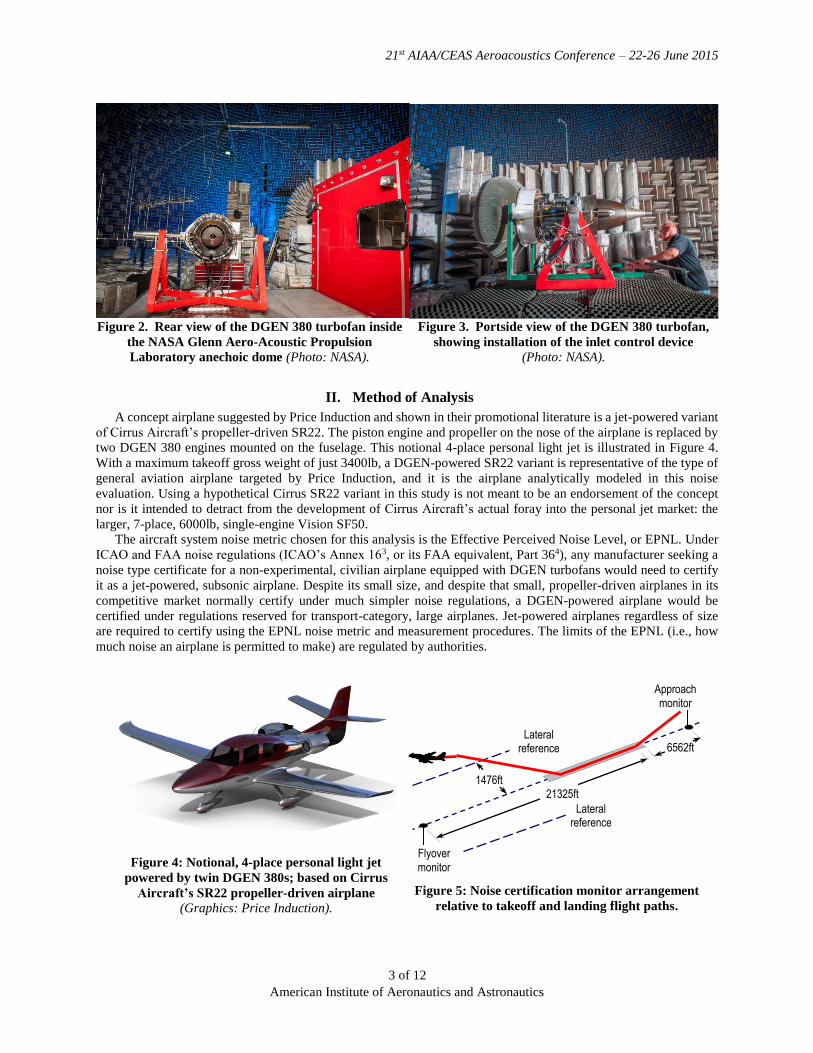
one-day acoustic test inside NASA Glenn’s Aero-Acoustic Propulsion Laboratory.2 The Laboratory is a large dome,
sixty-five feet high and 130 feet in diameter. It is fitted with acoustic foam wedges, creating an anechoic environment
down to 250Hz ideal for acoustic testing. The truck-mounted engine was located under an array of microphones
designed for the dome’s Nozzle Acoustic Test Rig, a freejet apparatus intended for jet noise research. Photos of the
DGEN 380 parked inside the facility are shown in Figure 2 and in Figure 3. An inlet control device designed to reduce
inflow distortion can be seen in Figure 3.
Narrowband acoustic spectra were measured at 24 emission angles and at six engine throttle settings. These
measurements are the basis of this investigation. In the event that a DGEN turbofan becomes a NASA noise technology
research testbed, it is in the interest of NASA to develop procedures to evaluate engine system noise metrics. This
report documents the procedures used to project the DGEN static noise measurements to flight conditions and the
prediction of system noise of a hypothetical airplane powered by twin DGEN engines.
*U.S.A. Price Induction Inc. is the North American office of Price Induction SA, a European SMB based in France.
Figure 1. Cutaway view of the DGEN 380 turbofan
(Graphics: Price Induction).
21st AIAA/CEAS Aeroacoustics Conference – 22-26 June 2015
American Institute of Aeronautics and Astronautics
3 of 12
Figure 2. Rear view of the DGEN 380 turbofan inside
the NASA Glenn Aero-Acoustic Propulsion
Laboratory anechoic dome (Photo: NASA).
Figure 3. Portside view of the DGEN 380 turbofan,
showing installation of the inlet control device
(Photo: NASA).
II. Method of Analysis
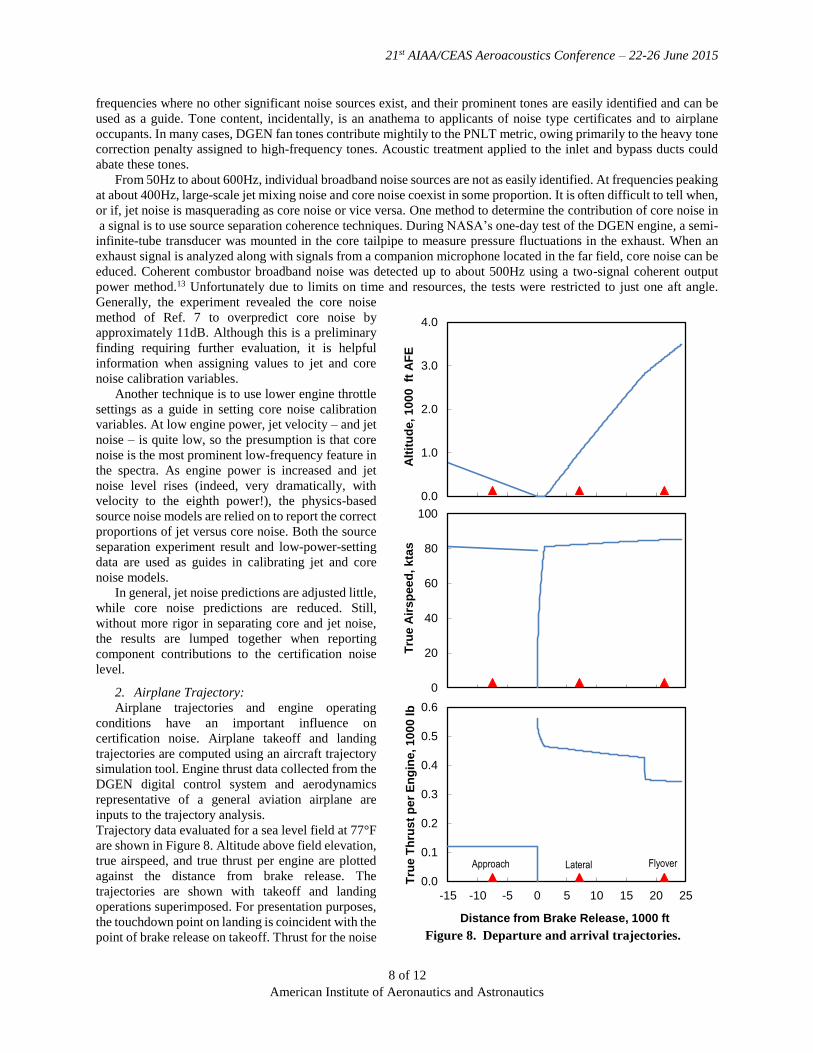
A concept airplane suggested by Price Induction and shown in their promotional literature is a jet-powered variant
of Cirrus Aircraft’s propeller-driven SR22. The piston engine and propeller on the nose of the airplane is replaced by
two DGEN 380 engines mounted on the fuselage. This notional 4-place personal light jet is illustrated in Figure 4.
With a maximum takeoff gross weight of just 3400lb, a DGEN-powered SR22 variant is representative of the type of
general aviation airplane targeted by Price Induction, and it is the airplane analytically modeled in this noise
evaluation. Using a hypothetical Cirrus SR22 variant in this study is not meant to be an endorsement of the concept
nor is it intended to detract from the development of Cirrus Aircraft’s actual foray into the personal jet market: the
larger, 7-place, 6000lb, single-engine Vision SF50.
The aircraft system noise metric chosen for this analysis is the Effective Perceived Noise Level, or EPNL. Under
ICAO and FAA noise regulations (ICAO’s Annex 163, or its FAA equivalent, Part 364), any manufacturer seeking a
noise type certificate for a non-experimental, civilian airplane equipped with DGEN turbofans would need to certify
it as a jet-powered, subsonic airplane. Despite its small size, and despite that small, propeller-driven airplanes in its
competitive market normally certify under much simpler noise regulations, a DGEN-powered airplane would be
certified under regulations reserved for transport-category, large airplanes. Jet-powered airplanes regardless of size
are required to certify using the EPNL noise metric and measurement procedures. The limits of the EPNL (i.e., how
much noise an airplane is permitted to make) are regulated by authorities.
Figure 4: Notional, 4-place personal light jet
powered by twin DGEN 380s; based on Cirrus
Aircraft’s SR22 propeller-driven airplane
(Graphics: Price Induction).
Figure 5: Noise certification monitor arrangement
relative to takeoff and landing flight paths.
6562ft
Flyover
monitor
Approach
monitor
21325ft 1476ft
Lateral reference
Lateral reference

21st AIAA/CEAS Aeroacoustics Conference – 22-26 June 2015
American Institute of Aeronautics and Astronautics
4 of 12
The basis of the EPNL is the perceived noise level, or PNL. The PNL is a weighted noise rating computed from
1/3rd octave band sound pressure levels, with particular emphasis given to levels at frequencies between 1kHz and
10kHz. An additional tone correction penalty is added to the PNL, forming the PNLT noise metric. During a noise
certification test, spectral acoustic measurements are made as an airplane flies past three certification noise observation
monitors on the ground (shown in Figure 5). Spectra are measured at half-second time intervals at each noise
observation station. From these, PNLs and PNLTs are computed. The EPNL is determined from a PNLT versus time
history. Thus the EPNL is a metric sensitive to level, frequency, tone content, and duration of a single airplane flyover
event. In noise certification parlance, the cumulative, or algebraic, sum of the three certification EPNLs is often used
to capture all three measurements.
The DGEN’s noise spectra – measured statically by NASA and corrected for atmospheric absorption – can be
analytically projected to simulated flight conditions by accounting for convective amplification and Doppler shift
effects. Propagation phenomena such as spherical spreading, atmospheric absorption, and various ground effects can
also be added to simulate a real airplane flyover event.
A sample noise spectrum acquired from
the DGEN turbofan is shown in Figure 6.
Narrowband power spectral densities
emitted 118° from the inlet axis are plotted.
The engine is operating at 96 percent of its
maximum, sea level static, low-spool shaft
speed (41,700rpm).* The spectrum is lossless
and corrected for spreading to a one-foot
distance. Fan tones at the fundamental blade
passage frequency (BPF) and its harmonics
are identified in the Figure. The fundamental
fan tone is usually prominent, despite the
cut-off fan design and the use of an inlet
control device to eliminate inlet flow
distortion. At most angles, another tone is
present at the high-spool’s shaft passage
frequency (SPFH). An additional prominent
tone (with hay-stacking behavior) at much
higher frequencies is created by the low-
pressure turbine (LPT). When computing PNL, regulations only consider noise up to the 10,000Hz preferred one-third
octave band center frequency. Acoustic content above 11,220Hz (the upper boundary frequency defined by the band
filter required by ICAO) does not contribute to aircraft noise metrics. Thus, the 4BPF fan tone only contributes to
certification noise at lower shaft speeds, or if Doppler effects in the aft quadrant are strong enough to shift it to lower
frequencies. The strong turbine tone does not contribute to certification noise, even at lower engine power settings
that would be used during approach. But since the turbine tone is distinct from fan tones, the DGEN could be a useful
research testbed for the study of turbine noise.
Perhaps the most expedient method for computing certification noise would be to use the measured engine spectra
directly with a system noise analysis and propagation tool. Straightforwardly, the measured spectra could be
analytically “flown” on a trajectory past observers on the ground. Propagation and ground effects could be applied
and EPNLs computed for each observer. Convection and Doppler flight effects could be applied to improve accuracy.
However, there are problems with this approach. Engine behavior is different in flight than at ground level. Engine
spool speeds, flow rates, temperatures and pressures – all of which influence engine noise – vary with altitude and
airspeed. Correcting these properties with referred temperature and pressure is helpful, but imperfect. Without
additional rigor, noise measured statically on the ground is not wholly representative of noise in flight.
In addition, jet mixing noise is a distributed source radiating along the axial plume of the exhaust. The microphones
in the NASA facility ranged from 32ft to 57ft away from the engine: distances far enough to be considered in the
acoustic far field, but not sufficiently distant to treat the entire exhaust plume as a point source radiating from the
nozzle. A technique is required to relate microphone geometric angles to the engine with apparent angles to jet noise
source locations.
*96 percent shaft speed was the highest engine power setting tested in the facility. 100 percent speed could not be achieved due to
moderately-high ambient temperature on the day of the test.
Figure 6. DGEN turbofan power spectral densities at 118° from
inlet axis, operating at 96% of maximum low-spool shaft speed.
80
90
100
110
0 5000 10000 15000 20000 25000 30000
Po
we
r S
pe
ctr
al D
en
sit
y,
dB
/Hz
Frequency, Hz
SPFH
1BPF
2BPF
3BPF
LPT
5BPF4BPF
6BPF
7BPF
10kHz center frequency upper boundary

21st AIAA/CEAS Aeroacoustics Conference – 22-26 June 2015
American Institute of Aeronautics and Astronautics
5 of 12
Instead, empirical source noise prediction methods are derived and are used in place of measured noise. Noise
surrogate models are constructed as empirical functions of engine state variables such as spool speed, flow rate,
temperature and pressure. Empirical noise models are calibrated to the static spectra measured at NASA, and they are
relied on to project spectra to arbitrary flight conditions. Engine state data are obtained from Price Induction’s Virtual
Engine Test Bench: an engine performance simulator built around the DGEN’s engine control unit. In this study,
polynomial response surfaces are created for engine state properties throughout the engine as functions of altitude,
flight Mach number, and low-pressure spool speed. This approach ensures that engine noise predictions react properly
to changes in altitude and airspeed.
Using noise surrogate models in place of actual spectra allows for removal of extraneous or spurious portions of
the spectra that are not believed to be genuine engine noise, particularly at low frequencies where the acoustic dome
facility is not sufficiently anechoic. Further, if the engine noise sources are separated and modeled individually, each
source can easily be manipulated mathematically. This is useful when simulating the effects of adding noise reduction
technology such as duct acoustic treatment (which would be applied only to fan noise), nozzle chevrons (a jet noise
reduction technology) or when conducting a noise uncertainty analysis of each component as it relates to the overall
system. Last, component noise modeling allows for the removal of engine noise sources that may be eliminated or
reduced during manufacturing and would not be present in the final, production engine.
Engine noise modeling is discussed in detail immediately below. The measured spectra are corrected for
atmospheric absorption. The levels of the lossless spectra can be adjusted to any distance using a spherical spreading
correction (the actual distance to the microphone is used when deriving the jet noise method so that distributed source
effects can be modeled). Each noise method is formulated in the one-third octave band paradigm, using decibels
referenced to 20Pa. When computing certification noise, convection and Doppler effects in each source noise model
are applied and spectra are projected to flight conditions appropriate for a DGEN-powered airplane. A trajectory
analysis is performed for a small, notional, personal light jet to determine the approximate flight path past each noise
certification monitor. In-flight spectra are fed into NASA’s Aircraft Noise Prediction Program (ANOPP5,6) as user-
supplied noise, propagation losses and ground effects are applied. and certification noise levels are computed.
1. Engine Noise Sources
Core noise predictions are based on a simple empirical expression7 suggested by the Society of Automotive
Engineers. Lossless core noise spectra (LCore, in dB, as a function of frequency f and polar emission angle, ) are
expressed as a function of engine properties, namely the mass flow rate entering the combustor (m), the change in
total temperature through the combustor (TComb) and the density of the flow entering the combustor (Comb):
kfRef
Comb
Ref
Comb
RefCore
M
xfSD
T
T
m
mxfL
cos1
),( )(log10),( 2
22
110
(1)
The flow properties are rendered dimensionless with reference parameters. D is a dimensionless directivity function
correcting levels for emission angle and S is a dimensionless function that accounts for spectral shaping and Doppler
shift. In flight, levels are adjusted for the flight Mach number Mf with the term 1 – Mf cos raised to a convective
amplification exponent, k (taken to be four for quadrupole emissions). The method defines core noise as direct and
indirect unsteady combustion noise. Turbine noise is not included in the method, but in the DGEN engine it is at such
high frequencies it is not expected to be relevant to certification noise. Spherical spreading corrections are applied
afterwards.
The terms x1 and x2 are empirical calibration variables. Suggested values are given in the original reference and
elsewhere, but in this study they are variables intended to fit the predictive model (with Mf = 0) to the measured static
spectra. x1 adjusts core noise spectra for amplitude, while x2 adjusts for curvature. Fitment of spectra is discussed in
the following section.
Fan noise predictions are based on an early empirical method developed by NASA,8 but recalibrated for modern,
wide-chord, low-pressure-ratio fans.9 Acoustic power level is proportional to the mass flow rate entering the fan, the
total temperature rise across the fan stage (TFan), and an empirical function dependent on the relative (helical) fan
rotor tip Mach number, G(Mr). Lossless fan noise spectra LFan are given by
kf
rRef
Fan
RefFan
M
xfSDMG
T
T
m
mxfL
cos1
),( )( )(log10),( 84
2
310
(2)
The method models broadband and rotor-stator discrete interaction tones separately. In addition to accounting for
Doppler shift, the spectral function S assigns an additional level representing an interaction tone whenever the one-

21st AIAA/CEAS Aeroacoustics Conference – 22-26 June 2015
American Institute of Aeronautics and Astronautics
6 of 12
third octave frequency span contains a multiple of the blade passage frequency. In other implementations of the
method, additional terms are present to account for effects such as variable rotor-stator spacing, inlet guide vanes, and
flow distortion. These terms, however, are omitted here since they reduce to constants and since fan noise is already
adjusted using the calibration variables x3 through x8. In this instance, x3 adjusts fan noise spectra for amplitude, x4
adjusts for curvature, and x5 through x8 adjust the levels of the first four interaction tones.
Shaft acoustic power is based on an empirical function H, a polynomial regression dependent on high and low
spool shaft speeds, NH and NL. LShaft is given by
kf
HLShaftsM
fSDNNHxxfL
cos1
)( )(),(log10),( 10910 (3)
The spectral function assigns levels when the one-third octave frequency span contains one or both shaft passage
frequencies. It also accounts for Doppler shift. x9 and x10 are used to make finer adjustments to shaft order tone levels
unaccounted for by H.
Jet noise is modeled using a semi-empirical method developed by Stone.10 The problem is approached by breaking
overall jet noise into several virtual components, each accounting for different noise-generation mechanisms within
the jet plume. Since both the core and bypass nozzles are subcritical throughout the takeoff regime, the jets are modeled
as shock-free streams and shock-related jet noise components are ignored. Three turbulent mixing components are
considered: 1) large-scale, merged-stream mixing noise (low-frequency content generated by large turbulent eddies
several diameters downstream of the exit plane), 2) small-scale mixing noise (relatively high-frequency content
generated at the exit plane of the nozzle by the jet-to-ambient shear layer), and 3) transitional, intermediate-scale
mixing noise. The intermediate-scale noise is the most difficult component to characterize. It is predominantly caused
by the inner shear layer at the interface between the streams of a coannular nozzle. The overall levels of the mixing
noise components are functions of jet velocity, jet density, size of the jet, and the convective Mach number. Spectral
shapes are characterized by Strouhal number functions. The general form of the three lossless mixing components is
2221110cos1
),( )(log10),(
cc
eeRef
nRefeJet
MM
fSDcVxfL
(4)
where Ve is an effective jet velocity (normalized by ambient sound speed to form an acoustic Mach number), n a
velocity slope, a fully-expanded jet density, and a variable density exponent. Each represents an appropriate value
for the jet noise component being considered. e is an effective polar emission angle dependent on jet velocity that
accounts for refraction. Although jet noise source locations vary, they are assumed to vary similarly with jet velocity
and can be correlated to the geometric emission angle. Each spectrum is adjusted to the distance from the nozzle to
the microphone before calibration (refraction modeling is discussed in greater detail in Ref. 10). Stone found that
better agreement with in-flight data could be obtained by eliminating the convection term 1 – Mf cos and relying
upon only a convective Mach number Mc and an empirical convection constant to account for the effects of simulated
flight. All three mixing noise components are ganged together and adjusted by the calibration constant x11.
2. Fitment of Spectra:
An optimizer is used to aid fitment of the noise models to the measurements. A composite objective function O(x)
is defined:
2,,22
,
2,,
1)( modelTPNdataTPN
idatadatai
imodelidatai
LLwLL
LLwO
x (5)
The first term is the residual sum of squares divided by the total sum of squares over all Li sound pressure level
observations of a spectrum. The first term, if driven to zero, would represent a perfect fit of noise models to the
measured data, and it alone would suffice as an objective function. But neither the noise models nor the data are perfect
representations of the system, so obtaining a perfect fit is difficult. Further, at least as important as matching the
spectral shape is matching the frequency-independent tone-corrected perceived noise level (PNLT, given the notation
LTPN), since it is the metric used directly to compute certification EPNL. Given this, the squared difference of LTPN is
added as a second term in O(x), with w1 and w2 used as weighting factors.
Of course a minimum, nonzero O(x) does not result in a unique solution. Caution is warranted when using this
logic to fit noise models. Generally, values of x should not stray too far from their nominal values. It is easy to envision
a case where levels of one noise component are driven unrealistically high just to drive O(x) a bit smaller, only to
have a more realistic noise component overshadowed. Judicious limits should be set for values of x. This is discussed
in greater detail in Section III.

21st AIAA/CEAS Aeroacoustics Conference – 22-26 June 2015
American Institute of Aeronautics and Astronautics
7 of 12
3. Airframe and Installation:
Propulsion noise is combined with airframe noise appropriate for a Cirrus SR22 using the Fink method.11 The
method uses empirical functions to model noise spectra as functions of polar and azimuthal emission angles. Spectra
are predicted for the SR22’s trailing edge planform surfaces, landing gear and single-slotted flaps. The SR22 has fixed,
non-retracting landing gear and no leading edge slats. The method uses gross airframe dimensions such as span, flap
chord lengths, and gear configuration and dimensions; all of which may be obtained from a simple, open-literature,
three-view aircraft drawing.
Noise shielding (also referred to as barrier attenuation or insertion loss) is an acoustic diffraction phenomenon
where acoustic waves are attenuated when propagated past an impermeable barrier placed between the noise source
and an observer. Shielding is particularly efficient when the observer is located in the “shadow region” where the
noise source is obscured. The wing planform provides a shielding surface for the engine located above and behind the
wing trailing edge. Airframe noise sources and jet noise – a distributed source generated downstream throughout the
axial exhaust plume – are not shielded.
The method used to predict shielding is a simple empirical diffraction model based on asymptotic results of optical
diffraction theory, originally proposed by Maekawa12 and reproduced in many foundational acoustic textbooks. The
analytic treatment of diffraction effects in this manner is common in aeroacoustic applications. Reliable, fast, and easy
to implement, it has been coded into aircraft noise system prediction programs.
Maekawa proposed the shadow zone insertion loss relation:
52tanh2log20 10 FFLI (6)
in dB, where F is the frequency-dependent Fresnel number (2f/ c), whose characteristic length is the difference
between the shortest path around the barrier between the source and the observer and the source-observer distance
directly through the barrier. For observers in the bright zone (F < -0.192), the attenuation is neglected, and for
observers in the transition zone (-0.192 < F < 0), it is appropriate to replace the hyperbolic tangent with the
trigonometric tangent. Although the above relation is intended for use with semi-infinite barriers, Maekawa suggested
that superposition may be used for barriers of finite length and width, such as a wing planform.
III. Results and Discussion
1. Spectral results:
The noise models are calibrated to every spectrum acquired in the facility. With 24 polar emission angles (ranging
from 36 to 145 degrees relative to the inlet axis), and six engine power settings (ranging from 47 percent to 96 percent
of the maximum low-spool shaft speed), a dataset of 144 static spectra are available to perform a system noise
assessment. Measured and modeled spectra at 138 degrees and at the highest power setting are plotted in Figure 7 for
discussion.
Narrowband, lossless sound
pressure levels for a virtual observer
on a one foot radius are plotted using a
frequency interval of 12.2Hz. Tone
content at the high-spool shaft
frequency and at the first three fan
passage frequencies are easily seen in
the narrowband data. The narrowband
data are summed to a coarser, one-
third octave band spectrum indicated
by the symbols. Higher-frequency fan
or turbine noise does not contribute to
the analysis, since levels only at
frequencies from 50Hz to 10kHz are
used to compute noise certification
metrics.
The calibrated spectra of fan, jet,
core, and shaft noise models are also
plotted. Fan and shaft noise levels are
perhaps the easiest sources to identify
and to calibrate. Both sources peak at
Figure 7. Measured and modeled lossless spectra at 138° from inlet
axis, 96% of maximum low-spool shaft speed.
80
90
100
110
120
130
10 100 1000 10000
So
un
d P
res
su
re L
eve
l, d
B
Frequency, Hz
Fan
Shafts
Small-scale jet mixing
Intermediate-scalejet mixing
Large-scalejet mixing
Core
Total of models Data, 1/3rd octave band
Data, narrowband
21st AIAA/CEAS Aeroacoustics Conference – 22-26 June 2015
American Institute of Aeronautics and Astronautics
8 of 12
frequencies where no other significant noise sources exist, and their prominent tones are easily identified and can be
used as a guide. Tone content, incidentally, is an anathema to applicants of noise type certificates and to airplane
occupants. In many cases, DGEN fan tones contribute mightily to the PNLT metric, owing primarily to the heavy tone
correction penalty assigned to high-frequency tones. Acoustic treatment applied to the inlet and bypass ducts could
abate these tones.
From 50Hz to about 600Hz, individual broadband noise sources are not as easily identified. At frequencies peaking
at about 400Hz, large-scale jet mixing noise and core noise coexist in some proportion. It is often difficult to tell when,
or if, jet noise is masquerading as core noise or vice versa. One method to determine the contribution of core noise in
a signal is to use source separation coherence techniques. During NASA’s one-day test of the DGEN engine, a semi-
infinite-tube transducer was mounted in the core tailpipe to measure pressure fluctuations in the exhaust. When an
exhaust signal is analyzed along with signals from a companion microphone located in the far field, core noise can be
educed. Coherent combustor broadband noise was detected up to about 500Hz using a two-signal coherent output
power method.13 Unfortunately due to limits on time and resources, the tests were restricted to just one aft angle.
Generally, the experiment revealed the core noise
method of Ref. 7 to overpredict core noise by
approximately 11dB. Although this is a preliminary
finding requiring further evaluation, it is helpful
information when assigning values to jet and core
noise calibration variables.
Another technique is to use lower engine throttle
settings as a guide in setting core noise calibration
variables. At low engine power, jet velocity – and jet
noise – is quite low, so the presumption is that core
noise is the most prominent low-frequency feature in
the spectra. As engine power is increased and jet
noise level rises (indeed, very dramatically, with
velocity to the eighth power!), the physics-based
source noise models are relied on to report the correct
proportions of jet versus core noise. Both the source
separation experiment result and low-power-setting
data are used as guides in calibrating jet and core
noise models.
In general, jet noise predictions are adjusted little,
while core noise predictions are reduced. Still,
without more rigor in separating core and jet noise,
the results are lumped together when reporting
component contributions to the certification noise
level.
2. Airplane Trajectory:
Airplane trajectories and engine operating
conditions have an important influence on
certification noise. Airplane takeoff and landing
trajectories are computed using an aircraft trajectory
simulation tool. Engine thrust data collected from the
DGEN digital control system and aerodynamics
representative of a general aviation airplane are
inputs to the trajectory analysis.
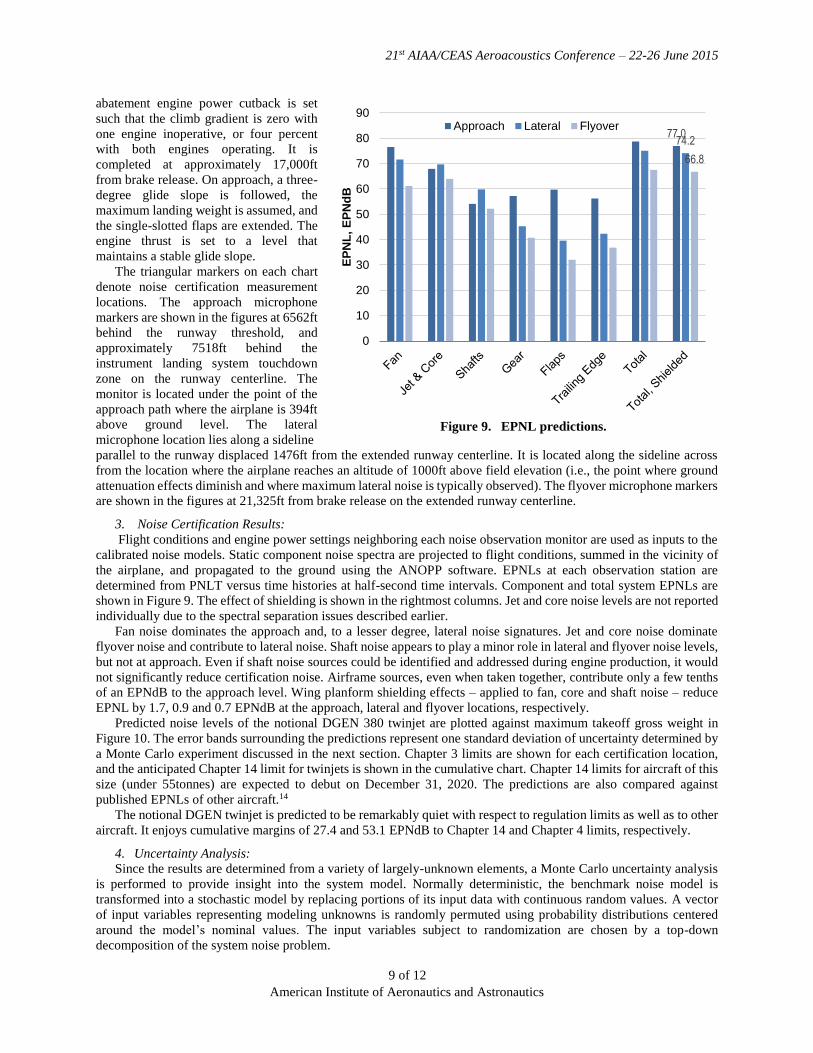
Trajectory data evaluated for a sea level field at 77°F
are shown in Figure 8. Altitude above field elevation,
true airspeed, and true thrust per engine are plotted
against the distance from brake release. The
trajectories are shown with takeoff and landing
operations superimposed. For presentation purposes,
the touchdown point on landing is coincident with the
point of brake release on takeoff. Thrust for the noise
Figure 8. Departure and arrival trajectories.
0.0
1.0
2.0
3.0
4.0
-15 -10 -5 0 5 10 15 20 25
Alt
itu
de
, 1
00
0 ft
AF
E
0
20
40
60
80
100
-15 -10 -5 0 5 10 15 20 25
Tru
e A
irs
pe
ed
, k
tas
0.0
0.1
0.2
0.3
0.4
0.5
0.6
-15 -10 -5 0 5 10 15 20 25
Tru
e T
hru
st
pe
r E
ng
ine
, 1
00
0 lb
Distance from Brake Release, 1000 ft
Approach Lateral Flyover
21st AIAA/CEAS Aeroacoustics Conference – 22-26 June 2015
American Institute of Aeronautics and Astronautics
9 of 12
abatement engine power cutback is set
such that the climb gradient is zero with
one engine inoperative, or four percent
with both engines operating. It is
completed at approximately 17,000ft
from brake release. On approach, a three-
degree glide slope is followed, the
maximum landing weight is assumed, and
the single-slotted flaps are extended. The
engine thrust is set to a level that
maintains a stable glide slope.
The triangular markers on each chart
denote noise certification measurement
locations. The approach microphone
markers are shown in the figures at 6562ft
behind the runway threshold, and
approximately 7518ft behind the
instrument landing system touchdown
zone on the runway centerline. The
monitor is located under the point of the
approach path where the airplane is 394ft
above ground level. The lateral
microphone location lies along a sideline
parallel to the runway displaced 1476ft from the extended runway centerline. It is located along the sideline across
from the location where the airplane reaches an altitude of 1000ft above field elevation (i.e., the point where ground
attenuation effects diminish and where maximum lateral noise is typically observed). The flyover microphone markers
are shown in the figures at 21,325ft from brake release on the extended runway centerline.
3. Noise Certification Results:
Flight conditions and engine power settings neighboring each noise observation monitor are used as inputs to the
calibrated noise models. Static component noise spectra are projected to flight conditions, summed in the vicinity of
the airplane, and propagated to the ground using the ANOPP software. EPNLs at each observation station are
determined from PNLT versus time histories at half-second time intervals. Component and total system EPNLs are
shown in Figure 9. The effect of shielding is shown in the rightmost columns. Jet and core noise levels are not reported
individually due to the spectral separation issues described earlier.
Fan noise dominates the approach and, to a lesser degree, lateral noise signatures. Jet and core noise dominate
flyover noise and contribute to lateral noise. Shaft noise appears to play a minor role in lateral and flyover noise levels,
but not at approach. Even if shaft noise sources could be identified and addressed during engine production, it would
not significantly reduce certification noise. Airframe sources, even when taken together, contribute only a few tenths
of an EPNdB to the approach level. Wing planform shielding effects – applied to fan, core and shaft noise – reduce
EPNL by 1.7, 0.9 and 0.7 EPNdB at the approach, lateral and flyover locations, respectively.
Predicted noise levels of the notional DGEN 380 twinjet are plotted against maximum takeoff gross weight in
Figure 10. The error bands surrounding the predictions represent one standard deviation of uncertainty determined by
a Monte Carlo experiment discussed in the next section. Chapter 3 limits are shown for each certification location,
and the anticipated Chapter 14 limit for twinjets is shown in the cumulative chart. Chapter 14 limits for aircraft of this
size (under 55tonnes) are expected to debut on December 31, 2020. The predictions are also compared against
published EPNLs of other aircraft.14
The notional DGEN twinjet is predicted to be remarkably quiet with respect to regulation limits as well as to other
aircraft. It enjoys cumulative margins of 27.4 and 53.1 EPNdB to Chapter 14 and Chapter 4 limits, respectively.
4. Uncertainty Analysis:
Since the results are determined from a variety of largely-unknown elements, a Monte Carlo uncertainty analysis
is performed to provide insight into the system model. Normally deterministic, the benchmark noise model is
transformed into a stochastic model by replacing portions of its input data with continuous random values. A vector
of input variables representing modeling unknowns is randomly permuted using probability distributions centered
around the model’s nominal values. The input variables subject to randomization are chosen by a top-down
decomposition of the system noise problem.
Figure 9. EPNL predictions.
77.074.2
66.8
0
10
20
30
40
50
60
70
80
90
EP
NL
, E
PN
dB
Approach Lateral Flyover

21st AIAA/CEAS Aeroacoustics Conference – 22-26 June 2015
American Institute of Aeronautics and Astronautics
10 of 12
Figure 10. Notional DGEN twinjet noise predictions compared to certification data and Chapter 3 and
Chapter 14 limits. Error bars represent one standard deviation in an uncertainty analysis.
Table 1. Uncertainty variables used in Monte Carlo experiment.
Variable Mode Model Min Max Std. Dev.
Approach flight Mach no. 0.119 Triangular 0.112 0.126 -
Lateral flight Mach no.
Flyover flight Mach no.
Approach NL setpoint
0.123
0.128
60%
Triangular
Triangular
Triangular
0.119
0.120
58%
0.127
0.150
62%
-
-
-
Lateral NL setpoint 96% Triangular 94% 100% -
Flyover NL setpoint 90% Triangular 87% 93% -
Approach angle of attack
Lateral angle of attack
Flyover angle of attack
Flyover altitude
Fan noise adjustment
Core noise adjustment
Shaft noise adjustment
Jet noise adjustment
Landing gear noise adjustment
Flap noise adjustment
Trailing edge noise adjustment
Ground specific flow resistance
Lateral attenuation adjustment
6°
6°
6°
3170ft
0
0
0
0
0
0
0
291sl/s-ft3
0
Triangular
Triangular
Triangular
Triangular
Normal
Normal
Normal
Normal
Normal
Normal
Normal
Triangular
Triangular
5°
5°
5°
2850ft
-
-
-
-
-
-
-
233sl/s-ft3
-2dB
7°
7°
7°
3490ft
-
-
-
-
-
-
-
349sl/s-ft3
2dB
-
-
-
-
1.0dB
1.0dB
1.0dB
1.0dB
1.5dB
1.5dB
1.5dB
-
-
Wing area (shielding) 155ft2 Uniform 0 200ft2 -
75
77
79
81
83
85
87
89
91
93
95
97
99A
pp
roa
ch
EP
NL
, E
PN
dB Chapter 3 limit
Notional DGEN twinjet
65
67
69
71
73
75
77
79
81
83
85
87
89
91
1 10
Fly
ove
r E
PN
L, E
PN
dB
Maximum Takeoff Gross Weight, 1000lb20
Chapter 3 limit, twins
Notional DGEN twinjet
72
74
76
78
80
82
84
86
88
90
92
94
96
La
tera
l E
PN
L, E
PN
dB
Chapter 3 limit
Notional DGEN twinjet
215
220
225
230
235
240
245
250
255
260
1 10
Cu
mu
lati
ve
EP
NL
, E
PN
dB
Maximum Takeoff Gross Weight, 1000lb20
Eclipse 500
Notional DGEN twinjet
Cessna 510 Mustang
Chapter 14 limit, twins
Embraer Phenom 100
21st AIAA/CEAS Aeroacoustics Conference – 22-26 June 2015
American Institute of Aeronautics and Astronautics
11 of 12
These uncertainty variables are presented in Table 1. The variables are chosen to represent various effects that
would certainly stray from mode values assumed for the benchmark case during the course of aircraft development.
Randomly-changing variables represent the lack of knowledge of system characteristics, as well as the accuracy of
(and uncertainty in) source noise prediction methods. Notably, atmospheric properties are not varied, despite their
strong influence on atmospheric absorption and other phenomena. Since ICAO requires acoustic measurements to be
corrected to standard acoustic day conditions, there is little reason to include ambient temperature or relative humidity
in the experiment. There are no variables assigned to represent variations in wind, terrain, or airport elevation for
similar reasons.
Since the airplane is notional, all trajectory-related variables are subject to variability. Engine power settings on
approach and during the noise abatement thrust cutback are dependent on airplane weight, aerodynamics and
regulations. These variables are allowed to change within limits judged reasonable using triangular distribution
models. Each noise source is allowed to vary using normal distributions. Airframe noise sources are assigned
somewhat more variability than propulsion sources since the airplane configuration is not precisely known. Ground
specific flow resistance and lateral attenuation are environmental variables affecting noise during certification testing.
Last, the wing planform shielding area is allowed to vary uniformly from zero (no shielding) to a maximum of 200ft2.
As wing area is varied, wing aspect ratio, taper ratio and sweep are held constant.
Table 2. Uncertainty statistics (in EPNdB).
Statistic Approach Lateral Flyover Cumulative
Benchmark case 77.0 74.2 66.8 217.9
Minimum of samples 74.3 70.6 64.4 209.5
Maximum of samples 80.5 78.1 69.7 226.4
Range of samples 6.2 7.6 5.3 17.0
Mean of samples 77.3 74.6 66.8 218.7
Standard deviation 0.9 1.2 0.8 2.3
The three certification EPNLs comprise the set of
stochastic output response variables. A single analysis
requires about three minutes to execute on a
contemporary office computer. The Monte Carlo
problem lends itself to concurrent parallelization, so the
analyses may be multi-threaded across several
platforms. A robot is easily constructed to modify a
template input file, permute its contents with randomly-
generated inputs, and run the analysis. The noise model
is interrogated eight thousand times. Results of the
uncertainty experiment are shown in Figure 11 for
cumulative EPNL. Statistics for the experiment are
presented in Table 2.
After eight thousand samples, there do not appear to
be multiple modes or truncations in any of the
histograms. Skew and kurtosis are not major factors. As
is the case in any uncertainty experiment, the spread of
the data perhaps is the most revealing. The standard
deviations are rather small; on the order of only
1 EPNdB at each observer.
IV. Conclusions
Static noise measurements of a Price Induction DGEN 380 turbofan collected at NASA Glenn Research Center
are used to develop propulsion noise prediction models. Calibrated to measured data, the models represent the actual
noise level of a DGEN engine, but embedded physics-based behavior allows them to react properly to changing engine
state and flight conditions. The models are used to analytically project noise spectra to flight conditions and to predict
system noise of a notional airplane powered by twin DGEN engines. The DGEN is a quiet turbofan, owing not only
to its small size, but also to its design. The gearbox allows the fan to spin more slowly than the low-pressure turbine.
With the fan generating less bypass duct pressure, turbine power can be used to drive the bypass ratio very high for
Figure 11. Monte Carlo uncertainty analysis of
cumulative EPNL. Histogram and normal
distribution generated from 8000 samples and bin
span of 0.1 EPNdB.
0.000
0.005
0.010
0.015
0.020
0.025
212 214 216 218 220 222 224 226
Pro
ba
bil
ity
Cumulative EPNL, EPNdB
21st AIAA/CEAS Aeroacoustics Conference – 22-26 June 2015
American Institute of Aeronautics and Astronautics
12 of 12
this class of engine. Relatively low fan speeds and low jet velocities result in a very low propulsion noise signature.
A notional DGEN twinjet is predicted to be remarkably quiet with respect to regulation limits as well as to other
aircraft. Cumulative margins to Chapter 14 and Chapter 4 limits are predicted to be 27.4 and 53.1 EPNdB, respectively.
Addition of inlet and bypass duct acoustic treatment could drive certification noise levels even lower.
Acknowledgments
This work was performed with support from NASA’s Advanced Air Transport Technology Project. Thanks also
go to NASA Glenn Research Center’s Daniel L. Sutliff and Clifford A. Brown for providing DGEN 380 acoustic
measurements and to Joseph W. Connolly and Yuan Liu at NASA for providing the DGEN engine performance data
used in this report.
1NASA Space Act Agreement SAA3-1370, “Acoustic Testing of Price Induction DGEN 380 Turbofan Jet Engine,” June, 2014. 2“The Little Engine that Could,” NASA Press Release, 2014 [URL: http://www.nasa.gov/content/the-little-engine-that-could/,
accessed March, 2015]. 3International Standards and Recommended Practices – Environmental Protection, “Annex 16 to the Convention on
International Civil Aviation, Volume I: Aircraft Noise,” 7th Edition, International Civil Aviation Organization (ICAO), Montreal,
Canada, July 2014. 4U.S. Code of Federal Regulations, Title 14, Chapter I, Part 36, “Noise standards: Aircraft Type and Airworthiness
Certification.” 5Gillian, R.E.: “Aircraft Noise Prediction Program User’s Manual,” NASA TM-84486, 1983. 6Zorumski, W.E.: “Aircraft Noise Prediction Program Theoretical Manual, Parts 1 and 2,” NASA TM-83199, 1982; Currently
maintained at NASA Langley by the ANOPP team in electronic format and provided upon request; Latest revision: Level 30. 7Emmerling, J.J.; Kazin, S.B.; and Matta, R.K.: “Core Engine Noise Control Program. Volume III, Supplement 1 - Prediction
Methods,” FAA-RD-74-125, III-I, Mar. 1976 (Available from DTIC as AD A030 376). 8Heidmann, M.F.: “Interim Prediction Method for Fan and Compressor Source Noise,” NASA TMX-71763, 1979. 9Krejsa, E.A.; and Stone, J.R.: “Enhanced Fan Noise Modeling for Turbofan Engines,” NASA CR-2014-218421, 2014. 10Stone, J.R.; Krejsa, E.A.; Clark, B.J.; and Berton, J.J.: “Jet Noise Modeling for Suppressed and Unsuppressed Aircraft in
Simulated Flight,” NASA TM-2009-215524, 2009. 11Fink, M.R.: “Airframe Noise Prediction Method,” FAA-RD-77-29, March, 1977. 12Maekawa, Z.: “Noise Reduction By Screens,” Memoirs of the Faculty of Engineering, Vol. 12, Kobe University, Kobe, Japan,
1966, pp. 472-479. 13Bendat, Julius S.; and Piersol, Allan G.: “Engineering Applications of Correlation and Spectral Analysis,” Wiley-Interscience,
New York, NY, 1980. 14European Aviation Safety Agency: Type Certificate Data Sheets, Noise [URL: https://easa.europa.eu/document-library/noise-
type-certificates-approved-noise-levels, accessed March, 2015].
References