System for Assessing Classroom Attention · PDF fileSystem for Assessing Classroom Attention...
5
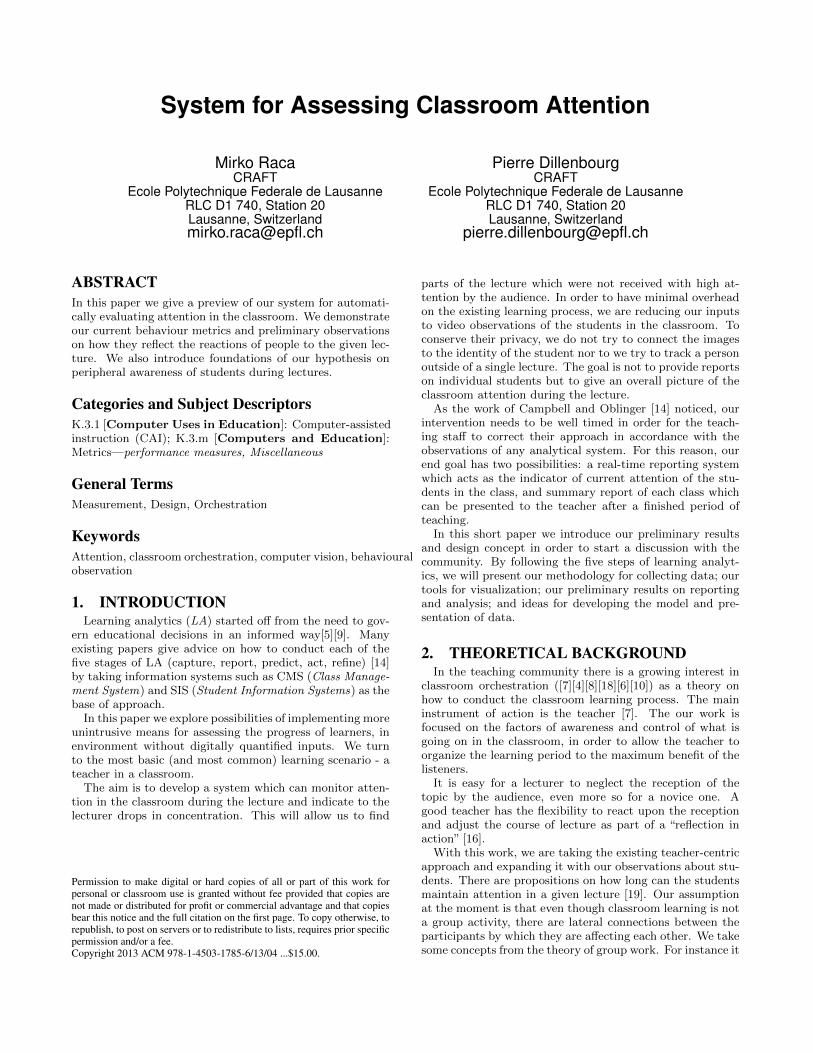
System for Assessing Classroom Attention Mirko Raca CRAFT Ecole Polytechnique Federale de Lausanne RLC D1 740, Station 20 Lausanne, Switzerland mirko.raca@epfl.ch Pierre Dillenbourg CRAFT Ecole Polytechnique Federale de Lausanne RLC D1 740, Station 20 Lausanne, Switzerland pierre.dillenbourg@epfl.ch ABSTRACT In this paper we give a preview of our system for automati- cally evaluating attention in the classroom. We demonstrate our current behaviour metrics and preliminary observations on how they reflect the reactions of people to the given lec- ture. We also introduce foundations of our hypothesis on peripheral awareness of students during lectures. Categories and Subject Descriptors K.3.1 [Computer Uses in Education]: Computer-assisted instruction (CAI); K.3.m [Computers and Education]: Metrics—performance measures, Miscellaneous General Terms Measurement, Design, Orchestration Keywords Attention, classroom orchestration, computer vision, behavioural observation 1. INTRODUCTION Learning analytics (LA) started off from the need to gov- ern educational decisions in an informed way[5][9]. Many existing papers give advice on how to conduct each of the five stages of LA (capture, report, predict, act, refine) [14] by taking information systems such as CMS (Class Manage- ment System) and SIS (Student Information Systems ) as the base of approach. In this paper we explore possibilities of implementing more unintrusive means for assessing the progress of learners, in environment without digitally quantified inputs. We turn to the most basic (and most common) learning scenario - a teacher in a classroom. The aim is to develop a system which can monitor atten- tion in the classroom during the lecture and indicate to the lecturer drops in concentration. This will allow us to find Permission to make digital or hard copies of all or part of this work for personal or classroom use is granted without fee provided that copies are not made or distributed for profit or commercial advantage and that copies bear this notice and the full citation on the first page. To copy otherwise, to republish, to post on servers or to redistribute to lists, requires prior specific permission and/or a fee. Copyright 2013 ACM 978-1-4503-1785-6/13/04 ...$15.00. parts of the lecture which were not received with high at- tention by the audience. In order to have minimal overhead on the existing learning process, we are reducing our inputs to video observations of the students in the classroom. To conserve their privacy, we do not try to connect the images to the identity of the student nor to we try to track a person outside of a single lecture. The goal is not to provide reports on individual students but to give an overall picture of the classroom attention during the lecture. As the work of Campbell and Oblinger [14] noticed, our intervention needs to be well timed in order for the teach- ing staff to correct their approach in accordance with the observations of any analytical system. For this reason, our end goal has two possibilities: a real-time reporting system which acts as the indicator of current attention of the stu- dents in the class, and summary report of each class which can be presented to the teacher after a finished period of teaching. In this short paper we introduce our preliminary results and design concept in order to start a discussion with the community. By following the five steps of learning analyt- ics, we will present our methodology for collecting data; our tools for visualization; our preliminary results on reporting and analysis; and ideas for developing the model and pre- sentation of data. 2. THEORETICAL BACKGROUND In the teaching community there is a growing interest in classroom orchestration ([7][4][8][18][6][10]) as a theory on how to conduct the classroom learning process. The main instrument of action is the teacher [7]. The our work is focused on the factors of awareness and control of what is going on in the classroom, in order to allow the teacher to organize the learning period to the maximum benefit of the listeners. It is easy for a lecturer to neglect the reception of the topic by the audience, even more so for a novice one. A good teacher has the flexibility to react upon the reception and adjust the course of lecture as part of a “reflection in action” [16]. With this work, we are taking the existing teacher-centric approach and expanding it with our observations about stu- dents. There are propositions on how long can the students maintain attention in a given lecture [19]. Our assumption at the moment is that even though classroom learning is not a group activity, there are lateral connections between the participants by which they are affecting each other. We take some concepts from the theory of group work. For instance it
Transcript of System for Assessing Classroom Attention · PDF fileSystem for Assessing Classroom Attention...
System for Assessing Classroom Attention
Mirko RacaCRAFT
Ecole Polytechnique Federale de LausanneRLC D1 740, Station 20Lausanne, [email protected]
Pierre DillenbourgCRAFT
Ecole Polytechnique Federale de LausanneRLC D1 740, Station 20Lausanne, Switzerland
ABSTRACTIn this paper we give a preview of our system for automati-cally evaluating attention in the classroom. We demonstrateour current behaviour metrics and preliminary observationson how they reflect the reactions of people to the given lec-ture. We also introduce foundations of our hypothesis onperipheral awareness of students during lectures.
Categories and Subject DescriptorsK.3.1 [Computer Uses in Education]: Computer-assistedinstruction (CAI); K.3.m [Computers and Education]:Metrics—performance measures, Miscellaneous
General TermsMeasurement, Design, Orchestration
KeywordsAttention, classroom orchestration, computer vision, behaviouralobservation
1. INTRODUCTIONLearning analytics (LA) started off from the need to gov-
ern educational decisions in an informed way[5][9]. Manyexisting papers give advice on how to conduct each of thefive stages of LA (capture, report, predict, act, refine) [14]by taking information systems such as CMS (Class Manage-ment System) and SIS (Student Information Systems) as thebase of approach.
In this paper we explore possibilities of implementing moreunintrusive means for assessing the progress of learners, inenvironment without digitally quantified inputs. We turnto the most basic (and most common) learning scenario - ateacher in a classroom.
The aim is to develop a system which can monitor atten-tion in the classroom during the lecture and indicate to thelecturer drops in concentration. This will allow us to find
Permission to make digital or hard copies of all or part of this work forpersonal or classroom use is granted without fee provided that copies arenot made or distributed for profit or commercial advantage and that copiesbear this notice and the full citation on the first page. To copy otherwise, torepublish, to post on servers or to redistribute to lists, requires prior specificpermission and/or a fee.Copyright 2013 ACM 978-1-4503-1785-6/13/04 ...$15.00.
parts of the lecture which were not received with high at-tention by the audience. In order to have minimal overheadon the existing learning process, we are reducing our inputsto video observations of the students in the classroom. Toconserve their privacy, we do not try to connect the imagesto the identity of the student nor to we try to track a personoutside of a single lecture. The goal is not to provide reportson individual students but to give an overall picture of theclassroom attention during the lecture.
As the work of Campbell and Oblinger [14] noticed, ourintervention needs to be well timed in order for the teach-ing staff to correct their approach in accordance with theobservations of any analytical system. For this reason, ourend goal has two possibilities: a real-time reporting systemwhich acts as the indicator of current attention of the stu-dents in the class, and summary report of each class whichcan be presented to the teacher after a finished period ofteaching.
In this short paper we introduce our preliminary resultsand design concept in order to start a discussion with thecommunity. By following the five steps of learning analyt-ics, we will present our methodology for collecting data; ourtools for visualization; our preliminary results on reportingand analysis; and ideas for developing the model and pre-sentation of data.
2. THEORETICAL BACKGROUNDIn the teaching community there is a growing interest in
classroom orchestration ([7][4][8][18][6][10]) as a theory onhow to conduct the classroom learning process. The maininstrument of action is the teacher [7]. The our work isfocused on the factors of awareness and control of what isgoing on in the classroom, in order to allow the teacher toorganize the learning period to the maximum benefit of thelisteners.
It is easy for a lecturer to neglect the reception of thetopic by the audience, even more so for a novice one. Agood teacher has the flexibility to react upon the receptionand adjust the course of lecture as part of a “reflection inaction” [16].
With this work, we are taking the existing teacher-centricapproach and expanding it with our observations about stu-dents. There are propositions on how long can the studentsmaintain attention in a given lecture [19]. Our assumptionat the moment is that even though classroom learning is nota group activity, there are lateral connections between theparticipants by which they are affecting each other. We takesome concepts from the theory of group work. For instance it

Figure 1: Snapshot of the tool for video synchroni-sation, annotation and a sample of our recording ofa class
is noticed in [15] that contribution of non-conforming groupmembers is perceived as of higher importance then the workof conforming members. We tend to see similar behaviour inreaction to non-conforming audience members paying atten-tion and we are interested to see how this influences otherparticipants. We aim to capture spatial propagations of at-tention or distraction among students, which we currentlycall “distraction ripples”. The idea is that even though theteacher is the dominant influence, students are not isolatedfrom their surrounding. Our approach can be considered asa counterpart to the research conducted on teacher’s move-ment [13] which we already see as a big influence on at-tention of students [7]. We have also seen how peripheralawareness can be used to improve classroom interaction [4],and we aim to achieve similar reactions with less intrusiveinput methods.
3. STATE OF RESEARCHAfter establishing the theoretical base of our research we
present our activities, tools and cues for analysing classroomattention. We are classifying our activities in accordancewith the five steps of learning analytics [14].
3.1 CaptureOur main source of data are captured videos of classrooms.
This is consistent with our determination of making a min-imal impact on the classroom existing ecosystem, since theneeded modification consists of inserting observational cam-eras, which are a passive way of collecting data and requireno interaction on the subjects side. We are motivated totake this approach with the maturing of computer visiontechnologies [11] and gradual demystification of human per-ception [12].
Our setup for collecting data consists of a system of 3to 4 cameras, of which one is observing the lecturer andthe others are used for capturing audience reactions. OnFigure 1 we see one of the recordings in the video synchro-nisation and annotation tool. This allows us to collect, forevery recorded lecture, events such as changes of slides, theirduration, amount of questions-answers, annotate person lo-cations in the classroom and other properties.
In addition to this, on a limited number of classes, we also
Figure 2: Spatial display of activities in class. Toprepresents the front of the class. Size of red circlesshows reported level of attention. The blue ringsindicate subjects that marked that they took notesduring that period of the lecture.
collect self-reported levels of attention and actions by meansof questionnaires. At four moments during the class, thestudents are asked to stop and report their level of attentionand activities they were doing during the period, whetherpositive or negative. As noted in Section 2, we take interestinto spatial distribution of student actions, and note thelocation of each subject in the classroom. A sample of ourdata and visualization can be seen on Figure 2.
In our visualisation tool, we are able to choose a set ofattributes that we want to display (Figure 2), in order toexplore how the activities are changing over space and time(at each of the 4 different interruptions). The reason whywe did not use one of the existing tools such as Gephi [2]or Cytoscape [1] is that we have a predetermined layout ofthe graph, with small number of nodes and big variabilityof display styles which we would like to dynamically changeduring a presentation. For this reason, we hope that oursolution, based on Processing library [3], will provide bettervisualisations for the intended domain, while it has no in-tention to compete with the above mentioned tools for otherpurposes.
3.2 ReportIn the exploratory phase of the research we are testing
different visual indicators of attention during the lecture.We are currently focused on two aspects - quantifying bodymotion and estimation of gaze direction.
Gaze direction has proven to be high importance cue forhuman interaction, as it is extensively written in Chapter 6of [12]. For our usage, we can not assume that we will havehigh enough resolution of data to estimate the precise pointof observation. We are aiming to reach rough estimation,and separation of 3 distinct directions: i) the teacher/slides,ii) notebook/bench and iii) other directions, which shouldbe reachable even given the low resolution of current input ifwe take into consideration position of the entire head, similarto [17].
We tested our motion metrics by annotating regions inwhich each student resides and measuring the amount ofmovement inside of it. Directions of movement in the ninemeasured sub-regions for each student can be seen on Fig-ure 3. The current approach is based on estimating opticalflow between 2 images by usage of iterative Lucas-Kanademethod [20], which we found to be a good combination ofspeed and robustness.
We find it encouraging that even without localizing the
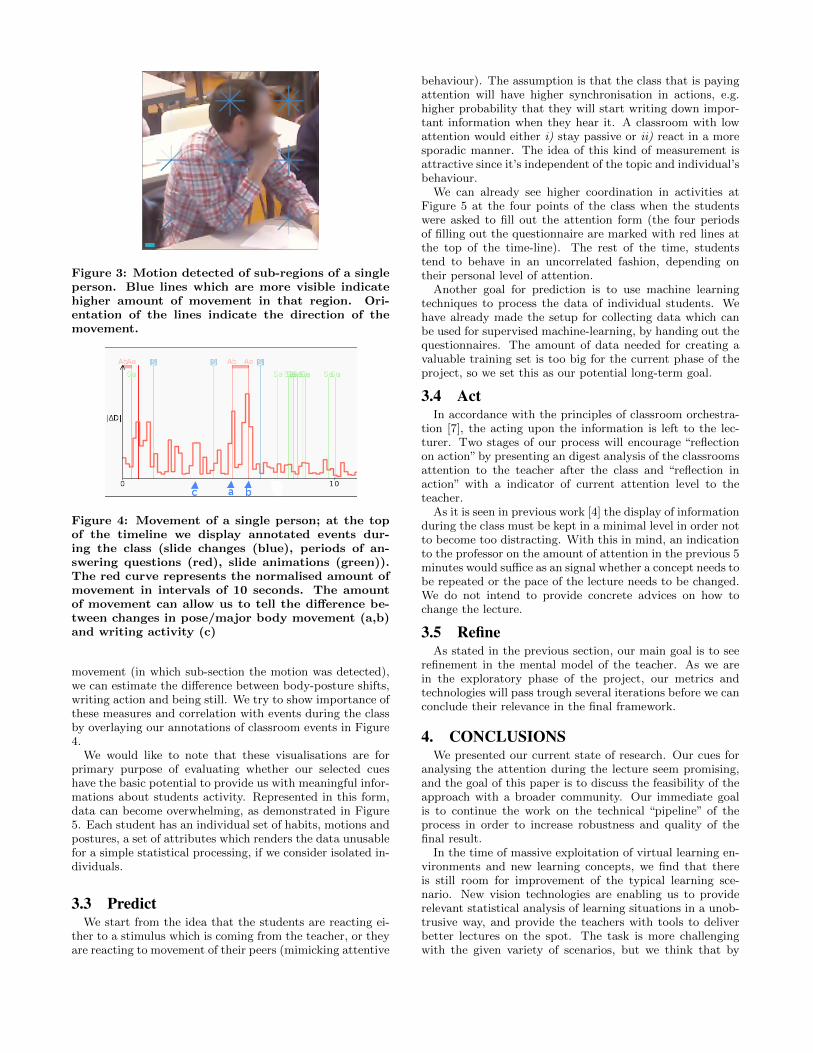
Figure 3: Motion detected of sub-regions of a singleperson. Blue lines which are more visible indicatehigher amount of movement in that region. Ori-entation of the lines indicate the direction of themovement.
Figure 4: Movement of a single person; at the topof the timeline we display annotated events dur-ing the class (slide changes (blue), periods of an-swering questions (red), slide animations (green)).The red curve represents the normalised amount ofmovement in intervals of 10 seconds. The amountof movement can allow us to tell the difference be-tween changes in pose/major body movement (a,b)and writing activity (c)
movement (in which sub-section the motion was detected),we can estimate the difference between body-posture shifts,writing action and being still. We try to show importance ofthese measures and correlation with events during the classby overlaying our annotations of classroom events in Figure4.
We would like to note that these visualisations are forprimary purpose of evaluating whether our selected cueshave the basic potential to provide us with meaningful infor-mations about students activity. Represented in this form,data can become overwhelming, as demonstrated in Figure5. Each student has an individual set of habits, motions andpostures, a set of attributes which renders the data unusablefor a simple statistical processing, if we consider isolated in-dividuals.
3.3 PredictWe start from the idea that the students are reacting ei-
ther to a stimulus which is coming from the teacher, or theyare reacting to movement of their peers (mimicking attentive
behaviour). The assumption is that the class that is payingattention will have higher synchronisation in actions, e.g.higher probability that they will start writing down impor-tant information when they hear it. A classroom with lowattention would either i) stay passive or ii) react in a moresporadic manner. The idea of this kind of measurement isattractive since it’s independent of the topic and individual’sbehaviour.
We can already see higher coordination in activities atFigure 5 at the four points of the class when the studentswere asked to fill out the attention form (the four periodsof filling out the questionnaire are marked with red lines atthe top of the time-line). The rest of the time, studentstend to behave in an uncorrelated fashion, depending ontheir personal level of attention.
Another goal for prediction is to use machine learningtechniques to process the data of individual students. Wehave already made the setup for collecting data which canbe used for supervised machine-learning, by handing out thequestionnaires. The amount of data needed for creating avaluable training set is too big for the current phase of theproject, so we set this as our potential long-term goal.
3.4 ActIn accordance with the principles of classroom orchestra-
tion [7], the acting upon the information is left to the lec-turer. Two stages of our process will encourage “reflectionon action” by presenting an digest analysis of the classroomsattention to the teacher after the class and “reflection inaction” with a indicator of current attention level to theteacher.
As it is seen in previous work [4] the display of informationduring the class must be kept in a minimal level in order notto become too distracting. With this in mind, an indicationto the professor on the amount of attention in the previous 5minutes would suffice as an signal whether a concept needs tobe repeated or the pace of the lecture needs to be changed.We do not intend to provide concrete advices on how tochange the lecture.
3.5 RefineAs stated in the previous section, our main goal is to see
refinement in the mental model of the teacher. As we arein the exploratory phase of the project, our metrics andtechnologies will pass trough several iterations before we canconclude their relevance in the final framework.
4. CONCLUSIONSWe presented our current state of research. Our cues for
analysing the attention during the lecture seem promising,and the goal of this paper is to discuss the feasibility of theapproach with a broader community. Our immediate goalis to continue the work on the technical “pipeline” of theprocess in order to increase robustness and quality of thefinal result.
In the time of massive exploitation of virtual learning en-vironments and new learning concepts, we find that thereis still room for improvement of the typical learning sce-nario. New vision technologies are enabling us to providerelevant statistical analysis of learning situations in a unob-trusive way, and provide the teachers with tools to deliverbetter lectures on the spot. The task is more challengingwith the given variety of scenarios, but we think that by
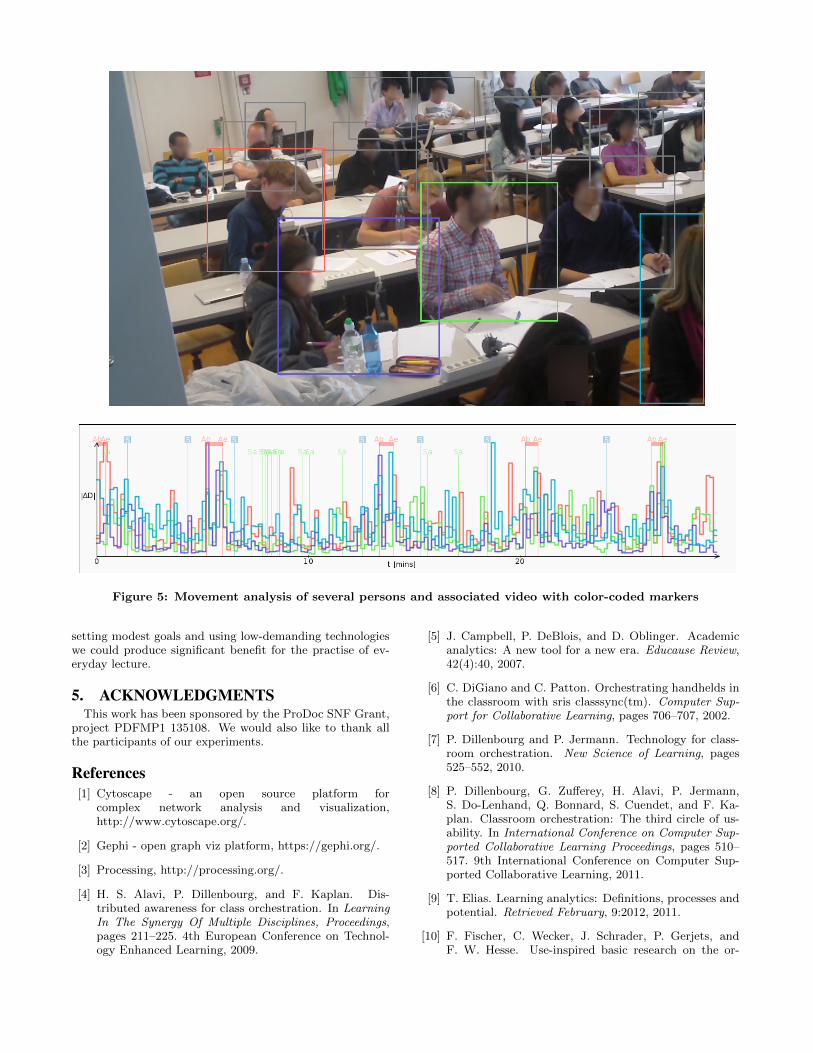
Figure 5: Movement analysis of several persons and associated video with color-coded markers
setting modest goals and using low-demanding technologieswe could produce significant benefit for the practise of ev-eryday lecture.
5. ACKNOWLEDGMENTSThis work has been sponsored by the ProDoc SNF Grant,
project PDFMP1 135108. We would also like to thank allthe participants of our experiments.
References[1] Cytoscape - an open source platform for
complex network analysis and visualization,http://www.cytoscape.org/.
[2] Gephi - open graph viz platform, https://gephi.org/.
[3] Processing, http://processing.org/.
[4] H. S. Alavi, P. Dillenbourg, and F. Kaplan. Dis-tributed awareness for class orchestration. In LearningIn The Synergy Of Multiple Disciplines, Proceedings,pages 211–225. 4th European Conference on Technol-ogy Enhanced Learning, 2009.
[5] J. Campbell, P. DeBlois, and D. Oblinger. Academicanalytics: A new tool for a new era. Educause Review,42(4):40, 2007.
[6] C. DiGiano and C. Patton. Orchestrating handhelds inthe classroom with sris classsync(tm). Computer Sup-port for Collaborative Learning, pages 706–707, 2002.
[7] P. Dillenbourg and P. Jermann. Technology for class-room orchestration. New Science of Learning, pages525–552, 2010.
[8] P. Dillenbourg, G. Zufferey, H. Alavi, P. Jermann,S. Do-Lenhand, Q. Bonnard, S. Cuendet, and F. Ka-plan. Classroom orchestration: The third circle of us-ability. In International Conference on Computer Sup-ported Collaborative Learning Proceedings, pages 510–517. 9th International Conference on Computer Sup-ported Collaborative Learning, 2011.
[9] T. Elias. Learning analytics: Definitions, processes andpotential. Retrieved February, 9:2012, 2011.
[10] F. Fischer, C. Wecker, J. Schrader, P. Gerjets, andF. W. Hesse. Use-inspired basic research on the or-
chestration of cognition, instruction and technology inthe classroom. EARLI, 2005.
[11] D. A. Forsyth and J. Ponce. Computer Vision: A Mod-ern Approach. Prentice Hall, 2011.
[12] R. B. A. Jr, N. Ambady, K. Nakayama, and S. Shimojo.The Science of Social Vision. Oxford Series in VisualCognition, 2010.
[13] F. Lim, K. L. O’Halloran, and A. Podlasov. Spatialpedagogy: mapping meanings in the use of classroomspace. pages 235–251, May 2012.
[14] D. Oblinger and J. Campbell. Academic analytics, ed-ucause white paper. Retrieved October, 20:2011, 2007.
[15] C. Ridgeway. Conformity, group-oriented motivationand status attainment in small groups. Social psychol-ogy, pages 175–188, 1978.
[16] D. Schon. The reflective practitioner: How professionalsthink in action, volume 5126. Basic Books, 1984.
[17] R. Stiefelhagen. Tracking focus of attention in meet-ings. In Multimodal Interfaces, 2002. Proceedings.Fourth IEEE International Conference on, pages 273–280. IEEE, 2002.
[18] C. A. Tomlinson. The Differentiated Classroom: Re-sponding to the Needs of All Learner. Pearson, 1999.
[19] K. Wilson and J. H. Korn. Attention during lectures:Beyond ten minutes. Teaching of Psychology, pages 85–89, December 2007.
[20] J.-Y. Bouguet. Pyramidal Implementation of the AffineLucas-Kanade Feature Tracker Description of the algo-rithm Inter corp. 2010