SYNTHETIC, CALCIUM-BASED SORBENTS FOR THE CAPTURE OF CO 2 SUMMARY OF RESULTS AND MODELLING J. S....
33
SYNTHETIC, CALCIUM-BASED SYNTHETIC, CALCIUM-BASED SORBENTS FOR THE CAPTURE SORBENTS FOR THE CAPTURE OF CO OF CO 2 2 SUMMARY OF RESULTS AND SUMMARY OF RESULTS AND MODELLING MODELLING J. S. Dennis and R. Pacciani J. S. Dennis and R. Pacciani University of Cambridge University of Cambridge Department of Chemical Department of Chemical Engineering Engineering [email protected] [email protected] [email protected] [email protected]
-
Upload
lambert-crawford -
Category
Documents
-
view
236 -
download
0
Transcript of SYNTHETIC, CALCIUM-BASED SORBENTS FOR THE CAPTURE OF CO 2 SUMMARY OF RESULTS AND MODELLING J. S....

SYNTHETIC, CALCIUM-BASED SYNTHETIC, CALCIUM-BASED SORBENTS FOR THE CAPTURE SORBENTS FOR THE CAPTURE
OF COOF CO22
SUMMARY OF RESULTS AND SUMMARY OF RESULTS AND MODELLINGMODELLING
J. S. Dennis and R. PaccianiJ. S. Dennis and R. PaccianiUniversity of CambridgeUniversity of Cambridge
Department of Chemical EngineeringDepartment of Chemical Engineering
[email protected]@[email protected]@cam.ac.uk

• The challenge is to find a sorbent which The challenge is to find a sorbent which
can be reused many times.can be reused many times.
• Natural limestone (mainly CaCONatural limestone (mainly CaCO33) degrades. ) degrades.
How can it be improved, based on a fundamental How can it be improved, based on a fundamental understanding of the reactions involved? Synthetic sorbents?understanding of the reactions involved? Synthetic sorbents?
ZECA – Generation of HZECA – Generation of H22 from coal and pure CO from coal and pure CO2 2 for for
sequestrationsequestration
Gasifier Reformer Calciner
4 H2
Fuel Cell
Air
CaCO3
CaO
C(s)
Work
Shift Reactor
CO + 3H2
+ H2O
CH4
2H2
2H2O
CO2
2H2O

COCO22 + CaO + CaO CaCO CaCO33**
* * The percentage completion of this reaction is theThe percentage completion of this reaction is the
carrying capacitycarrying capacity of the solid sorbent. of the solid sorbent.
Either mol CO2/mol CaO or g CO2/g calcined sorbent
KEY REACTIONSKEY REACTIONS
CalcinationCalcinationCaCOCaCO33 CaO + CO CaO + CO22
CarbonationCarbonation
C + 2HC + 2H2 2 CH CH44HydrogasificationHydrogasification
CHCH44 + H + H22OO CO + 3H CO + 3H22Reforming Reforming
CO + HCO + H22OO COCO22 + H + H22Watergas Shift Watergas Shift Separation of Separation of
HH22 and CO and CO22
Regeneration Regeneration of sorbent: of sorbent:
COCO22 to storage to storage

Typical experimental conditions:– Atmospheric pressure.Atmospheric pressure.– T = 600 – 900T = 600 – 900ooC (constant for an experiment). C (constant for an experiment). – Partial pressure of COPartial pressure of CO22 in N in N22 = 0 (calcination) and 0.14-0.8 bar (carbonation). = 0 (calcination) and 0.14-0.8 bar (carbonation).– Sorbent particles dSorbent particles dp p = 500-710 = 500-710 m.m.
fluidised bed
EXPERIMENTAL APPARATUSEXPERIMENTAL APPARATUS
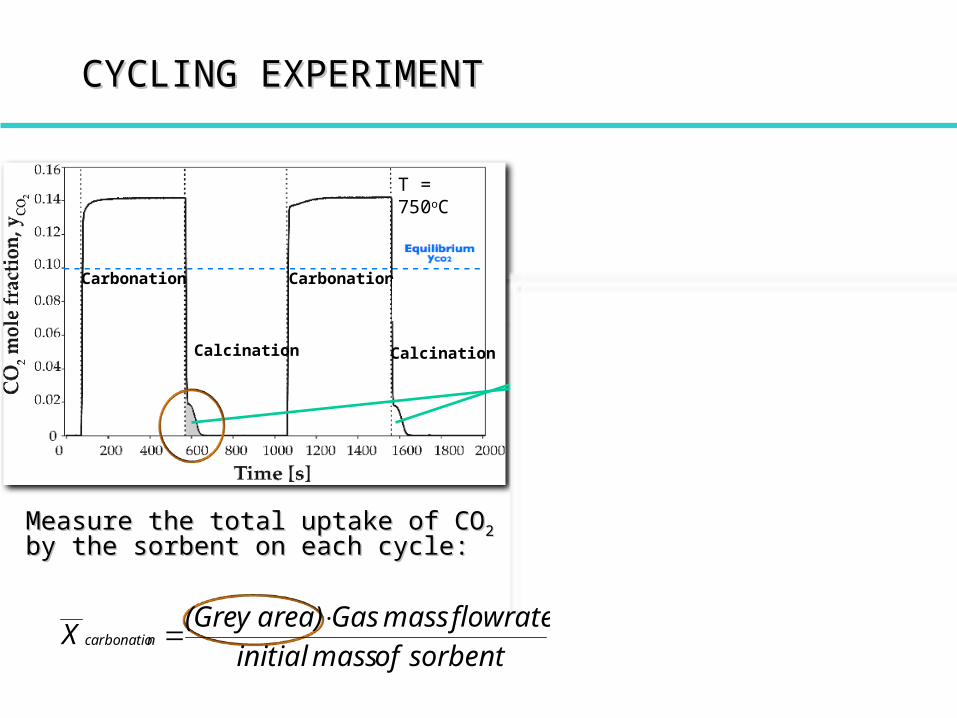
Measure the total uptake of COMeasure the total uptake of CO22 by by the sorbent on each cycle:the sorbent on each cycle:
Carbonation
Calcination Calcination
sorbentof mass initial
flowrate mass Gasarea)(Grey X ncarbonatio
Carbonation
T = 750oC
CYCLING EXPERIMENTCYCLING EXPERIMENT

CARRYING CAPACITY OF NATURAL SORBENTS CARRYING CAPACITY OF NATURAL SORBENTS Limestone vs. Eggshell
Extended cycles of Extended cycles of calcination and calcination and carbonationcarbonation
Uptake of COUptake of CO22
confirmed by XRD confirmed by XRD analysis of analysis of carbonated material.carbonated material.
Surprising Surprising similarities for similarities for disparate materials!disparate materials!
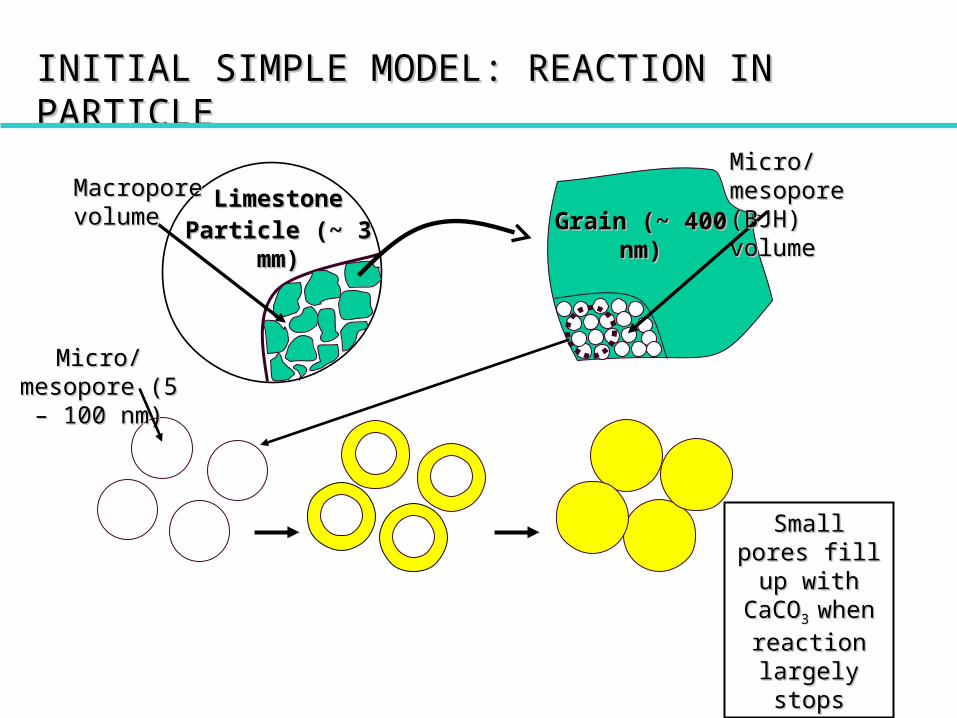
INITIAL SIMPLE MODEL: REACTION IN PARTICLEINITIAL SIMPLE MODEL: REACTION IN PARTICLE
Macropore Macropore volumevolume
Micro/mesopore Micro/mesopore (BJH) volume (BJH) volume
GrainGrain (~ 400 nm)(~ 400 nm)LimestoneLimestone
Particle (~ 3 mm)Particle (~ 3 mm)
Micro/mesopore Micro/mesopore (5 – 100 nm)(5 – 100 nm)
Small pores fill Small pores fill up with CaCOup with CaCO3 3
when reaction when reaction largely stopslargely stops
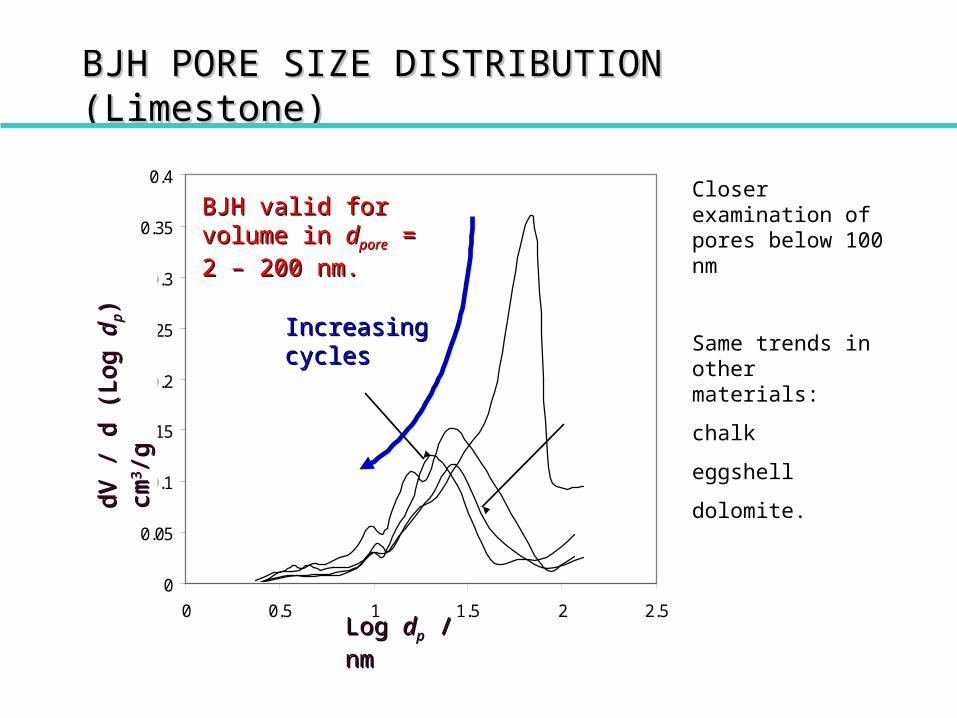
BJH PORE SIZE DISTRIBUTION (Limestone)BJH PORE SIZE DISTRIBUTION (Limestone)
0
0.05
0.1
0.15
0.2
0.25
0.3
0.35
0.4
0 0.5 1 1.5 2 2.5
(1 0)
(2 1)
(30 29)
(16 15)
Log Log ddpp / nm / nm
dV /
d (L
og
dV /
d (L
og dd
pp) c
m)
cm33 /g/
g
Closer examination of pores below 100 nm
Same trends in other materials:
chalk
eggshell
dolomite.
BJH valid for volume BJH valid for volume in in ddporepore = 2 – 200 nm. = 2 – 200 nm.
Increasing cyclesIncreasing cycles

y = 1.0746x + 0.1335R2 = 0.8204
0
0.1
0.2
0.3
0.4
0.5
0.6
0.7
0.8
0.9
1
0 0.1 0.2 0.3 0.4 0.5 0.6 0.7 0.8 0.9 1
For range of limestones: Purbeck, Cadomin, Penrith, Glen Morrison, Havelock.Best fit regression line fitted.
FRACTIONAL CARRYING CAPACITYFRACTIONAL CARRYING CAPACITY F
ract
ion
al C
arry
ing
Cap
acit
y (E
xptl
.)
Theoretical Conversion of BJH Volume
Typical residual constant conversion of ~13% is typical of limestone.
Conclusion holds for Conclusion holds for other materials – chalk, other materials – chalk, eggshell, etc. These have eggshell, etc. These have muchmuch different/larger different/larger macropore volumes than macropore volumes than limestone but limestone but comparablecomparable micropore micropore volumes. volumes.
BUTBUT they have similar they have similar capacity and decay of capacity and decay of capacity with cycle.capacity with cycle.
Fennell, Pacciani, Dennis, Davidson & Hayhurst, Energy Fuels, 21, 2072 (2007)

• The uptake of limestone decreases with increasing number of cycles.
• This is caused by loss in pore volume contained in the small pores (< 200 nm dia.) – sintering occurs.
• This is valid for other natural sorbents (e.g. dolomite and chalk) which have similar pore size distributions.
• Can this be improved upon?Can this be improved upon?
RESULTS - NATURAL SORBENTSRESULTS - NATURAL SORBENTS

• Aim: - a porous particle, resistant to loss of micropores by sintering effects, with high, constant reactivity over large number of cycles.
• Explored CaO supported on inert materials to provide – mechanical strength
– to investigate if an inert support will prevent micropore migration/agglomeration during calcination
• Methods investigated*:– Impregnation Impregnation
– Mechanical mixingMechanical mixing
– CoprecipitationCoprecipitation
– Hydrolysis:Hydrolysis:• CaO dispersed on MgO or CaCaO dispersed on MgO or Ca1212AlAl1414OO3333 (mayenite) (mayenite)
PREPARATION OF SYNTHETIC SORBENTSPREPARATION OF SYNTHETIC SORBENTS
*Full details: Pacciani, Müller, Davidson, Dennis & Hayhurst, Can. J. Chem. Eng., 86, 356 (2008)

HA-85-850
Pacciani, Müller, Davidson, Dennis & Hayhurst, Can. J. Chem. Eng., 86, 356 (2008)
BBJH analysis measures the volume in pores with dpore < 200 nm.
RESULTS - NOVEL SORBENTSRESULTS - NOVEL SORBENTSC
O2 U
pta
ke, g
CO
2/g
so
rben
t
T = 750oC, carbonation:14 mol% CO2 in N2, calcination: 100 mol% N2

HA-85-850
Number of cycles
RESULTS - NOVEL SORBENTSRESULTS - NOVEL SORBENTSC
O2 U
pta
ke, g
CO
2/g
so
rben
t
New sorbent - capacity loss much less. Capacity increases with [CO2]
Micropore volume increases with [CO2]
Natural sorbent - uptake degrades with no. of cycles of sorption &
regeneration. Insensitive to [CO2]
Micropore volume continuously decreases
Pacciani, Müller, Davidson, Dennis & Hayhurst, A.I.Ch.E.J., paper accepted, July 2008

Some Observations from Some Observations from ModellingModelling
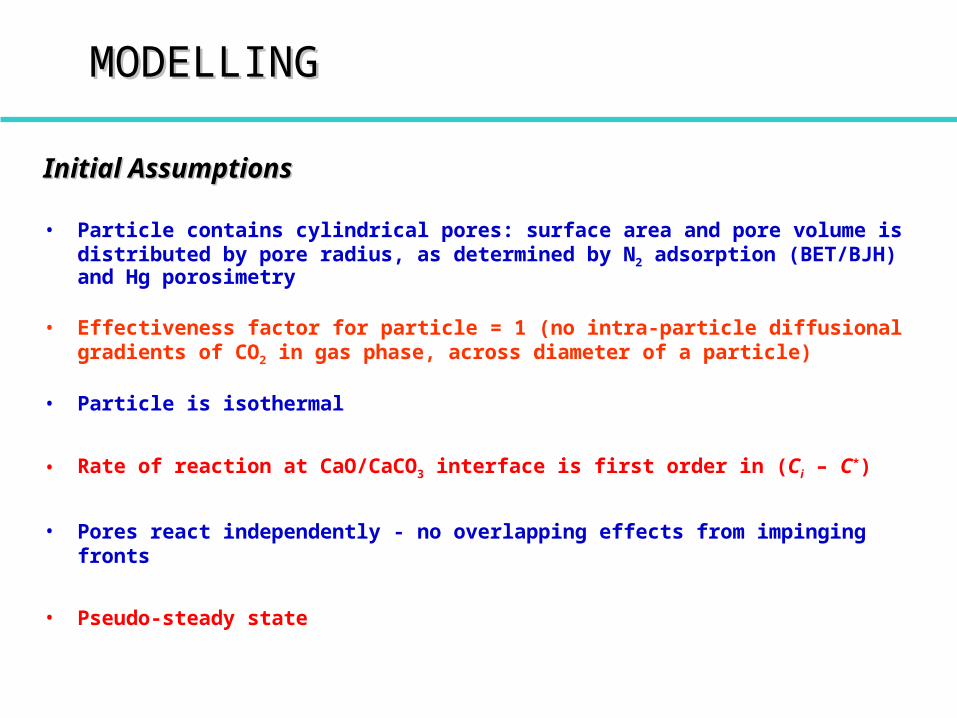
Initial AssumptionsInitial Assumptions
• Particle contains cylindrical pores: surface area and pore volume is distributed by pore radius, as determined by N2 adsorption (BET/BJH) and Hg porosimetry
• Effectiveness factor for particle = 1 (no intra-particle diffusional gradients of CO2 in gas phase, across diameter of a particle)
• Particle is isothermal
• Rate of reaction at CaO/CaCO3 interface is first order in (Ci – C*)
• Pores react independently - no overlapping effects from impinging fronts
• Pseudo-steady state
MODELLINGMODELLING

MODELLINGMODELLING
• Rate of increase in radius of CaCO3/CaO interface for jth pore size:
• Reaction rate in all pores, initial size roj:
dt
dr
r
r
V
SQ
r
r
D
kr
CCkV
dt
dr
cj
soj
cj
CaO
jj
ji
cj
s
cj
CaOcj
,ln1
)(
C* - equilibrium concentration
Ds - diffusivity of CO2 in CaCO3 product
ri,j
Ci
C
rcj
product CaCO3
Cross-section of Reacting Pore - Initial Radius roj
unreacted CaO
pore space
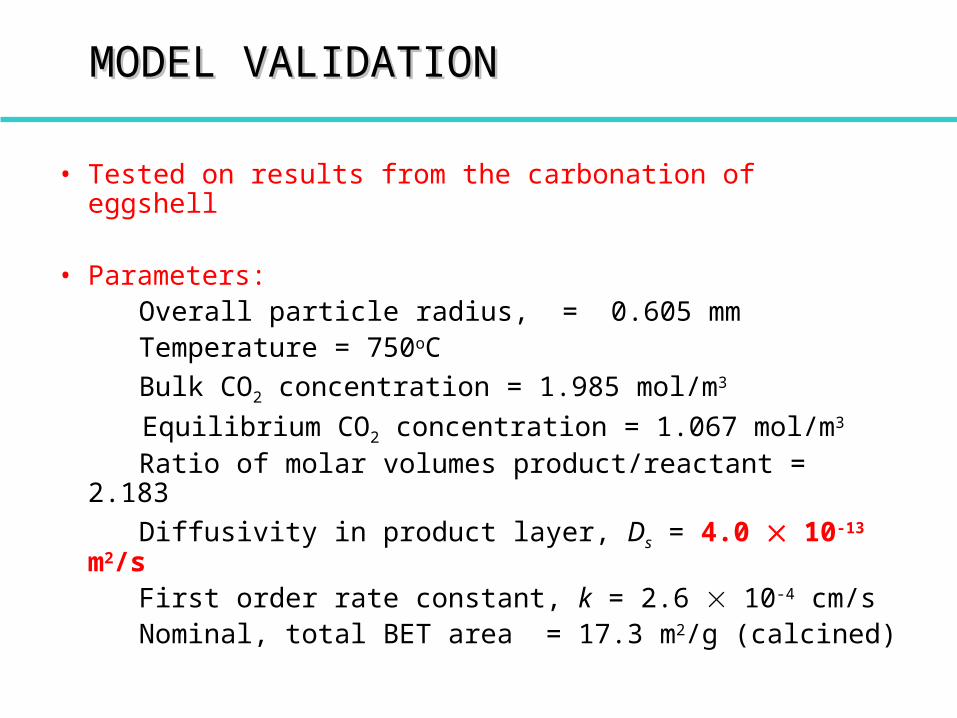
MODEL VALIDATIONMODEL VALIDATION
• Tested on results from the carbonation of eggshell
• Parameters: Overall particle radius, = 0.605 mm Temperature = 750oC
Bulk CO2 concentration = 1.985 mol/m3
Equilibrium CO2 concentration = 1.067 mol/m3
Ratio of molar volumes product/reactant = 2.183
Diffusivity in product layer, Ds = 4.0 10-13 m2/s First order rate constant, k = 2.6 10-4 cm/s Nominal, total BET area = 17.3 m2/g (calcined)
Reducing Ds to 4 10-16 m2/s
Rate vs. time for Eggshell, 1st Calcination
0.00E+00
1.00E-05
2.00E-05
3.00E-05
4.00E-05
5.00E-05
0 100 200 300 400 500 600
time, s
rate
, m
ol C
O2/s
/g
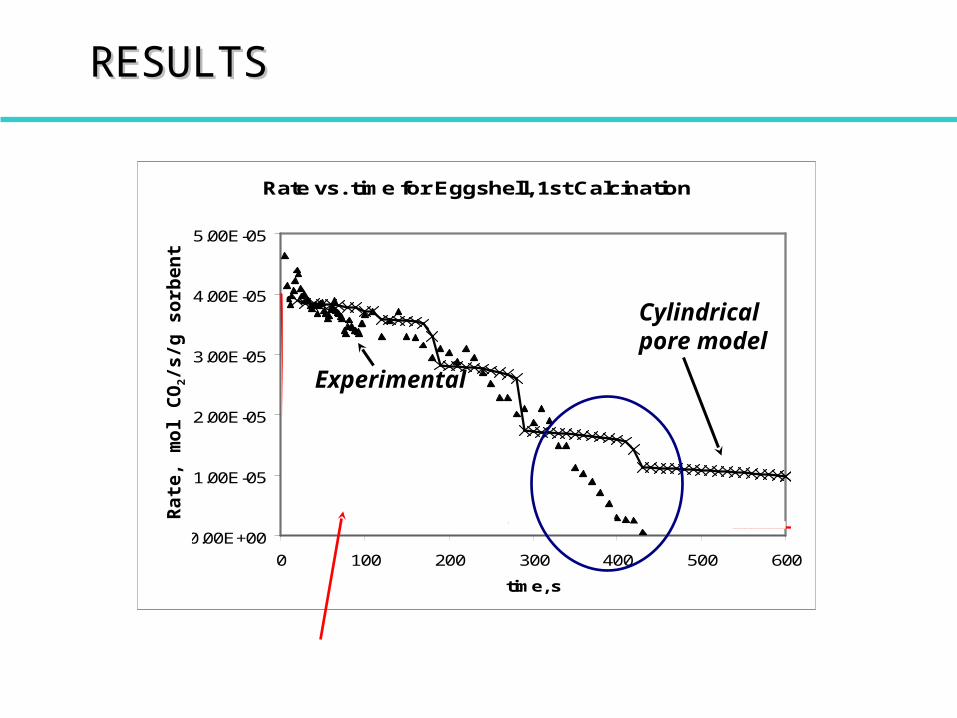
RESULTSRESULTS
Experimental
Cylindrical pore model
Rat
e, m
ol
CO
2/s
/g s
orb
ent
Rate vs. time for Eggshell, 1st Calcination
0.00E+00
1.00E-05
2.00E-05
3.00E-05
4.00E-05
5.00E-05
0 100 200 300 400 500 600
time, s
rate
, mo
l CO
2/s
/g c
alc
ine
d
ma
teri
al
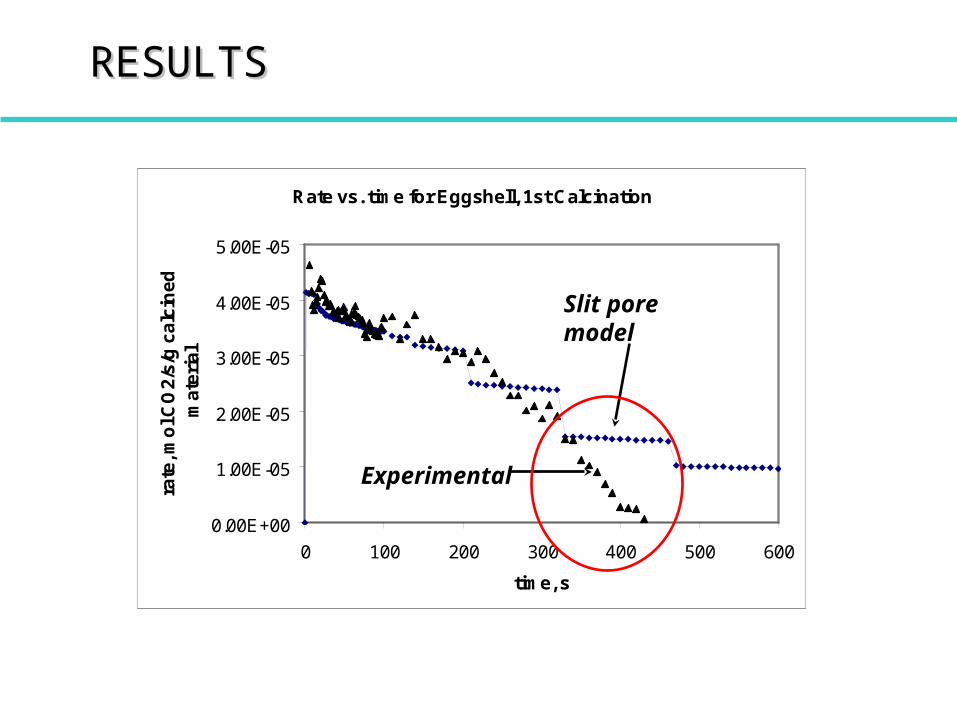
RESULTSRESULTS
Experimental
Slit pore model

Uptake vs. time for Eggshell, 1st Calcination
0
0.004
0.008
0.012
0.016
0 100 200 300 400 500 600
time, s
up
take
, m
ol
CO
2/g
cal
cin
ed
mat
eria
l
RESULTSRESULTS
Experimental
Slit pore model
Cylindrical pore model

A Model for the Prediction of A Model for the Prediction of Maximum UptakeMaximum Uptake
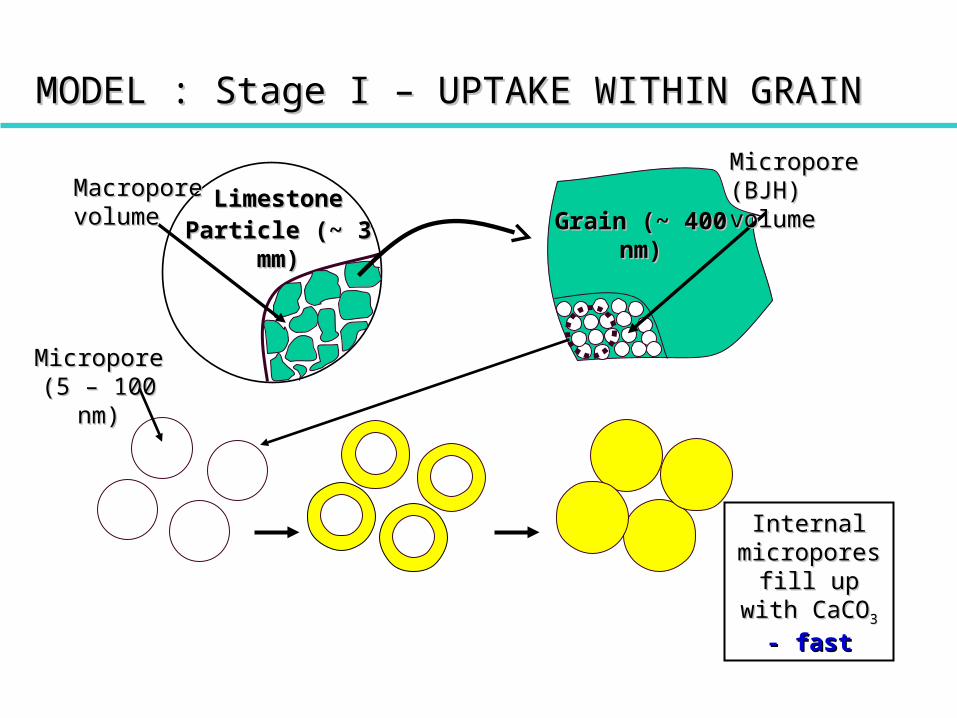
MODEL : Stage I – UPTAKE WITHIN GRAINMODEL : Stage I – UPTAKE WITHIN GRAIN
Macropore Macropore volumevolume
Micropore (BJH) Micropore (BJH) volume volume
GrainGrain (~ 400 nm)(~ 400 nm)LimestoneLimestone
Particle (~ 3 mm)Particle (~ 3 mm)
Micropore (5 – Micropore (5 – 100 nm)100 nm)
Internal Internal micropores fill micropores fill up with CaCOup with CaCO3 3
- fast- fast

RESULTS FOR HA-85-850 - Conversion of Grains OnlyRESULTS FOR HA-85-850 - Conversion of Grains Only
0
0.1
0.2
0.3
0.4
0.5
0.6
0 0.1 0.2 0.3 0.4 0.5 0.6
Predicted Uptake in Grains, g CO2/g sorbent
Exp
erim
enta
l U
pta
ke,
g C
O2/
g
sorb
ent
PCO2: 0.14 – 0.80 bar
Cycles: 1 – 23
T: 750 & 850oC

MODEL: Stage II – PREDICTION OF MAXIMUM MODEL: Stage II – PREDICTION OF MAXIMUM PRODUCT LAYER THICKNESS AROUND GRAINPRODUCT LAYER THICKNESS AROUND GRAIN
Unreacted CaOUnreacted CaO
Reaction Reaction interfaceinterface
Nanocrystallites Nanocrystallites of CaCOof CaCO33 build build
up as productup as product
Internal micropore Internal micropore already filled with CaCOalready filled with CaCO33
dd
Elastic modulus, E*
101.173/12
4
d
EE
GPaGPa
d ~ 15 nm ~ 0.5 - 1 J/m2
Slowly growing Slowly growing product layer around product layer around grain develops tensile grain develops tensile hoop stresshoop stress

MODEL: Stage II – PREDICTION OF MAXIMUM MODEL: Stage II – PREDICTION OF MAXIMUM PRODUCT LAYER THICKNESS AROUND GRAINPRODUCT LAYER THICKNESS AROUND GRAIN
• Cannot be a Cannot be a solidsolid product layer – how would pores fill? product layer – how would pores fill?
• Product layer around grain consists of nanocrystallites: very high Product layer around grain consists of nanocrystallites: very high elastic modulus owing to small size (~ 15 nm) and interface energy elastic modulus owing to small size (~ 15 nm) and interface energy (~ 0.5 J/m(~ 0.5 J/m22). Treat as thin shell under tension.). Treat as thin shell under tension.
• Thermodynamic model Thermodynamic model (adaptation of Duo, Grace, Clift & Seville)(adaptation of Duo, Grace, Clift & Seville): : GGoveralloverall = = GGreactionreaction
+ + GGnucleationnucleation
+ Mechanical strain energy stored in the product layer+ Mechanical strain energy stored in the product layer
• Gives an expression for Gives an expression for maximum maximum product layer thickness, product layer thickness, hh, as , as function of [COfunction of [CO22], ], TT, , ZZ = vol product/vol reactant = vol product/vol reactant etc.etc.
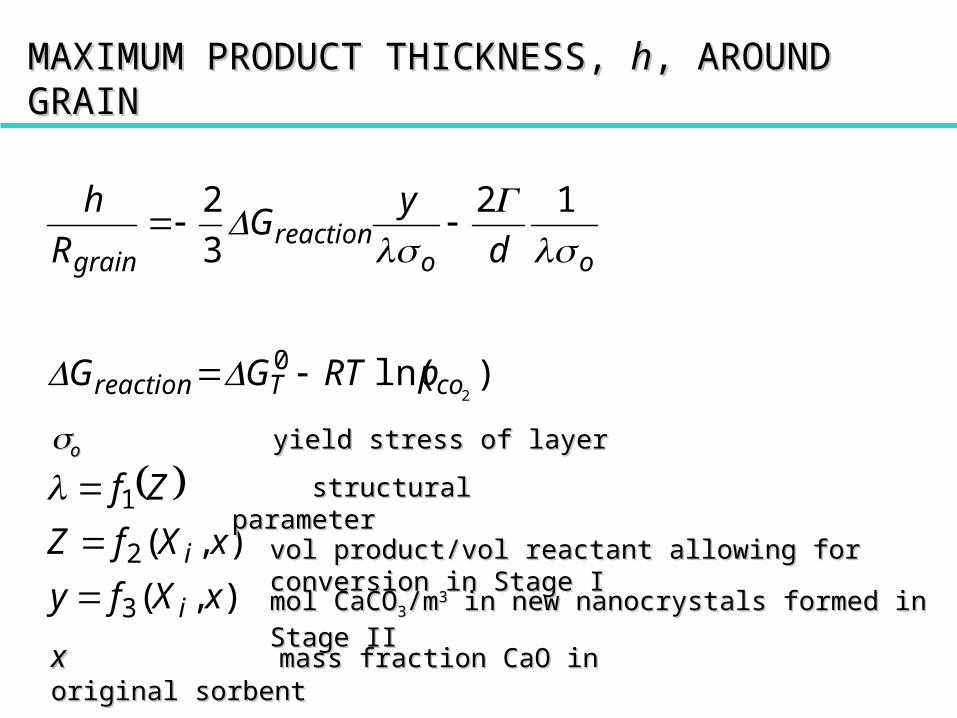
MAXIMUM PRODUCT THICKNESS, MAXIMUM PRODUCT THICKNESS, hh, AROUND , AROUND GRAINGRAIN
),(
),(
)ln(
12
3
2
3
2
1
02
xXfy
xXfZ
Zf
pRTGG
d
yG
R
h
i
i
coTreaction
ooreaction
grain
structural parameterstructural parameter
vol product/vol reactant allowing for conversion in Stage Ivol product/vol reactant allowing for conversion in Stage I
mol CaCOmol CaCO33/m/m33 in new nanocrystals formed in Stage II in new nanocrystals formed in Stage II
xx mass fraction CaO in original sorbentmass fraction CaO in original sorbent
oo yield stress of layeryield stress of layer

RESULTS FOR HA-85-850 - Grains plus Limiting Surface RESULTS FOR HA-85-850 - Grains plus Limiting Surface Layer Around GrainsLayer Around Grains
0
0.1
0.2
0.3
0.4
0.5
0.6
0 0.1 0.2 0.3 0.4 0.5 0.6
Predicted Uptake, Grains + Surface Layer g CO2/g sorbent
Exp
erim
enta
l U
pta
ke,
g C
O2/
g s
orb
ent
PCO2: 0.14 – 0.80 bar
Cycles: 1 – 23
T: 750 & 850oC

SULPHATION BEHAVIOUR, HA-85-850SULPHATION BEHAVIOUR, HA-85-850
T = 850oCbatch w = 0.03 gdp = 500 - 710 m5.2% O2
2200 ppm SO2
N2 at balance
0.000
0.100
0.200
0.300
0.400
0.500
0 100 200 300 400 500 600 700
Time [s]
SO
2 u
pta
ke
[gS
O2/
g cal
cin
ed s
orb
ent]
HA-85-850
Purbecklimestone
Good sulphation behaviour: maximum approximates to ~ 49% molar conversion of CaO to CaSO4 filling total porosity (~ 55% overall)
Gsulphation >> Gcarbonation
so sulphation reaction evidently not limited by mechanical work

What Happens in Practice?What Happens in Practice?

STEM HAADF TOMOGRAPHY - NanoengineeringSTEM HAADF TOMOGRAPHY - Nanoengineering
A grain from our synthetic sorbent showing pores in 5 - 50 nm range
Collaboration with Prof. Paul Midgeley, Materials Science
e.g. Midgley, P.A., Science, 309, 2195 (2005)

• Natural sorbents:– Deactivate (viz. lose their pore volume) after small number of cycles.
– Insensitive to changes in [CO2] during carbonation.
• Novel sorbent:– Stable, higher uptake than natural sorbents over a large number of cycles.– Able to develop new pore volume with number of cycles.
– Uptake increases with [CO2] during carbonation:
• way of regenerating pore volume.
• useful in systems with relatively high [CO2]
– High capacity for sulphur dioxide. • Modelling:
– A possible explanation of our experimental observations– To be verified by STEM HAADF
CONCLUSIONSCONCLUSIONS

ACKNOWLEDGEMENTSACKNOWLEDGEMENTS
• Miss R. Pacciani
• Dr. Stuart Scott
• Dr. P. Fennell (Imperial College London)
• Professor J. F. Davidson
• Professor Allan Hayhurst
• Prof. P. A. Midgeley
• Dr. C. Müller
• Prof. R. Kandiyoti, Prof. D. Dugwell, Dr. N. Paterson (Imperial College London)
• Dr. E. J. Anthony (CANMET)
• Cambridge European Trust
• EPSRC
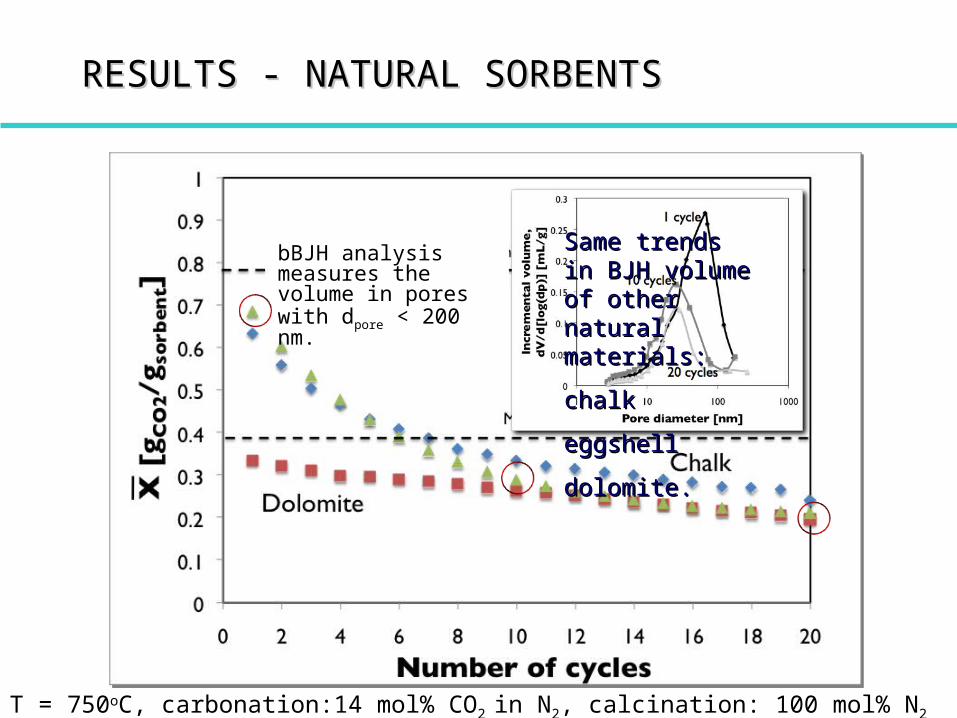
bBJH analysis measures the volume in pores with dpore < 200 nm.
T = 750oC, carbonation:14 mol% CO2 in N2, calcination: 100 mol% N2
RESULTS - NATURAL SORBENTSRESULTS - NATURAL SORBENTS
Same trends in BJH Same trends in BJH volume of other volume of other natural materials:natural materials:
chalkchalk
eggshelleggshell
dolomite.dolomite.