SYNTHESIS OF SOLID ACID CATALYST FROM RUBBER SEED …
94
SYNTHESIS OF SOLID ACID CATALYST FROM RUBBER SEED SHELLS FOR BIODIESEL PRODUCTION QUEK HUEI VERN A project report submitted in partial fulfilment of the requirements for the award of Bachelor of Engineering (Hons.) Mechanical Engineering Lee Kong Chian Faculty of Engineering and Science Universiti Tunku Abdul Rahman September 2017
Transcript of SYNTHESIS OF SOLID ACID CATALYST FROM RUBBER SEED …
SYNTHESIS OF SOLID ACID CATALYST FROM RUBBER SEED SHELLS
FOR BIODIESEL PRODUCTION
QUEK HUEI VERN
A project report submitted in partial fulfilment of the
requirements for the award of Bachelor of Engineering
(Hons.) Mechanical Engineering
Lee Kong Chian Faculty of Engineering and Science
Universiti Tunku Abdul Rahman
September 2017

ii
DECLARATION
I hereby declare that this project report is based on my original work except for
citations and quotations which have been duly acknowledged. I also declare that it
has not been previously and concurrently submitted for any other degree or award at
UTAR or other institutions.
Signature :
Name :
ID No. :
Date :

iii
APPROVAL FOR SUBMISSION
I certify that this project report entitled “SYNTHESIS OF SOLID ACID
CATALYST FROM RUBBER SEED SHELLS FOR BIODIESEL
PRODUCTION” was prepared by QUEK HUEI VERN has met the required
standard for submission in partial fulfilment of the requirements for the award of
Bachelor of Engineering (Hons.) Chemical Engineering at Universiti Tunku Abdul
Rahman.
Approved by,
Signature :
Supervisor :
Date :
Signature :
Co-Supervisor :
Date :

iv
The copyright of this report belongs to the author under the terms of the
copyright Act 1987 as qualified by Intellectual Property Policy of Universiti Tunku
Abdul Rahman. Due acknowledgement shall always be made of the use of any
material contained in, or derived from, this report.
© 2017, Quek Huei Vern. All right reserved.

v
ACKNOWLEDGEMENTS
I would like to thank everyone who had contributed to the successful completion of
this project. I would like to express my gratitude to my research supervisor, Dr.
Steven Lim for his invaluable advice, guidance and his enormous patience
throughout the development of the research.
In addition, I would also like to express my gratitude to my loving parents,
who have been patient and understanding in giving me the time and space that I need
to complete this research, and being there for me when I am at my lowest.
Moreover, I would like to thank my friends who not only gave me the help
and encouragement I need to persevere throughout this project, but also lend a hand
in brainstorming and making this research an enjoyable journey.

vi
ABSTRACT
Sustainable energy has always been in the forefront of many green energy researches.
The production of biodiesel using metal-based heterogeneous solid acid catalyst
(SAC) comes with a great cost. In this study, a novel SAC using waste rubber seed
shell was synthesised. A less conventional method of sulphonation using 4-
benzenediazoniumsulphonate (4-BDS) was used to incorporate the active SO3H
group, resulting in the desired catalyst. Increasing the carbonisation temperature
from 200 °C to 600 °C increased the porosity of the activated carbon, which further
increased the specific surface area to a value of 238 m2/g for SO3H group
attachments. Increasing the sulphanilic acid-to-activated carbon ratio from 2:1 to
10:1 during sulphonation increased the total acid density of the resulting catalyst
until it reached the highest value of 2.894 mmol/gcat. The free fatty acid (FFA)
conversion of palm fatty acid distillate (PFAD) at 90 °C and 3 wt% catalyst loading
was found to be dependent on the methanol-to-oil ratio (tested from 5:1 to 25:1) and
the esterification duration (tested from 3 h to 8 h). Increasing the methanol-to-oil
ratio to an optimum value of 15:1 and prolonging the duration up to 8 h enhanced the
biodiesel conversion up to 30 %. This experiment justified the potential usage of
waste rubber seed shells as a substitute for expensive metals in synthesising carbon-
based catalysts for sustainable biodiesel production.

vii
TABLE OF CONTENTS
DECLARATION ii
APPROVAL FOR SUBMISSION iii
ACKNOWLEDGEMENTS v
ABSTRACT vi
TABLE OF CONTENTS vii
LIST OF TABLES x
LIST OF FIGURES xii
LIST OF SYMBOLS / ABBREVIATIONS xiv
LIST OF APPENDICES xv
CHAPTER
1 INTRODUCTION 1
1.1 Diesel and Biodiesel 1
1.2 Renewable Energy - Biofuel 2
1.2.1 Biodiesel Development Around the World 3
1.2.2 Biodiesel Development in Malaysia 4
1.3 Biodiesel Production 6
1.3.1 Biomass Waste as Feedstock 6
1.3.2 Esterification and Transesterification 7
1.3.3 Types of Catalyst Used in the Industry 8
1.4 Importance of the Study 8
1.5 Problem Statement 9
1.6 Aims and Objectives 9
1.7 Scope of the Study 10
1.8 Contribution of the Study 10
2 LITERATURE REVIEW 11
2.1 Comparison Between Different Types of Catalyst 11

viii
2.2 Carbon as a Source of Solid Acid Catalysts (SAC) 13
2.3 Carbonisation of Biomass 18
2.3.1 Synthesis of a Porous Carbonaceous Structure 18
2.3.2 Carbonisation Temperature and Time on Catalytic
Performance 20
2.4 Sulphonation 23
2.4.1 Sulphonation methods 23
2.4.2 Factors Affecting Attachment of Active Groups 30
3 METHODOLOGY AND WORK PLAN 37
3.1 Materials and Apparatus 37
3.1.1 Raw Material and Chemicals 37
3.1.2 Apparatus and Equipment 39
3.1.3 Instruments 40
3.2 Research Methodology 40
3.3 Experimental Procedures 41
3.3.1 Carbonization of Biomass to Form Activated
Carbon (AC) 41
3.3.2 Functionalisation of AC by 4-
Benzenediazoniumsulphonate 44
3.3.3 Catalytic Tests 46
3.4 Catalyst Characterisation 47
3.4.1 Scanning Electron Microscopy (SEM) 48
3.4.2 BET Surface Area Analyser 48
3.4.3 Electron Dispersive X-ray Spectroscopy (EDX) 48
3.4.4 Fourier Transform – Infrared Spectroscopy
(FT-IR) 49
3.4.5 Thermogravimetric Analysis (TGA) 49
3.4.6 X-ray Diffraction (XRD) 49
3.4.7 Acid Density Test 49
3.5 Biodiesel Characterisation 50
3.5.1 Back Titration 50

ix
4 RESULTS AND DISCUSSION 52
4.1 Introduction 52
4.2 Catalyst Characterisation 52
4.3 Biodiesel Characterisation 63
5 CONCLUSIONS AND RECOMMENDATIONS 69
5.1 Conclusions 69
5.2 Recommendations for future work 70
REFERENCES 71
APPENDICES 77
x
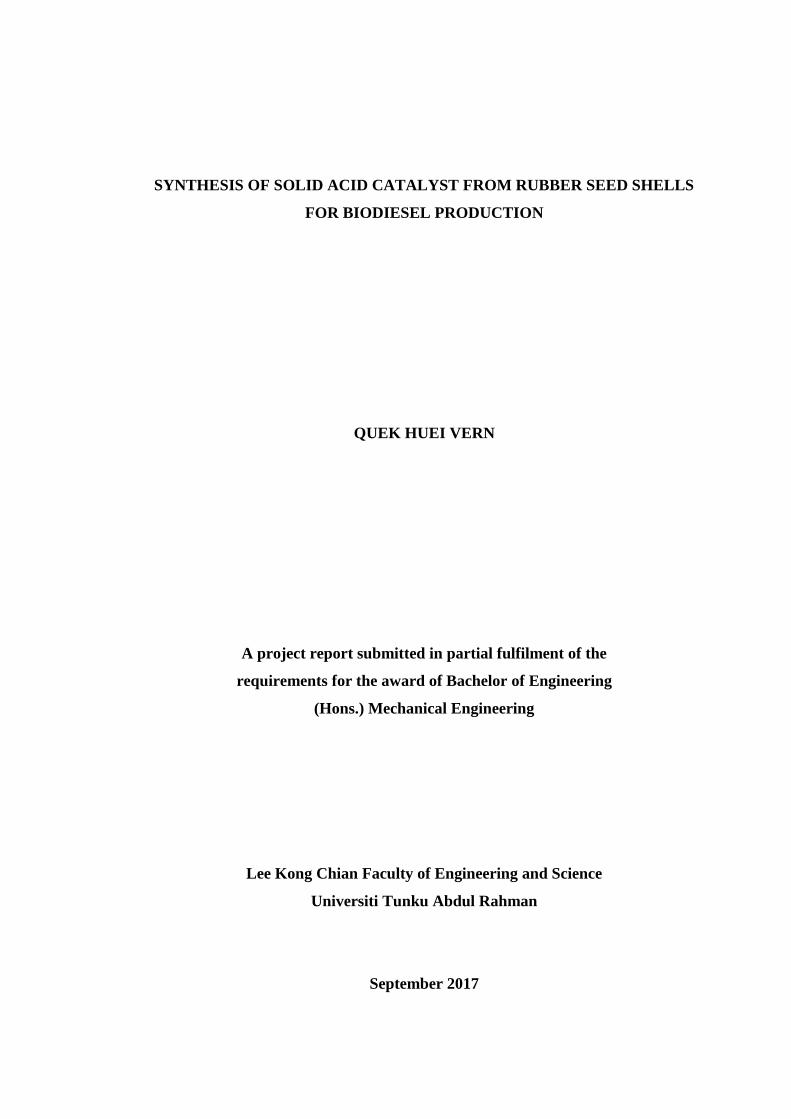
LIST OF TABLES
Table 1.1: Comparison of Diesel and Biodiesel 1
Table 1.2: EU Main Biodiesel Producers (Million Liters)
(USDA Foreign Agricultural Service, 2016) 4
Table 1.3: Energy Value of Crop Residues Produced in the
US and the World (Lal, 2005) 6
Table 2.1: Comparison of Homogeneous, Heterogeneous
Catalyst and Biocatalyst (Talha and Sulaiman,
2016) 12
Table 2.2: Inorganic and Organic Catalyst Used in Biodiesel
Production 16
Table 2.3: Different Carbonisation Methods from Various
Literatures 20
Table 2.4: Sulphonation Methods Utilised by Various
Literatures 26
Table 3.1: Raw Materials and Chemicals Used 37
Table 3.2: Apparatus and Equipment Used 39
Table 3.3: Instruments Used for Catalyst and Biodiesel
Characterisation 40
Table 3.4: Carbonisation Parameters and AC Nomenclature 44
Table 3.5: Carbonisation and Sulphonation Parameters and
Catalyst Nomenclature 45
Table 3.6: Esterification Parameters 46
Table 4.1: Specific Surface Area and Pore Specific Volume at
Different Carbonisation Temperatures 53
Table 4.2: Elemental Sulphur Concentrations at Varying
Sulphanilic Acid-to-AC Ratios 56
Table 4.3: Total Acid Density at Varying Sulphanilic Acid-
to-AC Ratios 57
Table 4.4: Comparison of SAC6:1 and Other Carbon
Catalysts From Various Literatures 62

xi
Table 4.5: Comparison of Esterification Duration and
Conversion of Various Literatures 67

xii
LIST OF FIGURES
Figure 1.1: Estimated Renewable Energy Share of Global
Final Energy Consumption in 2014 (REN21, 2016) 2
Figure 1.2: Malaysia Biodiesel Production and Consumption
(USDA Foreign Agricultural Service, 2016) 5
Figure 1.3: Transesterification of a Triglyceride and
Esterification of a Fatty Acid Reaction (Zillillah, et
al., 2014) 7
Figure 2.1: Influence of (a) Carbonisation Time; and (b)
Carbonisation Temperature on Esterification (□
and striped bars) and Transesterification (Δ and
black bars) Activities of Bagasse-Derived
Catalysts (Lou, et al., 2012) 21
Figure 2.2: Influence of Carbonization Time and
Carbonization Temperature on the Ester Yield (Liu,
et al., 2013) 22
Figure 2.3: SEM Images of Raw Oil Palm Trunk (a) and (b);
and Raw Sugarcane Bagasse (c) and (d) (Ezebor,
et al., 2014) 32
Figure 2.4: SEM Images of (a) Raw Rubber Seed Shell; (b)
Activated Carbon at t = 0.5 h; (c) Activated
Carbon at t = 2.5 h and (d) Activated Carbon at t =
3 h. All biomass were carbonised at 500 °C.
(Borhan and Kamil, 2012) 34
Figure 2.5: Influence of Sulphonation Conditions on
Esterification ( □ and striped bars) and
Transesterification (Δ and black bars) Activities of
Bagasse-Derived Catalysts (Lou, et al., 2012) 35
Figure 2.6: FTIR Spectra on the Effect of Varying
Sulphonation Temperatures (373 – 473 K) (Lou, et
al., 2012) 36
Figure 3.1: Process Flow of Research Procedure 41
Figure 3.2: Washed Rubber Seed Shells 42
Figure 3.3: Crushed Rubber Seed Shells Presoaked in 30 %
v/v H3PO4 42

xiii
Figure 3.4: Presoaked Rubber Seed Shells in a Carbolite
Furnace 43
Figure 3.5: Carbonised Material Being Grinded 43
Figure 3.6: Experimental Setup for Sulphonation of AC 45
Figure 3.7: Experimental Setup for Esterification of PFAD 47
Figure 4.1: Graph of Specific Surface Area against
Carbonisation Temperature 53
Figure 4.2: SEM images of (a) raw rubber seed shell, (b)
AC200, (c) AC400 and (d) AC600 54
Figure 4.3: EDX Spectrum Showing the Elemental
Compositions Within SAC2:1 56
Figure 4.4: Graph of Elemental Sulphur Composition and
Total Acid Density Against Sulphanilic Acid-to-
Activated Carbon Ratio 57
Figure 4.5: FT-IR Spectrum Before and After Sulphonation.
The wavenumbers 1099.48 cm-1 and 1272.75 cm-1
corresponded to S=O and SO3H stretching
respectively, and their presence indicated the
successful attachment of the SO3H groups. 59
Figure 4.6: SEM Images Before (Left, AC600) and After
Sulphonation (Right, SAC6:1) 60
Figure 4.7: TGA Curve for AC600 and SAC6:1 61
Figure 4.8: XRD Profile of AC600 (Top) and SAC6:1
(Bottom) 62
Figure 4.9: Effect of Methanol-to-Oil Ratio on FFA
Conversion. The reaction temperature was 90 °C,
with a catalyst loading of 3 wt% and a duration of
2.5 h. 64
Figure 4.10: Effect of Esterification Duration on FFA
Conversion. The reaction temperature was 90 °C,
with a catalyst loading of 3 wt% and a methanol-
to-oil ratio of 15:1. 65

xiv
LIST OF SYMBOLS / ABBREVIATIONS
AV acid value, mg KOH/g
AC activated carbon
BET Brunauer-Emmett-Teller
CCA carbon-coated alumina
EA elementary analysis
EDX electron dispersive X-ray spectroscopy
FAME fatty acid methyl esters
FFA free fatty acid
FT-IR Fourier Transform-Infrared Spectroscopy
HTC hydrothermal carbonisation
MWCNT multi-walled carbon nanotube
OPT oil palm trunk
PAH polycyclic aromatic hydrocarbons
PFAD palm oil fatty distillate
POWC palm oil waste cake
PTSA p-toluenesulphonic acid
SAC solid acid catalyst
SCB sugarcane bagasse
SEM scanning electron microscopy
TGA thermogravimetric analysis
XRD X-ray diffraction
XPS X-ray photoelectron spectroscopy

xv
LIST OF APPENDICES
APPENDIX A: Gantt Chart 77
APPENDIX B: BET Sorptomatic Surface Analyser Results 78
APPENDIX C: X-Ray Diffraction Results 86

1
CHAPTER 1
1 INTRODUCTION
1.1 Diesel and Biodiesel
Diesel fuel is a petroleum derivative produced from fractional distillation in the
cracking process. Its higher volatility and carbon content in comparison with
gasoline makes it an ideal transportation fuel for heavier vehicles like trucks and
buses, construction equipment and military tanks (U.S. Energy Information
Administration, 2016). Besides that, it is also used in diesel generators to generate
electricity for small and medium-sized businesses (Diesel Service and Supply, 2017).
Biodiesel, on the other hand, is a non-fossil fuel alternative to its
conventional counterpart, and is mostly produced from biomass such as vegetable oil
and animal fats via esterification and transesterification. Like diesel, it is mainly
utilised in diesel vehicles, whereby it is used in its pure form or as a biodiesel/diesel
blend (Haluzan, 2010). Furthermore, biodiesel is used as fuel to heat up domestic and
commercial boilers (Berkeleybiodiesel.org, 2015).
Table 1.1 below shows a comparison between diesel and biodiesel in terms of
its properties, advantages and disadvantages.
Table 1.1: Comparison of Diesel and Biodiesel
Fuel Diesel Biodiesel References
Source Petroleum Vegetable or animal oil Haluzan,
2010 Lubrication Poor Significantly better
Cetane number Lower Higher
Flash point 64 °C (riskier) 130 °C (safer)
Advantages - Lower cost
- Higher energy output
- Renewable, non-toxic,
biodegradable
- Fewer emissions of GHG
- Low volatility
- Better lubricity
Haluzan,
2010;
Demshimino,
et al, 2013
Disadvantages - Non-renewable
- Considerable amount of
emissions (particulates, sulphur)
- High volatility
- Nitrogen oxide emissions
increase with fuel blending
- Lower energy output
- Higher cost

2
1.2 Renewable Energy - Biofuel
The discovery and usage of renewable energy has been slow but on going over the
years; it was not until the oil embargo set up by the Organisation of Petroleum
Exporting Countries (OPEC) in the 1970s that made renewable energy a contingency
plan to ensure continuous energy supply to the masses, and simultaneously reduce
pollution (Ross, 2013). Global warming and the ozone layer depletion further
solidified transnational efforts in saving the environment and promoting renewables,
leading up to the formation of environmental organisations like Greenpeace
International, European Renewable Energy Research Centers (EUREC) Agency, and
the World Council on Renewable Energy (WCRE) (Martinot, 2008).
Biofuel consists of both bioethanol and biodiesel. Although it makes up the
smallest percentage among the renewables (Figure 1.1), its continual contribution to
the conservation of fossil fuels is welcomed. But crops have to be genetically
engineered; land has to be cultivated for its growth; engines might need to be
modified to run on biofuel (Biofuel.org.uk, 2017). Seeing as Earth’s surface is
roughly 71% seawater and 29 % land (Williams, 2016), it makes sense that some
countries would rather use a more abundant and already-present source of energy
compared to biodiesel, as can be interpreted from Figure 1.1. Furthermore, several
countries are still experiencing famine, which resulted in the food insecurity issue.
Figure 1.1: Estimated Renewable Energy Share of Global Final Energy Consumption
in 2014 (REN21, 2016)

3
Within the 0.8% of biofuel produced, only 22% of it is biodiesel whereas
bioethanol makes up 74%, with the remainder being hydrogenated vegetable oil. As
most consumers drive gasoline-powered vehicles, there is a higher production of
ethanol compared to biodiesel as like biodiesel, ethanol is blended with gasoline (U.S.
Energy Information Administration, 2017). However, as the demand for both was
maintained through blending mandates (B5, B7, B10, etc) the production of biofuel
remains a competitive market.
1.2.1 Biodiesel Development Around the World
The consumption of biodiesel across the globe has been steadily increasing as the
world begins the shift from using pure diesel fuel to diesel blends. Recently, Europe
has remained as the largest biodiesel consumer, followed by the United States, Brazil,
Asia, and the rest of the world (Merchant Research & Consulting, Ltd, 2017). The
production of biodiesel continues to rise to keep up with global demands, with the
United States in the lead, followed by Brazil, Germany, Argentina and France
(REN21, 2016).
Overall, European Union is the world’s largest biodiesel producer,
representing about 80 % of the market. Its rapid production was motivated by
growing crude oil prices, generous tax incentives (mostly in Germany and France),
and the provisions on the production of oilseeds. Directives and mandates set out by
the EU further encouraged biodiesel usage. Currently, France has a biodiesel
mandate of 7.7% since 2014; Germany has a new mandate of 4.0 and Netherlands
has an overall biofuel mandate of 7.75% (USDA Foreign Agricultural Service, 2016).
Table 1.2 shows the main biodiesel producing members of the EU and their
respective annual increment in production, with Germany leading with amounts
ranging in the 3-billion liter range since 2010, followed by France, Netherlands, and
Spain.

4
Table 1.2: EU Main Biodiesel Producers (Million Liters) (USDA Foreign
Agricultural Service, 2016)
North and Latin America have also dominated the biodiesel trade. As a
country by itself, the US remains to this day one of the major producers of biodiesel
fuel, with Brazil not far behind. New targeted achievements continuously set up in
the Renewable Fuel Standard (RFS) had helped the US produced about 4.8 billion
litres of biodiesel, while Brazil had produced close to 4.1 billion litres in 2015
(REN21, 2016). B20 (20% biodiesel blended with 80% petroleum diesel) remains a
common biodiesel blend in the US (U.S. Department of Energy, 2017). At the same
time, in 2016, the Brazil biodiesel mandate had increased from B7 to B10 in 2019
(USDA Foreign Agricultural Service, 2016).
In Asia, biodiesel production fell drastically during 2015. Indonesia, who was
once the top biodiesel producer in the world had 60% less production whereas
China’s biodiesel production has surged, which exceeded Indonesia’s 2015
production levels. In February 2016, it was reported that China began putting more
focus into its bioethanol production but had invested 1 billion euros in a biodiesel
plant in Northern Finland (Kotrba, 2016). Indonesia had also started catching up, and
achieved a production of 700 million litres in the first quarter of 2016 (USDA
Foreign Agricultural Service, 2016).
1.2.2 Biodiesel Development in Malaysia
In Malaysia, under the National Biofuel Policy, which was released on March 21,
2006, the objectives were to use environmental-friendly and more sustainable energy
sources to lower the fossil fuel dependency and to stabilise and lift palm oil prices.
Calendar Year 2010 2011 2012 2013 2014 2015 2016 2017
Germany 3,181 3,408 3,106 3,307 3,808 3,351 3,350 3,410
France 2,295 2,090 2,516 2,476 2,681 2,442 2,215 2,390
Netherlands 434 558 1,337 1,562 1,954 1,988 1,990 1,990
Spain 1,041 787 545 668 1,016 1,103 1,070 1,080
Poland 432 414 673 736 786 795 800 800
Italy 908 704 326 521 658 665 665 665
Belgium 494 536 568 568 568 568 570 570
Portugal 328 419 356 307 325 440 443 455
Finland 375 253 320 399 409 409 440 440
United Kingdom 227 261 364 648 648 648 650 420
Others 992 1,611 971 791 488 1,126 1,487 1,935
Total 10,707 11,041 11,082 11,983 13,341 13,535 13,680 14,155
5
Even though it was initially planned in 2008 to initiate the 5% biodiesel blend, it
only began in 2011 and full nationwide implementation spanning both the peninsular
region and East Malaysia was achieved in late 2014.
Growing crude palm oil stocks further pressured the Government to enact the
B7 mandate in 2015. The 10% blending mandate, which was supposed to be
implemented in July 2016, has since been postponed due to objections from
industrial stakeholders – specifically concerns from vehicle suppliers about the
apparent adverse impact of biofuel on diesel engine performance and lubrication
systems, and also because the government has not achieved the B7 mandate (USDA
Foreign Agricultural Service, 2016).
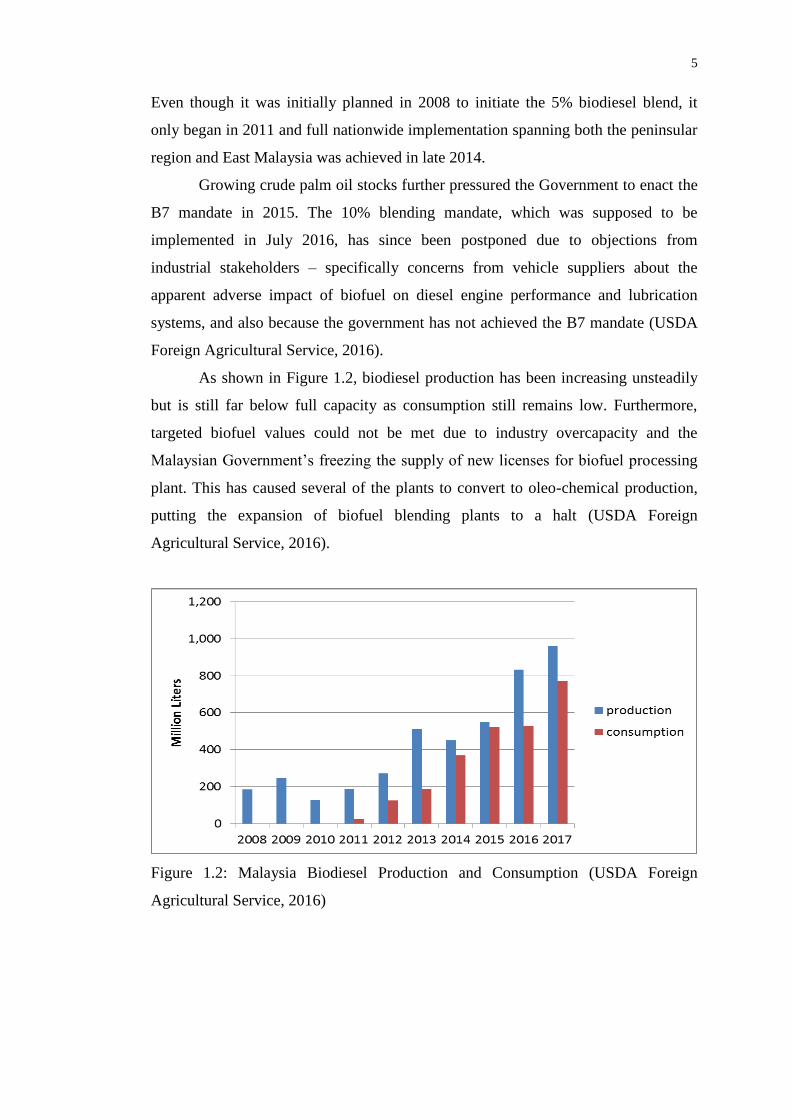
As shown in Figure 1.2, biodiesel production has been increasing unsteadily
but is still far below full capacity as consumption still remains low. Furthermore,
targeted biofuel values could not be met due to industry overcapacity and the
Malaysian Government’s freezing the supply of new licenses for biofuel processing
plant. This has caused several of the plants to convert to oleo-chemical production,
putting the expansion of biofuel blending plants to a halt (USDA Foreign
Agricultural Service, 2016).
Figure 1.2: Malaysia Biodiesel Production and Consumption (USDA Foreign
Agricultural Service, 2016)
6
1.3 Biodiesel Production
1.3.1 Biomass Waste as Feedstock
Food crops like maize, palm oil and soybeans are known to be utilised for the
production of bioethanol and biodiesel. Besides obtaining these raw materials from
edible crops, biofuel can also be derived from non-edible organic materials such as
livestock manure, dead organisms, municipal waste and agricultural waste.
Agricultural waste normally found in crop residues can provide an alternative
to fuel crops (crops planted for fuel), thereby reducing issues on proper land use and
offer an alternative to crop burning by farmers through proper waste management.
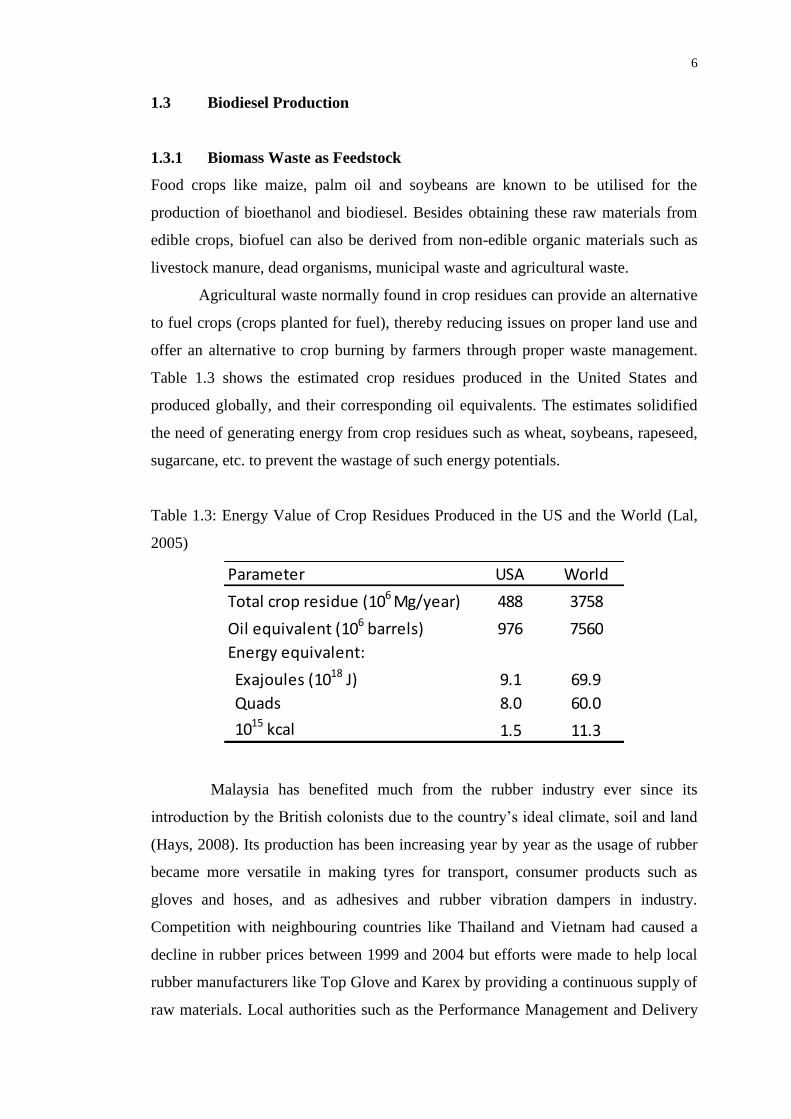
Table 1.3 shows the estimated crop residues produced in the United States and
produced globally, and their corresponding oil equivalents. The estimates solidified
the need of generating energy from crop residues such as wheat, soybeans, rapeseed,
sugarcane, etc. to prevent the wastage of such energy potentials.
Table 1.3: Energy Value of Crop Residues Produced in the US and the World (Lal,
2005)
Malaysia has benefited much from the rubber industry ever since its
introduction by the British colonists due to the country’s ideal climate, soil and land
(Hays, 2008). Its production has been increasing year by year as the usage of rubber
became more versatile in making tyres for transport, consumer products such as
gloves and hoses, and as adhesives and rubber vibration dampers in industry.
Competition with neighbouring countries like Thailand and Vietnam had caused a
decline in rubber prices between 1999 and 2004 but efforts were made to help local
rubber manufacturers like Top Glove and Karex by providing a continuous supply of
raw materials. Local authorities such as the Performance Management and Delivery
Parameter USA World
Total crop residue (106 Mg/year) 488 3758
Oil equivalent (106 barrels) 976 7560
Energy equivalent:
Exajoules (1018 J) 9.1 69.9
Quads 8.0 60.0
1015 kcal 1.5 11.3
7
Unit (Pemandu) are distributing grants to smallholders to replant 40,000 hectares
yearly and plant about 18,000 hectares worth of new areas over the next five years
(Bloomberg News, 2012).
The sap cultivated from the rubber tree is often of importance, although the
seed itself is used to extract its oil which can be used in the manufacture of paints,
varnishes, inferior laundry soap, grease and biodiesel (Rubber Board, 2002). The
shell produced from the removal of the kernel from the seed often finds its way to
disposal sites or are burnt, although recent studies have started experimenting on its
usage as a carbon precursor to activated carbon.
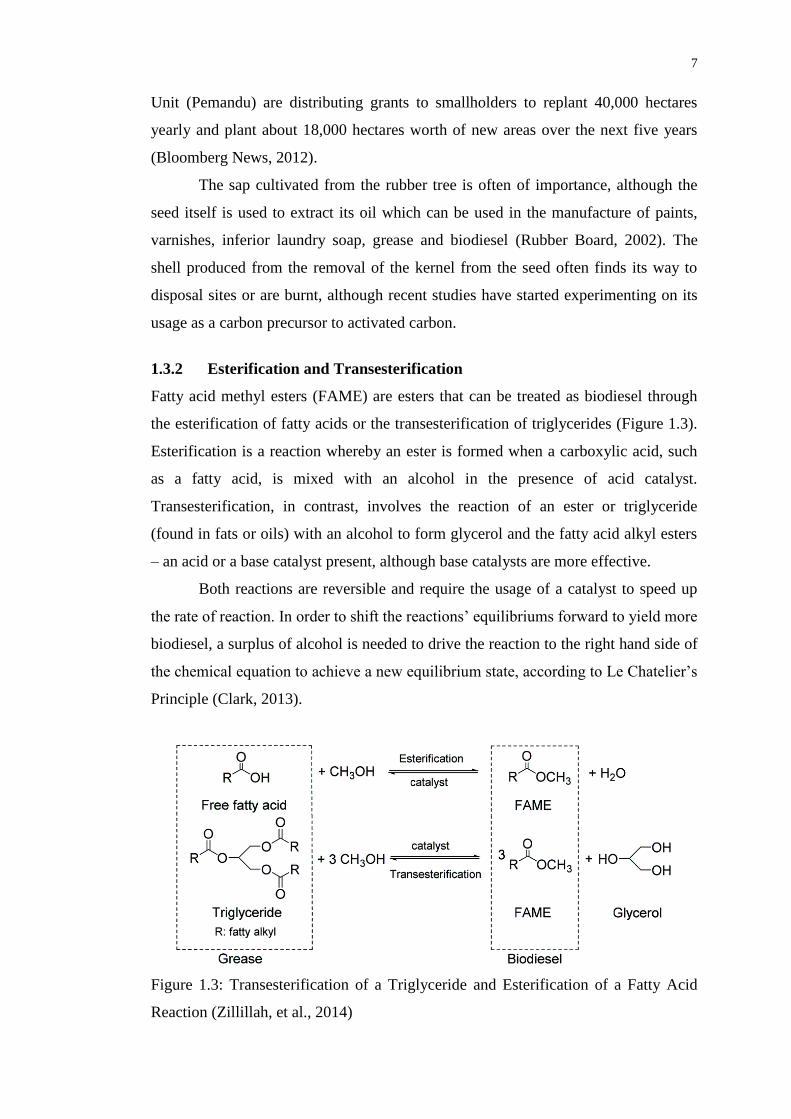
1.3.2 Esterification and Transesterification
Fatty acid methyl esters (FAME) are esters that can be treated as biodiesel through
the esterification of fatty acids or the transesterification of triglycerides (Figure 1.3).
Esterification is a reaction whereby an ester is formed when a carboxylic acid, such
as a fatty acid, is mixed with an alcohol in the presence of acid catalyst.
Transesterification, in contrast, involves the reaction of an ester or triglyceride
(found in fats or oils) with an alcohol to form glycerol and the fatty acid alkyl esters
– an acid or a base catalyst present, although base catalysts are more effective.
Both reactions are reversible and require the usage of a catalyst to speed up
the rate of reaction. In order to shift the reactions’ equilibriums forward to yield more
biodiesel, a surplus of alcohol is needed to drive the reaction to the right hand side of
the chemical equation to achieve a new equilibrium state, according to Le Chatelier’s
Principle (Clark, 2013).
Figure 1.3: Transesterification of a Triglyceride and Esterification of a Fatty Acid
Reaction (Zillillah, et al., 2014)
8
1.3.3 Types of Catalyst Used in the Industry
There are many types of catalyst involved in industrial processes as there is a need to
obtain and supply goods on time. The main role of a catalyst is to increase the
reaction rate (or shorten the time taken for a reaction) while it itself remains
unconsumed. They can be classified into three main groups, but the former two are
generally used in biodiesel production:
(i) Homogeneous catalyst – catalysts are in the same phase as the
reactants.
(ii) Heterogeneous catalyst – catalysts are in a different phase compared
to the reactants.
(iii) Enzymes – biological catalysts.
Furthermore, catalysts themselves can be derived from a variety of materials:
(i) Acids or bases (H2SO4 or NaOH).
(ii) Microorganisms (bacteria and yeast).
(iii) Biological molecules (enzymes like nitrile hydratase, glucose
isomerase and galactosidase) (Choi, et al., 2015).
(iv) Transition metals (Vanadium(V) oxide, Titanium oxide).
1.4 Importance of the Study
By studying the effect of continual usage of crude oil derivatives on the environment
and society, not only does this emphasize the severity of its impact in the ecology, it
drives forward the need to switch from using non-renewable energy resources to a
more continuous and sustainable supply of green energy.
Further reviews on the advancement of biodiesel production in various
countries would provide a standpoint on one’s current progress into the technology
utilised in biodiesel production, encouraging the innovation and invention of newer,
faster and more reliable production means. Not only that, by delving into the search
for novel carbon-based solid acid catalysts, massive amounts of biomass wastes can
be recycled and will not need to be disposed in landfills. This will lead to the
discovery of a new niche in the production of renewable biofuels using a more
sustainable method.

9
1.5 Problem Statement
The production of biodiesel has always been on-going, with increasing awareness on
the need to practise sustainable development for the sake of the environment.
Technology has constantly aid in the search for more cost-effective and safer
production methods. These methods, which involve the usage of transition-metal
supported catalysts; biocatalysts; acid-base catalysts, have their own advantages and
disadvantages, and the pathway to finding a more plausible solution is never-ending.
Farmers worldwide, specifically in countries with a large agricultural sector,
have been disposing their crop residues through open-burning, omitting the fact that
the country is still facing severe environmental pollution. Also, biomass is abundant
in municipal solid wastes, frequently ending up in landfills. The usage of biomass
waste for the synthesis of a carbon-based solid acid catalyst for the production of
biodiesel could kill two birds with one stone, encouraging renewable biofuel
production, while gradually reducing landfill waste and encouraging an eco-
friendlier way in disposing crop residues, especially in countries whereby their main
source of income is through agricultural exports.
As Malaysia happens to be one of the world’s largest rubber producers, it
would come as no surprise if there were to be an abundance of rubber seed shells to
be disposed from the removal of the rubber seed kernel for oil extraction. As little
research has been done in using waste rubber seed shells to synthesis a carbon-based
solid acid catalyst (SAC), this study hopes to utilise rubber seed shells in the
synthesis of a novel SAC with low cost and optimum synthesis parameters.
1.6 Aims and Objectives
This study aims to find the optimum parameters to produce a heterogeneous catalyst
derived from waste rubber seed shells to be used in catalysing the conversion of high
FFA content waste to biodiesel.
There are several objectives to be achieved by the end of this research:
(i) To synthesise carbon-based solid acid catalyst using rubber seed
shells through 4-benzenediazoniumsulphonate (4-BDS) sulphonation
method.
(ii) To optimise the carbonisation temperature and sulphonation
conditions (sulphanilic acid-to-activated carbon ratio) for the
synthesis of the carbon-based solid acid catalyst.

10
(iii) To investigate the catalytic activity of the catalyst for biodiesel
production by varying esterification conditions (methanol-to-oil ratio
and esterification duration).
1.7 Scope of the Study
Chapter 1 would give a brief introduction as to the difference between diesel and
biodiesel before delving into the oil depletion issue and the need for alternative fuel
sources. Both global and local biodiesel production are briefly reviewed before
introducing the use of catalyst in biodiesel production via the two main processes,
esterification and transesterification.
Chapter 2 of this study would encompass various literature reviews that have
been done regarding the production of solid acid catalysts from carbon-based sources,
besides detailing the means of producing activated carbon before functionalising the
material through the chosen sulphonation method.
Chapter 3 would then explain more on the methodology used in preparing
and pretreating the rubber seed shells, carbonisation and functionalisation procedure
of the raw material, before proceeding to its used as a catalyst in the production of
biodiesel from palm oil fatty distillate.
Chapter 4 contains the results obtained from each parameter, which are the
effect of carbonisation temperature on the specific surface area of activated carbon,
the effect of sulphanilic acid-to-activated carbon ratio on the total acid density of the
catalyst, the effect of methanol-to-oil ratio and the effect of esterification duration on
the conversion of biodiesel.
Chapter 5 finally concludes the whole experiment and provides an overview
as to the results obtained.
1.8 Contribution of the Study
This study aims to justify the finding that any type of carbon source can be used in
synthesising a solid acid catalyst. As the purpose for this catalyst is to catalyse the
esterification reaction, it would contribute to the biodiesel production industry as the
waste generated from the manufacture of rubber-based product is in abundance.
Furthermore, it can help identify the most suitable sulphonation method when it
comes to functionalising a rubber seed shell-based catalyst.
11
CHAPTER 2
2 LITERATURE REVIEW
2.1 Comparison Between Different Types of Catalyst
As mentioned in Sub-subsection 1.1.3, there are three types of catalyst being
employed in the biodiesel industry: homogeneous catalyst, heterogeneous catalyst,
and biocatalyst. The choice in choosing which catalyst to used could depend on a
number of factors. The ease at which it can be separated from the product, the costs
and strength of the catalyst and the efficiency of both heat and mass transfer all play
a role in determining the most efficient catalyst to apply.
The differences between each catalyst in terms of their advantages and
disadvantages were compared in Table 2.1. It can be assumed from Table 2.1 that a
suitable catalyst is an economical heterogeneous catalyst that has good heat and mass
transfer, that can be separated easily, can be recycled and reused to save cost and
insensitive to free fatty acid (FFA) content within the oil feed.

12
Table 2.1: Comparison of Homogeneous, Heterogeneous Catalyst and Biocatalyst (Talha and Sulaiman, 2016)
Type of catalyst Derivative Examples Advantages Disadvantages References
Homogeneous
catalyst
Base NaOH, KOH,
Alkali metal
methoxides
- High selectivity in short duration
- Low operating conditions
- Good heat and mass transfer
- Cheap and easily available
- Expensive separation costs
- Sensitive to FFA content in oil
- Lost of catalyst in saponification
CIEC Promoting
Science, 2013;
TutorVista.com,
2017; Talha and
Sulaiman, 2016 Acid H2SO4, HCl,
ferric sulphate
- Insensitive to FFA content in oil
- Simultaneous esterification and
transesterification
- High biodiesel yield produced
- Can cause equipment corrosion
- Costly separation
- Low reaction rate
Heterogeneous
catalyst
Base CaO,
Vanadium(V)
oxide,
platinum,
zeolite
- Simple separation
- Catalyst can be recycled and reused
- Long catalyst life time
- Higher activity than its SAC
- Moderate reaction conditions
- Low reaction rates
- Sensitive to FFA content in oil
- Problematic heat and mass transfer
- Difficult to modify
- Catalyst poisoning in ambient air
Acid Tungsten
oxides,
sulphonated
zirconia,
- Simple separation
- Insensitive to FFA content in oil
- Simultaneous esterification and
transesterification
- Can be regenerated and reused
- Reduce corrosion problems
- Low reaction rates
- Unfavourable side reaction
- Higher cost
- Leaching causes product contamination
- High reaction conditions
Enzyme Algae, lipase - Avoids soap formation
- Simple recovery
- Reusable and environmental friendly
- Very slow reaction rate
- High cost
- Deactivation at extreme conditions
Talha and
Sulaiman, 2016
13
2.2 Carbon as a Source of Solid Acid Catalysts (SAC)
Inorganic heterogeneous acid catalysts such as tungstated zirconium oxide (Guldhe,
et al., 2017), chromium-aluminium mixed oxide (Guldhe, et al., 2017), and Ti(SO4)O
(Gardy, et al., 2016) had been used in recent studies for the production of biodiesel.
However, several drawbacks are still present in their usage such as low acid site
concentration, microporosity, hydrophilic character of catalyst surface, leaching of
the active sites and high costs of synthesis (Shu, et al., 2009). On a good note, novel
carbon-based solid acid catalysts are being developed with hopes of providing a
more affordable alternative compared to their more expensive inorganic counterparts,
despite having the same leaching and deactivation drawbacks.
Carbon is a chemical element widely found in most organic matter, be it
edible or non-edible. It makes up the four main building blocks of life: carbohydrates,
protein, lipids, and nucleic acid. Carbohydrate derivatives were observed to be good
SAC catalysts as in the case of Lou, et al. (2008), whereby the catalysts were derived
from carbohydrate powders of starch, cellulose, D-glucose and sucrose. Although the
experiment indicated that the starch-derived catalyst achieved the highest yield in the
shortest amount of time (83 % in 8 h compared with 80 % within 8 to 12 h), it still
proved the feasibility of considering carbohydrates as a source of catalyst which still
maintained high stability after 50 cycles of reuse.
Carbohydrate usage was further supported by Chen and Fang (2011), where a
combination of carbohydrates was used, which is glucose and starch. The catalyst
made from the glucose-corn starch mixture gave the highest fatty acid methyl ester
(FAME) yield of 90 %. This finding was consistent with its structure that contained
an acid site density of 6.373 mmol/g, which was the highest value among the other
samples. Another recent synthesis was sulphonated-glucose acid catalysts derived
from D-glucose catalyst made by Lokman, et al. (2015) and the resulting catalyst
produced a biodiesel yield of 92.4 %.
Other polysaccharides like cellulose (Ayodele and Dawodu, 2014) and β-
cyclodextrin (Fu, et al., 2015) were also produced as highly active and stable SACs.
Ayodele and Dawodu (2014) had produced biodiesel from the esterification and
transesterification of Calophyllum inophyllum oil using a cellulose-based catalyst,
which produced a yield of almost 99 wt%. Its performance even surpassed that of the
D-glucose derived catalyst that was used as a comparison. It managed to retain most
14
of its original transesterification activity, which was characteristic of carbon-based
catalyst.
β-cyclodextrin was used as a precursor in the solid acid catalyst synthesis by
Fu, et al. (2015). Compared with another well-known SAC, Amberlyst-15, it had a
higher acid site density and larger pores for reactant accessibility to the active groups.
Once again, the manufactured carbon-based catalyst maintained its stability up to six
runs, although leaching of the active –SO3H group due to excessive alcohol washing
slightly decreased the catalytic activity.
Non-edible waste biomass is also a rich source of carbon and many have
begun the transition of using cheaper biomass waste. Shu, et al. (2009) had utilised
vegetable oil asphalt to produce a carbon-based SAC catalyst, which gave a
conversion of 89.93 % for cottonseed oil, an 80.5 wt% and 94.8 wt% conversion of
triglycerides and FFA respectively in waste cooking oil (Shu, et al., 2010). In both
experiments, the catalysts had high acid density, loose amorphous network and large
pores, offering entry of reactants into the bulk where more acid sites were located.
Furthermore, the acid sites were kept stable by the sulphonated polycyclic aromatic
hydrocarbons (PAHs). Compared with other heterogeneous SACs, it could maintain
its structure and acid sites at 270 °C, a high temperature characteristic of most acid-
catalysed transesterifications. Also, it would not be deactivated in the presence of
excess water produced from both reactions.
Novel catalysts were also synthesised from oil palm trunk (OPT) and
sugarcane bagasse (SCB) by Ezebor, et al. (2014). The catalysts were successfully
prepared, providing FAME yields of 88.8 % (OPT) and 96 % (SCB). The higher
activity of SCB could be explained by its structure, which was flake-like compared
to OPT, providing better attachment of the –SO3H groups during sulphonation. The
study also showed the stability of both carbon-based catalysts as high catalytic
activity still remained after 6 cycles, although the PAHs integrated with the –SO3H
groups still leached out after each washing cycle.
Residual lignin contained in the hulls of Xanthoceras sorbifolia Bunge was
used as a precursor in the development of a lignin-based solid acid catalyst by Guo,
et al. (2012). Lignin is a non-carbohydrate biological polymer having cross-linked
aromatic structures, making it a worthy candidate for the binding of the active –
SO3H groups, which was further supported by FT-IR spectra analysis in the form of
C−O−SO3H. The FFA conversion achieved was as high as 97 %, and this value was

15
almost on par with the conversion achieved when using 1.5 wt% of sulphuric acid as
a homogeneous catalyst. This study further highlights the significance of reusing
biomass waste, especially those from the agricultural sector, as resourceful materials
are still stored within. It is only a matter of discovery and finding a means of
extracting the materials.
Besides conventional biomass waste as those listed above, another relatively
cheap raw material, microalgae residue generated from its application in biodiesel
production can be further processed to produce a novel SAC. Similar to producing a
carbon-based SAC, Fu, et al. (2013) carbonized and sulphonated the microalgae
residue, generating a catalyst comprising of aromatic carbon sheets (as cellulose was
the main component of the microalgae) with high density of functional groups
anchoring sites. The developed carbon SAC showed high catalytic activity, which
persisted after 5 cycles with over 95 % conversion for esterification.
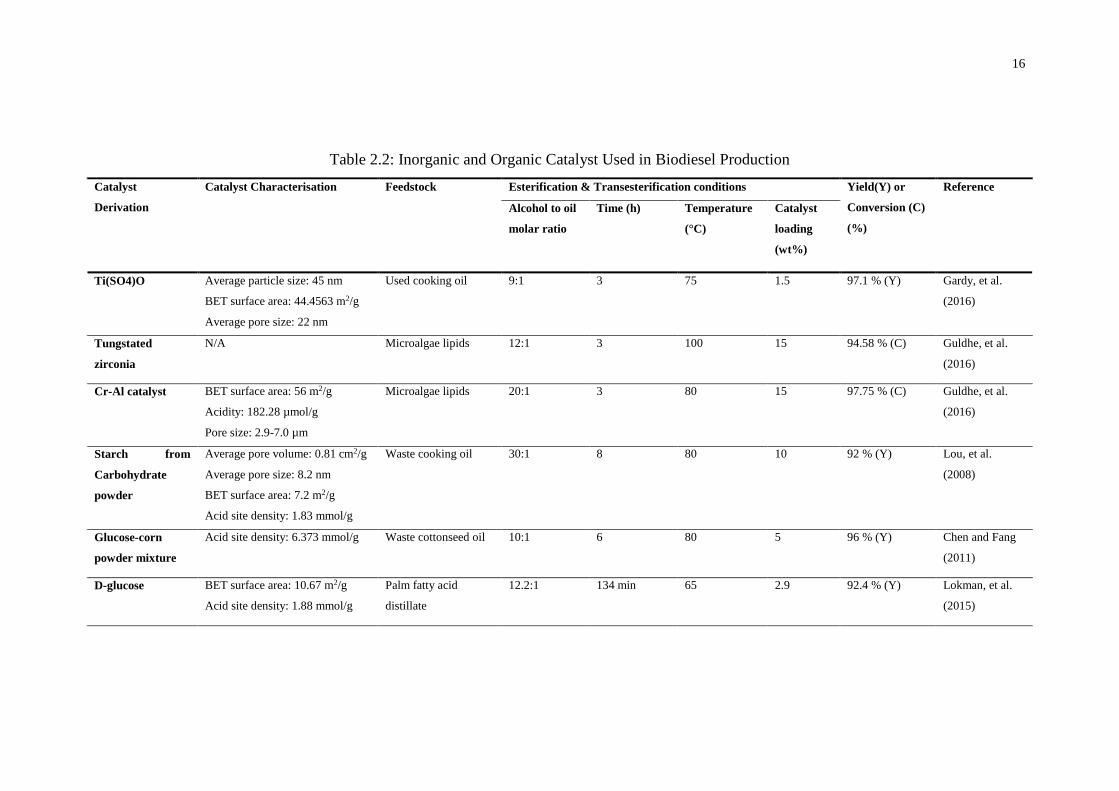
Table 2.2 provides an overview of the three inorganic SACs listed above and
a comparison of their biodiesel production with SACs derived from both valuable
and waste carbon sources. It can be seen that even cheap and unconventional raw
materials could provide a biodiesel yield or conversion on par with those produced
from costly metal-based catalysts.
In a nut shell, the abundance of carbon in life delivers a better alternative in
synthesising carbon-based catalysts due to the high aromatic carbon content.
Furthermore, efforts can be made in utilising waste biomass as a source of carbon as
it would be more environmental friendly in terms of disposing waste in a more
organised manner, relatively cheaper and ideal compared to exploiting useful and
valuable metal and carbohydrate resources. Hence, rubber seed shells should be a
viable candidate in the synthesis of a biomass-based SAC in the production of
biodiesel, further expanding its usage as an activated carbon. In addition, it could
reduce waste residual and incite proper waste disposal methods after obtaining the
kernel from the rubber seed.
Not only that, the literature review from various sources in Table 2.2 depicted
that an ideal heterogeneous carbon-based solid acid catalyst should have diverse pore
structure, high catalytic stability, high catalytic activity, high acid site density,
hydrophobicity that prevents catalyst deactivation by water generated from
esterification, hydrophilic functional groups that provide methanol access to the
triglyceride and FFA molecules, and low cost.
16
Table 2.2: Inorganic and Organic Catalyst Used in Biodiesel Production
Catalyst
Derivation
Catalyst Characterisation Feedstock Esterification & Transesterification conditions Yield(Y) or
Conversion (C)
(%)
Reference
Alcohol to oil
molar ratio
Time (h) Temperature
(°C)
Catalyst
loading
(wt%)
Ti(SO4)O Average particle size: 45 nm
BET surface area: 44.4563 m2/g
Average pore size: 22 nm
Used cooking oil 9:1 3 75 1.5 97.1 % (Y) Gardy, et al.
(2016)
Tungstated
zirconia
N/A Microalgae lipids 12:1 3 100 15 94.58 % (C) Guldhe, et al.
(2016)
Cr-Al catalyst BET surface area: 56 m2/g
Acidity: 182.28 µmol/g
Pore size: 2.9-7.0 µm
Microalgae lipids 20:1 3 80 15 97.75 % (C) Guldhe, et al.
(2016)
Starch from
Carbohydrate
powder
Average pore volume: 0.81 cm2/g
Average pore size: 8.2 nm
BET surface area: 7.2 m2/g
Acid site density: 1.83 mmol/g
Waste cooking oil 30:1 8 80 10 92 % (Y) Lou, et al.
(2008)
Glucose-corn
powder mixture
Acid site density: 6.373 mmol/g Waste cottonseed oil 10:1 6 80 5 96 % (Y) Chen and Fang
(2011)
D-glucose BET surface area: 10.67 m2/g
Acid site density: 1.88 mmol/g
Palm fatty acid
distillate
12.2:1 134 min 65 2.9 92.4 % (Y) Lokman, et al.
(2015)

17
Table 2.2: (continued)
Catalyst
Derivation
Catalyst Characterisation Feedstock Esterification & Transesterification conditions Yield(Y) or
Conversion (C)
(%)
Reference
Alcohol to oil
molar ratio
Time (h) Temperature
(°C)
Catalyst
loading
(wt%)
Cellulose Surface area: 2.4 m2/g
Total acid density: 3.9 mmol/g
Calophyllum
inophyllum oil
15:1 4 180 5 ~99 % (Y) Ayodele and
Dawodu
(2014)
Β-cyclodextrin BET surface area: 5.6 m2/g
Sulphur concentration: 0.86 mmol/g
Mixed oil of oleic acid
and triolein
30:1 12 85 5 ~80 % (Y) Fu, et al.
(2015)
Vegetable oil
asphalt
Average pore diameter: 43.9 nm
BET surface area: 7.48 m2/g
Acid site density: 2.21 mmol/g
Refined cottonseed oil 18.2:1 2.5 260 1 89.93 % (C) Shu, et al.
(2009)
Waste cooking oil 16.8:1 4.5 220 0.2 94.8 % FFA (C)
80.5 % triglyceride
(C)
Shu, et al.
(2010)
Oil palm trunk Acid site density: 0.81 Palmitic acid 18:1
5 65 9 88.8 % (Y) Ezebor. et al.
(2014) Sugarcane
bagasse
Acid site density: 1.41 96 % (Y)
Lignin-derived
from husk
BET surface area: 4.7 m2/g
Acid site density: 0.86 mmol/g
Acidified soybean
soapstock
9:1 5 70 7 97 % (C) Guo, et al.
(2012)
Microalgae
residue
BET surface area: > 1 m2/g
Acid site density: 0.90 mmol/g
Oleic acid and
triglyceride
N/A 12 80 5 98 % FFA (C)
24 % triglyceride
(Y)
Fu, et al.
(2013)
18
2.3 Carbonisation of Biomass
As carbon-based catalysts are becoming the norm in the production of biofuel, there
is a need to synthesis said catalyst which offers high catalytic activity, stability,
diverse pore structure and high acid density sites. Generally, carbon can be classified
into two variants, namely crystalline carbons and amorphous carbons. It has been
discovered that amorphous carbons such as the traditional activated carbons and
biochars, offers scientists the more promising surface structure due to its high
micropore and mesopore volumes coupled with the resulting high surface area,
increasing the sites for the active group attachments (Yang, et al., 2011).
2.3.1 Synthesis of a Porous Carbonaceous Structure
De, et al. (2015) had described in their literature the common ways of producing
porous carbon from biomass precursors based on three methods: hydrothermal
carbonisation (HTC), template-directed synthesis, and direct synthesis method.
Hydrothermal carbonisation is considered the most widely applied and favourable
approach and can be further subdivided into two types: high-temperature HTC and
low-temperature HTC:
(i) High-temperature carbonisation process is carried out under
supercritical water. It can penetrate into the pore structure better to
produce a broader distribution of micro- and mesopores and is highly
useful in preparing dissimilar carbon-based materials with high
surface areas and porosity. The disadvantage of this method is the
high operating temperature (300 – 800 °C) could clearly bring about
an adverse effect to when it comes to the stability of standard organic
compounds.
(ii) Low-temperature carbonisation process is a more benign approach
performed up to 250 °C and can be used for the functionalization of
activated carbon by dehydration, condensation, polymerisation and
aromatisation reactions; but its procedure is quite complex as it
involves the generation of different soluble products.
Another carbonisation method is the template-directed synthesis method, and
as its name depicts, applies the usage of a template for the creation of carbonaceous
materials with well-ordered pore size distribution. Three templates can be utilised,

19
that is hard template, soft template and dual template. Regardless of the type of
template used, it only serves as a scaffold, directing the pore formations during the
carbonisation process and hence improving the level of structural ordering (De, et al.,
2015). Its downside is that the structure obtained after its removal from the template
collapses at extreme temperatures.
Direct synthesis carbonisation leads to the formation of Starbons – a novel
class of mesoporous carbonaceous materials with adjustable surface functionalities.
This method is not only simple and environmental friendly as the HTC method; it is
applicable to the carbonisation of non-porous raw materials with low surface areas.
Besides that, there is no need for a template and it can be performed within various
temperature ranges (eg. 200 – 1000 °C), producing a structure with outstanding pore
volumes and sizes (De, et al., 2015). Table 2.2 illustrates several examples of the
direct synthesis carbonisation methods used in numerous literatures.

20
Table 2.3: Different Carbonisation Methods from Various Literatures
Carbon
source
Carbonisation method Sulphonation
method
Reference
Corn straw 2 g of material were heated under N2
flow for 1 h at different temperatures
(250, 300, 350, 400, 450, 500 °C)
Direct
sulphonation with
fuming H2SO4
Liu, et al.
(2013)
Microcrystall
ine Cellulose
50 g of material was pyrolysed under
dry N2 at 400 °C for 5 h
Direct
sulphonation with
conc. H2SO4
Ayodele and
Dawodu
(2014)
D-glucose 15 g of material were heated at 400 °C
for 12 h in an inert environment
Direct
sulphonation with
conc. H2SO4
Lokman, et al.
(2015)
Sucrose-
Al2O3
composite
Composite was carbonised at 600 °C
under N2 gas.
Sulphonation by
4-BDS
Geng, et al.
(2011)
Oil-cake
waste
20 g of powdered material was
impregnated with 50 % ortho-
phosphoric acid for 24 h before being
calcined in a muffle furnace at 500 °C
for 1 h. Material was then washed with
double distilled water, HCl and hot
double distilled water to obtain a pH of
6-7 before drying in an oven at 110 °C.
Sulphonation by
4-BDS
Konwar, et al.
(2014)
2.3.2 Carbonisation Temperature and Time on Catalytic Performance
Lou, et al. (2008) found that the temperature and time of carbonisation had a
significant effect on the catalytic performance. Based on the study, increasing the
carbonisation temperature of a starch-based catalyst from 300 °C up to 400 °C
showed an increase in catalytic activity and biodiesel yield of 24.8 %. Any further
increment caused a noticeable decline in performance. It was deduced that at low
temperatures, water produced from the reaction can be adsorbed onto the catalyst
exterior to prevent the entry of relatively hydrophobic oil samples, and cause the
leaching of the active groups due to the formation of a soft aggregate with weaker
bonding; high temperatures caused the catalyst to be rigid, and contained fewer –
21
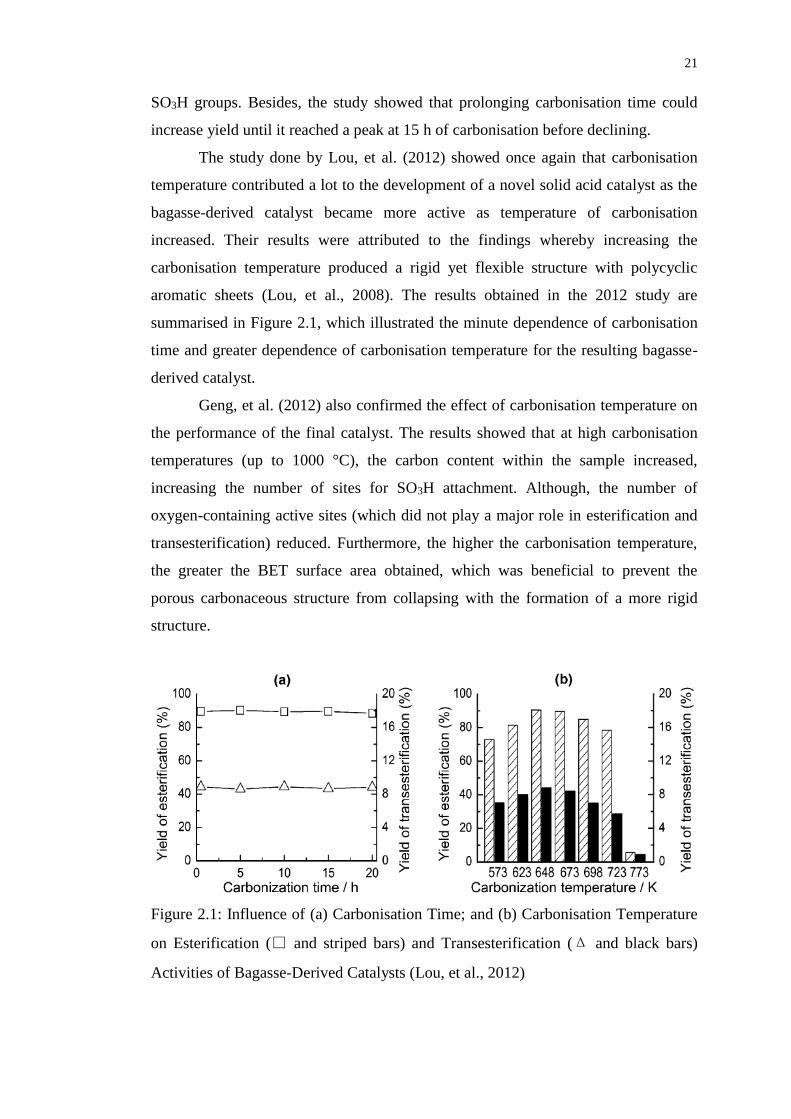
SO3H groups. Besides, the study showed that prolonging carbonisation time could
increase yield until it reached a peak at 15 h of carbonisation before declining.
The study done by Lou, et al. (2012) showed once again that carbonisation
temperature contributed a lot to the development of a novel solid acid catalyst as the
bagasse-derived catalyst became more active as temperature of carbonisation
increased. Their results were attributed to the findings whereby increasing the
carbonisation temperature produced a rigid yet flexible structure with polycyclic
aromatic sheets (Lou, et al., 2008). The results obtained in the 2012 study are
summarised in Figure 2.1, which illustrated the minute dependence of carbonisation
time and greater dependence of carbonisation temperature for the resulting bagasse-
derived catalyst.
Geng, et al. (2012) also confirmed the effect of carbonisation temperature on
the performance of the final catalyst. The results showed that at high carbonisation
temperatures (up to 1000 °C), the carbon content within the sample increased,
increasing the number of sites for SO3H attachment. Although, the number of
oxygen-containing active sites (which did not play a major role in esterification and
transesterification) reduced. Furthermore, the higher the carbonisation temperature,
the greater the BET surface area obtained, which was beneficial to prevent the
porous carbonaceous structure from collapsing with the formation of a more rigid
structure.
Figure 2.1: Influence of (a) Carbonisation Time; and (b) Carbonisation Temperature
on Esterification (□ and striped bars) and Transesterification (Δ and black bars)
Activities of Bagasse-Derived Catalysts (Lou, et al., 2012)
22
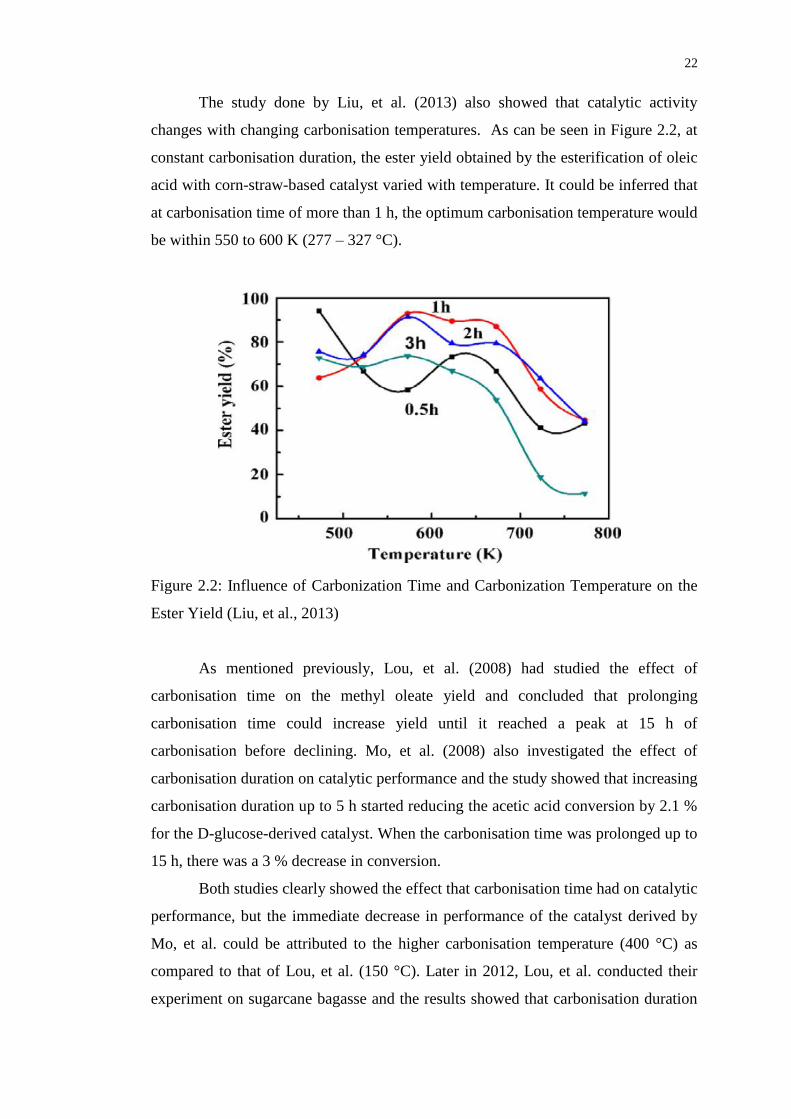
The study done by Liu, et al. (2013) also showed that catalytic activity
changes with changing carbonisation temperatures. As can be seen in Figure 2.2, at
constant carbonisation duration, the ester yield obtained by the esterification of oleic
acid with corn-straw-based catalyst varied with temperature. It could be inferred that
at carbonisation time of more than 1 h, the optimum carbonisation temperature would
be within 550 to 600 K (277 – 327 °C).
Figure 2.2: Influence of Carbonization Time and Carbonization Temperature on the
Ester Yield (Liu, et al., 2013)
As mentioned previously, Lou, et al. (2008) had studied the effect of
carbonisation time on the methyl oleate yield and concluded that prolonging
carbonisation time could increase yield until it reached a peak at 15 h of
carbonisation before declining. Mo, et al. (2008) also investigated the effect of
carbonisation duration on catalytic performance and the study showed that increasing
carbonisation duration up to 5 h started reducing the acetic acid conversion by 2.1 %
for the D-glucose-derived catalyst. When the carbonisation time was prolonged up to
15 h, there was a 3 % decrease in conversion.
Both studies clearly showed the effect that carbonisation time had on catalytic
performance, but the immediate decrease in performance of the catalyst derived by
Mo, et al. could be attributed to the higher carbonisation temperature (400 °C) as
compared to that of Lou, et al. (150 °C). Later in 2012, Lou, et al. conducted their
experiment on sugarcane bagasse and the results showed that carbonisation duration
23
had no significant effect on the yield of esterification and transesterification, as
prolonging carbonisation time only resulted in imperceptible fluctuations in yield, as
illustrated in Figure 2.1 (a), which was consistent with the findings made by Mo, et
al. (2008).
The study carried out by Dawodu, et al. (2014) further supported the findings
made by Mo, et al. (2008) regarding the effect of carbonisation time on catalytic
performance. According to the acid density results obtained, the catalyst prepared
from materials carbonised for 1 h had a greater amount of smaller carbon sheets and
consequently higher –SO3H densities (especially those attached to the sheet edges)
than the catalyst synthesised from substances carbonised for 5 h (Dawodu, et al.,
2014), although no findings were done on why was it so.
Therefore, it can be concluded that regardless of the type of starting materials
used to synthesise carbon-based solid acid catalysts, carbonisation temperature plays
a more significant role than carbonisation time.
2.4 Sulphonation
Once carbonisation has taken place in producing the activated carbons, there is a
need to increase the density of the acid sites on the carbonaceous surfaces as the
existing acid sites – OH and COOH groups – only result in mild FFA conversion
during esterification and transesterification. Hence, like normal esterification
methods, an activating agent is needed to provide a means of bringing both reactant
molecules, which in this case are the FFA or triglyceride molecules and alcohol,
close enough to establish a temporary bond and react.
2.4.1 Sulphonation methods
According to De, et al. (2015), there were numerous ways to functionalise
carbonaceous materials:
(i) Direct/in situ functionalization – organic or inorganic materials
containing the functional groups were mixed directly with the
catalytic material during its synthesis.
(ii) Post-synthetic modification – the functional groups were inserted after
the carbonaceous supports were prepared.

24
The second approach is more widely applied as compared to the single-step
direct functionalization process as certain modifications cannot be done at the
temperature of carbonisation (De, et al., 2015). Functionalisation can be done via
sulphonation or carbon nanocomposites, but sulphonisation would be utilised in this
report.
Sulphonated carbon can be prepared by directly pyrolysing and sulphonating
the carbon precursor in concentrated sulphuric acid (H2SO4). Although simple, this
process usually produces a catalyst with low surface area, low acid site densities and
poor diffusion in liquid-phase reaction mixtures (Geng, et al., 2011). Lou, et al.
(2008) had reported that higher catalytic activity was observed with larger BET
surface area, pore volume and pore size, especially if the −SO3H groups were also
found in the catalyst bulk. In their experiment, the comparatively larger pore size and
pore volume of the starch-based catalyst enabled the reactants to enter and reach the
active sites within the bulk, leading to higher catalytic efficiency compared to those
of cellulose, sucrose and D-glucose (Lou, et al., 2008). Hence, it is more favourable
to obtain a carbon catalyst with high porosity and surface area coupled with high acid
densities.
In addition, sulphonation using strong sulphonating agents like concentrated
sulphuric acid or fuming sulphuric acid were carried out at high temperatures (150 –
250 °C); the process was not entirely friendly (Konwar, et al., 2015). Furthermore,
sulphuric acid was reportedly incapable for sulphonating aromatised, structured and
rigid carbon materials (graphite, activated carbons or carbonised carbon material).
Thus, it is highly difficult to produce a catalyst which has both high porosity (as
sulphonation reduces porosity) and acid density via direct sulphonation of
concentrated or fuming sulphuric acid (Konwar, et al., 2015).
On the other hand, functionalised sulphonation using 4-
benzenediazoniumsulphonate (4-BDS) radicals will be more preferable instead of
H2SO4 as it utilises milder conditions (around 5 °C), preserves the structural and
morphological properties of the support, and it has the ability to sulphonate more
rigid and aligned carbon structures (activated carbon, graphene, ordered mesoporous
carbons, etc). Hence, it can be surmised that sulphonation via the 4-BDS method
provided a higher acid density, even higher than the acid density obtained through
sulphonation with H2SO4 making it appropriate for the functionalization of carbon
materials with thin walls, large pores, and large BET surface areas (De, et al., 2015).
25
Sulphonation can also be done via p-toluenesulphonic acid (PTSA) as was
done by Dawodu, et al. (2014). Although, materials sulphonated with concentrated
H2SO4 had a higher sulphur content than PTSA, which indicated a higher acid
density. Besides sulphonating multi-walled carbon nanotubes (MWCNTs) with
concentrated H2SO4, Shuit and Tan (2014) had also sulphonated the nanotubes via
other means as thermal treatment with H2SO4 was time-consuming and energy-
intensive. The study showed that among concentrated H2SO4, in-situ polymerisation
of acetic anhydride and sulphuric acid, in-situ polymerisation of poly(sodium 4-
styrenesulphonate) and the thermal decomposition of ammonium sulphate, the usage
of poly(sodium 4-styrenesulphonate) synthesised a catalyst with the highest acid site
density, achieving the highest yield of 93.4 % amongst the four. Table 2.4 provides a
general outlook on the methods of sulphonation from various literatures.

26
Table 2.4: Sulphonation Methods Utilised by Various Literatures
Sulphonation
method
Carbon source Catalyst Characterisation Esterification & Transesterification conditions Reference
Operating conditions Yield(Y)/ Conversion
(C)/
Turnover frequency
(TOF)
Recyclability
Direct
sulphonation
with fuming
H2SO4
Micro-
crystalline
cellulose
powder
Particle size = 10 – 40 µm
BET surface area = 2 m2/g
Acid site density = 1.9 mmol/g
Esterification:
Feedstock = Oleic acid
Alcohol:oil ratio = 25.8:1
Time = 4 hours
Temperature = 368 K
Loading = 4.6 wt%
Y = 99.9 % Washed with water: no decrease in
yield even after 10 cycles
Washed with methanol: activity
decrease to 75-80% yield after 4
cycles
Hara (2010)
Transesterification:
Feedstock = trolein
Alcohol:oil ratio = 62:1
Time = 5 hours
Temperature = 403 K
Loading = 6.77 wt%
Y = 98.1 % Washed with water: activity
remains high even after 5 cycles
Direct
sulphonation
with fuming
H2SO4
Oil palm trunk Acid site density = 1.41 mmol/g
Total acid site density = 5.31 mmol/g
Feedstock = Palmitic acid
Alcohol:oil ratio = 18:1
Time = 5 hours
Temperature = 65 °C
Loading = 9 wt%
Y = 88.8 % Washed with n-hexane: yield
decreased to 79.5% after 6 cycles
Ezerbor, et al.
(2014)
Sugarcane
bagasse
Acid site density = 1.53 mmol/g
Total acid site density = 5.52 mmol/g
Y = 96 % Washed with n-hexane: yield
decreased to 84% after 6 cycles
Direct
sulphonation
with
concentrated
H2SO4
Sugarcane
bagasse
Acid site density = 1.06 mmol/g
Total acid site density = 3.69 mmol/g
Feedstock = Oleic acid
Alcohol:oil ratio = 10:1
Time = 6 hours
Temperature = 80 °C
Loading = 0.14 g
Y = 95 %
Washed with n-hexane: activity
still remains around 90% after 8
cycles
Lou, et al.
(2012)

27
Table 2.4: (continued)
Sulphonation
method
Carbon source Catalyst Characterisation Esterification & Transesterification conditions Reference
Operating conditions Yield(Y)/ Conversion
(C)/
Turnover frequency
(TOF)
Recyclability
Sulphonation with
4-BDS
Activated
carbon powder
BET area = 318 m2/g
Average pore diameter = 2.36 nm
Pore volume = 0.76 cm3/g
Acid density = 1.42 mmol/g
Feedstock = Oleic acid
Alcohol:oil = 8 mL:1g
Time = 6 hours
Temperature = 65 °C
Loading = 50 mg
TOF = 44 h-1
- Geng, et al.
(2011)
Carbon-coated
alumina (CCA)
BET area = 39 m2/g
Average pore diameter = n.d.
Pore volume = 0.04 cm3/g
Acid density = 1.72 mmol/g
Feedstock = Oleic acid
Alcohol:oil = 8 mL:1g
Time = 6 hours
Temperature = 65 °C
Loading = 50 mg
TOF = 78 h-1
(almost five times of
Amberlyst-15
(15 h-1))
-
Carbon-coated
alumina (CCA)
with alumina
removed
BET area = 354 m2/g
Average pore diameter = 2.83 nm
Pore volume = 0.25 cm3/g
Acid density = 1.49 mmol/g
Feedstock = Oleic acid
Alcohol:oil = 8 mL:1g
Time = 6 hours
Temperature = 65 °C
Loading = 50 mg
TOF = 109 h-1
(almost five times of
Amberlyst-15
(15 h-1))
-
Sulphonation with
4-BDS
Oil-cake waste
(OCW)
Acid density = 0.735 mmol/g
Total acid density = 2.426 mmol/g
BET area = 556 m2/g
Average pore diameter = 3.9 nm
Micropore volume = 0.20 cm3/g
Feedstock = Jatropha oil
Alcohol:oil 43:1
Time = 6 hours
Temperature = 80 °C
Loading = 3 wt%
C = 99 % Conversion remains above
90% after 5 cycles
Konwar, et al.
(2014)

28
Table 2.4: (continued)
Sulphonation
method
Carbon source Catalyst Characterisation Esterification & Transesterification conditions Reference
Operating conditions Yield(Y)/ Conversion
(C)/
Turnover frequency
(TOF)
Recyclability
Sulphonation with
4-BDS
J.curcas De-
oiled seed
waste cake
(DOWC)
Acid density = 0.70 mmol/g
Total acid density = 3.96 mmol/g
BET area = 93 m2/g
Average pore diameter = 3.9 nm
Total pore volume = 0.23 cm3/g
Feedstock = Oleic acid
Alcohol:oil 20:1
Time = 10 hours
Temperature = 64 °C
Loading = 3 wt%
TOF = 70.81 h-1 Maintain high conversion at
above 60 % after 3 cycles
Konwar, et al.
(2015)
P. pinnata De-
oiled seed
waste cake
(DOWC)
Acid density = 0.84 mmol/g
Total acid density = 3.62 mmol/g
BET area = 483 m2/g
Average pore diameter = 4.8 nm
Total pore volume = 0.46 cm3/g
TOF = 104 h-1 Maintain high conversion at
above 60 % after 3 cycles
Sulphonation with
4-BDS
M. ferrea L.
De-oiled seed
waste cake
(DOWC)
Acid density = 0.75 mmol/g
Total acid density = 3.01 mmol/g
BET area = 468 m2/g
Average pore diameter = 4.0 nm
Total pore volume = 0.39 cm3/g
Feedstock = Oleic acid
Alcohol:oil 20:1
Time = 10 hours
Temperature = 64 °C
Loading = 3 wt%
TOF = 102.3 h-1 Maintain high conversion
at above 50 % after 3
cycles
Konwar, et al.
(2015)
Direct sulphonation
with H2SO4
Acid density = 0.30 mmol/g
Total acid density = 2.01 mmol/g
BET area = 690 m2/g
Average pore diameter = 4.1 nm
Total pore volume = 0.61 cm3/g
TOF = 26 h-1 Conversion decreases
immensely after 3 cycles
Hydrothermal
sulphonation with
H2SO4
Acid density = 1.30 mmol/g
Total acid density = 4.2 mmol/g
BET area < 1 m2/g
TOF = 29.2 h-1 Conversion maintained at
about 40 % after 3 cycles

29
Table 2.4: (continued)
Sulphonation
method
Carbon
source
Catalyst Characterisation Esterification & Transesterification conditions Reference
Operating conditions Yield(Y)/
Conversion (C)/
Turnover frequency
(TOF)
Recyclability
Functionalisation
with p-
toluenesulphonic
acid
C. inophyllum
seed cake
Acid density = 0.03 mmol/g
Total acid density = 1.0 mmol/g
BET area = 0.7 m2/g
Feedstock = C. inophyllum oil
Alcohol:oil 20:1
Time = 10 hours
Temperature = 64 °C
Loading = 3 wt%
C = 74.3 %
Y = 10.3 %
- Dawodu, et
al. (2014)
Direct sulphonation
with concentrated
H2SO4
Acid density = 0.8 mmol/g
Total acid density = 2.9 mmol/g
BET area = 0.8 m2/g
C = 87.2 %
Y = 75.0 %
Yield decreased by
67.6 % after 5 cycles
In-situ
polymerisation of
acetic anhydride and
sulphuric acid
Multi-walled
carbon
nanotubes
(MWCNT)
Acid density = 0.30 mmol/g
Feedstock = Palm fatty acid
distillate
Alcohol:oil 20:1
Time = 3 hours
Temperature = 170 °C
Loading = 2 wt%
Y = 85.8 % Yield maintained above
70 % after 5 cycles
Shuit and Tan
(2014)
In-site
polymerisation of
poly(sodium 4-
styrenesulphonate)
Acid density = 0.061 mmol/g
Y = 93.4 %
Thermal
decomposition of
ammonium sulphate
Acid density = 0.029 mmol/g
Y = 88.0 %

30
2.4.2 Factors Affecting Attachment of Active Groups
Subsection 2.2 has compared the effectiveness of using carbon-based solid acid
catalyst in place of metal-based SACs as it is the cheaper alternative, and provides
equally (and even higher) biodiesel yield. The attachment of the functionalised group,
−SO3H during sulphonation is important to ensure the catalyst produced has a dense
acid site to provide high conversions during both esterification and transesterification.
The types of carbon precursor used, carbonisation time, carbonisation temperature
and even sulphonation temperature can affect the structure of the carbonised material
produced, which in turn affects the integration of the −SO3H groups during
sulphonation.
2.4.2.1 Types of Raw Material
It has been referenced repeatedly that the performances of these unique catalysts is
significantly reliant on the raw material used for their synthesis. For example, the
sugar catalyst derived from D-glucose gave a favourable yield in its catalysis;
however, similarly sulphonated catalysts prepared from incompletely carbonised
resins, amorphous carbon, activated carbon and natural graphite exhibited no
improvement in catalytic activity (Konwar, et al., 2014).
Lou, et al. (2008) had showed the effect of different starting materials had on
the esterification and transesterification of biomass. All the carbohydrate-precursors
– starch, cellulose, sucrose and D-glucose – were carbonised and directly
sulphonated using concentrated H2SO4. The starched-derived catalyst had the highest
activity among the four, and achieved this milestone in the shortest duration of 3 h.
Elementary analysis (EA) and X-ray photoelectron spectroscopy (XPS) results
indicated that the starch-derived SAC was composed of polycyclic aromatic carbon
rings oriented in a random fashion, and had the highest −SO3H group densities than
its counterparts, despite them all having small surface areas. In addition, it clearly
had larger BET surface area, pore size, pore volume and a more hydrophobic surface
than the three other starting materials (Lou, et al., 2008).
Lou, et al. (2008) further inferred that the high acid site densities were
attributed to the attachment of the active group not only on the catalyst surface but
within the amorphous carbon bulk. The relatively larger pore size and pore volume
of the sulphonated starch catalyst in comparison with the three other carbohydrates
increased the accessibility of reactants into the bulk to reach the −SO3H sites. Chen

31
and Fang (2011) also produced a saccharide-based catalyst and found that the
amylopectin content in starch disturbed the PAH structure which was important for
the attachment of −SO3H groups.
The catalyst derived from vegetable oil asphalt by Shu, et al. (2009) was a
flexible material composing of sulphonated PAHs, which can exert an electron-
withdrawing force on the hydrogen-bonded sulphonic groups, improving −SO3H
stability. Furthermore, the asphalt had loose irregular networks and part of the
particles had agglomerated. After sulphonation treatment by concentrated H2SO4, the
scanning electron microscope (SEM) images showed that the agglomerates had
fragmented to a certain degree with increase in pore size. The disintegration of the
agglomerates likewise suggested that the synthesised catalyst had a high density of
acid sites on the external surface, which were readily available to the reactants.
SEM images by Ezebor, et al. (2014) revealed the properties of raw oil palm
trunk and sugarcane bagasse that could improve or obstruct the sulphonation process
(Figure 2.3). Contrary to oil palm trunk, the sugarcane bagasse had a flake-like
structure, signifying that the phenolic groups were easier to access than the SO3H
groups, accounting for its lower acid site density and slightly lower catalyst activity.
Besides, the C. inophyllum seed cake-based catalyst synthesised by Dawodu, et al.
(2014) showed high number of smaller carbon sheets, which in turn yielded high
−SO3H densities, but the activity of the catalyst decreased drastically after the fifth
cycle due to leaching. This was attributed to the weak bonding between the small
carbon sheets and the active group.

32
Figure 2.3: SEM Images of Raw Oil Palm Trunk (a) and (b); and Raw Sugarcane
Bagasse (c) and (d) (Ezebor, et al., 2014)
Konwar, et al. (2015) had also demonstrated the variations in −SO3H
densities for the sulphonated de-oiled waste cake (DOWC) derived from different
materials. The study showed that −SO3H density increased with increasing carbon
content in the activated carbon due to the increase in availability of the aromatic
carbon sheets for attachment. Although, in the study conducted by Geng, et al.
(2011), increasing carbon content of carbon-coated alumina (CCA) created larger
and thicker carbon sheets joined to form a continuous framework, rendering it less
soluble due to the rigid framework formed. Therefore, although most of the CCA
samples had high acid site densities, BET area and pores, rising carbon content
lowered the turnover frequency as the catalyst became increasingly insoluble in polar
solvents.

33
2.4.2.2 Carbonisation Temperature
As mentioned in Sub-subsection 2.3.2, Lou, et al. (2008) had showed that increasing
carbonisation temperatures improved catalytic performance but only up to a certain
temperature before performance declines. It was deduced that samples carbonised at
lower temperatures (< 648 K) had a higher phenolic −OH density, thus additional
water produced from esterification can be adsorbed onto the catalyst surface, making
it more hydrophilic, therefore impeding the access of the relatively hydrophobic fatty
acids or triglycerides to the catalyst.
Furthermore, the sample produced at low carbonisation temperature (< 648 K)
was a soft aggregate that comprised of −SO3H groups attached onto small polycyclic
aromatic carbon sites rather than a rigid carbon material, which can be readily
leached at high temperatures or in the presence of higher amount of fatty acids due to
the weaker bonding. On the other hand, carbonisation at higher temperatures (> 648
K) would make the carbon structure more rigid, presumably due to the growth and
stacking of large polycyclic aromatic carbon sheets, resulting in a catalyst with lower
flexibility and reduced surface area for −SO3H attachment, thereby leading to a lower
acid site density (Lou, et al., 2012).
2.4.2.3 Carbonisation Time
In Sub-subsection 2.3.2, various studies had shown that increasing carbonisation time
increased the catalytic performance but only up to a certain duration before
conversion plummeted (Mo, et al., 2008; Lou, et al., 2008). The study carried out by
Dawodu, et al. (2014) further supported the findings made by Mo, et al. (2008)
regarding the effect of carbonisation time on catalytic performance. As mentioned
before, the acid density results demonstrated that the catalyst prepared from materials
carbonised for 1 h possessed more small carbon sheets and hence higher SO3H
densities than the catalyst derived from material carbonised for 5 h (Dawodu, et al.,
2014).
The study conducted by Borhan and Kamil (2012) illustrates the development
of the surface morphology of rubber seed shell with increasing carbonisation time,
providing an idea of the effect of carbonisation duration on catalyst porosity. The
shell was carbonised at a fixed temperature of 500 °C, and the SEM images showed
that the surface structure of the raw material differed greatly to that of the activated
carbons (Figure 2.4). Figure 2.4 (b) shows the formation of canal structures,
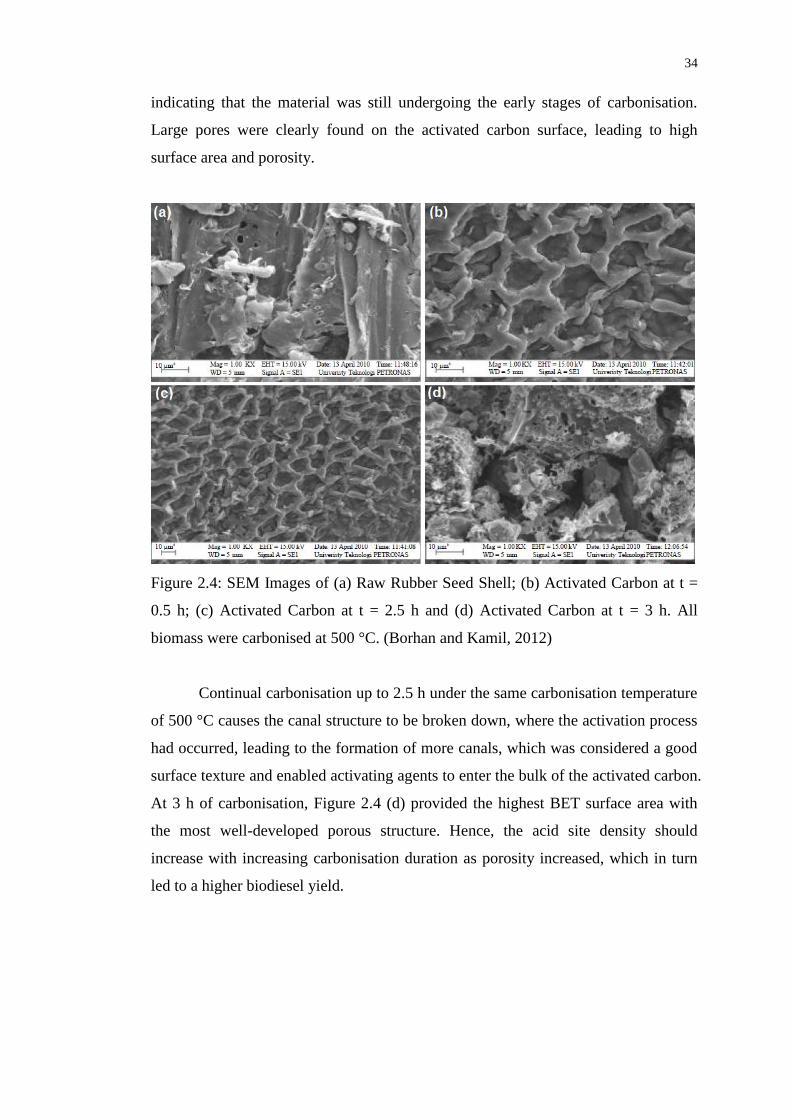
34
indicating that the material was still undergoing the early stages of carbonisation.
Large pores were clearly found on the activated carbon surface, leading to high
surface area and porosity.
Figure 2.4: SEM Images of (a) Raw Rubber Seed Shell; (b) Activated Carbon at t =
0.5 h; (c) Activated Carbon at t = 2.5 h and (d) Activated Carbon at t = 3 h. All
biomass were carbonised at 500 °C. (Borhan and Kamil, 2012)
Continual carbonisation up to 2.5 h under the same carbonisation temperature
of 500 °C causes the canal structure to be broken down, where the activation process
had occurred, leading to the formation of more canals, which was considered a good
surface texture and enabled activating agents to enter the bulk of the activated carbon.
At 3 h of carbonisation, Figure 2.4 (d) provided the highest BET surface area with
the most well-developed porous structure. Hence, the acid site density should
increase with increasing carbonisation duration as porosity increased, which in turn
led to a higher biodiesel yield.

35
2.4.2.4 Sulphonation Temperature
Although not much work was done on the effect of sulphonation time and
temperature, Lou, et al. (2012) had found that as sulphonation temperature increased
(373 to 423 K in this study), the resulting catalyst showed a marked enhancement in
esterification and transesterification activities (Figure 2.5). However, further
temperature increment above 423 K led to a rapid drop in activity. On the other hand,
the FAME yield for both esterification and transesterification increased favourably
with increasing sulphonation time until it reached maximum yield at 15 h of
sulphonation. Fourier Transform-Infrared Spectroscopy (FT-IR) spectra of the
carbonised carbon precursors in Figure 2.6 showed that the peak intensity due to
C=O groups at 1710 cm-1 was greatly enhanced, whereas the peaks for aliphatic C-H
at about 1610 cm-1 diminished once sulphonation was carried out. This showed that
besides the integration of −SO3H groups, sulphonation also resulted in structural
changes, and this was highly dependent on sulphonation temperature.
Figure 2.5: Influence of Sulphonation Conditions on Esterification (□ and striped
bars) and Transesterification (Δ and black bars) Activities of Bagasse-Derived
Catalysts (Lou, et al., 2012)

36
Figure 2.6: FTIR Spectra on the Effect of Varying Sulphonation Temperatures (373 –
473 K) (Lou, et al., 2012)
Overall, 4-BDS is a better sulphonation method as it is more environmentally
benign; it is able to sulphonate more rigid, ordered carbon structures and provides
higher acid densities. Carbon is also a better choice in catalyst synthesis as it
provides the site of −SO3H attachment, although a balanced carbon content has to be
reached whereby it contains enough sites for functionalization without rendering the
catalyst insoluble in the reacting solvent. In addition, increased carbonisation
temperature and duration will increase the acid site density, which in turn could
improve the yield of biodiesel.

37
CHAPTER 3
3 METHODOLOGY AND WORK PLAN
3.1 Materials and Apparatus
3.1.1 Raw Material and Chemicals
Table 3.1 lists down the chemicals used in the carbonisation and sulphonation of
rubber seed kernel, the chemicals involved in the esterification of palm fatty acid
distillate and the characterisation of the catalyst and biodiesel. The rubber seed was
supplied by a small rubber tree estate and the shell was a waste obtained when
extracting the kernel.
Table 3.1: Raw Materials and Chemicals Used
Chemicals/Materials Source Estimated
amount
Usage
Rubber seed Rubber estate Excess Obtain shells to be used
as carbon precursor to
synthesise SAC
Distilled water UTAR Excess To wash the materials and
to sulphonate the biomass
85% phosphoric acid UTAR 1.5 L To activate biomass and
sulphonate carbonized
material
Sulphanilic acid Chemolabs 200 g To produce the
sulphonating agent, 4-
BDS
37% hydrochloric acid UTAR 500 mL To produce the
sulphonating agent, 4-
BDS and calculate the
acid site density of SAC
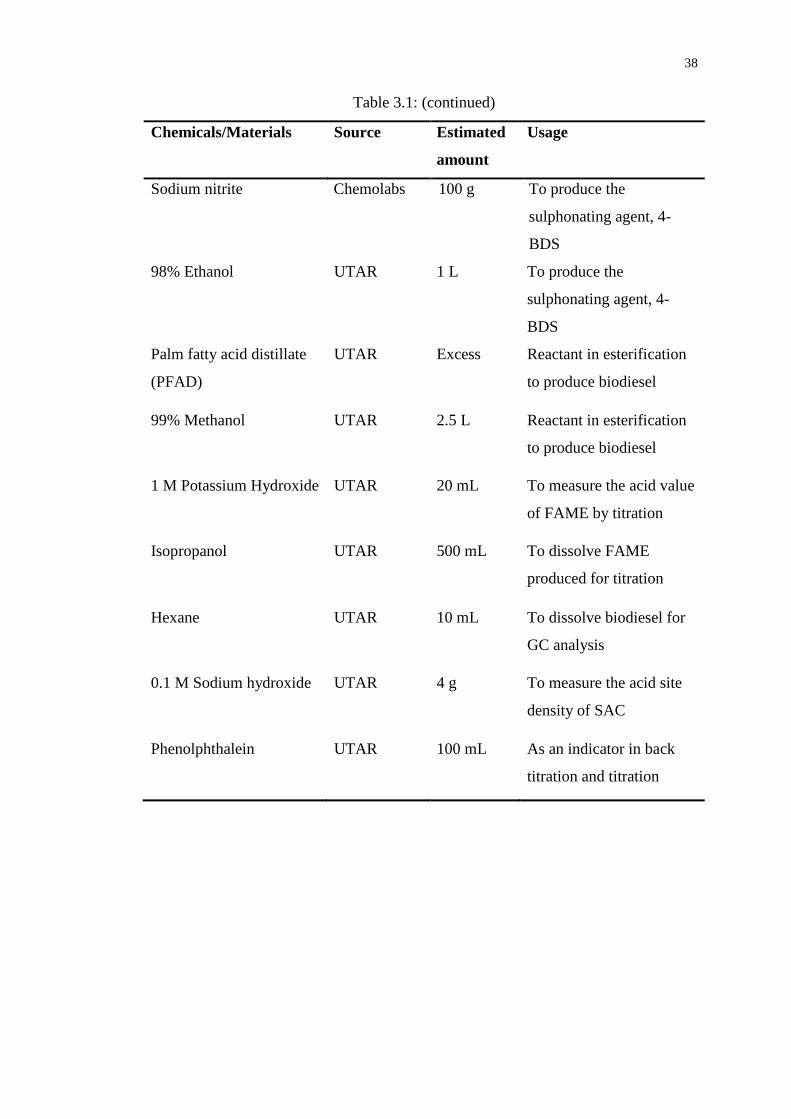
38
Table 3.1: (continued)
Chemicals/Materials Source Estimated
amount
Usage
Sodium nitrite Chemolabs 100 g To produce the
sulphonating agent, 4-
BDS
98% Ethanol UTAR 1 L To produce the
sulphonating agent, 4-
BDS
Palm fatty acid distillate
(PFAD)
UTAR Excess Reactant in esterification
to produce biodiesel
99% Methanol UTAR 2.5 L Reactant in esterification
to produce biodiesel
1 M Potassium Hydroxide UTAR 20 mL To measure the acid value
of FAME by titration
Isopropanol UTAR 500 mL To dissolve FAME
produced for titration
Hexane UTAR 10 mL To dissolve biodiesel for
GC analysis
0.1 M Sodium hydroxide UTAR 4 g To measure the acid site
density of SAC
Phenolphthalein UTAR 100 mL As an indicator in back
titration and titration

39
3.1.2 Apparatus and Equipment
Table 3.2 shows the apparatus and equipment utilized in the carbonisation and
sulphonation of the rubber seed shells, and the esterification of PFAD.
Table 3.2: Apparatus and Equipment Used
Apparatus/Equipment Specifications Usage
Oven 80 °C, overnight To dry the washed
biomass, carbonized and
sulphonated material
Carbolite furnace Carbolite RHF 15/8 To carbonize the activated
rubber seed shells
Buchner funnel and pump 90 mm To filter out carbonized
and sulphonated material
from filtrate
Blender - To blend raw rubber seed
shells into smaller size
Mortar and pestle - To grind activated carbon
produced
Sieve ASTM no.60 sieve To ensure activated
carbon are of a uniform
size of 250 µm
Ice water bath 2 L To produce 4-BDS
Coiled condenser 29/32 To condense methanol
vapours during
esterification
Heating mantle - To heat and stir the
esterification mixture
Hot plate stirrer - To stir the sulphonation
mixture

40
3.1.3 Instruments
Table 3.3 below provides an overview of the instruments that are utilized in the
catalyst and biodiesel characterisation, the respective models and specifications, and
their functions in characterising catalyst and biodiesel.
Table 3.3: Instruments Used for Catalyst and Biodiesel Characterisation
Instrument Specification Function
Scanning Electron
Microscopy (SEM)
Hitachi S-3400N To analyse surface topography,
morphology crystalline
structure and orientation of
catalyst
Sorptomatic Surface Area
Analyser (BET)
Thermo Scientific
SO1990
To measure the total specific
surface area of the catalyst.
Electron Dispersive X-Ray
Spectroscopy (EDX)
- To identify the chemical
elements and their respective
concentrations in the catalyst.
X-Ray Diffractometer Shidmazu XRD-6000 To determine the crystal
structure of the catalyst.
Fourier Transform Infrared
Spectroscopy (FT-IR)
Nicolet IS10 To identify the functional
groups present in the catalyst.
Thermogravimetric
Analysis (TGA)
- To analyse the thermal stability
of the components in the
catalyst.
3.2 Research Methodology
Figure 3.1 below shows the overall summarized methodology that will be the basis
for this research in determining the optimal carbonisation time, amount of
sulphonating agent:activated carbon ratio, esterification duration and esterification
temperature.

41
Figure 3.1: Process Flow of Research Procedure
3.3 Experimental Procedures
3.3.1 Carbonization of Biomass to Form Activated Carbon (AC)
The rubber seed shells were first washed to remove any dirt or impurities before
placing in an oven for 24 h at 80 °C to remove moisture completely (Figure 3.2). The
shells were then blended and crushed into smaller pieces of about 850 m. The
crushed shells were then presoaked with 30% (v/v) phosphoric acid in 2:1 w/w
impregnation ratio for 24 hrs at room temperature as shown in Figure 3.3. The
material was then washed thoroughly with distilled water and dried in an oven
overnight. The dried solids were then transferred into a 100 mL silica crucible with
lid and carbonized in a furnace at temperatures ranging from 200 °C to 600 °C for
2.5 h (Figure 3.4). The black carbonized solid produced was then cooled to room
temperature before being grounded and sieved with an ASTM no. 60 sieve to obtain
average particle size of < 250 µm (Figure 3.5).
The activated carbon samples carbonized between temperatures of 200 to
600 °C were named AC200, AC300, AC400, AC500 and AC600 accordingly as
shown in Table 3.4. Catalyst characterisation was performed to find the most optimal
surface area before the most suitable AC sample was chosen to undergo sulphonation.
Pretreatment of rubber seed
- washing and drying (80 °C)
- size reduction using ASTM no. 60 sieve (< 250 μm)
Carbonisation
- between temperatures of 200 -600 °C
- duration of 2 h
- grind with mortar and pestle
Catalyst characterisation
- Surface analyser
4-BDS sulphonation
- prepare 4-BDS powder/solution
- sulphonate at 3 - 5°C for 30 min
- vary acid:AC ratio (0.5:1 - 10:1)
Catalyst characterisation
- FTIR, EDX, TGA, SEM, XRD
Esterification
- fixed time = 5 h
- vary T (60 -100 °C), m:o ratio (5:1 - 25:1)
Biodiesel characterisation- Titration

42
Figure 3.2: Washed Rubber Seed Shells
Figure 3.3: Crushed Rubber Seed Shells Presoaked in 30 % v/v H3PO4

43
Figure 3.4: Presoaked Rubber Seed Shells in a Carbolite Furnace
Figure 3.5: Carbonised Material Being Grinded

44
Table 3.4: Carbonisation Parameters and AC Nomenclature
Carbonisation Temperature After Carbonisation
200 °C AC200
300 °C AC300
400 °C AC400
500 °C AC500
600 °C AC600
3.3.2 Functionalisation of AC by 4-Benzenediazoniumsulphonate
6 g of sulphanilic acid was dispersed in 300 mL of 1M HCl aqueous solution in a
round bottomed flask. The flask was then submerged into an ice bath with
temperatures maintained at 3-5 °C with continuous stirring. 90 mL of 1M NaNO2
aqueous was then added dropwise and a clear solution was obtained. After 1 h of
stirring at the same temperature, the white precipitate of 4-BDS formed was filtered
off, washed with distilled water before being transferred to a 500 mL beaker
containing 200 mL of distilled water and 60 mL of ethanol. Then, 3.0 g of the AC
sample was added into the beaker and the temperature maintained at 3-5 °C,
followed by the subsequent addition of 100 mL of 30-32% H3PO4 aqueous solution.
After 30 min of stirring, another 50 mL of H3PO2 was added and the mixture was
allowed to stand for 1 h with occasional stirring. The sulphonated AC produced was
then washed intensively with distilled water before being dried in a vacuum
overnight. The setup of the experiment is shown in Figure 3.6.
The sulphonation procedure was repeated on the AC with the most promising
surface area for different sulphanilic acid to AC ratios – 2:1; 4:1; 6:1; 7:1, 8:1 and
10:1. Catalyst characterisation was once again carried out to find the optimal
sulphanilic acid to AC ratio before the most desirable catalyst was used to carry out
the esterification process. The parameters investigated and the nomenclatures of the
catalysts produced are shown in Table 3.5.

45
Figure 3.6: Experimental Setup for Sulphonation of AC
Table 3.5: Carbonisation and Sulphonation Parameters and Catalyst Nomenclature
Sulphanilic Acid to Activated Carbon Ratio After Sulphonation
2:1 SAC2:1
4:1 SAC4:1
6:1 SAC6:1
7:1 SAC7:1
8:1 SAC8:1
10:1 SAC10:1

46
3.3.3 Catalytic Tests
Once the sulphonated catalyst with the highest acid density was determined, the SAC
produced was used to catalyse the esterification and transesterification of palm fatty
acid distillate (PFAD) to biodiesel. The esterification procedure was carried out in a
250 mL round bottom flask equipped with a magnetic stirrer and heating mantle with
temperatures kept constant at 90 °C. 3 wt% (0.3 g) of the chosen SAC catalyst was
added to appropriate amounts of methanol (15:1 molar ratio), stirred and heated to
90 °C before 10.0 g of PFAD was added with vigorous stirring at 300 rpm for 2.5 h.
The setup of the apparatus for esterification is shown in Figure 3.7. Once the reaction
was completed, the catalyst was filtered out and excess methanol was evaporation.
The esterification process was repeated for various parameters shown in Table 3.6.
Table 3.6: Esterification Parameters
Esterification Parameters Variables
Methanol to oil ratio 5:1, 10:1, 15:1, 20:1, 25:1
Esterification duration 3 h, 4 h, 5 h, 6 h, 8 h

47
Figure 3.7: Experimental Setup for Esterification of PFAD
3.4 Catalyst Characterisation
Once the solid acid catalyst was synthesised, numerous instruments were utilised in
its characterisation. The Brunauer-Emmett-Teller (BET) surface analyser, scanning
electron microscope (SEM), electron dispersive x-ray spectroscopy (EDX), Fourier
48
Transform-infrared spectroscopy (FT-IR), thermogravimetric analysis (TGA), x-ray
diffraction (XRD) and the acid density test were used to better understand the
structure, morphology, composition, and thermal stability of the catalyst.
3.4.1 Scanning Electron Microscopy (SEM)
The SEM focuses high-energy electrons into a beam to generate a variety of signals
on the surface of the solid specimen. The interactions between the beam of electrons
and the sample produce signals that reveal information on surface morphology,
chemical composition, crystalline structure and orientation of materials making up
the sample (Swapp, 2017). High resolution images are routinely generated to show
the topography of the sample.
3.4.2 BET Surface Area Analyser
The Brunauer-Emmett-Teller (BET) surface analyser provides specific surface area
evaluations via nitrogen sorption analysis. Nitrogen adsorption and desorption curves
are obtained before the BET theory is utilized to calculate the total specific surface
area in units of m2/g; the total specific surface area encompasses the external area
and pore area evaluations (HORIBA, 2017).
Once the catalysts surfaces have been analysed and the catalyst with the most
ideal surface chosen (polycyclic aromatic carbon sheets with high pore volume, pore
size and large surface area), the activated carbon was then sulphonated with 4-BDS
for SO3H group attachment. Further characterisation of the synthesized solid acid
catalyst were carried out using Electron Dispersive X-Ray Spectroscopy (EDX),
Fourier Transform Infrared Spectroscopy (FT-IR) and Thermogravimetric Analysis
(TGA) to analyse the presence of the acid group and its densities, and the thermal
stability of the catalyst.
3.4.3 Electron Dispersive X-ray Spectroscopy (EDX)
Electron dispersive spectrometry utilizes the x-ray spectrum emitted by the sample
when it is bombarded with a beam of electrons. Elemental compositions can be
analysed as in principle, all elements from atomic number 4 (Be) to 92 (U) can be
detected. Each element gives out a specific emission spectra with the concentrations
measured according to the line intensities and comparing with a standard (University
of California, 2016).

49
3.4.4 Fourier Transform – Infrared Spectroscopy (FT-IR)
FT-IR involves the study of the interactions between the sample and the
electromagnetic fields in the infrared region to identify organic and inorganic
materials. A material irradiated with IR radiation excites molecules to a higher
vibrational and rotational state. The wavelengths of light adsorbed are characteristic
of a particular functional group. The signal obtained from the detector is a
combination of constructive and destructive interferences, which is analysed by the
computer to give a single-beam IR spectrum for functional group analysis (Materials
Evaluation and Engineering, Inc., 2017).
3.4.5 Thermogravimetric Analysis (TGA)
TGA analysis measures the mass of a substance against time as the sample is
subjected to heat. In other words, the weight of the sample would increase or
decrease upon heating. The measurements obtained are primarily used to determine
the composition of materials present and also to predict their thermal stability. It
characterizes materials according to the weight lost or gained from the
decomposition, oxidation and reduction of the compounds (Perkin Elmer, 2015).
3.4.6 X-ray Diffraction (XRD)
X-ray diffraction is a method of determining the arrangement of atoms within a
crystal. Solid matter can be described as either amorphous or crystalline. An
alternating electromagnetic field (x-ray) is applied to the sample. When this beam
hits an atom, the electrons surrounding the atom will oscillate at the same frequency
as the field. Both constructive and destructive interference are observed, but only
waves which are in phase (constructive) are detected by the detector to produce an
XRD spectrum as no resultant energy is produced from destructive waves. By
studying the detector angle in the form of 2θ, the shape of the unit cell can be found,
and hence the dimension of the unit cell can be calculated. (Thermo ARL, 1999)
3.4.7 Acid Density Test
The acid density test is a practical mean of finding the total acid density of the
sulphonated material. It applies the principle of titration and is also called back
titration. For this experiment, 0.04 g of sample was added to 0.01 M NaOH solution

50
and mixed well for 30 minutes. The solid sample was then filtered out and the filtrate
was titrated with 0.01 M HCl using phenolphthalein as an indicator. The volume of
HCl used corresponds to the number of moles of NaOH molecules left unreacted
within the filtrate. By calculating the number of moles of NaOH neutralised, the total
acid density of the sample may be found. (Fu, et al., 2015; Liu, et al., 2013; Malins,
et al., 2015).
3.5 Biodiesel Characterisation
Back titration was carried out on the biodiesel obtained from the esterification
process in order to determine the conversion of free fatty acids (FFA) contained
within the PFAD.
3.5.1 Back Titration
Back titration is normally carried out to find the concentration of FFA, or the acid
number of biodiesel. Biodiesel are usually produced via esterification or
transesterification which uses high FFA source as precursors. In this study, the initial
acid value of the PFAD was first determined. Once esterification is completed, the
acid value of the oily product was found before subtracting this value with the initial
acid value to find the number of free fatty acid molecules neutralised. This can then
be compared with the initial acid value to find the conversion.
Blank titration was first carried out by neutralising 10 mL of isopropanol with
0.1 M KOH solution using phenolphthalein as an indicator. As isopropanol was used
to dissolve the biodiesel sample, carrying out the blank titration ensures that the
number of KOH molecules neutralised by the isopropanol is excluded from the final
calculation. 1 g of biodiesel sample was then dissolved in 10 mL of isopropanol and
once more titrated with 0.1 M KOH solution with phenolphthalein acting as an
indicator. End point of titration was obtained once the solution reached a permanent
reddish-orange colour. The acid number was then calculated based on Eq. (3.1):
𝐴𝑉(𝑚𝑔 𝐾𝑂𝐻−1) =56.1 × 𝑀 × 𝑉
𝑊 (3.1)
Where
M = molarity of the solution, M

51
V = volume of KOH reacted, cm3
W = the weight of the sample, g
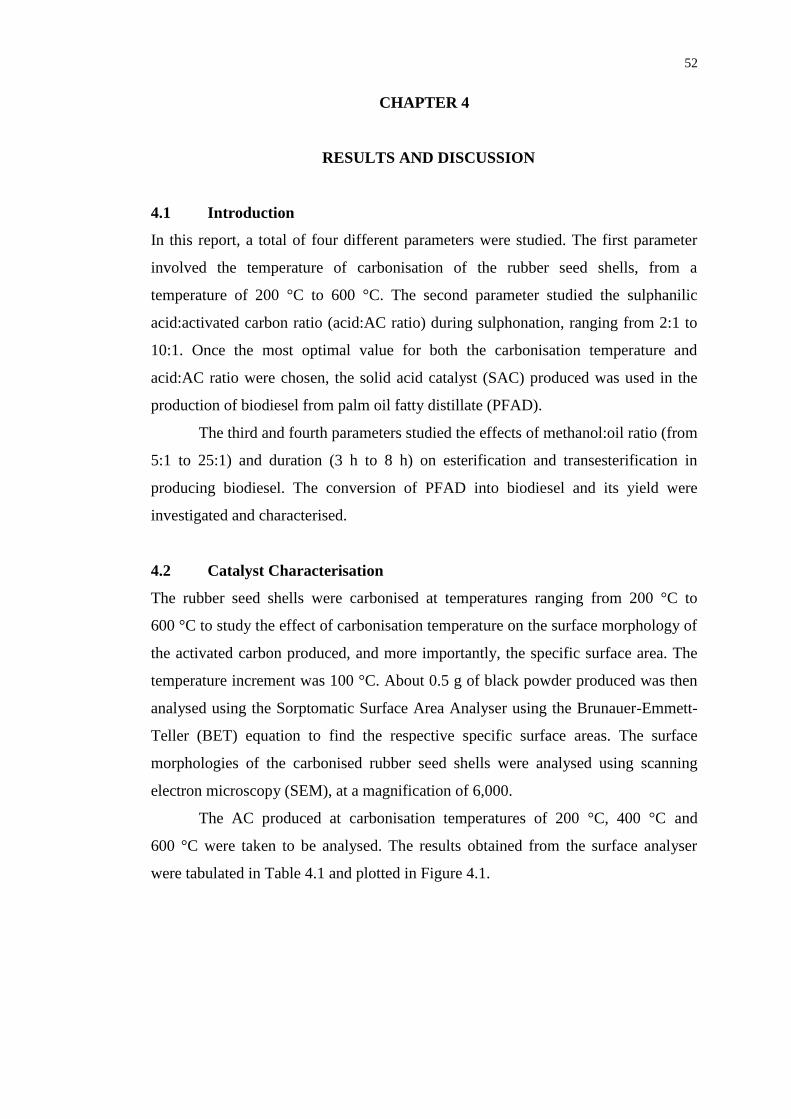
52
CHAPTER 4
4 RESULTS AND DISCUSSION
4.1 Introduction
In this report, a total of four different parameters were studied. The first parameter
involved the temperature of carbonisation of the rubber seed shells, from a
temperature of 200 °C to 600 °C. The second parameter studied the sulphanilic
acid:activated carbon ratio (acid:AC ratio) during sulphonation, ranging from 2:1 to
10:1. Once the most optimal value for both the carbonisation temperature and
acid:AC ratio were chosen, the solid acid catalyst (SAC) produced was used in the
production of biodiesel from palm oil fatty distillate (PFAD).
The third and fourth parameters studied the effects of methanol:oil ratio (from
5:1 to 25:1) and duration (3 h to 8 h) on esterification and transesterification in
producing biodiesel. The conversion of PFAD into biodiesel and its yield were
investigated and characterised.
4.2 Catalyst Characterisation
The rubber seed shells were carbonised at temperatures ranging from 200 °C to
600 °C to study the effect of carbonisation temperature on the surface morphology of
the activated carbon produced, and more importantly, the specific surface area. The
temperature increment was 100 °C. About 0.5 g of black powder produced was then
analysed using the Sorptomatic Surface Area Analyser using the Brunauer-Emmett-
Teller (BET) equation to find the respective specific surface areas. The surface
morphologies of the carbonised rubber seed shells were analysed using scanning
electron microscopy (SEM), at a magnification of 6,000.
The AC produced at carbonisation temperatures of 200 °C, 400 °C and
600 °C were taken to be analysed. The results obtained from the surface analyser
were tabulated in Table 4.1 and plotted in Figure 4.1.

53
Table 4.1: Specific Surface Area and Pore Specific Volume at Different
Carbonisation Temperatures
Sample Carbonisation temperature (°C) Specific surface area (m2/g)
AC200 200 0.6560
AC400 400 3.470
AC600 600 238.0
Figure 4.1: Graph of Specific Surface Area against Carbonisation Temperature
Figure 4.1 shows that the specific surface area gradually increased from
0.6560 m2/g to 3.470 m2/g as the carbonisation temperature was raised from 200 °C
to 400 °C, before increasing steeply to 238 m2/g from 400 °C to 600 °C. The slight
increment in specific surface area from 200 °C to 400 °C could be due to insufficient
heat provided to remove the volatile compounds and develop rudimentary pores
(Borhan and Kamil, 2012). Besides that, the phosphoric acid used might be too weak
to aid in the chemical activation of rubber seed shells as literatures such as
Pangketanang, et al. (2015) and Borhan and Kamil (2012) used the stronger base,
KOH to activate the rubber seed shells. The steep rise in specific surface area from
400 °C to 600 °C can be explained by the increase in heat energy to enhance the
removal of volatile compounds from the rubber seed shell (Borhan and Kamil, 2012).
0
50
100
150
200
250
0 100 200 300 400 500 600 700
Spe
cifi
c su
rfac
e a
rea,
m2 /
g
Carbonisation temperature, °C

54
The SEM images in Figure 4.2 helped illustrate this pore formation. Before
carbonisation, the surface of the rubber seed shells was smooth with no pores (Figure
4.2 (a)). When the raw material was carbonised at 200 °C, it can be seen in Figure
4.2 (b) that the surface of the shell has started to disintegrate, producing a specific
surface area of 0.6560 m2/g. As the carbonisation temperature was increased to
400 °C, small pores had developed with an average pore diameter of 0.5 µm, raising
the specific surface area to 3.470 m2/g (Figure 4.2 (c)). Once more, according to
Borhan and Kamil (2012), this was because more heat was provided to further
disintegrate the organic structure, increasing the carbon content, widening the pore
size. A further increase in temperature up to 600 °C not only increased the number of
pores, but further expanded the pore diameter to 1.5 μm.
Figure 4.2: SEM images of (a) raw rubber seed shell, (b) AC200, (c) AC400 and (d)
AC600
Therefore, it can be concluded that as carbonisation temperature was
increased, the specific surface area of the activated carbon produced also increased.
This was consistent with the findings done by Pangketanang, et al. (2015) whereby

55
the surface area of the carbonised rubber seed shells increased from 429 m2/g to 620
m2/g when it was carbonised from 700 °C to 900 °C. The results can further be
supported by Geng, et al. (2012), which showed that increasing the carbonisation
temperature increased the surface area of the sucrose-Al2O3 composite. Moreover,
the results showed that between carbonisation temperatures of 200 °C to 600 °C,
600 °C was the most optimal carbonisation temperature. Any temperatures higher
than 600 °C were not tested as according to Lou, et al. (2012), high carbonisation
temperatures could cause the catalyst to be too rigid, and contain less SO3H groups.
Hence, the AC produced from 600 °C was chosen to undergo sulphonation.
Sulphonation of AC600 was carried out at varying sulphanilic acid amounts
to investigate the effect of acid:AC ratio on the total acid density of the solid acid
catalyst (SAC) synthesised via 4-benzenediazonium sulphonate (4-BDS)
functionalisation. For this parameter, the sulphanilic acid:AC ratio was studied based
on a weight-to-weight basis. The ratios varied from 2:1, 4:1, 6:1, 7:1, 8:1 and 10:1.
Electron Dispersive X-ray Spectroscopy (EDX) was carried out to determine the
presence and concentration of the sulphur atoms from the SO3H groups. The acid
density test was used to determine the total acid density of the SACs produced. The
incorporation of the SO3H groups onto the catalyst was further analysed using FT-IR
spectroscopy. Once more, the surface morphology of the solid acid catalyst was
analysed using the SEM, at a magnification of 6,000. The thermal stability of the
catalyst was investigated using thermogravimetric analysis (TGA) using N2 gas and
heated to 900 °C. The crystallinity of the novel catalyst was determined by X-Ray
Diffraction (XRD).
An example of the EDX spectrum, using sample SAC2:1 is given as Figure
4.3. It can be seen that elemental carbon and oxygen were detected. This should
come as no surprise as all activated carbons contain carbon (C) and oxygen (O). The
presence of elemental phosphorus (P) was contributed by the phosphoric acid used in
the chemical activation of the crushed rubber seed shells. Moreover, elemental
sulphur (S) can be attributed to the sulphonation process. The outlier in this case,
which was elemental aluminium (Al), could be present due to its transfer during the
crushing and grinding phase of the activated carbons.

56
Figure 4.3: EDX Spectrum Showing the Elemental Compositions Within SAC2:1
The data acquired from the EDX elemental analysis was further tabulated into
Table 4.2 whereas the data obtained from the acid density test was tabulated into
Table 4.3. A graph of the elemental composition of sulphur (taking the highest value
for each) and total acid density against acid:AC ratio was plotted in Figure 4.4.
Table 4.2: Elemental Sulphur Concentrations at Varying Sulphanilic Acid-to-AC
Ratios
Sample Acid:AC ratio
(w/w)
Elemental concentration of sulphur (wt%)
Scanned
area 1
Scanned
area 2
Scanned
area 3
Average
SAC2:1 2:1 0.00 0.25 0.34 0.20
SAC4:1 4:1 3.74 0.49 0.27 1.50
SAC6:1 6:1 9.03 8.89 3.75 7.22
SAC7:1 7:1 0.19 0.17 5.10 1.82
SAC8:1 8:1 0.00 0.92 0.92 0.61
SAC10:1 10:1 0.23 0.00 0.17 0.13

57
Table 4.3: Total Acid Density at Varying Sulphanilic Acid-to-AC Ratios
Sample Acid:AC ratio (w/w) Total acid density (mmol/gcat)
SAC2:1 2:1 2.325
SAC4:1 4:1 2.906
SAC6:1 6:1 2.894
SAC7:1 7:1 2.900
SAC8:1 8:1 2.694
SAC10:1 10:1 2.737
Figure 4.4: Graph of Elemental Sulphur Composition and Total Acid Density
Against Sulphanilic Acid-to-Activated Carbon Ratio
Based on Figure 4.4, as the acid:AC ratio increased from a ratio of 2:1, the
total acid density of the SAC produced increased, although this value reached a
plateau of 2.906 mmol/gcat at a ratio of 4:1 before decreasing to 2.694 mmol/gcat at a
ratio of 8:1. The initial increase was synonymous to the initial binding of the SO3H
groups to the surface of the carbonaceous material. As more 4-BDS was produced
with increasing amounts of sulphanilic acid, more SO3H groups were attached to the
AC pores. The plateau could be explained whereby most of the binding sites in the
mesopores and micropores developed during carbonisation had been fully occupied
by the SO3H groups. Besides, according to Konwar, et al. (2015), the amount of
0
0.5
1
1.5
2
2.5
3
3.5
0
1
2
3
4
5
6
7
8
9
10
0 2 4 6 8 10 12
Tota
l Aci
d D
en
sity
(m
mo
l/g c
at)
Ele
me
nta
l Su
lph
ur
Co
mp
osi
tio
n (
wt%
)
Acid: AC Ratio
Elemental S
Total aciddensity

58
sulphanilic acid caused minute changes to the catalyst’s acid density as this depended
on the sites available for SO3H group attachments. The drop in acid density after
ratio 8:1 could be due to the intensive washing of the catalyst as more washing cycles
were needed to completely remove any unattached SO3H groups. This could
adversely cause some of the attached SO3H groups to detach, subsequently lowering
the total acid density.
It can be seen from Table 4.2 that the SAC with the most elemental sulphur
present and with the best distribution was SAC6:1 – when the carbonised material
AC600 was sulphonated with an acid:AC weight ratio of 6:1. Theoretically, it should
have the highest acid density. However, according to Table 4.3, the catalyst with the
highest acid density was SAC4:1. By comparing both the sulphur distribution and
total acid density from Figure 4.4, SAC6:1 was chosen as the most promising solid
acid catalyst to be used to synthesise biodiesel from PFAD. This was because
although SAC6:1 has almost as high an acid density as that of SAC4:1, SAC6:1 has a
better SO3H group distribution (as indicated by EDX analysis) than SAC4:1. Its
incorporation and distribution was shown in the SEM image on the right of Figure
4.6.
The FT-IR spectrum of the optimum catalyst produced was illustrated in
Figure 4.5. The appearance of bands at 1099.48 cm-1 was attributed to S=O
stretching whereas the band at 1272.75 cm-1 was due to SO3H stretching as
mentioned by Geng, et al. (2011) and Konwar, et al. (2014). Therefore, the presence
of both bands in the FT-IR spectrum of the sulphonated AC600 signified the
successful attachment of the SO3H groups. On top of that, the presence of the weak
acids were also indicated in the spectrum: the hydroxyl –OH group was characterised
by the wavenumbers 3602.23 to 3852.80 cm-1 on the AC600 spectrum and 3726.79
cm-1 on the SAC6:1 spectrum (Lou, et al., 2012; Shuit and Tan, 2014). The carbonyl
C=O group from –COOH was attributed to wavenumbers 1653.79 to 1734.61 cm-1
in the AC600 spectrum and 1653.81 to 1752.34 cm-1 in the SAC6:1 spectrum as
according to Dawodu, et al. (2014) and Konwar, et al (2014).
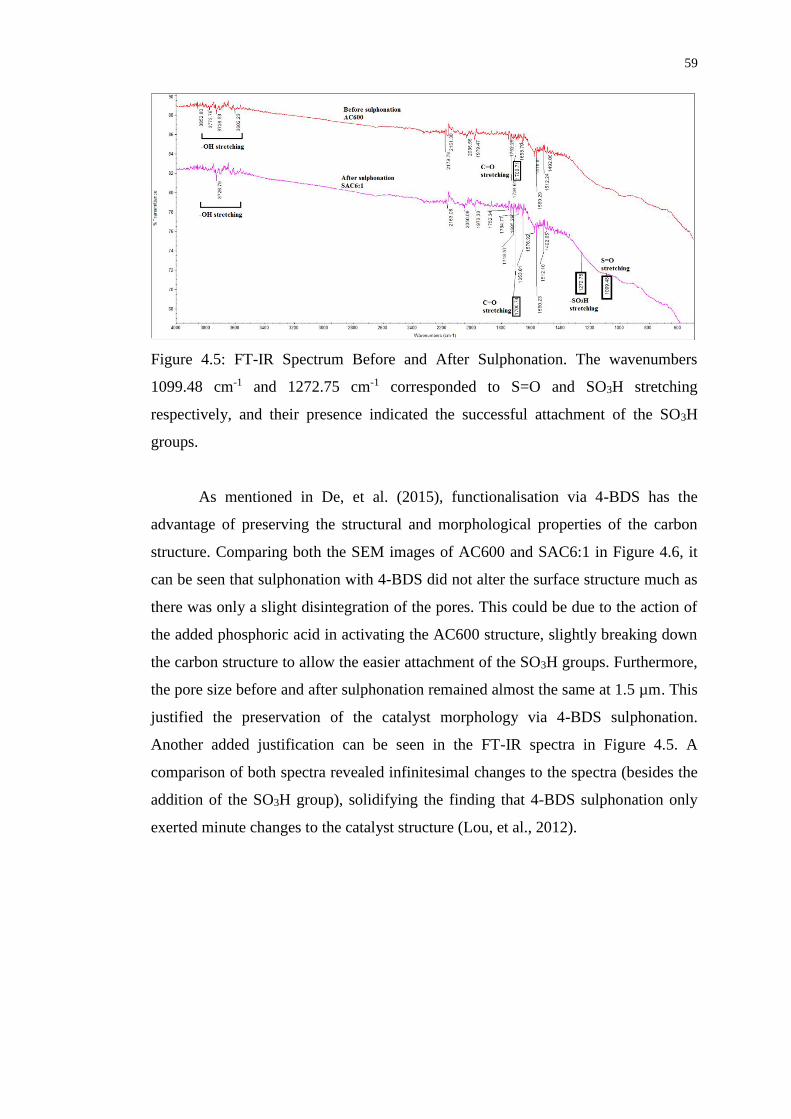
59
Figure 4.5: FT-IR Spectrum Before and After Sulphonation. The wavenumbers
1099.48 cm-1 and 1272.75 cm-1 corresponded to S=O and SO3H stretching
respectively, and their presence indicated the successful attachment of the SO3H
groups.
As mentioned in De, et al. (2015), functionalisation via 4-BDS has the
advantage of preserving the structural and morphological properties of the carbon
structure. Comparing both the SEM images of AC600 and SAC6:1 in Figure 4.6, it
can be seen that sulphonation with 4-BDS did not alter the surface structure much as
there was only a slight disintegration of the pores. This could be due to the action of
the added phosphoric acid in activating the AC600 structure, slightly breaking down
the carbon structure to allow the easier attachment of the SO3H groups. Furthermore,
the pore size before and after sulphonation remained almost the same at 1.5 µm. This
justified the preservation of the catalyst morphology via 4-BDS sulphonation.
Another added justification can be seen in the FT-IR spectra in Figure 4.5. A
comparison of both spectra revealed infinitesimal changes to the spectra (besides the
addition of the SO3H group), solidifying the finding that 4-BDS sulphonation only
exerted minute changes to the catalyst structure (Lou, et al., 2012).

60
Figure 4.6: SEM Images Before (Left, AC600) and After Sulphonation (Right,
SAC6:1)
Thermogravimetric analysis was performed on catalyst SAC6:1 and its
thermal stability was compared to that of AC600. The results were plotted into
Figure 4.7. The initial 7 % decrease in weight percentage from an initial temperature
of 30 °C to 100 °C was due to the evaporation and loss of free water (Konwar, et al.,
2014). The minute decrease in weight loss from 100 °C to 500 °C could be attributed
to the removal of adsorbed water within the pores (Ezebor, et al., 2014; Zhou, et al.,
2016). A more significant decrease was observed from 500 °C to 900 °C whereby the
weight loss of the catalyst decreased by 20 % for SAC6:1 whereas the weight loss of
AC600 was twice that value. This could be synonymous to removal of the SO3H
group as this region was absent in AC600 (Konwar, et al., 2014). This indicated that
the sulphonated AC has a higher thermal stability compared to the unsulphonated AC.
This was because the attachment of the SO3H group lowered the inception of thermal
decomposition (Konwar, et al., 2015). Therefore, it can be inferred from the Figure
4.7 that SAC6:1 has a thermal stability of up to 500 °C.

61
Figure 4.7: TGA Curve for AC600 and SAC6:1
X-Ray Diffraction patterns for both AC600 and SAC6:1 were shown in
Figure 4.8. Looking at the diagram as a whole, it once more cemented the finding
that sulphonation via 4-BDS maintained the structure of the support as no obvious
differences could be seen between the two XRD profiles. According to both Ezebor,
et al. (2014) and Zhou, et al. (2016), the diffraction peaks observed at 2θ = 20 ° – 35 °
corresponded to aromatic carbon sheets arranged randomly in an amorphous
structure, with a plane of (002) (Konwar et al., 2014). The peaks at 2θ = 40 ° – 55 °
could be credited to its crystalline graphite-like structure (Zhou et al., 2016), which
according to Konwar, et al (2014), had a plane of (101). The two sharp peaks located
at 2θ = 65 ° and 2θ = 78 ° could be ascribed to impurities introduced during blending
(aluminium from the blender blade) or carbonisation (silica from the crucible).
0
20
40
60
80
100
120
0 100 200 300 400 500 600 700 800 900 1000
We
igh
t %
(%
)
Temperature (°C)
AC600
SAC6:1

62
Figure 4.8: XRD Profile of AC600 (Top) and SAC6:1 (Bottom)
A comparison of numerous novel carbon catalysts and the catalyst produced
in this study was done and generated in Table 4.4. It should be noted that all the
catalyst listed were synthesised via sulphonation with 4-BDS.
Table 4.4: Comparison of SAC6:1 and Other Carbon Catalysts From Various
Literatures
Carbon source BET surface
area (m2/g)
Total acid
density (mmol/g)
Source
Rubber seed shell 238 2.89
Activated carbon power 318 1.42 Geng, et al.
(2011) Carbon-coated alumina
(CCA)
39 1.72
CCA with alumina removed 354 1.49
Oil-cake waste 556 0.735 Konwar, et al.
(2014)
J.curcas De-oiled seed waste
cake (DOWC)
93 3.96 Konwar, et al.
(2015)
P. pinnata De-oiled seed
waste cake (DOWC)
483 3.62
63
Comparing the rubber seed shell-derived SAC to novel carbon catalyst
synthesised by others, it could be seen that SAC6:1 has a higher total acid density
value than that of the catalyst developed by Geng, et al. (2011) and Konwar, et al.
(2014). This indicated that rubber seed shells could be a good candidate in
synthesising a promising solid acid catalyst to be used in biodiesel production. It is
therefore hypothesised that a high FFA conversion would come out of this
experimentation.
4.3 Biodiesel Characterisation
Esterification of palm fatty acid distillate (PFAD) was carried out at 90 °C with a
catalyst loading of 3 wt%, and by varying the methanol-to-oil ratio (from 5:1 to 25:1)
and duration (3 h to 8 h) to investigate the conversion of the free fatty acids (FFA)
within PFAD into biodiesel. FFA conversion was calculated based on the acid values
by using Eq. (4.1):
𝐶𝑜𝑛𝑣𝑒𝑟𝑠𝑖𝑜𝑛 (%) =𝐴𝑉 − 𝐴𝑉0
𝐴𝑉0 (4.1)
Where AV and AV0 were the final and initial acid values respectively. The acid
value was found according to the methodology in Sub-subsection 3.5.1 and is
calculated using Eq. (4.2) as shown:
𝐴𝑉(𝑚𝑔 𝐾𝑂𝐻−1) =56.1 × 𝑀 × 𝑉
𝑊 (4.2)
Where
M = molarity of the solution, M
V = volume of KOH reacted, cm3
W = the weight of the sample, g
The effect of methanol-to-oil ratio on the FFA conversion of PFAD was
illustrated in Figure 4.6.
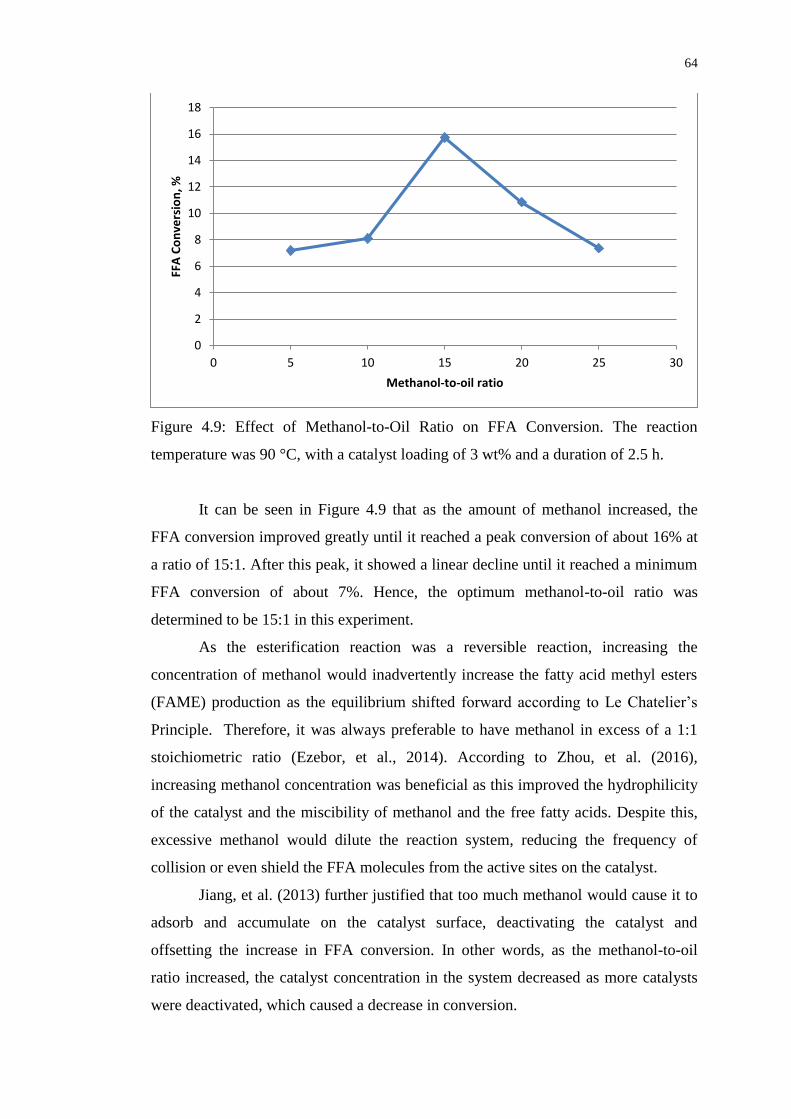
64
Figure 4.9: Effect of Methanol-to-Oil Ratio on FFA Conversion. The reaction
temperature was 90 °C, with a catalyst loading of 3 wt% and a duration of 2.5 h.
It can be seen in Figure 4.9 that as the amount of methanol increased, the
FFA conversion improved greatly until it reached a peak conversion of about 16% at
a ratio of 15:1. After this peak, it showed a linear decline until it reached a minimum
FFA conversion of about 7%. Hence, the optimum methanol-to-oil ratio was
determined to be 15:1 in this experiment.
As the esterification reaction was a reversible reaction, increasing the
concentration of methanol would inadvertently increase the fatty acid methyl esters
(FAME) production as the equilibrium shifted forward according to Le Chatelier’s
Principle. Therefore, it was always preferable to have methanol in excess of a 1:1
stoichiometric ratio (Ezebor, et al., 2014). According to Zhou, et al. (2016),
increasing methanol concentration was beneficial as this improved the hydrophilicity
of the catalyst and the miscibility of methanol and the free fatty acids. Despite this,
excessive methanol would dilute the reaction system, reducing the frequency of
collision or even shield the FFA molecules from the active sites on the catalyst.
Jiang, et al. (2013) further justified that too much methanol would cause it to
adsorb and accumulate on the catalyst surface, deactivating the catalyst and
offsetting the increase in FFA conversion. In other words, as the methanol-to-oil
ratio increased, the catalyst concentration in the system decreased as more catalysts
were deactivated, which caused a decrease in conversion.
0
2
4
6
8
10
12
14
16
18
0 5 10 15 20 25 30
FFA
Co
nve
rsio
n, %
Methanol-to-oil ratio

65
The effect of esterification duration on the FFA conversion of PFAD was
illustrated in Figure 4.10.
Figure 4.10: Effect of Esterification Duration on FFA Conversion. The reaction
temperature was 90 °C, with a catalyst loading of 3 wt% and a methanol-to-oil ratio
of 15:1.
Figure 4.10 shows that for every one hour increase in reaction time from 3 h
to 6 h, the FFA conversion gradually increased from a conversion of around 11 % to
a value of around 17 %. A further increase in esterification duration up to 8 h
increased the FFA conversion further to about 30 %.
In the beginning of the reaction, the methanol and PFAD molecules start to
collide with the SAC. The attachment of both the PFAD and methanol molecules led
to the formation of methyl esters and water. As the reaction time increased, the
frequency of collision between the reactant molecules and the catalyst increased,
leading to an increase in methyl ester formation. As the catalysts were not involved
in the reaction and its conformation was not changed, the methanol and PFAD
molecules could weakly bind to the active sites for esterification to take place before
detaching and allowing other reactants to take their places. This reaction would carry
on indefinitely until all the reactants have been converted into FAME. Therefore, the
graph still continued to increase after a duration of 8 h as the reactants have not been
used up. It is thus determined that the optimum esterification duration for this
experiment was 8 h.
0
5
10
15
20
25
30
35
2 4 6 8 10
FFA
Co
nve
rsio
n, %
Duration, h

66
Once again, esterification reaction is a reversible reaction which not only
produces methyl esters in the forward reaction but water too. Thence, there could be
setbacks in prolonging the reaction as this could inadvertently increase the water
content within the mixture, driving the esterification reaction backwards. But judging
on the trend in Figure 4.10, the FFA conversion has not reached a plateau after 8 h.
This could mean that the reactants were still dominating within the mixture
compared to the products, so the reaction was still being driven forward as according
to Le Chatelier’s Principle.
Compared to the conversion values obtained in Geng, et al. (2012), Konwar,
et al. (2014), and Malins, et al. (2015), the conversion values obtained in this
experiment was comparatively lower than all three journals. The types of carbon
precursor used, its acid density, the esterification conditions, maximum duration and
final conversion of each literature were summarised in Table 4.5. By comparing the
acid densities of each catalyst, the SAC derived from rubber seed shells should give
the highest FFA conversion as compared to the other catalysts. The fact that the
results showed otherwise could mean that there might be more weak acid sites
present on the surface of the catalyst as compared to the number of strong acid sites.

67
Table 4.5: Comparison of Esterification Duration and Conversion of Various
Literatures
Carbon
Precursor
Acid Density and
Esterification Conditions
Longest
Duration (h)
Conversion
(%)
Source
Rubber
seed
shells
Acid density = 2.89 mmol/g
T = 90 °C
Loading = 3 wt%
Methanol:oil ratio = 15:1
8 30 -
Resin Acid density = 1.86 mmol/g
T = 65 °C
Loading = 20 mg of solid
catalyst
Methanol = 8 ml
Oleic acid = 1 g
5 97 Geng, et al
(2012)
Oil-cake
waste
Acid density = 2.426
mmol/g
T = 100 °C
Loading = 5 wt%
Methanol to oil ratio = 43:1
6 97 Konwar, et
al. (2014)
Activated
carbon
Acid density = 0.72 mmol/g
T = 65 °C
Loading = 10 wt%
Methanol to oil ratio = 20:1
7 92 Malins, et
al. (2015)
The low conversion could also be attributed to the low catalyst loading as
compared to Konwar, et al (2014) and Malins, et al. (2015). This was because at low
catalyst loading, there were fewer SACs available to bring both the methanol
molecules and the PFAD molecules in close contact with each other to react.
Moreover, faulty equipment could have contributed to the low FFA conversion.
When carrying out the experiment, the temperature probe of the heating mantle was
not in contact with the solution mixture, instead was placed on the surface of the
round bottom flask near the bottom. Therefore, the temperature reading on the
heating mantle did not represent the actual temperature of the solution mixture, and

68
the actual temperature within the round bottom flask could be lower. Hence, the
conversion was at a low value.
In addition, if it were true that there were a higher number of weaker –OH
acid groups located on the catalyst as compared to the strong SO3H acid groups,
sulphonation via 4-BDS could not be a plausible method when using rubber seed
shells as a carbon precursor. Stronger sulphonating agent, such as concentrate or
fuming sulphuric acid, could be a more effective candidate due to its more rigorous
nature, although there is always the setback of it affecting the structural morphology
of the catalyst. Besides, non-conventional sulphonating agents mentioned in
Subsection 2.3.1, which were p-toluenesulphonic acid (PTSA), in-situ
polymerisation of acetic anhydride, in-situ polymerisation of poly(sodium 4-
styrenesulphonate) and thermal decomposition of ammonium sulphate could also be
tested to decide on the best sulphonating agent when using rubber seed shells as the
carbon precursor.
69
CHAPTER 5
5 CONCLUSIONS AND RECOMMENDATIONS
5.1 Conclusions
In conclusion, the objective to synthesise a heterogeneous carbon-based solid acid
catalyst using waste rubber seed shells via the 4-Benzenediazoniumsulphonate (4-
BDS) method was successfully achieved. Both the carbonisation temperature and
sulphanilic acid-to-activated carbon ratio for the synthesis of the carbon-based solid
acid catalyst were successfully optimised. The catalytic activity of the novel catalyst
for biodiesel production was investigated and the esterification conditions (methanol-
to-oil ratio and esterification duration) were successfully optimised.
The study showed that as carbonisation temperature increased, the specific
surface area of the carbonised material increased. The optimal carbonsation
temperature within the range of study was found to be 600 °C. High sulphanilic acid-
to-activated carbon ratios improve the total acid density of the sulphonated material.
The optimal ratio was found to be 6:1 for the catalyst produced. Based on the results
from the Sorptomatic Surface Area Analyser, the specific surface area of the catalyst
was 238 m2/g. The pore diameter of the catalyst according to the SEM images was
found to be 1.5 μm. The FT-IR spectrum not only showed the successful attachment
of the SO3H groups at 1099.48 cm-1 and 1272.75 cm-1, but EDX and total acid
density tests showed that the catalyst has an elemental sulphur composition of 7.22
wt% and a total acid density of 2.894 mmol/gcat. TGA analysis indicated that the
SAC6:1 catalyst has a thermal stability of up to 500 °C. XRD patterns showed that
the catalyst produced was an amorphous aromatic carbon structure with a plane of
(002) and a plane of (101).
The catalytic activity of the catalyst was found to be dependent on methanol-
to-oil ratios and esterification duration. At 90 °C with a catalyst loading of 3 wt%,
the optimal methanol-to-oil ratio was found to be 15:1 whereas the optimal duration
was 8 h. The free fatty acid (FFA) conversion of palm fatty acid distillate (PFAD)
under optimal conditions was found to be 30 %. Rubber seed shells have the
potential to be used as a carbon precursor in SAC synthesis for biodiesel production.

70
5.2 Recommendations for future work
It would be recommended that the same weighing balance be used as the calibration
between devices could have minor changes. Extended laboratory hours could aid in
obtaining better and more reliable results for time-dependent reactions. A larger
container should be used in preparing the ice bath in order for low temperatures to be
maintained throughout the experiment. When drying, samples should be left longer
within the dryer to ensure moisture is completely removed. It can also be
recommended that a proper functioning heating mantle should be used to ensure the
readings obtained from the heating mantle.

71
REFERENCES
Ayodele, O.O. and Dawodu, F.A., 2014. Production of biodiesel from Calophyllum
inophyllum oil using a cellulose-derived catalyst. Biomass and Bioenergy, 70,
pp.239-48.
Berkeleybiodiesel.org, 2015. Usage of Biodiesel Fuel - A Review by Experts. [Online]
Available at: http://www.berkeleybiodiesel.org/usage-of-biodiesel-fuel-a.html
[Accessed 3 February 2017].
Bloomberg News, 2012. Condoms, gloves provide lifeline for Malaysian rubber.
[Online] Available at: http://www.bangkokpost.com/print/322063/ [Accessed 3
March 2017].
Borhan, A. and Kamil, A.F., 2012. Preparation and Characterization of Activated
Carbon from Rubber-seed Shell by Chemical Activation. Journal of Applied Sciences,
12(11), pp.1124-29.
Campbell, C.J., 2005. Future Production - Crisis and Beyond. In Oil Crisis. Borough
of Brentwood: Multi-Science Publishing Co. Ltd. pp.173-76.
Chen, G. and Fang, B.S., 2011. Preparation of solid acid catalyst from glucose–starch
mixture for biodiesel production. Bioresource Technology, 102(3), pp.2635–40.
Choi, J.M., Han, S.S. and Kim, H.S., 2015. Industrial Applications for Enzyme
Biocatalysis: Current Status and Future Aspects. Biotechnology Advances, 33(7),
pp.1443-54.
CIEC Promoting Science, 2013. Catalysis in Industry. [Online] Available at:
http://www.essentialchemicalindustry.org/processes/catalysis-in-industry.html
[Accessed 25 January 2017].
Clark, J., 2013. Le Chatelier's Principle. [Online] Available at:
http://www.chemguide.co.uk/physical/equilibria/lechatelier.html [Accessed 9
February 2017].
Dawodu, F.A. et al., 2014. Effective conversion of non-edible oil with high free fatty
acid into biodiesel by sulphonated carbon catalyst. Applied Energy, 114, pp.819–26.
De, S., Balu, A.M., van der Waal, J.C. and Luque, R., 2015. Biomass-Derived
Porous Carbon Materials: Synthesis and Catalytic Applications. ChemCatChem, 7,
pp.1608 – 1629.
Demshimino, S.I. et al., 2013. Comparative Analysis of Biodiesel and Petroleum
Diesel. International Journal of Education and Research, 1(8), pp.1-8.
Diesel Service and Supply, 2017. Industrial Diesel Engines: Generator and Engine
Types and Industrial Uses. [Online] Available at:
72
http://www.dieselserviceandsupply.com/industrial_industry_usage.aspx [Accessed
21 January 2017].
Ezebor, F., Khairuddean, M., Abdullah, A.Z. and Boey, P.L., 2014. Oil palm trunk
and sugarcane bagasse derived heterogeneous acid catalysts for production of fatty
acid methyl esters. Energy, 70, pp.493–503.
Fu, X.B. et al., 2015. Biodiesel Production Using a Carbon Solid Acid Catalyst
Derived from β-Cyclodextrin. Journal of the American Oil Chemists' Society, 92(4),
pp.495-502.
Fu, X.B. et al., 2013. A microalgae residue based carbon solid acid catalyst for
biodiesel production. A microalgae residue based carbon solid acid catalyst for
biodiesel, 146, pp.767–70.
Gardy, J., Hassanpour, A., Lai, X.J. and Ahmed, M.H., 2016. Synthesis of Ti(SO4)O
solid acid nano-catalyst and its application for biodiesel production from used
cooking oil. Applied Catalysis A: General, 527, pp.81-95.
Geng, L., Wang, Y., Yu, G. and Zhu, Y.X., 2011. Efficient carbon-based solid acid
catalysts for the esterification of oleic acid. Catalysis Communications, 13(1), pp.26-
30.
Geng, L., Yu, G., Wang, Y. and Zhu, Y.X., 2012. Ph-SO3H-modified mesoporous
carbon as an efficient catalyst for the esterification of oleic acid. Applied Catalyst A:
General, 427-428, pp.137-44.
Guldhe, A. et al., 2017. Biodiesel synthesis from microalgal lipids using tungstated
zirconia as a heterogeneous acid catalyst and its comparison with homogeneous acid
and enzyme catalysts. Fuel, 187, pp.180-88.
Guo, F., Xiu, Z.L. and Liang, Z.X., 2012. Synthesis of biodiesel from acidified
soybean soapstock using a lignin-derived carbonaceous catalyst. Applied Energy, 98,
pp.47–52.
Haluzan, D., 2010. Biodiesel and Standard Diesel Comparison. Renewables-info.com,
23 November.
Hara, M., 2010. Biodiesel Production by Amorphous Carbon Bearing SO3H, COOH
and Phenolic OH Groups, a Solid Brønsted Acid Catalyst. Topics in Catalysis,
53(11), pp.805-10.
Hays, J., 2008. Rubber in Malaysia. [Online] Available at:
http://factsanddetails.com/southeast-asia/Malaysia/sub5_4e/entry-
3702.html#chapter-1 [Accessed 3 March 2017].
Hexza Corporation Berhad, 2016. Subsidiaries Profile. [Online] Available at:
http://www.hexza.com.my/sub_hexzachem_sarawak.htm [Accessed 13 February
2017].

73
HORIBA, 2017. SA-9600 BET Surface Area Analyzer. [Online] Available at:
http://www.horiba.com/scientific/products/particle-characterization/surface-area-
analysis/details/sa-9600-series-938/ [Accessed 25 February 2017].
Jiang, Y.W. et al., 2013. Esterification of oleic acid with ethanol catalyzed by
sulfonated cation exchange resin: Experimental and kinetic studies. Energy
Conversion and Management, 76, pp.980-85.
Konwar, L.J., Boro, J. and Deka, D., 2014. Review on latest developments in
biodiesel production using carbon-based catalysts. Renewable and Sustainable
Energy Reviews, 29, pp.546–64.
Konwar, L.J. et al., 2014. Biodiesel production from acid oils using sulfonated
carbon catalystderived from oil-cake waste. Journal of Molecular Catalysis A:
Chemical, 388-389, pp.167–76.
Konwar, L.J. et al., 2015. Towards carbon efficient biorefining: Multifunctional
mesoporous solid acids obtained from biodiesel production wastes for biomass
comversion. Applied Catalysis B: Environmental, 176-177, pp.20-35.
Kotrba, R., 2016. Finland's Chinese-owned synthetic diesel plant. [Online] Available
at: http://biodieselmagazine.com/blog/article/2016/02/finlands-chinese-owned-
synthetic-diesel-plant [Accessed 3 February 2017].
Lal, R., 2005. World Crop Residues Production and Implications of Its Use as a
Biofuel. Environmental International, 31(4), pp.575-84.
Liu, T.T. et al., 2013. Preparation and characterization of biomass carbon-based solid
acid catalyst for the esterification of oleic acid with methanol. Bioresource
Technology, 133, pp.618–21.
Lokman, I.M., Rashid, U. and Taufiq-Yap, Y.H., 2015. Production of biodiesel from
palm fatty acid distillate using sulfonated-glucose solid acid catalyst:
Characterization and optimization. Chinese Journal of Chemical Engineering, 23(11),
pp.1857–64.
Lou, W.Y. et al., 2012. A Highly Active Bagasse-Derived Solid Acid Catalyst with
Properties Suitable for Production of Biodiesel. ChemSusChem, 5(8), pp.1-10.
Lou, W.Y., Zong, M.H. and Duan, Z.Q., 2008. Efficient production of biodiesel from
high free fatty acid-containing waste oils using various carbohydrate-derived solid
acid catalysts. Bioresource Technology, 99(18), pp.8752–58.
Malins, K. et al., 2015. Synthesis of activated carbon based heterogenous acid
catalyst for biodiesel preparation. Applied Catalysis B, 176-177, pp.553-58.
Martinot, E., 2008. Organisations Engaged in Renewable Energy. [Online] Available
at: http://www.martinot.info/organizations.htm [Accessed 3 February 2017].

74
Materials Evaluation and Engineering, Inc., 2017. FOURIER TRANSFORM
INFRARED SPECTROSCOPY (FTIR). [Online] Available at: http://www.mee-
inc.com/hamm/fourier-transform-infrared-spectroscopy-ftir/ [Accessed 25 February
2017].
Merchant Research & Consulting, Ltd, 2017. Biodiesel: 2017 World Market Outlook
and Forecast up to 2021. [Online] Available at:
https://mcgroup.co.uk/researches/biodiesel [Accessed 4 February 2017].
Mo, X.H. et al., 2008. Activation and deactivation characteristics of sulfonated
carbon catalysts. Journal of Catalysis , 254, pp.332-38.
Pagketanang, T., Artnaseaw, A., Wongwicha, P. and Thabuot, M., 2015.
Microporous Activated Carbon from KOH-Activation of Rubber Seed-Shells for
Application in Capacitor Electrode. Energy Procedia, 79, pp.651-56.
Perkin Elmer, 2015. Thermogravimetric Analysis (TGA). Waltham: Perkin Elmer,
Inc.
REN21, 2016. Renewables 2016: Global Status Report. Paris: REN21 REN21.
Ross, M.L., 2013. How the 1973 Oil Embargo Saved the Planet. Foreign Affairs, 15
October.
Rubber Board, 2002. Experimentally Proved Uses of Rubber Seed Oil. [Online]
Available at: http://rubberboard.org.in/ManageCultivation.asp?Id=229 [Accessed 3
March 2017].
Shimadzu Corporation, 2017. Gas Chromatography. [Online] Available at:
http://www.shimadzu.com/an/gc/index.html [Accessed 25 February 2017].
Shu, Q. et al., 2010. Synthesis of biodiesel from waste vegetable oil with large
amounts of free fatty acids using a carbon-based solid acid catalyst. Applied Energy,
87(8), pp.2589-96.
Shuit, S.H. and Tan, S.H., 2014. Feasibility study of various sulphonation methods
for transforming carbon nanotubes into catalysts for the esterification of palm fatty
acid distillate. Energy Conversion and Management, 88, pp.1283-89.
Shu, Q. et al., 2009. Synthesis of biodiesel from cottonseed oil and methanol using a
carbon-based solid acid catalyst. Fuel Processing Technology, 90(7-8), pp.1002–08.
Swapp, S., 2017. Scanning Electron Microscopy (SEM). [Online] Available at:
http://serc.carleton.edu/research_education/geochemsheets/techniques/SEM.html
[Accessed 25 February 2017].
Talha, N.S. and Sulaiman, S., 2016. Overview of Catalysts in Biodiesel Production.
Journal of Engineering and Applied Sciences, 11(1), pp.439-48.

75
Thermo ARL, 1999. Basics of X-Ray Diffraction. [Online] ThermoARL Available at:
https://old.vscht.cz/clab/RTG/dokumenty/thermo/xrd/Introduction%20to%20powder
%20diffraction.pdf [Accessed 20 August 2017].
TutorVista.com, 2017. Homogeneous Catalyst - Definition, Mechanism & Example.
[Online] Available at: http://chemistry.tutorvista.com/inorganic-
chemistry/homogeneous-catalyst.html [Accessed 4 February 2017].
U.S. Department of Energy, 2017. Biodiesel Blends. [Online] Available at:
http://www.afdc.energy.gov/fuels/biodiesel_blends.html [Accessed 4 February 2017].
U.S. Energy Information Administration, 2016. Use of Diesel - Energy Explained,
Your Guide to Understanding Energy. [Online] Available at:
http://www.eia.gov/Energyexplained/index.cfm?page=diesel_use [Accessed 21
January 2017].
U.S. Energy Information Administration, 2017. Biofuels: Ethanol and Biodiesel -
Energy Explained, Your Guide to Understanding Energy. [Online] Available at:
http://www.eia.gov/energyexplained/index.cfm/data/index.cfm?page=biofuel_home
[Accessed 4 February 2017].
U.S. Energy Information Administration, 2017. Short-Term Energy Outlook. [Online]
Available at: https://www.eia.gov/outlooks/steo/report/global_oil.cfm [Accessed 23
January 2017].
University of California, 2016. Electron Dispersive X-Ray Spectroscopy. [Online]
Available at: http://cfamm.ucr.edu/documents/eds-intro.pdf [Accessed 25 February
2017].
USDA Foreign Agricultural Service, 2016. Brazil: Annual Report 2016. Washington:
USDA USDA.
USDA Foreign Agricultural Service, 2016. EU-28: Annual Report 2016. Washington:
USDA USDA.
USDA Foreign Agricultural Service, 2016. Indonesia: Annual Report 2016.
Washington: USDA USDA.
USDA Foreign Agricultural Service, 2016. Malaysia: Annual Report 2016.
Washington: USDA USDA.
Williams, M., 2016. What Percent of Earth is Water? [Online] Available at:
http://www.universetoday.com/65588/what-percent-of-earth-is-water/ [Accessed 3
February 2017].
Yang, Y.X., Chiang, K. and Burke, N., 2011. Porous carbon-supported catalysts for
energy and environmental applications: A short review. Catalysis Today, 178(1),
pp.197–205.

76
Zhou, Y., Niu, S.L. and Li, J., 2016. Activity of the carbon-based heterogeneous acid
catalyst derived from bamboo in esterification of oleic acid with ethanol. Energy
Conversion and Management, 114, pp.188-96.
Zillillah, Toh, A.N. and Zhi, L., 2014. Phosphotungstic Acid-Functionalised
Magnetic Nanoparticles as an Efficient and Recyclable Catalyst for the One-Pot
Production of Biodiesel from Grease via Esterification and Transesterification.
Green Chemistry, 16(3), pp.1202-10.
Zong, M.H. et al., 2007. Preparation of a sugar catalyst and its use for highly
efficient production of biodiesel. Green Chemistry, 9(5), pp.434-37.

77
APPENDICES
APPENDIX A: Gantt Chart
No Project Activities W1 W2 W3 W4 W5 W6 W7 W8 W9 W10 W11 W12 W13 W14
M1 Gathering of materials and
glassware
M2 Biomass carbonisation
M3 AC sulphonation
M4 Catalyst characterisation
M5 Esterification of PFAD
M6 Biodiesel characterisation
M7 Report writing & Presentation

78
APPENDIX B: BET Sorptomatic Surface Analyser Results

86
APPENDIX C: X-Ray Diffraction Results


![Valorisation of Proteins from Rubber Tree...leaves of rubber tree [16, 17]. Rubber seed has been identified as a potential protein source, particularly after oil separation for biodiesel](https://static.fdocuments.net/doc/165x107/60a8f64227c3404c4c181646/valorisation-of-proteins-from-rubber-tree-leaves-of-rubber-tree-16-17-rubber.jpg)