Synthesis of Ammonium, Sodium, and Potassium Fluoroionophores · PDF fileSynthesis of...
93
Synthesis of Ammonium, Sodium, and Potassium Fluoroionophores By __________________________ Katherine F. Dennen A Thesis submitted to the Faculty of the WORCESTER POLYTECHNIC INSTITUTE In partial fulfillment of the requirements for the Degree of Master of Science In Chemistry September 6, 2002 Approved: ________________________________ Dr. W. Grant McGimpsey, Advisor ________________________________ Dr. James P. Dittami, Department Head
Transcript of Synthesis of Ammonium, Sodium, and Potassium Fluoroionophores · PDF fileSynthesis of...

Synthesis of Ammonium, Sodium, and Potassium
Fluoroionophores
By
__________________________
Katherine F. Dennen
A Thesis submitted to the Faculty of the
WORCESTER POLYTECHNIC INSTITUTE
In partial fulfillment of the requirements for the
Degree of Master of Science
In
Chemistry
September 6, 2002
Approved:
________________________________
Dr. W. Grant McGimpsey, Advisor
________________________________
Dr. James P. Dittami, Department Head

1
Abstract N-(1-methylpyrene) monoaza-15-crown-5 (P5), N-(1-methylpyrene) monoaza-18-crown-
6 (P6), N-(9-anthryl-methyl) monoaza-15-crown-5 (A5), N-(9-anthryl-methyl) monoaza-
18crown-6 (A6), were synthesized and tested as fluoroionophores for potassium and
sodium cations. Upon metal ion complexation, fluorescence yields increased
dramatically due to an internal photoinduced electron transfer quenching mechanism (an
off-on fluorescence switch).
The results for these model compounds led to the design and synthesis of 1,3 alternate
calixarene[4]arenecrown-5 (I) and bicyclic peptide (V). Calixarene I was synthesized
and found to selectively complex potassium cations as predicted.
The design of bicyclic peptide V is directed toward the selective complexation of
ammonium cations. The synthesis of V involved the preparation of an open chain hexa-
peptide consisting of two trityl-protected homoserine residues. Addition of an amino
methyl pyrene across two homoserine residues was attempted by triflating the alcohols.
The cyclization of the peptide ring is expeded to produce a basket-like structure that
molecular modeling indicates should have improved selectivity over that of nonactin, the
current industry standard.

2
Acknowledgements
I would like to thank my Advisor, Dr. W. Grant McGimpsey, for his guidance over the
past two years. Providing an enormous amount of support, patience, and concern for his
students, I am very grateful for having been a part of this work group.
For their assistance with this project, I would also like to Dr. Stephen Weininger and Dr.
James Dittami. Having an enormous amount of knowledge concerning synthetic organic
chemistry, their time and effort was greatly appreciated.
Helping me in innumerable ways, I would like to thank Dr. Hubert Nienaber, John
Benco, and Christopher Cooper. Over the past two years, they have taught me a great
deal both in and out of the lab. Their time, guidance, and patience were truly appreciated.
I would like to thank my friends and colleagues Mustafa Guler, Ernesto Soto, Cheryl
Nowak, Nantanit Wanichacheva, and Selman Yavuz. Getting to know all of them and
spending time together in and out of the lab has been a great experience.
I’d like to acknowledge and thank Bayer Corporation for their financial support.
And, I’d also like to thank Susan Wade for helping me scan in all the data found in
Appendix A.

3
Table of Contents
ABSTRACT.................................................................................................... 1 ACKNOWLEDGEMENTS............................................................................ 2 TABLE OF CONTENTS................................................................................ 3 LIST OF FIGURES ........................................................................................ 4 LIST OF TABLES.......................................................................................... 6 INTRODUCTION .......................................................................................... 9 EXPERIMENTAL........................................................................................ 19
I. GENERAL MATERIALS ................................................................................................ 19
II. GENERAL METHODS.................................................................................................. 19
III. SYNTHESIS ............................................................................................................... 22
RESULTS AND DISCUSSION................................................................... 36 I. AZA-CROWN-ETHERS.................................................................................................. 36
i. Synthesis................................................................................................................. 36
ii. Photo-electron transfer (PET).............................................................................. 38
iii. Fluorescence Data............................................................................................... 39
II. 1,3 ALTERNATE CALIXARENE[4]ARENECROWN-5...................................................... 46
i. Synthesis................................................................................................................. 46
ii. Fluorescence Data................................................................................................ 47
iii. Solvent Effects...................................................................................................... 50
III. BICYCLIC PEPTIDE V................................................................................................ 53
i. Design of Synthetic Route ...................................................................................... 53
ii. Preliminary Synthesis ........................................................................................... 56
iii. Synthesis .............................................................................................................. 60
APPENDIX A............................................................................................... 68 REFERENCES ............................................................................................. 89

4
List of Figures Figure 1: Model of photo-electron transfer (PET) Figure 2: A. Structure of cryptand [2.2.2] B. Structure of supercryptand
Figure 3: Structure of Nonactin
Figure 4: 19-crown-6 ether with decalino subunits Figure 5: Bicyclic peptide structures Figure 6: Fluorescence emission spectra (λex 333 nm) of P5 Figure 7: Fluorescence area increase of P5 Figure 8: Fluorescence emission spectra (λex 333 nm) of P6 Figure 9: Fluorescence area increase of P6 Figure 10: Fluorescence emission spectra (λex 365 nm) of A5 Figure 11: Fluorescence area increase of A5 Figure 12: Fluorescence emission spectra (λex 365 nm) of A6 Figure 13: Fluorescence area increase of A6 Figure 14: 1,3 alternate calixarene[4]arenecrown-5 Figure 15: Fluorescence emission spectra (λex 355 nm) of A6 in DCM
Figure 16: Fluorescence area increase of A6 in DCM
Figure 17: Fluorescence emission spectra (λex 355 nm) of I
Figure 18: Open chain unprotected linear peptide
Figure 18: Delta fluorescence response to K+ of I
Figure 19: Cyclizations of Fmoc-L-Ser-OH
Figure 20: Structures of triflic chloride, triflic anhydride, and tosyl chloride
Figure 21: Structure of Bzl-L-Ser-OMe

5
List of Schemes
Scheme 1: Enzymatic degradation of creatinine and urea
Scheme 2: Formation of 1-(Bromomethyl)pyrene
Scheme 3: Formation of N-(1-methylpyrene) monoaza-15-crown-5 (P5)
Scheme 4: Formation of N-(1-methylpyrene) monoaza-18-crown-6 (P6)
Scheme 5: Formation of N-(9-anthryl-methyl) monoaza-15-crown-5 (A5)
Scheme 6: Formation of N-(9-anthryl-methyl) monoaza-18-crown-6 (A5) Scheme 7: Loading of 2-Chlorotrityl Chloride resin
Scheme 8: Deprotection of Fmoc-Ala-Resin
Scheme 9: Coupling of Fmoc-D-Hse-OH
Scheme 10: Cleavage of peptide from resin
Scheme 11: Deprotection of alcohols
Scheme 12: Triflation and pyrene addition
Scheme 13: Mechanism of pyrene addition to aza crown ether
Scheme 14: Retrosynthetic analysis of bicyclic peptide V
Scheme 15: Solid phase peptide coupling using PyBOP, HOBT, and DIPEA.
Scheme 16: 2-Chlorotrityl Chloride resin cleavage using 1% TFA in DCM
Scheme 17: Deprotection of alcohol using 1% TFA and 2.5 eq. TIS.
Scheme 18: Triflation and pyrene addition mechanism
6
List of Tables Table 1: Sample Concentrations of P5, P6, A5, A6, in 1:1 DCM:MeOH, A6 in DCM,
and each absorbance at the given wavelength of excitation
Table 2: Molar concentrations of host, base, and cation used for fluorescence testing are
shown, along with the fluorescence enhancement, FE, which was calculated based on the
increase in fluorescence areas upon cation addition.

7
Summary of Compounds
O
NO
OO
O
O
O
O
O
N
N-(1-methylpyrene) monoaza-15-crown-5 N-(1-methylpyrene) monoaza-18-crown-6
(P5) (P6)
O
NO
OO
O
O
O
O
O
N
N -(9-anthrylmethyl) monoaza-18-crown-6 N-(9-anthrylmethyl) monoaza-15-crown-5
(A5) (A6)

8
1,3 alternate calixarene[4]arenecrown-5
(I)
NHNH
NH
NHNH
N
O
CH3 CH3
CH3CH3
O
O
O
O
O
N
CH3
cyclo-[L-Ala-D-Hse-L-MeAla-D-Ala-L-Hse-D-Ala]
(V)
O
O O
O
OO
N

9
Introduction
The focus of this research has been toward the synthesis of fluoroionophores for
incorporation into bulk optodes for the detection of blood analyte concentrations, such as
potassium and ammonium cations. Blood analyte concentrations are important in
medical diagnoses because they can indicate problems within the body. 1 The design and
synthesis of a fluoroionophore that changes optical properties upon complexation with
certain analytes may provide a quick and cost effective method of reliably testing blood
analyte concentrations.
Our research is directed toward the synthesis of various fluoroionophores that will
ultimately lead to the fabrication of an optical sensor. Preliminary studies included the
synthesis and fluorescence testing of four chromophore-containing aza-crown ether
compounds, N-(1-methylpyrene) monoaza-15-crown-5, N-(1-methylpyrene) monoaza-
18-crown-6, N-(9-anthryl-methyl) monoaza-15-crown-5, N-(9-anthryl-methyl) monoaza-
18-crown-6, (P5, P6, A5, A6), respectively. These studies led to the novel synthesis of
a calixarene covalently linked to an aza crown ether, 1,3 alternate
calixarene[4]arenecrown-5, (I), that is N-substituted with a fluorescent anthracene group
and is tailored for selective potassium complexation. This research has further led to the
design and synthesis of bicyclic peptide V, which modeling indicates should have better
selectivity for ammonium cations than the current industry standard, nonactin.
Biologically, the detection of ammonium cations is important because it is a
metabolite of creatinine and urea. Concentrations of creatinine and urea present in the
blood can give an indication of kidney, thyroid, and muscle function.2 Since creatinine

10
and urea can both be enzymatically degraded into ammonium cation, (Scheme 1),
bicyclic peptide V could potentially be used to test creatinine and urea concentrations.
NH2N
NH2+
O
OHN NH
NH2+
O
NH4+
NH2
O
NH2
NH4+
-H2O creatininase
urease 2
urea
creatine creatinine
Scheme 1: Enzymatic degradation of creatinine and urea
To synthesize a working fluoroionophore for the detection of cations, several
factors were considered. Fluoroionophores should be highly sensitive and selectively
complex the desired cation with a high equilibrium constant for complexation. Unwanted
complexation with other cations can alter the optical properties of the fluoroionophore
and in the process lower reliability of testing. Low sensitivity to the cation desired would
also lower the accuracy of detection.
The selectivity of complexation of specific cations over others present is based in
part on size-fit factors. The fluoroionophore must possess a sufficient cavity size to
complex specific cations. If the cavity is too small, complexation may be impossible.
Conversely, if it is too large, complexation may not occur. The electrostatics of the

11
fluoroionophore also effect the complexation. For complexation of cations to occur,
negative charge densities must be present to interact with the positively charged cation.
To optically detect cation concentrations, the molecule must be able to participate
in photo-induced electron transfer (PET). PET requires that an electron donor is able to
travel to the fluorophore and thus quench fluorescence upon excitation.3 Cation
complexation at the donor site consequently prevents electron transfer, thereby
eliminating fluorophore quenching, (as shown in Figure 1). This increase in fluorescence
is proportional to the amount of complexation and therefore the concentration of cation
present.
fluorophore*O
NO
OO
fluorophore*O
NO
OO
: :Na+
X
A B
Figure 1: A) Model of photo-electron transfer (PET) of the amine lone pair to
the excited fluorophore. B) Model of sodium cation complexation of amine lone pair to
prevent PET to the fluorophore.
Due to their ability to participate in photoinduced electron transfer (PET), various
aspects of N-substituted chromophores onto aza-crown-ether rings have been studied,
such as pH dependence,4 cation selectivity,5,6 and spacer length effect on PET.7 The
ability of a molecule to signal cation complexation optically is particularly attractive

12
because this is a highly sensitive method of detection.3 Yoshida et. al. have noted,8
chromophore containing aza-crown ether compounds maintain their absorption and
emission wavelengths and absorption intensity, while their fluorescence intensities are
significantly altered upon cation complexation.1
Because photo-induced electron transfer (PET) occur over a distance of 10 Å,6
research has been done by Hai-Feng et. al. to determine the magnitude of impact on
sensitivity due to spacer length.7 Pyrene-(CH2)n-aza-crown ether (n = 1-4) was used to
study the effect of spacer length on PET.12 Results of these studies indicate that
maximum efficiency is achieved when n<3 CH2 linkers,7 and methyl linked pyrene aza-
crown ether, n=1, was found to have higher selectivity for K+ than all other cations. n=1
methyl linked pyrenyl-aza-crown-6 showed no response to high concentrations of Na+,
unlike the anthryl substituted counterpart.9
Studies done on the effects that different chromophores have on cation
complexation have been conducted by Kubo et. al.10 Using an aza-crown-6 with various
chromophores attached, this work demonstrated that the size and electronic properties of
the aromatic pendants attached to the aza-crown nitrogen may contribute to the selectivity
of the host toward metal cations.10
Chromophore-containing aza-crown ether compounds are an attractive model, as
they complex cations that in turn effectively inhibit PET, thereby making them excellent
cation concentration sensors. However, chromophore-containing aza-crown ether
compounds do not selectively complex certain cations,9 making them of little use in
blood analyte testing. They also suffer pH dependence problems, where protonation of
the amine mimics cation complexation at low pH. In some studies,

13
benzyltrimethylammonium hydroxide, (BTMAH), is employed to insure deprotonation of
the amine.7,8 To avoid this problem benzo-crown ethers have been used. In these
systems, the alkoxy-substituted benzene ring is able to participate in PET rather than the
amine. However, in some cases, using a benzo-crown ether lowers the overall
fluorescence enhancement, FE, obtained, FE=15 vs. 47.3
To help increase crown selectivity, the use of crown ethers covalently-bound to
calix[4]arenes have been studied extensively.11,12,13,14,15,16,17,18,19,20,21,22,23,24 Reinhoudt at
al. reported selective binding of potassium ions (relative to sodium or lithium) to
calix[4]crown-5 structures, noting that the K+/Na+ selectivity was dependent on the
calix[4]crown conformation (i.e., cone, partial cone or 1,3-alternate). 9,12
Since these early reports, studies have expanded to include benzocrown and
azacrown structures and their selectivity and sensitivity for binding a wide variety of
metal cations and their practical application as sensors. Dabestani et al. reported the
synthesis and characterization of an o-benzocrown-6-calix[4]arene structure consisting of
a 9-cyanoanthracenyl chromophore covalently-linked through a methylenic bridge to the
benzo group.13,15,16 This fluoroionophore acts as an on-off fluorescence switch that is
triggered by ion complexation. In the absence of cation, the benzocrown group quenches
the cyanoanthracenyl excited singlet state by electron transfer, while in the presence of
complexed cation, the electrostatic field of the ion disrupts the electron transfer process.
This particular system exhibited high sensitivity for Cs+ ion, important in the detection of
radioactive contamination, and relatively good selectivity for Cs+ over other alkali metal
ions. Similar structures make use of azacrown rings instead of
benzocrowns,17,18,19,20,21,22,23 presumably because the lower oxidation potential of the

14
amine relative to the benzo group allows greater flexibility in the selection of the
fluorophore used in the system, i.e., the amine provides greater driving force for the
electron transfer process. Kim et al.22 have synthesized azacrown-5 calix[4]arenes where
the nitrogen of the azacrown is substituted with benzyl or picolyl groups. In the picolyl
systems, selectivity for Ag+ ions was found to be an order of magnitude higher than for
other cations measured. The presence of the pyridinyl ring apparently contributes to the
metal ion binding.
Based on the above, we have synthesized I, which combines the known optical
response of anthryl azacrown-6 to K+, with the expected enhanced selectivity provided by
coupling the azacrown to a 1,3-alternate calix[4]arene. Fluorescence testing indicates
increased selectivity for K+ over Na+ and a high sensitivity for K+ in the human
physiological range.
Considered to be the three-dimensional equivalent of crown ethers, cryptands
incorporate N as well as O atoms and show stronger complexation behavior than the
crowns.25 Spherical macrotricycles, also known as supercryptands, have four identical
faces each being composed of an 18-membered ring connected at the nitrogen sites.26

15
OO
N
O O
NO O
NO O
N N
O O
N
OO
A B
Figure 2: A) Structure of cryptand [2.2.2] B) Structure of supercryptand
The macrobicyclic ligand, cryptand [2.2.2], is known to complex with ammonium
ions, but the spherical macrotricycle, supercryptand, forms an even stronger complex.27
Macrobicyclic ligand [2.2.2] is known to selectively bind K+ while the spherical
macrotricyclic ligand selectively binds NH4+.27,28,29 The NH4
+ < K+ binding selectivity of
cryptand [2,2,2] may be related to its O/N ratio and smaller cavity size. The K+ < NH4+
preference of the supercryptand results from a larger number of N sites, a larger cavity
size and a tetrahedral arrangement of the four N sites.27,
Traditionally, nonactin, shown in Figure 3, a natural antibiotic agent, utilizes four
ethereal and four carbonyl oxygen atoms to bind NH4+. 30 Because binding of
ammonium cation to nonactin is coupled with a proton transport, the dynamic range can
be varied by the adjustment of the pH of the ammonium solution. At pH 7,
measurements can be achieved in the range from 0.1 to 10 mM ammonium ion.31

16
O
OO O
O
O O O
O
O
O
OCH3 CH3
CH3
CH3
CH3
CH3
CH3
CH3
Figure 3: Structure of Nonactin
A novel ammonium ionophore that exhibits better selectivity than the natural
antibiotic nonactin was successfully designed and synthesized based on a 19-membered
crown compound having the decalino subunits in the macrocyclic system shown in
Figure 4.32 The use of bulky decalino groups has been employed to provide structure
rigidity, and block the complexation of larger ions, while also increasing the lipophilicity
of the ionophore molecule. The structural rigidity is thought to decrease the likelihood of
complexing smaller ions such as Li+, Na+, and even K+, while the bulkiness of the groups
prevents the complexation of larger ions such as Rb+ and Cs.+ The 19-membered crown
was found to exhibit 10 times the selectivity over K+ and 3000 times the selectivity over
Na,+ thereby making it more selective than nonactin.

17
OO
O
O O
O
Figure 4: 19-crown-6 ether with decalino subunits
Several cyclic peptide systems have also been synthesized for ammonium
complexation. Kunik et. al constructed a cyclic peptide composed of L-proline and three
amino benzoic acids in an alternating sequence that was able to bind ammonium with
stability constants between 11000 and 42000 M-1 in chloroform.33 Bicyclic peptide
systems have also been synthesized. Zanotti et al. reported models of bicyclic peptides
cyclo-(Glu1-Leu2-Pro3-Gly4-Ser5-Ile6-Pro7-Ala8)-cyclo(1-5ß) Phe9-Gly10, as well as (Glu1-
X2-Pro3-Gly4-Lys5-X6-Pro7-Gly8)-cyclo(1γ-5ε) where X was Ala or Leu, respectively,34
shown in Figure 5. The most significant deviation found in the ion-binding properties of
X=Ala and X=Leu was the fact that stable Na+, K+, and Ba2+ complexes were formed
with X=Leu and not with X=Ala on the NMR time scale.35 Another eight-membered
bicyclic peptide, cyclo-(1,5-ε-succinoyl)(Lys-Gly-Gly-Gly)2, has been synthesized by
Crusi, et al. demonstrating high selectivity for Sr2+ cation.36

18
Ser
Ile Pro
Pro Leu
AlaO
Gly
Gly
Glu
Phe
GlyGlu
X Pro
Pro X
Gly
Gly
Lys
Gly-Gly-Gly
Gly-Gly-Gly
Lys Lys
OO
1 2 3
Figure 5: Bicyclic peptide structures
1) cyclo-(Glu1-Leu2-Pro3-Gly4-Ser5-Ile6-Pro7-Ala8)-cyclo(1-5ß) Phe9-Gly10
2) cyclo-(Glu1-X2-Pro3-Gly4-Lys5-X6-Pro7-Gly8)-cyclo(1γ-5ε) X = Ala or Leu
3) cyclo-(1,5-ε-succinoyl)(Lys-Gly-Gly-Gly)2
Based on these previous studies and on work from our laboratory on ammonium
ion complexation37, we have designed and undertaken the synthesis of (V), a bicyclic
peptide that is constructed of a main ring of the sequence cyclo-[L-Ala-D-Hse-L-MeAla-
D-Ala-L-Hse-D-Ala], with a pyrenyl-methyl-amine bridge across the two homoserine
alcohols. Modeling has shown that bicyclic peptide V should exhibit high selectivity for
ammonium cations.

19
Experimental
I. General Materials All reagents were used as received without further purification. 1-aza-15-crown-5
(97%), 1-aza18-crown-6 (95%), 9-chloroanthracene (96%), 1-pyrenemethanol (98%),
phosphorus tribromide, benzyltrimethylammoniumhydroxide, potassium acetate, sodium
acetate, triethylamine, piperidine, acetonitrile (anhydrous), trifluoromethanesulfonic
anhydride, trifluoromethanesulfonic chloride, 1-pyrenemethylamine hydrochloride,
ethanol, methanol, and ethyl acetate were all purchased from Aldrich Chemicals. 2-
Chlorotrityl Chloride resin (1.0mmol/g loading) 200-400 mesh, 1%DVB, Fmoc-Ala-OH,
Fmoc-D-Hse(Trt)-OH, Fmoc-MeAla-OH, Fmoc-D-Ala-OH, 1-hydroxybenzotriazole
hydrate (HOBT), and PyBop were purchased from Nova Biochem. Fmoc-Hse(trt)-OH,
tBoc-Ala-OH, and trifluoro-acetic acid were purchased from Advanced Chemtech. The
Diisopropylethylamine was purchased from Avocado Research Chemicals Ltd;
triisopropylsilane 99% from Acros; dimethylformamide from J.T. Baker;
dichloromethane and hexane from VWR. Anhydrous magnesium sulfate was purchased
from Mallinchrodt.
II. General Methods
i. NMR Proton nuclear magnetic resonance (1H NMR) spectra were obtained on a Bruker
AVANCE 400 (400 MHz) NMR spectrometer. Chemical shifts are reported in ppm (δ).

20
Carbon nuclear magnetic resonance (13C NMR) spectra were recorded at 100 MHz on the
same instrument mentioned above.
ii. UV-Visible Spectroscopy Ground state absorption spectra were measured in a quartz cuvette (1cm x 1cm) with a
Shimadzu UV 2100 Spectrophotometer. Samples were measured in single beam mode
and compared with a blank obtained with pure solvent. Extinction coefficients were
calculated via Beer’s law.
iii. Infrared Spectroscopy Infrared spectra were obtained on a Perkin-Elmer Spectrum One FT-IR spectrometer
supported in KBr (Aldrich, Standard IR Grade). Samples were prepared with an IR press
of 13mm diameter (Z11,241-0) under 10 tons of pressure using a vacuum pump for 10
minutes.
iv. Fluorescence Spectroscopy Fluorescence spectra were obtained at room temperature in a quartz cuvette
(1 cm x 1 cm) in air saturated solvent using a Perkin-Elmer LS-50B Spectrofluorimeter.
v. Mass Spectrometry Mass Spectra were performed by SYNPEP Corporation, Dublin, CA. The carrier solvent
used was a mixture of H2O and acetonitrile (1:1). The sample was ionized by

21
electrospray and injected using compressed air. The mass spectrometer used ultra-grade5
nitrogen as a curtain gas.
vi. Thin Layer Chromatography (TLC) Analytical TLC was performed using pre-coated silica gel plates (Whatman 200 µm
KCF18 silica gel 60A reverse phase plates or Whatman 250 µm thickness KF6F silica gel
60A normal phase plates), which were illuminated by a UV lamp at 254 nm and 356 nm.
vii. Flash Chromatography Flash chromatography was performed on a Biotage Flash 12i using KP-Sil 32-63 µm
60A silica gel under N2 pressure.
viii. Preparative Thin Layer Chromatography Preparative TLC was performed using precoated silica gel plates (1000 µm Whatman
K6F silica gel 60A).
ix. Melting Point Apparatus All melting points were obtained using a Fisher-Johns Melting point apparatus and are
uncorrected.
x. Computational studies
Molecular structures were minimized using a SGI 320 running Windows NT. All calculations
were performed using the Molecular Operating Environment (MOE), version 2000.02 computing
22
package (Chemical Computing Group Inc., Montreal, Quebec, Canada.). Dynamics calculations
on structures were heated to 400 K, equilibrated at 310 K and cooled to 290 K at a rate of 10
K/ps. The lowest energy structures obtained from these calculations were re-minimized.
Electrostatic calculations were performed on these structures using default parameters.
III. Synthesis
Synthetic details are provided below. All data cited can be found in Appendix A.
OH Br0.3 eq. PBr3
benzene
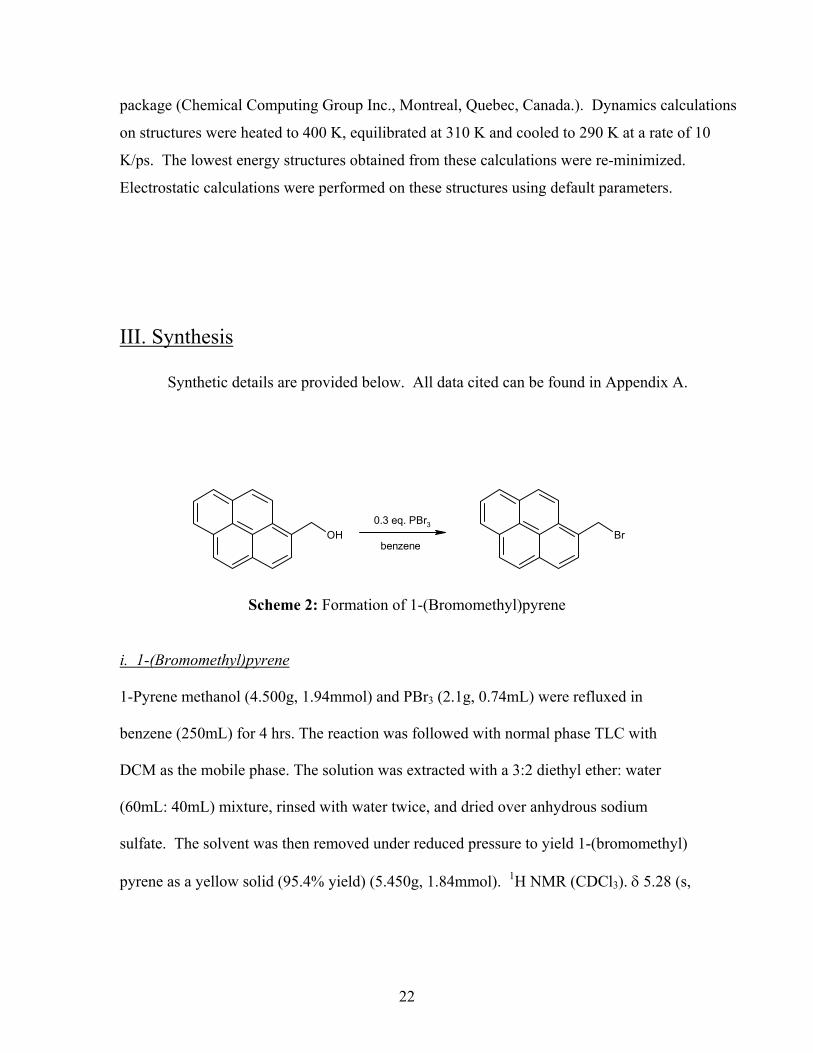
Scheme 2: Formation of 1-(Bromomethyl)pyrene
i. 1-(Bromomethyl)pyrene 1-Pyrene methanol (4.500g, 1.94mmol) and PBr3 (2.1g, 0.74mL) were refluxed in
benzene (250mL) for 4 hrs. The reaction was followed with normal phase TLC with
DCM as the mobile phase. The solution was extracted with a 3:2 diethyl ether: water
(60mL: 40mL) mixture, rinsed with water twice, and dried over anhydrous sodium
sulfate. The solvent was then removed under reduced pressure to yield 1-(bromomethyl)
pyrene as a yellow solid (95.4% yield) (5.450g, 1.84mmol). 1H NMR (CDCl3). δ 5.28 (s,

23
2H), 8.0-8.3 (m, 9H) 13C NMR (CDCl3). δ 32.205 (CH2), 122.818-131.963 (pyrene).
[Scheme 2]
O
NHO
OO
Br
O
NO
OO
+3.0 eq. Et3N
1,4 dioxane
Scheme 3: Formation of N-(1-methylpyrene) monoaza-15-crown-5 (P5)
ii. N-(1-methylpyrene) monoaza-15-crown-5 (P5) 1-aza-18-crown-6 (0.464g, 2.1mmol), 1- (bromomethyl) pyrene (0.520g, 1.76mmol), and
triethylamine (0.526g, 0.74mL) were refluxed in 1,4-dioxane (200mL) for 48 hrs. The
solvent was evaporated, and the product extracted with DCM:H2O (2:3). The organic
phase was rinsed three times with water and then dried over anhydrous magnesium
sulfate. The crude product was purified using prep-TLC plates in the absence of ambient
light. (DCM:EtOH 17:1 as eluent), to yield N-(1-methylpyrene) monoaza-15-crown-5
(0.412 g, 0.95mmol) as an oil (45.25% yield overall). Rf 0.13 DCM: EtoAc (17:1). 1H
NMR (CDCl3). δ 8.1-7.9 (m, 9H), 4.3 (s, 2H), 3.7-3.5 (m, 20H), 2.9 (t, 4H). 13C NMR
(CDCl3). δ 54.9 (CH2), 59.5 (CH2), 71.4-70.4 (CH2 crown), 133.6-123.8 (pyrene). MS
m/z (M+) calcd. 434.54 found 434.2. [Scheme 3]

24
O
O
O
O
O
N
O
O
O
O
O
NHBr
+3.0 eq. Et3N
1,4 dioxane
Scheme 4: Formation of N-(1-methylpyrene) monoaza-18-crown-6 (P6)
iii. N-(1-methylpyrene) monoaza-18-crown-5 (P5) 1-aza-18-crown-6 (0.553g, 2.10mmol), 1- (Bromomethyl) Pyrene (0.520g, 1.76mmol),
and triethylamine (0.526g, 0.74mL) were refluxed in 1,4-dioxane (200mL) for 24 hrs.
The solvent was evaporated, and the product extracted with DCM:H2O (2:3). The organic
phase was rinsed three times with water and then dried over anhydrous magnesium
sulfate. Further purification was done using preparative TLC in the absence of ambient
light. (DCM:EtOH 17:1 as eluent), to yield N-(1-methylpyrene) monoaza-18-crown-6.
(0.0601g, 0.138mmol) as an oil (6.8% yield overall). Rf 0.03 DCM: EtoAc (17:1). 1H
NMR (CDCl3). δ 8.5-7.9 (m, 9H), 4.3 (s, 2H), 3.6-3.4 (m, 20H), 2.9 (t, 4H). 13C NMR
(CDCl3). δ 54.9 (CH2), 58.77 (CH2), 71.1-70.2 (CH2 crown), 133.6-123.8 (pyrene). MS
m/z (M+) calcd. with Na+ 500.59 found 500.2. [Scheme 4]

25
O
NHO
OO
ClO
NO
OO
+3.0 eq. Et3N
1,4 dioxane
Scheme 5: Formation of N-(9-anthryl-methyl) monoaza-15-crown-5 (A5)
iv. N-(9-anthryl-methyl) monoaza-15-crown-5 (A5) 1-aza-15-crown-5 (0.464g, 2.10mmol), 9-chloromethylanthracene (0.400g, 1.76mmol),
and triethylamine (0.526g, 0.74mL) were refluxed in 1,4-dioxane (200mL) for 48 hrs.
The solvent was evaporated, and the product extracted with DCM:H2O (2:3). The organic
phase was rinsed three times with water and then dried over anhydrous magnesium
sulfate. Further purification was done using preparative TLC in the absence of ambient
light. (DCM:EtOH 17:1 as eluent), to yield N-(9-Anthryl-methyl) monoaza-15-crown-5
(0.440g, 1.07mmol) as yellow oil (60.8% yield overall). Rf 0.03 DCM: EtoAc (17:1). 1H
NMR (CDCl3). δ 9.0-7.5 (m, 9H), 4.6 (s, 2H), 3.7-3.5 (m, 20H), 2.9 (t, 4H). 13C NMR
(CDCl3). δ 52.9 (CH2), 54.5 (CH2), 71.4-70.4 (CH2 crown), 131.8-125.2 (anthryl).
[Scheme 5]

26
O
O
O
O
O
N
O
O
O
O
O
NH Cl
+3.0 eq. Et3N
1,4 dioxane
Scheme 6: Formation of N-(9-anthryl-methyl) monoaza-18-crown-6 (A6)
v. N-(9-anthryl-methyl) monoaza-18-crown-6 (A6) 1-aza-18-crown-6 (0.515g, 1.95mmol), 9-chloromethylanthracene (0.400g, 1.76mmol),
and triethylamine (0.526g, 0.74mL) were refluxed in 1,4-dioxane (200mL) for 24 hrs.
The solvent was evaporated, and the product extracted with DCM:H2O (2:3). The organic
phase was rinsed three times with water and dried over anhydrous magnesium sulfate.
Further purification was done using preparative TLC in the absence of ambient light.
(DCM:EtOH 17:1 as eluent), to yield N-(9-anthryl-methyl) monoaza-18-crown-6
(0.176g, 0.388mmol). The product was then recrystalized with dichloromethane and ether
to yield a yellow solid (22% yield overall). mp.80º-82ºC, Rf 0.05 DCM: EtoAc (17:1).
1H NMR (CDCl3). δ 8.6-7.4 (m, 9H), 4.6 (s, 2H), 3.7-3.5 (m, 20H), 2.9 (t, 4H). 13C NMR
(CDCl3). δ 52.4 (CH2), 54.3 (CH2), 71.3-70.6 (CH2 crown), 131.8-124.8 (anthryl). MS
m/z (M+) calcd. 454.54 found 454.2. [Scheme 6]

27
vi. Synthesis of 1,3 alternate calixarene[4]arenecrown-5 (I) The synthesis of 1,3 alternate calixarene[4]arenecrown-5 was done by Dr. Hubert
Nienaber and the experimental detail can be found in reference 13.38
vii. Synthesis of bicyclic peptide (V) The synthetic pathway used toward the construction of bicyclic peptide V is
shown below. An Fmoc solid phase synthesis using a 2-Chlorotrityl Chloride resin was
employed along with an N-terminus tBoc protecting group and trityl protected
homoserine residues. Upon cleavage, the trityl groups, located on the homoserine side
chains, were removed and cyclization of the side chains attempted.
Cl
Cl OH
O
NH
O
O
R +
1.2 eq. L-Ala / 4 eq. DIPEA
Fmoc-L-Ala
DCM 2hr
Scheme 7: Loading of 2-Chlorotrityl chloride resin
vi. Loading Resin 2-Chlorotrityl Chloride resin (1.0mmol/g, 4.600g) was swelled in a peptide synthesizer
(100mL) for 3 minutes by bubbling N2 through dry DCM. 1.2 eq. of Fmoc-Ala-OH
(1.718g, 5.52mmol) and 4.0 eq. of DIPEA (3.21mL, 18.40mmol) were dissolved in dry
28
DCM (60mL) and added to the resin. After 2 hours, the mixture was drained and rinsed
2x with 25mL of DCM:MeOH:DIPEA (17:2:1), 3x DCM, 3x DMF, 2x DCM. [Scheme
7]
O
NH
Cl
O
O
NH2
Cl
O
20 % piperidineDMF 20 min.
R RFmoc
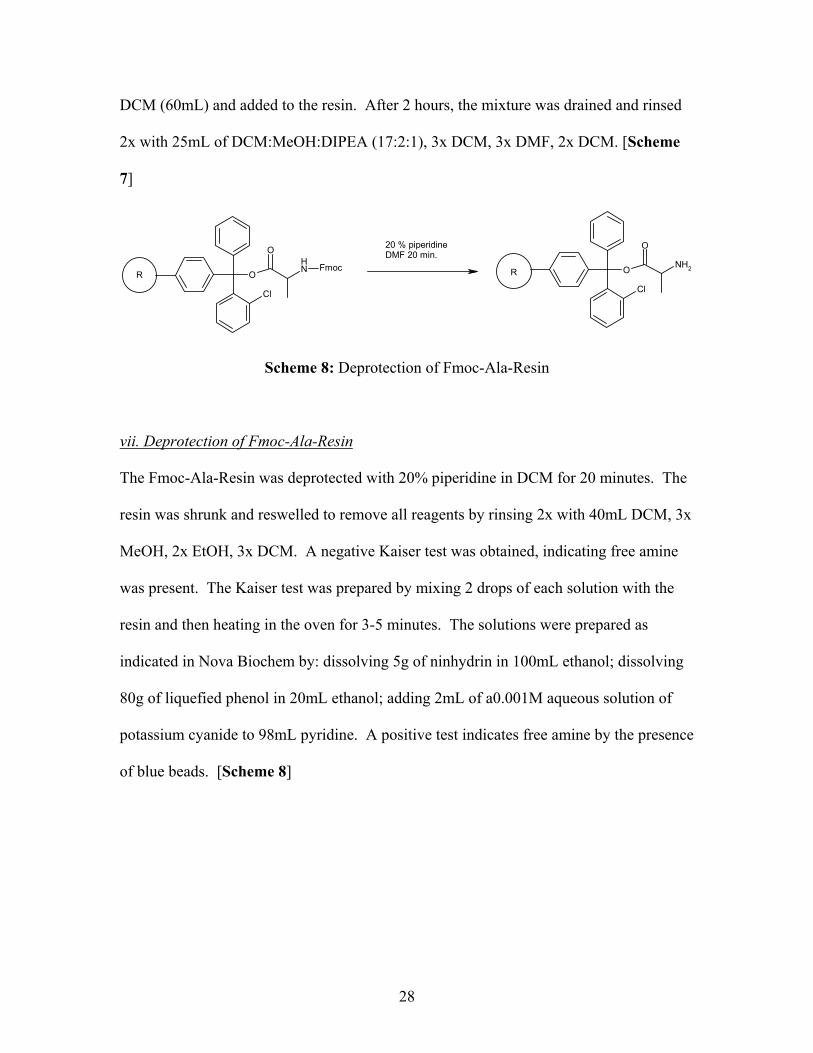
Scheme 8: Deprotection of Fmoc-Ala-Resin
vii. Deprotection of Fmoc-Ala-Resin The Fmoc-Ala-Resin was deprotected with 20% piperidine in DCM for 20 minutes. The
resin was shrunk and reswelled to remove all reagents by rinsing 2x with 40mL DCM, 3x
MeOH, 2x EtOH, 3x DCM. A negative Kaiser test was obtained, indicating free amine
was present. The Kaiser test was prepared by mixing 2 drops of each solution with the
resin and then heating in the oven for 3-5 minutes. The solutions were prepared as
indicated in Nova Biochem by: dissolving 5g of ninhydrin in 100mL ethanol; dissolving
80g of liquefied phenol in 20mL ethanol; adding 2mL of a0.001M aqueous solution of
potassium cyanide to 98mL pyridine. A positive test indicates free amine by the presence
of blue beads. [Scheme 8]

29
O
NH2
Cl
O
O
OHNH
Otrt
1.25 eq. fmoc-D-Hse / 1.35 eq. PyBOP / 1.25 eq.HOBT / 3.0 eq. DIPEA+
DMF/DCM 18 hr
Fmoc-D-Hse(trt)
RFmoc
Scheme 9: Coupling of Fmoc-D-Hse-OH
viii. Coupling Fmoc-D-Hse-OH
1.25 eq. of Fmoc-D-Hse-OH (3.356g, 5.75mmol), 1.25 eq. HOBT (0.777g, 5.75mmol),
1.35 eq. PyBop (3.231g, 6.21mmol), and 2.5 eq. DIPEA (2.00mL, 11.50mmol) were
dissolved in 40mL of DMF and added to the resin-Ala-NH2. DCM (40mL) was then
added to the peptide synthesizer to facilitate solvation and the reaction was carried out
over night. The mixture was then drained and rinsed 2x with 40mL DCM, 3x MeOH, 2x
EtOH, and 3x DCM. A positive Kaiser test was obtained, indicating the absence of
amine. [Scheme 9]
ix. Coupling Fmoc-MeAla-OH The Fmoc-D-Hse-Ala-resin was deprotected via the procedure above. 1.5 eq. of Fmoc-
MeAla-OH (2.245g, 6.90mmol), 1.5 eq. HOBT (0.932g, 6.90mmol), 1.6 eq. PyBop
(3.829g, 7.36mmol), and 2.5 eq. DIPEA (2.40mL, 13.80mmol) were dissolved in 40mL
of DMF and added to the resin-Ala-D-Hse-NH2. DCM (40mL) was then added to the
peptide synthesizer to facilitate solvation and the reaction continued for 5 hours. A
seemingly positive Kaiser test was obtained 2x, so the mixture was then drained and

30
rinsed 2x with 40mL DCM, 3x MeOH, 2x EtOH, and 3x DCM and the coupling repeated
with 0.3 eq of Fmoc-MeAla-OH (0.440g, 1.35mmol), 0.3 eq. HOBT (0.182g, 1.35mmol),
1.6 eq. PyBop (0.702g, 1.51mmol), and 0.6 eq. DIPEA (0.47mL, 2.70mmol) were
dissolved in 40mL DCM and DMF for 4 hours. A positive Kaiser test was obtained.
x. Coupling Fmoc-D-Ala-OH The Fmoc-MeAla-D-Hse-Ala-resin was deprotected via the procedure above. 1.5 eq. of
Fmoc-Ala-OH (2.148g, 6.90mmol), 1.5 eq. HOBT (0.932g, 6.90mmol), 1.6 eq. PyBop
(3.829g, 7.36mmol), and 2.5 eq. DIPEA (2.40mL, 13.80mmol) were dissolved in 40mL
of DMF and added to the resin-Ala-D-Hse-MeAla-NH2. DCM (40mL) was then added to
the peptide synthesizer to facilitate solvation and the reaction carried out for 6 hours. The
mixture was then drained and rinsed 2x with 40mL DCM, 2x MeOH, 1x EtOH, 2x DCM.
No reliable secondary amine test was found, so the coupling was repeated with 0.8 eq. of
Fmoc-Ala-OH (1.145g, 3.68mmol), 0.8 eq. HOBT (0.497g, 3.68mmol), 0.9 eq. PyBop
(2.154g , 4.12mmol), and 1.6 eq. DIPEA (1.28mL, 7.36mmol) to insure complete
coupling. The mixture was then drained and rinsed 2x with 40mL DCM, 3x MeOH, 2x
EtOH, 3x DCM.
xi. Coupling Fmoc-Hse-OH The Fmoc-D-Ala-MeAla-D-Hse-Ala-resin was deprotected via the procedure above. 1.25
eq. of Fmoc-Hse-OH (3.356g, 5.75mmol), 1.25 eq. HOBT (0.777g, 5.75mmol), 1.35 eq.
PyBop (3.231g, 6.21mmol), and 2.5 eq. DIPEA (2.00mL, 11.50mmol) were dissolved in
40mL of DMF and added to the resin-Ala-D-Hse-MeAla-D-Ala-NH2. DCM (40mL) was

31
then added to the peptide synthesizer to facilitate solvation and the reaction was
continued for 4 hours. The mixture was then drained and rinsed 2x with 40mL DCM, 3x
MeOH, 2x EtOH, and 3x DCM. A positive Kaiser test was obtained, indicating the
absence of amine.
xii. Coupling tBoc-Ala-OH The Fmoc-Hse-D-Ala-MeAla-D-Hse-Ala-resin was deprotected via the procedure above.
1.50eq. tBoc-Ala-OH (1.305g, 6.90mmol), 1.5 eq. HOBT (0.932g, 6.90mmol), 1.6 eq.
PyBop (3.829g, 7.36mmol), and 2.5 eq. DIPEA (2.40mL, 13.80mmol) were dissolved in
40mL of DMF and added to the resin-Ala-D-Hse-MeAla-NH2. DCM (40mL) was then
added to the peptide synthesizer to facilitate solvation and the reaction carried out for 3
1/2 hours. The mixture was then drained and rinsed 2x with 40mL DCM, 3x MeOH, 2x
EtOH, and 2x MeOH. A positive Kaiser test was obtained, indicating the absence of
amine.
OHNH
NH
NNH
NH
NH
O
CH3 O
O O
O
O
CH3
CH3
CH3
O
CH3
O
O
O
CH3
CH3
CH3
trt
trt
Cl
O Peptide
Ala-D-Hse-MeAla-D-Ala-Hse-D-Ala-tBoc
1% TFAR
Scheme 10: Cleavage of peptide from resin
xiii. Peptide Cleavage The shrunken resin was dried using N2 and cleaved in fractions with 1%TFA in DCM
(250mL total) in the peptide synthesizer. The cleavage solution (~42mL) was bubbled

32
with N2 for 5 minutes, drained into 10% pyridine in methanol (4.3mL), and collected
separately in six 50mL Erlenmeyer flasks. Equivalent molar amounts of TFA and
pyridine were used to minimize the amount of excess acid and base. The peptide was
then bubbled and rinsed with DCM and MeOH and collected separately. Fractions 1-8
were spotted on a normal phase TLC plate using EtoAc:MeOH (3:1) as an eluent.
Fractions 1 and 2 were placed in a 250mL round bottom flask and evaporated to ~5%.
Distilled water was added, and the solution was adjusted to a pH of ~7 using pyridine to
precipitate the peptide as a white solid (2.100g, 1.90mmol). Fractions 3-8 were
combined in a 500mL round bottom flask and evaporated to ~5%. Distilled H2O was
added and the solution determined to have a pH of ~1; pyridine was added to adjust the
pH to ~7 to precipitate the peptide (0.400g, 0.36mmol). mp.72º-74ºC, Rf 0.43
DCM:MeOH (10:1) (with 2 drops base-piperidine). 1H NMR (CDCl3). δ 9.5-9.4 (m,
COOH), 8.6 (s, 6NH), 7.9-7.2 (m, 30H trityl), 4.0-4.6 (m, 6CH), 3.1-2.9 (m, 1CH3N),
2.3-1.8 (t, 2CH2OH), 1.4-1.2 (t, 7CH3+2CH2). 13C NMR (CDCl3). δ 13.6 (CH3), 28.2
(tboc-CH3), 48.3 (NCH3), 53.4 (CH2), 59.3 (CH2), 86.9-86.4 (CH), 128.6-126.7 (CH
trityl), 147.0-143.8 (3C), 155.7 (CONH), 171.5 (COOH) 175.0-173.3 (CO). 135C NMR
(CDCl3). δ 14.6 (CH3), 29.3 (tboc-CH3), 53.0 (NCH3), 54.5 (CH2), 60.0 (CH2), 129.7-
128.0 (CH trityl), 130.9 (CONH), 146.4-141.6 (COOH). MS m/z (M+) with Na+ calcd.
1126.29 found 1126.462. [Scheme 10]

33
OHNH
NH
NNH
NH
NH
O
CH3 O
O O
O
OH
CH3
CH3
CH3
OH
CH3
O
O
O
CH3
CH3
CH3
1% TFA / 1-5% TIS
DCM
Scheme 11: Deprotection of alcohols
xiv. Deprotection of Alcohols The protected linear peptide (2.020g, 1.83mmol) was dissolved in 50mL of
DCM:TIS:TFA (48:1.5:0.5) for 10 minutes forming a light yellow solution. All solvents
were evaporated to yield a slightly crystalline light yellow oil. The trityl groups were
precipitated using MeOH. The final amount of trityl groups removed by column
chromatography using Hexane:EtoAc (1:1) as eluent and the peptide rinsed through using
MeOH to obtain a white solid (1.121g, 1.82mmol) in a 99.4% yield. mp.54º-56ºC, Rf
0.14 EtoAc:DCM:MeOH (2:1:1). 1H NMR (MeOD). δ 7.4-7.3 (m, 6NH), 3.08-3.07 (s,
2CH2OH), 2.9-2.8 (m, 1CH3N), 2.5-2.9 (t, 2CH2), 1.3-1.0 (t, 7CH3). 13C NMR
(MEOD). δ 14.6 (CH3), 28.2 (tboc-CH3), 52.4 (CH2), 35.7 (CH2), 81.1 (CH), 158.3
(CONH), 163.3 (COOH) 176.9-172.7 (CO). 135C NMR (MeOD). δ 14.6 (CH3), 29.2
(tboc-CH3), 53.1 (NCH3), 35.5 (CH2), 58.0 (CH2), 130.9 (CONH). MS m/z (M+) with
Na+ calcd. 641.66 found 641.32. [Scheme 11]

34
OHNH
NH
NNH
NH
NH
O
CH3 O
O O
O
O
CH3
CH3
CH3
O
CH3
O
O
O
CH3
CH3
CH3
S
O
O
F
F
F
SF
F
F
O
O
2.2 eq F3CSO2Cl / Et3N
DCM
NHNH
NH
NHNH
N
O
CH3 CH3
CH3CH3
O
O
O
O
O
N
CH3
NHNH
NH
NHNH
N
O
CH3 CH3
CH3CH3
O O
O
O
O
N
CH3OH
O
O
CH3CH3
CH3
Scheme 12: Triflation and pyrene addition
xv. Triflation and pyrene addition
Linear peptide (0.238g, 0.38mmol) and Et3N (0.18mL, 1.29mmol) were dissolved in
150mL of acetonitrile and cooled to 0º C. Triflic chloride (.10mL, 0.915mmol) was
added dropwise while stirring and then allowed to warm to room temperature for 1 hour.
The orange solution was evaporated to yield a yellow oil.
1-Pyrenemethylamine hydrochloride was washed with DCM and 2N NaOH to
extract 1-pyrenemethylamine into the organic layer. The organic layer was then dried,
and 1-pyrenemethylamine (0.088g, 0.34mmol) was dissolved in acetonitrile with Et3N

35
(0.21mL, 1.52mmol). This mixture was then added dropwise to the triflated peptide to a
volume of 350mL. A low concentration was used (0.95mg/mL) to ensure that the
reaction would be intermolecular rather than intramolecular. The solution turned from
cloudy orange to clear light orange overnight. 1H NMR (MeOD). δ 8.2-7.9 (m, 9H
pyrene), 7.3 (s, 6NH), 3.8-4.4 (m, 6CH), 3.7 (m, CH2pyrene), 2.9 (m, 1CH3N), 2.5 (t,
2CH2N), 2.0 (t, 2CH2), 1.3-1.1 (t, 21CH3). [Scheme 12]

36
Results and Discussion
Details of the synthesis and fluorescence testing of the four aza crown ethers, 1,3
alternate calixarene[4]arenecrown-5, and bicyclic peptide V are discussed below.
I. Aza-crown-ethers
i. Synthesis
Chromophore containing aza-crown ether compounds were studied as models for
both 1,3 alternate calixarene[4]arenecrown-5 and bicyclic peptide V. All four
chromophore containing aza-crown ether compounds were synthesized by the same
synthetic pathway. Following a literature procedure,39 1.0 equivalent of the
chromophore, 1.2 equivalents of the aza-crown ether, and 2.5 equivalents of
triethylamine were dissolved in 1,4 dioxane. The reaction proceeds via an SN2
mechanism, (see Scheme 13 below). After 48 hours, the solvent was evaporated and the
product extracted into DCM and washed with water. The organic layer was dried over
MgSO4, rather than NaSO4, to prevent any possible contamination or complexation
between the sodium cations and the aza-crown ether moiety.

37
Br
OO
O
OO
N H
Br
OO
O
OO
N H
n
δ+
δ-
+
Scheme 13: Mechanism of pyrene addition to aza crown ether
Further purification was achieved using preparative thin layer chromatography
plates with DCM:EtOH (17:1) as eluent. All plates were run in the dark and the silica
removed before the solvent was fully allowed to dry. Initial chromatography done under
ambient light conditions caused an apparent decomposition of the product. A literature
search concluded that pyrene is known to photo-oxidize on unactivated and activated
silica.40,41,42 Mechanistic studies done by Reyes et. al. concluded that the pyrene cation
radical forms by an electron transfer from the pyrene excited state to oxygen or by photo-
ionization of pyrene and is the precursor to the photoproduct formation. The pyrene
cation radical then reacts with physisorbed water on silica to give 1,8-pyrenedione, 1-
hydroxypyrene, 1,6-pyrenedione, along with minor products.41
Higher product yields were obtained when using 1-aza-15-crown-5 (P5 42.5%,
A5 60.8%). The reason for this result is unclear at this time, but may be due to the fact
that the amine 1-aza-15-crown-5 may be more rigid and less sterically hindered than the
1-aza-18-crown-6 (P6 6.8%, A6 22.0%), enabling it to be more reactive. Adding the
anthracene moiety to the aza-crown ethers also proceeded in overall higher yields than

38
the addition of the 9-methylpyrene and is likely due to the higher reactivity of the 9-
chloromethylanthracene moiety.
Characterization of each chromophore-containing aza-crown ether was done
primarily with NMR and Mass Spectroscopy. All spectral data can be found in Appendix
A.
ii. Photo-electron transfer (PET)
Chromophore-containing aza-crown ethers are able to participate in photoinduced
electron transfer (PET), where, upon excitation an electron of the lone pair on the
nitrogen is able to travel to the chromophore, quenching the fluorescence.7 Upon
complexation with a cation, the electrostatic field of the amine is disrupted, thereby
preventing PET and causing an increase in fluorescence intensity proportional to the
concentration of cations.
The thermodynamics of PET are described by the simplified Rehm-Weller
equation (1). ∆GPET is calculated to determine the spontaneity of the PET process for
chemosensors with a fluorophore-spacer-receptor system.
∆GPET = Eox – Ered – e2/εr – Eoo (1)
Here, ∆GPET is the free energy for the PET process, Eox is the oxidation potential of the
amine, Ered is the reduction potential of the chromophore, and ε the dielectric constant of
the solvent. The oxidation potential of the aza-crown ether moiety is reported to be
+0.84 V vs. Ag/AgCl.1 Values for the reduction potential of the anthracene and pyrene

39
were converted from SCE to Ag/AgCl and found to be -1.93 eV and –2.10 eV,
respectively.43 A value of e2/εr was approximated to be -0.1 eV1 and the singlet-singlet
energy was calculated to be 3.28ev for anthracene and 3.34 eV for pyrene. 43 Using the
Rehm-Weller equation, ∆GPET of the anthryl-aza-crown-ethers was calculated to be –
0.41 eV and the ∆GPET of the pyrenyl-aza-crown-ethers –0.30 eV. The negative values
for PET in these systems indicate that electron transfer quenching is a spontaneous
process. The thermodynamic requirement for spontaneity is crucial in the design of
cation-sensing systems and is always the first consideration.
iii. Fluorescence Data
Fluorescence spectra were obtained in air saturated 1:1 DCM: MeOH at
concentrations between 2.0x10⁻⁴ M and 2.2 x10⁻⁴ M by preparing a stock solution of
0.010g, in 100mL of a 1:1 solution. A6 was also tested in DCM, providing a comparison
with 1,3 alternate calixarene[4]arenecrown-5 and determination of solvent effects. The
stock solution was then used (0.5mL) to prepare (10mL) a 1.0x10⁻⁵ M – 1.2 x10⁻⁵ M
solution. All fluorescence emission spectra were obtained with the slit widths set at 5.0
nm for the excitation monochromator and 2.5 nm for the emission monochromator on a
Perkin-Elmer LS-50B. The samples were prepared as follows with each UV absorbance
at the excitation wavelength noted.
Sodium acetate salt (0.01M stock solution) in 1:1 DCM MeOH was used as the
sodium cation in experiments with both aza-crown-5 compounds. Potassium acetate salt
(0.005M stock solution) in 1:1 DCM: MeOH was used as the potassium cation in
experiments with both aza-crown-6 compounds. Benzyltrimethylammonium hydroxide

40
(0.0055M stock solution) in 1:1 DCM: MeOH was used as a proton scavenger in each of
the samples. Data is shown in Table 1.
Sample Concentration Excitation Abs. [M] nm
N-(1-methylpyrene) monoaza-15-crown-5 (P5) 1.15 x10⁻⁵ 333 0.153 N-(1-methylpyrene) monoaza-18-crown-6 (P6) 1.00 x10⁻⁵ 333 0.165 N-(9-anthryl-methyl) monoaza-15-crown-5 (A5) 1.22 x10⁻⁵ 355 0.048 N -(9-anthryl-methyl) monoaza-18-crown-6 (A6) 1.10 x10⁻⁵ 355 0.040
Table 1: Sample Concentrations of P5, P6, A5, A6, in 1:1 DCM:MeOH, A6 in DCM,
and each absorbance at the given wavelength of excitation
Fluorescence spectra obtained upon the addition of each cation concentration are
shown below along with a plot of the fluorescence area compared to cation concentration.
[Figures 6-13] From these plots it can be seen that the complexation of cation is linearly
proportional to the fluorescence area obtained. Once all possible complexation has taken
place, the plot begins to plateau and the fluorescence area and intensity reach a maximum
regardless of the amount of cation added. For A6 and P6, this plateau is observed at a
marginally higher concentration of cation than the host molecule, likely due to the value
of the complexation constant. A significantly higher concentration of cation is needed for
A5 and P5 in order to reach a plateau on the complexation plot. This may be due to a
lower complexation constant of the host and Na+. All four compounds form a 1:1 host-
guest complexation based on the data obtained.9
41
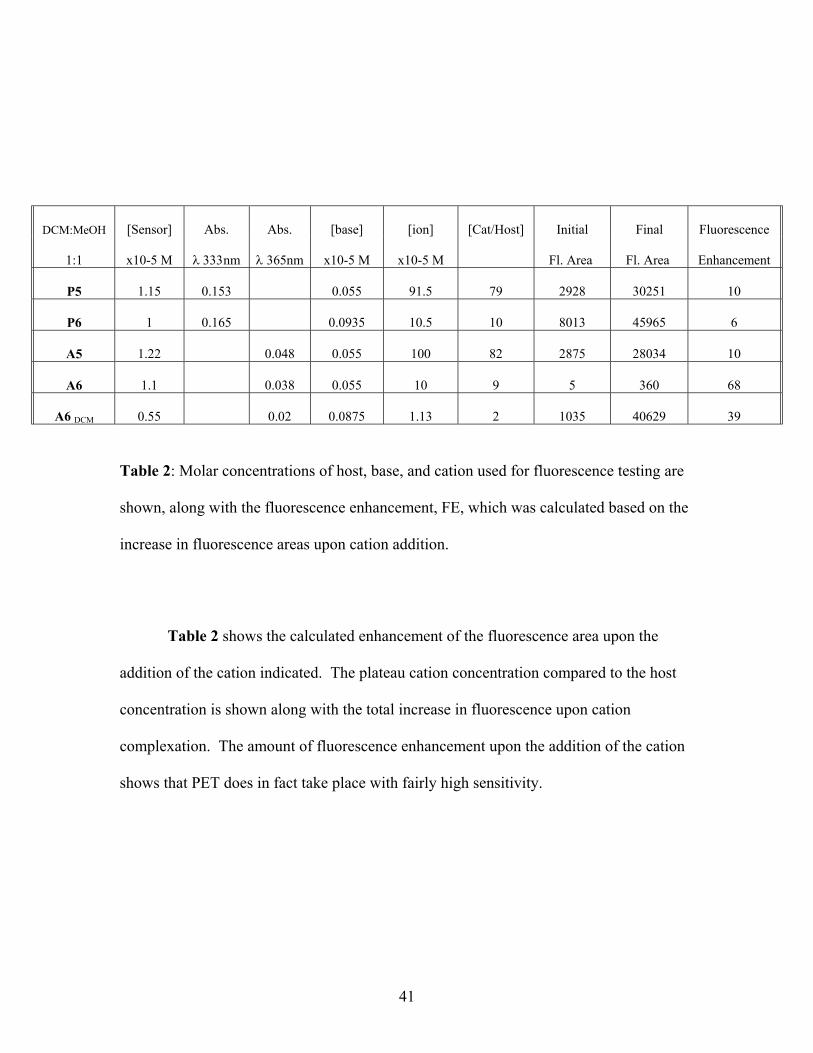
DCM:MeOH [Sensor] Abs. Abs. [base] [ion] [Cat/Host] Initial Final Fluorescence
1:1 x10⁻⁵ M λ 333nm λ 365nm x10-5 M x10-5 M Fl. Area Fl. Area Enhancement
P5 1.15 0.153 0.055 91.5 79 2928 30251 10
P6 1 0.165 0.0935 10.5 10 8013 45965 6
A5 1.22 0.048 0.055 100 82 2875 28034 10
A6 1.1 0.038 0.055 10 9 5 360 68
A6 DCM 0.55 0.02 0.0875 1.13 2 1035 40629 39
Table 2: Molar concentrations of host, base, and cation used for fluorescence testing are
shown, along with the fluorescence enhancement, FE, which was calculated based on the
increase in fluorescence areas upon cation addition.
Table 2 shows the calculated enhancement of the fluorescence area upon the
addition of the cation indicated. The plateau cation concentration compared to the host
concentration is shown along with the total increase in fluorescence upon cation
complexation. The amount of fluorescence enhancement upon the addition of the cation
shows that PET does in fact take place with fairly high sensitivity.

42
0
100
200
300
400
500
600
700
800
343 363 383 403 423 443 463 483
Wavelength (nm)
Fluo
recs
ence
Inte
nsity
Figure 6: Fluorescence emission spectra (λex 333 nm) of P5 (1.15 × 10⁻⁵ M) in DCM:
MeOH (1:1) with added BTMAH (5.5 × 10⁻⁷ M) as a function of [Na+], [0 µM −1000
µM].
0
5000
10000
15000
20000
25000
30000
35000
0 0.0002 0.0004 0.0006 0.0008 0.001 0.0012 0.0014
[Na+] (M)
Fluo
resc
ence
Inte
nsity
Figure 7: Fluorescence area increase of P5 (1.15 × 10⁻⁵ M) in DCM: MeOH (1:1) with
added BTMAH (5.5 × 10⁻⁷ M) as a function of [Na+], [0 µM −1000 µM].

43
0
200
400
600
800
1000
343 363 383 403 423 443 463 483Wavelength (nm)
Fluo
resc
ence
Inte
nsity
Figure 8: Fluorescence emission spectra (λex 333 nm) of P6 (1.00 × 10⁻⁵ M) in DCM:
MeOH (1:1) with added BTMAH (9.35 × 10⁻⁷ M) as a function of [K+], [0 µM −205
µM].
0
5000
10000
15000
20000
25000
30000
35000
40000
45000
50000
0.00E+00 5.00E-05 1.00E-04 1.50E-04 2.00E-04 2.50E-04
[K+] (M)
Fluo
resc
ence
Inte
nsity
Figure 9: Fluorescence area increase of P6 (1.00 × 10⁻⁵ M) in DCM: MeOH (1:1) with
added BTMAH (9.35 × 10⁻⁷ M) as a function of [K+], [0 µM −205 µM].
44
0
100
200
300
400
500
600
700
365 385 405 425 445 465 485 505
Wavelength (nm)
Fluo
resc
ence
Inte
nsity
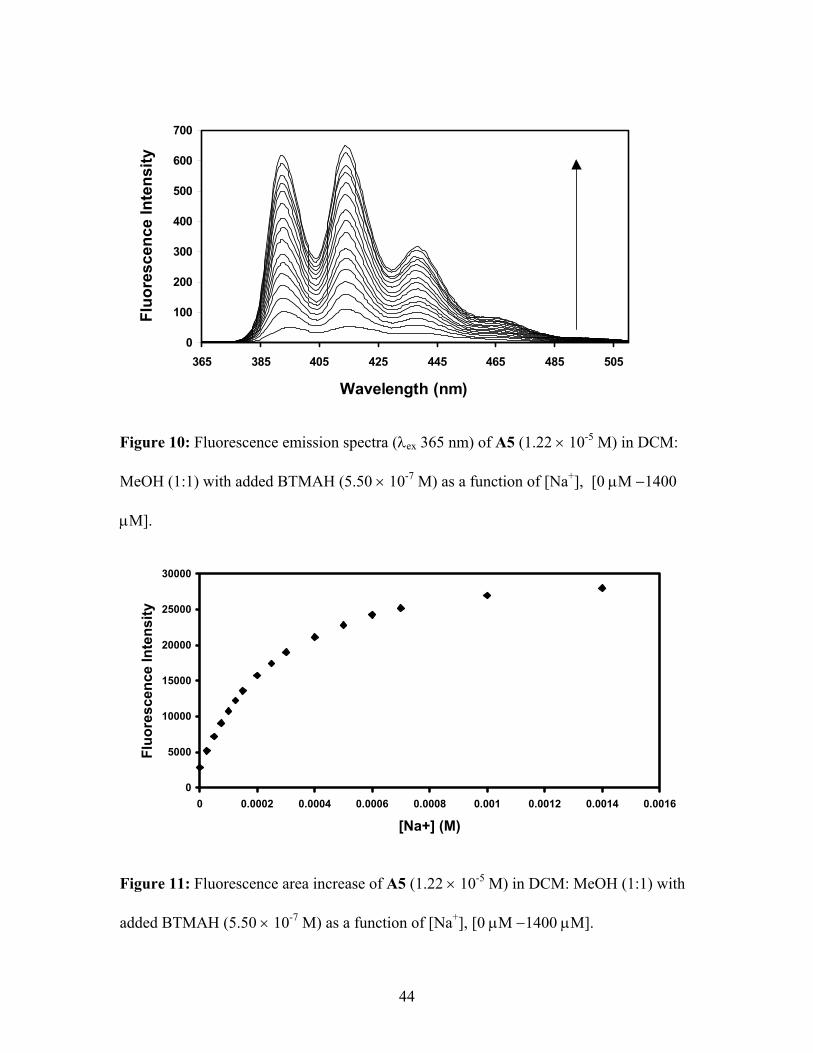
Figure 10: Fluorescence emission spectra (λex 365 nm) of A5 (1.22 × 10⁻⁵ M) in DCM:
MeOH (1:1) with added BTMAH (5.50 × 10⁻⁷ M) as a function of [Na+], [0 µM −1400
µM].
0
5000
10000
15000
20000
25000
30000
0 0.0002 0.0004 0.0006 0.0008 0.001 0.0012 0.0014 0.0016
[Na+] (M)
Fluo
resc
ence
Inte
nsity
Figure 11: Fluorescence area increase of A5 (1.22 × 10⁻⁵ M) in DCM: MeOH (1:1) with
added BTMAH (5.50 × 10⁻⁷ M) as a function of [Na+], [0 µM −1400 µM].

45
0
100
200
300
400
500
600
700
800
900
365 385 405 425 445 465 485 505
Wavelength (nm)
Fluo
resc
ence
Inte
nsity
Figure 12: Fluorescence emission spectra (λex 365 nm) of A6 (1.10 × 10⁻⁵ M) in DCM:
MeOH (1:1) with added BTMAH (5.50 × 10⁻⁷ M) as a function of [K+], [0 µM −175.0
µM].
0
5000
10000
15000
20000
25000
30000
35000
40000
0.00E+00 5.00E-05 1.00E-04 1.50E-04 2.00E-04
[K+] (M)
Fluo
resc
ence
Are
a
Figure 13: Fluorescence area increase of A6 (1.10 × 10⁻⁵ M) in DCM: MeOH (1:1) with
added BTMAH (5.50 × 10⁻⁷ M) as a function of [K+], [0 µM −175.0 µM].
46
Protonation of the nitrogen atom in the azacrown can potentially block the
electron transfer process and for this reason, the organic base, benzyltrimethylammonium
hydroxide (BTMAH), was added to minimize protonation.7,9 In fact, the addition of base
to solutions of A6 in the absence of potassium ions causes a 4-fold decrease in the
fluorescence intensity, consistent with this protonation effect. However, the addition of
excess base caused an increase in fluorescence intensity.
Nevertheless, some fluorescence is still observed. It is difficult to unambiguously
determine the origin of this fluorescence, i.e. whether it reflects the intrinsic rate constants for
fluorescence and electron transfer in this molecule or whether there is a low background
concentration of potassium, sodium or other cations present as impurities. Indeed, the intensity of
the fluorescence emission in the presence of base and in the absence of added potassium is
somewhat variable and it is possible to reduce this intensity by using rigorously cleaned
glassware during sample preparation, suggesting that at least some of the effect is due to
impurity ions.44,45
Upon testing, A6 was found to have a fluorescence enhancement, FE, for K+
greater than 50. This finding is consistent with published data where for the same
compound the F.E. was found to equal 47.3
II. 1,3 alternate calixarene[4]arenecrown-5 (I)
i. Synthesis
The synthesis of 1,3 alternate calixarene[4]arenecrown-5 (I) can be found in reference 46.
A structure of the molecule is given in Figure 14.

47
Figure 14: 1,3 alternate calixarene[4]arenecrown-5 (I)
ii. Fluorescence Data
The aza-crowns, P5, P6, A5, A6, were model compounds for more complex
fluoroionophores designed to exhibit higher cation selectivity. A6 was synthesized as a model for
I because it contains both the same chromophore/amine electron transfer system and based on
molecular modeling, the electrostatic characteristics of the complexation sites are qualitatively
similar in both compounds. The synthesis of A6 also served as a baseline for determining
whether selectivity and sensitivity of the azacrown moiety is enhanced by the incorporation of
the calix[4]arene group. Thus, the aza-crown moiety was combined with a calixarene group and
the resulting molecule was tested for cation response and selectivity. To provide a consistent
comparison of A6 to I, fluorescence spectra of A6 were obtained in DCM, (shown in Figure 15).
O
O O
O
OO
N

48
The results obtained using A6 in DCM show over a ca. 50–fold enhancement of the fluorescence
intensity upon addition of potassium ions. [Figure 16]
0100200300400500600700800900
1000
365 385 405 425 445 465 485
Wavelength (nm)
Fluo
rese
nce
Inte
nsity g
fedcba
Figure 15: Fluorescence emission spectra (λex 355 nm) of A6 (5.50 × 10⁻⁶ M) in DCM
with added BTMAH (8.75 × 10⁻⁷ M) as a function of [K+], [0 µM - 11.3 µM].
0
5
10
15
20
25
30
35
40
45
0.00 2.00 4.00 6.00 8.00 10.00 12.00
[K+] uM
A.U
.
Figure 16: Fluorescence area increase of A6 (5.50 × 10⁻⁶ M) in DCM with added
BTMAH (8.75 × 10⁻⁷ M) as a function of [K+].

49
Figure 17 shows the fluorescence spectra obtained for I in the absence and presence of
added potassium acetate in dichloromethane solution. In order to compare directly the behavior
of A6 and I, the spectrum for I in the absence of potassium ions was normalized to that of A6 to
account for differences in sample absorbance at the excitation wavelength. As with A6, the
fluorescence intensity of I in the presence of added base, increases dramatically with addition of
potassium ions, although both the rate of increase as a function of ion concentration and the
dynamic range for I is considerably less than for A6, (8.5-fold and 50-fold increases
respectively).
Figure 17: Fluorescence emission spectra (λex 355 nm) of I (1.1 × 10⁻⁶ M) in dichloromethane
with added BTMAH (1.0 × 10⁻⁷ M) as a function of [K+]. a: 0 µM, b: .5 µM, c: 1 µM, d: 1.5
µM, e: 2 µM, f: 2.5 µM, g: 3 µM.
0
50
100
150
200
250
380 400 420 440 460 480 500Wavelength (nm)
Fluo
resc
ence
inte
nsity gfedcba

50
The reason for this reduced response of I compared to A6 is unclear. One potential
explanation is that the ion occupies a site in I relative to the electron lone pair on the azacrown
nitrogen atom as well as to the anthryl fluorophore that is different than in A6. For example, if
the most stable position of the ion in the complex is at a greater distance from the nitrogen lone
pair in I, this could lead to a weaker electrostatic interaction and result in less effective
interference with the electron transfer quenching process. Such an effect could conceivably be
caused by an interaction between the ion and the π-systems of the phenyl rings of the calixarene
group. The binding of cations through π interactions has been observed for other host-guest
molecules47,48,49 as well as the 1,3 alternate calix[4]arenecrown-5 used in the present study.50 In
fact, electrostatics calculations on the potassium ion-I complex point out significant changes in
charge density in the calixarene phenyl rings upon complexation. Additionally, it was found that
when the structure of A6 complexed with potassium ion was minimized, a K+…N distance = 3.00
Å was optimal whereas a K+…N distance of 3.48 Å was observed for I. Therefore, a weaker
interaction with the amine electron donor and consequently a reduction in the fluorescence
response would be expected for I compared to A6.
iii. Solvent Effects
Previous studies of analogous anthryl-benzocrown ether calixarenes indicated a
considerable and complex solvent effect on the intensity of fluorescence in such compounds.16
Specifically, addition of methanol to dichloromethane was observed initially to cause an increase
in the fluorescence presumably due to complexation of the methanol with the oxygen atoms of
the benzocrown ether, i.e., electron transfer was less efficient. With continued addition of
methanol, the increase in polarity in turn increased the efficiency of electron transfer and led to a

51
decrease in the fluorescence. Given this reported medium effect and its potential importance in
the operation of a sensor based on this molecular structure, we have investigated the effect of
solvent on I, both in the absence and presence of added potassium ions. In the absence of ions,
the addition of methanol to the dichloromethane solutions caused an increase in the fluorescence
intensity at small methanol concentrations and then a decrease as the methanol concentration was
increased further. This behavior is similar to that reported for the benzocrown systems.1 It is
likely here that at low methanol concentrations, the increase in fluorescence intensity is due to a
hydrogen bond interaction between methanol and the azacrown nitrogen. The fact that the effect
of small concentrations of added methanol is more pronounced in I than in the previously studied
benzocrown compounds is consistent with the fact that the nitrogen lone pair is a more localized
source of electrons for the fluorescence quenching process than the 1,2-dimethoxybenzo moiety
within benzocrown ethers. However, at higher methanol concentrations the drop in fluorescence
intensity observed can be ascribed to an increase in the efficiency of electron transfer due to an
increase in solvent polarity. This polarity effect overshadows the hydrogen bonding effect.

52
Figure 18: Delta fluorescence response to K+ of I as a function of the mole fraction of
dichloromethane in methanol.
In the presence of added potassium ions, an additional effect of solvent is observed.
Figure 18 shows the delta response of I as a function of the mole fraction of dichloromethane in
methanol. The delta response is determined from the slope of the fluorescence intensity versus
ion concentration curve at a specific solvent composition. It is clear that as the mole fraction of
methanol decreases, the delta response increases dramatically. We ascribe this behavior to a
solvation effect in that, as the solvent polarity decreases with increased dichloromethane
concentration, the potassium ions seek out a more energetically favorable solvation environment,
namely the complexation site in I. This response to solvation is expected to have an important
impact on the composition of the membrane that is eventually chosen to host I in sensor
applications.
0
50
100
150
200
250
300
350
0 0.2 0.4 0.6 0.8 1 1.2Mole fraction of DCM
∆ F
luor
esce
nce
resp
onse
53
The anthryl azacrowncalix[4]arene, I, complexes with potassium ions in organic
solution triggering a substantial increase in anthryl fluorescence emission through the
disruption of the PET quenching process. Preliminary measurements indicate that the
selectivity for potassium ions over other alkali metal cations particularly sodium and
lithium for I is increased dramatically over that of the anthryl azacrown model
compound, A6. These preliminary solution phase studies indicate a 1:1 complexation
between I and the ion, suggesting that I could be sensitive to potassium in the normal
physiological concentration range once incorporated into a sensor. Furthermore, the
observed fluorescence response to changes in solvent polarity suggests that the sensor
substrate composition will have an important impact on the efficiency of I as an
ionophore and could allow further optimization of sensitivity and selectivity.
III. Bicyclic Peptide V
i. Design of Synthetic Route
Bicyclic peptide V was designed based on molecular modeling using MOE. The
modeling indicates that the use of V as a fluorionophore for ammonium cations should be
more selective than that of the currently used standard, nonactin.
In order to construct bicyclic peptide V, several different possible synthetic routes
that were examined. Ultimately, the core part of the molecule that needs to be
constructed is the linear peptide with both side chains deprotected, shown in Figure 19.

54
OHNH
NH
NNH
NH
NH
O
CH3 O
O O
O
OR
CH3
CH3
CH3
OR
CH3
O
O
O
CH3
CH3
CH3
Figure 19: Open chain unprotected linear peptide.
Initially, we intended to synthesize the linear peptide with a end terminal Fmoc
protecting group using a Wang Resin. However, it was determined that the Fmoc would
be removed by the reagents used. Specifically, the use of base in subsequent steps would
cleave the Fmoc group prior to the desired step. The option of using a terminal tBoc
protecting group was then explored because it is stable under basic conditions. However,
the use of tBoc precludes the use of a Wang Resin. Since 95% TFA is required to cleave
the peptide from this resin, the tBoc group would be completely removed.
Questions arose as to whether cyclization of the main outer peptide ring would be
a viable option. But, the deprotection of the alcohols could cause an unknown amount of
cyclization between the side chains and the free amine or carboxylic acid. It was decided
that the better option would be to attempt to cyclize the side chains first while leaving the
amine protected by the tBoc group.
This decision then meant that a different resin would have to be employed, in
which the cleavage conditions would not remove the tBoc protecting group. Various
resins were explored, such as those that undergo photo cleavage and one that may be
cleaved in NaOH. It was decided that the best alternative may be to use the 2-chloro-

55
trityl chloride resin, which cleaves in 5% TFA. Under this condition, the tBoc group
should not be removed.
1 2
NH
NH
NH
NH
NH
N
OO
O
OO
O N
CH3
NHNH
NH
NHNH
N
O
CH3
CH3
CH3
OO
O
O
O
NCH3
OHO
O
CH3CH3
CH3
OHNH
NH
NNH
NH
NH
O
CH3 O
O O
O
O
CH3
CH3
CH3
O
CH3
OO
O
CH3
CH3
CH3
SO
OF
F
F
SF
F
FO
O
OHNH
NH
NNH
NH
NH
O
CH3 O
O O
O
OH
CH3
CH3
CH3
OH
CH3
OO
O
CH3
CH3
CH3OH
NH
NH
NNH
NH
NH
O
CH3 O
O O
O
O
CH3
CH3
CH3
O
CH3
OO
O
CH3
CH3
CH3
O
O
OCl
NH
NH
NNH
NH
NH
O
CH3 O
O O
O
CH3
CH3
CH3 CH3
OO
O
CH3
CH3
CH3
P
3
4 5
6
Scheme 14: Retrosynthetic analysis of bicyclic peptide (V)

56
ii. Preliminary Synthesis
Decisions toward a synthetic route of constructing bicyclic peptide V were based
on trial syntheses. The synthetic route was designed around the need for having a stable
amine protecting group, while being able to activate the alcohols to facilitate the
pyrenemethyl amine addition across the homo-serine side chains, as in Scheme 14,
Structure 3. Initial attempts were directed toward activating the alcohol while still using
a Fmoc protecting group on the residue. This would mean that either the Wang or the
HMBA resins, which have been frequently used within our group and known to give
good yields, could be employed and cleaved in strong acid without affecting the
protecting group. A synthetic procedure that enabled the activation of the alcohol while
not removing the end protecting group on the amine of the linear peptide was needed in
order to prevent unwanted side reactions. In an attempt to find a method of activating the
alcohols without removing the Fmoc, several trial syntheses were attempted. Syntheses
tried and results obtained are described below.
Based on a procedure found in Organikum46 Fmoc- Ser-OH (1.0 eq., 3.1mmol)
was mixed with tosyl chloride (1.1 eq., 3.7 mmol) and DIPEA (1.6 eq., 4.9mmol) in
DCM. After 4 ½ hours at room temperature, 3 g of ice were added along with HCl (2-3
mL). The organic layer was then washed with water and dried with Na2SO4, but yielded
little evidence that the tosylation had taken place. The reaction was then re-run using 5
eq of DIPEA; however it was determined that these basic conditions removed the Fmoc
group.

57
OH
O
NH
O
OOH
-O
O
NH
O
OO
H
ONH
O
OH
O
OH
Fmoc-L-Ser-OH
Stablized Fmoc-L-Ser-OH Cyclized Fmoc-L-Ser-OH
Figure 20: Cyclizations of Fmoc-L-Ser-OH under basic conditions to form either a six
membered ring though stability or a cyclized five membered ring.
It is possible that once the base removes the proton on the carboxylic acid, the
Fmoc-Ser-OH is stabilized by the formation of a six membered ring between the alcohol
and the carboxylic acid, causing the alcohol of the serine to be much less reactive. The
other possibility is that under basic conditions, the alcohol is able to attack the carbonyl
and cyclizes to form a five membered ring, shown in Figure 20. To avoid these possible
cyclizations, the methyl ester was formed and used in further reactions.

58
S
O
O
ClF
F
F
S
O
O
OF
FFS
O
O
F
FF S
O
O
Cl
Triflic chloride Triflic anhydride Tosyl chloride
Figure 21: Structures of triflic chloride, triflic anhydride, and tosyl chloride.
Because a triflic group is a better leaving group than a tosyl group51, subsequent
reactions were attempted to find an efficient method for triflating the alcohol. [Figure
21] Fmoc-Ser-O-Me (1 eq., 7.4mmol) and DIPEA (2eq, 14.8mmol) were stirred at –78C
in DCM and triflic anhydride (1.1 eq., 8.1mmol) added dropwise over 1 hr. The organic
layer was rinsed with water and then NaHCO3. It was determined that he Fmoc was also
removed during this reaction. The above reaction was repeated using Fmoc- Ser-O-Me
(1.0 eq., 5.8mmol) and tosyl chloride (1.1 eq., 6.4 mmol) in DCM at room temperature
and then cooled to 0C. DIPEA (1.1 eq., 6.4mmol) was added dropwise over a ½ hour.
After 2 ½ hours at room temperature, 50 g of ice were added along with HCl (20 mL).
The organic layer was then washed with water and dried with Na2SO4. The Fmoc was
once again removed under these basic conditions.
O
O
NH
O
OOH
CH3
Figure 22: Structure of Bzl-L-Ser-OMe

59
The use of an N-protecting benzyl group was then employed. Bzl- Ser-O-Me (1.0
eq., 5.0mmol), Figure 22, was mixed with tosyl chloride (1.1 eq., 5.5mmol) and Et3N (2
eq., 10mmol) in chloroform. After 4 ½ hours at room temperature 3 g of ice were added
along with HCl (2-3 mL). The organic layer was then washed with water and dried with
Na2SO4. The products were not kept under inert conditions and based on TLC’S (3:1
DCM:Hexane), decomposition took placed, therefore the reaction was repeated under
inert conditions. Bzl- Ser-O-Me (1.0 eq., 36.7mmol) was mixed with tosyl chloride (1.1
eq., 40.4mmol) and Et3N (2 eq., 73.4mmol) in chloroform. After 4 ½ hours at room
temperature, 3 g of ice were added along with HCl (2-3 mL). The organic layer was then
washed with water and dried with Na2SO4. TLC plates were run in DCM:Hexane (4:1).
Based on NMR, cyclization took place. Spectra obtained were identical to previous NMR
spectra obtained when attempting to add an alkyl chain to the alcohol of Bzl- Ser-O-Me.
The next attempt made was to brominate the alcohol of Fmoc-Ser-OH. Fmoc-
Ser-OH (3.1mmol, 1.0g) and PBr3 (34mmol, 0.32mL) were refluxed over night in DCM.
Organic layer was washed with water and 3N NaOH (5mL) to convert from an acid
bromide to a carboxylic acid. TLC plates were run in DCM:EtOAc (19:1).
The decision was made to utilize an end tBoc protecting group, which is stable to
basic conditions that are needed to activate the alcohol. This decision also meant that a
very acid sensitive resin would need to be employed. Because the tBoc group is cleaved
in 50% TFA, either a photolytically-cleaved resin, base-cleaved resin, or very acid-
sensitive resin was required. Light sensitive resins are extremely expensive, and one
resin that could be cleaved in base was found, but there is evidence that cleavage is
inefficient based on a private communication with Advanced Chemtech. The decision

60
was made to attempt the synthesis of the linear peptide on the 2-chlorotrityl-chloride
resin which cleaves in 5% TFA a condition that presumably would not remove the tBoc.
iii. Synthesis
The linear peptide was loaded with Fmoc-Ala-OH using DIPEA and tested for its
loading amount. By using a known amount of Resin-Ala-Fmoc(0.010g), the resin can be
subjected to Fmoc deprotection conditions of (20% piperidine). The absorption spectra
of the Fmoc in solution can then be measured and the concentration of Fmoc in solution
calculated. The moles of Fmoc present indicate amount of loading on the resin. Both
times that the resin loading was tested it was found to be above 95%.
The linear peptide was synthesized using solid phase Fmoc strategy. Some
adaptations were made to the usual synthesis to facilitate better coupling yields. It was
experimentally determined that a higher coupling yield was obtained when a slightly
higher amount of PyBOP was used. This observation may be due to two possibilities;
either the higher amount of PyBOP present increased the amount of activated esters
formed thereby increasing the likelihood for amino acid coupling, or the PyBOP that was
being used had previously been exposed to air/water and some of the chloride had been
removed. The only other alteration that was made to the previously used strategy was the
use of DCM along with DMF. Due to a shortage of DMF, the use of DCM was
employed for coupling, and found to dramatically increase the amount of coupling,
especially for the bulkier groups. When only DMF is used for the addition of the homo-
serine, the reaction mixture becomes thick and frothy. The use of DCM drastically
increases the solubility of the mixture.

61
Coupling of each amino acid using a Fmoc strategy proceeds via the mechanism
shown below in Scheme 15. Removal of the hydrogen from the acid to form the anion,
leads to attack on PyBOP. An HOBT anion is then removed from the PyBOP to yield the
activated ester of the amino acid. Nucleophilic attack of HOBT on the carbonyl causes
the removal of the PyBOP ester, and enables the amine of the previous amino acid to
attack the carbonyl and remove the HOBT, causing coupling to take place.
.
R' O
O
H :N R' O
O P+
ON 3
NNN
R' O
O
P+
N 3
OHN
NN
R'
O
O+
NNN
O
H
P+
N 3R' O
ON
N N NH2 R Resin
R' O NN NO
N+
H HR
Resin
R' O NH
R ResinO
+
N-protected a.a.PyBOP
+
HOBT
Scheme 15: Solid phase peptide coupling using PyBOP, HOBT, and DIPEA.

62
The Kaiser test, which indicates the presence of free amine, was used to insure
proper coupling had taken place during each step. Some coupling steps were repeated
twice to insure complete coupling because slightly negative Kaiser tests were obtained
after single coupling. As the peptide became longer, and especially after the addition of
each homo-serine, slightly negative Kaiser tests were obtained (light purple beads, rather
than yellow). Based on later mass spectra, this is not due to any significant amount of
incomplete coupling of any of the residues. According to Nova BioChem, larger, bulky
groups are known to aggregate, thereby giving a slightly negative Kaiser test.52
In a previous synthesis, the cleavage reagents used were AcOH: TFE: DCM
(2:2:6) for 2 hours, which did not completely, if at all, cleave the peptide. Therefore,
cleavage of the peptide was done following another Nova BioChem procedure to prevent
the removal of the trityl groups. 1% TFA in DCM (42mLs) was bubbled through the
peptide synthesizer for 5 minutes and then filtered into 10% pyridine in methanol to
quench the reaction. [Scheme 16] Each fraction was collected and visualized using TLC
(EtoAc:MeOH, 3:1). The first 2 fractions contained the majority of peptide present
(2.020g); subsequent fractions contained a smaller amount of peptide (0.400g). A lower
overall peptide yield was obtained than expected. This may be due to the fact that either
incomplete loading took place initially, which is doubtful due to the high calculated
loading yield from the Fmoc UV testing, or the peptide may be partially cleaved during
coupling reactions or rinses. Because the trityl cation on the resin is extremely stable, i.e.
the product of cleavage, it is possible that some unwanted cleavage took place.

63
OCl
R
O OH
O
F
F
F OH+Cl
R
OO
F
F
F-O
OH R
O
Cl
RR+
+R +
Scheme 16: 2-Chlorotrityl Chloride resin cleavage using 1% TFA in DCM
The peptide was then precipitated from each cleavage mixture by rotoevaporation
to 5% volume and then adding de-ionized water. A white gummy precipitate was
immediately formed on the glass. The pH of the water was then tested to insure that
acidic conditions were not present since they could lead to cleavage of the tBoc group.
The major amount of precipitate from the first two cleavage batches was found to have a
pH of about 6-7. a small amount of pyridine was added to insure acidic conditions were
not present (to a pH of ~7). The minor fraction was found to have a pH of ~0-1, and
therefore a significant amount of base was quickly added. This fraction of peptide was
kept separate from the major fraction. Both fractions were cooled in the fridge overnight.
The deprotection of the trityl groups was done using 1% TFA in DCM 2.5 eq.
Triisopropylsilane (TIS). TIS is used as a carbocation scavenger by acting as a hydride
donor.53 Cleavage of the trityl groups yields unprotected alcohols on the homo-serine
residues along with tritylmethane, shown in Scheme 17.
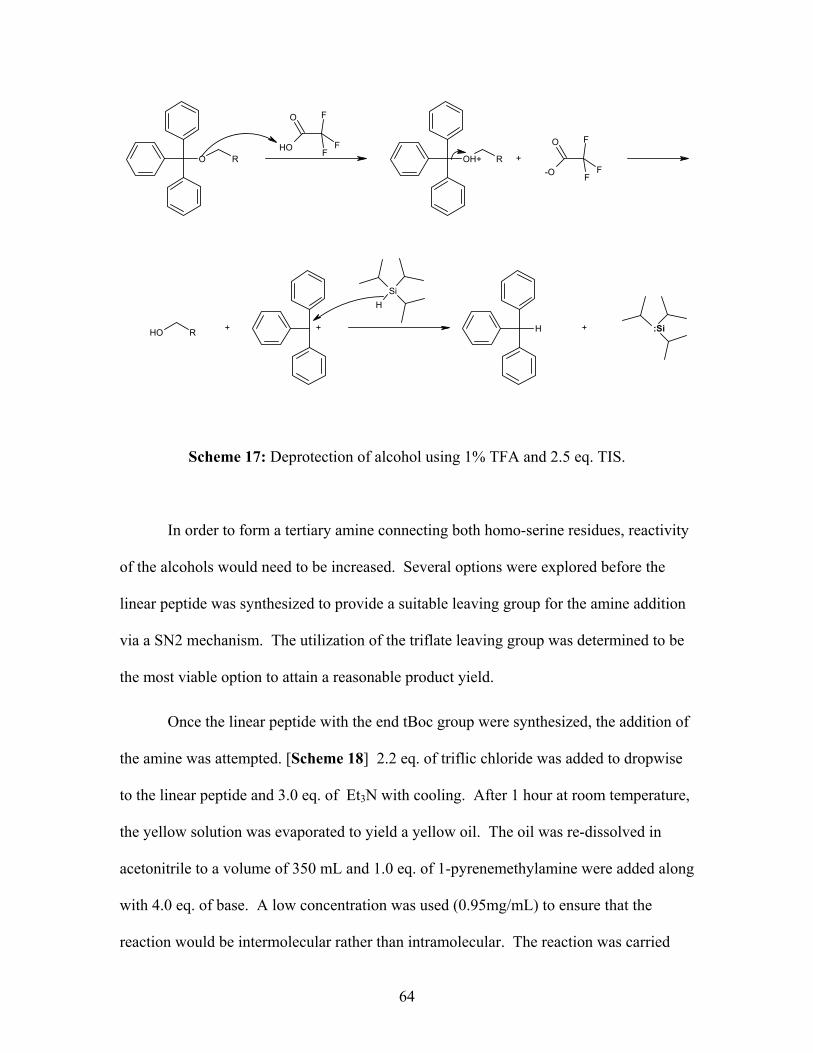
64
O RF
F
F
O
OHOH+ R
F
F
F
O
-O
OH R
SiH
H :Si
+
+ + +
Scheme 17: Deprotection of alcohol using 1% TFA and 2.5 eq. TIS.
In order to form a tertiary amine connecting both homo-serine residues, reactivity
of the alcohols would need to be increased. Several options were explored before the
linear peptide was synthesized to provide a suitable leaving group for the amine addition
via a SN2 mechanism. The utilization of the triflate leaving group was determined to be
the most viable option to attain a reasonable product yield.
Once the linear peptide with the end tBoc group were synthesized, the addition of
the amine was attempted. [Scheme 18] 2.2 eq. of triflic chloride was added to dropwise
to the linear peptide and 3.0 eq. of Et3N with cooling. After 1 hour at room temperature,
the yellow solution was evaporated to yield a yellow oil. The oil was re-dissolved in
acetonitrile to a volume of 350 mL and 1.0 eq. of 1-pyrenemethylamine were added along
with 4.0 eq. of base. A low concentration was used (0.95mg/mL) to ensure that the
reaction would be intermolecular rather than intramolecular. The reaction was carried

65
out overnight and the reaction mixture changed from cloudy orange to clear.
R OH
S
O
O
ClF
F
FR O
+
H
S
O
Cl
F F
FO
R O+
H
S
O
F
F
FO
R OS
O
F
F
FOHH NH2 pyrene
NH2+R
HHO S
O
F
F
FO
pyrene
pyreneNH
ROH S
O
F
F
FO R OS
O
F
F
FOHH
pyrene
NH+
R R
O S
O
F
F
FO
pyrene
N
R R
OH S
O
F
F
FO
+ Cl-
HCl +
d+
d-+
+
d+
d-
+
+
Scheme 18: Triflation and pyrene addition mechanism
Based on TLC, 3 spots were obtained in DCM:MeOH (10:1); one faint spot that
barely moved, one at an Rf of 0.45, and one at an R f of 1.0. All spots appeared under
the UV lamp, and indicated the presence of the pyrene group. The middle spot

66
corresponded to the pyrene-containing starting material and the bottom spot might
possibly be the linear peptide with one pyrene attached. Possibly, the top spot was the
desired product. The crude NMR is shown in the appendix and integrates fairly well for
the desired product.
A column was then run using the same solvent system and many more than three
fractions were obtained, none of which (based on mass spec and NMR) contained the
desired product. It is assumed that decomposition through photo-induced oxidation took
place on the silica and decomposed the products. Since the structure has a very similar
make-up to the aza-crown ether chromophore compounds, these compounds also
underwent photo-oxidation.
The linear peptide was successfully synthesized and the alcohols deprotected.
The addition of the amine will be repeated using a similar procedure as above.54 The
products formed will then be recrystalized and not subjected to silica. If that product is
obtained, the amino tBoc will then be removed using 50% TFA in DCM and cyclization
of the peptide ring done. Fluorescence testing will then be performed on the bicyclic
peptide to determine its selectivity and sensitivity toward complexing ammonium cations.

67
Conclusions Based on studies of P6, P5, A6, and A5, it can be concluded that photo-electron transfer
from the amine group quenches the fluorescence of the chromophore in the absence of
cations. Therefore, by monitoring fluorescence emission intensity it is possible to
determine the concentration of cations in solution. 1,3 alternate
calixarene[4]arenecrown-5 was synthesized and found to form a 1:1 complex and have
selectivity for potassium over all other alkali metal cations including sodium and lithium.
Our current molecule, V, is expected to behave similarly based on its molecular
architecture, and is predicted to selectively bind ammonium cations over potassium
cations. Future work will focus on completing the synthesis of molecule V and
characterizing its photophysical properties in the presence of ammonium cations.

68
Appendix A

69
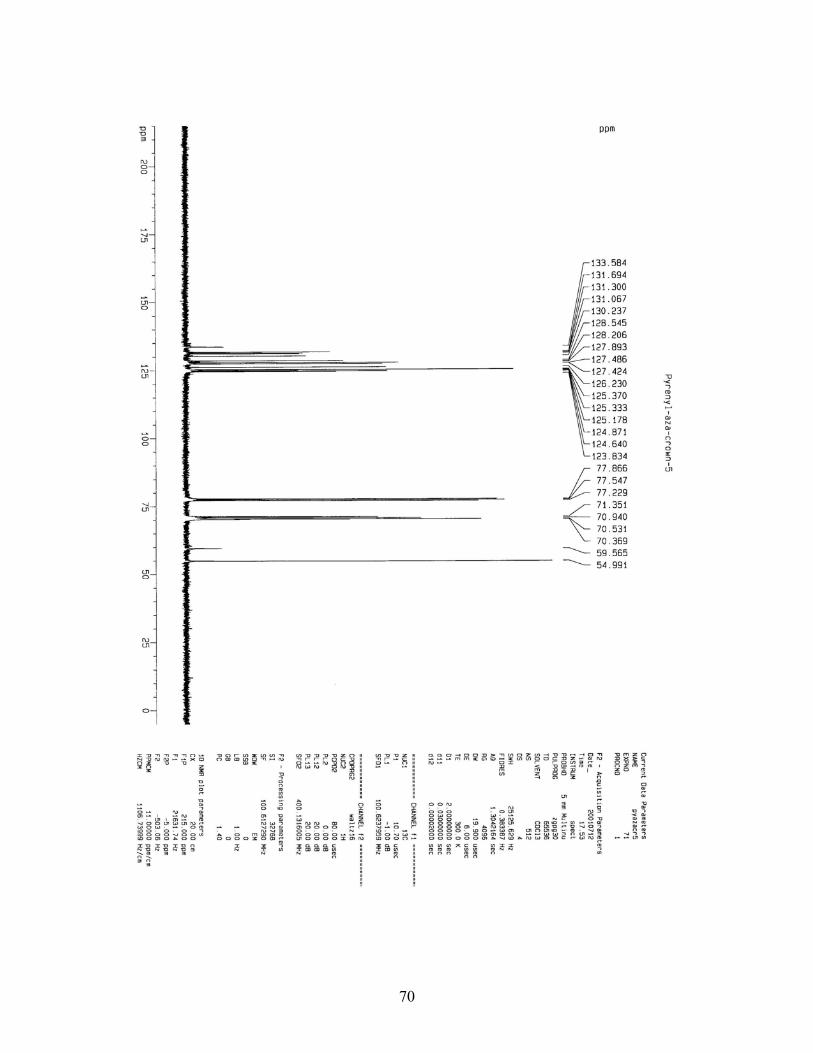
70

71

72

73

74

75

76

77

78

79
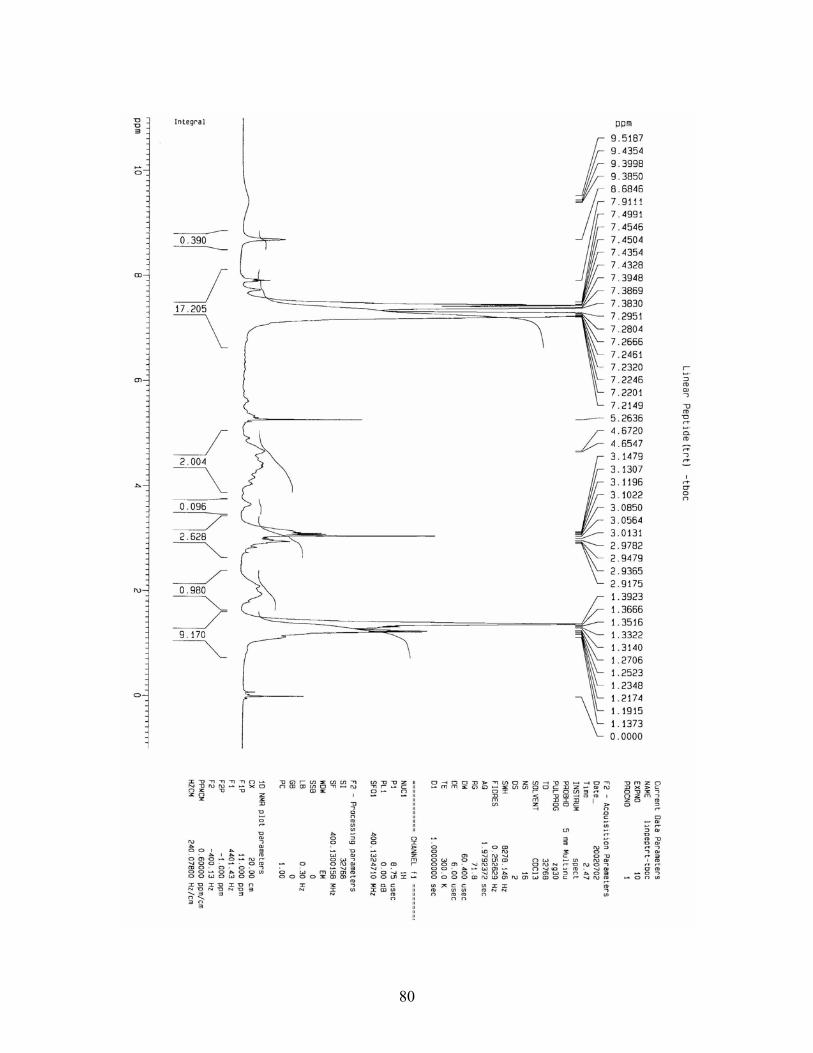
80

81

82
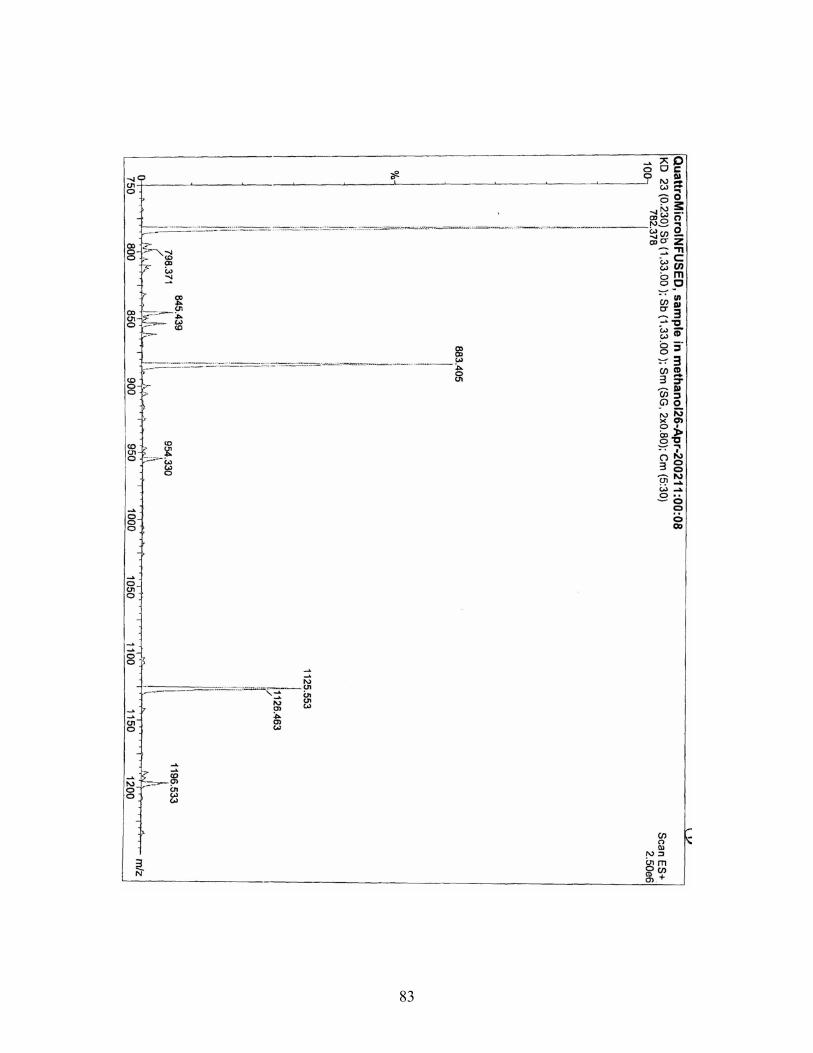
83

84
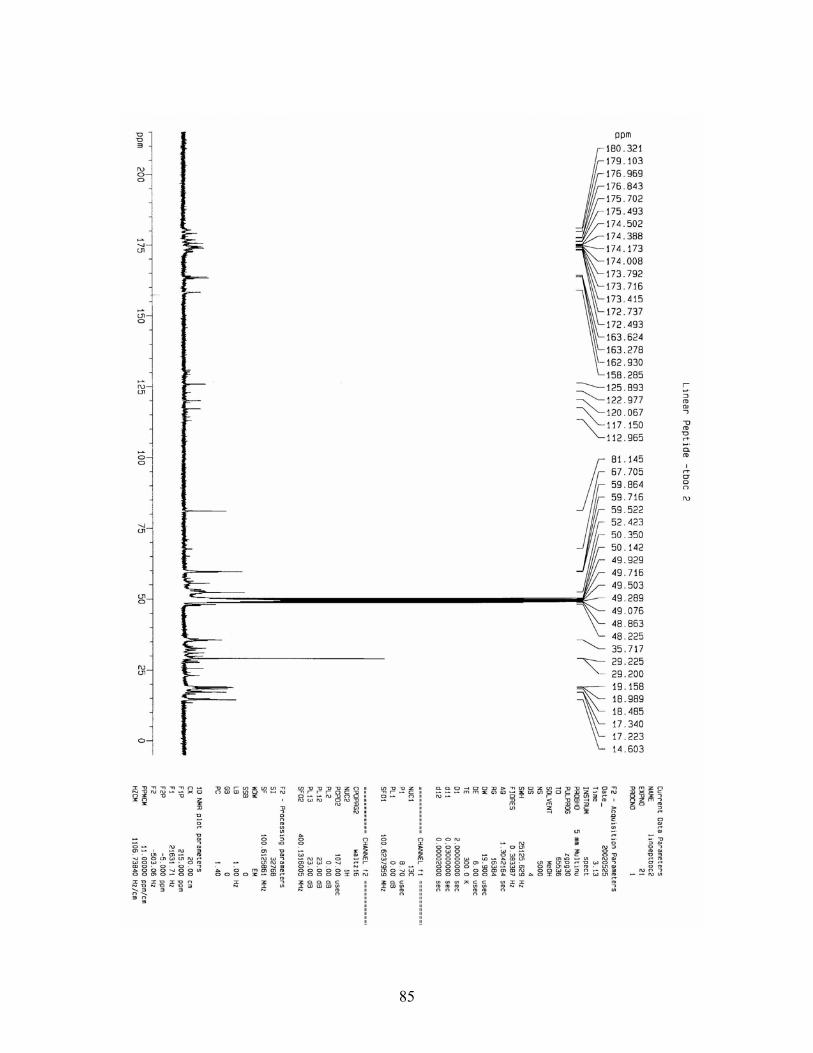
85

86

87

88

89
References 1 Yoshida, Katsuhira; Mori, Takayoshi; Watanabe, Shigeru; Kawai, Hideki; Nagamura, Toshihiko. J. Chem. Soc., Perkin Trans. 2 1999, 393. 2 Shih, Ying-Tai; Huang, Hsuan-Jung. Analy. Chim. Acta. 1999, 392, 143. 3 Bissell, Richard A.; de Silva, A. Prasnanna; Gunaratne, H. Q. Nimal; Lynch, P.L. Mark; Maguire, Glenn E. M.; Chem. Soc. Rev. 1992, 187. 4 Bissell, Richard A.; Calle, Emilio; de Silva, A. Prasanna; et al. J. Chem. Soc. Perk. 1992, 2, 1559. 5 Kubo, Kanji; Kato, Nobuo; Sakurai, Tadamitsu; Bull Chem.. Soc. of Japan. 1997, 70, 3041. 6 Kubo, Kanji; Ishige, Ryoichi; Kato, Nobuo; Yamamoto, Emi; Sakurai, Tadamitsu; Heterocycles. 1997, 45, 12, 2365. 7 Ji, Hai-Feng; Dabestani, Reza; Brown, Gilbert M.; Hettich, Robert L. Photochemistry and Photobiology. 1999, 69, 5, 513. 8 de Silva, A.P.; de Silva, S.A. J. Chem. Soc., Chem Commun. 1989, 1183. 9 de Silva, A. Prasnanna; de Silva, Saliya A.; J. Chem. Soc. Chem. Commun. 1986, 1709. 10 Kubo, Kanji; Ishige, Ryoichi; Kubo, Junko; Sakurai, Tadamitsu. Talanta 1999, 48, 181. 11 A. Casnati, A. Pochini, R. Ungaro, C. Bocchi, F. Ugozzoli, R. J. M. Egberink, H. Struijk, R. Lugtenberg, F. de Jong and D. N. Reinhoudt, Chem. Eur. J. 1996, 2, 436. 12 A. Casnati, A. Pochini, R. Ungaro, F. Ugozzoli, F. Arnaud, S. Fanni, M.-J. Schwing, R. J. M. Egberink, F. de Jong and D. N. Reinhoudt, J. Am. Chem. Soc. 1995, 117 , 2767. 13 H.-F. Ji, R. Dabestani, G. M. Brown and R. L. Hettich, J. Chem. Soc. Perkin Trans. 2001, 2, 585. 14 H.-F. Ji, R. Dabestani, G. M. Brown and R. L. Hettich, Photochem. Photobiol. 1999, 69, 513. 15 H.-F. Ji, G. M. Brown and R. Dabestani, Chem. Commun. 1999, 609. 16 H.-F. Ji, R. Dabestani, G. M. Brown and R. A. Sachleben, Chem. Commun. 2000, 833. 17 H.-F. Ji, R. Dabestani, R. L. Hettich and G. M. Brown, Photochem. Photobiol. 1999, 70, 882.
90
18 H.-F. Ji, R. Dabestani and G. M. Brown, J. Am. Chem. Soc. 2000, 122 , 9306. 19 J. S. Kim, W. K. Lee, K. No, Z. Asfari and J. Vicens, Tet. Lett. 2000, 41, 3345 20 J. S. Kim, O. J. Shon, J. W. Ko, M. H. Cho, I. Y. Yu, J. Vicens, J. Org. Chem. 2000, 65, 2386. 21 J. S. Kim, O. J. Shon, W. Sim, S. K. Kim, M. H. Cho, J.-G. Kim, I.-H. Suh and D. W. Kim, J. Chem. Soc. Perkin Trans. 2001, 1, 31. 22 K. Kubo, R. Ishige, N. Kato, E. Yamamoto and T. Sakurai, Heterocycles. 1997, 45, 2365. 23 K. Yoshida, T. Mori, S. Watanabe, H. Kawai and T. Nagamura, J. Chem. Soc. Perkin Trans. 1999, 2, 393. 24 J.S. Kim, I. Y. Yu, J. H. Pang, J. K. Kim, K. W. Lee, and W. Z. Oh, Microchem. J. 1998, 58, 225. 25 Pederson, C. J.; Lehn, J. M.; Cram, D. J. Resonance . 2001, 6, 6, 71. 26 Kremer, L.N.; Spicer, L.D. J. Am. Chem. Soc. 1975, 97, 17, 5022. 27 Dietrich, Bernard; Kintzinger, Jean-Pierre; Lehn, Jean-Marie; Metz, Bernard; Zahidi, Assou. J. Phys. Chem. 1987, 91, 6600. 28 Krakowiak, K.E.; Bradshaw, J.S. J. Org. Chem. 1995, 60, 7070. 29 Graf, E.; Kintzinger, J.P.; Lehn, J.M.; LeMoigne, J. J. Am. Chem. Soc. 1982, 104, 1672. 30 Jon, Sang Yong; Kim, Jeongho; Kim, Sang-Hyun Park; Jeon, Woo Sung; Heo, Jeongsuk; Kim, Kimoon. Angew. Chem. Int. Ed. 2001 40, 11, 2116. 31 Draxler, Sonja; Lippitsch, Max E.. Applied Optics. 1996, 35, 21, 4117-4123. 32 Suzuki, K.; Siswanta, D.; Otsuka, T.; Amano, T.; Ikeda, T.; Hisamoto, H.; Yoshihara, R.; Ohba, S. Anal. Chem. 2000, 72, 2200. 33 Furlan, Ricardo L. E; Ng, Yiu-Fai; Cousins, Graham R. L.; Redman, James E.; Sanders, Jeremy K.M.. Tetrahedron .2002, 58, 771. 34 Zanotti, G.C.; Campbell, B.E.; Easwaran, K.R.K.; Blout, E.R. Int. J. Peptide Protein Res. 1988, 32, 527. 35 Zanotti, G.C.; Paolillo, L.; Barbato, G.; Fraternali, F.; D’Alagni, M. Peptides. 1990, 499.

91
36 Cursi, E.; Giralt, E.; Andreu, D. Peptide Res. 1995, 8, 62. 37 Benco, John S.; Nienaber, Hubert A.; McGimpsey, W. Grant. Anal. Chem. 2002, under review. 38 Benco, John S.; Nienaber, Hubert A.; Dennen, Katherine; McGimpsey, W. Grant. J. Photochem. & Photobio. A: Chemistry. 2002, 6098, 1. 39 Petrov, N. Kh.; Kuhnle, W.; Fiebig, T.; Staerk, H.; J. Phys Chem. A. 1997, 101, 7043. 40 Dabestani, Reza; Ellis, Keith J.; Sigman, Micheal E.; J. of Photochem. and Photobio.. A: Chemistry. 1995, 86, 231. 41 Reyes, Celso A.; Medina, Myriam; Crespo, Carlos; et. al.; Environ. Sci. Technol. 2000, 34, 415. 42 Sigman, Micheal E.; Schuler, Peter F.; Ghosh, Mriganka M.; Dabestani, Reza; Environ. Sci. Technol. 1998, 32, 3980. 43 Murov, Steven L.; Carmichael, Ian; Hug, Gordon L.; Handbook of Photochemistry. Second ed. New York. Marcel Dekker, Inc. p. 6, 270, 271 44 E. Bakker, P. Bühlmann, and E. Pretsch, Chem. Rev. 1997, 97, 3083. 45 Benco, H. A. Nienaber, W. Grant McGimpsey, Sensors and Actuators B. 2002, In Press. 46 (Autorencollectiv) Organikum; 16. Auflage; VEB Deutscher Verlag der Wissenschaften Berlin, 1986, 559. 47 P.J. Dijkstra, J.A., Brunink, K.E. Bugge, D.N. Reinhoudt, S. Harkema, R. Ungaro, F. Ugozzoli, E. Ghidini, J. Am. Chem. Soc. 1989, 111, 7567. 48 E. Ghidini, F. Ugozzoli, R. Ungaro, S. Harkema, A.A. El-Fadl, D.N. Reinhoudt, J. Am. Chem. Soc. 1990, 112, 6979. 49 W.F. Nijenhuis, E.G. Buitenhuis, F. de Jong, E.J.R. Sudholter, D.N. Reinhoudt, J. Am. Chem. Soc. 1991, 113, 7963. 50 Z. Brzozka, B. Lammerink, D.N. Reinhoudt, E. Ghidini, R. Ungaro, J. Chem. Soc. Perkin Trans. 2. 1993, 1037. 51 Yang, Chuluo; Wong, Yiu Tung; li, Zaoying; Krepinsky, Jiri J.; Jia, Guochen. Organometallics. 2001, 20, 5220.

92
52 NovaBiochem Catalog and Handbook. 1999, p. S 44. 53 Blanchette, Mary; Baker, Mary Lou; Guindon, Cathy A.; Tet. Lett. 1989, 30, 21, 2739. 54 Pickersgill, Fraser I.; Rapoport, Henry; J. Org,. Chem. 2000, 65, 4048.