
Synthesis, GC MS, GC MS/MS, GC IR and chromatographic ...
226
Synthesis, GC–MS, GC–MS/MS, GC–IR and chromatographic studies on cathinone derivatives related to methylenedioxypyrovalerone (MDPV) by Younis Faraj Hamad Abiedalla A dissertation submitted to the Graduate Faculty of Auburn University in partial fulfillment of the requirements for the degree of Doctor of Philosophy Auburn, Alabama December 15, 2018 Keywords: designer drugs, bath salts, GC–MS, GC–IR, MS/MS, regioisomers. Copyright 2018 by Younis Faraj Hamad Abiedalla Approved by C. Randall Clark, Chair, Professor of Medicinal Chemistry Jack DeRuiter, Professor of Medicinal Chemistry Forrest Smith, Associate Professor of Medicinal Chemistry Angela Calderon, Associate Professor of Medicinal Chemistry
Transcript of Synthesis, GC MS, GC MS/MS, GC IR and chromatographic ...

Synthesis, GC–MS, GC–MS/MS, GC–IR and chromatographic studies on cathinone
derivatives related to methylenedioxypyrovalerone (MDPV)
by
Younis Faraj Hamad Abiedalla
A dissertation submitted to the Graduate Faculty of
Auburn University
in partial fulfillment of the
requirements for the degree of
Doctor of Philosophy
Auburn, Alabama
December 15, 2018
Keywords: designer drugs, bath salts, GC–MS, GC–IR, MS/MS, regioisomers.
Copyright 2018 by Younis Faraj Hamad Abiedalla
Approved by
C. Randall Clark, Chair, Professor of Medicinal Chemistry
Jack DeRuiter, Professor of Medicinal Chemistry
Forrest Smith, Associate Professor of Medicinal Chemistry
Angela Calderon, Associate Professor of Medicinal Chemistry

ii
Abstract
This project will address issues of resolution and discriminatory capabilities for cathinone
derivatives (regioisomeric and homologous groups) providing additional reliability and selectivity
for forensic evidence and analytical data on new analytes of the so-called bath salt-type drugs of
abuse. A number of aminoketones have appeared on the illicit drug market in recent years
including methcathinone, mephedrone, methylone and MDPV (3,4-
methylenedioxypyrovalerone). These substances represent a variety of aromatic ring substituent,
hydrocarbon side-chain and amino group modifications of the basic cathinone molecular skeleton.
Exploration and designer development in the aminoketone drugs using models based on
substituted amphetamines and related phenethylamines is likely to continue for many years.
Current clandestine designer drug development concepts used for amphetamine-type molecules
can be applied directly for aminoketone analogues. Production of these drugs can be based on
common readily available precursor chemicals. These numerous precursor substances are
commercially available and would not prevent the further clandestine/designer exploration of this
group of compounds. It could be argued that isomer differentiation is not necessary in forensic
drug science because of the Controlled Substance Analogue Act. However, the courts should
expect forensic drug chemistry to be able to identify a substance as an individual compound, not
report it as an unknown member of a large group of isomeric substances. Furthermore, the forensic
chemist must identify the compound in order to know if it is an analogue of a controlled substance.

iii
These circumstances all point to the strong need for a thorough and systematic investigation of the
forensic chemistry of these substituted aminoketones.
The broad objective of this research is to improve the specificity, selectivity and reliability
of the analytical methods used to identify ring substituted aminoketones and related compounds.
This improvement will come from methods, which allow the forensic analyst to identify specific
regioisomeric forms of substituted aminoketones among many isomers of mass spectral equivalence.
Mass spectrometry is the most common method of confirmation in forensic analysis. This project will
provide methodology and analytical data to discriminate between those regioisomeric molecules
having the same molecular weight and major fragments of equivalent mass (i.e. identical mass
spectra). Furthermore, this work will anticipate the future appearance of some designer
aminoketones and develop analytical reference data and analytical reference standards for these
compounds.
The initial phase of this work is the organic synthesis of aminoketones of varying aromatic
ring substituents, hydrocarbon side-chains and amino groups. In this phase of the work more than
60 substituted aminoketones of potential forensic interest will be evaluated. The analytical phases
will consist of chemical characterization, using tools common to forensic science labs such as MS and
IR and these studies will be carried out on each of the compounds. The chromatographic retention
properties for each series of isomers will be evaluated by gas chromatographic techniques on a variety
of stationary phases. These studies will establish a structure-retention relationship for the regioisomers
aminoketones on selected chromatographic stationary phases.
The results of this project will significantly increase the forensic drug chemistry knowledge
base for aminoketone-type designer drugs. When compounds exist which produce the same mass

iv
spectrum (same MW and fragments of equivalent mass) as the drug of interest, the identification
by GC–MS must be based entirely upon the ability of the chromatographic system to resolve these
substances. Chromatographic co-elution of compounds having identical mass spectra can lead to
misidentification. This is a critical issue when some of the MS equivalent compounds are
controlled substances. This project involves the synthesis and generation of complete analytical
profiles as well as methods of differentiation for those homologous and regioisomeric substances
related to MDPV.

v
Acknowledgments
First and foremost, my thanks and all praise go to Allah (SWT) without Whom this life is
nonexistent and absolutely meaningless. I thank Him for giving me the ability and patience to
persevere through this process and I ask for His Guidance in becoming someone who continually
seeks useful knowledge and delivers it to others.
To my chair, Dr. Randall Clark, who regardless of how busy I know he was, always made
me feel that I was the top priority as soon as I walked in his office. Without his constructive
feedback, guidance, support and patience, I would not have been able to complete my dissertation.
To the rest of my committee, Dr. Jack DeRuiter, Dr. Forrest Smith and Dr. Angela
Calderon, have each provided helpful feedback and have been great teachers who have prepared
me to get to this place in my academic life. This project would not be nearly as good without their
help. I would also like to thank former postdoctoral fellows, Dr. Karim Hafiz and Dr. Amber
Thaxton for their sincere help and support in the lab.
We gratefully acknowledge the National Institute of Justice, Office of Justice Programs,
U. S. Department of Justice (Award No. 2013-DN-BX-K022) for supporting portions of this
research project.

vi
To my father, Faraj (May Allah bless him), who has been the driving force behind my
motivation to excel as an academician, and more importantly, as a human being. To my mother,
Mabroka, whose devotion to her seven sons and two daughters and her sincere desire for our
success has been immeasurable. I would especially like to thank my family. My wife, Azeza has
been extremely supportive of me throughout this entire process and has made countless sacrifices
to help me get to this point. My children, Faraj and Saad, have continually provided the requisite
breaks from philosophy and the motivation to finish my degree with expediency.
Finally yet importantly, I would like to thank my sponsor, The Ministry of Higher
Education in Libya, and the administrator of the sponsorship program, Canadian Bureau for
International Education (CBIE) in Canada, for giving me this opportunity and for their support and
help throughout the duration of my study.

vii
Table of Contents
Abstract ..................................................................................................................................... ii
Acknowledgments .......................................................................................................................v
Table of Contents ..................................................................................................................... vii
List of Tables ..............................................................................................................................x
List of Figures ........................................................................................................................... xi
List of Schemes ........................................................................................................................xvi
List of Abbreviations............................................................................................................. xviii
1. Review of relevant literature ................................................................................................1
1.1. Introduction .................................................................................................................1
1.2. Historical background ..................................................................................................3
1.3. Prevalence, patterns of use and legal status ..................................................................6
1.4. Chemistry ....................................................................................................................9
1.5. Pharmacokinetics ....................................................................................................... 10
1.6. Pharmacodynamics .................................................................................................... 16
1.7. Physiological and toxicological effects in animal studies ........................................... 18
1.8. Subjective effects and adverse toxic reactions ............................................................ 18
1.9. Analytical detection of synthetic cathinones ............................................................... 19
1.9.1. Analytical detection of synthetic cathinones using GC–MS and LC–MS .............. 20
1.9.1.1. Thermal degradation of cathinone derivatives in GC–MS ............................. 22
1.9.2. Gas chromatography with infrared detection (GC–IR).......................................... 23
1.9.3. Nuclear magnetic resonance (NMR) .................................................................... 24
1.10. The instability of hydrochloride salts of cathinone derivatives in air .......................... 25
1.11. Project rational .......................................................................................................... 26
1.12. Purpose, goals and objectives ..................................................................................... 29
2. Synthesis, analytical studies and isotope labeling of the regioisomeric and homologous
cathinone derivatives ................................................................................................................. 33
2.1. GC–MS, GC–MS/MS and GC–IR analyses of a series of methylenedioxyphenyl-
aminoketones: precursors, ring regioisomers and side-chain homologues of MDPV .............. 36

viii
2.1.1. Synthesis of the methylenedioxyphenyl-aminoketones: Ring substituted regioisomers
and side-chain homologues of 3,4-methylenedioxypyrovalerone (MDPV) ......................... 36
2.1.1.1. Alternative synthesis of the intermediate 3,4-methylenedioxyphenyl-ketones .... 37
2.1.1.2. Synthesis of the precursor 2,3-methylenedioxybenzaldehyde ............................ 38
2.1.2. Gas chromatographic separation .............................................................................. 38
2.1.3. Mass spectral studies (EI-MS, CI-MS and MS/MS) ................................................. 42
2.1.4. Vapor phase infrared spectrophotometry .................................................................. 56
2.1.5. Conclusion ............................................................................................................... 60
2.2. Differentiation of regioisomeric methylenedioxyphenyl-aminoketones and desoxy
cathinone derivatives: Cyclic tertiary amines and side-chain regioisomers of MDPV by GC–
MS, GC–MS/MS and GC–IR ................................................................................................ 61
2.2.1. Synthesis of the cyclic tertiary amines and side-chain regioisomers of MDPV ......... 62
2.2.1.1. Synthesis of the regioisomeric aminoketones .................................................... 62
2.2.1.2. Synthesis of the regioisomeric desoxy phenethylamines .................................... 63
2.2.1.2.1. Alternative synthesis of the intermediate ketones for the desoxy
phenethylamines ........................................................................................................ 64
2.2.2. Gas chromatographic separation .............................................................................. 65
2.2.3. Mass spectral studies (EI-MS, CI-MS and MS/MS) ................................................. 73
2.2.4. Vapor phase infrared spectrophotometry ................................................................ 101
2.2.5. Conclusion ............................................................................................................. 107
2.3. Product ion MS/MS differentiation of regioisomeric side-chain groups in cathinone
derivatives ........................................................................................................................... 109
2.3.1. Synthesis of the aminoketone derivatives containing regioisomeric n-propyl and
isopropyl side-chain groups ............................................................................................. 110
2.3.2. Gas chromatographic separation ............................................................................ 110
2.3.3. Mass spectral studies (EI-MS, CI-MS and MS/MS) ............................................... 113
2.3.4. Vapor phase infrared spectrophotometry ................................................................ 127
2.3.5. Conclusion ............................................................................................................. 130
2.4. GC–MS, GC–MS/MS and GC–IR differentiations of carbonyl modified analogues of
MDPV................................................................................................................................. 131
2.4.1. Synthesis of the carbonyl modified analogues of MDPV ........................................ 132
2.4.1.1. Synthesis of the aminoketones and aminoalcohol derivatives .......................... 132
2.4.1.2. Synthesis of the desoxy phenethylamine derivatives ........................................ 132
2.4.2. Gas chromatographic separation ............................................................................ 133
2.4.3. Mass spectral studies (EI-MS, CI-MS and MS/MS) ............................................... 135
2.4.4. Vapor phase infrared spectrophotometry ................................................................ 144

ix
2.4.5. Conclusion ............................................................................................................. 147
2.5. Differentiation of homologous and regioisomeric methoxy-cathinone derivatives by GC–
MS, GC–MS/MS and GC–IR .............................................................................................. 148
2.5.1. Synthesis of the homologous and regioisomeric methoxy-cathinone derivatives..... 149
2.5.2. Gas chromatographic separation ............................................................................ 149
2.5.3. Mass spectral studies (EI-MS, CI-MS and MS/MS) ............................................... 152
2.5.4. Vapor phase infrared spectrophotometry ................................................................ 161
2.5.5. Conclusion ............................................................................................................. 165
2.6. Differentiation of the six dimethoxypyrovalerone (DMPV) regioisomers: GC–MS, GC–
MS/MS and GC–IR ............................................................................................................. 167
2.6.1. Synthesis of the six regioisomeric dimethoxypyrovalerones ................................... 168
2.6.2. Gas chromatographic separation ............................................................................ 168
2.6.3. Mass spectral studies (EI-MS, CI-MS and MS/MS) ............................................... 170
2.6.4. Vapor phase infrared spectrophotometry ................................................................ 173
2.6.5. Conclusion ............................................................................................................. 180
3. Experimental ................................................................................................................... 181
3.1. Materials, instruments, GC-Columns and temperature programs ................................... 181
3.1.1. Materials ................................................................................................................ 181
3.1.2. Instruments ............................................................................................................ 182
3.1.3. GC-Columns .......................................................................................................... 183
3.1.4. Temperature Programs ........................................................................................... 184
3.2. Synthesis of the regioisomeric and homologous aminoketones ..................................... 186
3.2.1. Synthesis of the ring substituted aminoketones ...................................................... 186
3.2.1.1. Synthesis of the methylenedioxyphenyl-aminoketones .................................... 186
3.2.1.2. Synthesis of the monomethoxyphenyl-aminoketones....................................... 188
3.2.1.3. Synthesis of the dimethoxyphenyl-aminoketones (dimethoxypyrovalerones,
DMPV)........................................................................................................................ 188
3.2.2. Synthesis of the side-chain regioisomeric cathinone derivatives (flakka and iso-
flakka) .......................................................................................................................... 189
3.2.3. Synthesis of the aminoalcohol regioisomeric compounds ....................................... 190
3.2.4. Synthesis of the desoxy regioisomeric compounds ................................................. 190
Summary................................................................................................................................. 192
References .............................................................................................................................. 195

x
List of Tables
Table 1. Structures for a series of cyclic tertiary aminoketones and their major EI-MS fragment
ions as well as MS/MS product ions. ......................................................................................... 95
Table 2. List of columns used and their composition ............................................................... 184
Table 3. List of temperature programs used ............................................................................. 185

xi
List of Figures
Figure 1. Structures of common cathinone/bath salts reported in recent forensic samples and their
similarity to Schedule IV and V prescription drugs. .....................................................................2
Figure 2. The major historical events associated with khat and synthetic cathinone derivatives
[Valente et al, 2014]. ...................................................................................................................6
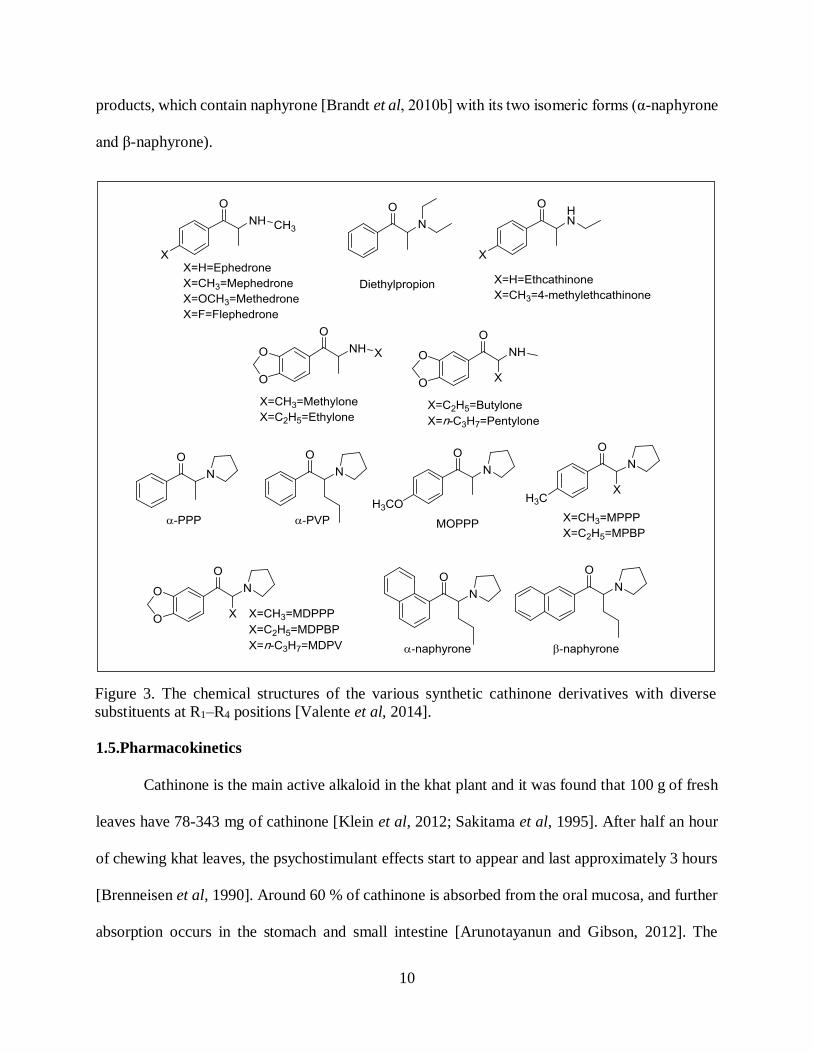
Figure 3. The chemical structures of the various synthetic cathinone derivatives with diverse
substituents at R1–R4 positions [Valente et al, 2014]. ................................................................. 10
Figure 4. EI spectrum (70 eV) of MDPV [Westphal et al, 2009]. ............................................... 21
Figure 5. Electron ionization mass spectra of (A) decomposition product of α-PVP, (B) intact α-
PVP, (C) decomposition product of α-PVP-D8 and (D) intact α-PVP-D8 [Tsujikawa et al, 2013a].
................................................................................................................................................. 23
Figure 6. General structures for the bath salt aminoketones in this study.................................... 32
Figure 7. Capillary gas chromatographic separation of the six regioisomeric and homologous
methylenedioxyphenyl-aminoketones. GC–MS System 1. A: Rxi®-35Sil MS stationary phase, B:
Rxi®-17Sil MS stationary phase. ............................................................................................... 40
Figure 8. Capillary gas chromatographic separation of the regioisomeric compounds 2,3-MDPV
and 3,4-MDPV. GC–MS System 1. Rtx®-5 stationary phas. ...................................................... 41
Figure 9. Capillary gas chromatographic separation of the six regioisomeric and homologous
methylenedioxyphenyl-ketones. GC–MS System 1. Rtx®-5 stationary phase. ............................ 41
Figure 10. EI mass spectra of the six regioisomeric and homologous methylenedioxyphenyl-
aminoketones in this study. GC–MS System 1. ......................................................................... 46
Figure 11. Chemical ionization mass spectra (CI-MS) for Compounds 3 and 6. GC–MS System
2. ............................................................................................................................................... 48
Figure 12. Low mass portion of the EI-MS for Compounds 4, 5 and 6. GC–MS System 1. ........ 50
Figure 13. MS/MS scan of the m/z 126 base peak for 2,3-MDPV (Compound 3). See Figure 10
for the full scan EI-MS of this compound. GC–MS System 2. ................................................... 51

xii
Figure 14. EI-MS and product ion spectra for the pyrrolidine-D4 analogue of 3,4-MDPV,
Compound 6. 14A= GC–MS System 1, 14B= GC–MS System 2. ............................................. 52
Figure 15. EI-MS and product ion spectra for the pyrrolidine-D8 analogue of Compound 4. 15A=
GC–MS System 1, 15B= GC–MS System 2. ............................................................................. 54
Figure 16. Product ion spectrum of the m/z 112 base peak of Compound 5. GC–MS System 2.. 55
Figure 17. EI-MS and product ion spectra for the pyrrolidine-D8 analogue of Compound 5. 17A=
GC–MS System 1, 17B= GC–MS System 2. ............................................................................. 56
Figure 18. An example set of vapor phase IR spectra for Compound 3 (2,3-MDPV) and
Compound 6 (3,4-MDPV). ........................................................................................................ 57
Figure 19. An example set of vapor phase IR spectra for the intermediate ketone c (2,3-
methylenedioxyvalerophenone) and intermediate ketone f (3,4-methylenedioxyvalerophenone).
................................................................................................................................................. 59
Figure 20. Capillary gas chromatographic separation of the eight precursor regioisomeric and
homologous 3,4-methylenedioxyphenyl-ketones on Rxi®-17Sil MS stationary phase. GC–MS
System 1. .................................................................................................................................. 66
Figure 21. Capillary gas chromatographic separation of the four regioisomeric desoxyamines (A)
and the four regioisomeric aminoketones (B) on Rxi®-17Sil MS stationary phase and identical
temperature program. GC–MS System 1. .................................................................................. 68
Fgure 22. Capillary gas chromatographic separation of three aminoketone analogues illustrating
the effect of side-chain and ring methylene (CH2) homologation on retention for Compound I. . 70
Figure 23. Capillary gas chromatographic separation of Compounds 1–4 with co-elution of
Compounds 2 (3,4-MDPV) and 3. GC–MS System 1. Rxi®-5Sil MS stationary phase. .............. 71
Figure 24. Capillary gas chromatographic co-elution of Compounds 2 (3,4-MDPV) and 3. GC–
MS System 2 (CI technique). Rtx®-1 stationary phase. .............................................................. 72
Figure 25. Electron ionization mass spectra (EI-MS) for the intermediate regioisomeric ketones.
A: 1-(3,4-methylenedioxyphenyl)-2-pentanone; B: 1-(3,4-methylenedioxyphenyl)-1-pentanone.
GC–MS System 1...................................................................................................................... 74
Figure 26. EI-MS for the four regioisomeric aminoketones of MW= 275 and regioisomeric base
peak iminium cations at m/z 126. GC–MS System 1. ................................................................ 76
Figure 27. Chemical ionization mass spectra (CI-MS) for Compounds 1–4. GC–MS System 2. 79
Figure 28. MS/MS product ion spectra for the four regioisomeric m/z 126 base peak iminium

xiii
cations of the aminoketones. ..................................................................................................... 81
Figure 29. EI-MS and product ion spectra for the methyl side-chain pyrrolidine isomer and the
2,2,5,5-D4-pyrrolidine analogue. ............................................................................................... 85
Figure 30. EI-MS and product ion spectra for the methyl side-chain piperidine derivative. ........ 88
Figure 31. EI-MS and product ion spectra for the methyl group side-chain D10-piperidine
derivative. ................................................................................................................................. 89
Figure 32. EI-MS and product ion spectra for the n-propyl side-chain isomer for the azepane
series. ........................................................................................................................................ 92
Figure 33. EI-MS and product ion spectra for the D8-labeled n-propyl side-chain analogue of the
azepane series. .......................................................................................................................... 93
Figure 34. Representative EI-MS (GC–MS System 1) and CI-MS (GC–MS System 2) spectra for
Compound 6.............................................................................................................................. 97
Figure 35. MS/MS product ion spectra for the four regioisomeric m/z 126 base peak iminium
cations of the desoxy phenethylamines. GC–MS System 2. ..................................................... 100
Figure 36. Vapor phase IR spectra (GC–IR) for the four regioisomeric aminoketones
(Compounds 1–4) and the four regioisomeric desoxyamines (Compounds 5–8). ..................... 105
Figure 37. Representative example of vapor phase IR spectra (GC–IR) for the intermediate
regioisomeric ketones. A: 1-(3,4-methylenedioxyphenyl)-2-pentanone; B: 1-(3,4-
methylenedioxyphenyl)-1-pentanone. ...................................................................................... 106
Figure 38. GC separation of the compounds in this study. A: Compounds 1 and 2; B: Compounds
3 and 4. Rtx®-5 stationary phase. ............................................................................................. 111
Figure 39. GC separation of the intermediate ketones. A: valerophenone and isovalerophenone;
B: 3,4-methylenedioxyvalerophenone and 3,4-methylenedioxyisovalerophenone. Rtx®-5
stationary phase. ...................................................................................................................... 112
Figure 40. Full scan EI-MS spectra for Compounds1–4 (Flakka, iso-Flakka, MDPV and iso-
MDPV). GC–MS System 1. .................................................................................................... 115
Figure 41. Chemical ionization mass spectra (CI-MS) for Compounds 1–4. GC–MS System 2.
............................................................................................................................................... 118
Figure 42. MS/MS product ion spectra for the m/z 126 iminium cation base peak for A: alpha-
PVP (Compound 1); B: iso-alpha-PVP (Compound 2). ........................................................... 120
Figure 43. MS/MS product ion spectra for the m/z 126 iminium cation base peak for A: MDPV

xiv
(Compound 3); B: iso-MDPV (Compound 4). ......................................................................... 121
Figure 44. Mass spectra for the 2,2,5,5-D4-pyrrolidine ring analogue of Compound 1. A: EI-MS
full scan; B: product ion spectrum for the m/z 130 iminium cation. ......................................... 123
Figure 45. Mass spectra for the 2,2,5,5-D4-pyrrolidine ring analogue of Compound 2. A: EI-MS
full scan; B: product ion spectrum for the m/z 130 iminium cation. ......................................... 125
Figure 46. Mass spectra for the D7-isopropyl side-chain analogue of Compound 2. A: EI-MS full
scan; B: product ion spectrum for the m/z 133 iminium cation. ............................................... 127
Figure 47. Vapor phase infrared spectra for Compounds 1–4 (Flakka, iso-Flakka, MDPV and iso-
MDPV). .................................................................................................................................. 129
Figure 48. Capillary gas chromatographic separation of the four regioisomeric intermediate
ketones on Rxi®-17Sil MS stationary phase. GC–MS System 1. .............................................. 133
Figure 49. Capillary gas chromatographic separation of the aminoketones and their desoxy
analogues on Rtx®-1 stationary phase. GC–MS System 2 (CI technique). ................................ 134
Figure 50. Capillary gas chromatographic separation of the aminoalcohol analogues on Rxi®-
17Sil MS stationary phase. GC–MS System 1. ........................................................................ 135
Figure 51. A: CI-MS, B: EI-MS and C: MS/MS spectra for the aminoalcohol analogue of the
2,3-methylenedioxy substituted isomer. ................................................................................... 139
Figure 52. A: CI-MS, B: EI-MS and C: MS/MS spectra for the aminoalcohol analogue of the
3,4-methylenedioxy substituted isomer. ................................................................................... 140
Figure 53. CI-MS, B: EI-MS and C: MS/MS spectra for the desoxy analogue of the 2,3-
methylenedioxy substituted isomer. ......................................................................................... 142
Figure 54. A: CI-MS, B: EI-MS and C: MS/MS spectra for the desoxy analogue of the 3,4-
methylenedioxy substituted isomer. ......................................................................................... 144
Figure 55. Vapor phase IR spectra for the aminoalcohol analogues (Compounds 3 and 4). ...... 145
Figure 56. Vapor phase IR spectra for the desoxy phenethylamine analogues (Compounds 5 and
6). ........................................................................................................................................... 146
Figure 57. Capillary gas chromatographic separation of the nine regioisomeric and homologous
monomethoxyphenyl-ketones on Rtx®-1 stationary phase. GC–MS System 1.......................... 150
Figure 58. GC separation of the nine compounds in this study. A: Compounds 1, 2 and 3; B:
Compounds 4, 5 and 6; C: Compounds 7, 8 and 9. Rtx®-5 stationary phase. GC–MS System 1.
............................................................................................................................................... 152

xv
Figure 59. Representative full scan EI-MS spectra for the intermediate ketones: a, e and i. GC–
MS System 1. .......................................................................................................................... 154
Figure 60. Representative methanol CI mass spectra for Compounds 1, 5 and 9. GC–MS System
2. ............................................................................................................................................. 156
Figure 61. Representative full scan EI-MS spectra for Compounds 1, 5 and 9. GC–MS System 1.
............................................................................................................................................... 158
Figure 62. Product ion MS/MS spectra for iminium cation base peaks of Compounds 1, 5 and 9.
GC–MS System 2.................................................................................................................... 161
Figure 63. Vapor phase IR spectra of the regioisomeric methoxyaminoketones with n-propyl
side-chain. ............................................................................................................................... 163
Figure 64. Vapor phase IR spectra of 4-methoxybenzaldehyde, 4-methoxypropiophenone, and 4-
methoxyaminoketone. ............................................................................................................. 165
Figure 65. Capillary gas chromatographic separation of the six intermediate regioisomeric
dimethoxyphenylketones. GC–MS System 1. Rxi®-17Sil MS stationary phase. ....................... 169
Figure 66. Capillary gas chromatographic separation of the six regioisomeric
dimethoxyphenylaminoketones. GC–MS System 1. Rxi®-17Sil MS stationary phase. ............. 170
Figure 67. A: CI-MS, B: EI-MS and C: MS/MS spectra for the representative 2,5-dimethoxy
substituted isomer (Compound 3). ........................................................................................... 173
Figure 68. Vapor phase IR spectra (GC–IR) for the six regioisomeric
dimethoxyphenylaminoketones. .............................................................................................. 178
Figure 69. Representative vapor phase IR spectra (GC–IR) of the precursor 2,5-
dimethoxybenzaldehyde and the intermediate 2,5-dimethoxyvalerophenone (Compound c). ... 179

xvi
List of Schemes
Scheme 1. Chemical structure of natural cathinone (A) and the general structure for the synthetic
cathinones (B) [Valente et al, 2014]. ...........................................................................................9
Scheme 2. Cathinone phase I metabolism (reduction) [Brenneisen et al, 1986]. ......................... 12
Scheme 3. Mephedrone phase I metabolic pathways determined in rat and human urine [Meyer
et al, 2010b]. ............................................................................................................................. 13
Scheme 4. Phase II metabolites of mephedrone, (A): Acetylation, (B): Glucuronidation [Khreit
et al, 2013]. ............................................................................................................................... 13
Scheme 5. Phase I metabolism of methylone and ethylone [Kamata et al, 2006; Zaitsu et al,
2009]......................................................................................................................................... 14
Scheme 6. Proposed phase I metabolism of α-PVP and MDPV [Meyer et al, 2010a; Sauer et al,
2009]......................................................................................................................................... 15
Scheme 7. Proposed EI-MS fragmentation pathway for MDPV [Westphal et al, 2009]. ............. 22
Scheme 8. Molecular regions for designer modification in cathinone bath salts. ........................ 30
Scheme 9. General synthesis for the six regioisomeric and homologous derivatives of MDPV. . 37
Scheme 10. Alternative synthesis for the intermediate 3,4-methylenedioxyphenyl ketones. ....... 37
Scheme 11. Synthesis of 2,3-methylenedioxybenzaldehyde. ...................................................... 38
Scheme 12. Structures of the major fragment ions in the mass spectra of the six regioisomeric
and homologous methylenedioxyphenyl-aminoketones in this study. ........................................ 43
Scheme 13. General synthetic scheme for the four cyclic tertiary amines and side-chain
regioisomers of MDPV. ............................................................................................................ 63
Scheme 14. General synthetic scheme for the desoxy phenethylamines with desoxy-MDPV as
example. ................................................................................................................................... 64
Scheme 15. Alternative synthetic scheme for the intermediate ketones of the desoxy
phenethylamines with 3,4-methylenedioxyphenyl-2-pentanone as example. .............................. 65

xvii
Scheme 16. Fragmentation scheme for MS/MS product ion formation in the methyl side-chain
D10-piperidine analogue. ........................................................................................................... 90
Scheme 17. Fragmentation scheme for MS/MS product ion formation in the n-propyl side-chain
D8-azepane analogue. ................................................................................................................ 94
Scheme 18. General synthetic scheme for the six target compounds in this study. ................... 132
Scheme 19. General synthetic scheme for the nine target compounds in this study. ................. 149
Scheme 20. General synthetic scheme for the six dimethoxypyrovalerones in this study. ......... 168

xviii
List of Abbreviations
MDPV 3,4-methylenedioxypyrovalerone
MS Mass spectrometry
IR Infrared
MW Molecular weight
GC–MS Gas chromatography–mass spectrometry
NDIC National Drug Intelligence Center
4-MMC 4-methylmethcathinone
4-FMC 4-fluoromethcathinone
MDMC 3,4-methylenedioxy-N-methylcathinone
EMCDDA European Monitoring Center for Drugs and Drug Addiction
CNS Central nervous system
MPPP 4-methyl- α-pyrrolidinopropiophenone
MOPPP 4-methoxy- α-pyrrolidinopropiophenone
3,4-DMMC 3,4-dimethylmethcathinone
α-PVP α-pyrrolidinovalerophenone
NPS New psychoactive substances
UNODC United Nations Office on Drugs and Crime
AAPCC American Association of Poison Control Centers
DEA Drug Enforcement Administration

xix
MDPPP 3',4'-methylenedioxy-α-pyrrolidinopropiophenone
MDPBP 3',4'-methylenedioxy-α-pyrrolidinobutiophenone
NRG-1 (Neuregulin-1)
BBB Blood-brain barrier
MDMA Methylenedioxymethamphetamine
CYP2D6 Cytochrome- P450 (2D6)
LC–MS Liquid chromatography–mass spectrometry
COMT Catechol O-methyltransferase
MAO Monoamine oxidase
DAT Dopamine transporter
NET Norepinephrine transporter
SERT Serotonin transporter
LC–MS/MS Liquid chromatography–mass spectrometry/mass spectrometry
LC–HR-MS Liquid chromatography–high‐resolution-mass spectrometry
m/z Mass/charge ratio
EI Electron ionization
eV Electron volt
GC–MS/MS Gas chromatography–mass spectrometry/mass spectrometry
GC–IR Gas chromatography–infrared
EI-MS Electron ionization-mass spectrometry
cm-1 Centimeter (wavenumber)
NMR Nuclear magnetic resonance
D Deuterium

xx
[M+H]+ Protonated molecular ion
TLC Thin layer chromatography
cm Centimeter
µm Micrometer
nm Nanometer
DMF Dimethylformamide
°C Degree centigrade
m Meter
mm Millimeter
i.d. Internal diameter
CI-MS Chemical ionization-mass spectrometry
MS-MS Mass spectrometry-mass spectrometry
GC–CI-MS Gas chromatography–chemical ionization-mass spectrometry
CI Chemical ionization
Da Dalton
AMD Automated Method Development
P-2-P 1-phenyl-2-propanone
P-1-P 1-phenyl-1-propanone
LAH Lithium aluminum hydride
DMPV Dimethoxypyrrovalerone
HPLC High-performance liquid chromatography
THF Tetrahyrdofuran
s Second
xxi
ml Milliliter
psi Pound-force per square inch
µl Microliter
IRD-3 Infrared detector-Model 3
f.d. Film depth
TP Temperature program
mol Mole
N Normal (normality)

1
1. Review of relevant literature
1.1. Introduction
Cathinone is a major naturally occurring psychoactive substance found in the leaves of Catha
edulis plant, commonly known as khat. For centuries, “khat sessions” have played a very important
role in the social and cultural traditions around Saudi Arabia and most East African countries. The
identification of cathinone (a Schedule I controlled substance) as the main psychoactive
component of the khat leaves with amphetamine like pharmacological effects has led to the
synthesis of several derivatives, which are structurally similar to this so-called natural
amphetamine [Valente et al, 2014].
The first cathinone derivatives were originally synthesized at the beginning of the 20 th
century for therapeutic purposes. However, the recreational use of these synthetic compounds only
gained public attention in the last decade [Kelly, 2011]. These cathinones emerged in the
recreational drug markets as legal alternatives (“legal highs”) to amphetamine and cocaine. They
are included in a large group of psychoactive substances generally designated by “legal highs”.
These derivatives are abused indiscriminately for their cocaine and amphetamine-like effects.
Furthermore, these synthetic cathinones are typically marketed as “bath salts” or “plant food” and
are sold under various names (Ivory Wave, Blizzard, etc.) labeled “not for human consumption”
in order to bypass legislative restrictions in several countries [Bretteville-Jensen et al, 2013; Fass
et al, 2012; Van Hout and Brennan, 2011].

2
Based on a report from The National Drug Intelligence Center (U. S. Department of
Justice), there has been a significant increase in the production, distribution and use of synthetic
cathinones or “bath salt” drugs across the U. S. and abroad over the past several years [U. S. DOJ-
NDIC, 2011]. The synthetic cathinones that have appeared in clandestine samples to date include
a number of aromatic aminoketones (shown in Figure 1) such as 3,4-methylenedioxypyrovalerone
(MDPV), 4-methylmethcathinone (mephedrone, 4-MMC), N-methylcathinone (also known as
methcathinone, ephedrone or CAT), 4-fluoromethcathinone (also known as flephedrone or 4-
FMC), and 3,4-methylenedioxy-N-methylcathinone (also known as methylone, MDMC, β-keto
MDMA, or M1). These drugs are also structurally related to several Schedule IV and V
prescription drugs including bupropion (Zyban®, Wellbutrin®), diethylpropion (Tenuate®), and
pyrovalerone (Centroton®) [German et al, 2014; Lewin et al, 2014; Katz et al, 2014].
Ephedrone and mephedrone were the first two derivatives to be produced by the
pharmaceutical industry in the late 1920’s. Recently, mephedrone, methylone and MDPV rapidly
emerged in recreational drug markets as the main ingredients of “bath salts”. These were generally
sold in retail establishments such as adult stores, independently owned convenience stores, gas
Figure 1. Structures of common cathinone/bath salts reported in recent forensic samples and their
similarity to Schedule IV and V prescription drugs.

3
stations, head shops, and smart shops. The synthetic cathinone products, as well as their synthetic
precursors, are also sold on many Internet sites, including popular Internet auction sites [Valente
et al, 2014].
By the end of 2011, MDPV, mephedrone and methylone were provisionally scheduled in
the United States under drug legislation for further analysis of their potential harm. Nonetheless,
the legal control of these substances like cathinones is hard to attain success since they are easily
replaced by novel compounds by minor structural modifications, which consequently leads to new
and powerful analogues reaching the licit drug market [Jerry et al, 2012; Kelly, 2011; Prosser and
Nelson, 2012]. The 2018 European Drug Report describes the synthetic cathinones as the second
largest group of new substances monitored by The European Monitoring Center for Drugs and
Drug Addiction (EMCDDA), with a total of 130 different substances identified from 2008–2018
in clandestine drug samples [EMCDDA, 2018].
1.2. Historical background
Khat is a flowering evergreen plant that grows in Africa and the southwestern of Arabian
Peninsula. For centuries, the chewing of fresh khat leaves for their stimulant effects has been a
tradition in cultural ceremonies at the so-called khat sessions [Balint et al, 2009]. The fresh leaves
contain over 40 compounds, including alkaloids, tannins, flavonoids, vitamins and minerals [Cox
and Rampes, 2003]. In the first attempts to identify the active constituents of khat, the psychoactive
compound named katin was detected by [Fluckiger and Gerock, 1887] which was later identified
by [Wolfes, 1930] as (+)-norpseudoephedrine and commonly named cathine in the next decades.
Cathine was believed to be the main active component of khat even though it was not sufficient
for the stimulant effect of khat. A β-keto analogue of cathine (cathinone) was isolated in the United

4
Nations’ Narcotics Laboratory [UN, 1975] and early studies demonstrated that cathinone is 10-
fold more potent than cathine and undergoes degradation rapidly which, explains the chewing of
fresh leaves [Kalix and Khan, 1984].
Methcathinone (ephedrone, EPH) and 4-methylmethcathinone (mephedrone, MEPH) were
synthesized by optimized methods in 1928/1929 in a study attempting to prepare a series of
ephedrine homologues [Hyde et al, 1928]. These derivatives as well as other analogues were
developed for therapeutic purposes due to their CNS stimulant effects [Canning et al, 1979].
However, due to their addictive potential (especially EPH) with cocaine-like stimulant effect, this
has led to the abuse of EPH in the former Soviet Union and later in the U. S. [Young and Glennon,
1993; Emerson and Cisek, 1993]. Several cases of intoxications have been reported in the early
1990’s which typically manifest as a Parkinsonism-like syndrome induced by manganese ingestion
[Iqbal et al, 2012; Varlibas et al, 2009]. This is attributed to the easy synthesis of ephedrone at
home through the oxidation of available pharmaceuticals that contain ephedrine or
pseudoephedrine by potassium permanganate in the presence of acetic acid. In 1996, methylone
was synthesized as an antidepressant but it never reached the legitimate pharmaceutical market
[Dal Cason et al, 1997]. 4-Methyl-α-pyrrolidinopentanophenone (pyrovalerone) was synthesized
in the 1970’s for clinical use to treat obesity and chronic fatigue [Gardos and Cole, 1971] and was
withdrawn due to its strong addiction potential [Sauer et al, 2009]. Unlike pyrovalerone, other
psychoactive substances from the pyrrolidinophenone family such as 4-methyl- α-
pyrrolidinopropiophenone (MPPP), 4-methoxy- α-pyrrolidinopropiophenone (MOPPP) and
MDPV were never intended for clinical use [Peters et al, 2005].

5
Recreationally, the first-generation cathinones sold on the black market includes
methylone in the mid-2000’s under the name of explosion, first in Netherlands and Japan, and later
in Australia and New Zealand [Zaitsu et al, 2011]. Mephedrone was first identified in Finland in
2008 and reported to The European Monitoring Center for Drugs and Drug Addiction (EMCDDA),
another five synthetic cathinones were reported beside MEPH in 2008 [EMCDDA-Europol, 2009].
The fluorinated derivatives flephedrone and 3-fluoromethcathinone were the next to reach the
black market in 2009, followed by butylone (β-keto-N-methylbenzodioxolylbutanamine) and
ethylone (3,4-methylenedioxy-N-ethylcathinone) and finally MDPV [Archer, 2009; EMCDDA-
Europol, 2009].
Due to the continuous search for new, legal and more powerful highs by the drug users, the
synthesis of novel cathinone derivatives became a fruitful industry leading to the rapid emergence
of new alternative derivatives every year. The first of the second-generation derivatives to be
reported was naphyrone in 2010 by EU early-warning system (EMCDDA-Europol, 2011]. The
third-generation cathinones such as 3,4-dimethylmethcathinone (3,4-DMMC) and α-
pyrrolidinovalerophenone (α-PVP) started to show up at the same time [EMCDDA-Europol, 2010,
2011]. In 2017, 12 new cathinone derivatives were reported for the first time [EMCDDA, 2018].
Figure 2 summarizes the time line of the main events related to the khat plant and synthetic
cathinones.

6
1.3. Prevalence, patterns of use and legal status
The majority of khat consumers are located in Yemen and many East African countries like
Somalia and Ethipoia [Al-Mugahed, 2008]. The use of khat leaves has been local to where these
plants grow. However, improving distribution routes has led to the distribution of the leaves in
Europe and U. S. and their costs depend on the freshness of these leaves [Alem et al, 1999; Klein
et al, 2012].
In 1993, cathinone was placed into Schedule I of the Controlled Substance Act. Khat’s
legal status is often challenging and depends on the detectable amounts of cathinone. Currently,
khat is illegal in U. S. and Canada and was banned in several European countries [Gezon, 2012].
In Europe, over 150 new psychoactive substances (NPS) were reported to the EMCDDA from
Figure 2. The major historical events associated with khat and synthetic cathinone derivatives
[Valente et al, 2014].

7
2005 to 2011, 34 were synthetic cathinones [EMCDDA-Europol, 2011]. Cathinone analogues
together with cannabinoids represent two-thirds of these NPS that are included in a large group of
so-called “legal highs” [EMCDDA, 2012]. The rapid proliferation of new psychoactive substances
has led to the development of drug analogue laws attempting to control unspecified drug molecules
not yet known to exist. In a recent report from The United Nations Office on Drugs and Crime,
approximately 650 new psychoactive substances have been reported by 102 countries and
territories since 2008 [UNODC, 2016]. Additionally, by the end of 2017, the EMCDDA was
monitoring more than 670 new psychoactive substances that have been identified in Europe
[EMCDDA, 2018]. A total of 75 new psychoactive substances appearing for the first time in 2015
according to the 2016 World Drug Report [UNODC, 2016]. This represents an increase from the
66 new psychoactive substances from clandestine samples reported during the previous year. A
total of 20 of these first time reports in 2015 represented new synthetic cathinone derivatives and
for the first time in history, the number of new synthetic cathinones rivaled the number of reported
new synthetic cannabinoids, 20 and 21 respectively. In previous years (2012–2014), the vast
majority of first time reports were for synthetic cannabinoids.
Bath salts are sold under a variety of brand names such as, Bloom, Blue Silk, Ivory Wave,
Purple Wave and Vanilla Sky. They are purchased locally at head or smart shops or readily
accessible and technically legal over the Internet [Coppola and Mondola, 2012]. Most of these
allegedly legal substances are actually composed by previously banned compounds like MDPV,
methylone and mepherdone [Brandt et al, 2010a]. These cathinones are commonly sold in the form
of white or yellowish powder or in capsules [Karila and Reynaud, 2011]. MDPV is commonly
available as white light tan powder and reported to have a slight odor (potato-like odor) upon
exposure to air [Gorun et al, 2010].

8
The main routes for administration of these substances include ingestion either by
swallowing capsules or swallowing powder wrapped in cigarette paper [Deluca et al, 2009] and
nasal insufflation [Lindsay and White, 2012]. Other routes such as inhalation, intravenous injection
and sublingual delivery have been also reported [Mas-Morey et al, 2012].
Even though statistics on the prevalence of synthetic cathinones use in the U. S. are limited.
However, recent data from The American Association of Poison Control Centers (AAPCC)
reported a significant increase in calls related to bath salts from 2010 (304 calls) to 2011 (6136
calls) [AAPCC, 2013] and these numbers are comparable to the statistics from the UK [Spyker et
al, 2012].
It is important to note that the legal status of the synthetic cathinones vary greatly from
country to country and even among states and this status is always changing based on new findings
related to possible risks for public safety. Until the fourth trimester of 2011, the synthetic
cathinones were unscheduled in the U. S. However, on October 21, 2011, the Drug Enforcement
Administration scheduled MDPV, methylone and mephedrone under the Schedule I of Controlled
Substances Act temporarily and later on, these three derivatives were permanently banned in the
U. S. [DEA, 2011, 2012; Bretteville-Jensen et al, 2013]. Despite this recent scheduling as
controlled substances within the U. S. and other countries, these derivatives, which are labeled and
sold as bath salt products, are still on the market. This is attributed to the lack of information,
reliability and consistency on the chemical composition of these products. Additionally, since the
law is always a step behind, several new cathinone derivatives keep emerging in the recreational
markets every year to avoid legal detection [Valente et al, 2014].

9
1.4. Chemistry
The synthetic cathinones are phenylalkylamine derivatives which are closley related to
amphetamines except the ketone group being introduced at the β-position of the amino group.
Therefore, these derivatives are often entitled β-keto amphetamines [Zaitsu et al, 2011]. These
cathinones are analogues of the natural cathinone and they are synthesized by adding different
substituents at different locations of the basic cathinone molecule as illustrated in Scheme 1.
This group of psychoactive compounds can be chemically separated into four families (see
Figure 3). The fisrt analogues were those synthesized for therapeutic purposes including N-
alkylated derivatives at R1 and/or R2 and in some cases alkyl or halogen substituents at R3. The
3,4-methylenedioxy group [Dal Cason, 1997] can be added to the aromatic ring to make another
family of these cathinones which are structurally related to 3,4-methylenedioxymethamphetamines
[Zaitsu et al, 2011]. Another group of these synthetic cathinones is the derivatives of α-PPP which
is characterized by a pyrrolidinyl substitution at the nitrogen atom [Westphal et al, 2007]. A
combination of 3,4-methylenedioxy group and the pyrrolidinyl group produces the next family of
synthetic cathinones which include MDPV, MDPPP (3',4'-methylenedioxy-α-
pyrrolidinopropiophenone) and MDPBP (3',4'-methylenedioxy-α-pyrrolidinobutiophenone)
[Kelly, 2011]. A unique structural characteristic has been reported in NRG-1 (Neuregulin-1)
Scheme 1. Chemical structure of natural cathinone (A) and the general structure for the synthetic
cathinones (B) [Valente et al, 2014].
10
products, which contain naphyrone [Brandt et al, 2010b] with its two isomeric forms (α-naphyrone
and β-naphyrone).
1.5.Pharmacokinetics
Cathinone is the main active alkaloid in the khat plant and it was found that 100 g of fresh
leaves have 78-343 mg of cathinone [Klein et al, 2012; Sakitama et al, 1995]. After half an hour
of chewing khat leaves, the psychostimulant effects start to appear and last approximately 3 hours
[Brenneisen et al, 1990]. Around 60 % of cathinone is absorbed from the oral mucosa, and further
absorption occurs in the stomach and small intestine [Arunotayanun and Gibson, 2012]. The
Figure 3. The chemical structures of the various synthetic cathinone derivatives with diverse
substituents at R1–R4 positions [Valente et al, 2014].

11
ingested dose of cathinone is mainly eliminated as cathine and norephedrine metabolites
[Brenneisen et al, 1986] with less than 7 % appearing unchanged in the urine.
The doses of synthetic cathinones vary among different derivatives and depend on the
potency and route of administration [Prosser and Nelson, 2012]. Furthermore, the variable contents
of the purchased bath salts, concentration and purity are also important factors that make the
pharmacokinetics and pharmacodynamics unpredictable [Davies et al, 2010]. Structurally, the
presence of β-keto group in cathinones increases the polarity of these compounds and thus,
decreases their ability to cross the blood-brain barrier (BBB) [Schifano et al, 2011] and their
potency compared to non-keto derivatives for example, methylone and MDMA, respectively
[Cozzi et al, 1999]. The polarity issue occurs mainly in the N-alkylated derivatives and to less of
an extent with the pyrrolidine substituted cathinones since the pyrrolidine ring greatly reduces the
polarity of these derivatives [Coppola and Mondola, 2012]. This polarity issue is not the only
factor that affects the transfer of these cathinones across the BBB, derivatives such as MDPV,
methylone, ephedrone and mephedrone were reported to exhibit higher permeability (with MDPV
being the highest) across the BBB and evidences show that these derivatives are actively
transported into the brain via specific influx carriers [Simmler et al, 2013].
Like all synthetic cathinones, the natural cathinone undergoes phase I metabolism, which
is the reduction of β-keto group into alcohol by the liver microsomal enzymes [Brenneisen et al,
1986] to yield cathine and norephedrine as shown in Scheme 2. It has been reported that the
metabolism was determined to be stereoselective with the S-(–)-cathinone being primairly

12
metabolized to norephedrine, while R-(+)-cathinone reduced into cathine [Mathys and Brenneisen,
1992].
This stereoselective reduction was also reported to proceed in synthetic derivatives like
ephedrone yielding ephedrine [Sparago et al, 1996] which will further undergo N-demethylation
to yield norephedrine [Paul and Cole, 2001]. Mephedrone can undergo phase I oxidation besides
the N-demethylation (see Scheme 3). The methyl group on the phenyl ring can be oxidized to yield
an alcohol, which upon oxidation yields a carboxylic acid followed by reduction at the β-keto
group. It has been found that CYP2D6 is the main enzyme responsible for phase I metabolism of
mephedrone [Pedersen et al, 2013]. The N-demethylation product of mephedrone can be either
oxidized at the methyl group or reduced at the β-keto group [Meyer et al, 2010b].
Scheme 2. Cathinone phase I metabolism (reduction) [Brenneisen et al, 1986].

13
A recent in vitro method using LC–MS to identify phase I and II metabolites of
mephedrone has been reported [Khreit et al, 2013] and it characterized seven phase II metabolites
which resulted from the acetylation and/or glucuronidation as shown in Scheme 4.
Scheme 3. Mephedrone phase I metabolic pathways determined in rat and human urine [Meyer et
al, 2010b].
Scheme 4. Phase II metabolites of mephedrone, (A): Acetylation, (B): Glucuronidation [Khreit et
al, 2013].

14
The metabolism of the 3,4-methylenedioxy N-alkylated cathinones like methylone and
ethylone has been characterized [Kamata et al, 2006] and they exhibit three pathways shown in
Scheme 5. The minor N-dealkylation pathway, the reduction of β-keto group and finally, the
conversion of methylenedioxy group to the corresponding catechol (demethylenation) followed by
O-methylation mediated by catechol O-methyltransferase (COMT). The phase II metabolism is
likely the glucuronidation and sulfonation of the alcohol group [Shima et al, 2009].
The pyrrolidine derivatives such as MDPV have been reported to undergo reduction of the
β-keto group as well as the formation of catechol and methoxy catechol pyrovalerone as the main
metabolites [Strano-Rossi et al, 2010]. Another study proposed further biotransformation for α-
PVP and MDPV [Meyer et al, 2010a]. It involves the degradation of the pyrrolidine ring and the
formation of the primary amine. It also involves hydroxylation of the side-chain and the 2-position
of the pyrrolidine ring followed by dehydrogenation and subsequent ring opening and oxidation
Scheme 5. Phase I metabolism of methylone and ethylone [Kamata et al, 2006; Zaitsu et al, 2009].

15
of the aldehyde (see Scheme 6). The phenyl ring of α-PVP can be hydroxylated at 4-position [Sauer
et al, 2009]. This hydroxylated product along with previous hydroxyl containing metabolites can
undergo phase II metabolism. Flephedrone has been reported [Meyer et al, 2012; Pawlik et al,
2012] to undergo similar phase I metabolic reactions to α-PVP which include hydroxylation of the
phenyl ring, β-keto reduction and N-demethylation to yield a primary amine. However, a slower
metabolic transformation is predicted due to the stability of this compound, which results from
fluorination and the resistance of C-F bond to the enzymatic cleavage [Westphal et al, 2010].
Scheme 6. Proposed phase I metabolism of α-PVP and MDPV [Meyer et al, 2010a; Sauer et al,
2009].

16
1.6. Pharmacodynamics
The designation of “natural amphetamine” given to cathinone is attributed to the structural
similarity between cathinone and amphetamine, and the amphetamine-like subjective effects of
khat [Kalix, 1992]. Cathinone is the β-keto analogue of amphetamine, while its metabolites are
structurally related to norepinephrine. Like amphetamine, cathinone has both CNS stimulant and
sympathomimetic effects and early pharmacological reports [Kalix 1983; Kalix and Braenden,
1985] on khat leaves demonstrated that cathinone and its metabolites can induce an amphetamine-
like dopamine release with cathinone being the most potent. This higher potency is the
consequence of the lipophilic character and favorable CNS penetration of cathinone compared to
its metabolites [Kalix, 1991]. In regards to the peripheral effects, administration of cathinone or
chewing khat results in sympathomimetic syndrome which is characterized by increased heart rate
and blood pressure, mydriasis and hyperthermia. These effects suggest that cathinone induces the
release of catecholamines at nerve endings in a similar manner to amphetamine [Kalix, 1992].
Similar to amphetamine, the methyl group at the α-position of the amino group prevents
the inactivation of cathinone and its metabolites by monoamine oxidase (MAO) [Siegel et al,
1999]. Additionally, it has been reported that cathinone displays a greater inhibition of MAO than
amphetamine and has a higher selectivity to MAO-B [Nencini et al, 1984; Osorio-Olivares et al,
2004]. This inhibition results in a decrease in dopamine degradation and consequently, the synaptic
accumulation of this catecholamine.
Due to the limited information on the pharmacology of these “legal highs” including
synthetic cathinones, research regarding these cathinones usually tend to compare the subjective
effects with similar drugs like amphetamine and cocaine. In fact, synthetic cathinones and

17
amphetamines were reported to induce their effects by interacting with membrane monoamine
transporters, which includes the dopamine transporter (DAT), norepinephrine transporter (NET)
and serotonin transporter (SERT) leading to a higher concentration of these biogenic amines in the
synaptic cleft [Baumann et al, 2012; Cameron et al, 2013]. The different affinity and selectivity of
these cathinones toward the monoamine transporters produce a complex array of adrenergic and
serotonergic effects. When interacting with monoamine membrane transporters, drugs can be
classified as either substrates (translocated into cells where they disrupt vesicular storage and
stimulate non-exocytotic release of neurotransmitters by reversing the normal direction of trans-
porter flux), like amphetamines, or blockers like cocaine (inhibit the reuptake of the
neurotransmitters) [Baumann et al, 2013a].
Recent studies with different in vivo and in vitro models showed that synthetic cathinones
act as inhibitors for all catecholamine transporters and as monoamine releasers as well. However,
the selectivity to these transporters vary among these derivatives. In contrast, MDPV (similarly,
α-PVP) was reported to induce powerful cocaine-like effects. It acts as a pure monoamine-selective
transporter blocker with higher potency for DAT and NET and lower potency for SERT in
comparison to cocaine. Unlike amphetamine, these two derivatives (α-PVP and MDPV) do not
promote monoamine release. As mentioned early, these cathinones have demonstrated a high
permeability to an in vitro blood-brain barrier model with MDPV expressing a very high
permeability [Baumann et al, 2012; Baumann et al, 2013a; Baumann et al, 2013b; Simmler et al,
2013].

18
1.7. Physiological and toxicological effects in animal studies
Several animal studies showed that the synthetic cathinones induce a dose-dependent
hyperlocomotion (hyperactivity) especially MDPV [Lopez-Arnau et al, 2012; Marusich et al,
2012]. Some derivatives were implicated in cognitive processes [Wright et al, 2012], while others
affected thermoregulation [Shortall et al, 2013]. Abuse liability and reinforcing properties of
synthetic cathinones were supported by animal studies. MDPV was confirmed for its ability to
induce self-administration patterns [Aarde et al, 2013a; Motbey et al, 2013]. Few cardiovascular
and neurotoxic studies have been reported, and these are related to mephedrone, which
demonstrated significant increase in heart rate, blood pressure and cardiac contractility [Meng et
al, 2012] and significant toxic effects on dopaminergic nerve endings [Sparago et al, 1996].
1.8. Subjective effects and adverse toxic reactions
Chewing khat is characterized by rapid onset of psychostimulant effects [Alem et al, 1999;
Dhaifalah and Santavy, 2004], which include increased energy, excitements, and sense of euphoria
as described by users. Additionally, stimulant effects such as improved sense of alertness,
enhanced self-esteem, and increased ability to concentrate, associate ideas and communicate have
been also described by users, which contributes to the social character of this tradition. Long-term
consumption of khat was reported to be associated with severe conditions like tooth decay,
periodontal disease, oral cancer, acute and chronic liver disease, and cirrhosis as well as
gastrointestinal disorders. Similar withdrawal symptoms to amphetamine and cocaine were
reported. They include insomnia, lack of concentration and depression [Al-Motarreb et al, 2002;
Fasanmade et al, 2007; Roelandt et al, 2011]. Severe cardiac, neurological, psychological and
gastrointestinal complications are common following chronic use of khat and synthetic cathinones
[Chapman et al, 2010; Corkery et al, 2011]. Subjective effects may vary among synthetic

19
cathinones and they generally include desired effects [Yohannan and Bozenko Jr, 2010] such as
mild euphoria, increased empathy, decrease sense of insecurity and hostility and increased libido.
Several unwanted subjective effects have been also reported, which include nausea and vomiting,
headaches, vertigo, dizziness, palpitations and tremor, muscle twitching, confusion and impaired
short-term memory, tachycardia and hypertension, anhedonia, depression with suicidal ideations,
psychosis, tolerance and dependence [Bentur et al, 2008; Sammler et al, 2010; Coppola and
Mondola, 2012].
Bath salts induced intoxication usually involves hallucinations, paranoia, panic attacks,
aggressiveness, agitation, chest pain and seizures, hyponatremia and hyperthermia, acute liver
failure, kidney injury and symptoms related to serotonin syndrome [AAPCC, 2013; James et al,
2011; Wood et al, 2010; Warrick et al, 2012]. Some of these side effects are associated with
particular derivatives for example, hyperthermia is commonly associated with MDPV [Garrett and
Sweeney, 2010; Levine et al, 2013]. The specific combination of these effects as well as their
intensity and severity vary with each cathinone derivative.
1.9. Analytical detection of synthetic cathinones
The structural diversity of synthetic cathinones and the rapid appearance of new analogues
of these cathinones present a practical limitation for traditional immunoassays (limitation for
immunogen design and ultimately antibody-based screening), suggesting that either
chromatographic or mass spectrometry-based screening techniques may be more appropriate. This
limitation is attributed to the fact that the detection of synthetic cathinones using amphetamine
immunoassays are often negative (Swortwood et al, 2014), results are highly variable between
manufacturers (Regester et al, 2015) and cross reactivity for some synthetic cathinones may occur

20
with traditional amphetamine, methamphetamine or MDMA immunoassays (Toennes and Kauert,
2002; Truscott et al, 2013; de Castro et al, 2014). Confirmation of unknown drugs using
hyphenated mass spectroscopic techniques such as gas chromatography–mass spectrometry (GC–
MS) or liquid chromatography–mass spectrometry (LC–MS) rely upon reproducible
chromatographic separation (retention time) and characteristic fragmentation (mass spectra).
1.9.1. Analytical detection of synthetic cathinones using GC–MS and LC–MS
GC–MS is the main tool used for the detection and identification of unknown drugs in
forensic and other drug screening laboratories because of its excellent separation and identification
abilities. LC–MS is a non-destructive exact mass determination technique. It utilizes chemical
ionization to identify the molecular ion of drugs or their metabolites. It has been reported that GC–
MS was used as a basic screening method for analysis of synthetic cathinones in human
performance and postmortem toxicology, while LC–MS/MS confirmation method was used to
analyze cases that had a history indicative of synthetic cathinone use or in which subject behavior
suggested synthetic cathinone use [Marinetti and Antonides, 2013]. Furthermore, GC–MS and
LC–high‐resolution MS (LC–HR-MS) were utilized to identify phase I and II metabolites of
MDPV and the human cytochrome- P450 (CYP) isoenzymes responsible for its main metabolic
step(s) in rat and human urine and human liver microsomes [Meyer et al, 2010a]. Other studies
indicated that LC–HR‐MS was also utilized for the quantification of synthetic cathinones and
metabolites in urine [Concheiro et al, 2013].
Although LC–MS and other hyphenated LC techniques are becoming more popular, GC–
MS remains, the most widely used technique in routine forensic toxicology laboratories. Figure 4
shows the electron ionization mass spectrum of MDPV reported by Westphal [Westphal et al,

21
2009], which is heavily dominated by the m/z 126 base peak. The mass spectrum of MDPV also
shows the fragment ions at m/z 149, 121, 97, 84 and 69 as well as other ions of low relative abundance.
Scheme 7 below illustrates the EI mass spectral fragmentation pathway. The radical
electron of the nitrogen atom induces a fast alpha-cleavage reaction (α-1) of the benzoyl bond and
produces a base peak iminium cation at m/z 126. The alternative alpha-cleavage reaction (α-2)
produces an iminium cation at m/z 232 with low intensity by the loss of an n-propyl radical. M-15
and M-29 alpha-cleavage fragments are found with low intensities at m/z 260 and m/z 246,
respectively. Ionization at the carbonyl oxygen atom and alpha-cleavage reaction (α-3) yields a
methylenedioxybenzoyl cation at m/z 149, and a subsequent (CO) loss is responsible for the ion at
m/z 121 [Westphal et al, 2009]. The extensive fragmentation leaves very few qualifier ions. An
additional challenge is that due to the tertiary amine, the pyrrolidine-type cathinones lack the active
hydrogen necessary for commonly used or widely accepted approaches to derivatization. The use
of multiple and complementary analytical methods such as GC–MS, GC–MS/MS and GC–IR are
Figure 4. EI spectrum (70 eV) of MDPV [Westphal et al, 2009].

22
often necessary for the specific identification of these cathinone derivatives as will be discussed
in the next sections.
1.9.1.1. Thermal degradation of cathinone derivatives in GC–MS
Although GC–MS is considered the first choice for identification of unknown drugs, some
alkylamine-type cathinones such as methcathinone and 4-methylmethcathinone are known to
undergo thermal decomposition during GC–MS analysis. [Noggle et al, 1994; Tsujikawa et al,
2013b]. Despite the fact that derivatization has proven to be effective to avoid thermal degradation
[Tsujikawa et al, 2013b], it is not applicable for pyrrolidine-type cathinones because of its tertiary
amine structure as mentioned in the previous section.
Three factors have been evaluated [Tsujikawa et al, 2013a] to investigate the thermal
decomposition of α-PVP during GC–MS analysis, namely the injection method (splitless or split,
Scheme 7. Proposed EI-MS fragmentation pathway for MDPV [Westphal et al, 2009].

23
split ratio), injector temperature and the surface activity on the inlet liner. The results showed that
the split injection and the use of deactivated liner were effective to prevent the thermal
decomposition of α-PVP (deactivated liner also minimized the degradation with splitless). The
decomposition product of this derivative was proposed to be an enamine with the double bond
located in the side-chain as demonstrated in Figure 5 shown below. The proposed structures of the
fragment ions were supported by deuterium labeling experiment.
1.9.2. Gas chromatography with infrared detection (GC–IR)
The absorption of IR radiation is also considered one of the non-destructive techniques that
can be used for the identification of organic molecules. The region from 1250 to 600 cm-1 is
generally classified as the “fingerprint region” and is usually a result of bending and rotational
Figure 5. Electron ionization mass spectra of (A) decomposition product of α-PVP, (B) intact α-
PVP, (C) decomposition product of α-PVP-D8 and (D) intact α-PVP-D8 [Tsujikawa et al, 2013a].

24
energy changes of the molecule as a whole. However since the clandestine samples are usually
impure, overlapping absorptions of different molecules present in the sample becomes a
possibility. Hence, this region is not useful for identifying functional groups, but can be useful for
determining whether samples are chemically identical.
GC–MS detection is perhaps the most common technique used for forensic drug
identification. However, regioisomeric molecules yielding regioisomeric fragment ions present a
significant challenge for mass-based methods of identification. Infrared spectroscopy is a useful
confirmatory method for identification and differentiation of regioisomeric substances having
mass-based equivalence. Gas chromatography with vapor phase infrared detection has proven to
be a reliable partner to GC–MS for the complete and exact structural determination in a number of
designer drug categories [Smith et al, 2018; Abdel-Hay et al, 2013; Awad et al, 2009].
1.9.3. Nuclear magnetic resonance (NMR)
NMR is a nondestructive flexible technique that can be used for the simultaneous
identification of pure compounds and even mixtures of compounds in one sample. Its advantages,
compared to GC–MS techniques, include stereochemical differentiation and the capability to
analyze nonvolatile compounds. However, the lack of use in forensic laboratories can be attributed
to the high cost of instrumentation and the poor sensitivity of NMR. Solid state NMR also can
be used for analytical purposes in much the same way as solution NMR. The observed chemical
shifts however differ in the solution and solid states because of conformational freezing and
packing effects. 1H and 13C NMR were utilized to confirm the structure of MDPV in a seized
sample in Germany in 2007 [Westphal et al, 2009].

25
1.10. The instability of hydrochloride salts of cathinone derivatives in air
Cathinone derivatives can be classified into two types based on their amino groups,
alkylamine-type (secondary amines) like methcathinone and pyrrolidine-type like MDPV. The
pyrrolidine-type cathinones contain a tertiary amine group [Tsujikawa et al, 2015]. Tertiary amines
can be easily oxidized by molecular oxygen into amine oxides [Aleksandrov, 1980]. The salt form
of these amines is usually difficult to oxidize due to the protonation of the amine group [Saal,
2010]. However, the salt of MDPV was reported to be extremely unstable in air [Wang et al, 2012].
The decomposition of hydrochloride salts of various cathinone derivatives in air has been
evaluated [Tsujikawa et al, 2015]. The pyrrolidine-type cathinones afforded two types of
decomposition products, which were proposed to be a cyclic amide (2-pyrrolidone, lactam) and N-
oxide derivatives, while secondary amine-type cathinones showed different decomposition
products, possibly including dealkylated derivatives.

26
1.11. Project rational
The rapid proliferation of new psychoactive substances has led to the development of drug
analogue laws attempting to control unspecified drug molecules not yet known to exist. Based on
a report from the UNODC, approximately 650 new psychoactive substances have been reported
by 102 countries and territories since 2008 [UNODC, 2016]. Additionally, by the end of 2017, the
EMCDDA was monitoring more than 670 new psychoactive substances that have been identified
in Europe [EMCDDA, 2018].
A total of 75 new psychoactive substances appeared for the first time in 2015 according to
the 2016 World Drug Report [UNODC, 2016]. A total of 20 of these first time reports in 2015
represented new synthetic cathinone derivatives and for the first time in history, the number of
new synthetic cathinones rivaled the number of reported new synthetic cannabinoids, 20 and 21
respectively. The 2018 European Drug Report describes the synthetic cathinones as the second
largest group of new substances monitored by the EMCDDA, with a total of 130 different
substances identified from 2008–2018 in clandestine drug samples [EMCDDA, 2018].
A number of synthetic cathinones (aminoketones, “bath salts”) have appeared on the illicit
drug market in recent years including methcathinone, mephedrone, methylone and MDPV (3,4-
methylenedioxypyrovalerone). These compounds represent a new emphasis in the development of
designer drugs [German et al, 2014; Lewin et al, 2014; Katz et al, 2014] with a variety of aromatic
ring substituent, hydrocarbon side-chain and amino group modifications of the basic cathinone
molecular skeleton.
The synthetic cathinones produce central nervous system stimulation and other
psychoactive effects as a result of elevations in CNS neurotransmitter levels for the various

27
catecholamines [Coppola and Mondola, 2012; Cozzi et al, 1999]. MDPV is a designer drug with
stimulant effects similar to those of cocaine and amphetamine [Kriikku et al, 2011]. It is an
analogue of pyrovalerone, a psychostimulant compound that was the first commercially available
drug from the alpha-pyrrolidinophenone class. It came to the market in the 1970’s and was
removed later due to abuse potential [Meyer et al, 2010a; Gardos and Cole, 1971]. MDPV has also
been described as a synthetic cathinone derivative since it can be viewed as a structurally modified
cathinone [Gibbons and Zloh, 2010].
The designer style molecular modification and synthesis of analogues in a number of drug
categories are possible due to the commercial availability of many regioisomeric forms of common
precursor substances. A single synthetic pathway utilizing a variety of regioisomeric precursor
materials can yield numerous closely related products. These compounds in many cases have
identical molecular framework, elemental composition, functional groups and often equivalent or
identical mass spectral fragments. Chromatographic co-elution of regioisomeric substances that
yield regioisomeric or identical mass spectral fragment ions would require a unique strategy for
identification.
Exploration and current clandestine designer drug development concepts in the
aminoketone drugs based on substituted amphetamines and related phenethylamines models
[Zaitsu et al, 2009] are likely to continue for many years. Clandestine production of these drugs
can be based on common precursor chemicals. Therefore, legal control of key precursor substances
is not likely and might not prevent the further clandestine/designer exploration of this group of
compounds. In fact, the legal control of a specific drug of abuse often provides the driving force
for the development of new designer substances. Issues of designer aminoketone identification as

28
well as regioisomer relationships in these designer molecules will continue to be significant in
forensic drug analysis.
Perhaps the U. S. Controlled Substance Analogue Act would make all these “isomers”
controlled substances. Therefore, it could be argued that isomer differentiation is not necessary in
forensic drug science. However, the compound must be specifically identified in order to even
know if it falls into the category as an analogue of a controlled substance. These circumstances all
point to the strong need for a thorough and systematic investigation of the forensic chemistry of
these substituted aminoketones. The use of multiple and complementary analytical methods such
as GC–MS, GC–MS/MS and GC–IR are often necessary for the specific identification of one
compound from a series of closely related structural isomers.
This project will investigate the forensic analytical chemistry of the current and future
regioisomeric and homologous designer cathinone derivatives. The resulting analytical data as
well as methods for reference standard synthesis represent important advancements in forensic
drug chemistry. The goal of this work is to have the data and methods for differentiation among
these designer substances available to assist in drug identification.

29
1.12. Purpose, goals and objectives
The purpose of this project is to develop regioisomer specific methods for the identification
of ring substituted aminoketone compounds (cathinone derivatives). This will be accomplished
by:
1) The chemical synthesis of all regioisomeric forms of selected aromatic ring substituted
aminoketones.
2) Generation of a complete analytical profile for each compound using the following analytical
techniques: GC–MS, GC–CI-MS, GC–MS/MS and GC–IR.
3) Chromatographic studies to separate/resolve all regioisomeric aminoketones having
overlapping analytical profiles.
4) Design and validation of confirmation level methods to identify each compound to the exclusion
of other regioisomeric forms.
Based on the structure of the unsubstituted cathinone molecule, designer modifications are
possible in four distinct regions (see Scheme 8) of the molecule: the aromaric ring, the alkyl side-
chain, the amino group and the carbonyl functionality. Based on the structures of common
synthetic cathinones in Figure 1 (see Section 1.1.), the first three of these areas of possible designer
modifications are currently being explored by clandestine chemists. Legal control of a specific
molecule often provides the driving force for clandestine development of additional substituted
cathinone designer molecules. The proposed designer modifications in the various regions of the
basic cathinone structure depicted in Scheme 8 are very likely and can be based on the commonly
reported designer manipulations as well as the commercial availability of precursor materials.

30
Figure 6 shows the general structures for the compounds to be prepared and evaluated in
this project. As demonstrated in Scheme 8, in Region A, there are three regioisomeric variants for
each monosubstituted aromatic ring with one alkyl side-chain (ortho-, meta-, para- or 2-, 3-, 4-
substituted), six regioisomers for equivalent disubstitution (for example dimethoxy). In Region B,
n-alkyl groups such as methyl, ethyl, n-propyl and butyl have been reported in marketed samples
of bath salt/cathinone derivatives. Region C is generally a secondary or tertiary amine and N-
methyl, ethyl, dimethyl and pyrrolidine are commonly encountered in clandestine samples. Region
D can be modified to its reduced forms, the hydroxyl and the desoxy moieties.
The appearance of increasingly structurally diverse aminoketone derivatives in clandestine
samples highlights several key issues of immediate forensic significance. First, most of these
compounds have regioisomeric analogues, which would not be readily differentiated and
specifically identified using standard forensic analytic methodology. The second key issue of
Scheme 8. Molecular regions for designer modification in cathinone bath salts.

31
forensic importance among the aminoketone compounds involves designer drug development.
Many of these compounds contain aromatic substituents known to enhance hallucinogenic or
entactogenic activity in the phenylalkylamine (amphetamine and methylenedioxy-amphetamine)
drugs of abuse series. As regulatory controls tighten with respect to available aminoketones,
designer derivative exploration and synthesis are expected to continue. This is particularly
important in these aminoketone compounds since the syntheses are relatively straightforward and
many starting materials are readily accessible. Further designer exploration would likely parallel
that observed in the phenylalkylamine series of drugs and involve methoxy, dimethoxy, bromo-
dimethoxy, methylenedioxy, trifluoromethyl, chloro, and methyl substituents, as well as
regiosiomers of these substitution patterns.
In July of 2011, the NDIC [U. S. DOJ-NDIC, 2011] issued a “Situation Report” examining
the threat that synthetic cathinone abuse poses to the United States and the difficulty that U. S. law
enforcement faces in preventing the manufacture and distribution of synthetic cathinones and
synthetic cathinone products. The four major concerns in the NDIC report were as follows:
1) The distribution and abuse of synthetic cathinones in the U. S. will increase in the near term.
2) More synthetic cathinones will be abused in the long term.
3) Different synthetic cathinones will surface as commercial drug testing companies develop drug
screens to detect existing synthetic cathinones.
4) The global nature of Internet chemical sales, particularly of synthetic cathinones, will present
increasing challenges to U. S. law enforcement in the long term.
These points highlight the need to develop specific, selective and reliable analytical methods to
identify existing cathinone products in the clandestine market place, and versatile methods that

32
can be used to readily identify new designer analogues as they emerge.
The overall goal of this project is a comprehensive and systematic analytical study of the
likely structural variations in clandestinely prepared designer bath salt aminoketones. The
availability of all the necessary compounds to establish and prove the structure-retention, structure-
fragmentation and other structure-property analytical relationships is the first step in this research.
The specific project deliverables are:
1) The chemical synthesis of regioisomeric and homologous compounds related to MDPV.
2) Synthesis of selected deuterium and carbon-13 labeled compounds as needed for MS fragmentation
confirmation.
3) GC–MS evaluation of the regioisomeric aminoketones.
4) Evaluation of GC methods for the separation of all isomers producing equivalent mass spectra.
5) Evaluation of GC–MS, GC–MS/MS and GC–IR data for specific differentiation of all isomers
producing equivalent mass spectra.
Figure 6. General structures for the bath salt aminoketones in this study.

33
2. Synthesis, analytical studies and isotope labeling of the regioisomeric and
homologous cathinone derivatives
Regioisomeric substances are considered a significant challenge for the analytical
techniques used to identify specific molecules. This is considered extremely important when some
of these molecules are legally controlled drugs and others may be uncontrolled, non-drug species
or imposter molecules. Methylenedioxypyrovalerone has direct regioisomers (of equal molecular
weight and fragmentation products of identical mass) as well as homologous substances of
homologous molecular weight and fragmentation products of homologous mass. The ability of the
analytical method to distinguish between regioisomers directly enhances the specificity of the
analysis for the target drugs of abuse. The mass spectrum is often the confirmatory piece of
evidence for the identification of drugs of abuse in the forensic laboratory. While the mass
spectrum is often considered a specific “fingerprint” for an individual compound, there may be
other substances, not necessarily having any known pharmacological activity, capable of
producing very similar or almost identical mass spectra. These imposter substances provide the
possibility for misidentification as the drug of abuse itself. In the case of the cathinones, there may
be many positional isomers, direct or indirect regioisomers, as well as isobaric compounds which
yield a similar mass spectrum. A compound co-eluting with the controlled drug and having the
same mass spectrum as the drug of abuse would represent a significant analytical challenge. The
ultimate concern then is “if the forensic scientist has never analyzed all the non-drug substances,
how can she/he be sure that any of these compounds would not co-elute with the drug of abuse?”

34
The significance of this question is related to many factors, chief among these is the
chromatographic system separation efficiency and the number of possible counterfeit substances.
Furthermore, the ability to distinguish between these regioisomers directly enhances the specificity
of the analysis for the target drugs of abuse.
NMR is a nondestructive flexible technique that can be used for the simultaneous
identification of pure compounds and even mixtures of compounds in one sample. Its advantages,
compared to GC–MS techniques, include stereochemical differentiation and the capability to
analyze nonvolatile compounds. However, the lack of use in forensic laboratories can be attributed
to the high cost of instrumentation and the poor sensitivity of NMR. In addition, NMR requires
pure samples, which are hard to satisfy in the case of biological samples.
Infrared spectroscopy is considered a confirmation method for the identification of organic
compounds due to the uniqueness of infrared spectra for very similar organic molecules. Gas
chromatography with infrared detection (GC–IR) is characterized by scanning quickly enough to
obtain vapor phase IR spectra of compounds eluting from the capillary GC columns.
All the regioisomers, direct and indirect as well as isobaric compounds have a strong
possibility to be misidentified as the controlled drug, by some analytical methods especially mass
spectrometry. In this project, all direct ring regioisomers, and side-chain homologous compounds
related to 3,4-MDPV drug of abuse are compared by chromatographic and spectroscopic
techniques, and methods for their differentiation are explored. Gas chromatography coupled to ion
trap (GC–MS/MS) will be utilized to further investigate some less intense product ions and their
parent ions. Isotope labeling such as deuterium (D) labeling will be used to confirm mass

35
spectrometric fragmentation mechanisms that result in the formation of some key fragment ions
or to confirm the elemental composition of these fragment ions.

36
2.1. GC–MS, GC–MS/MS and GC–IR analyses of a series of methylenedioxyphenyl-
aminoketones: precursors, ring regioisomers and side-chain homologues of MDPV
The ring substituted cathinone, 3,4-methylenedioxypyrovalerone (3,4-MDPV) and its
regioisomer 2,3-methylenedioxypyrovalerone (2,3-MDPV) isomer have almost identical mass
spectra with equivalent fragments including the base peak at m/z 126 and major product ion
fragments at m/z 84. Furthermore, the chemical ionization mass spectra for both isomers are also
identical with a major peak at m/z 276 [M+H]+.
Gas chromatographic separation coupled with infrared detection (GC–IR) provides direct
confirmatory data for structural differentiation between the two regioisomers. The mass spectrum
in combination with the vapor phase infrared spectrum provides for specific confirmation of each
of the regioisomeric and homologous aminoketones. The six aminoketone derivatives were
resolved on a 30-meter capillary column containing an Rxi®-35Sil MS stationary phase while their
intermediate ketones were resolved on Rtx®-5 stationary phase.
2.1.1. Synthesis of the methylenedioxyphenyl-aminoketones: Ring substituted regioisomers
and side-chain homologues of 3,4-methylenedioxypyrovalerone (MDPV)
The synthetic methods needed to prepare the various isomeric and homologous
aminoketones in this study are well established in the chemical literature and in our laboratory.
The procedures used in this project were those reported by Kavanagh [Kavanagh et al, 2012].
These desired compounds were prepared individually from the substituted benzaldehydes via a
4-step synthetic procedure (see Scheme 9). The condensation of alkylmagnesium halides
(Grignard reagents) with the individual 2,3- or 3,4-methylenedioxybenzaldehyde yields the
corresponding methylenedioxybenzyl alcohols. The oxidation of the alcohols with potassium
dichromate (fine powder) gave the precursor ketones. Alpha-bromination of the ketones at the

37
activated methylene carbon gives the alpha-bromoketones and subsequent displacement of the
bromide ion with the pyrrolidine secondary amine yields the desired aminoketone final products.
The products are isolated by solvent extraction and purified by preparative thin layer
chromatography (TLC) 20:80 ethyl acetate-petroleum ether using Analtech (Newark, DE) glass
backed 20 x 20 cm plates with a 1000 µm layer of silica and an inorganic fluorescent 254 nm
indicator.
2.1.1.1. Alternative synthesis of the intermediate 3,4-methylenedioxyphenyl-ketones
The 3,4-methylenedioxyphenyl-ketones can be alternatively prepared by two different
ways as illustrated in Scheme 10. The first method involves the reaction of 1,3-benzodioxole and
the appropriate acyl chloride in the presence of tin (IV) chloride [Aarde et al, 2013b]. The second
method involves the reaction of 3,4-methylenedioxyphenyl nitile with the appropriate Grignard
reagent followed by acidic hydrolysis to afford the ketone [Meltzer et al, 2006; Collins, 2011].
Scheme 9. General synthesis for the six regioisomeric and homologous derivatives of MDPV.
Scheme 10. Alternative synthesis for the intermediate 3,4-methylenedioxyphenyl ketones.

38
2.1.1.2. Synthesis of the precursor 2,3-methylenedioxybenzaldehyde
Piperonal and 2,3-methylenedioxybenzaldehyde are both commercially available.
However, the 2,3-methylenedioxybenzaldehyde was also prepared in our lab. The preparation of
2,3-methylenedioxybenzaldehyde has been reported previously [Soine et al, 1983; Casale et al,
1995] and is outlined in Scheme 11. 2,3-dihydroxybenzaldehyde was converted to 2,3-
methylenedioxybenzaldehyde by adding dibromomethane to a solution of 2,3-
dihydroxybenzaldehyde and potassium carbonate in dimethylformamide (DMF), followed by the
addition of copper(II)oxide and the resulting mixture was heated at reflux overnight. Solvent
extraction followed by Kugelrohr distillation produced the pure 2,3-methylenedioxybenzaldehyde.
2.1.2. Gas chromatographic separation
The chromatogram in Figure 7 (Panel A) shows the GC separation of the six regioisomeric
and homologous methylenedioxyphenyl-aminoketones in this study. The separation was obtained
on a 30-meter capillary column coated with a 0.50 μm film of Rxi®-35Sil MS, a midpolarity phase;
similar to 35% phenyl, 65% dimethyl polysiloxane. The temperature program consisted of an
initial hold at 70 °C for 1.0 minute, ramped up to 250 °C at a rate of 30 °C/minute followed by a
hold at 250 °C for 15.0 minutes. The compounds elute over approximately a 3.0-minute window
requiring a total run time of just over 16.0 minutes. The six compounds in this study differ by the
position of the methylenedioxy ring substitution and the homologation of the alkyl side-chain. The
Scheme 11. Synthesis of 2,3-methylenedioxybenzaldehyde.

39
elution order in Figure 7A reflects these structure-retention relationships showing increased
retention with increasing side-chain length for the homologous series as well as significant
retention differences based on the aromatic ring substitution pattern for the methylenedioxy group.
For example, the degree of retention of the homologous side-chain series for both 2,3- and 3,4-
methylenedioxy ring substitution pattern shows the methyl side-chain eluting before the ethyl and
the n-propyl group having the highest retention. Furthermore, within each pair of equivalent
homologues, the position of the ring methylenedioxy substitution controls the relative retention of
the regioisomeric pair. In every case, the 2,3-isomer elutes before the 3,4-isomer, for example
MDPV (the 3,4-methylenedioxyphenyl substituted isomer, Compound 6) has much higher
retention than its corresponding 2,3-methylenedioxyphenyl substituted isomer, Compound 3, in
Figure 7A. The closely eluting critical peak pair in Figure 7A are Compounds 3 and 5 and these
closely eluting bands represent the 2,3-methylenedioxy ring substitution pattern with the higher
homologue n-propyl side-chain group eluting before the 3,4-pattern with the lower side-chain ethyl
homologue.
A:
1 1 .5 0 1 2 .0 0 1 2 .5 0 1 3 .0 0 1 3 .5 0 1 4 .0 0 1 4 .5 0 1 5 .0 0 1 5 .5 0 1 6 .0 0 1 6 .5 0 1 7 .0 0 1 7 .5 0 1 8 .0 0
5 0 0 0 0
1 0 0 0 0 0
1 5 0 0 0 0
2 0 0 0 0 0
2 5 0 0 0 0
3 0 0 0 0 0
3 5 0 0 0 0
4 0 0 0 0 0
4 5 0 0 0 0
5 0 0 0 0 0
5 5 0 0 0 0
6 0 0 0 0 0
6 5 0 0 0 0
7 0 0 0 0 0
T ime -->
A b u n d a n c e
T IC: 1 6 0 1 1 9 -1 0 .D \ d a ta .ms
1 2
4
3
5
6(MDPV)

40
B:
A similar chromatogram in Figure 7 (Panel B) using the identical temperature program
(with the GC injector temperature maintained at 150 °C) was obtained on a column coated with
0.25 μm film of midpolarity Crossbond® silarylene phase; similar to 50% phenyl, 50% dimethyl
polysiloxane (Rxi®-17Sil MS) with slightly lower retention and the same elution order. The
nonpolar Rtx®-5 column (30 m × 0.25 mm i.d. coated with 0.10 μm film of Crossbond® 5%
diphenyl, 95% dimethyl polysiloxane ) required a 65.0 minutes run time for adequate resolution
of all six compounds (chromatogram not shown). The baseline resolution of a binary mixture of
MDPV and its 2,3-MDPV regioisomer (Compounds 3 and 6) was achieved on an Rtx®-5 stationary
phase in less than 8.50 minutes using the same temperature program described previously (with
the GC injector temperature maintained at 150 °C) and the resulting chromatogram is shown in
Figure 8. The separation of the precursor ketones in Figure 9 was accomplished on an Rtx®-5
stationary phase using the exact temperature program and required an analysis time of less than
Figure 7. Capillary gas chromatographic separation of the six regioisomeric and homologous
methylenedioxyphenyl-aminoketones. GC–MS System 1. A: Rxi®-35Sil MS stationary phase, B:
Rxi®-17Sil MS stationary phase.
3
4
2
9 . 0 0 9 . 5 0 1 0 . 0 0 1 0 . 5 0 1 1 . 0 0 1 1 . 5 0 1 2 . 0 0 1 2 . 5 0
5 0 0 0 0
1 0 0 0 0 0
1 5 0 0 0 0
2 0 0 0 0 0
2 5 0 0 0 0
3 0 0 0 0 0
3 5 0 0 0 0
4 0 0 0 0 0
4 5 0 0 0 0
5 0 0 0 0 0
5 5 0 0 0 0
6 0 0 0 0 0
T i m e - - >
A b u n d a n c e
T I C : 1 6 0 2 0 2 - 8 3 . D \ d a t a . m s
1
5
6(MDPV)

41
7.0 minutes. The structure-retention relations observed for these ketones are consistent with the
results described for the product aminoketones. However, the elution order is slightly different
with each equivalent alkyl side-chain group with the 2,3-methylenedioxy substituted isomer
eluting before the 3,4-substituted isomer.
6
3
7 . 0 0 7 . 2 0 7 . 4 0 7 . 6 0 7 . 8 0 8 . 0 0 8 . 2 0 8 . 4 0 8 . 6 0 8 . 8 0 9 . 0 0 9 . 2 0 9 . 4 0 9 . 6 0 9 . 8 0
2 0 0 0 0 0
4 0 0 0 0 0
6 0 0 0 0 0
8 0 0 0 0 0
1 0 0 0 0 0 0
1 2 0 0 0 0 0
1 4 0 0 0 0 0
1 6 0 0 0 0 0
1 8 0 0 0 0 0
T im e -->
A b u n d a n c e
T I C : 1 5 0 4 2 0 -5 8 . D \ d a t a . m s
4 . 0 0 4 . 5 0 5 . 0 0 5 . 5 0 6 . 0 0 6 . 5 0 7 . 0 0 7 . 5 0 8 . 0 0 8 . 5 0 9 . 0 0
1 0 0 0 0 0
2 0 0 0 0 0
3 0 0 0 0 0
4 0 0 0 0 0
5 0 0 0 0 0
6 0 0 0 0 0
7 0 0 0 0 0
8 0 0 0 0 0
9 0 0 0 0 0
1 0 0 0 0 0 0
1 1 0 0 0 0 0
1 2 0 0 0 0 0
1 3 0 0 0 0 0
1 4 0 0 0 0 0
T i m e - - >
A b u n d a n c e
T I C : 1 5 0 5 2 9 - 1 5 . D \ d a t a . m s
a
d
b
e
c f
Figure 8. Capillary gas chromatographic separation of the regioisomeric compounds 2,3-MDPV
and 3,4-MDPV. GC–MS System 1. Rtx®-5 stationary phas.
Figure 9. Capillary gas chromatographic separation of the six regioisomeric and homologous
methylenedioxyphenyl-ketones. GC–MS System 1. Rtx®-5 stationary phase.

42
2.1.3. Mass spectral studies (EI-MS, CI-MS and MS/MS)
The EI mass spectra of the six homologous and regioisomeric 2,3- and 3,4-
methylenedioxyphenyl-aminoketones (Compounds 1–6) are shown in Figure 10. The base peak in
the mass spectra of all these compounds are the result of the amino-group dominated alpha-
cleavage process producing the iminium cation fragments. The base peaks in all these spectra occur
in a mass range of m/z 98 (C6H12N+), m/z 112 (C7H14N
+) and m/z 126 (C8H16N+) and represents
the homologous series of iminium cations based on the number of methylene units in the alkyl
side-chain. These iminium cations are the result of fragmentation of the bond between the carbonyl
carbon and the adjacent side-chain carbon bearing the amine nitrogen of the pyrrolidine ring. The
iminium cation is the only fragment of significant relative abundance in these spectra and this
fragment provides information about the make-up of the alkyl portion of the molecule. The m/z
149 ion seen in all of the spectra is the methylenedioxybenzoyl cation (ArCO+) resulting from
initial ionization of the carbonyl oxygen and fragmentation of the same carbon-carbon bond to
result in charge retention on the carbonyl portion of the structure. Loss of CO from the m/z 149
cation is the likely source of the m/z 121 cation observed in most of the spectra. The fragmentation
mechanisms for these main ions are explained in Scheme 12 shown below.

43
The iminium cation essentially characterizes the nature of the alkylamino-group portion of
the molecule attached to the carbonyl carbon. However, these ions as well as the substituted
benzoyl cations and resulting fragments, do not provide characterization of the regioisomeric
position of substitution of the methylenedioxy-group. The spectra in Figure 10 for the 2,3-series
are essentially identical to the 3,4-methylenedioxyphenyl-aminoketones. For example, a
comparison of Compound 6 (MDPV) and the corresponding 2,3-regioisomer (Compound 3) shows
essentially equivalent mass spectra with little information for isomer differentiation and
identification. The mass spectra for the representative intermediate ketones (spectra not shown)
show similar overlap of major fragment ions for the regioisomeric pairs.
Scheme 12. Structures of the major fragment ions in the mass spectra of the six regioisomeric and
homologous methylenedioxyphenyl-aminoketones in this study.

44
4 0 6 0 8 0 1 0 0 1 2 0 1 4 0 1 6 0 1 8 0 2 0 0 2 2 0 2 4 0 2 6 0 2 8 0
0
1 0 0 0 0
2 0 0 0 0
3 0 0 0 0
4 0 0 0 0
5 0 0 0 0
6 0 0 0 0
7 0 0 0 0
8 0 0 0 0
9 0 0 0 0
1 0 0 0 0 0
1 1 0 0 0 0
1 2 0 0 0 0
1 3 0 0 0 0
1 4 0 0 0 0
1 5 0 0 0 0
1 6 0 0 0 0
m / z - - >
A b u n d a n c e
S c a n 1 6 9 5 ( 1 2 . 9 6 6 m in ) : 1 6 0 1 1 9 - 1 0 . D \ d a t a . m s
9 8 . 1
5 6 . 1
1 4 9 . 12 4 5 . 11 2 1 . 07 7 . 0 1 7 5 . 1 2 1 6 . 0
4 0 6 0 8 0 1 0 0 1 2 0 1 4 0 1 6 0 1 8 0 2 0 0 2 2 0 2 4 0 2 6 0 2 8 0
0
5 0 0 0 0 0
1 0 0 0 0 0 0
1 5 0 0 0 0 0
2 0 0 0 0 0 0
2 5 0 0 0 0 0
3 0 0 0 0 0 0
3 5 0 0 0 0 0
m / z -->
A b u n d a n c e
S c a n 8 1 0 (7 .8 0 8 m in ): 1 5 0 6 0 8 -3 1 .D \ d a ta .m s
1 1 2 .2
6 5 .14 1 .1 1 4 9 .1
2 5 9 .19 1 .1 2 3 2 .12 0 4 .11 7 5 .11 3 1 .1
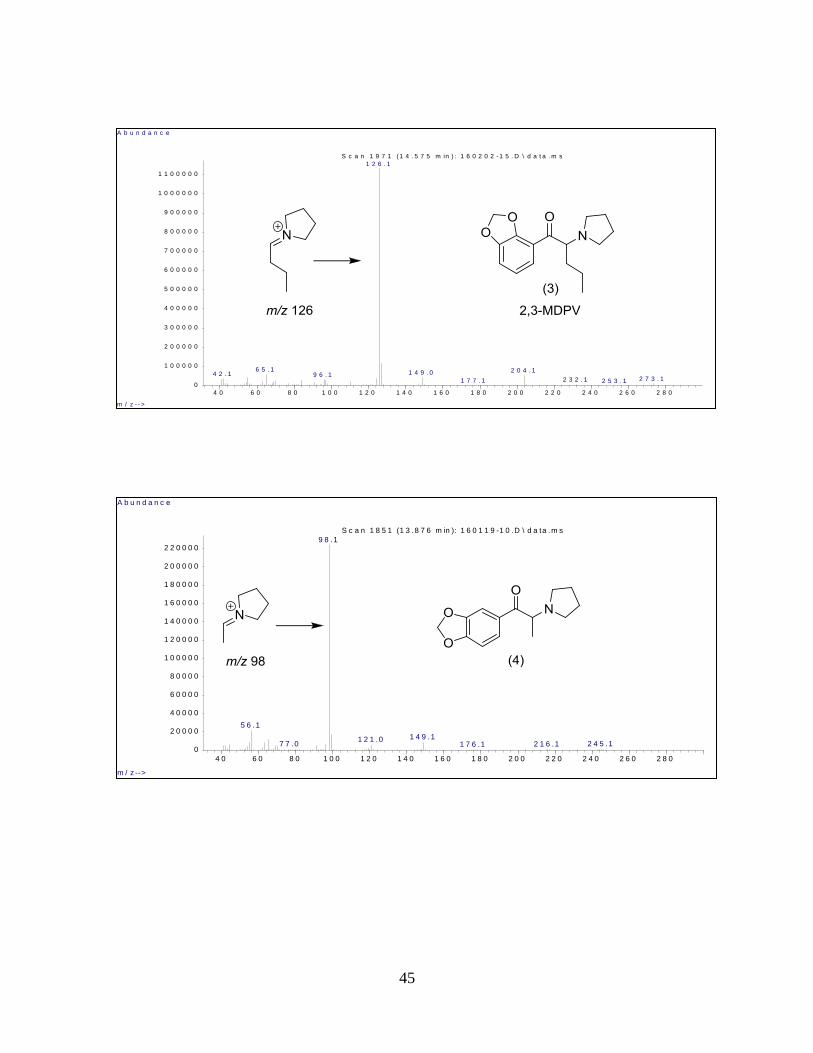
45
4 0 6 0 8 0 1 0 0 1 2 0 1 4 0 1 6 0 1 8 0 2 0 0 2 2 0 2 4 0 2 6 0 2 8 0
0
1 0 0 0 0 0
2 0 0 0 0 0
3 0 0 0 0 0
4 0 0 0 0 0
5 0 0 0 0 0
6 0 0 0 0 0
7 0 0 0 0 0
8 0 0 0 0 0
9 0 0 0 0 0
1 0 0 0 0 0 0
1 1 0 0 0 0 0
m / z - - >
A b u n d a n c e
S c a n 1 9 7 1 ( 1 4 . 5 7 5 m in ) : 1 6 0 2 0 2 - 1 5 . D \ d a t a . m s
1 2 6 . 1
6 5 . 1 2 0 4 . 11 4 9 . 04 2 . 1 9 6 . 12 7 3 . 12 3 2 . 11 7 7 . 1 2 5 3 . 1
4 0 6 0 8 0 1 0 0 1 2 0 1 4 0 1 6 0 1 8 0 2 0 0 2 2 0 2 4 0 2 6 0 2 8 0
0
2 0 0 0 0
4 0 0 0 0
6 0 0 0 0
8 0 0 0 0
1 0 0 0 0 0
1 2 0 0 0 0
1 4 0 0 0 0
1 6 0 0 0 0
1 8 0 0 0 0
2 0 0 0 0 0
2 2 0 0 0 0
m / z -->
A b u n d a n c e
S c a n 1 8 5 1 (1 3 .8 7 6 m in ): 1 6 0 1 1 9 -1 0 .D \ d a ta .m s
9 8 .1
5 6 .1
1 4 9 .11 2 1 .02 4 5 .17 7 .0 2 1 6 .11 7 6 .1

46
The GC–CI-MS studies for Compounds 3 and 6 were performed on a column (30 m × 0.25
mm i.d.) coated with 0.10 μm film of Crossbond® 100% dimethyl polysiloxane (Rtx®-1). The
chemical ionization mass spectra in Figure 11 confirm the molecular weight for the two
4 0 6 0 8 0 1 0 0 1 2 0 1 4 0 1 6 0 1 8 0 2 0 0 2 2 0 2 4 0 2 6 0 2 8 0
0
2 0 0 0 0
4 0 0 0 0
6 0 0 0 0
8 0 0 0 0
1 0 0 0 0 0
1 2 0 0 0 0
1 4 0 0 0 0
1 6 0 0 0 0
1 8 0 0 0 0
2 0 0 0 0 0
2 2 0 0 0 0
m / z -->
A b u n d a n c e
S c a n 2 0 0 4 (1 4 .7 6 7 m in ): 1 6 0 1 2 1 -5 2 .D \ d a ta .m s
1 1 2 .1
1 4 9 .04 1 .1 7 0 .1
9 1 .0 2 5 7 .11 9 0 .1 2 2 6 .11 3 1 .0 1 6 7 .0
4 0 6 0 8 0 1 0 0 1 2 0 1 4 0 1 6 0 1 8 0 2 0 0 2 2 0 2 4 0 2 6 0 2 8 0
0
2 0 0 0 0
4 0 0 0 0
6 0 0 0 0
8 0 0 0 0
1 0 0 0 0 0
1 2 0 0 0 0
1 4 0 0 0 0
1 6 0 0 0 0
1 8 0 0 0 0
2 0 0 0 0 0
2 2 0 0 0 0
2 4 0 0 0 0
m / z -->
A b u n d a n c e
S c a n 2 2 2 9 (1 6 . 0 7 9 m in ): 1 6 0 1 1 9 -1 0 . D \ d a ta .m s
1 2 6 . 1
1 4 9 . 06 5 .1 9 6 .14 2 .02 3 2 . 1 2 7 3 . 12 0 4 . 11 7 5 . 0
Figure 10. EI mass spectra of the six regioisomeric and homologous methylenedioxyphenyl-
aminoketones in this study. GC–MS System 1.

47
regioisomeric aminoketones (Compounds 3 and 6) via the intense [M+H]+ ion. These spectra were
generated using methanol as the CI reagent gas. Thus, GC–CI-MS confirms the molecular weight
for these compounds and the EI mass spectra provide information about that portion of the
molecule bonded to the methylenedioxybenzoyl moiety common to these two compounds.
Chromatographic analysis was performed using a temperature program consisting of an initial hold
at 70 °C for 1.0 minute, ramped up to 250 °C at a rate of 30 °C/minute followed by a hold at 250
°C for 15.0 minutes.
A:
[M+H]+

48
B:
A second less obvious homologous series of fragments occurs among the low mass ions
and this series provides information concerning the exact structure of the iminium cations. Figure
12 shows the low mass region of the EI-MS for Compounds 4, 5 and 6 displaying only the ions
occurring in the portion of the spectrum at masses lower than the mass of the base peak. The low
mass EI scans for Compounds 1, 2 and 3 generated an analogous pattern. The homologous
sequence of interest in Figure 12 is m/z 56, 70 and 84 in Compounds 4, 5 and 6, respectively. Each
of the ions in this low mass series represents the loss of 42 Da from the iminium cation base peak
for these compounds.
The use of product ion MS/MS experiments for each of the base peaks in Compounds 4, 5
and 6 confirmed the iminium cations as the source for the low mass homologous series of ions.
For MS/MS experiments, the scan type used was the Automated Method Development function
[M+H]+
Figure 11. Chemical ionization mass spectra (CI-MS) for Compounds 3 and 6. GC–MS System 2.

49
(AMD) and the optimum MS/MS excitation amplitude was 1.20 volt. The GC–MS/MS studies
were performed on a column (30 m × 0.25 mm i.d.) coated with 0.25 μm film of Crossbond® 100%
trifluoropropylmethyl polysiloxane (Rtx®-200). Chromatographic analysis was performed using a
temperature program consisting of an initial hold at 70 °C for 1.0 minute, ramped up to 250 °C at
a rate of 30 °C/minute followed by a hold at 250 °C for 7.0 minutes.
3 5 4 0 4 5 5 0 5 5 6 0 6 5 7 0 7 5 8 0 8 5
0
2 0 0 0
4 0 0 0
6 0 0 0
8 0 0 0
1 0 0 0 0
1 2 0 0 0
1 4 0 0 0
1 6 0 0 0
1 8 0 0 0
2 0 0 0 0
2 2 0 0 0
2 4 0 0 0
2 6 0 0 0
2 8 0 0 0
3 0 0 0 0
m / z - ->
A b u n d a n c e
S c a n 1 8 4 8 (1 3 . 8 5 8 m in ) : 1 6 0 1 1 9 -1 0 . D \ d a t a . m s
5 6 . 1
6 5 . 1
4 4 . 0 6 9 . 1
5 1 . 07 7 . 0 8 8 . 96 1 . 0 8 2 . 0
3 5 4 0 4 5 5 0 5 5 6 0 6 5 7 0 7 5 8 0 8 5
0
1 0 0 0
2 0 0 0
3 0 0 0
4 0 0 0
5 0 0 0
6 0 0 0
7 0 0 0
8 0 0 0
9 0 0 0
1 0 0 0 0
1 1 0 0 0
1 2 0 0 0
1 3 0 0 0
1 4 0 0 0
1 5 0 0 0
1 6 0 0 0
1 7 0 0 0
1 8 0 0 0
1 9 0 0 0
2 0 0 0 0
m / z - - >
A b u n d a n c e
S c a n 2 0 0 7 ( 1 4 . 7 8 5 m i n ) : 1 6 0 1 2 1 - 5 2 . D \ d a t a . m s
4 1 . 1
7 0 . 16 5 . 1
5 5 . 0
8 2 . 1
5 1 . 07 7 . 0
8 9 . 04 5 . 0 6 0 . 9

50
The major fragments in the product ion spectra for the iminium cations at m/z 98, 112 and
126 appeared at m/z 56, 72 and 84 respectively. The loss of a constant 42 Da across this series of
homologues could suggest the involvement of both pyrrolidine ring and alkyl side-chain in the
formation of these product ions.
The product ion MS/MS spectrum for Compound 3 (2,3-MDPV) in Figure 13 shows the
fragments generated from the m/z 126 iminium cation indicating the major product ion at m/z 84.
Thus, the 42 Da (C3H6) loss could be from the pyrrolidine ring or the n-propyl side-chain.
However, the loss of 42 Da in the product ion spectrum for Compound 4 (methyl side-chain) could
only come from the pyrrolidine ring portion of this iminium cation.
3 5 4 0 4 5 5 0 5 5 6 0 6 5 7 0 7 5 8 0 8 5
0
1 0 0 0
2 0 0 0
3 0 0 0
4 0 0 0
5 0 0 0
6 0 0 0
7 0 0 0
8 0 0 0
9 0 0 0
1 0 0 0 0
1 1 0 0 0
1 2 0 0 0
1 3 0 0 0
1 4 0 0 0
1 5 0 0 0
1 6 0 0 0
1 7 0 0 0
1 8 0 0 0
m / z - - >
A b u n d a n c e
S c a n 2 2 2 2 ( 1 6 . 0 3 8 m in ) : 1 6 0 1 1 9 - 1 0 . D \ d a t a . m s
6 5 . 0
5 5 . 1
4 2 . 0 8 4 . 1
6 9 . 1
5 1 . 0 7 7 . 0
8 9 . 06 1 . 0
Figure 12. Low mass portion of the EI-MS for Compounds 4, 5 and 6. GC–MS System 1.

51
The D4 analogue of 3,4-MDPV ( Compound 6) was synthesized using 2,2,5,5-pyrrolidine-
D4 and this labeled compound subjected to EI-MS as well as product ion MS/MS experiments.
The full scan EI-MS in Figure 14A shows the molecular ion and the base peak with a +4 Da
increase in mass as expected. Furthermore, the product ion spectrum in Figure 14B also shows a
+4 Da mass increase to m/z 88 compared to the product ion spectrum for the unlabeled 2,3-
substituted analogue in Figure 13. These results confirm the pyrrolidine ring remains a part of the
product ion spectrum and this significant product ion is formed from hydrogen migration in the
side-chain followed by alkene (propene) elimination (C3H6).
Figure 13. MS/MS scan of the m/z 126 base peak for 2,3-MDPV (Compound 3). See Figure 10 for
the full scan EI-MS of this compound. GC–MS System 2.

52
14A:
14B:
The pyrrolidine-D8 analogue of Compound 4 was synthesized using 2,2,3,3,4,4,5,5-
pyrrolidine-D8 and this labeled material subjected to EI-MS and product ion MS/MS evaluation.
The results of these experiments showed the base peak iminium cation shifted to m/z 106 (Figure
4 0 6 0 8 0 1 0 0 1 2 0 1 4 0 1 6 0 1 8 0 2 0 0 2 2 0 2 4 0 2 6 0 2 8 0
0
5 0 0 0 0
1 0 0 0 0 0
1 5 0 0 0 0
2 0 0 0 0 0
2 5 0 0 0 0
3 0 0 0 0 0
3 5 0 0 0 0
4 0 0 0 0 0
4 5 0 0 0 0
m / z -->
A b u n d a n c e
S c a n 8 6 1 (8 .1 0 5 m in ): 1 5 1 1 2 4 -1 2 2 .D \ d a ta .m s
1 3 0 .1
6 5 .1 1 4 9 .14 4 .01 0 1 .1
2 3 6 .22 0 7 .11 7 8 .1 2 7 8 .1
Figure 14. EI-MS and product ion spectra for the pyrrolidine-D4 analogue of 3,4-MDPV,
Compound 6. 14A= GC–MS System 1, 14B= GC–MS System 2.

53
15A), +8 Da higher than the m/z 98 iminium cation base peak observed in the unlabeled analogue
(see Figure 10). However, the product ion in Figure 15B was shifted only +2 Da higher to m/z 58
indicating that only one methylene group from the pyrrolidine ring remained a portion of this new
fragment. Additionally, the pyrrolidine-D4 analogue of Compound 4 was synthesized from 2,2,5,5-
pyrrolidine-D4. The EI-MS scan for the 2,2,5,5-tetra-deutero pyrrolidine analogue of Compound
4 showed a base peak at m/z 102 (4 Da higher), however the MS/MS product ion remained at m/z
58 (spectra not shown).
These experiments confirm the source of the methylene remaining in the low mass product
ion as coming from the pyrrolidine ring positions adjacent to the nitrogen (ring positions 2 or 5).
Thus, the loss of 42 Da to yield the product ion for the methyl side-chain homologue in Compounds
1 and 4 results from pyrrolidine ring fragmentation while the equivalent 42 Da loss for the n-propyl
side-chain (Compounds 3 and 6) occurs via side-chain fragmentation.
15A:
4 0 6 0 8 0 1 0 0 1 2 0 1 4 0 1 6 0 1 8 0 2 0 0 2 2 0 2 4 0 2 6 0 2 8 0
0
1 0 0 0 0 0
2 0 0 0 0 0
3 0 0 0 0 0
4 0 0 0 0 0
5 0 0 0 0 0
6 0 0 0 0 0
7 0 0 0 0 0
8 0 0 0 0 0
9 0 0 0 0 0
1 0 0 0 0 0 0
1 1 0 0 0 0 0
m / z - - >
A b u n d a n c e
S c a n 1 8 2 4 ( 1 3 . 7 1 8 m in ) : 1 6 0 1 1 9 - 1 9 . D \ d a t a . m s
1 0 6 . 2
5 8 . 1
1 4 9 . 07 8 . 1 2 5 3 . 22 2 4 . 21 7 7 . 1 2 0 6 . 01 3 0 . 0

54
15B:
The product ion spectrum for the m/z 112 base peak for Compound 5 (the ethyl side-chain
homologue) confirms a transition from ring to side-chain fragmentation in the base peak iminium
cations as the source for product ion formation. This MS/MS scan is shown in Figure 16 and
confirms both ring and side-chain fragmentation to yield a mixture of the two major product ions
at m/z 70 (ring fragmentation) and m/z 84 (side-chain fragmentation).
Figure 15. EI-MS and product ion spectra for the pyrrolidine-D8 analogue of Compound 4. 15A=
GC–MS System 1, 15B= GC–MS System 2.

55
The full scan EI-MS spectrum (Figure 17 A) for the pyrrolidine-D8 analogue of Compound
5 yields the base peak iminium cation at m/z 120, a mass shift of 8 Da as expected. The product
ion scan (Figure 17 B) of the m/z 120 iminium cation yields two major peaks at m/z 72 (ring
fragmentation, loss of C3D6) and m/z 92 (side-chain fragmentation, loss of ethylene, C2H4). These
observed mass shifts are consistent with the assigned structures for these product ion fragments.
17A:
4 0 6 0 8 0 1 0 0 1 2 0 1 4 0 1 6 0 1 8 0 2 0 0 2 2 0 2 4 0 2 6 0 2 8 0
0
5 0 0 0 0 0
1 0 0 0 0 0 0
1 5 0 0 0 0 0
2 0 0 0 0 0 0
2 5 0 0 0 0 0
3 0 0 0 0 0 0
3 5 0 0 0 0 0
4 0 0 0 0 0 0
4 5 0 0 0 0 0
5 0 0 0 0 0 0
m / z - - >
A b u n d a n c e
S c a n 1 9 8 1 ( 1 4 . 6 3 3 m in ) : 1 6 0 1 1 9 - 2 1 . D \ d a t a . m s
1 2 0 . 2
6 5 . 1 1 4 9 . 14 4 . 19 1 . 1 2 4 0 . 2 2 6 7 . 11 9 1 . 1 2 1 2 . 21 7 3 . 1
Figure 16. Product ion spectrum of the m/z 112 base peak of Compound 5. GC–MS System 2.

56
17B:
2.1.4. Vapor phase infrared spectrophotometry
Infrared spectrometry is often used as a confirmatory method for drug identification in
forensic drug analysis. Gas chromatography with infrared detection (GC–IR) was evaluated for
differentiation among the six regioisomeric and homologous compounds. Infrared detection
should provide compound specificity without the need for chemical modification of the drug
molecule. The vapor phase infrared spectra generated in GC–IR experiments are shown in Figure
18 for an example set of regioisomeric aromatic ring substitution patterns, MDPV and its 2,3-
isomer (Compounds 3 and 6). These spectra were generated directly from the chromatography
peak as each compound eluted from the capillary GC column. Thus, these infrared spectra have an
added level of reliability based on the purity of the chromatography peak generated in the GC–IR
experiments following sample injection into the gas chromatograph. The GC–IR vapor phase
infrared spectra were recorded in the range of 4000 – 550 cm-1 with a resolution of 8 cm-1. Each
compound shows a vapor phase IR spectrum with transmittance bands in the regions 1700 – 700
Figure 17. EI-MS and product ion spectra for the pyrrolidine-D8 analogue of Compound 5. 17A=
GC–MS System 1, 17B= GC–MS System 2.

57
cm-1 and 3000 – 2700 cm-1. In general, variations in the position of the methylenedioxy group on
the aromatic ring results in variations in the IR transmittance in the region 1700 – 700 cm-1 [Awad
et al, 2009]. All six compounds show a carbonyl band in the 1690 cm-1 range and characteristic
bands in the 1500 cm-1 to 1200 cm-1 range. The characteristic bands for aromatic ethers in the 1500
cm-1 to 1200 cm-1 range provide information concerning the position of the methylenedioxy ring
and its relationship to the aminoketone side-chain.
100020003000Wavenumbers
94
96
98
100
Per
cent
Tra
nsm
itta
nce
3081
2969
2882
2816
1697
1629
1593
1446
1397
1358
1254
1220
1150
1067
950
894
842 7
73
733
637
100020003000Wavenumbers
94
96
98
100
Per
cent
Tra
nsm
itta
nce
3081
2967
2882
2812
1689
1612
1484 1436
1344
1246
1094
1049
945
890
867
806
753
722
575
Figure 18. An example set of vapor phase IR spectra for Compound 3 (2,3-MDPV) and Compound
6 (3,4-MDPV).

58
The 2,3-methylenedioxy substitution pattern in Compound 3 shows a characteristic
absorption in the 1500 cm-1 to 1200 cm-1 range consisting of a strong singlet band centered in the
1446 cm-1 range and a less intense doublet peak in the 1254/1220 cm-1 range. However, the 3,4-
methylenedioxy substitution pattern in Compound 6 shows a doublet absorption pattern with peaks
centered at 1484 cm-1 and 1436 cm-1 and an intense singlet absorption band at 1246 cm-1.
The vapor phase IR spectra for the other four aminoketones (spectra not shown) as well as
another example set of intermediate ketones in Figure 19 show the identical strong singlet band in
the 1450 cm-1 range for the 2,3-substitution pattern and the corresponding doublet absorption in
the same region for the 3,4-methylenedioxyphenyl substitution pattern. The structure correlated
vapor phase IR absorption bands are consistent across both the precursor aldehyde and
intermediate ketones as well as the target aminoketone final products. The precursor aldehydes
2,3-methylenedioxybenzaldehyde and 3,4-methylenedioxybenzaldehyde (piperonal) have
identical mass spectra (not shown) but can be easily differentiated by the characteristic absorption
bands in the 1500 cm-1 to 1200 cm-1 range in the vapor phase IR (spectra not shown). The 1500
cm-1 to 1200 cm-1 range for the 2,3- and 3,4-substituted series of compounds shows the sharp
singlet absorption band at approximately 1450 cm-1 for the 2,3-isomer and the equal intensity
doublet absorption bands in the same region for the 3,4 substitution pattern.

59
100020003000Wavenumbers
92
94
96
98
100
Per
cent
Tra
nsm
itta
nce
3082
3012
2964
2943
2882
2779
1700
1630
1594
1449
1404
1360
1224
1118
1065
952
875
834
770
729
640
100020003000Wavenumbers
92
94
96
98
100
Per
cent
Tra
nsm
itta
nce
3082
3015
2965
2940 2
883
2778
1696
1613
1486
1439
1347
1249
1089
1049
945
887
806
767
572
Figure 19. An example set of vapor phase IR spectra for the intermediate ketone c (2,3-
methylenedioxyvalerophenone) and intermediate ketone f (3,4-methylenedioxyvalerophenone).

60
2.1.5. Conclusion
Characterization of the ring substitution pattern, the alkyl side-chain and the cyclic tertiary
amine portions of synthetic designer drugs related to 3,4-methylenedioxypyrovalerone (MDPV)
was accomplished by a combination of GC–MS, GC–MS/MS and GC–IR techniques. Six
regioisomeric and homologous methylenedioxyphenyl-aminoketones were separated via capillary
gas chromatography using an Rxi®-35Sil MS stationary phase. Chromatographic retention
increases with the hydrocarbon content of the alkyl side-chain and the 3,4-methylenedioxy
substitution pattern shows higher retention than the corresponding 2,3-methylenedioxy isomer.
The absorption bands in the 1500 cm-1 to 1200 cm-1 range in the vapor phase infrared
spectra readily allows for differentiation of the aromatic ring substitution pattern in the target
aminoketones and the related synthetic precursor materials. The full scan EI mass spectra show
homologous base peaks and the product ion spectra of these iminium cations characterize the alkyl
side-chain portion of the molecule.

61
2.2. Differentiation of regioisomeric methylenedioxyphenyl-aminoketones and desoxy
cathinone derivatives: Cyclic tertiary amines and side-chain regioisomers of MDPV by GC–
MS, GC–MS/MS and GC–IR
The aminoketones and the desoxy phenethylamine analogues in this study represent a
combination of alkyl side-chain and cyclic amines (azetidine, pyrrolidine, piperidine and azepane)
to yield a set of molecules of identical elemental composition as well as major mass spectral
fragment ions (base peaks) of identical elemental composition. A series of regioisomeric cyclic
tertiary amines were prepared and evaluated in EI-MS, MS/MS product ion and IR experiments.
These desoxy phenethylamine analogues of the aminoketone designer drug, 3,4-
methylenedioxypyrrovalerone (MDPV) related to the natural product cathinone were prepared
from piperonal (3,4-methylenedioxybenzaldehyde) via the intermediate ketones. The
aminoketones and the desoxy phenethylamine regioisomers were each separated in capillary gas
chromatography experiments using an Rxi®-17Sil MS stationary phase with the aminoketones
showing greater retention than the corresponding desoxyamines.
The electron ionization mass spectra for the aminoketones as well as the desoxy
phenethylamines yield equivalent m/z 126 regioisomeric iminium cation base peaks. Product ion
fragmentation provides useful data for differentiation of regioisomeric cyclic tertiary amine
iminium cations. Deuterium labeling in both the cyclic amine and alkyl side-chain allowed for the
confirmation of the structure for the major product ions formed from the EI-MS iminium cation
base peaks. Variations of ring size and hydrocarbon side-chain length yield a series of
regioisomeric products having equivalent regioisomeric EI-MS iminium cations. These iminium
cation base peaks show characteristic product ion spectra which allow differentiation of the ring
and side-chain portions of the structure. The azetidine series yields products exclusively by side-
chain fragmentation while the pyrrolidine series undergoes ring fragmentation for the methyl side-

62
chain and both ring and side-chain fragmentation for the higher homologues. The piperadine
containing amines undergo side-chain fragmentation in the ethyl, and n-propyl side-chains while
the methyl side-chain analogue undergoes ring fragmentation. Both side-chain and ring
fragmentation yield a mixture of product ions in the higher side-chain homologues for the seven
membered cyclic tertiary amines and ring fragmentation occurs in the methyl side-chain analogue.
Ring fragmentation in the pyrrolidine series results in the loss of 42 Da from the iminium cation
base peak, 28 Da for the piperadine series and 54 Da for the azepane series.
The vapor phase infrared spectra for these desoxy phenethylamines show doublet
absorption bands at 1489 cm-1 and 1442 cm-1 characteristic for the 3,4-methylenedioxy aromatic
ring substitution pattern and the unsymmetrical nature of these doublet absorption bands indicates
the lack of a carbonyl group at the benzylic position of the alkyl side-chain.
2.2.1. Synthesis of the cyclic tertiary amines and side-chain regioisomers of MDPV
2.2.1.1. Synthesis of the regioisomeric aminoketones
The desired regioisomeric aminoketones were prepared individually from piperonal using
the same procedure prescribed previously in (Section 2.1.1.) with the exception of using three
different cyclic amines in addition to pyrrolidine, which include azetidine, piperidine and azepane
as shown in Scheme 13. The final products were isolated by solvent extraction and purified by
preparative thin layer chromatography (TLC) 20:80 ethyl acetate-petroleum ether using Analtech
(Newark, DE) glass backed 20 x 20 cm plates with a 1000 µm layer of silica and an inorganic
fluorescent 254 nm indicator.
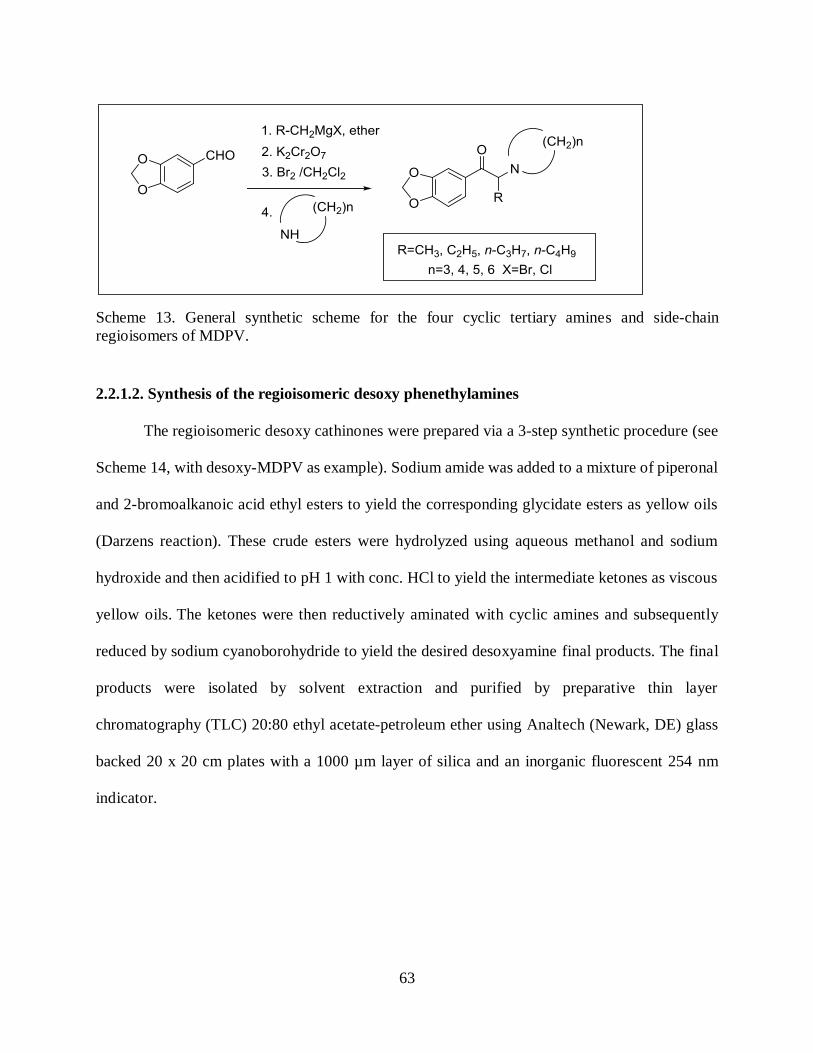
63
2.2.1.2. Synthesis of the regioisomeric desoxy phenethylamines
The regioisomeric desoxy cathinones were prepared via a 3-step synthetic procedure (see
Scheme 14, with desoxy-MDPV as example). Sodium amide was added to a mixture of piperonal
and 2-bromoalkanoic acid ethyl esters to yield the corresponding glycidate esters as yellow oils
(Darzens reaction). These crude esters were hydrolyzed using aqueous methanol and sodium
hydroxide and then acidified to pH 1 with conc. HCl to yield the intermediate ketones as viscous
yellow oils. The ketones were then reductively aminated with cyclic amines and subsequently
reduced by sodium cyanoborohydride to yield the desired desoxyamine final products. The final
products were isolated by solvent extraction and purified by preparative thin layer
chromatography (TLC) 20:80 ethyl acetate-petroleum ether using Analtech (Newark, DE) glass
backed 20 x 20 cm plates with a 1000 µm layer of silica and an inorganic fluorescent 254 nm
indicator.
Scheme 13. General synthetic scheme for the four cyclic tertiary amines and side-chain
regioisomers of MDPV.

64
2.2.1.2.1. Alternative synthesis of the intermediate ketones for the desoxy phenethylamines
The synthesis of the intermediate ketones was reported in 1986 [Nichols et al, 1986]. The
ketone was prepared from piperonal by treating with alkyllmagnesium halide. Dehydration of the
resulting alcohol yielded 3,4-methylenedioxyphenyl-2-alkene derivative, which was oxidized to
the desired ketone (Scheme 15). Another way to prepare the intermediate ketones is the
condensation of piperonal with nitroalkane [Clark et al, 1995]. The resulting 3,4-
methylenedioxyphenyl-2-nitroalkene derivative can be converted to the ketone by treatment with
iron, ferric chloride and hydrochloric acid.
Scheme 14. General synthetic scheme for the desoxy phenethylamines with desoxy-MDPV as
example.
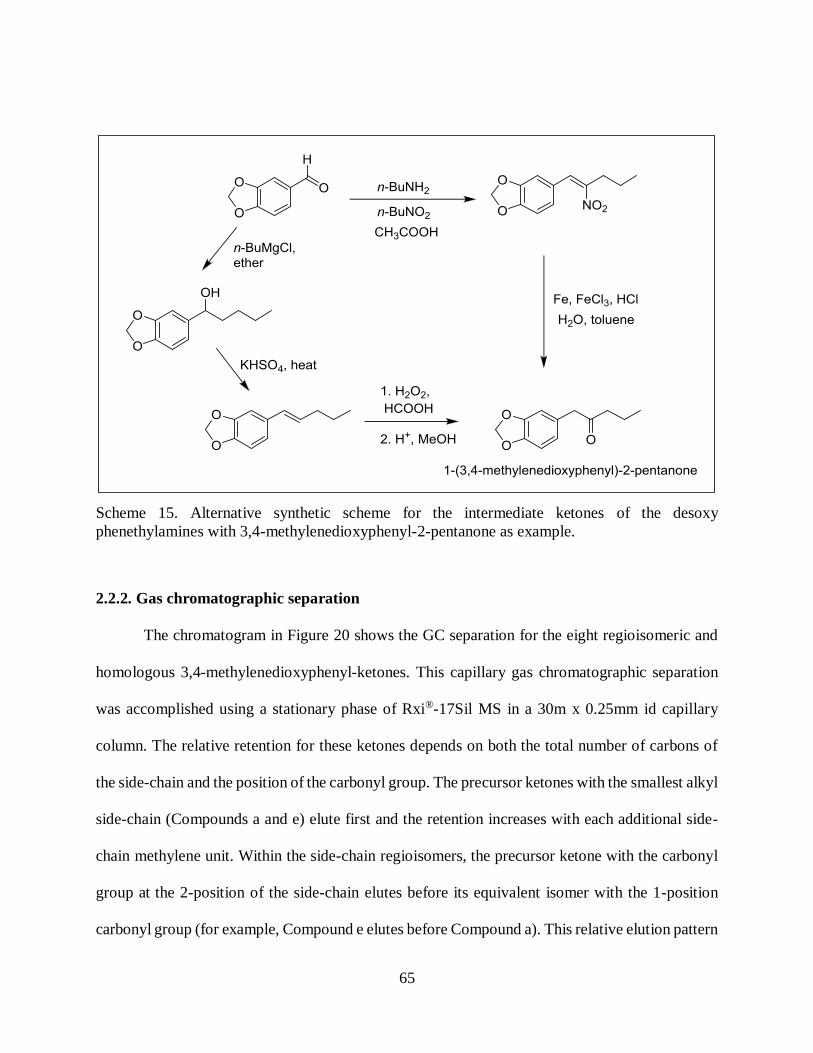
65
2.2.2. Gas chromatographic separation
The chromatogram in Figure 20 shows the GC separation for the eight regioisomeric and
homologous 3,4-methylenedioxyphenyl-ketones. This capillary gas chromatographic separation
was accomplished using a stationary phase of Rxi®-17Sil MS in a 30m x 0.25mm id capillary
column. The relative retention for these ketones depends on both the total number of carbons of
the side-chain and the position of the carbonyl group. The precursor ketones with the smallest alkyl
side-chain (Compounds a and e) elute first and the retention increases with each additional side-
chain methylene unit. Within the side-chain regioisomers, the precursor ketone with the carbonyl
group at the 2-position of the side-chain elutes before its equivalent isomer with the 1-position
carbonyl group (for example, Compound e elutes before Compound a). This relative elution pattern
Scheme 15. Alternative synthetic scheme for the intermediate ketones of the desoxy
phenethylamines with 3,4-methylenedioxyphenyl-2-pentanone as example.

66
based on the position of the carbonyl group continues for each alkyl-side chain in this study. The
effect of carbonyl position on elution order was further evaluated by a comparison of the retention
characteristics for a set of unsubstituted aromatic ring regioisomers. The GC separation (not
shown) for 1-phenyl-2-propanone (P-2-P, phenylacetone) and 1-phenyl-1-propanone (P-1-P,
propiophenone) using the same column gave a baseline resolution of the two regioisomers in about
five minutes with the P-2-P eluting first and P-1-P having the higher retention time. These results
are consistent with those described above and in all examples the regioisomers with the carbonyl
at the 1-position of the alkyl side-chain gave enhanced retention compared to the regioisomers
with the carbonyl at the 2-position. The stationary phase for these separations is the relatively polar
Rxi®-17Sil MS containing a 50% phenyl polymer and the enhanced pi-electron conjugated system
of the 1-carbonyl isomers shows higher affinity for this material than does the un-conjugated
system in the 2-carbonyl isomers.
Figure 20. Capillary gas chromatographic separation of the eight precursor regioisomeric and
homologous 3,4-methylenedioxyphenyl-ketones on Rxi®-17Sil MS stationary phase. GC–MS
System 1.
6 . 5 0 7 . 0 0 7 . 5 0 8 . 0 0 8 . 5 0 9 . 0 0 9 . 5 0 1 0 . 0 0 1 0 . 5 0 1 1 . 0 0 1 1 . 5 0
0
1 0 0 0 0 0
2 0 0 0 0 0
3 0 0 0 0 0
4 0 0 0 0 0
5 0 0 0 0 0
6 0 0 0 0 0
7 0 0 0 0 0
8 0 0 0 0 0
9 0 0 0 0 0
1 0 0 0 0 0 0
1 1 0 0 0 0 0
1 2 0 0 0 0 0
1 3 0 0 0 0 0
1 4 0 0 0 0 0
1 5 0 0 0 0 0
T i m e - - >
A b u n d a n c e
T I C : 1 6 1 0 1 8 - 1 4 5 . D \ d a t a . m s
e
a
f b
g
c
h d

67
The chromatograms in Figure 21 show the gas chromatographic separation of the
regioisomeric aminoketones and the desoxy phenethylamine analogues. These two sets of
compounds each represent a combination of alkyl side-chain length and cyclic tertiary amine ring
size to yield molecules of identical elemental composition as well as major mass spectral fragment
ions (base peaks) of an identical elemental composition. While the presence of the carbonyl group
is unique to Compounds 1–4 yielding two sets of regioisomers (Compounds 1–4 and Compounds
5–8), these eight compounds all yield equivalent EI-MS iminium cation base peaks at m/z 126
(C8H16N)+. The chromatogram in Figure 21A shows the separation of the desoxy phenethylamine
series of regioisomers while Figure 21B represents the separation of the corresponding
aminoketone cathinone derivatives (Compound 2 is the designer drug of abuse known as MDPV,
3,4-methylenedioxypyrrovalerone).
The desoxy phenethylamine series (Compounds 5–8) each vary in ring size for the cyclic
tertiary amino group and the length of the hydrocarbon side-chain. Each methylene unit increase
in ring size for the cyclic amino group are offset by a corresponding decrease in one methylene
unit in the alkyl side-chain producing this set of regioisomers. For example, Compound 5 consists
of a combination of the 4-membered ring cyclic amine azetidine with a four-carbon butyl side-
chain (n-C4H9) while the isomer (Compound 6) with the next higher cyclic amino group (the 5-
membered ring pyrrolidine moiety) contains a three carbon n-propyl side-chain (n-C3H7) and this
pattern continues for Compounds 7 and 8. The resulting set of four regioisomeric desoxy
phenethylamines (Compounds 5–8) has the same elemental composition and mass.

68
A:
B:
9 . 0 0 9 . 5 0 1 0 . 0 0 1 0 . 5 0 1 1 . 0 0 1 1 . 5 0 1 2 . 0 0 1 2 . 5 0
5 0 0 0 0 0
1 0 0 0 0 0 0
1 5 0 0 0 0 0
2 0 0 0 0 0 0
2 5 0 0 0 0 0
3 0 0 0 0 0 0
3 5 0 0 0 0 0
T im e - - >
A b u n d a n c e
T I C : 1 6 1 0 1 8 - 9 0 . D \ d a t a . m s
5
6
7 8
9 . 0 0 9 . 5 0 1 0 . 0 0 1 0 . 5 0 1 1 . 0 0 1 1 . 5 0 1 2 . 0 0 1 2 . 5 0
5 0 0 0 0
1 0 0 0 0 0
1 5 0 0 0 0
2 0 0 0 0 0
2 5 0 0 0 0
3 0 0 0 0 0
3 5 0 0 0 0
4 0 0 0 0 0
T im e - ->
A b u n d a n c e
T I C : 1 6 0 2 0 2 - 2 7 . D \ d a t a . m s
1 2
3
4
Figure 21. Capillary gas chromatographic separation of the four regioisomeric desoxyamines (A)
and the four regioisomeric aminoketones (B) on Rxi®-17Sil MS stationary phase and identical
temperature program. GC–MS System 1.

69
The chromatogram in Figure 21A shows the GC separation of the four regioisomeric
desoxy phenethylamine analogues on an Rxi®-17Sil MS stationary phase. This phase is equivalent
to a 50% phenyl, 50% dimethyl polysiloxane. The elution order for the regioisomeric amines
appears controlled by the size of the cyclic tertiary amine portion of the molecule. The isomer
containing the 4-membered ring azetidine (Compound 5) elutes first followed by the pyrrolidine
containing isomer then the piperidine containing isomer and finally the 7-membered ring azepane
containing isomer displaying the highest degree of retention on this stationary phase.
The chromatogram in Figure 21B was obtained on the same column and stationary phase
as well as the identical temperature program as that in Figure 21A. The pattern of molecular
modifications in ring size and side-chain length to yield these regioisomers (Compounds 1–4) is
identical to that described above. These aminoketone regioisomers show the identical elution order
as that observed for the desoxy phenethylamines in Figure 21A. The compounds elute according
to cyclic tertiary amine ring size with the azetidine containing isomer eluting first and the azepane
containing isomer eluting last. A comparison of the retention properties resulting from side-chain
verses ring homologation on the Rxi®-17Sil MS stationary phase revealed significantly greater
retention for the ring homologue. The chromatogram illustrating this evaluation is presented in
Figure 22 and it shows much greater retention for the expanded ring homologue (pyrrolidine to
piperidine) than the side-chain homologue (methyl to ethyl) in a similar series of aminoketone
analogues. The selectivity of stationary phase polymers in gas chromatography is a complex
mixture of forces including steric and electronic. The relative polar nature of the high phenyl group
content of the stationary phase liquid would suggest polar interactions as a central component of
the retention of these regioisomeric amines. The larger alkyl side-chain for Compounds 1 and 5
may provide maximum shielding of interactions between the electrons on nitrogen and the phenyl

70
groups of the stationary phase. These steric effects would be reduced as the alkyl side-chain length
decreases allowing more efficient polar association thus increasing retention for the larger ring
regioisomers with the smaller alkyl side-chains.
Since the chromatograms in Figures 21A and 21B were obtained under identical
conditions, a comparison of these two elution profiles reveals a role for the carbonyl group in
retention for these compounds. This comparison shows a retention increase for the carbonyl
containing compounds compared to the corresponding desoxy phenethylamine analogues and
suggests enhanced stationary phase affinity based on polar interactions with the carbonyl group.
Thus, the fully conjugated and extended pi-electron system of the 1-carbonyl isomers shows higher
affinity for the phenyl-group containing stationary phase than does the un-conjugated system of
the desoxy phenethylamine analogues. This observation appears consistent with the elution order
observed for the regioisomeric ketones in Figure 20.
Fgure 22. Capillary gas chromatographic separation of three aminoketone analogues illustrating
the effect of side-chain and ring methylene (CH2) homologation on retention for Compound I.
9 . 0 0 9 . 5 0 1 0 . 0 0 1 0 . 5 0 1 1 . 0 0 1 1 . 5 0 1 2 . 0 0 1 2 . 5 0 1 3 . 0 0
2 0 0 0 0 0
4 0 0 0 0 0
6 0 0 0 0 0
8 0 0 0 0 0
1 0 0 0 0 0 0
1 2 0 0 0 0 0
1 4 0 0 0 0 0
1 6 0 0 0 0 0
1 8 0 0 0 0 0
T im e - - >
A b u n d a n c e
T I C : 1 7 0 1 1 1 - 2 0 . D \ d a t a . m s
I
II
III

71
Compounds 2 and 3 in Figure 21B represent a closely eluting critical peak pair in this
analysis. The chromatogram in Figure 23 shows the results of injecting a mixture of Compounds
1–4 using an Rxi®-5Sil MS stationary phase (low polarity Crossbond® silarylene phase; similar to
5% phenyl, 95% dimethyl polysiloxane). One of the components of this essentially co-eluting pair
(Compounds 2 and 3) is the designer drug of abuse, MDPV (Compound 2) and this chromatogram
illustrates the potential for co-elution of regioisomeric substances of equivalent electron ionization
mass spectra. Chromatographic co-elution of compounds having equivalent mass spectra is a
concern in forensic drug analysis especially for totally synthetic designer drugs where compounds
may be previously unknown. All the GC–MS chromatographic separations were carried out using
a temperature program consisted of an initial hold at 70 °C for 1.0 minute, ramped up to 250 °C at
a rate of 30 °C/minute followed by a hold at 250 °C for 15.0 minute.
7.50 8.00 8.50 9.00 9.50 10 .00
100000
200000
300000
400000
500000
600000
700000
800000
900000
1000000
1100000
1200000
T ime-->
Abundanc e
T IC: 150824-40 .D \ da ta .ms
Figure 23. Capillary gas chromatographic separation of Compounds 1–4 with co-elution of
Compounds 2 (3,4-MDPV) and 3. GC–MS System 1. Rxi®-5Sil MS stationary phase.

72
Figure 24. Capillary gas chromatographic co-elution of Compounds 2 (3,4-MDPV) and 3. GC–
MS System 2 (CI technique). Rtx®-1 stationary phase.
A similar co-elution pattern has been also observed after injecting a sample mixture of
Compounds 2 and 3 using CI technique (using methanol as the CI reagent gas) and the identical
temperature program described previously. These two isomers each yield an iminium cation base
peak at m/z 126 and equivalent minor fragment ions including the 3,4-methylenedioxybenzoyl ion
at m/z 149. The chromatogram in Figure 24 illustrates the co-elution of the two isomers and the
chromatography peak was maximized to further emphasize that both isomers are co-eluting under
the same peak and no baseline resolution was observed. The GC–CI-MS study was performed on
a column (30 m × 0.25 mm i.d.) coated with 0.10 μm film of Crossbond® 100% dimethyl
polysiloxane (Rtx®-1), a commonly used stationary phase in forensic analysis. These two examples
(shown in Figures 23 and 24) are clear evidences that chromatographic co-elution is a concern
among regioisomers despite the different stationary phases that might be available.

73
2.2.3. Mass spectral studies (EI-MS, CI-MS and MS/MS)
The electron ionization mass spectra for the intermediate regioisomeric ketones
(Compounds c and g) are shown in Figure 25. While these two examples are for compounds having
identical elemental composition (C12H14O3), the position of the carbonyl in the side-chain provides
unique and characteristic fragment ions. Compound g with the carbonyl group at the 2-position of
the C5 side-chain generates the 3,4-methylenedioxybenzyl cation (m/z 135) as the base peak. While
the base peak at m/z 149 (3,4-methylenedioxybenzoyl cation) is characteristic for Compound c
with the carbonyl group at the 1-position of the side-chain.
A:
3 0 4 0 5 0 6 0 7 0 8 0 9 0 1 0 0 1 1 0 1 2 0 1 3 0 1 4 0 1 5 0 1 6 0 1 7 0 1 8 0 1 9 0 2 0 0 2 1 0
0
5 0 0 0 0
1 0 0 0 0 0
1 5 0 0 0 0
2 0 0 0 0 0
2 5 0 0 0 0
3 0 0 0 0 0
3 5 0 0 0 0
4 0 0 0 0 0
4 5 0 0 0 0
5 0 0 0 0 0
m / z - - >
A b u n d a n c e
S c a n 8 1 0 ( 7 . 8 0 8 m i n ) : 1 6 1 0 1 8 - 1 2 8 . D \ d a t a . m s
1 3 5 . 0
4 3 . 1
7 7 . 1
2 0 6 . 1
1 0 5 . 0
6 3 . 09 1 . 0 1 4 9 . 01 2 1 . 0 1 6 2 . 0 1 7 4 . 8 1 9 1 . 9

74
B:
The full electron ionization mass spectra (EI-MS) for the four regioisomeric aminoketones
are shown in Figure 26. The length of the alkyl side-chain varies in each of the compounds in order
to yield the mass equivalent regioisomeric iminium cation species at m/z 126, the base peak for
the cathinone derivative MDPV. These iminium cations are the base peaks and the only peaks of
significant relative abundance in each of the four spectra shown in Figure 26. These fragments are
generated by the loss of the 3,4-methylenedioxybenzoyl radical (149 Da) from each of the
molecular ions. Each of the four compounds whose spectra are shown in Figure 26 has equivalent
molecular ions at m/z 275 for the same elemental composition, C16H21NO3. Differentiation of these
compounds by GC–MS alone would be based primarily on chromatographic retention
characteristics since these four compounds also yield regioisomeric major fragment ions of
identical elemental composition. Such a chromatographic identification would require the
availability of a number of reference samples for retention time comparisons.
4 0 5 0 6 0 7 0 8 0 9 0 1 0 0 1 1 0 1 2 0 1 3 0 1 4 0 1 5 0 1 6 0 1 7 0 1 8 0 1 9 0 2 0 0 2 1 00
1 0 0 0 0
2 0 0 0 0
3 0 0 0 0
4 0 0 0 0
5 0 0 0 0
6 0 0 0 0
7 0 0 0 0
8 0 0 0 0
9 0 0 0 0
1 0 0 0 0 0
1 1 0 0 0 0
1 2 0 0 0 0
1 3 0 0 0 0
1 4 0 0 0 0
m / z - - >
A b u n d a n c e
S c a n 5 8 3 ( 6 . 4 8 5 m i n ) : 1 6 0 1 0 4 - 4 6 . D \ d a t a . m s1 4 9 . 0
1 6 4 . 1
1 2 1 . 0
6 5 . 0
2 0 6 . 1
4 1 . 0 9 1 . 1
1 7 7 . 11 3 5 . 0 1 9 2 . 17 7 . 9 1 0 5 . 1
Figure 25. Electron ionization mass spectra (EI-MS) for the intermediate regioisomeric ketones.
A: 1-(3,4-methylenedioxyphenyl)-2-pentanone; B: 1-(3,4-methylenedioxyphenyl)-1-pentanone.
GC–MS System 1.

75
A:
B:
4 0 6 0 8 0 1 0 0 1 2 0 1 4 0 1 6 0 1 8 0 2 0 0 2 2 0 2 4 0 2 6 0 2 8 0
0
5 0 0 0 0 0
1 0 0 0 0 0 0
1 5 0 0 0 0 0
2 0 0 0 0 0 0
2 5 0 0 0 0 0
3 0 0 0 0 0 0
3 5 0 0 0 0 0
4 0 0 0 0 0 0
4 5 0 0 0 0 0
m / z - - >
A b u n d a n c e
S c a n 8 5 3 ( 8 . 0 5 9 m in ) : 1 5 1 2 0 4 - 1 3 . D \ d a t a . m s
1 2 6 . 1
4 2 . 1
6 5 . 1 1 4 9 . 0
9 1 . 02 1 8 . 11 9 0 . 1 2 4 4 . 1 2 7 4 . 11 7 0 . 0
4 0 6 0 8 0 1 0 0 1 2 0 1 4 0 1 6 0 1 8 0 2 0 0 2 2 0 2 4 0 2 6 0 2 8 0
0
2 0 0 0 0
4 0 0 0 0
6 0 0 0 0
8 0 0 0 0
1 0 0 0 0 0
1 2 0 0 0 0
1 4 0 0 0 0
1 6 0 0 0 0
1 8 0 0 0 0
2 0 0 0 0 0
2 2 0 0 0 0
2 4 0 0 0 0
m / z -->
A b u n d a n c e
S c a n 2 2 2 9 (1 6 . 0 7 9 m in ): 1 6 0 1 1 9 -1 0 . D \ d a ta .m s
1 2 6 . 1
1 4 9 . 06 5 .1 9 6 .14 2 .02 3 2 . 1 2 7 3 . 12 0 4 . 11 7 5 . 0

76
C:
D:
4 0 6 0 8 0 1 0 0 1 2 0 1 4 0 1 6 0 1 8 0 2 0 0 2 2 0 2 4 0 2 6 0 2 8 0
0
1 0 0 0 0 0 0
2 0 0 0 0 0 0
3 0 0 0 0 0 0
4 0 0 0 0 0 0
5 0 0 0 0 0 0
6 0 0 0 0 0 0
7 0 0 0 0 0 0
8 0 0 0 0 0 0
m / z -->
A b u n d a n c e
S c a n 8 6 6 (8 . 1 3 5 m in ): 1 5 1 2 0 4 -1 5 . D \ d a t a . m s
1 2 6 . 2
4 1 . 1
6 5 . 11 4 9 . 0
8 4 . 12 4 6 . 21 0 5 . 1 2 7 4 . 11 7 7 . 1 2 1 8 . 12 0 0 . 1
4 0 6 0 8 0 1 0 0 1 2 0 1 4 0 1 6 0 1 8 0 2 0 0 2 2 0 2 4 0 2 6 0 2 8 0
0
1 0 0 0 0 0 0
2 0 0 0 0 0 0
3 0 0 0 0 0 0
4 0 0 0 0 0 0
5 0 0 0 0 0 0
6 0 0 0 0 0 0
7 0 0 0 0 0 0
8 0 0 0 0 0 0
m / z -->
A b u n d a n c e
S c a n 9 1 0 (8 . 3 9 1 m in ) : 1 5 1 2 0 4 -1 6 . D \ d a t a . m s
1 2 6 . 1
5 5 . 1
1 4 9 . 19 1 . 1
1 7 7 . 1 2 7 4 . 12 4 4 . 12 0 2 . 1 2 2 5 . 9
Figure 26. EI-MS for the four regioisomeric aminoketones of MW= 275 and regioisomeric base
peak iminium cations at m/z 126. GC–MS System 1.
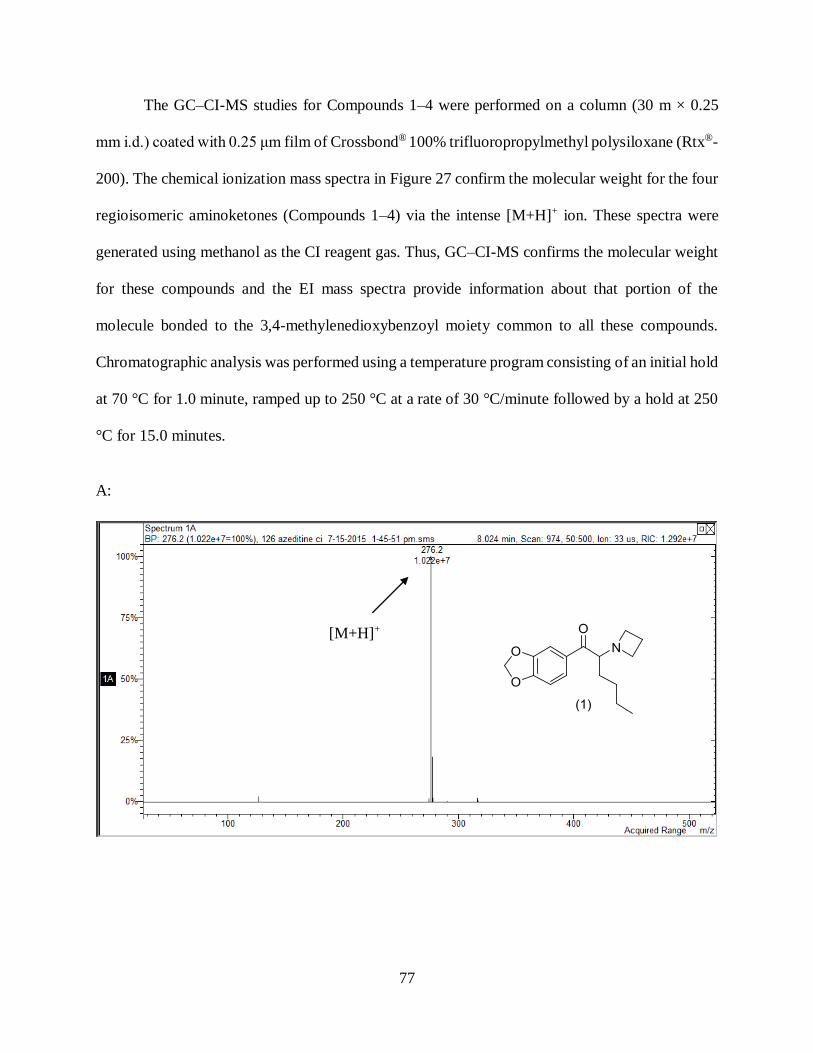
77
The GC–CI-MS studies for Compounds 1–4 were performed on a column (30 m × 0.25
mm i.d.) coated with 0.25 μm film of Crossbond® 100% trifluoropropylmethyl polysiloxane (Rtx®-
200). The chemical ionization mass spectra in Figure 27 confirm the molecular weight for the four
regioisomeric aminoketones (Compounds 1–4) via the intense [M+H]+ ion. These spectra were
generated using methanol as the CI reagent gas. Thus, GC–CI-MS confirms the molecular weight
for these compounds and the EI mass spectra provide information about that portion of the
molecule bonded to the 3,4-methylenedioxybenzoyl moiety common to all these compounds.
Chromatographic analysis was performed using a temperature program consisting of an initial hold
at 70 °C for 1.0 minute, ramped up to 250 °C at a rate of 30 °C/minute followed by a hold at 250
°C for 15.0 minutes.
A:
[M+H]+
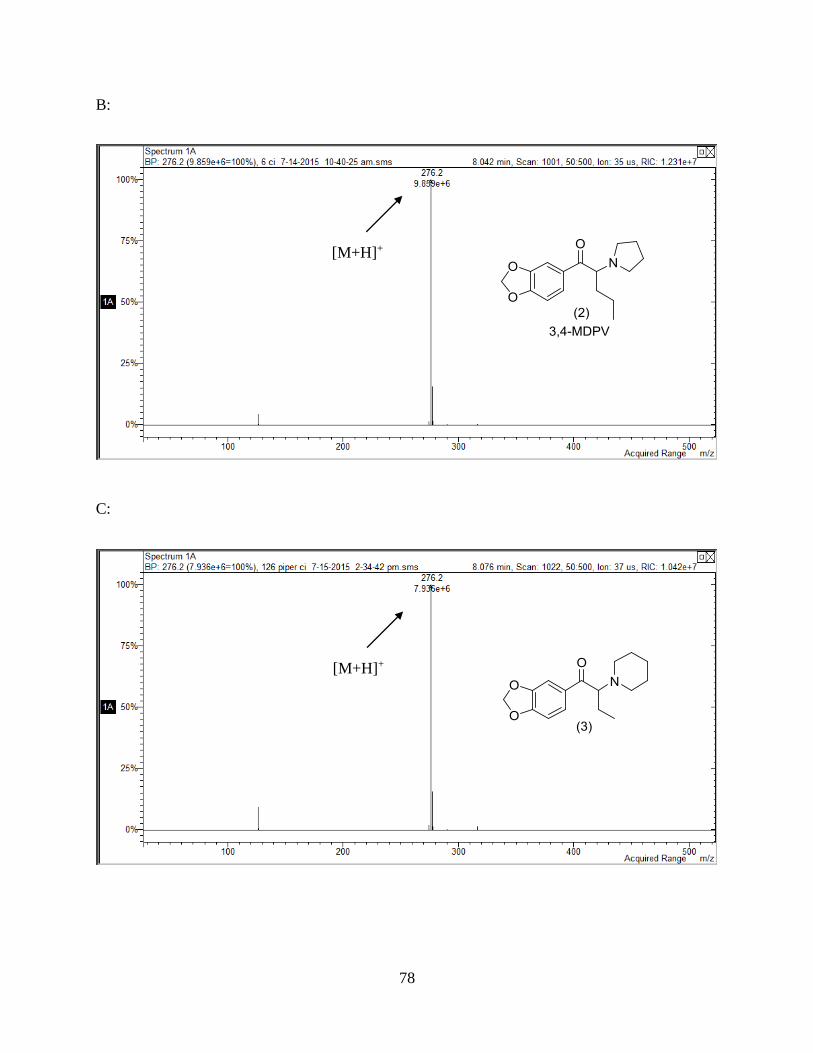
78
B:
C:
[M+H]+
[M+H]+

79
D:
In this study, the MS/MS product ion spectra of the iminium cation base peaks for a variety
of tertiary amines were compared in an effort to characterize the structure-fragmentation
relationships in these molecules of varying ring size and alkyl side-chains. This project compared
the product ion MS/MS spectra of the iminium cations generated from amines containing cyclic
fully saturated 4, 5, 6 and 7 membered rings. For MS/MS experiments, the scan type used was the
Automated Method Development function (AMD) and the optimum MS/MS excitation amplitudes
ranged from 0.20 to 1.60 volts. The GC–MS/MS studies were performed using the same column
described for the GC–CI-MS studies (Rtx®-200) with a temperature program consisting of an
initial hold at 70 °C for 1.0 minute, ramped up to 250 °C at a rate of 30 °C/minute followed by a
hold at 250 °C for 7.0 minutes. The MS/MS spectra for each of the m/z 126 iminium cations from
Figure 26 are shown in Figure 28 and each of the regioisomeric cations yield a unique product ion.
These product ions provide an additional level of mass spectral differentiation for compounds
[M+H]+
Figure 27. Chemical ionization mass spectra (CI-MS) for Compounds 1–4. GC–MS System 2.

80
containing these regioisomeric cyclic tertiary amines. The structures for a number of the cyclic
tertiary aminoketones as well as their base peaks and major product ions are shown in Table 1.
The full EI-MS scans were done on GC–MS (System 1) in this study and the product ion MS/MS
spectra on GC–MS/MS (System 2) in order to have the results confirmed on two different
instruments.
A:
B:

81
Figure 28. MS/MS product ion spectra for the four regioisomeric m/z 126 base peak iminium
cations of the aminoketones.
C:
D:

82
The product ion MS/MS spectrum for the iminium cation formed from the cyclic 4-
membered ring (azetidine) containing cathinone derivative is shown in Figure 28A. The m/z 126
fragment yields the m/z 70 product ion as the only major fragment and this represents the loss of
56 Da from the EI-MS base peak iminium cation. The alkyl side-chain for the azetidine containing
iminium cation at m/z 126 is composed of a C4H9 moiety and the major product ion fragment at
m/z 70 would suggest a hydrogen rearrangement in the alkyl side-chain with the loss of a butene
molecular fragment, C4H8. A series of azetidine containing cathinone derivatives of varying alkyl
side-chain length were prepared to evaluate the process of product ion formation in this group of
compounds. All the alkyl group side-chains yield the m/z 70 product ion whenever a four centered
H-migration to the carbon atom of the iminium species is possible. The migration of the hydrogen
from the side-chain was confirmed via deuterium labeling in the alkyl side-chain. The full EI mass
spectral scan of the n-propyl side-chain analogue shows a base peak at m/z 112 and the major
product ion for the m/z 112 base peak appears at m/z 70. The spectra for the corresponding D8-
labeled n-propyl side-chain analogue show the base peak m/z 120 and the major product ion occurs
at m/z 72 (Table 1). The product ion spectrum for the m/z 120 ion shows the major fragment at m/z
72 indicating the addition of two deuterium atoms into this major MS/MS fragment. The results
of these experiments support the proposed structure for the m/z 70 product ion shown in Table 1
and the formation of this ion via hydrogen rearrangement from the alkyl side-chain. This m/z 70
fragment is the common ion observed for all the azetidine series compounds as long as a four-
centered hydrogen rearrangement process is available in the side-chain. In the case of the methyl
side-chain, a four centered migration is not possible and no product ion of significance was
observed for the iminium cation base peaks for this homologue.

83
The product ion MS/MS spectrum for the iminium cation (m/z 126) formed from the cyclic
5-membered ring amine (pyrrolidine) containing cathinone derivative is shown in Figure 28B. The
cathinone derivatives containing a five membered cyclic pyrrolidine ring were compared by
evaluating alkyl side-chain homologues as well as some deuterium labeled pyrrolidine ring
analogues. The alkyl side-chains including methyl, ethyl and n-propyl as well as D8-pyrrolidine
and 2,2,5,5-D4-pyrrolidine analogues were evaluated in this study. Figure 29 shows a series of
mass spectra, which serve to describe the results seen for the methyl side-chain pyrrolidine
derivative. The major product ion is formed via fragmentation of the pyrrolidine ring itself to
eliminate 42 Da from the EI-MS iminium cation base peak. The full scan EI-MS for the unlabeled
compound in Figure 29A shows the base peak for the iminium cation at m/z 98 and Figure 29B
shows the corresponding product ion scan with the major fragment at m/z 56. The 2,2,5,5-D4-
pyrrolidine analogue in Figure 29C indicates the +4 Da mass shift for the base peak at m/z 102 as
expected and Figure 29D shows the m/z 58 product ion occurring from the m/z 102 iminium cation.
This +2 Da mass shift observed in the m/z 58 product ion indicates that one methylene from the
pyrrolidine ring remains a part of the structure for this major MS/MS product ion. This spectrum
further identifies the one remaining methylene from the pyrrolidine ring as that from the 2 or 5
carbon of the ring, the carbons directly bonded to the nitrogen atom. The proposed mechanism for
the formation of the product ion is shown within Figure 29D. The elimination of the side-chain in
a four-centered hydrogen rearrangement analogous to the process observed for the azetidine series
occurs for the higher side-chain homologues ethyl and n-propyl groups.

84
A:
B:
4 0 6 0 8 0 1 0 0 1 2 0 1 4 0 1 6 0 1 8 0 2 0 0 2 2 0 2 4 0 2 6 0 2 8 0
0
2 0 0 0 0
4 0 0 0 0
6 0 0 0 0
8 0 0 0 0
1 0 0 0 0 0
1 2 0 0 0 0
1 4 0 0 0 0
1 6 0 0 0 0
1 8 0 0 0 0
2 0 0 0 0 0
2 2 0 0 0 0
m / z -->
A b u n d a n c e
S c a n 1 8 5 1 (1 3 .8 7 6 m in ): 1 6 0 1 1 9 -1 0 .D \ d a ta .m s
9 8 .1
5 6 .1
1 4 9 .11 2 1 .02 4 5 .17 7 .0 2 1 6 .11 7 6 .1

85
Figure 29. EI-MS and product ion spectra for the methyl side-chain pyrrolidine isomer and the
2,2,5,5-D4-pyrrolidine analogue.
C:
D:
4 0 6 0 8 0 1 0 0 1 2 0 1 4 0 1 6 0 1 8 0 2 0 0 2 2 0 2 4 0 2 6 0 2 8 0
0
1 0 0 0 0 0
2 0 0 0 0 0
3 0 0 0 0 0
4 0 0 0 0 0
5 0 0 0 0 0
6 0 0 0 0 0
7 0 0 0 0 0
8 0 0 0 0 0
9 0 0 0 0 0
m / z -->
A b u n d a n c e
S c a n 1 5 7 5 (1 0 .4 2 8 m in ): 1 5 0 2 0 2 -6 1 .D \ d a ta .m s
1 0 2 .2
5 8 .1
1 4 9 .11 2 1 .1
4 0 .1 7 9 .1 1 8 4 .0 2 5 0 .22 0 8 .1 2 3 1 .1

86
The structures for the base peak in the EI-MS and product ion spectra for the D8-pyrrolidine
containing aminoketone with the n-propyl side chain, D8-MDPV, are shown in Table 1. The EI-
MS and product ion spectra for the unlabeled form of this compound are shown in Figures 26B
and 28B, respectively. The full scan EI-MS for D8-MDPV shows the molecular ion and the base
peak (m/z 134) with a +8 Da increase in mass as expected. Furthermore, the major product ion
(m/z 92) shows a +8 Da mass increase compared to the spectrum for the unlabeled analogue (Table
1). These results confirm the pyrrolidine ring remains a part of the major product ion fragment and
that no significant ring fragmentation product ion is formed for this compound. The EI-MS and
product ion MS/MS spectra for 2,2,5,5-pyrrolidine-D4 analogue of 3,4-MDPV were discussed in
the previous chapter (Section 2.1.3.) and the fragment ions are consistent with the proposed
mechanism. In the ethyl side-chain pyrrolidine homologue (spectrum not shown) both ring (m/z
70) and side-chain (m/z 84) product ions were observed in approximately equal ion intensities.
The product ion MS/MS spectrum for the iminium cation (m/z 126) formed from the cyclic
6-membered ring amine (piperidine) containing cathinone derivative is shown in Figure 28C. The
piperidine containing compounds were evaluated via the synthesis of a series of alkyl side-chain
derivatives as well as D10-piperidine analogues. In this piperidine series, the alkyl side-chain
homologues yield a common MS/MS product ion at m/z 98 as long as the side-chain based four
centered H-migration to the carbon atom of the iminium species is possible. The structures for the
full scan EI-MS base peak and major product ion for the piperidine containing n-propyl side-chain
derivative and the D10-piperidine analogue are shown in Table 1. The major product ion appears
at m/z 98 and in the D10-piperidine analogue, a mass shift of +10 Da occurs as shown for the m/z
108 product ion. This mass shift to m/z 108 in the product ion spectrum confirms that the piperidine

87
ring remains a part of the product ion and the side-chain is the source of the additional
fragmentation to form the observed major MS/MS fragment.
While the four centered H-migration of the side-chain yields the common m/z 98 product
ion for the ethyl and n-propyl side-chains in the piperidine series as described above, the methyl
side-chain analogue undergoes ring fragmentation. Since the four centered H-migration is not
possible in the methyl side-chain, an analogous migration appears to initiate piperidine ring
fragmentation for the methyl side-chain analogue. The EI-MS for the methyl side-chain analogue
in the piperidine series shows a base peak at m/z 112 with the major product ion at m/z 84 as
illustrated in Figure 30A and 30B, respectively. This m/z 84 product ion represents the loss of 28
Da (C2H4) from the base peak iminium cation at m/z 112.
A:
4 0 6 0 8 0 1 0 0 1 2 0 1 4 0 1 6 0 1 8 0 2 0 0 2 2 0 2 4 0 2 6 0 2 8 0
0
1 0 0 0 0 0
2 0 0 0 0 0
3 0 0 0 0 0
4 0 0 0 0 0
5 0 0 0 0 0
6 0 0 0 0 0
7 0 0 0 0 0
8 0 0 0 0 0
9 0 0 0 0 0
m / z -->
A b u n d a n c e
S c a n 2 1 1 4 (1 5 .4 0 8 m in ): 1 6 0 1 1 9 -0 8 .D \ d a ta .m s
1 1 2 .1
4 1 .1 6 5 .1 1 4 9 .19 1 .12 3 0 .1 2 5 9 .11 7 8 .11 3 1 .0 2 0 3 .0

88
B:
Figure 31A shows the full scan EI-MS for the methyl side-chain D10-piperidine analogue
with the base peak at m/z 122 while Figure 31B illustrates the product ion spectrum for the m/z
122 iminium cation showing a major fragment at m/z 90, only a 6 Da mass shift from the equivalent
product ion in the unlabeled compound.
A:
4 0 6 0 8 0 1 0 0 1 2 0 1 4 0 1 6 0 1 8 0 2 0 0 2 2 0 2 4 0 2 6 0 2 8 0
0
2 0 0 0 0 0
4 0 0 0 0 0
6 0 0 0 0 0
8 0 0 0 0 0
1 0 0 0 0 0 0
1 2 0 0 0 0 0
1 4 0 0 0 0 0
1 6 0 0 0 0 0
1 8 0 0 0 0 0
2 0 0 0 0 0 0
2 2 0 0 0 0 0
2 4 0 0 0 0 0
2 6 0 0 0 0 0
2 8 0 0 0 0 0
m / z - - >
A b u n d a n c e
S c a n 2 0 8 4 ( 1 5 . 2 3 4 m i n ) : 1 6 0 1 1 9 - 2 5 . D \ d a t a . m s
1 2 2 . 2
4 6 . 1
6 5 . 11 4 9 . 19 1 . 1 2 4 0 . 2 2 6 9 . 11 7 7 . 1 2 0 5 . 1
Figure 30. EI-MS and product ion spectra for the methyl side-chain piperidine derivative.

89
Figure 31. EI-MS and product ion spectra for the methyl group side-chain D10-piperidine
derivative.
B:
The fragmentation mechanism shown below (Scheme 16) indicates the alternate four
centered H-migration, which appears to operate in this methyl side-chain example. The ethyl and
n-propyl homologues which allow the four centered H-migration in the alkyl side-chain do not
show any appreciable fragments from this potentially competing H-migration from the piperidine
ring. However, in the next higher ring homologue series containing the seven membered azepane
ring both the ring and side-chain H-migration processes appear to operate perhaps in competition
in some compounds.

90
The azepane containing compounds were evaluated via the synthesis of a series of alkyl
side-chain derivatives as well as deuterium labeled alkyl side-chain analogues. The product ion
MS/MS spectrum for the iminium cation (m/z 126) formed from the cyclic 7-membered amine
(azepane) containing cathinone derivative is shown in Figure 28D. The m/z 72 product ion (Figure
28D) is produced from the m/z 126 base peak which consists of the azepane ring with the methyl
group side-chain. The homologous ethyl side-chain shows a homologues product ion at m/z 86
resulting from the iminium cation base peak at m/z 140 (Table 1).These two product ions at m/z
72 and 86 represent the loss of a consistent 54 Da from the iminium cation base peaks. The most
likely source for this loss would be C4H6, butadiene, which could only come from the azepane ring
in these small side-chain homologues (methyl and ethyl).
Scheme 16. Fragmentation scheme for MS/MS product ion formation in the methyl side-chain D10-
piperidine analogue.

91
The full scan EI-MS as well as the product ion spectrum for the next higher homologue,
the n-propyl side-chain, are shown in Figure 32A and 32B. The base peak in the full scan in Figure
32A occurs at m/z 154 as expected from the loss of the 3,4-methylenedioxybenzoyl radical from
the molecular ion. The product ion spectrum in this example (Figure 32B) shows major fragments
at both m/z 100 and m/z 112. The m/z 100 product ion again represents the loss of 54 Da from the
base peak while the m/z 112 ion represents the loss of 42 Da from the m/z 154 base peak. These
results suggest that both side-chain and ring fragmentation are involved in the formation of these
product ions.
A:
4 0 6 0 8 0 1 0 0 1 2 0 1 4 0 1 6 0 1 8 0 2 0 0 2 2 0 2 4 0 2 6 0 2 8 0 3 0 0
0
2 0 0 0 0
4 0 0 0 0
6 0 0 0 0
8 0 0 0 0
1 0 0 0 0 0
1 2 0 0 0 0
1 4 0 0 0 0
1 6 0 0 0 0
1 8 0 0 0 0
2 0 0 0 0 0
2 2 0 0 0 0
2 4 0 0 0 0
m / z -->
A b u n d a n c e
S c a n 3 2 3 7 (2 1 .9 5 4 m in ): 1 6 0 1 1 9 -6 0 .D \ d a ta .m s
1 5 4 .2
5 5 .11 2 1 .09 8 .17 7 .1 2 6 0 .12 0 4 .11 7 7 .1 3 0 1 .12 3 2 .2

92
Figure 32. EI-MS and product ion spectra for the n-propyl side-chain isomer for the azepane series.
B:
The full scan and product ion spectra for the deuterium labeled n-propyl side-chain
analogue are shown in Figure 33A and 33B, respectively. The base peak in Figure 33A occurs at
m/z 162, which represents an 8 Da shift as expected for the major iminium cation. The product ion
spectrum in Figure 33B indicates major fragments at m/z 108 and m/z 114. A direct comparison of
the fragment ions in Figures 32B and 32B shows a mass shift of the m/z 100 ion to m/z 108 in the
side-chain labeled analogue indicating the side-chain remains a part of this ion and the
fragmentation occurs in the cyclic 7-membered azepane ring system. Furthermore, the +2 Da mass
shift for the second major product ion from m/z 112 to m/z 114 indicates fragmentation of the side-
chain to eliminate the propene molecular equivalent. The next higher side-chain homologue
(spectra not shown) in this azepane series having the n-butyl side-chain shows an analogous set of
ions for both side-chain and ring fragmentation of the m/z 168 base peak iminium cation. Thus, in
the seven membered cyclic tertiary amines both side-chain and ring fragmentation yield a mixture

93
Figure 33. EI-MS and product ion spectra for the D8-labeled n-propyl side-chain analogue of the
azepane series.
of product ions in the higher side-chain homologues while only ring fragmentation occurs in the
methyl and ethyl side-chains.
A:
B:
4 0 6 0 8 0 1 0 0 1 2 0 1 4 0 1 6 0 1 8 0 2 0 0 2 2 0 2 4 0 2 6 0 2 8 0 3 0 0
0
5 0 0 0 0
1 0 0 0 0 0
1 5 0 0 0 0
2 0 0 0 0 0
2 5 0 0 0 0
3 0 0 0 0 0
3 5 0 0 0 0
4 0 0 0 0 0
4 5 0 0 0 0
5 0 0 0 0 0
5 5 0 0 0 0
6 0 0 0 0 0
6 5 0 0 0 0
m / z - - >
A b u n d a n c e
S c a n 3 1 8 2 ( 2 1 . 6 3 4 m in ) : 1 6 0 1 1 9 - 3 5 . D \ d a t a . m s
1 6 2 . 2
5 5 . 11 2 1 . 0
9 1 . 0 1 4 2 . 1 2 6 1 . 12 3 3 . 11 9 1 . 0 3 1 0 . 32 1 3 . 1 2 9 1 . 1

94
The fragmentation mechanism shown below (Scheme 17) illustrates the ring fragmentation
process for the D8-labeled n-propyl side-chain analogue of the azepane series. This process
operates predominantly in the analogues with methyl and ethyl side-chains and it involves two
consecutive six centered H-migrarions, which ultimately results in the loss of 54 Da (C4H6,
butadiene).
In summary, many of the more popular cathinone derivative drugs of abuse contain cyclic
tertiary amine moieties. In most cases, the cyclic amine is the five-membered pyrrolidine ring.
However, other cyclic amines may appear as additional designer modifications. Product ion
spectra provide useful structural information in these cyclic tertiary amines that do not form stable
acylated derivatives. The table shown below illustrates the structures for a number of the cyclic
tertiary aminoketones as well as their base peaks and major product ions.
Scheme 17. Fragmentation scheme for MS/MS product ion formation in the n-propyl side-chain
D8-azepane analogue.

95
Table 1. Structures for a series of cyclic tertiary aminoketones and their major EI-MS fragment
ions as well as MS/MS product ions.
Parent structure Iminum cation Product ion
The electron ionization mass spectra for Compounds 5–8 also yield the m/z 126 iminium
cation base peaks identical to the base peaks observed for Compounds 1–4. These regioisomeric
iminium cations are the dominant fragments in the spectra and the extensive fragmentation of these
molecules yields very little ion current for the molecular ion. The m/z 135 fragment for the 3,4-
methylenedioxybenzyl cation is the only other high mass ion of significance in these spectra. The
chemical ionization mass spectra confirm the molecular weight for these regioisomers via the

96
intense [M+H]+ ion and the EI mass spectra provide information about that portion of the molecule
bonded to the 3,4-methylenedioxybenzyl moiety common to all these compounds. The GC–CI-
MS studies were performed on a column (30 m ×0.25 mm i.d.) coated with 0.10 μm film of
Crossbond® 100% dimethyl polysiloxane (Rtx®-1). Chromatographic analysis was performed
using a temperature program consisting of an initial hold at 70 °C for 1.0 minute, ramped up to
250 °C at a rate of 30 °C/minute followed by a hold at 250 °C for 15.0 minutes. Figures 34A and
34B below show a representative EI-MS and CI-MS spectra for the desoxy-MDPV analogue,
Compound 6.
A:
4 0 6 0 8 0 1 0 0 1 2 0 1 4 0 1 6 0 1 8 0 2 0 0 2 2 0 2 4 0 2 6 0 2 8 0
0
5 0 0 0 0
1 0 0 0 0 0
1 5 0 0 0 0
2 0 0 0 0 0
2 5 0 0 0 0
3 0 0 0 0 0
3 5 0 0 0 0
4 0 0 0 0 0
4 5 0 0 0 0
5 0 0 0 0 0
5 5 0 0 0 0
m / z - ->
A b u n d a n c e
S c a n 1 0 7 2 (9 . 3 3 5 m in ) : 1 6 1 0 1 8 -7 7 . D \ d a t a . m s
1 2 6 . 1
4 1 . 1 7 7 . 1
9 6 . 1
2 1 8 . 11 4 7 . 0 1 8 8 . 0 2 6 0 . 1

97
B:
The product ion MS/MS spectra for each of the regioisomeric iminium cations generated
by Compounds 5–8 are presented in Figure 35. For MS/MS experiments, the scan type used was
the Automated Method Development function (AMD) and the optimum MS/MS excitation
amplitudes were 1.00 and 1.20 volts. While the EI-MS gave the equivalent iminium cation base
peak for each compound, the corresponding product ion spectra allow differentiation based on the
nature of the cyclic tertiary amine portion and the length of the alkyl side-chain of the iminium
cation. The product ion spectrum for the m/z 126 iminium cation from the azetidine containing
isomer (Figure 35A) indicates the m/z 70 cation as the major fragment. This product ion occurs
via elimination of the C4H8 alkene from the side-chain portion of the m/z 126 iminium cation. This
can be compared to the major product ion at m/z 84 (Figure 35B) observed for the pyrrolidine
containing iminium cation species and this ion results from the loss of the C3H6 alkene from the
[M+H]+
Figure 34. Representative EI-MS (GC–MS System 1) and CI-MS (GC–MS System 2) spectra for
Compound 6.

98
side-chain. The major product ion from the piperidine containing iminium cation (Figure 35C)
occurs at m/z 98 from the analogous loss of C2H4 alkene from the side-chain with some less
abundant product ions at m/z 84 and 70. Thus, the major product ions in Figures 35A–35C
represent a homologous series resulting from the loss of butene, propene and ethylene respectively
from the side-chain. The product ion from the azepane containing iminium cation whose spectrum
is shown in Figure 35D occurs at m/z 72 and is the result of fragmentation of the ring portion of
the m/z 126 iminium cation base peak for Compound 8. The structures for the product ions
described in Figure 35 were confirmed for the analogous aminoketones (Compounds 1–4) using
deuterium labeling of the cyclic tertiary amine and the alkyl side-chain. Thus, these product ion
spectra allow for the differentiation of the m/z 126 iminium cations containing the various ring size
cyclic tertiary amines. The GC–MS/MS studies were performed using the same column described
for the GC–CI-MS studies (Rtx®-1) with a temperature program consisting of an initial hold at 70
°C for 1.0 minute, ramped up to 250 °C at a rate of 30 °C/minute followed by a hold at 250 °C for
7.0 minutes. It is important to note that the source of the iminium cation is a different molecule
(Compounds 1–4 and Compounds 5–8) however, once formed; the iminium cation yields product
ions consistent with its regioisomeric structure.

99
A:
B:

100
C:
D:
84.3
60638
Figure 35. MS/MS product ion spectra for the four regioisomeric m/z 126 base peak iminium
cations of the desoxy phenethylamines. GC–MS System 2.

101
2.2.4. Vapor phase infrared spectrophotometry
The vapor phase infrared spectra for the four desoxy phenethylamines and the four
regioisomeric aminoketones are shown in Figure 36. The overall absorption band shape as well as
individual band position and intensity in the 3000 cm-1 to 2700 cm-1 provide information for
differentiation among the regioisomeric aminoketones as well as the regioisomeric desoxy
phenethylamines. The doublet absorption bands at 1489 cm-1 and 1442 cm-1 are characteristic for
the 3,4-methylenedioxy aromatic ring substitution pattern and the unsymmetrical nature of these
doublet absorption bands indicates the lack of a carbonyl at the benzylic position of the alkyl side-
chain for the desoxy phenethylamines. The analogous aminoketones are characterized by
symmetrical doublet absorption bands centered at this wavelength range and these have been
previuosly discussed in detail in Section 2.1.4.
The four regioisomeric aminoketones are displaying a slight difference related to the
carbonyl absorption band from 1685 cm-1 to 1692 cm-1 for Compounds 1 to 4, respectively. This
may be attributed to the size of the tertiary amine ring for these regioisomers, with azetidine ring
(Compound 1) having a smaller influence on the coplanar structure between the aromatic ring and
the carbonyl functionality (less double bond character) and a greater influence with the isomer
having the azepane ring (Compound 4) which may force the carbonyl group out of the plane (more
double bond character).

102
100020003000Wavenumbers
94
95
96
97
98
99
100
Per
cent
Tra
nsm
itta
nce
3081
3000
2965
2938
2876 2836
2778
1685
1612
1484 1436
1342
1246
1192
1097
1049
944
886
806
575
100020003000Wavenumbers
94
96
98
100
Per
cent
Tra
nsm
itta
nce
3081
2967
2882
2812
1689
1612
1484 1436
1344
1246
1094
1049
945
890
867
806
753
722
575

103
100020003000Wavenumbers
94
96
98
100
Per
cent
Tra
nsm
itta
nce
3082
3015
2966
2939
2887
2866 2808
1690
1612
1485
1438
1384
1345
1244
1160
1103
1049
986
944
879
800
740
723
575
100020003000Wavenumbers
94
95
96
97
98
99
100
Per
cent
Tra
nsm
itta
nce
3081
2931
2866
2777
1692
1612
1484
1436
1346
1245
1130
1096
1049
971
945 8
70
809
769 5
76

104
100020003000Wavenumbers
96
97
98
99
100
Per
cent
Tra
nsm
itta
nce
2998
2962
2932
2878
2823
1489
1442
1351 1303
1245
1191
1123
1049
945
863
805
776
100020003000Wavenumbers
90
92
94
96
98
100
Per
cen
t T
ran
smit
tan
ce
2966
2938
2881
2796
1489
1442
1353
1244
1189
1122
1049
944
857
805

105
The vapor phase infrared spectra (GC–IR) for the two example intermediate ketones
(Compounds c and g) are shown in Figure 37. The carbonyl absorption band for Compound c
occurs at 1696 cm-1 compared to 1724 cm-1 for the unconjugated carbonyl in Compound g. The
symmetrical doublet absorption bands of equal intensities at 1486 and 1439 cm-1 is characteristic
for the 3,4-methylenedioxybenzoyl group in which formal conjugation exists between the aromatic
100020003000Wavenumbers
90
92
94
96
98
100
Per
cent
Tra
nsm
itta
nce
3016
2938
2866
2796
2692
1489
1443
1377
1348
1307
1245
1189
1162
1112
1049
984
945
858
803
100020003000Wavenumbers
92
94
96
98
100
Per
cent
Tra
nsm
itta
nce
3017
2931
2867
2823 2
774
1489
1443
1353
1245
1189
1130
1049
945
856
805
Figure 36. Vapor phase IR spectra (GC–IR) for the four regioisomeric aminoketones (Compounds
1–4) and the four regioisomeric desoxyamines (Compounds 5–8).
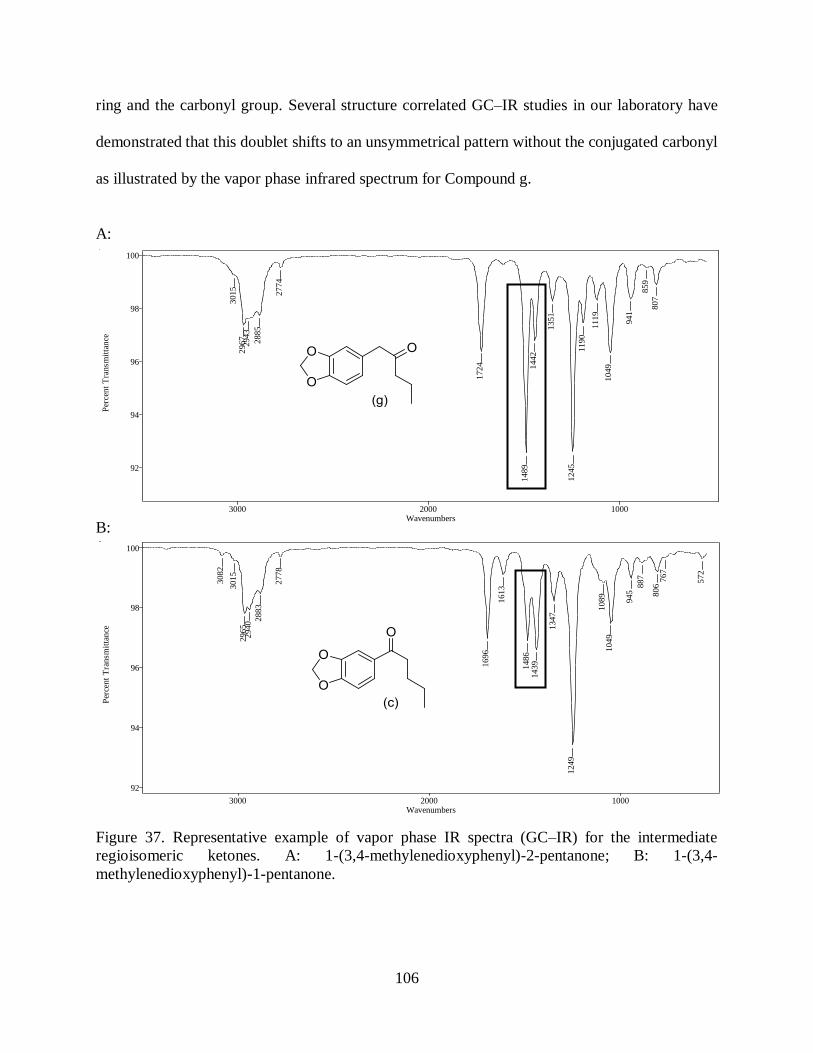
106
ring and the carbonyl group. Several structure correlated GC–IR studies in our laboratory have
demonstrated that this doublet shifts to an unsymmetrical pattern without the conjugated carbonyl
as illustrated by the vapor phase infrared spectrum for Compound g.
A:
B:
100020003000Wavenumbers
92
94
96
98
100
Per
cent
Tra
nsm
itta
nce
3082
3015
2965
2940 2
883
2778
1696
1613
1486
1439
1347
1249
1089
1049
945
887
806
767
572
100020003000Wavenumbers
92
94
96
98
100
Per
cent
Tra
nsm
itta
nce
3015
2967
2943
2885
2774
1724
1489
1442
1351
1245
1190
1119
1049
941
859
807
Figure 37. Representative example of vapor phase IR spectra (GC–IR) for the intermediate
regioisomeric ketones. A: 1-(3,4-methylenedioxyphenyl)-2-pentanone; B: 1-(3,4-
methylenedioxyphenyl)-1-pentanone.

107
2.2.5. Conclusion
Product ion fragmentation of iminium cations provides useful data for differentiation of
regioisomeric cyclic tertiary amines. The cyclic amines azetidine, pyrrolidine, piperidine and
azepane were incorporated into a series of aminoketones and desoxy phenethylamines related to
the cathinone-type drugs of abuse. Variations of ring size and hydrocarbon side-chain length yield
two regioisomeric sets of compounds, aminoketones and desoxy phenethylamines having
equivalent regioisomeric iminium cations base peaks at m/z 126. The CI-MS spectra provide
molecular weight information for these desoxy phenethylamine analogues and their corresponding
aminoketone analogues. The MS/MS product ion spectra provide data to characterize the side-
chain and cyclic tertiary amine portions of the iminium cation base peaks. The product ions from
the m/z 126 iminium cation produced by the desoxy phenethylamines and the aminoketones
containing the azetidine, pyrrolidine, piperidine and azepane cyclic tertiary amines occur at m/z
70, 84, 98 and 72, respectively. The azetidine series of compounds all yield a common product ion
at m/z 70 as long as a four-centered hydrogen rearrangement process is available in the side-chain.
No significant product ion was formed for the azetidine containing iminium cation for the methyl
side-chain homologue since the analogous four centered hydrogen migration is not possible in this
compound. Product ions in the pyrrolidine series are formed via ring and side-chain fragmentation
with side-chain fragmentation dominating in the higher side-chain homologues. The piperidine
containing amines undergo H-migration in the side-chain to yield a common m/z 98 product ion
for the ethyl and n-propyl side-chains while the methyl side-chain homologue undergoes ring
fragmentation. Both side-chain and ring fragmentation yield a mixture of product ions in the higher
side chain homologues for the seven membered cyclic azepane tertiary amines and ring
fragmentation occurs in the smaller alkyl side-chains. Ring fragmentation in the pyrrolidine series

108
results in the loss of 42 Da (C3H6) from the iminium cation base peak, 28 Da (C2H4) for the
piperidine series and 54 Da (C4H6) for the azepane series.
The vapor phase infrared spectra for the regioisomeric desoxy phenethylamines are
characterized by unsymmetrical doublet absorption bands at 1489 cm-1 and 1442 cm-1 that
indicates the lack of a carbonyl group at the benzylic position of the alkyl side-chain. However,
the corresponding regioisomeric aminoketones show a doublet absorption pattern with peaks
centered at 1484 cm-1 and 1436 cm-1. The aminoketones and the desoxy phenethylamine
regioisomers were separated in capillary gas chromatography experiments using an Rxi®-17Sil
MS stationary phase and the aminoketones showing greater retention than the desoxy
phenethylamines. In both series of compounds chromatographic retention was related to the ring
size of the cyclic tertiary amines with the azetidine containing analogue eluting first and the
azepane containing derivative eluting last.

109
2.3. Product ion MS/MS differentiation of regioisomeric side-chain groups in cathinone
derivatives
Precursor materials are available to prepare aminoketone drugs containing regioisomeric
n-propyl and isopropyl side-chain groups related to the drug alpha-pyrrovalerone (Flakka) and
MDPV (3,4-methylenedioxypyrrovalerone). The regioisomeric compounds related to Flakka and
MDPV were prepared and evaluated in EI-MS and MS/MS product ion experiments. These
compounds yield equivalent regioisomeric iminium cation base peaks at m/z 126 in EI-MS spectra.
This study describes the use of product ion spectra with deuterium labeling in the analysis
of regioisomeric iminium cations generated by the EI-MS for a series of n-propyl and isopropyl
side-chain cathinone-type tertiary amines (MDPV, iso-MDPV, Flakka and iso-Flakka). These
iminium cation base peaks show characteristic product ion spectra, which allow differentiation of
the side-chain n-propyl and isopropyl groups in the structure. The n-propyl side-chain containing
iminium cation base peak (m/z 126) in the EI-MS yields a major product ion at m/z 84 while the
regioisomeric m/z 126 base peak for the isopropyl side-chain yields a characteristic product ion at
m/z 70. Deuterium labeling in both the pyrrolidine ring and the alkyl side-chain confirmed the
process for the formation of these major product ions.
These regioisomeric compounds yield equivalent EI-MS, CI-MS and IR spectra. However,
MS/MS product ion fragmentation provides useful data for differentiation of n-propyl and
isopropyl side-chain iminium cations from these cathinone derivative drugs of abuse.

110
2.3.1. Synthesis of the aminoketone derivatives containing regioisomeric n-propyl and
isopropyl side-chain groups
The precursor ketone valerophenone needed for the synthesis of the current popular drug
of abuse alpha-pyrrovalerone (alpha-PVP, Flakka) is available from a variety of commercial
sources. The regioisomeric precursor ketone having the isopropyl side-chain, isovalerophenone, is
also a commercially available material. The bromination and subsequent substitution with
pyrrolidine of these phenones yields Compounds 1 and 2. MDPV and iso-MDPV (Compounds 3
and 4) can be prepared from the starting material piperonal using the same procedure prescribed
previously in Section 2.1.1. The deuterated bromoalkanes were used along with magnesium metal
to prepare the appropriate labeled Grignard reagents. These deuterated reagents were used to
prepare the desired deuterium labeled analogues. The compounds were purified using preparative
TLC.
2.3.2. Gas chromatographic separation
The chromatograms in Figure 38 shows the GC separation of the regioisomeric side-chain
compounds for both the aromatic ring unsubstituted compounds and the 3,4-methylenedioxy
substituted aromatic ring. The separations were obtained on a column (30 m × 0.25 mm i.d.) coated
with 0.10 μm film of Crossbond® 5% diphenyl, 95% dimethyl polysiloxane (Rtx®-5). The
temperature program consisted of an initial hold at 70 °C for 1.0 minute, ramped up to 250 °C at
a rate of 30 °C/minute followed by a hold at 250 °C for 15.0 minutes (with an injector temperature
of 150 °C). In both chromatograms, the branched chain regioisomer elutes before the linear n-
propyl side-chain isomer. This elution order was also observed in the intermediate ketone materials
in Figure 39.

111
A:
B:
4
7.00 7.50 8.00 8.50 9.00 9.50 10.00
50000
100000
150000
200000
250000
300000
350000
400000
450000
Time-->
Abundance
TIC: 151204-87.D\ data.ms
3
Figure 38. GC separation of the compounds in this study. A: Compounds 1 and 2; B: Compounds
3 and 4. Rtx®-5 stationary phase.
5 .2 0 5 .4 0 5 .6 0 5 .8 0 6 .0 0 6 .2 0 6 .4 0 6 .6 0 6 .8 0 7 .0 0 7 .2 0 7 .4 0 7 .6 0 7 .8 0 8 .0 0 8 .2 0 8 .4 0 8 .6 0
1 0 0 0 0 0
2 0 0 0 0 0
3 0 0 0 0 0
4 0 0 0 0 0
5 0 0 0 0 0
6 0 0 0 0 0
7 0 0 0 0 0
8 0 0 0 0 0
9 0 0 0 0 0
1 0 0 0 0 0 0
1 1 0 0 0 0 0
1 2 0 0 0 0 0
1 3 0 0 0 0 0
1 4 0 0 0 0 0
1 5 0 0 0 0 0
T im e -->
A b u n d a n c e
T IC : 1 5 1 2 0 4 -6 9 .D \ d a ta .m s
1 2

112
A:
B:
c
4 .5 0 5 .0 0 5 .5 0 6 .0 0 6 . 5 0 7 .0 0 7 .5 0 8 . 0 0 8 .5 0
1 0 0 0 0 0 0
2 0 0 0 0 0 0
3 0 0 0 0 0 0
4 0 0 0 0 0 0
5 0 0 0 0 0 0
6 0 0 0 0 0 0
7 0 0 0 0 0 0
8 0 0 0 0 0 0
9 0 0 0 0 0 0
1 e + 0 7
1 . 1 e + 0 7
1 . 2 e + 0 7
1 . 3 e + 0 7
T im e -->
A b u n d a n c e
T IC : 1 5 1 2 0 4 -6 0 . D \ d a ta . m s
d
4 . 0 0 5 . 0 0 6 . 0 0 7 . 0 0 8 . 0 0 9 . 0 0 1 0 . 0 0
5 0 0 0 0 0
1 0 0 0 0 0 0
1 5 0 0 0 0 0
2 0 0 0 0 0 0
2 5 0 0 0 0 0
3 0 0 0 0 0 0
3 5 0 0 0 0 0
4 0 0 0 0 0 0
4 5 0 0 0 0 0
5 0 0 0 0 0 0
5 5 0 0 0 0 0
6 0 0 0 0 0 0
6 5 0 0 0 0 0
7 0 0 0 0 0 0
7 5 0 0 0 0 0
8 0 0 0 0 0 0
8 5 0 0 0 0 0
9 0 0 0 0 0 0
9 5 0 0 0 0 0
T i m e - - >
A b u n d a n c e
T I C : 1 5 1 2 0 4 - 5 7 . D \ d a t a . m sa
b
Figure 39. GC separation of the intermediate ketones. A: valerophenone and isovalerophenone; B:
3,4-methylenedioxyvalerophenone and 3,4-methylenedioxyisovalerophenone. Rtx®-5 stationary
phase.

113
2.3.3. Mass spectral studies (EI-MS, CI-MS and MS/MS)
The differentiation between MDPV and iso-MDPV as well as Flakka and iso-Flakka in
their pure forms can be easily performed via NMR spectroscopy. The proton NMR splitting
patterns for a straight chain n-propyl and branched chain isopropyl groups can readily identify
these compounds. However, NMR spectroscopy is less applicable to mixture and trace analysis
often required for forensic drug identification and biological sample analysis. The present method
can be used in the analysis of mixtures or trace amounts of the studied compounds.
The unsubstituted aromatic ring and the 3,4-methylenedioxy substituted ring subdivide
these four compounds based on their molecular weight. However, the regioisomeric n-propyl and
isopropyl side-chains yield equivalent iminium cation base peaks for all four of these compounds.
The mass spectra in Figure 40 show the m/z 126 iminium cation base peak for the unsubstituted
aromatic ring isomers, Compounds 1 and 2 (Flakka and iso-Flakka) and the 3,4-methylenedioxy
derivatives, Compounds 3 and 4 (MDPV and iso-MDPV). The mass spectra for these four
compounds show the m/z 126 iminium cation as the dominant ion in the spectrum and the base
peak. Thus, the EI-MS for Compounds 1 and 2 as well as 3 and 4 are essentially identical showing
no distinguishing ions to differentiate the straight n-propyl and the branched isopropyl chain
iminium cations.

114
A:
B:
4 0 6 0 8 0 1 0 0 1 2 0 1 4 0 1 6 0 1 8 0 2 0 0 2 2 0 2 4 0 2 6 0 2 8 0
0
1 0 0 0 0
2 0 0 0 0
3 0 0 0 0
4 0 0 0 0
5 0 0 0 0
6 0 0 0 0
7 0 0 0 0
8 0 0 0 0
9 0 0 0 0
1 0 0 0 0 0
1 1 0 0 0 0
1 2 0 0 0 0
1 3 0 0 0 0
1 4 0 0 0 0
1 5 0 0 0 0
1 6 0 0 0 0
1 7 0 0 0 0
m / z - - >
A b u n d a n c e
S c a n 2 6 6 ( 6 . 6 3 7 m i n ) : 1 5 1 2 0 4 - 6 9 . D \ d a t a . m s
1 2 6 . 1
7 7 . 14 1 . 0
1 0 5 . 0
1 8 8 . 1 2 2 9 . 01 6 0 . 1 2 0 7 . 1
4 0 6 0 8 0 1 0 0 1 2 0 1 4 0 1 6 0 1 8 0 2 0 0 2 2 0 2 4 0 2 6 0 2 8 0
0
2 0 0 0 0 0
4 0 0 0 0 0
6 0 0 0 0 0
8 0 0 0 0 0
1 0 0 0 0 0 0
1 2 0 0 0 0 0
1 4 0 0 0 0 0
1 6 0 0 0 0 0
1 8 0 0 0 0 0
2 0 0 0 0 0 0
2 2 0 0 0 0 0
2 4 0 0 0 0 0
2 6 0 0 0 0 0
m / z - - >
A b u n d a n c e
S c a n 5 7 9 ( 6 . 4 6 2 m in ) : 1 5 1 1 2 4 - 7 8 . D \ d a t a . m s
1 2 6 . 1
7 7 . 1
5 5 . 11 0 5 . 0
1 8 8 . 11 5 9 . 1 2 3 0 . 12 0 6 . 9

115
C:
D:
4 0 6 0 8 0 1 0 0 1 2 0 1 4 0 1 6 0 1 8 0 2 0 0 2 2 0 2 4 0 2 6 0 2 8 0
0
2 0 0 0 0
4 0 0 0 0
6 0 0 0 0
8 0 0 0 0
1 0 0 0 0 0
1 2 0 0 0 0
1 4 0 0 0 0
1 6 0 0 0 0
1 8 0 0 0 0
2 0 0 0 0 0
2 2 0 0 0 0
2 4 0 0 0 0
m / z -->
A b u n d a n c e
S c a n 2 2 2 9 (1 6 . 0 7 9 m in ): 1 6 0 1 1 9 -1 0 . D \ d a ta .m s
1 2 6 . 1
1 4 9 . 06 5 .1 9 6 .14 2 .02 3 2 . 1 2 7 3 . 12 0 4 . 11 7 5 . 0
4 0 6 0 8 0 1 0 0 1 2 0 1 4 0 1 6 0 1 8 0 2 0 0 2 2 0 2 4 0 2 6 0 2 8 0
0
5 0 0 0 0
1 0 0 0 0 0
1 5 0 0 0 0
2 0 0 0 0 0
2 5 0 0 0 0
3 0 0 0 0 0
3 5 0 0 0 0
4 0 0 0 0 0
4 5 0 0 0 0
5 0 0 0 0 0
5 5 0 0 0 0
m / z - - >
A b u n d a n c e
S c a n 2 0 5 5 ( 1 5 . 0 6 5 m in ) : 1 6 0 1 1 9 - 2 3 . D \ d a t a . m s
1 2 6 . 1
1 4 9 . 17 0 . 1 9 6 . 14 1 . 1 2 3 2 . 12 0 4 . 1 2 7 1 . 11 7 4 . 1
Figure 40. Full scan EI-MS spectra for Compounds1–4 (Flakka, iso-Flakka, MDPV and iso-
MDPV). GC–MS System 1.

116
The GC–CI-MS studies were performed on a column (30 m × 0.25 mm i.d.) coated with
0.25 μm film of Crossbond® 100% trifluoropropylmethyl polysiloxane (Rtx®-200). The chemical
ionization mass spectra in Figure 41 confirm the molecular weight for the two sets of the
regioisomeric aminoketones, Flakka and iso-Flakka as well as MDPV and iso-MDPV via the
intense [M+H]+ ion. These spectra were generated using methanol as the CI reagent gas. Thus,
GC–CI-MS confirms the molecular weight for these compounds and the EI mass spectra provide
information about that portion of the molecule bonded to the benzoyl moiety or the 3,4-
methylenedioxybenzoyl moiety common to all these compounds. Chromatographic analysis was
performed using a temperature program consisting of an initial hold at 70 °C for 1.0 minute,
ramped up to 250 °C at a rate of 30 °C/minute followed by a hold at 250 °C for 15.0 minutes.
A:
[M+H]+

117
B:
C:
[M+H]+
[M+H]+

118
D:
The product ion spectra (MS/MS) for the straight n-propyl chain and branched isopropyl
chain substituted iminium cations show unique and characteristic product ions which allow
differentiation of these regioisomeric side-chains. For MS/MS experiments, the scan type used
was the Automated Method Development function (AMD) and the optimum MS/MS excitation
amplitudes ranged from 0.20 to 1.60 volts. The GC–MS/MS studies were performed using the
same column described for the GC–CI-MS studies (Rtx®-200) with a temperature program
consisting of an initial hold at 70 °C for 1.0 minute, ramped up to 250 °C at a rate of 30 °C/minute
followed by a hold at 250 °C for 7.0 minutes.
Figure 42 shows the MS/MS product ion spectra for the n-propyl side-chain m/z 126
iminium cation and the isopropyl side-chain cation generated from Compounds 1 and 2, Flakka
and iso-Flakka, respectively. The base peak iminium cation (m/z 126) for the n-propyl side chain
[M+H]+
Figure 41. Chemical ionization mass spectra (CI-MS) for Compounds 1–4. GC–MS System 2.

119
in Compound 1 yields a major product ion at m/z 84 while the isopropyl side-chain shows the
major product ion at m/z 70. Thus, the regioisomeric side-chains yielding equivalent EI-MS base
peaks at m/z 126 for Compounds 1 and 2 can be easily differentiated by their unique major product
ions.
A:

120
B:
Figure 43 illustrates the equivalent product ion spectral results for the m/z 126 iminium
cations generated from Compounds 3 and 4, MDPV and iso-MDPV, respectively. The source of
the iminium cation is a different molecule however, once formed; the iminium cation yields
product ions consistent with its regioisomeric structure.
Figure 42. MS/MS product ion spectra for the m/z 126 iminium cation base peak for A: alpha-
PVP (Compound 1); B: iso-alpha-PVP (Compound 2).

121
A:
B:
Figure 43. MS/MS product ion spectra for the m/z 126 iminium cation base peak for A: MDPV
(Compound 3); B: iso-MDPV (Compound 4).

122
The mechanistic details for the formation of these diagnostic product ions at m/z 84 and
m/z 70 were examined via deuterium labeling experiments. The spectra in Figure 44 show the EI-
MS and product ion spectrum for the iminium cation generated from the D4-analogue of
Compound 1. This D4-analogue of Compound 1 was prepared using 2,2,5,5-D4-pyrrolidine as the
amine component in the synthetic process. Figure 44A confirms the incorporation of the four
deuterium atoms into the iminium cation at m/z 130 for the full EI-MS for this labeled molecule.
Figure 44B further shows the mass shift of +4 Da to m/z 88 for the product ion spectrum confirming
that all four deuterium labels remain in the product ion and the hydrogen, which migrates, must
come from the n-propyl side-chain. This fragmentation process has been previously discussed for
the D4-analogue of MDPV (in Section 2.1.3.) and D8-analogue of MDPV (in Section 2.2.3.)
confirming the n-propyl side-chain as the source of the migrating hydrogen.
A:
4 0 6 0 8 0 1 0 0 1 2 0 1 4 0 1 6 0 1 8 0 2 0 0 2 2 0 2 4 0 2 6 0 2 8 0
0
1 0 0 0 0 0 0
2 0 0 0 0 0 0
3 0 0 0 0 0 0
4 0 0 0 0 0 0
5 0 0 0 0 0 0
6 0 0 0 0 0 0
7 0 0 0 0 0 0
8 0 0 0 0 0 0
m / z -->
A b u n d a n c e
S c a n 6 0 2 (6 . 5 9 6 m in ) : 1 5 1 1 2 4 -1 1 3 . D \ d a t a . m s
1 3 0 . 2
7 7 . 1
4 4 . 1 1 0 5 . 0
1 9 2 . 21 6 4 . 1 2 3 4 . 22 1 2 . 1

123
B:
The proposed mechanism for the formation of the m/z 70 product ion for the isopropyl side-
chain containing iminium cation is shown within Figure 42B. The formation of the m/z 70 product
ion would involve the loss of the entire four carbon fragment (C4H8) attached to the pyrrolidine
nitrogen or perhaps the four carbons of the pyrrolidine ring. The mechanism shown within Figure
33B suggests the loss of isobutene (C4H8) from the side-chain to account for the formation of the
m/z 70 major product ion. Deuterium labeling of both the pyrrolidine ring and the isopropyl side-
chain was used to gather support for the proposed mechanism. The D4-analogue of Compound 2
was prepared from 2,2,5,5-D4-pyrrolidine and the product ion spectrum as well as the full EI-MS
scan are presented in Figure 45. The mechanism described for the product ion formation in the
case of the isopropyl side-chain would suggest conserving three of the four deuterium labels in the
resulting product ion. The spectrum in Figure 45A confirms the incorporation of the four deuterium
Figure 44. Mass spectra for the 2,2,5,5-D4-pyrrolidine ring analogue of Compound 1. A: EI-MS
full scan; B: product ion spectrum for the m/z 130 iminium cation.

124
labels into the molecule and the resulting iminium cation base peak occurs at m/z 130 in the full
EI-MS scan. The major product ion in Figure 45B confirms the +3 Da mass shift for the dominant
product ion at m/z 73. This m/z 73 product ion also supports the loss of one deuterium in the
formation of the product ion from the m/z 130 D4-iminium cation base peak for the D4-analogue
of Compound 2.
A:
4 0 6 0 8 0 1 0 0 1 2 0 1 4 0 1 6 0 1 8 0 2 0 0 2 2 0 2 4 0 2 6 0 2 8 0
0
5 0 0 0 0
1 0 0 0 0 0
1 5 0 0 0 0
2 0 0 0 0 0
2 5 0 0 0 0
3 0 0 0 0 0
3 5 0 0 0 0
4 0 0 0 0 0
4 5 0 0 0 0
5 0 0 0 0 0
5 5 0 0 0 0
6 0 0 0 0 0
m / z - - >
A b u n d a n c e
S c a n 2 3 3 ( 6 . 4 4 5 m in ) : 1 5 1 2 0 4 - 3 5 . D \ d a t a . m s
1 3 0 . 2
7 7 . 0
1 0 5 . 05 1 . 1
1 9 2 . 21 6 3 . 1 2 1 9 . 9

125
B:
Additional support for the mechanism of formation of the product ion from the iminium
cation base peak in Compound 2 comes from the spectra in Figure 46. These results show the EI-
MS as well as the product ion spectrum for the D7-isopropyl side-chain analogue of Compound 2.
The EI-MS of this compound shows the iminium cation base peak at m/z 133, a +7 Da mass shift
compared to the m/z 126 fragment in the unlabeled compound (Figure 46A). The product ion
spectrum for the m/z 133 iminium cation (Figure 46B) shows a +1 Da mass shift to m/z 71
indicating one deuterium from the D7-isopropyl group remaining in the product ion fragment.
Thus, one deuterium migrated from the isopropyl portion of the side-chain to form the m/z 71
major product ion in the spectrum for the D7-isopropyl side-chain compounds with both the
unsubstituted and 3,4-methylenedioxy substituted aromatic ring. The identical EI and product ion
Figure 45. Mass spectra for the 2,2,5,5-D4-pyrrolidine ring analogue of Compound 2. A: EI-MS
full scan; B: product ion spectrum for the m/z 130 iminium cation.

126
fragments were confirmed by equivalent deuterium labeling experiments in iso-MDPV,
Compound 4 (spectra not shown).
A:
4 0 6 0 8 0 1 0 0 1 2 0 1 4 0 1 6 0 1 8 0 2 0 0 2 2 0 2 4 0 2 6 0 2 8 0
0
2 0 0 0 0 0
4 0 0 0 0 0
6 0 0 0 0 0
8 0 0 0 0 0
1 0 0 0 0 0 0
1 2 0 0 0 0 0
1 4 0 0 0 0 0
1 6 0 0 0 0 0
1 8 0 0 0 0 0
2 0 0 0 0 0 0
m / z - ->
A b u n d a n c e
S c a n 1 0 7 2 (9 . 3 3 5 m in ) : 1 6 0 1 2 1 -2 8 . D \ d a t a . m s
1 3 3 . 2
7 7 . 11 0 5 . 1
5 1 . 1 1 8 8 . 1 2 3 5 . 21 6 0 . 1 2 1 3 . 1

127
B:
2.3.4. Vapor phase infrared spectrophotometry
The vapor phase infrared spectra for the two aromatic ring unsubstituted compounds and
the two 3,4-methylenedioxy aromatic ring substituted compounds are shown in Figure 47. Each
set of regioisomers displays very similar spectral information. However, the isopropyl side-chain
substituted regioisomer has a carbonyl absorption band lower than the n-propyl side-chain
substituted regioisomer, which could be attributed to the steric effect of the alkyl side-chain on the
coplanarity and the resonance between the aromatic ring and the carbonyl functionality. The 3,4-
methylenedioxy aromatic ring substituted compounds are characterized by symmetrical doublet
absorption bands centered at 1484 cm-1 and 1436 cm-1 and these have been previuosly discussed
in detail in Section 2.1.4.
Figure 46. Mass spectra for the D7-isopropyl side-chain analogue of Compound 2. A: EI-MS full
scan; B: product ion spectrum for the m/z 133 iminium cation.

128
A:
B:
100020003000Wavenumbers
92
94
96
98
100
Per
cent
Tra
nsm
itta
nce
3068
3027
2966
2882
2811
1694
1595
1450
1357
1241
1203
1181
1018
953
903 8
29
768
695
609
100020003000Wavenumbers
92
94
96
98
100
Per
cent
Tra
nsm
itta
nce
3069 3
031
2966
2881
2816
1688
1594
1465
1451
1357
1283
1208
1178
1106
1022
997
927 837 772
692
666

129
C:
D:
100020003000Wavenumbers
94
96
98
100
Per
cent
Tra
nsm
itta
nce
3081
2967
2882
2812
1689
1612
1484 1436
1344
1246
1094
1049
945
890
867
806
753
722
575
100020003000Wavenumbers
92
94
96
98
100
Per
cent
Tra
nsm
itta
nce
3081
2966
2881
2816
1682
1611
1484
1436
1348
1242
1095
1049
942
890
798
721
675
575
Figure 47. Vapor phase infrared spectra for Compounds 1–4 (Flakka, iso-Flakka, MDPV and iso-
MDPV).

130
2.3.5. Conclusion
Regioisomeric n-propyl and isopropyl side-chains in aminoketone cathinone derivatives
such as alpha-PVP and MDPV can be differentiated by MS/MS product ion fragmentation. The
precursor materials are commercially available for the production of both regioisomeric side-
chains. The full EI-MS scan for these compounds yields regioisomeric iminium cations of the same
mass at m/z 126 for alpha-PVP and MDPV. The major product ion formed from the base peak
iminium cation at m/z 126 for the n-propyl side-chain occurs at m/z 84. However, the major product
ion for the m/z 126 having the isopropyl side-chain occurs at m/z 70. Thus, the product ion MS/MS
spectrum clearly differentiates these two regioisomeric m/z 126 iminium cations. Deuterium
labeling of these molecules in the pyrrolidine ring as well as the alkyl side-chain confirmed the
mechanistic process for the formation of these major product ions.
The vapor phase infrared spectra for these regioisomeric compounds show very similar
bands that cannot distinguish each set of regioisomers. However, the isopropyl side-chain
regioisomers have a lower carbonyl absorption bands than the n-propyl substituted regioisomers.

131
2.4. GC–MS, GC–MS/MS and GC–IR differentiations of carbonyl modified analogues of
MDPV
A combination of GC–MS, GC–MS/MS and GC–IR techniques can be used to differentiate
2,3- and 3,4-MDPV from the carbonyl modified analogues, aminoalcohols and the corresponding
desoxy substituted phenethylamines. These six compounds all yield the identical base peak
iminium cation at m/z 126 in their electron ionization mass spectrum. The MS/MS evaluation of
the iminium cation fragment yields identical major product ions at m/z 84. Soft ionization via
methanol CI-MS confirms the molecular weight for all these compounds. The only peak in the CI-
MS for the aminoketones and the desoxy substituted phenethylamines occurs at [M+H]+. The
aminoalcohols show a characteristic fragment ion in CI-MS corresponding to the loss of H2O from
the [M+H]+. Vapor phase infrared spectra (GC–IR) confirm the aromatic ring substitution pattern
via unique absorption in the 1450 cm-1 range. In all GC separations the 2,3-methylenedioxy
substituted isomer elutes before the analogous 3,4-isomer.

132
2.4.1. Synthesis of the carbonyl modified analogues of MDPV
2.4.1.1. Synthesis of the aminoketones and aminoalcohol derivatives
The desired regioisomeric aminoketones were prepared individually from piperonal and
2,3-methylenedioxybenzaldehyde using the same procedure prescribed previously in Section
2.1.1. The two isomeric aminoalcohol analogues (2,3- and 3,4- substituted isomers) were prepared
individually by LAH (lithium aluminum hydride) reduction of 2,3- and 3,4-MDPV, respectively.
2.4.1.2. Synthesis of the desoxy phenethylamine derivatives
The desired regioisomeric desoxy phenethylamines were also prepared individually from
piperonal and 2,3-methylenedioxybenzaldehyde using the procedure described in Section 2.2.1.2.
The six final products were isolated by solvent extraction and purified by preparative thin layer
chromatography (TLC) 20:80 ethyl acetate-petroleum ether using Analtech (Newark, DE) glass
backed 20 x 20 cm plates with a 1000 µm layer of silica and an inorganic fluorescent 254 nm
indicator. Scheme 18 shown below briefly describes the synthesis of the six target compounds.
Scheme 18. General synthetic scheme for the six target compounds in this study.

133
2.4.2. Gas chromatographic separation
The structures for the regioisomeric intermediate ketones and the GC separation of these
compounds are shown in Figure 48. These compounds were separated in less than 8.0 minutes
using a column (30 m × 0.25 mm i.d.) coated with 0.25 μm film of midpolarity Crossbond®
silarylene phase; similar to 50% phenyl, 50% dimethyl polysiloxane (Rxi®-17Sil MS). Both of the
2-pentanone isomers elute before the 1-pentanones and the 2,3-methylenedioxy substituted isomer
elutes before the 3,4-isomer for each of the pairs of regioisomeric ketones. The critical peak pair
in Figure 48 (Compounds d and a) represent the 3,4-methylenedioxyphenyl-2-pentanone and the
2,3-methylenedioxyphenyl-1-pentanone isomers. These regioisomeric intermediate ketones were
separated using a temperature program consisting of an initial hold at 70 °C for 1.0 minute, ramped
up to 250 °C at a rate of 30 °C/minute followed by a hold at 250 °C for 15.0 minutes.
d b
6 . 4 0 6 . 6 0 6 . 8 0 7 . 0 0 7 . 2 0 7 . 4 0 7 . 6 0 7 . 8 0 8 . 0 00
5 0 0 0 0
1 0 0 0 0 0
1 5 0 0 0 0
2 0 0 0 0 0
2 5 0 0 0 0
3 0 0 0 0 0
3 5 0 0 0 0
4 0 0 0 0 0
4 5 0 0 0 0
5 0 0 0 0 0
5 5 0 0 0 0
T i m e - - >
A b u n d a n c e
T I C : 1 6 0 7 0 1 - 0 0 9 6 . D \ d a t a . m s
a
c
Figure 48. Capillary gas chromatographic separation of the four regioisomeric intermediate
ketones on Rxi®-17Sil MS stationary phase. GC–MS System 1.

134
The GC separation in Figure 49 was obtained on a column (30 m × 0.25 mm i.d.) coated
with 0.10 μm film of Crossbond® 100% dimethyl polysiloxane (Rtx®-1) and it shows the resolution
of the keto and desoxy analogues in this study (Compounds 1, 2, 5 and 6). The regioisomeric
desoxy analogues, Compounds 5 and 6, elute before either of the carbonyl containing 2,3- and 3,4-
MDPV isomers (Compounds 1 and 2) on this nonpolar stationary phase. In each case, the 2,3-
methylenedioxy substituted isomer eluted well before the 3,4-isomer for each of the equivalent
regioisomeric side-chains. The separation of the keto and desoxy analogues was carried out using
CI technique (using methanol as the reagent gas). The temperature program applied for CI analysis
consisted of an initial hold at 70 °C for 1.0 minute, ramped up to 250 °C at a rate of 30 °C/minute
followed by a hold at 250 °C for 15.0 minutes.
The chromatogram for the separation of the aminoalcohols, Compounds 3 and 4, is shown
in Figure 50. This chromatogram shows two major peaks and suggests the possibility of some
secondary products of lower relative concentration. These secondary products or broad
peaks/baseline in the chromatogram are likely the result of diastereomeric products. These
5
6
1
2
Figure 49. Capillary gas chromatographic separation of the aminoketones and their desoxy
analogues on Rtx®-1 stationary phase. GC–MS System 2 (CI technique).

135
diastereoisomeric forms of the aminoalcohols are the result of the formation of the second chiral
center in these compounds upon reduction of the ketone functionality to the alcohol. The elution
order of these aminoalcohols with the methylenedioxy substitution patterns again shows the 2,3-
substituted regioisomer eluting before the analogous 3,4-regioisomer. The aminoalcohol
regioisomers were separated by using the same column and temperature program applied for the
intermediate ketones in Figure 48.
2.4.3. Mass spectral studies (EI-MS, CI-MS and MS/MS)
The GC–CI-MS (using methanol as the reagent gas) and the GC–MS/MS studies for the
aminoalcohol derivatives as well as the desoxy phenethylamine derivatives were performed on a
column (30 m × 0.25 mm i.d.) coated with 0.10 μm film of Crossbond® 100% dimethyl
polysiloxane (Rtx®-1). For MS/MS experiments, the scan type used was the Automated Method
Development function (AMD) and the optimum MS/MS excitation amplitude was 1.20 volts.
MS/MS analysis was performed using a temperature program consisting of an initial hold at 70 °C
8 . 0 0 8 . 5 0 9 . 0 0 9 . 5 0 1 0 . 0 0 1 0 . 5 0 1 1 . 0 0 1 1 . 5 0 1 2 . 0 0 1 2 . 5 0 1 3 . 0 0
2 0 0 0 0 0
4 0 0 0 0 0
6 0 0 0 0 0
8 0 0 0 0 0
1 0 0 0 0 0 0
1 2 0 0 0 0 0
1 4 0 0 0 0 0
1 6 0 0 0 0 0
1 8 0 0 0 0 0
2 0 0 0 0 0 0
2 2 0 0 0 0 0
2 4 0 0 0 0 0
2 6 0 0 0 0 0
2 8 0 0 0 0 0
T i m e - - >
A b u n d a n c e
T I C : 1 6 0 7 0 1 - 0 0 1 1 . D \ d a t a . m s
3 4
Figure 50. Capillary gas chromatographic separation of the aminoalcohol analogues on Rxi®-17Sil
MS stationary phase. GC–MS System 1.

136
for 1.0 minute, ramped up to 250 °C at a rate of 30 °C/minute followed by a hold at 250 °C for 7.0
minutes. The mass spectral characterization of the 2,3- and 3,4- methylenedioxyphenyl-
aminoalcohols is shown in Figures 51 and 52, respectively. Panel A in each figure shows the
chemical ionization mass spectra (CI-MS) using methanol vapor as the reagent gas/proton source.
This soft ionization technique is a useful method for molecular weight determination for
compounds that undergo extensive fragmentation in electron ionization mass spectrometry (EI-
MS). The methanol CI spectrum shown in panel A in Figures 51 and 52 indicates significant
protonated molecular ion [M+H]+ at m/z 278. However, a significant fragment at m/z 260 resulting
from the loss of 18 Da, water (H2O), from the [M+H]+ ion is also present in these regioisomeric
aminoalcohols. This loss of H2O in these compounds confirms the presence of the alcohol
functionality in Compounds 3 and 4. The fragmentation schemes shown within Figures 51A and
52A indicate the [M+H]+ fragment as the protonated OH group, however the protonated amine is
also a reasonable structure for the [M+H]+ ion. The loss of water from the [M+H]+ would follow
OH protonation and this elimination process could be assisted by the nitrogen to yield the
aziridinium species as well as the benzylic carbocation as shown in the fragment schemes. The
spectrum in Figure 52A indicates the fragment resulting from the loss of H2O is more significant
in the 3,4- isomer than in the 2,3 isomer. This could be attributed to the additional stabilization of
the protonated hydroxyl group supported by the oxygen at the 2-position of the 2,3-
methylenedioxy group in Compound 3. Moreover, the resonance stabilization of the benzylic
carbocation by the oxygen at the 4-position of the 3,4-methylenedioxy group in Compound 4.

137
Panel B in Figures 51 and 52 represents the EI mass spectra for Compounds 3 and 4
illustrating the dominance of the iminium cation fragment and the lack of significant molecular
radical cation and molecular weight information. This m/z 126 iminium cation is the same base
peak as that observed for the aminoketones 2,3- and 3,4-MDPV, Compounds 1 and 2. The EI mass
spectra for Compounds 1 and 2 have been described in Section 2.1.3. Thus, these aminoalcohols
yield the identical base peak as that observed for the corresponding aminoketone analogues.
The product ion spectra for the m/z 126 iminium cation fragments are shown in panel C in
Figures 51 and 52 for Compounds 3 and 4, respectively. These identical spectra indicate the major
product ion from the iminium cation occurs at m/z 84. This loss of 42 Da corresponds to the
elimination of a C3H6 alkene as expected. Previous studies (described in Sections 2.1.3., 2.2.3. and
2.3.3.) using deuterium labeling experiments identified the n-propyl side-chain as the moiety
eliminated in the hydrogen rearrangement product ion formation. Other combinations of
hydrocarbon side-chain and cyclic tertiary amine rings (described in Section 2.2.3.) can yield
regioisomeric forms of the m/z 126 iminium cation. However, these other m/z 126 base peaks yield
unique product ions at other characteristic masses. It is only the m/z 126 iminium cation resulting
from the combination of the n-propyl side-chain and the pyrrolidine ring, which yields the major
m/z 84 product ion. The m/z 126 iminium cations generated from a combination of the appropriate
n-alkyl side-chain and the 4-membered ring azetidine, 6-membered ring piperidine and 7-
membered ring azepane yield major MS/MS product ions at m/z 70, 98 and 72, respectively. Thus,
a combination of CI-MS, EI-MS and MS/MS spectra provides information to characterize a
significant portion of the structural details of the analogues in this study. The CI-MS provides
molecular weight information for this series of analogues, which undergo extensive EI

138
fragmentation. The EI-MS data yield primarily the iminium cation fragment and the MS/MS
spectra differentiate the cyclic amine and side-chain portions of the iminium cation.
A:
B:
4 0 6 0 8 0 1 0 0 1 2 0 1 4 0 1 6 0 1 8 0 2 0 0 2 2 0 2 4 0 2 6 0 2 8 0
0
2 0 0 0 0 0
4 0 0 0 0 0
6 0 0 0 0 0
8 0 0 0 0 0
1 0 0 0 0 0 0
1 2 0 0 0 0 0
1 4 0 0 0 0 0
1 6 0 0 0 0 0
1 8 0 0 0 0 0
2 0 0 0 0 0 0
2 2 0 0 0 0 0
2 4 0 0 0 0 0
m / z - - >
A b u n d a n c e
S c a n 1 1 9 7 ( 1 0 . 0 6 4 m in ) : 1 6 0 3 1 6 - 1 6 0 . D \ d a t a . m s
1 2 6 . 2
8 4 . 16 5 . 14 2 . 1 1 4 9 . 1 2 0 4 . 2 2 3 0 . 21 0 8 . 1 2 5 9 . 11 7 7 . 1 2 7 7 . 1

139
C:
A:
Figure 51. A: CI-MS, B: EI-MS and C: MS/MS spectra for the aminoalcohol analogue of the 2,3-
methylenedioxy substituted isomer.
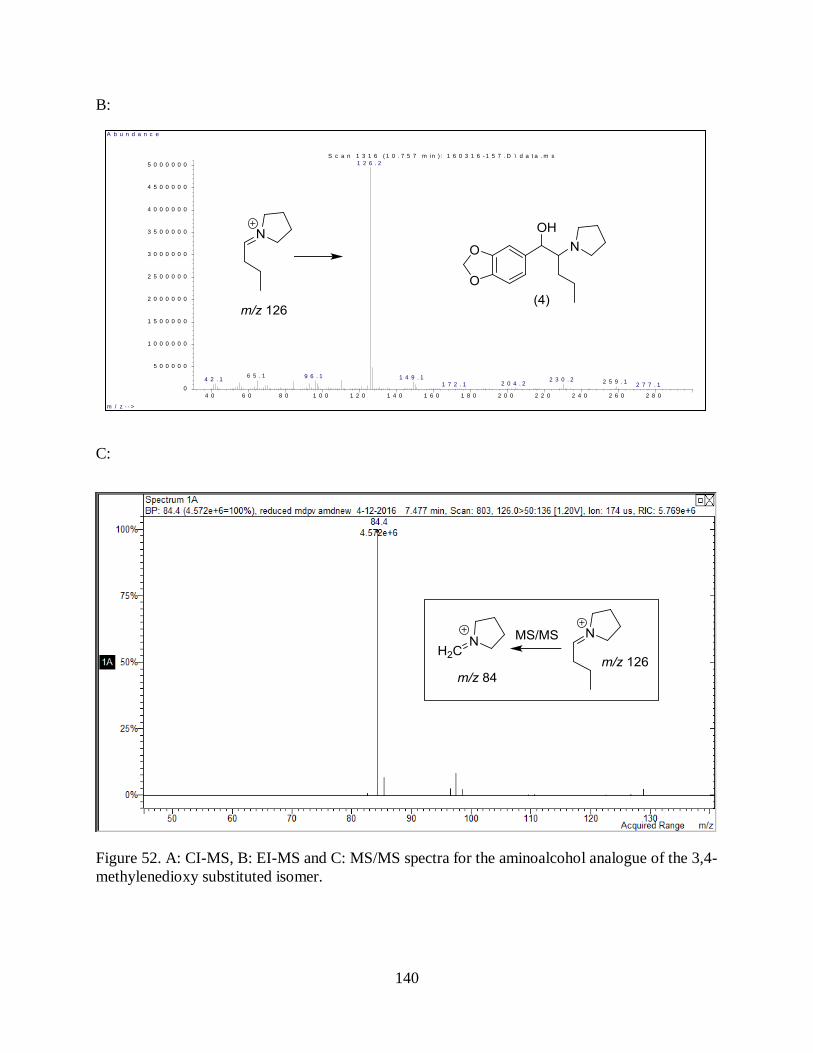
140
B:
C:
4 0 6 0 8 0 1 0 0 1 2 0 1 4 0 1 6 0 1 8 0 2 0 0 2 2 0 2 4 0 2 6 0 2 8 0
0
5 0 0 0 0 0
1 0 0 0 0 0 0
1 5 0 0 0 0 0
2 0 0 0 0 0 0
2 5 0 0 0 0 0
3 0 0 0 0 0 0
3 5 0 0 0 0 0
4 0 0 0 0 0 0
4 5 0 0 0 0 0
5 0 0 0 0 0 0
m / z - - >
A b u n d a n c e
S c a n 1 3 1 6 ( 1 0 . 7 5 7 m in ) : 1 6 0 3 1 6 - 1 5 7 . D \ d a t a . m s
1 2 6 . 2
6 5 . 1 9 6 . 1 1 4 9 . 14 2 . 1 2 3 0 . 2 2 5 9 . 12 0 4 . 21 7 2 . 1 2 7 7 . 1
Figure 52. A: CI-MS, B: EI-MS and C: MS/MS spectra for the aminoalcohol analogue of the 3,4-
methylenedioxy substituted isomer.

141
The mass spectral evaluation of the desoxy regioisomers produced the spectra in Figures
53 and 54. Panels A, B and C in these figures display the methanol CI-MS, EI-MS and MS/MS
product ion spectra, respectively. The methanol CI data in Figures 53A and 54A allow for the
molecular weight confirmation via the [M+H]+ ion of these phenethylamine-type compounds.
However, no other structural information can be obtained from these CI spectra. The remaining
spectra in panels B and C in Figures 53 and 54 also reveal identical analytical results for these
regioisomeric desoxy phenethylamines. The EI spectra in panel B show the identical iminium
cations at m/z 126 and panel C indicates equivalent MS/MS product ions at m/z 84. The mass
spectral data for the desoxy analogue of MDPV (Compound 6) have been described in detail in
Section 2.2.3.
A:
[M+H]+

142
B:
C:
4 0 6 0 8 0 1 0 0 1 2 0 1 4 0 1 6 0 1 8 0 2 0 0 2 2 0 2 4 0
0
2 0 0 0 0 0
4 0 0 0 0 0
6 0 0 0 0 0
8 0 0 0 0 0
1 0 0 0 0 0 0
1 2 0 0 0 0 0
1 4 0 0 0 0 0
1 6 0 0 0 0 0
1 8 0 0 0 0 0
2 0 0 0 0 0 0
2 2 0 0 0 0 0
2 4 0 0 0 0 0
m / z - - >
A b u n d a n c e
S c a n 8 5 4 ( 8 . 0 6 5 m i n ) : 1 6 0 6 1 4 - 0 0 1 4 . D \ d a t a . m s
1 2 6 . 2
4 2 . 17 7 . 1
9 6 . 1 2 1 8 . 11 6 0 . 15 8 . 6 1 8 6 . 1 2 6 0 . 11 4 4 . 1 2 0 2 . 1 2 4 4 . 1
Figure 53. CI-MS, B: EI-MS and C: MS/MS spectra for the desoxy analogue of the 2,3-
methylenedioxy substituted isomer.

143
A:
B:
[M+H]+
4 0 6 0 8 0 1 0 0 1 2 0 1 4 0 1 6 0 1 8 0 2 0 0 2 2 0 2 4 0 2 6 0 2 8 0
0
5 0 0 0 0
1 0 0 0 0 0
1 5 0 0 0 0
2 0 0 0 0 0
2 5 0 0 0 0
3 0 0 0 0 0
3 5 0 0 0 0
4 0 0 0 0 0
4 5 0 0 0 0
5 0 0 0 0 0
5 5 0 0 0 0
m / z - ->
A b u n d a n c e
S c a n 1 0 7 2 (9 . 3 3 5 m in ) : 1 6 1 0 1 8 -7 7 . D \ d a t a . m s
1 2 6 . 1
4 1 . 1 7 7 . 1
9 6 . 1
2 1 8 . 11 4 7 . 0 1 8 8 . 0 2 6 0 . 1

144
C:
2.4.4. Vapor phase infrared spectrophotometry
The vapor phase infrared spectra in Figure 55 allow for the differentiation of the relative
position of substitution of the methylenedioxy group in the aminoalcohols (Compounds 3 and 4).
These spectra were generated in GC–IR experiments and the spectra were generated as the
chromatography peak eluted from the capillary column. The aromatic ether region of the spectra
shows a strong single absorption band for the 2,3-methylenedioxyphenyl substituted isomer at
1456 cm-1 in Figure 55A. However, this region of the vapor phase IR spectrum for Compound 4
(the 3,4-methylenedioxyphenyl substituted isomer) shows an unsymmetrical doublet absorption
pattern at 1487 cm-1 and 1442 cm-1 in Figure 55B. This absorption pattern is consistent with the
symmetrical doublet absorption pattern observed for the regioisomeric aminoketones, Compounds
1 and 2 (see Section 2.1.4.). The spectra in Figure 55 further indicate a weak and broad absorption
Figure 54. A: CI-MS, B: EI-MS and C: MS/MS spectra for the desoxy analogue of the 3,4-
methylenedioxy substituted isomer.

145
band above 3400 cm-1 indicating the presence of the hydroxyl group in these two regioisomeric
compounds.
A:
B:
In addition to the chromatographic resolution of Compounds 5 and 6 shown in Figure 49,
the vapor phase infrared spectra in Figure 56 differentiate these regioisomeric desoxy substituted
phenethylamine analogues. The single strong absorption banad at 1456 cm-1 in Figure 56A for
1000200030004000Wavenumbers
92
94
96
98
100
Per
cen
t T
ran
smit
tan
ce
3429
2966
2943
2880
2829
1716
1608
1487
1442
1394
1354
1242
1188
1121
1093
1049
944
867
807
721
639
1000200030004000Wavenumbers
94
95
96
97
98
99
100
Per
cen
t T
ran
smit
tan
ce
3433
3070
2966
2943 2880
2828
1636
1596
1456
1401
1350
1310
1246
1169
1143
1062
969
942
837
771
728
636
Figure 55. Vapor phase IR spectra for the aminoalcohol analogues (Compounds 3 and 4).

146
Compound 5 is consistent with the 2,3-methylenedioxy substitution pattern while the
unsymmetrical doublet absorption bands at 1489 cm-1 and 1442 cm-1 in Figure 56B for Compound
6 indicate the 3,4-methylenedioxy substitution pattern. The same absorption patterns (spectra not
shown) were also observed for the intermediate ketones, Compounds c and d (see Figure 48 for
structures).
A:
B:
100020003000Wavenumbers
95
96
97
98
99
100
Per
cen
t T
ran
smit
tan
ce
3066
2965
2941
2879
2797
1635
1596
1456
1351
1247
1170
1149
1066
942
837
751
726
100020003000Wavenumbers
90
92
94
96
98
100
Per
cen
t T
ran
smit
tan
ce
2966
2938
2881
2796
1489
1442
1353
1244
1189
1122
1049
944
857
805
Figure 56. Vapor phase IR spectra for the desoxy phenethylamine analogues (Compounds 5 and
6).

147
2.4.5. Conclusion
Carbonyl modifications in aminoketones such as MDPV yield the corresponding
aminoalcohols and the desoxy substituted phenethylamine analogues. Multiple confirmation
methods were necessary for the specific identification of one compound from this set of closely
related structural isomers. Extensive fragmentation in the EI-MS yields the identical iminium
cation base peak at m/z 126 for MDPV as well as the carbonyl modified analogues. The CI-MS
provides molecular weight information and one characteristic fragment for the aminoalcohols
resulting from loss of water (H2O) from the protonated molecular ion [M+H]+. The MS/MS
product ion spectra provide data to characterize the side-chain and cyclic tertiary amine portions
of the iminium cation. The vapor phase infrared spectra differentiate the 2,3- and 3,4-
methylenedioxy substitution pattern based on absorption bands in the 1450 cm-1 range. The
aminoketones and desoxy substituted phenethylamine regioisomers were separated in capillary gas
chromatography experiments with the aminoketones showing higher retention times. The two
regioisomeric aminoalcohols each likely exist as a set of diastereomers as reflected by the broad
chromatography peaks.

148
2.5. Differentiation of homologous and regioisomeric methoxy-cathinone derivatives by GC–
MS, GC–MS/MS and GC–IR
A combination of GC–MS, GC–MS/MS and GC–IR techniques can be used to differentiate
the nine methoxy cathinone derivatives related to the designer drug MDPV. Nine homologous and
regioisomeric methoxyphenyl-aminoketone cathinone derivatives were prepared from the three
commercially available 2-, 3- and 4-methoxybenzaldehydes. The gas chromatographic separation
of the nine intermediate methoxyphenones was achieved on a 100% dimethyl polysiloxane (Rtx®-
1) stationary phase and the regioisomeric aminoketones were resolved on a 5% diphenyl, 95%
dimethyl polysiloxane (Rtx®-5) stationary phase. The chemical ionization mass spectra (CI-MS)
show only one major peak occurring at the mass of the protonated molecular ion [M+1]+ while the
EI-MS spectra display primarily the iminium cation fragment. The MS/MS product ion spectra for
the three homologous iminium cations yield a homologous series of ions representing the loss of
42 Da from the parent species. MS/MS experiments confirmed the loss of 42 Da occurring via
pyrrolidine ring fragmentation for iminium cations having the methyl and ethyl side-chains and
via side-chain fragmentation for the n-propyl side-chain. The vapor phase infrared spectra in the
range of 1300 to 1150 cm-1 show unique and characteristic absorption pattern for each of the three
regioisomeric methoxy-group substitution patterns.

149
2.5.1. Synthesis of the homologous and regioisomeric methoxy-cathinone derivatives
The desired regioisomeric aminoketones were prepared individually from the three
commercially available 2-, 3- and 4-methoxybenzaldehydes using the same procedure (see
Scheme 19) prescribed previously in Section 2.1.1. The final nine compounds were purified using
acid base extraction to yield the free bases.
2.5.2. Gas chromatographic separation
The gas chromatographic separation of the nine intermediate methoxyphenones is shown
in Figure 57. The elution order of these regioisomeric and homologous ketones is related to the
aromatic ring substitution pattern and the alkyl side-chain group. The two carbon alkyl side-chain
regioisomers (a–c) elute first and the 2-methoxy regioisomer elutes before the 3-methoxy isomer
followed by the 4-methoxypropiophenone. The elution sequence is repeated for the three carbon
alkyl side-chain set of ketones (d–f) and again with the final set of four carbon side-chain
methoxyphenones (g–i). These compounds were resolved using a 30-meter capillary column
containing a 0.10 µm film of Crossbond® 100% dimethyl polysiloxane, Rtx®-1, a nonpolar
stationary phase. The least resolved peak pair in Figure 57 is peaks c and d and these peaks
represent the 4-methoxypropiophenone and the 2-methoxybutyrophenone, respectively. The
Scheme 19. General synthetic scheme for the nine target compounds in this study.

150
additional closely eluting peaks (f and g) represent the 4-methoxybutyrophenone and the 2-
methoxyvalerophenone side-chain homologue. These regioisomeric intermediate ketones were
separated using a temperature program consisting of an initial hold at 70 °C for 1.0 minute, ramped
up to 150 °C at a rate of 7.5 °C/minute followed by a hold at 150 °C for 2.0 minutes, then ramped
up to 250 °C at a rate of 10 °C/minute followed by a hold at 250 °C for 47.0 minutes.
The chromatograms in Figure 58A–C show the GC separation of the regioisomeric
aminoketones in this study. The elution order for the regioisomeric methoxy groups is the same as
that seen for the intermediate ketones. The 2-methoxy isomers elutes first followed by the 3-isomer
with the 4-methoxy isomer displaying the highest degree of retention. Figure 58A shows the
methyl side-chain set of regioisomers (1–3); 58B the ethyl (4–6) and 58C the n-propyl-side chain
regioisomers (7–9). These separations were obtained on a column (30 m × 0.25 mm i.d.) coated
with 0.10 μm film of Crossbond® 5% diphenyl, 95% dimethyl polysiloxane (Rtx®-5) and adequate
resolution was achieved for each set of regioisomeric compounds having equivalent EI mass
i
h
g
f
e
d
c
b
a
12.00 13.00 14.00 15.00 16.00 17.00 18.00 19.00 20.00 21.00 22.00 23.00 24.00 25.000
200000
400000
600000
800000
1000000
1200000
1400000
1600000
1800000
Time-->
Abundance
TIC: 140429-35.D\ data.ms
Figure 57. Capillary gas chromatographic separation of the nine regioisomeric and homologous
monomethoxyphenyl-ketones on Rtx®-1 stationary phase. GC–MS System 1.

151
spectra. These regioisomeric sets of compounds were separated using a temperature program
consisting of an initial hold at 70 °C for 1.0 minute, ramped up to 250 °C at a rate of 30 °C/minute
followed by a hold at 250 °C for 15.0 minutes.
A:
B:
5 . 5 0 6 . 0 0 6 . 5 0 7 . 0 0 7 . 5 0 8 . 0 0 8 . 5 0 9 . 0 0 9 . 5 0
5 0 0 0 0 0
1 0 0 0 0 0 0
1 5 0 0 0 0 0
2 0 0 0 0 0 0
2 5 0 0 0 0 0
3 0 0 0 0 0 0
3 5 0 0 0 0 0
4 0 0 0 0 0 0
4 5 0 0 0 0 0
5 0 0 0 0 0 0
5 5 0 0 0 0 0
T i m e - - >
A b u n d a n c e
T I C : 1 5 0 1 1 6 - 1 5 . D \ d a t a . m s
3
2
1
6 . 8 0 7 . 0 0 7 . 2 0 7 . 4 0 7 . 6 0 7 . 8 0 8 . 0 0 8 . 2 0 8 . 4 0 8 . 6 0 8 . 8 0
2 0 0 0 0
4 0 0 0 0
6 0 0 0 0
8 0 0 0 0
1 0 0 0 0 0
1 2 0 0 0 0
1 4 0 0 0 0
1 6 0 0 0 0
1 8 0 0 0 0
2 0 0 0 0 0
2 2 0 0 0 0
2 4 0 0 0 0
2 6 0 0 0 0
2 8 0 0 0 0
3 0 0 0 0 0
3 2 0 0 0 0
3 4 0 0 0 0
3 6 0 0 0 0
3 8 0 0 0 0
4 0 0 0 0 0
T i m e - - >
A b u n d a n c e
T I C : 1 5 0 1 1 6 - 2 9 . D \ d a t a . m s
6 5
4

152
C:
2.5.3. Mass spectral studies (EI-MS, CI-MS and MS/MS)
The electron ionization mass spectra (EI-MS) for a representative selection of three of the
intermediate ketones are shown in Figure 59. The base peak in the spectra for these ketones occurs
at m/z 135 for the methoxybenzoyl (CH3OC6H4CO)+ cation. Additionally, the higher alkyl side-
chain homologues show the expected hydrogen rearrangement product at m/z 150.
7 . 0 0 7 . 2 0 7 . 4 0 7 . 6 0 7 . 8 0 8 . 0 0 8 . 2 0 8 . 4 0 8 . 6 0 8 . 8 0 9 . 0 0
1 0 0 0 0 0
2 0 0 0 0 0
3 0 0 0 0 0
4 0 0 0 0 0
5 0 0 0 0 0
6 0 0 0 0 0
7 0 0 0 0 0
8 0 0 0 0 0
9 0 0 0 0 0
1 0 0 0 0 0 0
1 1 0 0 0 0 0
T im e - - >
A b u n d a n c e
T I C : 1 5 0 1 1 6 - 5 5 . D \ d a t a . m s
7
9
8
Figure 58. GC separation of the nine compounds in this study. A: Compounds 1, 2 and 3; B:
Compounds 4, 5 and 6; C: Compounds 7, 8 and 9. Rtx®-5 stationary phase. GC–MS System 1.

153
A:
B:
4 0 5 0 6 0 7 0 8 0 9 0 1 0 0 1 1 0 1 2 0 1 3 0 1 4 0 1 5 0 1 6 0 1 7 0
0
2 0 0 0 0
4 0 0 0 0
6 0 0 0 0
8 0 0 0 0
1 0 0 0 0 0
1 2 0 0 0 0
1 4 0 0 0 0
1 6 0 0 0 0
1 8 0 0 0 0
2 0 0 0 0 0
2 2 0 0 0 0
2 4 0 0 0 0
2 6 0 0 0 0
2 8 0 0 0 0
m / z - - >
A b u n d a n c e
S c a n 1 5 9 3 ( 1 3 . 8 7 2 m in ) : 1 4 0 4 2 9 - 3 5 . D \ d a t a . m s
1 3 5 . 1
7 7 . 1
9 2 . 1
6 3 . 15 1 . 11 6 4 . 1
1 2 0 . 01 0 5 . 14 1 . 0 1 4 7 . 1
40 50 60 70 80 90 100 110 120 130 140 150 160 170 180
50000
100000
150000
200000
250000
300000
350000
400000
450000
500000
m/ z-->
Abundance
Scan 2027 (16.401 min): 140429-35.D\ data.ms135.1
107.1
77.1178.192.1
64.1
150.141.1121.153.1 163.1

154
C:
The GC–CI-MS studies were performed on a column (30 m × 0.25 mm i.d.) coated with
0.10 μm film of Crossbond® 100% dimethyl polysiloxane (Rtx®-1). The GC–CI-MS using
methanol as the reagent gas shows only one major peak occurring at the mass of the protonated
molecular ion [M+1]+. Sample CI mass spectra for Compounds 1, 5 and 9 are shown in Figure 60.
This CI technique confirms the molecular weight for these amines, which show essentially
complete fragmentation in the EI mode (displayed in the following section). Chromatographic
analysis was performed using a temperature program consisting of an initial hold at 70 °C for 1.0
minute, ramped up to 250 °C at a rate of 30 °C/minute followed by a hold at 250 °C for 15.0
minutes.
4 0 5 0 6 0 7 0 8 0 9 0 1 0 0 1 1 0 1 2 0 1 3 0 1 4 0 1 5 0 1 6 0 1 7 0 1 8 0 1 9 0
0
5 0 0 0 0
1 0 0 0 0 0
1 5 0 0 0 0
2 0 0 0 0 0
2 5 0 0 0 0
3 0 0 0 0 0
3 5 0 0 0 0
4 0 0 0 0 0
4 5 0 0 0 0
5 0 0 0 0 0
5 5 0 0 0 0
m / z - - >
A b u n d a n c e
S c a n 2 4 8 9 ( 1 9 . 0 9 4 m i n ) : 1 4 0 4 2 9 - 3 5 . D \ d a t a . m s
1 3 5 . 1
1 5 0 . 1
7 7 . 1
9 2 . 1
1 0 7 . 16 4 . 1
4 1 . 1 1 9 2 . 11 6 3 . 11 2 1 . 1
1 7 5 . 1
Figure 59. Representative full scan EI-MS spectra for the intermediate ketones: a, e and i. GC–MS
System 1.

155
A:
B:
[M+H]+
[M+H]+

156
C:
The EI-MS spectra for a selection of three of the aminoketone compounds in this study are
shown in Figure 61. These three spectra are representative of all nine compounds in this study.
The three spectra represent each of the three ring regioisomers and each of the three alkyl side-
chain homologues. The iminium cation fragment is the base peak and the dominant feature in all
these spectra. The spectra show few ions of significance at masses higher than the iminium cation
base peak. Thus, the EI-MS spectrum does not provide clear information on the mass of the
molecular radical cation. Compounds 1, 2 and 3 yield identical EI mass spectra and the spectrum
for Compound 1 in Figure 61 is representative of all three of these regioisomeric compounds. Each
of these compounds (1–3) has the identical elemental composition and molecular weights as well
as identical iminium cation base peaks at m/z 98. The ethyl side-chain group (Compounds 4–6) for
[M+H]+
Figure 60. Representative methanol CI mass spectra for Compounds 1, 5 and 9. GC–MS System
2.

157
which Compound 5 is representative (Figure 61) shows iminium cation base peaks at m/z 112
along with identical elemental composition. The same relationship exists in Compounds 7–9 and
this set of compounds each has the iminium cation base peak at m/z 126. Thus, the EI-MS spectrum
of Compound 9 in Figure 61 is representative of all three regioisomeric compounds having the n-
propyl side-chain group.
A:
B:
4 0 5 0 6 0 7 0 8 0 9 0 1 0 0 1 1 0 1 2 0 1 3 0 1 4 0 1 5 0 1 6 0 1 7 0 1 8 0 1 9 0 2 0 0 2 1 0 2 2 0 2 3 0
0
2 0 0 0 0
4 0 0 0 0
6 0 0 0 0
8 0 0 0 0
1 0 0 0 0 0
1 2 0 0 0 0
1 4 0 0 0 0
1 6 0 0 0 0
1 8 0 0 0 0
2 0 0 0 0 0
2 2 0 0 0 0
2 4 0 0 0 0
2 6 0 0 0 0
2 8 0 0 0 0
m / z - - >
A b u n d a n c e
S c a n 3 2 6 ( 6 . 9 8 7 m i n ) : 1 5 0 1 1 6 - 1 5 . D \ d a t a . m s
9 8 . 1
5 6 . 17 7 . 1
4 1 . 1 1 3 5 . 1
2 0 0 . 11 2 0 . 0 2 3 3 . 11 6 1 . 1 2 1 8 . 11 8 6 . 1
4 0 6 0 8 0 1 0 0 1 2 0 1 4 0 1 6 0 1 8 0 2 0 0 2 2 0 2 4 0
0
5 0 0 0 0 0
1 0 0 0 0 0 0
1 5 0 0 0 0 0
2 0 0 0 0 0 0
2 5 0 0 0 0 0
3 0 0 0 0 0 0
3 5 0 0 0 0 0
4 0 0 0 0 0 0
4 5 0 0 0 0 0
5 0 0 0 0 0 0
5 5 0 0 0 0 0
6 0 0 0 0 0 0
6 5 0 0 0 0 0
7 0 0 0 0 0 0
7 5 0 0 0 0 0
8 0 0 0 0 0 0
m / z - - >
A b u n d a n c e
S c a n 3 9 5 ( 7 . 3 8 9 m in ) : 1 5 0 1 1 6 - 2 6 . D \ d a t a . m s
1 1 2 . 2
7 0 . 14 1 . 1 9 2 . 1
1 3 5 . 12 1 8 . 1 2 4 6 . 21 6 1 . 1 1 9 0 . 1

158
C:
The MS/MS product ion spectra for the three iminium cations are shown in Figure 62. The
scan type used was the Automated Method Development function (AMD) and the optimum
MS/MS excitation amplitudes were 0.80, 1.00 and 1.20 volts. The GC–MS/MS studies were
performed using the same column described for the GC–CI-MS studies (Rtx®-1) with a
temperature program consisting of an initial hold at 70 °C for 1.0 minute, ramped up to 250 °C at
a rate of 30 °C/minute followed by a hold at 250 °C for 7.0 minutes. Only three homologous
iminium cations are generated in the electron ionization mass spectra of these nine compounds.
The product ion spectra are shown for the iminium cation base peaks from Compounds 1, 5 and 9
as examples of this entire set of compounds. The structures for the precursor iminium species are
provided within the individual MS/MS spectra along with the proposed structures of the major
characteristic product ion for each compound. The small side-chain methyl homologue iminium
cation (m/z 98) shows the major product ion at m/z 56 consistent with the loss of 42 Da from the
4 0 6 0 8 0 1 0 0 1 2 0 1 4 0 1 6 0 1 8 0 2 0 0 2 2 0 2 4 0 2 6 00
1 0 0 0 0 0
2 0 0 0 0 0
3 0 0 0 0 0
4 0 0 0 0 0
5 0 0 0 0 0
6 0 0 0 0 0
7 0 0 0 0 0
8 0 0 0 0 0
9 0 0 0 0 0
1 0 0 0 0 0 0
m / z -->
A b u n d a n c e
S c a n 4 9 0 (7 . 9 4 3 m in ): 1 5 0 1 1 6 -3 3 . D \ d a t a . m s1 2 6 . 2
7 7 . 15 5 . 1 9 6 . 12 1 8 . 11 9 0 . 1 2 5 9 . 11 6 3 . 11 4 5 . 1 2 4 2 . 0
Figure 61. Representative full scan EI-MS spectra for Compounds 1, 5 and 9. GC–MS System 1.

159
parent ion species. The highest hydrocarbon side-chain homologue (m/z 126) n-propyl side-chain
whose MS/MS spectrum is shown in Figure 62 yields the m/z 84 product ion. This ion also
represents the loss of 42 Da from the parent iminium cation species at m/z 126. In fact, these three
product ion spectra appear to represent another homologous series of ions. The major product ion
for Compound 1 occurs at m/z 56 and the expected 14 Da increase occurs for Compound 5 (m/z
70) and the equivalent product ion for Compound 9 occurs at m/z 84. These three product ions
each represent the loss of 42 Da from the iminium cation base peak. The loss of 42 Da to yield the
m/z 56 product ion for Compound 1 must occur via the loss of C3H6 from the pyrrolidine ring
portion of the iminium cation structure. Likewise, the loss of 42 Da from Compound 5 must occur
from the pyrrolidine ring. However, the loss of C3H6 for Compound 9 could occur from the
pyrrolidine ring or the three carbon alkyl side-chain. Previous studies (in Sections 2.1.3., 2.2.3.
and 2.3.3.) using deuterium labels in both the pyrrolidine ring and the alkyl side-chain groups have
confirmed the product ion structures shown within Figure 62. These labeling experiments
confirmed the loss of 42 Da via pyrrolidine ring fragmentation for iminium cations having the
methyl and ethyl side-chains. However, the loss of 42 Da in Compound 9 comes only from side-
chain fragmentation and does not involve the pyrrolidine ring based on the previous deuterium
labeling studies.
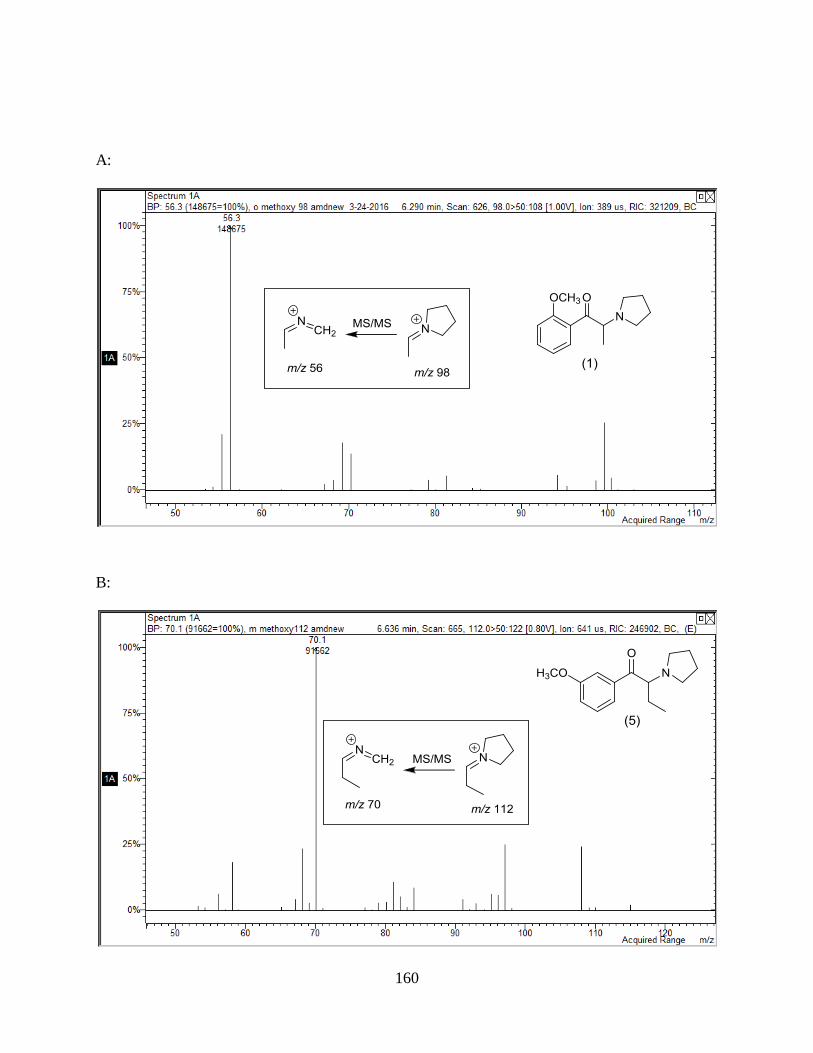
160
A:
B:

161
C:
2.5.4. Vapor phase infrared spectrophotometry
The vapor phase infrared spectra generated in GC–IR experiments are shown in Figure 63
for an example set of regioisomeric aromatic ring substitution patterns (Compounds 7, 8 and 9).
These spectra were generated directly from the chromatography peak as each compound eluted
from the capillary GC column. Thus, providing an added level of reliability based on the purity of
the chromatography peak generated via the GC analysis. The GC–IR vapor phase infrared spectra
were recorded in the range of 4000 – 550 cm-1 with a resolution of 8 cm-1. All compounds show a
carbonyl band in the 1690 cm-1 range and characteristic bands in the 1300 cm-1 to 1150 cm-1 range.
The characteristic bands for aromatic ethers in the 1300 cm-1 range provide information concerning
the position of the methoxy-group and its relationship to the aminoketone side-chain. The 1300
cm-1 to 1150 cm-1 range shows a unique and characteristic absorption pattern for each of the three
Figure 62. Product ion MS/MS spectra for iminium cation base peaks of Compounds 1, 5 and 9.
GC–MS System 2.

162
regioisomeric methoxy-group substitution patterns. The 2-methoxy group for Compound 7 shows
a doublet pattern of absorption bands at 1280 cm-1 and 1241 cm-1 with the 1241 cm-1 band having
slightly greater intensity. This can be compared to the very intense single absorption band at 1260
cm-1 observed in the 3-methoxy substitution pattern for Compound 8. The four absorption bands
occurring in the range from 1295 cm-1 to 1169 cm-1 is characteristic of the 4-methoxy substitution
pattern. Compound 9 shows two of these bands, 1251 cm-1 and 1169 cm-1 as the more intense
absorptions for the 4-methoxy- substitution pattern in this compound. The correlations between IR
absorption bands and aromatic ring substitution pattern for Compounds 7, 8 and 9 are repeated for
the other two sets of compounds (1, 2 and 3 as well as 4, 5 and 6).
A:
100020003000Wavenumbers
94
96
98
100
Per
cent
Tra
nsm
itta
nce
3075
2965
2881
2844
1697
1596
1479
1440
1357
1280
1241
1191
1158 1
111
1026 9
66 9
03
830
752
645
613

163
B:
C:
100020003000Wavenumbers
94
96
98
100
Per
cent
Tra
nsm
itta
nce
3074
2966
2882
2842
2812
1693
1588 1477
1430
1260
1188
1048
992
981
877
849
834
774
686
620
552
100020003000Wavenumbers
94
96
98
100
Per
cent
Tra
nsm
itta
nce
3074
3007
2966
2882
2846
2812
1688
1600
1506
1466
1415
1354
1295
1251
1208
1169
1038
959
903
841
804
599
Figure 63. Vapor phase IR spectra of the regioisomeric methoxyaminoketones with n-propyl side-
chain.

164
The vapor phase IR spectra in Figure 64 show the consistent absorption pattern in the 1300
cm-1 to 1150 cm-1 range for a series of 4-methoxyphenyl substituted carbonyl compounds. The
commercially available precursor compound 4-methoxybenzaldehyde is compared to the
intermediate ketone (c) and the corresponding aminoketone (Compound 3). The four absorption
bands occurring in the range from 1294 cm-1 to 1169 cm-1 are readily observed in all these
compounds. Thus, the vapor phase GC–IR infrared absorption spectra provide clear differentiation
of the relative position of the methoxy-group in these regioisomeric substances.
A:
B:
100020003000Wavenumbers
94
96
98
100
Per
cent
Tra
nsm
itta
nce
3079
3012
2951
2843
2811
2724
1717 1
601
1509
1467 1428
1389
1303
1256
1207
1161
1106
1037
838
757
639
598
100020003000Wavenumbers
94
96
98
100
Per
cent
Tra
nsm
itta
nce
3076
3047
3004
2981
2948
2921 2
847
1697
1602
1507
1466
1415
1346
1300
1253 1224
1172
1109
1038
945
840 802 5
79

165
C:
2.5.5. Conclusion
The regioisomeric aminoketones were resolved on an Rtx®-5 stationary phase column. The
iminium cation fragment is the base peak and the dominant feature in all the EI spectra. The spectra
show few ions of significance at masses higher than the iminium cation base peak. Thus, the EI-
MS spectrum does not provide clear information on the mass of the molecular radical cation due
to extensive fragmentation. However, the GC–CI-MS using methanol as the reagent gas provides
molecular weight information and these CI spectra show only one major peak occurring at the
mass of the protonated [M+1]+ molecular ion. The EI iminium cation base peaks for these
compounds occur in a homologous series at m/z 98, 112 and 126 depending on the alkyl side-chain
of the aminoketone compounds. The MS/MS spectra for the homologous iminium cation species
yield a series of product ions each representing the loss of 42 Da from the EI base peaks. The vapor
phase infrared absorption spectra provide clear differentiation of the relative position of the
methoxy-group in these regioisomeric substances. Thus, this combination of techniques provides
100020003000Wavenumbers
94
96
98
100
Per
cent
Tra
nsm
itta
nce
3075
2971
2885
2843
2815
1691
1600
1506
1465
1416
1372
1296
1253
1227
1169
1038
930
842
798
776
597
Figure 64. Vapor phase IR spectra of 4-methoxybenzaldehyde, 4-methoxypropiophenone, and 4-
methoxyaminoketone.

166
complete differentiation of these regioisomeric and homologous aminoketone designer cathinone
derivatives.

167
2.6. Differentiation of the six dimethoxypyrovalerone (DMPV) regioisomers: GC–MS, GC–
MS/MS and GC–IR
Multiple and complementary analytical methods are often necessary for the identification
of a specific compound from a series of closely related structural isomers. Gas chromatography-
mass spectrometry (GC–MS), gas chromatography-product ion mass spectrometry (GC–MS/MS)
and gas chromatography-infrared spectroscopy (GC–IR) were used to differentiate between the
six dimethoxypyrrovalerone (DMPV) regioisomers. The six regioisomeric aminoketones were
separated on a 50% phenyl stationary phase and the elution order is related to the positioning of
substituents on the aromatic ring. These six DMPV regioisomers yield essentially identical mass
spectral data in both chemical ionization (CI-MS) and electron ionization (EI-MS) spectra as well
as identical product ion MS/MS spectra of the iminium cation base peak (m/z 126). These various
mass spectral techniques provide data to identify all major structural features of these molecules
except the dimethoxy substitution pattern of the aromatic ring. The region of the vapor phase
infrared spectra between 1600 cm-1 and 1000 cm-1 provides a significant number of unique
absorption bands characteristic of each individual DMPV regioisomer.

168
2.6.1. Synthesis of the six regioisomeric dimethoxypyrovalerones
The desired regioisomeric aminoketones (Compounds 1–6) were prepared individually
(see Scheme 20) from the six commercially available dimethoxybenzaldehydes using the same
procedure prescribed previously in Section 2.1.1. The six final products were isolated by solvent
extraction and purified by preparative thin layer chromatography (TLC) using a 20:80 ethyl
acetate-petroleum ether solvent and Analtech (Newark, DE) glass backed 20 x 20 cm plates with
a 1000 µm layer of silica and an inorganic fluorescent 254 nm indicator.
2.6.2. Gas chromatographic separation
The chromatogram in Figure 65 shows the capillary gas chromatographic separation of the
intermediate dimethoxyvalerophenones. These six regioisomeric ketones elute over
approximately a one-minute time window using a column (30 m × 0.25 mm i.d.) coated with 0.25
μm film of midpolarity Crossbond® silarylene phase; similar to 50% phenyl, 50% dimethyl
polysiloxane (Rxi®-17Sil MS). The first compound to elute is 2,3-dimethoxyvalerophenone (peak
a) followed by the 2,6-isomer (peak d). These two early eluting bands share substitution of all three
groups on adjacent carbons of the aromatic ring. The next two compounds to elute are the 2,5-
isomer (peak c) and the 3,5-isomer (peak f). The common structural feature for these two isomers
Scheme 20. General synthetic scheme for the six dimethoxypyrovalerones in this study.

169
is the 5-methoxy group and this substituent shares a meta- relationship with the carbonyl
containing side-chain. The remaining two late eluting compounds share a methoxy substituent at
the 4-position, para- to the carbonyl containing side-chain. Peak b is the 2,4-isomer and the last
compound to elute, peak e, represents the 3,4-dimethoxyvalerophenone isomer.
The chromatogram in Figure 66 is a representative of the separation obtained on the Rxi®-
17Sil MS stationary phase for the six regioisomeric aminoketones. The compounds elute over
approximately a two-minute time window and the elution order based on the aromatic ring
substitution pattern is the same as that observed for the intermediate ketones. Compounds 1 and 4
having the most crowded substituent arrangements on the aromatic ring elute first while
Compounds 2 and 5 show the highest retention in this chromatographic system. The stationary
phase used for these separations was the relatively polar Rxi®-17Sil MS containing a 50% phenyl
polymer and this would suggest polar interactions as an important contributor to the retention of
these regioisomeric aminoketones. The selectivity of stationary phase polymers in gas
chromatography is a complex interplay between steric and electronic forces. The steric and
e b
f
c
d
7.00 7.50 8.00 8.50 9.00 9.50 10.00
500000
1000000
1500000
2000000
2500000
3000000
3500000
Time-->
Abundance
TIC: 161117-00114.D\ data.ms
a
Figure 65. Capillary gas chromatographic separation of the six intermediate regioisomeric
dimethoxyphenylketones. GC–MS System 1. Rxi®-17Sil MS stationary phase.

170
electronic features of the methoxy groups and their relative positions on the aromatic ring would
affect the extended conjugation of the aromatic ring and the carbonyl group, thus altering
molecular polarity and relative retention. These two regioisomeric sets of compounds were
separated using a temperature program consisting of an initial hold at 70 °C for 1.0 minute, ramped
up to 250 °C at a rate of 30 °C/minute followed by a hold at 250 °C for 15.0 minutes.
2.6.3. Mass spectral studies (EI-MS, CI-MS and MS/MS)
The six DMPV regioisomers yield essentially identical mass spectral data in chemical
ionization (CI-MS) and electron ionization (EI-MS) spectra as well as identical product ion
MS/MS spectra of the iminium cation base peak (m/z 126). The GC–CI-MS (using methanol as
the reagent gas) studies for these six regioisomeric DMPV were performed on a column (30 m ×
0.25 mm i.d.) coated with 0.10 μm film of Crossbond® 100% dimethyl polysiloxane (Rtx®-1).
Chromatographic analysis was performed using a temperature program consisting of an initial hold
at 70 °C for 1.0 minute, ramped up to 250 °C at a rate of 30 °C/minute followed by a hold at 250
5
9 . 0 0 9 . 5 0 1 0 . 0 0 1 0 . 5 0 1 1 . 0 0 1 1 . 5 0 1 2 . 0 0 1 2 . 5 0 1 3 . 0 0 1 3 . 5 0 1 4 . 0 0
5 0 0 0 0
1 0 0 0 0 0
1 5 0 0 0 0
2 0 0 0 0 0
2 5 0 0 0 0
3 0 0 0 0 0
3 5 0 0 0 0
4 0 0 0 0 0
4 5 0 0 0 0
5 0 0 0 0 0
5 5 0 0 0 0
6 0 0 0 0 0
6 5 0 0 0 0
T i m e - - >
A b u n d a n c e
T I C : 1 6 1 1 1 7 - 0 0 1 1 0 . D \ d a t a . m s
1
4
3
6
2
Figure 66. Capillary gas chromatographic separation of the six regioisomeric
dimethoxyphenylaminoketones. GC–MS System 1. Rxi®-17Sil MS stationary phase.

171
°C for 15.0 minutes. The GC–MS/MS studies were performed using the same column described
for the GC–CI-MS studies (Rtx®-1) with a temperature program consisting of an initial hold at 70
°C for 1.0 minute, ramped up to 250 °C at a rate of 30 °C/minute followed by a hold at 250 °C for
7.0 minutes. The scan type used was the Automated Method Development function (AMD) and
the optimum MS/MS excitation amplitude was 1.20 volts. The CI-MS, EI-MS and MS/MS spectra
for one example compound of spectra is presented in Figure 67. The CI-MS spectrum in Figure
67A was obtained using methanol as the proton source and it shows the [M+H]+ ion as the only
major peak in the spectrum. The [M+H]+ ion confirms the molecular weight of these DMPV
regioisomers and this can be compared to the EI-MS spectrum in Figure 67B showing no molecular
ion and essentially a complete fragmentation. The EI-MS spectrum shown in Figure 67B is
dominated by the iminium cation base peak at m/z 126 and the structure for this fragment is shown
within that spectrum. This major fragment is the result of elimination of the dimethoxybenzoyl
radical species following initial molecular radical cation formation at the basic nitrogen atom.
The mass spectral fragmentation properties for all DMPV aminoketones do not provide
any significant information for differentiation between these six regioisomers. These compounds
share the identical elemental composition C17H25NO3, identical EI-MS iminium cation base peak
at m/z 126 which yields the identical MS/MS product ion at m/z 84 for each of the six DMPV
regioisomers. While these compounds were well resolved in the GC studies, chromatographic data
are not considered a confirmation level technique in forensic drug analysis. Other columns,
stationary phases or chromatographic conditions could yield a very different separation profile for
these compounds. Thus, overlapping chromatography peaks that yield identical mass spectra could
lead to misidentification of an individual compound.

172
A:
B:
[M+H]+
4 0 6 0 8 0 1 0 0 1 2 0 1 4 0 1 6 0 1 8 0 2 0 0 2 2 0 2 4 0 2 6 0 2 8 0
0
1 0 0 0 0 0
2 0 0 0 0 0
3 0 0 0 0 0
4 0 0 0 0 0
5 0 0 0 0 0
6 0 0 0 0 0
7 0 0 0 0 0
8 0 0 0 0 0
9 0 0 0 0 0
1 0 0 0 0 0 0
m / z - ->
A b u n d a n c e
S c a n 1 3 4 4 (1 0 . 9 2 1 m in ) : 1 6 1 1 1 7 -0 0 8 4 . D \ d a t a . m s
1 2 6 . 1
5 5 . 17 7 . 1 9 6 . 1 1 6 5 . 1
2 4 8 . 12 2 0 . 11 9 1 . 11 4 7 . 0 2 9 1 . 1

173
C:
2.6.4. Vapor phase infrared spectrophotometry
Issues of regioisomerism in drug categories involving totally synthetic drugs require the
use of multiple and complementary confirmation level techniques for the identification of a
specific compound. The infrared spectrum for an organic molecule provides unique data useful for
the characterization of regioisomers especially aromatic ring substitution patterns. The data
generated from the various mass spectral techniques described above can be used to identify all
major structural features of these molecules except the dimethoxy substitution pattern of the
aromatic ring. Once the MS data provide focus on the six regioisomeric dimethoxy pyrovalerones,
the vapor phase infrared spectra clearly distinguish each of the aromatic ring dimethoxy
substitution patterns. The vapor phase infrared spectra for the six DMPV regioisomers were
determined using GC–IR techniques and these spectra are presented in Figure 68. The spectra were
Figure 67. A: CI-MS, B: EI-MS and C: MS/MS spectra for the representative 2,5-dimethoxy
substituted isomer (Compound 3).

174
obtained directly as the individual chromatography peaks eluted from the capillary column. The
general inspection of the spectra shows a significant degree of similarity in the 3100 cm-1 to 2700
cm-1 region with the major sharp absorption band occurring at 2965 or 2966 cm-1 for all six
compounds. This carbon-hydrogen stretching region should be quite similar for all these
compounds based on the equivalence of most of the C-H bonding within these regioisomers.
The carbonyl absorption region for these regioisomers shows some variation in frequency
likely based on a combination of steric and electronic factors. The spectra for Compounds 1 and 4
(Figure 68) show the highest carbonyl absorption frequencies at 1700 cm-1 and 1711 cm-1,
respectively. These crowded substitution patterns force the carbonyl group out of the plane of the
aromatic ring yielding less through ring conjugation, more carbonyl double bond character and
thus a higher carbonyl absorption frequency. Compounds 2 and 5 each have one methoxy group
in the 4-position (para-) relative to the carbonyl group and this arrangement provides maximum
through ring conjugation to the carbonyl group. This maximum conjugation effect enhances the
single bond character of the carbonyl group and lowers the absorption frequencies to 1690 cm-1
and 1688 cm-1, respectively. Compounds 3 and 6 yield carbonyl absorption frequencies
intermediate between these two extremes. This pattern of carbonyl absorption frequencies as a
function of dimethoxy group substitution patterns is also observed in the synthetic intermediate
ketones (spectra not shown).
The region of the vapor phase infrared spectra between 1600 cm-1 and 1000 cm-1 provides
a significant number of unique absorption bands characteristic for each individual DMPV
regioisomer (Figure 68). This region of the IR spectrum includes absorbances of carbon-carbon
double bonds, ether functional groups as well as the overall bending and stretching vibrations of

175
the molecular fingerprint region. This fingerprint region is a composite of interactions among
similar energy single bonds and depends on the overall molecular skeleton. Compound 1 is
characterized by strong bands at 1470 cm-1 and 1264 cm-1 while Compound 2 shows a strong single
band at 1603 cm-1 for the carbon-carbon double bond vibration and a complex of several similar
intensity bands from 1293 cm-1 to 1121 cm-1 in the molecular fingerprint region. Compound 3 has
strong absorbances at both 1491 cm-1 and 1223 cm-1 along with less intense satellite bands at 1408
cm-1 and 1273 cm-1. Compound 4 shows three intense fingerprint bands at 1469, 1246 and 1110
cm-1 in addition to the strong carbon-carbon double bond absorbance at 1589 cm-1. The strongest
absorption band for Compound 5 occurs at 1270 cm-1 and it is accompanied by a series of less
intense bands at 1507, 1466 and 1411 cm-1. The carbon-carbon double bond absorbance at 1594
cm-1 is a significant band for Compound 6 along with a second strong band at 1155 cm-1 and a
number of absorbances of intermediate strength between 1462 cm-1 and 1200 cm-1.
These results demonstrate that vapor phase infrared spectroscopy (GC–IR) clearly
differentiates between the six regioisomeric forms of the dimethoxy aromatic ring substitution
patterns for the DMPV compounds. The MS data provide focus on the six regioisomeric dimethoxy
substitution patterns and the vapor phase infrared spectra clearly distinguish each of the aromatic
ring dimethoxy substitution patterns. Thus, these two confirmatory-level techniques used in
combination provide a complete identification for any one of these DMPV regioisomers.

176
100020003000Wavenumbers
92
94
96
98
100
Per
cent
Tra
nsm
itta
nce
3074
2966
2881
2841
1700
1578
1470
1426
1357
1264
1080
1009
906
846
817
805
749
637
100020003000Wavenumbers
94
96
98
100
Per
cent
Tra
nsm
itta
nce
3085
3004
2965
2881
2846
1690
1603
1493
1466
1411 1
354
1293
1255
1208
1160
1121
1037
964 834
800
590

177
100020003000Wavenumbers
92
94
96
98
100
Per
cent
Tra
nsm
itta
nce
3000
2965
2881
2842
1698
1578
1491
1408
1357
1273
1223
1163
1047
850
813
725
652
625
581
100020003000Wavenumbers
94
96
98
100
Per
cent
Tra
nsm
itta
nce
3082
2999
2965
2881 2
844
1711
1589
1469
1435
1358
1246
1189
1170
1110
1025
968
903
827
790
725 6
12

178
The consistency of the infrared spectral features based on dimethoxy group substitution
patterns is illustrated in Figure 69. The commercially available precursor aldehyde (2,5-
dimethoxybenzaldehyde) and the synthetic intermediate ketone having the equivalent 2,5-
dimethoxy substitution pattern yield equivalent vapor phase infrared spectra in the 1600 to 1000
100020003000Wavenumbers
92
94
96
98
100
Per
cent
Tra
nsm
itta
nce
3073
3002
2966
2882 2
844
2814
1688 1594
1507
1466
1411
1270
1193
1135
1029
860
806
759 6
25
100020003000Wavenumbers
92
94
96
98
100
Per
cent
Tra
nsm
itta
nce
3088
3005
2966
2882
2845 2813
1693
1594
1462
1427
1319
1297
1242
1200
1155
1064
1027
925
861 766
680 591
Figure 68. Vapor phase IR spectra (GC–IR) for the six regioisomeric
dimethoxyphenylaminoketones.

179
cm-1 range. Furthermore, the absorption pattern in this range is consistent with that shown in Figure
68 for Compound 3, the 2,5-dimethoxy regioisomer of DMPV. The equivalent consistency for the
other dimethoxy substitution patterns was also observed by comparing the remaining spectra in
Figure 68 with the appropriate precursor aldehydes and intermediate ketones spectra.
100020003000Wavenumbers
90
92
94
96
98
100
Per
cent
Tra
nsm
itta
nce
3069
3006
2950
2855
2753
2708
1702
1603
1581
1493
1422
1389
1270
1219
1154
1045
937
877
811
703
634
580
100020003000Wavenumbers
94
95
96
97
98
99
100
Per
cent
Tra
nsm
itta
nce
3002
2947
2882
2843
1699
1579
1492
1409
1274
1222
1169
1046
871
861
813
726
Figure 69. Representative vapor phase IR spectra (GC–IR) of the precursor 2,5-
dimethoxybenzaldehyde and the intermediate 2,5-dimethoxyvalerophenone (Compound c).

180
2.6.5. Conclusion
The six dimethoxypyrovalerones (DMPVs) represent possible designer modifications of
the pyrovalerone type cathinone derivatives. These regioisomeric compounds have identical
elemental composition and identical functional groups arranged differently within the aromatic
ring. The chemical ionization (CI-MS) spectra show the [M+H]+ ion as the only major peak in
each spectrum and confirm the molecular weight of these DMPV regioisomers. These six DMPV
regioisomers share the identical elemental composition C17H25NO3, identical EI-MS iminium
cation base peak at m/z 126 which yields the identical MS/MS product ion at m/z 84. The six
aminoketones and the intermediate ketones were separated on a 50% phenyl stationary phase and
the elution order in each case is related to the positioning of substituents on the aromatic ring with
the most crowded 2,6- and 2,3-regioisomers eluting first. The MS data provide focus on the six
regioisomeric dimethoxy substitution patterns and the vapor phase infrared spectra clearly
distinguish each of the aromatic ring dimethoxy substitution patterns. These results demonstrate
that the vapor phase infrared spectroscopy (GC–IR) clearly differentiates between the six
regioisomeric forms of the dimethoxy aromatic ring substitution pattern for the DMPV
compounds. The use of multiple and complementary analytical methods such as GC–MS and GC–
IR combine for the specific identification of each regioisomer in the DMPV series.

181
3. Experimental
3.1. Materials, instruments, GC-Columns and temperature programs
3.1.1. Materials
Precursor materials including piperonal (3,4-methylenedioxybenzaldehyde), 2,3-
methylenedioxybenzaldehyde, 3,4-methylenedioxyproiophenone, 3,4-
methylenedioxybutyrophenone, benzaldehyde, valerophenone, isovalerophenone, 2-, 3- and 4-
methoxybenzaldehydes, 2,3-, 2,4-, 2,5-, 2,6-, 3,4- and 3,5-dimethoxybenzaldehydes,
alkylmagnesium halides, 2-bromoalkanoic acid ethyl esters, azetidine, pyrrolidine, piperidine,
azepane (hexamethyleneimine, perhydroazepine, hexahydro-1H-azepine), potassium dichromate,
bromine, sodium amide, sodium cyanoborohydride, lithium aluminum hydride were obtained from
Aldrich chemical company (Milwaukee, WI) or VWR chemical company (Radnor, PA). Samples
of 2,2,3,3,4,4,5,5-pyrrolidine-D8 and 2,2,5,5-pyrrolidine-D4, piperidine-D10 and deuterated
bromoalkanes were purchased from CDN Isotopes, Pointe Claire, Quebec, Canada.
HPLC grade acetonitrile, methylene chloride, methanol, tetrahydrofuran were purchased
from Fisher Scientific, (Atlanta, GA). Diethyl ether, methylene chloride, carbon tetrachloride,
benzene, ethanol, methanol, tetrahydrofuran (THF) were purchased from Fisher Scientific (Fair
Lawn, NJ).

182
3.1.2. Instruments
GC–MS System 1 consisted of an Agilent Technologies (Santa Clara, CA) 7890A gas
chromatograph and an Agilent 7683B auto injector coupled with a 5975C VL Agilent mass
selective detector. The mass spectral scan rate was 2.86 scans/s. The GC was operated in splitless
injection mode with a helium (ultra-high purity, grade 5, 99.999%) flow rate of 0.480 ml/minute
and the column head pressure was 10 psi. The MS was operated in the electron ionization (EI)
mode with an ionization voltage of 70 eV and a source temperature of 230 °C. The GC injector
was maintained at 230, 150 or 250 °C and the transfer line at 280 °C. Samples were dissolved and
diluted in high-performance liquid chromatography grade acetonitrile and introduced via the auto
injector using an injection volume of 1-μl.
GC–MS System 2 consisted of an Agilent Technologies (Santa Clara, CA) 7890A gas
chromatograph and an Agilent 7683B auto injector coupled with a 240 Agilent Ion Trap mass
spectrometer (MS/MS). The mass spectral scan rate was 2.86 scans/s. The GC was operated in
splitless injection mode (EI-MS and MS/MS) with a helium (ultra-high purity, grade 5, 99.999%)
flow rate of 1 ml/minute and the column head pressure was 8.8085 psi. The MS was operated in
the electron ionization (EI) mode using an ionization voltage of 70 eV and a trap temperature of
150 °C or 200 °C. The GC injector was maintained at 230 °C and the transfer line at 280 °C. For
MS/MS experiments, the scan type used was Automated Method Development function (AMD)
and the MS/MS excitation amplitude was ranged from 0.20 to 1.60 volts. CI-MS studies were
performed using 99.9% methanol as the reagent gas and split injection mode (split ratio of 20:1).
Samples were dissolved and diluted in high-performance liquid chromatography grade acetonitrile
and introduced via the auto injector using an injection volume of 1-μl.

183
GC–IR studies were carried out on a Hewlett-Packard 6890 Series gas chromatograph and
a Hewlett-Packard 7683 series auto-injector coupled with an IRD-3 (Infrared detector Model-3)
obtained from Analytical Solutions and Providers (ASAP), Covington, KY. The vapor phase
infrared spectra were recorded in the range of 4000 to 550 cm-1 with a resolution of 16 cm-1 and a
scan rate 1.50 scans/s. The GC injector was maintained at 250 °C and the transfer line A, the light
pipe and the transfer line B temperatures were maintained at 250 °C. The GC was operated in the
split injection mode (split ratio of 10:1) with a carrier gas helium (ultra-high purity, grade 5,
99.999%) flow rate of 2 ml/minute and the column head pressure was 2.62 psi.
All IR experiments were performed using the same parameters. The stationary phase used
was a 30 m × 0.25 mm i.d. capillary column coated with 0.10 µm film of low polarity Crossbond®
silarylene phase; similar to 5% phenyl, 95% dimethyl polysiloxane (Rxi®-5Sil MS) purchased
from Restek Corporation (Bellefonte, PA). The temperature program consisted of an initial hold
at 70 oC for 1.0 minute, ramped up to 250 oC at a rate of 25 oC/minute followed by a hold at 250
oC for 6.80 minutes. Samples were dissolved and diluted in high-performance liquid
chromatography grade acetonitrile and introduced via the auto injector using an injection volume
of 1-μl.
3.1.3. GC-Columns
Different capillary GC columns were evaluated throughout the course of this work.
However, only columns showed best compromises between resolution and analysis time are
illustrated in Table 2. All columns used were purchased from Restek Corporation (Bellefonte, PA)
and have the same dimensions, 30 m x 0.25 mm i.d., and film depth (f.d.) of 0.10, 0.25 or 0.50 µm.

184
Inlet pressure was converted according to the constant flow mode and the total flow was 60
ml/minute.
Table 2. List of columns used and their composition
Column name
Column composition
Rxi®-35Sil MS
Rxi®-17Sil MS
Midpolarity phase; similar to 35% phenyl, 65% dimethyl
polysiloxane
Midpolarity Crossbond® silarylene phase; similar to 50%
phenyl, 50% dimethyl polysiloxane
Rtx®-5 Crossbond® 5% diphenyl, 95% dimethyl polysiloxane
Rtx®-1 Crossbond® 100% dimethyl polysiloxane
Rtx®-200 Crossbond® 100% trifluoropropylmethyl polysiloxane
Rxi®-5Sil MS Low polarity Crossbond® silarylene phase; similar to 5%
phenyl, 95% dimethyl polysiloxane
3.1.4. Temperature Programs
Different temperature programs were evaluated throughout the course of this work.
However, only programs showing the best compromises between resolution and analysis time are
illustrated in Table 3.

185
Table 3. List of temperature programs used
Temperature
program
name
Injector
temperature
°C
Detector
temperature
°C
Program setup
TP-1
(GC–MS)
(System 1)
230
280
Initial hold of column temperature at 70 °C
for 1.0 minute, then the temperature was
ramped up to 250 °C at a rate of 30
°C/minute followed by a hold at 250 °C for
15.0 minutes
TP-2
(GC–MS)
(System 1)
150
280
Initial hold of column temperature at 70 °C
for 1.0 minute, then the temperature was
ramped up to 250 °C at a rate of 30
°C/minute followed by a hold at 250 °C for
15.0 minutes
TP-3
(GC–MS)
(System 2)
230
280
Initial hold of column temperature at 70 °C
for 1.0 minute, then the temperature was
ramped up to 250 °C at a rate of 30
°C/minute followed by a hold at 250 °C for
7.0 minutes
TP-4
(GC–MS)
(System 1)
250
280
Initial hold of column temperature at 70 °C
for 1.0 minute, ramped up to 150 °C at a
rate of 7.5 °C/minute followed by a hold at
150 °C for 2.0 minutes, then ramped up to
250 °C at a rate of 10 °C/minute followed
by a hold at 250 °C for 47.0 minutes
TP-5
(GC–IR)
250
250
Initial hold of column temperature at 70 °C
for 1.0 minute, then the temperature was
ramped up to 250 °C at a rate of 25
°C/minute followed by a hold at 250 °C for
6.80 minutes

186
3.2. Synthesis of the regioisomeric and homologous aminoketones
3.2.1. Synthesis of the ring substituted aminoketones
3.2.1.1. Synthesis of the methylenedioxyphenyl-aminoketones
A solution of piperonal or 2,3-methylenedioxybenzaldehyde (0.033 mol) in 50 ml of dry
diethyl ether was added to a round bottom flask and maintained under an atmosphere of dry
nitrogen. Alkylmagnesium halide solution in diethyl ether (0.033 to 0.05 mol) was added with a
syringe and the reaction mixture was stirred in ice-acetone bath for two hours. The reaction mixture
was quenched using 1N hydrochloric acid (25 ml) and the ether layer was separated, washed with
water and dried over anhydrous sodium sulfate. The ether layer was filtered and evaporated under
reduced pressure to yield the 2,3- or 3,4-methylenedioxyphenyl-alcohol.
A solution of 2,3- or 3,4-methylenedioxyphenyl-alcohol (0.022 mol) in dilute sulfuric acid
(50 ml) was stirred overnight at room temperature with potassium dichromate (0.022 to 0.033
mol). The reaction mixture was diluted with methylene chloride (150 ml), stirred for 30 minutes
then, vacuum filtered on a pad of Celite. The organic layer was separated, evaporated under
reduced pressure to yield 2,3- or 3,4-methylenedioxyphenyl-ketone, which was purified by flash
chromatography 20:80 ethyl acetate-petroleum ether using Sorbtech (Norcross, GA) purity flash
cartridges (granular silica gel, 25 g).
The alcohol derivatives with 2,3-methylenedioxy subsititution pattern and the 3,4-
methylenedioxy substituted alcohol derivatives with isopropyl or n-butyl side-chain were refluxed
overnight with potassium dichromate to yield the intermediate ketones.

187
The 2,3- or 3,4-methylenedioxyphenyl-ketone (0.011 mol) was dissolved in methylene
chloride in a round bottom flask. Bromine (0.013 mol) was dripped slowly into the solution and
stirred for one hour. The methylene chloride was then evaporated under reduced pressure to yield
a yellow to dark red oil of the alpha brominated 2,3- or 3,4-methylenedioxyphenyl-ketone.
A solution of alpha brominated 2,3- or 3,4-methylenedioxyphenyl-ketone (0.002 mol) in
(50 ml) methylene chloride was slowly added to a (50 ml) methylene chloride solution of cyclic
amine (azetidine, pyrrolidine, piperidine or azepane) (0.0024 mol) in a round bottom flask and the
reaction mixture was stirred at room temperature for 2 hours. The methylene chloride was then
evaporated under reduced pressure to yield the oily 2,3- or 3,4-methylenedioxyphenyl-
aminoketone product. The product was then isolated by solvent extraction and purified by
preparative thin layer chromatography (TLC) 20:80 ethyl acetate-petroleum ether using Analtech
(Newark, DE) glass backed 20 x 20 cm plates with a 1000 µm layer of silica and an inorganic
fluorescent 254 nm indicator.
The bromoketome derivatives with 2,3-methylenedioxy subsititution pattern and the 3,4-
methylenedioxy substituted bromoketone derivatives with isopropyl side-chain were refluxed
overnight with pyrrolidine to yield the final product. While the 3,4-methylenedioxy substituted
bromoketone derivative with n-butyl side-chain was refluxed overnight with azetidine to yield the
final product.

188
3.2.1.2. Synthesis of the monomethoxyphenyl-aminoketones
A solution of 2-, 3- or 4-methoxybenzaldehyde (0.037 mol) in 50 ml of dry diethyl ether
was added to a round bottom flask and maintained under an atmosphere of dry nitrogen.
Alkylmagnesium halide solution in diethyl ether (0.037 to 0.06 mol) was added with a syringe and
the reaction mixture was stirred in ice-acetone bath for two hours. The reaction mixture was
quenched using 1N hydrochloric acid (25 ml) and the ether layer was separated, washed with water
and dried over anhydrous sodium sulfate. The ether layer was filtered and evaporated under
reduced pressure to yield the 2-, 3- or 4-methoxyphenyl-alcohol.
The next steps were accomplished using the same protocol described in the previous
section (see Section 3.2.1.1.) and pyrrolidine in the last step. The final nine compounds were
purified using acid base extraction to yield the free bases.
3.2.1.3. Synthesis of the dimethoxyphenyl-aminoketones (dimethoxypyrovalerones, DMPV)
A solution of 2,3-, 2,4- 2,5- 2,6- 3,4- or 3,5-dimethoxybenzaldehyde (0.03 mol) in 50 ml
of dry diethyl ether was added to a round bottom flask and maintained under an atmosphere of dry
nitrogen. Solution of n-butylmagnesium chloride in diethyl ether (0.03 to 0.05 mol) was added
with a syringe and the reaction mixture was stirred in ice-acetone bath for two hours. The reaction
mixture was quenched using 1N hydrochloric acid (25 ml) and the ether layer was separated,
washed with water and dried over anhydrous sodium sulfate. The ether layer was filtered and
evaporated under reduced pressure to yield the dimethoxyphenyl-alcohol.
The next steps were accomplished using the same protocol described in the previous
section (see Section 3.2.1.1.) with minor changes of the conditions. In the oxidation step, the
regioisomeric 2,6- and 3,5-dimethoxyphenyl-alcohols were refluxed overnight with potassium

189
dichromate to yield the intermediate ketones. The alpha bromination of 2,6-dimethoxyphenyl-
ketone was performed using carbon tetrachloride. Last, dry tetrahydrofuran was used as a solvent
for the neucleophilic substitution reaction with pyrrolidine at room temperature. However, the
alpha brominated 2,6-dimethoxyphenyl-ketone was refluxed overnight with pyrrolidine to yield
the final product.
The product was then isolated by solvent extraction and purified by preparative thin layer
chromatography (TLC) 20:80 ethyl acetate-petroleum ether using Analtech (Newark, DE) glass
backed 20 x 20 cm plates with a 1000 µm layer of silica and an inorganic fluorescent 254 nm
indicator.
3.2.2. Synthesis of the side-chain regioisomeric cathinone derivatives (flakka and iso-flakka)
These regiosiomers were synthesized from the commercially available intermediate
ketones, valerophenone and isovalerophenone or the precursor benzaldehyde. However, the
isopropyl side-chain substituted alcohol was refluxed with potassium dichromate to yield the
intermediate ketone. Furthermore, the alpha brominated intermediate ketone with isopropyl side-
chain was refluxed overnight with pyrrolidine to yield the final product, isoflakka.
The product was then isolated by solvent extraction and purified by preparative thin layer
chromatography (TLC) 20:80 ethyl acetate-petroleum ether using Analtech (Newark, DE) glass
backed 20 x 20 cm plates with a 1000 µm layer of silica and an inorganic fluorescent 254 nm
indicator.

190
3.2.3. Synthesis of the aminoalcohol regioisomeric compounds
The 2,3- and 3,4-methylenedioxypheny-aminoalcohol derivatives were prepared by
lithium aluminum hydride reduction of 2,3-MDPV and 3,4-MDPV, respectively. Dry
tetrahydrofuran (30 ml) was added dropwise to a round bottom flask containing lithium aluminum
hydride (0.0018 mol) under nitrogen followed by the dropwise addition of 2,3-MDPV or 3,4-
MDPV (0.0006 mol) in dry tetrahydrofuran (30 ml). The mixture was refluxed for one hour and
then stirred at room temperature overnight. The reaction mixture was quenched using 1 ml of water
and 5 ml of tetrahydrofuran, followed by the addition of sodium hydroxide (2 ml, 10%) and 3 ml
of water. The mixture was then washed with tetrahydrofuran (10 ml), filtered and evaporated under
reduced pressure to yield the oily 2,3- or 3,4-methylenedioxyphenyl-aminoalcohol product. The
product was then isolated by solvent extraction and purified by preparative thin layer
chromatography (TLC) 20:80 ethyl acetate-petroleum ether using Analtech (Newark, DE) glass
backed 20 x 20 cm plates with a 1000 µm layer of silica and an inorganic fluorescent 254 nm
indicator.
3.2.4. Synthesis of the desoxy regioisomeric compounds
Sodium amide (0.05 mol) was added dropwise to an ice cooled mixture of piperonal or 2,3-
methylenedioxybenzaldehyde (0.033mol) and 2-bromoalkanoic acid ethyl esters (0.033 mol) in
dry benzene (50 ml). The mixture was allowed to stir for two hours at 15-20 °C. The reddish
colored reaction mixture was then poured over crushed ice and the organic layer was separated.
The aqueous layer was washed with benzene (3 x 20 ml). The combined organic extract was
washed with distilled water (3 x 30 ml) then dried over anhydrous sodium sulfate. Benzene was
filtered and evaporated under reduced pressure to yield crude glycidate ester (β-2,3- or 3,4-
methylenedioxyphenyl-α-alkyl glycidic ester) as yellow oils (Darzens reaction).

191
Crude glycidate ster (0.033mol) was dissolved in ethanol (30 ml) and sodium hydroxide
(0.033mol) was added slowly followed by the addition of distilled water (5 ml). The mixture was
stirred overnight at room temperature to give white crystals of glycidic acid sodium salt that were
collected by filtration under reduced pressure. Crystals were washed with ether and methanol (50
ml each) and air-dried. The glycidic acid sodium salt was added to 50 ml 2N hydrochloric acid
solution and the mixture was heated for 1.5 hour. An oily layer of the intermediate ketone was
formed. The desired ketone was extracted with ether (70 ml) and the ether layer was washed once
with water and dried over anhydrous sodium sulfate. The ether was filtered and evaporated under
reduced pressure to give a yellow oil of intermediate ketone.
The intermediate ketone (0.003 mol) along with cyclic amine (azetidine, pyrrolidine,
piperidine or azepane) (0.006 mol) and sodium cyanoborohydride (0.009 mol) were dissolved in
methanol (50 ml) and the reaction mixture was refluxed overnight. Methanol was evaporated under
reduced pressure and the resulting residue was stirred in acidic water (50 ml) at room temperature.
The aqueous layer was washed with ether (3 x 20 ml) and was alkalinized using sodium hydroxide
pellets. The aqueous layer was then extracted with methylene chloride (3 x 30 ml) and the organic
layer was dried over anhydrous sodium sulfate. Methylene chloride was filtered and evaporated
under reduced pressure to give a yellow oil of the desired desoxyamine final product. The product
was purified by preparative thin layer chromatography (TLC) 20:80 ethyl acetate-petroleum ether
using Analtech (Newark, DE) glass backed 20 x 20 cm plates with a 1000 µm layer of silica and
an inorganic fluorescent 254 nm indicator.

192
Summary
This project has focused on issues of resolution and discriminatory capabilities in
controlled substance analysis providing data to increase reliability and selectivity for forensic
evidence and analytical data on new analytes of the so-called bath salt-type drugs of abuse. The
overall goal of these studies was to provide an analytical framework for the identification of
individual substituted cathinones to the exclusion of all other possible isomeric and homologous
forms of these compounds. A number of aminoketones have appeared on the illicit drug market in
recent years including methcathinone, mephedrone, methylone and MDPV (3,4-
methylenedioxypyrovalerone). These substances represent a variety of aromatic ring substituent,
hydrocarbon side-chain and amino group modifications of the basic cathinone molecular skeleton.
Exploration and designer development in the aminoketone derivatives similar to those
reported for amphetamine and related phenethylamines is anticipated to continue for many years.
Production of cathinone derivatives can be based on common readily available precursor
chemicals. These numerous precursor substances are commercially available and would not
prevent the further clandestine/designer exploration of this group of compounds. This suggested a
strong need for a thorough and systematic investigation of the forensic chemistry of these
substituted aminoketones.

193
The broad objective of this research was to improve the specificity, selectivity and
reliability of analytical methods used to identify ring substituted aminoketones and related
compounds. This improvement comes from methods, which allow the forensic analyst to identify
specific regioisomeric forms of substituted aminoketones among many isomers of mass spectral
equivalence. Mass spectrometry is the most common method of confirmation in forensic drug
analysis. This project provides methodology and analytical data to discriminate between those
regioisomeric molecules having the same molecular weight and major fragments of equivalent
mass (i.e. identical mass spectra). Furthermore, this work has anticipated the future appearance of
some designer aminoketones and developed reference data and analytical reference standards for
these compounds.
The initial phase of this work was the organic synthesis of aminoketones of varying
aromatic ring substituents, hydrocarbon side-chains and amino groups. This included the synthesis
of selected deuterium labeled compounds as needed for MS fragmentation confirmation. The
analytical phases consisted of chemical characterization, using tools common to forensic science
labs such as MS and IR and these studies were carried out on each of the compounds. The
chromatographic retention properties for each series of isomers were evaluated by gas
chromatographic techniques on a variety of stationary phases to establish a structure-retention
relationship for the regioisomeric aminoketones on selected chromatographic stationary phases.
The use of multiple and complementary analytical methods such as GC–MS, GC–MS/MS
and GC–IR were necessary for the specific identification of these cathinone derivatives. These
techniques were used to differentiate among different groups (regioisomers and homologs) of
substituted aminoketone-type drugs (cathinone derivatives). The MS data provided focus on the

194
dimethoxy, methylenedioxy as well as monomethoxy substitution patterns and the vapor phase
infrared spectra clearly differentiated among each of these aromatic ring substitution patterns. The
side-chain and cyclic amino group containing regioisomers and the side-chain n-propyl and
isopropyl containing regioisomers each yielded equivalent iminium cation base peaks and IR
spectra. However, these equivalent iminium cation base peaks (m/z 126) yielded characteristic
product ions in the MS/MS experiments. The product ions from the m/z 126 iminium cation
produced by the side-chain and cyclic amino group containing regioisomeric desoxy
phenethylamines were consistent with the corresponding aminoketone analogues. The vapor phase
infrared spectra of the desoxy phenethylamines and the aminoalcohol derivatives displayed
characteristic absorption bands specific for those compounds. These studies suggested the strong
need for multiple and complementary analytical methods such as GC–MS, GC–MS/MS and GC–
IR.

195
References
AAPCC (2013) American Association of Poison Control Centers: Bath salts. Available in
http://www.aapcc.org/alerts/bath-salts/
Aarde, S.M., Angrish, D., Barlow, D.J. et al. Mephedrone (4-methylmethcathinone) supports
intravenous self-administration in Sprague-Dawley and Wistar rats. Addict. Biol. 18 (2013a) 786–
799.
Aarde, S.M., Huang, P.K., Creehan, K.M., Dickerson, T.J., Taffe, M.A. The novel recreational
drug 3,4-methylenedioxypyrovalerone (MDPV) is a potentpsychomotor stimulant: Self-
administration and locomotor activity in rats. Neuropharmacology 71 (2013b) 130–140.
Abdel-Hay, K.M., DeRuiter, J., Clark, C.R. GC–MS and GC–IRD studies on the six ring
regioisomeric dimethoxybenzylpiperazines (DMBPs). Drug Test. Anal. 5 (2013) 560–572.
Aleksandrov, A.L. Oxidation of amines by molecular oxygen, Bull. Acad. Sci. USSR Div. Chem.
Sci. 29 (1980) 1740–1744.
Alem, A., Kebede, D., Kullgren, G. The prevalence and socio-demographic correlates of khat
chewing in Butajira, Ethiopia. Acta. Psychiatr. Scand. Suppl. 397 (1999) 84–91.
Al-Motarreb, A., Baker, K., Broadley, K.J. Khat: Pharmacological and medical aspects and its
social use in Yemen. Phytother. Res. 16 (2002) 403–413.
Al-Mugahed, L. Khat chewing in Yemen: Turning over a new leaf. Bull. World Health Organ. 86
(2008) 741.
Archer, R.P. Fluoromethcathinone, a new substance of abuse. Forensic Sci. Int. 185 (2009) 10–20.
Arunotayanun, W., Gibbons, S. Natural product ‘legal highs’. Nat. Prod. Rep. 29 (2012) 1304–
1316.
Awad, T., Belal, T., DeRuiter, J., Kramer, K., Clark, C.R. Comparison of GC–MS and GC–IRD
methods for the differentiation of methamphetamine and regioisomeric substances. Forensic Sci.
Int. 185 (2009) 67–77.

196
Balint, E.E., Falkay, G., Balint, G.A. Khat—a controversial plant. Wien Klin Wochenschr 121
(2009) 604–614.
Baumann, M.H., Ayestas Jr, M.A., Partilla, J.S. et al. The designer methcathinone analogs,
mephedrone and methylone, are substrates for monoamine transporters in brain tissue. Neuropsy-
chopharmacol. Off. Publ. Am. Coll. Neuropsychopharmacol. 37 (2012) 1192–1203.
Baumann, M.H., Partilla, J.S., Lehner, K.R. Psychoactive “bath salts”: Not so soothing. Eur. J.
Pharmacol. 698 (2013a) 1–5.
Baumann, M.H., Partilla, J.S., Lehner, K.R. et al. Powerful cocaine-like actions of 3,4-
Methylenedioxypyrovalerone (MDPV), a principal constituent of psychoactive ‘bath salts’
products. Neuropsychopharmacol. Off. Publ. Am. Coll. Neuropsychopharmacol. 38 (2013b) 552–
562.
Bentur, Y., Bloom-Krasik, A., Raikhlin-Eisenkraft, B. Illicit cathinone (“Hagigat”) poisoning.
Clin. Toxicol. 46 (2008) 206–210.
Brandt, S.D., Sumnall, H.R., Measham, F., Cole, J. Second generation mephedrone. The confusing
case of NRG-1. Bmj. 341 (2010a) c3564.
Brandt, S.D., Wootton, R.C., De Paoli, G., Freeman, S. The naphyrone story: The alpha or beta-
naphthyl isomer? Drug Test. Anal. 2 (2010b) 496–502.
Brenneisen, R., Fisch, H.U., Koelbing, U., Geisshusler, S., Kalix, P. Amphetamine-like effects in
humans of the khat alkaloid cathinone. Br. J. Clin. Pharmacol. 30 (1990) 825–828.
Brenneisen, R., Geisshusler, S., Schorno, X. Metabolism of cathinone to (−)-norephedrine and (−)-
norpseudoephedrine. The Journal of pharmacy and pharmacology 38 (1986) 298–300.
Bretteville-Jensen, A., Tuv, S., Bilgrei, O., Fjeld, B., Bachs, L. Synthetic cannabinoids and
cathinones: Prevalence and markets. Forensic Sci. Rev. 25 (2013) 7–26.
Cameron, K.N., Kolanos, R., Solis Jr, E., Glennon, R.A., De Felice, L.J. Bath salts components
mephedrone and methylenedioxypyrovalerone (MDPV) act synergistically at the human dopamine
transporter. Br. J. Pharmacol. 168 (2013) 1750–1757.
Canning, H., Goff, D., Leach, M.J., Miller, A.A., Tateson, J.E., Wheatley, P.L. The involvement
of dopamine in the central actions of bupropion, a new antidepressant [proceedings]. Br. J.
Pharmacol. 66 (1979) 104P–105P.
Casale, J.F., Hays, P.A., Klein, R.F.X. Synthesis and characterization of the 2,3-
methylenedioxyamphetamines, J. Forensic Sci. 40 (1995) 391–400.
Chapman, M.H., Kajihara, M., Borges, G. et al. Severe, acute liver injury and khat leaves. N. Engl.
J. Med. 362 (2010) 1642–1644.

197
Clark, C.R., DeRuiter, J., Valaer, A., Noggle, F.T. Gas chromatographic-mass spectrometric and
liquid chromatographic analysis of designer butanamines related to MDMA. J. Chromatogr. Sci.
33 (1995) 328–337.
Collins, M. Some new psychoactive substances: Precursor chemicals and synthesis-driven end-
products. Drug Test. Anal. 3 (2011) 404–416.
Concheiro, M., Anizan, S., Ellefsen, K., Huestis, M.A. Simultaneous quantification of 28 synthetic
cathinones and metabolites in urine by liquid chromatography-high resolution mass spectrometry.
Anal. Bioanal. Chem. 405 (2013) 9437–9448.
Coppola, M., Mondola, R. Synthetic cathinones: chemistry, pharmacology and toxicology of a
new class of designer drugs of abuse marketed as “bath salts” or “plant food”. Toxicol. Lett. 211
(2012) 144–149.
Corkery, J.M., Schifano, F., Oyefeso, A. et al. ‘Bundle of fun’or’bunch of problems’? Case series
of khat-related deaths in the UK. Drugs Educ. Prev. Policy 18 (2011) 408–425.
Cox, G., Rampes, H. Adverse effects of khat: A review. Adv. Psychiatr. Treat. 9 (2003) 456–463.
Cozzi, N.V., Sievert, M.K., Shulgin, A.T., Jacob 3rd, P., Ruoho, A.E. Inhibition of plasma
membrane monoamine transporters by beta-ketoamphetamines. Eur. J. Pharmacol. 381 (1999) 63–
69.
Dal Cason, T.A. The characterization of some 3,4-methylenedioxycathinone (MDCATH)
homologs. Forensic Sci. Int. 87 (1997) 9–53.
Dal Cason, T.A., Young, R., Glennon, R.A. Cathinone: An investigation of several N-alkyl and
methylenedioxy-substituted analogs. Pharmacol. Biochem. Behav. 58 (1997) 1109–1116.
Davies, S., Wood, D.M., Smith, G. et al. Purchasing ‘legal highs’ on the Internet–is there
consistency in what you get? QJM. Mon. J. Assoc. Phys. 103 (2010) 489–493.
de Castro, A., Lendoiro, E., Fernández-Vega, H., Steinmeyer, S., López-Rivadulla, M., Cruz, A.
Liquid chromatography tandem mass spectrometry determination of selected synthetic cathinones
and two piperazines in oral fluid. Cross reactivity study with an on-site immunoassay device. J.
Chromatogr. A 1374 (2014) 93–101.
Deluca, P., Schifano, F., Davey, Z., Corazza, O., Di Furia, L. Group PWMR (2009) Mephedrone
report. Available at http://www.psychonautproject.eu/
Dhaifalah, I., Santavy, J. Khat habit and its health effect. A natural amphetamine. Biomedical
papers of the Medical Faculty of the University Palacky, Olomouc, Czechoslovakia 148 (2004)
11–15.

198
Drug Enforcement Administration DoJ Schedules of controlled substances: Temporary placement
of three synthetic cathinones in Schedule I. Final order. Fed. Reg. 76 (2011) 65371–65375.
Drug Enforcement Administration DoJ Schedules of controlled substances: Extension of
temporary placement of methylone into schedule I of the controlled substances Act. Final order.
Fed. Reg. 77 (2012) 64032–64033.
EMCDDA (2012) The EMCDDA annual report 2012: The state of the drugs problem in Europe.
Euro. Surveill. doi:10.2810/64775. Available at http://www.emcdda.europa.eu/
EMCDDA (2018) The EMCDDA annual report 2018: Trends and developments. Euro. Surveill.
doi:10.2810/688395. Available at http://www.emcdda.europa.eu/
EMCDDA-Europol (2009) EMCDDA–Europol 2008 annual report on the implementation of
council decision 2005/387/JHA. Available at http://www.emcdda.europa.eu/
EMCDDA-Europol (2010) EMCDDA–Europol 2009 annual report on the implementation of
council decision 2005/387/JHA. Available at http://www.emcdda.europa.eu/
EMCDDA-Europol (2011) EMCDDA–Europol 2010 annual report on the implementation of
council decision 2005/387/JHA. Available at http://www.emcdda.europa.eu/
Emerson, T.S., Cisek, J.E. Methcathinone: A Russian designer amphetamine infiltrates the rural
midwest. Ann. Emerg. Med. 22 (1993) 1897–1903.
Fasanmade, A., Kwok, E., Newman, L. Oral squamous cell carcinoma associated with khat
chewing. Oral Surg. Oral Med. Oral Pathol. Oral Radiol. Endod. 104 (2007) e53–e55.
Fass, J.A., Fass, A.D., Garcia, A.S. Synthetic cathinones (bath salts): Legal status and patterns of
abuse. Ann. Pharmacother. 46 (2012) 436–441.
Fluckiger, F.A., Gerock, J.E. Contribution to the knowledge of catha leaves. Pharm. J. Transvaal.
18 (1887) 221–224.
Gardos, G., Cole, J.O. Evaluation of pyrovalerone in chronically fatigued volunteers. Curr. Ther.
Res. Clin. Exp. 13 (1971) 631–635.
Garrett, G., Sweeney, M. The serotonin syndrome as a result of mephedrone toxicity. BMJ. Case
Rep. (2010) 1–5.
German, C.L., Fleckenstein, A.E., Hanson, G.R. Bath salts and synthetic cathinones: An emerging
designer drug phenomenon. Life Sci. 97 (2014) 2–8.
Gezon, L.L. Drug crops and food security: The effects of khat on lives and livelihoods in northern
madagascar. Cult. Agric. Food Environ. 34 (2012) 124–135.

199
Gibbons, S., Zloh, M. An analysis of the ‘legal high’ mephedrone. Bioorg. Med. Chem. Lett., 20
(2010) 4135–4139.
Gorun, G., Dermengiu, D., Curcă, C., Hostiuc, S., Ioan, B., Luta, V. Toxicological drivers issues
in “legal highs” use. Romanian J. Legal Med. 18 (2010) 272.
Hyde, J., Browning, E., Adams, R. Synthetic homologs of d, l-ephedrine. J. Am. Chem. Soc. 50
(1928) 2287–2292.
Iqbal, M., Monaghan, T., Redmond, J. Manganese toxicity with ephedrone abuse manifesting as
Parkinsonism: A case report. J. Med. Case Rep. 6 (2012) 52.
James, D., Adams, R.D., Spears, R. et al. Clinical characteristics of mephedrone toxicity reported
to the U.K. National Poisons Information Service. Emerg. Med. J. EMJ. 28 (2011) 686–689.
Jerry, J., Collins, G., Streem, D. Synthetic legal intoxicating drugs: The emerging ‘incense’ and
‘bath salt’ phenomenon. Clevel. Clin. J. Med. 79 (2012) 258–264.
Kalix, P. A comparison of the catecholamine releasing effect of the khat alkaloids (−)-cathinone
and (+)-norpseudoephedrine. Drug Alcohol Depend. 11 (1983) 395–401.
Kalix, P. The pharmacology of psychoactive alkaloids from ephedra and catha. J. Ethnopharmacol.
32 (1991) 201–208.
Kalix, P. Cathinone, a natural amphetamine. Pharmacol. Toxicol. 70 (1992) 77–86.
Kalix, P., Braenden, O. Pharmacological aspects of the chewing of khat leaves. Pharmacol. Rev.
37 (1985) 149–164.
Kalix, P., Khan, I. Khat: An amphetamine-like plant material. Bull. World Health Organ. 62 (1984)
681–686.
Kamata, H.T., Shima, N., Zaitsu, K. et al. Metabolism of the recently encountered designer drug,
methylone, in humans and rats. Xenobiotica. Fate Foreign Compd. Biol. Syst. 36 (2006) 709–723.
Karila, L., Reynaud, M. GHB and synthetic cathinones: Clinical effects and potential
consequences. Drug Test. Anal. 3 (2011) 552–559.
Katz, D.P., Bhattacharya, D., Bhattacharya, S., DeRuiter, J., Clark, C.R., Suppiramaniam, V.,
Dhanasekaran, M. Synthetic cathinones: “A khat and mouse game”. Tox. Letters 229 (2014) 349–
356.
Kavanagh, P., O’Brien, J., Fox, J., O’Donnell, C., Christie, R., Power, J.D., McDermott, S.D. The
analysis of substituted cathinones. Part 3. Synthesis and characterisation of 2,3-methylenedioxy
substituted cathinones, Forensic Sci. Int. 216 (2012) 19–28.

200
Kelly, J.P. Cathinone derivatives: A review of their chemistry, pharmacology and toxicology. Drug
Test. Anal. 3 (2011) 439–453.
Khreit, O.I., Grant, M.H., Zhang, T., Henderson, C., Watson, D.G., Sutcliffe, O.B. Elucidation of
the Phase I and Phase II metabolic pathways of (±)-4′-methylmethcathinone (4-MMC) and (±)-4′-
(trifluoromethyl)methcathinone (4-TFMMC) in rat liver hepatocytes using LC-MS and LC-MS(2).
J. Pharm. Biomed. Anal. 72 (2013) 177–185.
Klein, A., Jelsma, M., Metaal, P. Chewing over Khat prohibition. In: The globalisation of control
and regulatio.n of an ancient stimulant. Transnational Institute Series on Legislative Reform of
Drug Policies No. 17. Transnational Institute, Amsterdam, 2012.
Kriikku, P., Wilhelm, L., Schwarz, O., Rintatalo, J. New designer drug of abuse: 3,4-
Methylenedioxypyrovalerone (MDPV). Findings from apprehended drivers in Finland. Forensic
Sci. Int. 210 (2011) 195–200.
Levine, M., Levitan, R., Skolnik, A. Compartment syndrome after “bath salts” use: A case series.
Ann. Emerg. Med. 61 (2013) 480–483.
Lewin, A.H., Seltzman, H.H., Carroll, F.I., Mascarella, S.W., Reddy, P.A. Emergence and
properties of spice and bath salts: A medicinal chemistry prospective. Life Sci. 97 (2014) 9–19.
Lindsay, L., White, M.L. Herbal marijuana alternatives and bath salts—“barely legal” toxic highs.
Clin. Pediatr. Emerg. Med. 13 (2012) 283–291.
Lopez-Arnau, R., Martinez-Clemente, J., Pubill, D., Escubedo, E., Camarasa, J. Comparative
neuropharmacology of three psychostimulant cathinone derivatives: Butylone, mephedrone and
methylone. Br. J. Pharmacol. 167 (2012) 407–420.
Marinetti, L.J., Antonides, H.M. Analysis of synthetic cathinones commonly found in bath salts in
human performance and postmortem toxicology: Method development, drug distribution and
interpretation of results. J. Anal. Toxicol. 37 (2013) 135–146.
Marusich, J.A., Grant, K.R., Blough, B.E., Wiley, J.L. Effects of synthetic cathinones contained
in “bath salts” on motor behavior and a functional observational battery in mice. Neurotoxicology
33 (2012) 1305–1313.
Mas-Morey, P., Visser, M., Winkelmolen, L., Touw, D. Clinical toxicology and management of
intoxications with synthetic cathinones (“bath salts”). J. Pharm. Pract. 26 (2012) 353–357.
Mathys, K., Brenneisen, R. Determination of (S)-(−)-cathinone and its metabolites (R, S)-(−)-
norephedrine and (R, R)-(−)- norpseudoephedrine in urine by high-performance liquid chro-
matography with photodiode-array detection. J. Chromatogr. 593 (1992) 79–85.

201
Meltzer, P.C., Butler, D., Deschamps, J.R., Madras, B.K. 1-(4-Methylphenyl)-2-pyrrolidin-1-yl-
pentan-1-one (Pyrovalerone) analogues: A promising class of monoamine uptake inhibitors. J.
Med. Chem. 49 (2006) 1420–1432.
Meng, H., Cao, J., Kang, J. et al. Mephedrone, a new designer drug of abuse, produces acute
hemodynamic effects in the rat. Toxicol. Lett. 208 (2012) 62–68.
Meyer, M.R., Du, P., Schuster, F., Maurer, H.H. Studies on the metabolism of the alpha-
pyrrolidinophenone designer drug methylenedioxy-pyrovalerone (MDPV) in rat and human urine
and human liver microsomes using GC–MS and LC-high-resolution MS and its detectability in
urine by GC–MS. J. Mass Spectrom. JMS. 45 (2010a) 1426–1442.
Meyer, M.R., Vollmar, C., Schwaninger, A.E., Wolf, E., Maurer, H.H. New cathinone-derived
designer drugs 3-bromomethcathinone and 3-fluoromethcathinone: Studies on their metabolism in
rat urine and human liver microsomes using GC–MS and LC-high-resolution MS and their
detectability in urine. J. Mass Spectrom. JMS. 47 (2012) 253–262.
Meyer, M.R., Wilhelm, J., Peters, F.T., Maurer, H.H. Beta-keto amphetamines: Studies on the
metabolism of the designer drug mephedrone and toxicological detection of mephedrone,
butylone, and methylone in urine using gas chromatography-mass spectrometry. Anal. Bioanal.
Chem. 397 (2010b) 1225–1233.
Motbey, C.P., Clemens, K.J., Apetz, N. et al. High levels of intravenous mephedrone (4-
methylmethcathinone) self-administration in rats: Neural consequences and comparison with
methamphetamine. J. Psychopharmacol. 27 (2013) 823–836.
Nencini, P., Amiconi, G., Befani, O., Abdullahi, M.A., Anania, M.C. Possible involvement of
amine oxidase inhibition in the sympathetic activation induced by khat (Catha edulis) chewing in
humans. J. Ethnopharmacol. 11 (1984) 79–86.
Nichols, D.E., Hoffman, A.J., Oberlender, R.A., Jacob III, P., Shulgin, A.T. Derivatives of 1-(1,3-
benzodioxol5-yl)-2-butanamine: Representatives of a novel therapeutic class. J. Med. Chem. 29
(1986) 2009–2015.
Noggle, F.T., DeRuiter, J., Valaer, A., Clark, C.R. GC–MS analysis of methcathinone and its major
decomposition product, Microgram 27 (1994) 106–118.
Osorio-Olivares, M., Rezende, M.C., Sepulveda-Boza, S., Cassels, B.K., Fierro, A. MAO
inhibition by arylisopropylamines: The effect of oxygen substituents at the beta-position. Bioorg.
Med. Chem. 12 (2004) 4055–4066.
Paul, B.D., Cole, K.A. Cathinone (Khat) and methcathinone (CAT) in urine specimens: A gas
chromatographic-mass spectrometric detection procedure. J. Anal. Toxicol. 25 (2001) 525–530.

202
Pawlik, E., Plasser, G., Mahler, H., Daldrup, T. Studies on the phase I metabolism of the new
designer drug 3-fluoromethcathinone using rabbit liver slices. Int. J. Legal Med. 126 (2012) 231–
240.
Pedersen, A.J., Reitzel, L.A., Johansen, S.S., Linnet, K. In vitro metabolism studies on
mephedrone and analysis of forensic cases. Drug Test. Anal. 5 (2013) 430–438.
Peters, F.T., Meyer, M.R., Fritschi, G., Maurer, H.H. Studies on the metabolism and toxicological
detection of the new designer drug 4′-methyl-alpha-pyrrolidinobutyrophenone (MPBP) in rat urine
using gas chromatography-mass spectrometry. J. Chromatogr. B Anal. Technol. Biomed. Life Sci.
824 (2005) 81–91.
Prosser, J.M., Nelson, L.S. The toxicology of bath salts: A review of synthetic cathinones. J. Med.
Toxicol. Off. J. Am. Coll. Med. Toxicol. 8 (2012) 33–42.
Regester, L.E., Chmiel, J.D., Holler, J.M., Vorce, S.P., Levine, B., Bosy, T.Z. Determination of
designer drug cross-reactivity on five commercial immunoassay screening kits. J. Anal. Toxicol.
39 (2015) 144–151.
Roelandt, P., George, C., d’Heygere, F. et al. Acute liver failure secondary to khat (< i > Catha
edulis </i >)–induced necrotic hepatitis requiring liver transplantation: Case report. Transpl. Proc.
43 (2011) 3493–3495.
Saal, C. Pharmaceutical Salts Optimization of Solubility or Even More? American Pharmaceutical
Review, (hhttp://www.americanpharmaceuticalreview.com/Fea- tured-Articles/117009-
Pharmaceutical-Salts-Optimization-of-Solubility-or- Even-More/). 2010.
Sakitama, K., Ozawa, Y., Aoto, N., Nakamura, K., Ishikawa, M. Pharmacological properties of
NK433, a new centrally acting muscle relaxant. Eur. J. Pharmacol. 273 (1995) 47–56.
Sammler, E.M., Foley, P.L., Lauder, G.D., Wilson, S.J., Goudie, A.R., O’Riordan, J.I. A harmless
high? Lancet 376 (2010) 742.
Sauer, C., Peters, F.T., Haas, C., Meyer, M.R., Fritschi, G., Maurer, H.H. New designer drug alpha-
pyrrolidinovalerophenone (PVP): Studies on its metabolism and toxicological detection in rat urine
using gas chromatographic/mass spectrometric techniques. J. Mass Spectrom. JMS. 44 (2009)
952–964.
Schifano, F., Albanese, A., Fergus, S. et al. Mephedrone (4-methylmethcathinone; ‘meow meow’):
Chemical, pharmacological and clinical issues. Psychopharmacology 214 (2011) 593–602.
Shima, N., Katagi, M., Tsuchihashi, H. Direct analysis of conjugate metabolites of
methamphetamine, 3,4-methylenedioxymethamphetamine, and their designer drugs in biological
fluids. J. Health Sci. 55 (2009) 495–502.

203
Shortall, S.E., Green, A.R., Swift, K.M., Fone, K.C., King, M.V. Differential effects of cathinone
compounds and MDMA on body temperature in the rat, and pharmacological characterization of
mephedrone-induced hypothermia. Br. J. Pharmacol. 168 (2013) 966–977.
Siegel, G.J., Agranoff, B.W., Albers, R.W., Fisher, S.K., Uhler, M.D. (1999) Storage and release
of catecholamines. In: Siegel, G.J., Fisher, S.K., Uhler, M.D., Albers, R.W., Agranoff, B.W. (eds)
Basic neurochemistry: Molecular, cellular and medical aspects, 6th edn. Lippincott Williams &
Wilkins, Philadelphia.
Simmler, L.D., Buser, T.A., Donzelli, M. et al. Pharmacological characterization of designer
cathinones in vitro. Br. J. Pharmacol. 168 (2013) 458–470.
Smith, L.W., Thaxton-Weissenfluh, A., Abiedalla, Y., DeRuiter, J., Smith, F., Clark, C.R.
Correlation of vapor phase infrared spectra and regioisomeric structure in synthetic cannabinoids.
Spectrochim. Acta A 196 (2018) 375–384.
Soine, W.H., Shark, R.E., Agee, D.T. Differentiation of 2,3-methylenedioxyamphetamine from
3,4-methylenedioxyamphetamine. J. Forensic Sci. 28 (1983) 386–390.
Sparago, M., Wlos, J., Yuan, J. et al. Neurotoxic and pharmacologic studies on enantiomers of the
N-methylated analog of cathinone (methcathinone): A new drug of abuse. J. Pharmacol. Exp. Ther.
279 (1996) 1043–1052.
Spyker, D.A., Thomas, S., Bateman, D.N. et al. International trends in designer amphetamine
abuse in UK and US, 2009–2012. Clin. Toxicol. 50 (2012) 141.
Strano-Rossi, S., Cadwallader, A.B., de la Torre, X., Botre, F. Toxicological determination and in
vitro metabolism of the designer drug methylenedioxypyrovalerone (MDPV) by gas chromatog-
raphy/mass spectrometry and liquid chromatography/quadrupole time-of-flight mass
spectrometry. Rapid Commun. Mass spectrum. RCM. 24 (2010) 2706–2714.
Swortwood, M.J., Hearn, W.L., deCaprio, A.P. Cross-reactivity of designer drugs, including
cathinone derivatives, in commercial enzyme-linked immunosorbent assays. Drug Test. Anal. 6
(2014) 716–727.
Toennes, S.W., Kauert, G.F. Excretion and detection of cathinone, cathine, and
phenylpropanolamine in urine after kath chewing. Clin. Chem. 48 (2002) 1715–1719.
Truscott, S.M., Crittenden, N.E., Shaw, M.A., Middleberg, R.A., Jortani, S.A. Violent Behavior
and Hallucination in a 32-Year-Old Patient. Clin. Chem. 59 (2013) 612–615.
Tsujikawa, K., Kuwayama, K., Kanamori, T., Iwata, Y.T., Inoue, H. Thermal degradation of α-
pyrrolidinopentiophenone during injection in gas chromatography/mass spectrometry. Forensic
Sci. Int. 231 (2013a) 296–299.

204
Tsujikawa, K., Mikuma, T., Kuwayama, K., Miyaguchi, H., Kanamori, T., Iwata, Y.T., Inoue, H.
Identification and differentiation of methcathinone analogs by gas chromatography-mass
spectrometry, Drug Test. Anal. 5 (2013b) 670–677.
Tsujikawa, K., Yamamuro, T., Kuwayama, K., Kanamori, T., Iwata, Y.T., Inoue, H. Instability of
the hydrochloride salts of cathinone derivatives in air. Forensic Sci. Int. 248 (2015) 48–54.
United Nations. Etudes sur la composition chimique du khat: Recherches sur la fraction
phénylalkylamine. UN document MNAR/11/1975.
United Nations Office on Drugs and Crime, World Drug Report 2016 (United Nations publication,
Sales No. E.16.XI.7). ISBN: 978-92-1-148286-7, 52–61.
U. S. Department of Justice, National Drug Intelligence Center (NDIC), Situation report, synthetic
cathinones (bath salts): An emerging domestic threat, July 2011.
Valente, M.J., Guedes de Pinho, P., Bastos, M., Carvalho, F., Carvalho, M. Khat and synthetic
cathinones: A review. Arch. Toxicol. 88 (2014) 15–45.
Van Hout, M.C., Brennan, R. Plant food for thought: A qualitative study of mephedrone use in
Ireland. Drugs Educ. Prev. Policy 18 (2011) 371–381.
Varlibas, F., Delipoyraz, I., Yuksel, G., Filiz, G., Tireli, H., Gecim, N.O. Neurotoxicity following
chronic intravenous use of “Russian cocktail”. Clin. Toxicol. 47 (2009) 157–160.
Wang, C.C., Hartmann-Fischbach, P., Krueger, T.R., Wells, T.L., Feineman, A.R., Compton, J.C.
Rapid and sensitive analysis of 3,4-methylenedioxypyrovalerone in equine plasma using liquid
chromatography–tandem mass spectrometry, J. Anal. Toxicol. 36 (2012) 327–333.
Warrick, B.J., Wilson, J., Hedge, M., Freeman, S., Leonard, K., Aaron, C. Lethal serotonin
syndrome after methylone and butylone ingestion. J. Med. Toxicol. Off. J. Am. Coll. Med.
Toxicol. 8 (2012) 65–68.
Westphal, F., Junge, T., Rosner, P., Fritschi, G., Klein, B., Girreser, U. Mass spectral and NMR
spectral data of two new designer drugs with an alpha-aminophenone structure: 4′-methyl-alpha-
pyrrolidinohexanophenone and 4′-methyl-alpha-pyrrolidinobutyrophenone. Forensic Sci. Int. 169
(2007) 32–42.
Westphal, F., Junge, T., Rosner, P., Sonnichsen, F., Schuster, F. Mass and NMR spectroscopic
characterization of 3,4- methylenedioxypyrovalerone: A designer drug with alpha-
pyrrolidinophenone structure. Forensic Sci. Int. 190 (2009) 1–8.
Westphal, F., Rosner, P., Junge, T. Differentiation of regioisomeric ring-substituted
fluorophenethylamines with product ion spectrometry. Forensic Sci. Int. 194 (2010) 53–59.

205
Wolfes, O. Über das Vorkommen von d-nor-iso-Ephedrin in Catha edulis. Arch. Pharm. 268
(1930) 81–83.
Wood, D.M., Davies, S., Greene, S.L. et al. Case series of individuals with analytically confirmed
acute mephedrone toxicity. Clin. Toxicol. 48 (2010) 924–927.
Wright Jr, M.J., Vandewater, S.A., Angrish, D., Dickerson, T.J., Taffe, M.A. Mephedrone (4-
methylmethcathinone) and d-methamphetamine improve visuospatial associative memory, but not
spatial working memory, in rhesus macaques. Br. J. Pharmacol. 167 (2012) 1342–1352.
Yohannan, J.C., Bozenko Jr, J.S. The characterization of 3,4-methylenedioxypyrovalerone
(MDPV). Microgram J. 7 (2010) 5–15.
Young, R., Glennon, R.A. Cocaine-stimulus generalization to two new designer drugs:
Methcathinone and 4-methylaminorex. Pharmacol. Biochem. Behav. 45 (1993) 229–231.
Zaitsu, K., Katagi, M., Kamata, H., Kamata, T., Shina, N., Miki, A., Tsuchihashi, H., Mori, Y.
Determination of the metabolites of the new designer drugs bk-MBDB and bk-MDEA in human
urine. Forensic Sci. Int. 188 (2009) 131–139.
Zaitsu, K., Katagi, M., Tatsuno, M., Sato, T., Tsuchihashi, H., Suzuki, K. Recently abused β-keto
derivatives of 3, 4-methylenedioxyphenylalkylamines: A review of their metabolisms and toxi-
cological analysis. Forensic Toxicol. 29 (2011) 73–84.


![Chromatographic Characterization and GC-MS Evaluation of ... fileLoligo sp. ink has quantified its chemical components as L-DOPAandDopamine[3].Theblackpigmentwasfoundto bemelaninandtheprocessofmelanogenesiswasexplained](https://static.fdocuments.net/doc/165x107/5cac5a0788c99358488c1673/chromatographic-characterization-and-gc-ms-evaluation-of-sp-ink-has-quantified.jpg)