Synthesis, Characterization and Thermoluminescence …paper.uscip.us/jla/jla.2014.1005.pdf ·...
21
Columbia International Publishing Journal of Luminescence and Applications (2014) Vol. 1 No. 2 pp. 40-60 doi:10.7726/jla.2014.1005 Research Article ______________________________________________________________________________________________________________________________ *Corresponding e-mail: [email protected] 1 Department of Physics, Jnana Bharathi Campus, Bangalore University, Bangalore – 560 056 40 Synthesis, Characterization and Thermoluminescence Studies of LiNaSO 4 : Eu 3+ nanophosphor Y.S. Vidya 1 and B.N. Lakshminarasappa 1* Received 13 December 2013; Published online 2 August 2014 © The author(s) 2014. Published with open access at www.uscip.us Abstract Na2SO4, LiNaSO4 and LiNaSO4: Eu 3+ nanophosphors were successfully synthesized by slow evaporation technique followed by calcination at 400°C. The resultant products were characterized by using powder X- ray diffraction (PXRD), Fourier transform infrared spectroscopy (FTIR), UV – Vis, scanning electron microscope (SEM) and transmission electron microscope (TEM). Doping with Li + ion stabilized the thenardite phase (Phase V) while, codoping with Eu 3+ promoted the phase transformation from stable thenardite to metastable mirabilite (Phase III) crystal structure. The average crystallite size was calculated by using Debye – Scherrer’s formula and Williamson – Hall (W – H) plots. The optical energy band gap (Eg) of Na2SO4, LiNaSO4 and LiNaSO4: Eu 3+ were estimated from Wood and Tauc’s relation which varies from 4.2 – 4.33 eV. Thermoluminescence (TL) studies were investigated by using γ – irradiation in the dose range 0.5 – 5 kGy at a heating rate of 5 °C s -1 . A well resolved glow peaks at ~ 180 °C, ~ 150 °C and ~115 °C were recorded for Na2SO4, LiNaSO4 and LiNaSO4: Eu 3+ nanophosphors respectively. It was observed that isovalent doping of Li + served as quencher, while codoping of hypervalent Eu 3+ acted as activator to enhance the TL intensity of glow peak. In the present study, the extent of TL fading of LiNaSO4: Eu 3+ was 31 % compared to LiNaSO4 (52 %) and Na2SO4 (59 %). So, LiNaSO4: Eu 3+ phosphor might also have potential use in dosimetry. The kinetic parameters namely activation energy (E), frequency factor (s) and order of kinetics (b) was estimated and the results were discussed. Keywords: Sodium sulphate; Codoping; Thermoluminescence; Fading; Kinetic Parameters 1. Introduction Alkali sulphates were known for a long time as versatile and excellent phosphor materials. These sulphates attracted the attention of many workers in view of their potential applications in radiation dosimetry, TV screens, cathode ray tubes etc. A variety of defect centres were likely to be formed in sulphate based phosphors (Kher et al., 2008; Panigrahi et al., 2003; Zhang et al., 2001;
Transcript of Synthesis, Characterization and Thermoluminescence …paper.uscip.us/jla/jla.2014.1005.pdf ·...

Columbia International Publishing Journal of Luminescence and Applications (2014) Vol. 1 No. 2 pp. 40-60 doi:10.7726/jla.2014.1005
Research Article
______________________________________________________________________________________________________________________________ *Corresponding e-mail: [email protected] 1 Department of Physics, Jnana Bharathi Campus, Bangalore University, Bangalore – 560 056
40
Synthesis, Characterization and Thermoluminescence Studies of LiNaSO4: Eu3+ nanophosphor
Y.S. Vidya1 and B.N. Lakshminarasappa1*
Received 13 December 2013; Published online 2 August 2014 © The author(s) 2014. Published with open access at www.uscip.us
Abstract Na2SO4, LiNaSO4 and LiNaSO4: Eu3+ nanophosphors were successfully synthesized by slow evaporation technique followed by calcination at 400° C. The resultant products were characterized by using powder X- ray diffraction (PXRD), Fourier transform infrared spectroscopy (FTIR), UV – Vis, scanning electron microscope (SEM) and transmission electron microscope (TEM). Doping with Li+ ion stabilized the thenardite phase (Phase V) while, codoping with Eu3+ promoted the phase transformation from stable thenardite to metastable mirabilite (Phase III) crystal structure. The average crystallite size was calculated by using Debye – Scherrer’s formula and Williamson – Hall (W – H) plots. The optical energy band gap (Eg) of Na2SO4, LiNaSO4 and LiNaSO4: Eu3+ were estimated from Wood and Tauc’s relation which varies from 4.2 – 4.33 eV. Thermoluminescence (TL) studies were investigated by using γ – irradiation in the dose range 0.5 – 5 kGy at a heating rate of 5 °C s-1. A well resolved glow peaks at ~ 180 °C, ~ 150 °C and ~115 °C were recorded for Na2SO4, LiNaSO4 and LiNaSO4: Eu3+ nanophosphors respectively. It was observed that isovalent doping of Li+ served as quencher, while codoping of hypervalent Eu3+ acted as activator to enhance the TL intensity of glow peak. In the present study, the extent of TL fading of LiNaSO4: Eu3+ was 31 % compared to LiNaSO4 (52 %) and Na2SO4 (59 %). So, LiNaSO4: Eu3+ phosphor might also have potential use in dosimetry. The kinetic parameters namely activation energy (E), frequency factor (s) and order of kinetics (b) was estimated and the results were discussed. Keywords: Sodium sulphate; Codoping; Thermoluminescence; Fading; Kinetic Parameters
1. Introduction Alkali sulphates were known for a long time as versatile and excellent phosphor materials. These sulphates attracted the attention of many workers in view of their potential applications in radiation dosimetry, TV screens, cathode ray tubes etc. A variety of defect centres were likely to be formed in sulphate based phosphors (Kher et al., 2008; Panigrahi et al., 2003; Zhang et al., 2001;

Y.S. Vidya and B.N. Lakshminarasappa / Journal of Luminescence and Applications (2014) Vol. 1 No. 2 pp. 40-60
41
Gundu Rao et al., 1993; Dhoble et al., 2001; Gedam, 2013). Sulphate based radiation dosimeter materials doped with rare earth (RE) ions extensively investigated due to their high luminescence sensitivity (Magarabi et al. 2008). The significant advancements made in thermoluminescence (TL) and photoluminescence (PL) experiments during the last few decades (Vij et al., 2009; Elder, 1980; Wiedemann, 1981). Sodium sulphate, via simple chemical composition exhibits a variety of phase transformation between its five anhydrous polymorphs (labeled I – V). The phase transformation sequence among the Na2SO4 polymorphs can be described as:
Melt1156K I 510K II 503K III 473K V Na2SO4 forms two naturally occurring minerals mirabilite (Na2SO4:10H2O) and thenardite (Na2SO4). At room temperature (RT), phase V (thenardite) was reported to be stable while phase III was metastable. Phase I and II were high – temperature polymorphs however, phase II was reported to have a narrow stability zone. Phase IV was considered to be metastable and its phase relation and structure have yet to be well established (Braitsh et al., 1962; Gomathy et al., 1999; Kracek et al., 1930; Choi et al., 1998; Navarro et al., 2000). Correcher et al., (2004) observed the spectra of infrared – stimulated luminescence (IRSL), radioluminescence (RL) and TL of thenardite but failed to identify the origin of the luminescence center related to the IRSL, RL and TL spectra of thenardite. Sidike et al. (2009) studied the PL excitation and decay curves of natural, heat – treated and γ- irradiated thenardite from Ai – Diang salt lake and concluded that crystal defects were responsible for observed luminescence. Reliable studies on the PL and TL properties of thenardite were very few to till date, to the best of our knowledge. In order to develop new dosimetric phosphors and to obtain a better understanding of the physical mechanism of radiation effects, Na2SO4 was doped and co-doped with isovalent and hypervalent ions. In the present work, we report the structural and TL properties of Na2SO4, LiNaSO4 and LiNaSO4: Eu3+ nanophosphors prepared by slow evaporation method at RT. The resultant product was well characterized using PXRD, SEM, TEM and FTIR. TL studies were carried out by irradiating with γ – rays in the dose range 0.5 – 4 kGy to explore the possibility of the material as TL dosimeter.
2. Experimental
2.1 Materials Preparation Saturated solution of Na2SO4 was obtained by dissolving 6 g of sodium sulphate (S-d fine) in 20 ml of deionized water. To prepare LiNaSO4, stoichiometrically calculated Li2SO4 (0.5 mol %) procured from S-d fine was weighed and dissolved in 10 ml of double – distilled deionized water and added to Na2SO4 solution. For LiNaSO4: Eu3+, stoichiometrically calculated amount Eu2O3 (Sigma Aldrich) were weighed and dissolved in 10 ml of concentrated H2SO4 and added to LiNaSO4 solution to get Eu / Na mole ratio 0.2, 0.5 and 1.0 mol %. All the above solutions were taken in beakers and allowed to undergo slow evaporation at RT in an open air atmosphere for a period of 10 - 15 days. The phosphors thus obtained in powder form was crushed and calcined at 400o C for 4 h in furnace. After cooling to RT, the samples were grinded to

Y.S. Vidya and B.N. Lakshminarasappa / Journal of Luminescence and Applications (2014) Vol. 1 No. 2 pp. 40-60
42
fine powder and pressed into pellets of 5mm thickness (80 kg cm-2). The pellets were annealed to 110 o C in order to reduce the pressure induced defects. 2.2 Materials characterization The PXRD patterns of the synthesized samples were recorded using Philips PW/1050/70/76 X- ray diffractometer at 30 KV and 20 mA using CuKα radiation using nickel filter at a scan rate of 2 deg
min-1. The size, shape and distribution of the grains were examined by SEM (Quanta – 200 FEI). TEM measurements were carried out using a Philips CM 200 microscope with 2.4 Å resolutions. FT-IR studies of the samples were performed on a Perkin–Elmer FTIR spectrometer (Spectrum 1000) using KBr as reference standard. The UV-Vis absorption spectra were recorded by using UV-Visible Shimadzu double beam spectrophotometer. TL measurements were carried out at RT using homemade TL reader, using γ – irradiation (60Co source) as excitation in the dose range 0.5-4 kGy.
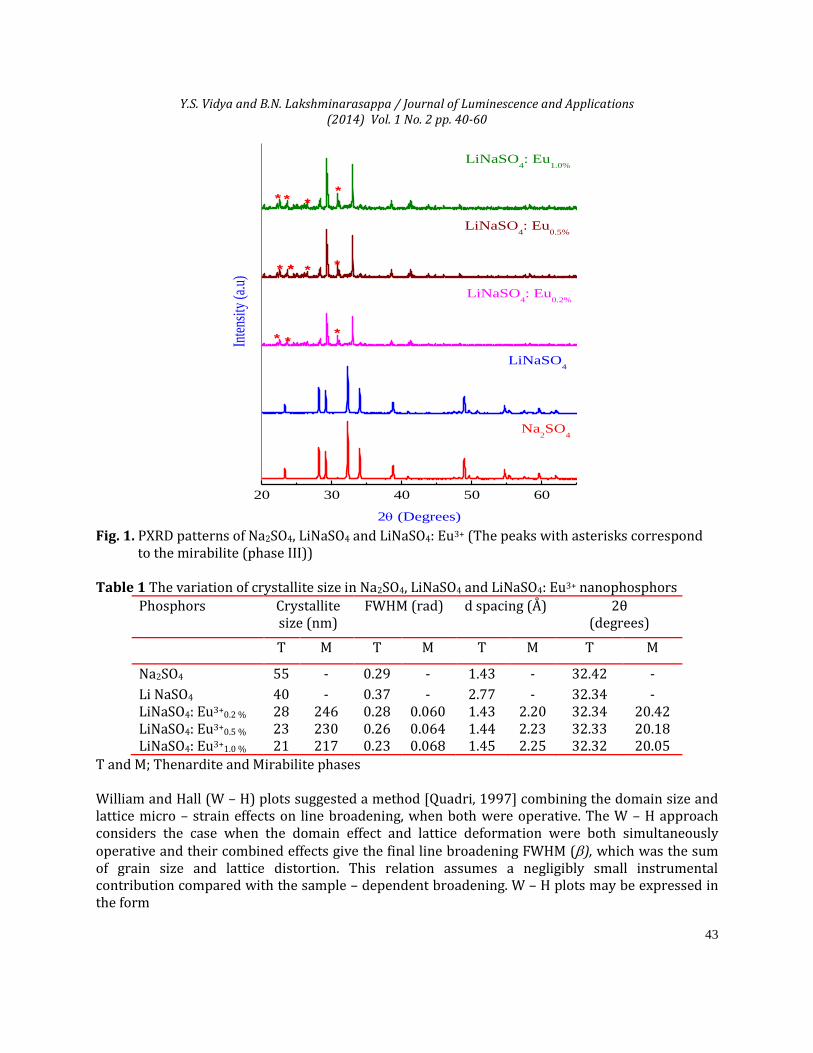
3. Results and Discussion 3.1 Powder X- ray Diffraction Analysis The PXRD patterns of calcined Na2SO4, LiNaSO4 (0.5 %) and LiNaSO4: Eu3+ (0.2, 0.5 and 1 mol %) samples synthesized by slow evaporation method at RT were shown in Fig. 1. The XRD patterns showed sharp and intense peaks. The diffraction patterns were in good agreement with ICDD card 37 – 1465 (Phase V, Thenardite). Further, small peaks related to phase III (mirabilite) of Na2SO4 were detected in LiNaSO4: Eu3+ (Hawthrone et. al., 1975). The phase V to phase III transformation was generally considered as a nucleation growth process during which the phase III nuclei were formed within the phase V. The average crystallite size (D) was calculated from full width at half maxima (FWHM) of the most intense PXRD peak using Eq. 1(Klug, 1953).
θ cos β
λ 0.9 = D (1)
Where ‘D’; the average grain size of the crystallites, ‘λ’ ; the incident wavelength, ‘θ’; the Bragg angle and ‘β’; the FWHM (in radians) caused by the crystallites. The variation of crystallite sizes and FWHM values in thenardite and mirabilite were given in Table 1.
Y.S. Vidya and B.N. Lakshminarasappa / Journal of Luminescence and Applications (2014) Vol. 1 No. 2 pp. 40-60
43
20 30 40 50 60
2 (Degrees)
Na2SO
4
LiNaSO4
***
LiNaSO4: Eu
0.2%
Inte
nsity
(a.u
)
*****
LiNaSO4: Eu
0.5%
****
LiNaSO4: Eu
1.0%
Fig. 1. PXRD patterns of Na2SO4, LiNaSO4 and LiNaSO4: Eu3+ (The peaks with asterisks correspond
to the mirabilite (phase III)) Table 1 The variation of crystallite size in Na2SO4, LiNaSO4 and LiNaSO4: Eu3+ nanophosphors
Phosphors Crystallite size (nm)
FWHM (rad) d spacing (Å) 2θ (degrees)
T M T M T M T M
Na2SO4 55 - 0.29 - 1.43 - 32.42 -
Li NaSO4 40 - 0.37 - 2.77 - 32.34 - LiNaSO4: Eu3+
0.2 % 28 246 0.28 0.060 1.43 2.20 32.34 20.42 LiNaSO4: Eu3+0.5 % 23 230 0.26 0.064 1.44 2.23 32.33 20.18 LiNaSO4: Eu3+1.0 % 21 217 0.23 0.068 1.45 2.25 32.32 20.05
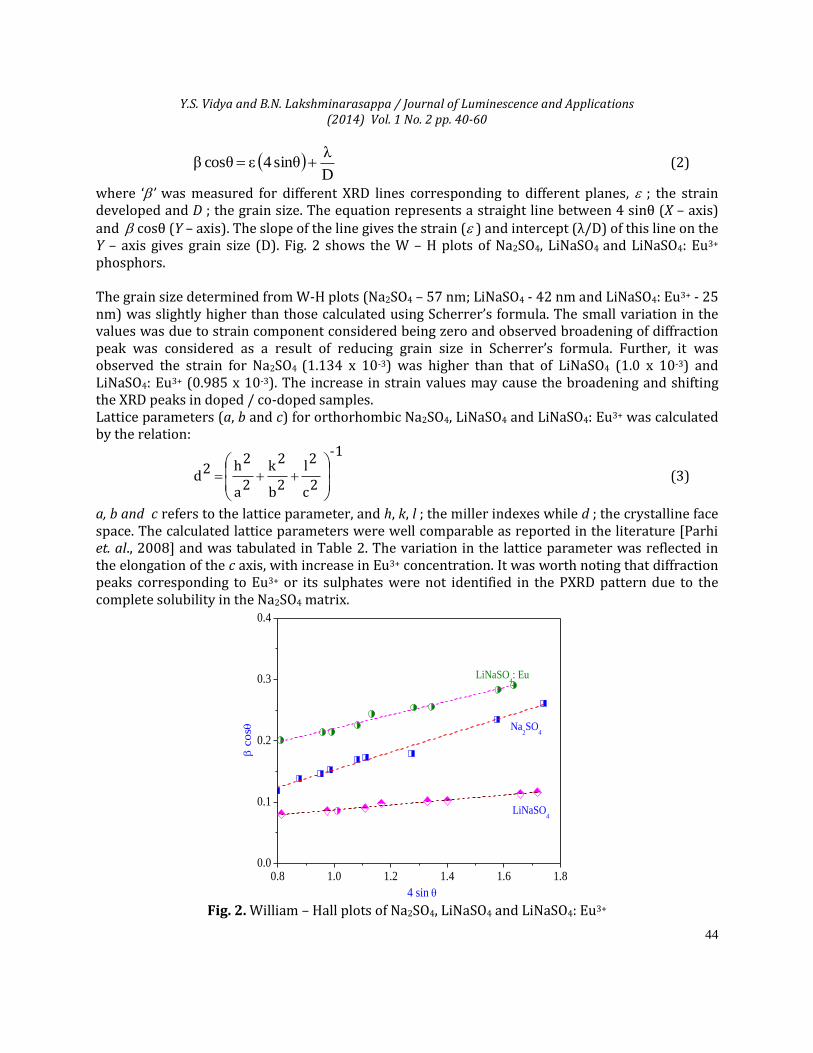
T and M; Thenardite and Mirabilite phases William and Hall (W – H) plots suggested a method [Quadri, 1997] combining the domain size and lattice micro – strain effects on line broadening, when both were operative. The W – H approach considers the case when the domain effect and lattice deformation were both simultaneously operative and their combined effects give the final line broadening FWHM (), which was the sum of grain size and lattice distortion. This relation assumes a negligibly small instrumental contribution compared with the sample – dependent broadening. W – H plots may be expressed in the form
Y.S. Vidya and B.N. Lakshminarasappa / Journal of Luminescence and Applications (2014) Vol. 1 No. 2 pp. 40-60
44
D
λ sinθ 4 ε cosθ β (2)
where ‘’ was measured for different XRD lines corresponding to different planes, ; the strain developed and D ; the grain size. The equation represents a straight line between 4 sinθ (X – axis) and cosθ (Y – axis). The slope of the line gives the strain ( ) and intercept (λ/D) of this line on the Y – axis gives grain size (D). Fig. 2 shows the W – H plots of Na2SO4, LiNaSO4 and LiNaSO4: Eu3+ phosphors. The grain size determined from W-H plots (Na2SO4 – 57 nm; LiNaSO4 - 42 nm and LiNaSO4: Eu3+ - 25 nm) was slightly higher than those calculated using Scherrer’s formula. The small variation in the values was due to strain component considered being zero and observed broadening of diffraction peak was considered as a result of reducing grain size in Scherrer’s formula. Further, it was observed the strain for Na2SO4 (1.134 x 10⁻³) was higher than that of LiNaSO4 (1.0 x 10⁻³) and LiNaSO4: Eu3+ (0.985 x 10⁻³). The increase in strain values may cause the broadening and shifting the XRD peaks in doped / co-doped samples. Lattice parameters (a, b and c) for orthorhombic Na2SO4, LiNaSO4 and LiNaSO4: Eu3+ was calculated by the relation:
-1
2c
2l
2b
2k
2a
2h 2d
(3)
a, b and c refers to the lattice parameter, and h, k, l ; the miller indexes while d ; the crystalline face space. The calculated lattice parameters were well comparable as reported in the literature [Parhi et. al., 2008] and was tabulated in Table 2. The variation in the lattice parameter was reflected in the elongation of the c axis, with increase in Eu3+ concentration. It was worth noting that diffraction peaks corresponding to Eu3+ or its sulphates were not identified in the PXRD pattern due to the complete solubility in the Na2SO4 matrix.
0.0
0.1
0.2
0.3
0.4
0.8 1.0 1.2 1.4 1.6 1.8
c
os
4 sin
LiNaSO4
Na2SO
4
LiNaSO4: Eu
Fig. 2. William – Hall plots of Na2SO4, LiNaSO4 and LiNaSO4: Eu3+

Y.S. Vidya and B.N. Lakshminarasappa / Journal of Luminescence and Applications (2014) Vol. 1 No. 2 pp. 40-60
45
Table 2 The lattice parameters of Na2SO4, LiNaSO4 and LiNaSO4: Eu3+ nanophosphors
Samples a (Å) b (Å) c (Å) V (Å)3
T M T M T M T M
Na2SO4 5.80 - 12.20 - 7.60 - 538 - LiNaSO4 5.86 - 12.32 - 7.66 - 553 - LiNaSO4: Eu3+0.2 % 5.81 6.82 12.24 8.25 2.86 4.420 204 248 LiNaSO4: Eu3+
0.5 % 5.80 6.78 12.30 8.30 2.88 4.465 206 251 LiNaSO4: Eu3+1.0 % 5.86 6.85 12.32 8.32 2.90 4.523 209 257
T and M; thenardite and mirabilite phases 3.2 Transmission Electron Microscopy (TEM) Studies The shape and size of the samples were determined by TEM. The TEM photograph of Na2SO4, LiNaSO4 and LiNaSO4: Eu3+ shows the crystals were of hexagonal shaped particles with negligible amorphous constituents and agglomerated particles (Figs. 3, 4 and 5). The grain sizes of Na2SO4, LiNaSO4 and LiNaSO4: Eu3+ was distributed in the range 40-50 nm, 20-30 nm and 10-20 nm respectively.
a
b
Fig 3. (a) TEM image and (b) SAED pattern of Na2SO4

Y.S. Vidya and B.N. Lakshminarasappa / Journal of Luminescence and Applications (2014) Vol. 1 No. 2 pp. 40-60
46
b
200 nm
a
Fig 4. (a) TEM image and (b) SAED pattern of LiNaSO4
(311)
(151)
(-312)
21/ nm
b
2μm
a
Fig 5. (a) TEM image and (b) SAED pattern of LiNaSO4: Eu3+
The Selected Area Electron Diffraction (SAED) revealed, the samples were neither regular diffraction spots nor whole diffraction rings, indicating the number of polycrystalline grains in the selected area was finite. The d- values and corresponding (hkl) planes were given in Table 3.
Table 3 The interpalnar distance (d- value) and corresponding (hkl) planes of Na2SO4, LiNaSO4 and LiNaSO4: Eu3+ nanophosphors.
Phosphors d – values (Å) (hkl) planes Phase
Na2SO4 3.636 3.181 3.072
(200) (131) (040)
V V V

Y.S. Vidya and B.N. Lakshminarasappa / Journal of Luminescence and Applications (2014) Vol. 1 No. 2 pp. 40-60
47
2.781 (311) V LiNaSO4 3.636
3.771 2.015
(200) (220) (151)
V V V
LiNaSO4: Eu3+ 2.781 2.154 3.441
(311) (151) (-312)
V V III
3. 3 Scanning Electron Microscopy Studies
a
b
c
Fig. 6. SEM images of (a) Na2SO4, (b) LiNaSO4 and (c) LiNaSO4: Eu3+ at RT. The surface morphological features of the Na2SO4, LiNaSO4 and LiNaSO4: Eu3+
samples showed the uniform distribution of generalized habit of grains corresponds to twinned orthorhombic prisms

Y.S. Vidya and B.N. Lakshminarasappa / Journal of Luminescence and Applications (2014) Vol. 1 No. 2 pp. 40-60
48
and pyramids without any agglomeration (Fig. 6). LiNaSO4 and LiNaSO4: Eu3+ was slightly agglomerated compared to Na2SO4 sample. The agglomeration generally occurs within short period of time. During the synthesis of LiNaSO4 and LiNaSO4: Eu3+, water was used as solvent. Within the solution, capillary bonds were created between the particles. These bonds persist if the adhesion forces were higher than the separating forces resulting from the stress. The aggregate continuous to grow and form irregular particle clusters and reduces the homogeneity of the sample. The average grain sizes on the surface were found to be in the range 50-60 nm; 60-70 nm; and 40-50 nm for Na2SO4, LiNaSO4 and LiNaSO4: Eu3+ respectively.
3.4 Fourier Transform Infrared Spectroscopy Studies
4000 3500 3000 2500 2000 1500 1000 500
LiNaSO4: Eu
3+
LiNaSO4
Wavenumbers (cm-1)
Na2SO
4Inte
nsi
ty (
a.u
)
Fig. 7. FTIR spectra of (a) Na2SO4; (b) LiNaSO4 and (c) LiNaSO4: Eu3+ at RT
Table 4 FTIR wave numbers corresponding to Na2SO4, LiNaSO4 and LiNaSO4: Eu3+ samples
Samples Wave numbers and corresponding band assignments (cm-1)
M-O S-O
Na2SO4 2864 2924 3441
614 1129
LiNaSO4 2843 2921 3465
622 1122
LiNaSO4: Eu3+ 2857 2929 3433
620 1124

Y.S. Vidya and B.N. Lakshminarasappa / Journal of Luminescence and Applications (2014) Vol. 1 No. 2 pp. 40-60
49
Fig. 7 shows the FTIR spectra of pure Na2SO4, LiNaSO4 and LiNaSO4: Eu3+ samples in the range of
500–4000 cm-1. The spectra clearly distinguish the ranges corresponding to the vibrations of the SO4
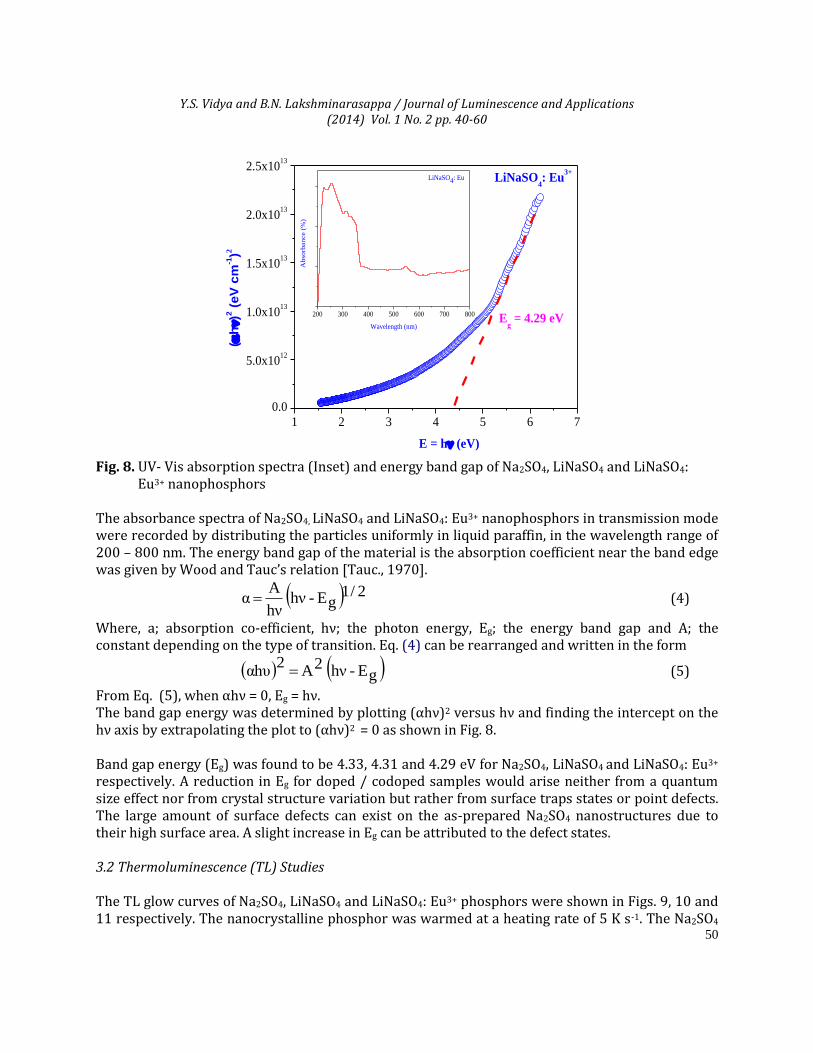
2- group and the Na-O vibrations. The most intense, stretching and bending of S-O bond were situated at 1100 and 600 cm-1. The frequencies of all the observed absorption bands were tabulated in Table 4 (Periaswamy et. al., 2009). The substitution of RE3+ in –Na-O-Na framework of Na2SO4 leads to the formation of –RE-O-Na- bond. Compared to Na, RE ions were less electropositive and hence the bond strength of –RE-O-Na- will be lower compared with –Na-O-Na. 3.5 UV- Vis absorption and optical band gap energy Inset of Fig. 8 shows the UV – Vis absorption spectra of Na2SO4, LiNaSO4 and LiNaSO4: Eu3+ phosphors. The optical absorption spectrum shows prominent peaks in between 250 – 300 nm and 300 – 350 nm regions. The maximum absorption peaks arise due to a transition from valence band to conduction band (Pan et al., 2004). The weak absorption in the UV-Vis region was expected to arise from transitions involving extrinsic states such as surface traps or defect states or impurities (Cao et. al., 2004). The smaller sized particles were found to have high surface to volume ratio. This results in increase of defects distribution on the surface of nanomaterials. Thus, if the particle size was small; nanomaterials exhibit strong absorption bands (Emeline et. al., 1998). In LiNaSO4 and LiNaSO4: Eu3+ the particles sizes in nanometers which results in high surface to volume ratio; as a result, there was an increase in defects distribution on the surface of the nanomaterials.
1 2 3 4 5 6 7
0.0
5.0x10¹²
1.0x10¹³
1.5x10¹³
2.0x10¹³
2.5x10¹³
LiNaSO4
Eg = 4.31 eV
E = h (eV)
(h)2
(eV
cm
-1)2
200 300 400 500 600 700 800
Ab
sorb
an
ce (
%)
Wavelength (nm)
LiNaSO4
1 2 3 4 5 6 7
0.0
5.0x10¹²
1.0x10¹³
1.5x10¹³
2.0x10¹³
2.5x10¹³
(h)2
(eV
cm
-1)2
E = h (eV)
Eg = 4.33 eV
Na2SO
4
200 300 400 500 600 700 800
Ab
so
rban
ce (
%)
Wavelength (nm)
Na2SO
4
Y.S. Vidya and B.N. Lakshminarasappa / Journal of Luminescence and Applications (2014) Vol. 1 No. 2 pp. 40-60
50
1 2 3 4 5 6 7
0.0
5.0x10¹²
1.0x10¹³
1.5x10¹³
2.0x10¹³
2.5x10¹³
(h)2
(e
V c
m-1)2
E = h (eV)
LiNaSO4: Eu
3+
Eg = 4.29 eV
200 300 400 500 600 700 800
Abso
rbance (
%)
Wavelength (nm)
LiNaSO4: Eu
Fig. 8. UV- Vis absorption spectra (Inset) and energy band gap of Na2SO4, LiNaSO4 and LiNaSO4:
Eu3+ nanophosphors The absorbance spectra of Na2SO4, LiNaSO4 and LiNaSO4: Eu3+ nanophosphors in transmission mode were recorded by distributing the particles uniformly in liquid paraffin, in the wavelength range of 200 – 800 nm. The energy band gap of the material is the absorption coefficient near the band edge was given by Wood and Tauc’s relation [Tauc., 1970].
2/1gE - hν
hν
A α (4)
Where, a; absorption co-efficient, hν; the photon energy, Eg; the energy band gap and A; the constant depending on the type of transition. Eq. (4) can be rearranged and written in the form
gE - hν 2A 2
αhυ (5)
From Eq. (5), when αhν = 0, Eg = hν. The band gap energy was determined by plotting (αhν)2 versus hν and finding the intercept on the hν axis by extrapolating the plot to (αhν)2 = 0 as shown in Fig. 8. Band gap energy (Eg) was found to be 4.33, 4.31 and 4.29 eV for Na2SO4, LiNaSO4 and LiNaSO4: Eu3+
respectively. A reduction in Eg for doped / codoped samples would arise neither from a quantum size effect nor from crystal structure variation but rather from surface traps states or point defects. The large amount of surface defects can exist on the as-prepared Na2SO4 nanostructures due to their high surface area. A slight increase in Eg can be attributed to the defect states.
3.2 Thermoluminescence (TL) Studies The TL glow curves of Na2SO4, LiNaSO4 and LiNaSO4: Eu3+ phosphors were shown in Figs. 9, 10 and 11 respectively. The nanocrystalline phosphor was warmed at a heating rate of 5 K s-1. The Na2SO4

Y.S. Vidya and B.N. Lakshminarasappa / Journal of Luminescence and Applications (2014) Vol. 1 No. 2 pp. 40-60
51
phosphor has prominent peak at ~180 o C along with a shoulder peak at 100 ° C (Fig. 9A). Fig. 9B shows the deconvoluted TL glow peaks of Na2SO4 irradiated at 2 kGy.
50 100 150 200 250 300
0
20
40
60
80
100A -- 0.5 kGy
B -- 1.0 kGy
C -- 2.0 kGy
D -- 3.0 kGy
E -- 4.0 kGy
F -- 5.0 kGy
FE
DC
BA
Temperature (oC)
TL
Inte
nsi
ty (
a.u
)
Na2SO
4
a
b
50 100 150 200 250 300
2
Temperature (o C)
Experimental curve
Peak 1
Peak 2
Fitted curve
Na2SO
4
TL
Inte
nsi
ty (
a.u)
1
Fig. 9. (A) TL glow curves of γ – ray irradiated Na2SO4 nanoparticles (gamma dose = 0.5 - 5 kGy); (B)
Deconvoluted peak of Na2SO4 γ – ray irradiated for 2 kGy.
50 100 150 200 250 300
2
Temperature (o C)
Experimental curve
Peak 1
Peak 2
Deconvoluted Curve
LiNaSO4
TL
In
ten
sity
(a.u
)
1
b
50 100 150 200 250
40
45
50
55
60
65
FE
DC
B
Temperature (o C)
TL
Inte
nsit
y (
a.u
)
A -- 0.5 kGy
B -- 1.0 kGy
C -- 2.0 kGy
D -- 3.0 kGy
E -- 4.0 kGy
F -- 5.0 kGy
A
a
Fig. 10. (A) TL glow curves of γ – ray irradiated LiNaSO4 nanoparticles (gamma dose = 0.5 - 5 kGy);
(B) Deconvoluted peaks of LiNaSO4 irradiated for 2 kGy γ – ray dose.

Y.S. Vidya and B.N. Lakshminarasappa / Journal of Luminescence and Applications (2014) Vol. 1 No. 2 pp. 40-60
52
50 100 150 200 250 300
Peak 2
2
TL
Inte
nsi
ty (
a.u
)
Temperature ( C)
1
o --- Experimental Curve
Fitted Curve
Peak 1
b
50 100 150 200 250
0
200
400
600
F
CD
E
A
Temperature (o C)
TL
Inte
nsit
y (
a.u
)
B
A -- 0.5 kGy
B -- 1.0 kGy
C -- 2.0 kGy
D -- 3.0 kGy
E -- 4.0 kGy
F -- 5.0 kGya
Fig. 11. (A) TL glow curves of γ – ray irradiated LiNaSO4: Eu3+ nanoparticles (gamma dose = 0.5 - 5
kGy); (B) Deconvoluted peaks LiNaSO4: Eu3+ irradiated for 2 kGy γ – ray dose.
The LiNaSO4 phosphor has a single well resolved glow peak at ~ 170 ° C with a small shoulder at ~ 130 ° C (Fig. 10A). Fig. 10B shows the deconvoluted TL glow peaks of LiNaSO4 irradiated for 2 kGy. The presence of Lithium ion slightly shifts the glow peak positions towards higher temperature. This process inhibits the radiative recombination of electron and hole centres causing a reduction in TL intensity. The TL glow curve recorded for LiNaSO4: Eu 0.5 % consists of a prominent peak showing the signature ~ 130 ° C and a small shoulder at ~110 ° C. No significant changes in the position of the peak temperatures were observed and they were within the experimental error of ± 3 K for all the γ – ray doses.
The variation of TL glow peak intensity with accumulated dose was studied and shown in Fig. 12. It was observed that, the TL intensity increases with increasing dose. This linear behavior of the sample is useful for dosimetric applications. The appearance of two peaks in the glow curve indicates that there are possibly two kinds of trapping sites generated due to γ – irradiation. The shallow trapping center leads to the resolved peak at lower temperature and the other deeper center gives rise to shouldered peak at higher temperature. The increase in TL intensity with dose might be due to high surface to volume ratio, which results in a higher surface barrier energy for the nanoparticles. On increasing the dose, the energy density crosses the barrier and a large number of defects were produced in the nanoparticles which ultimately keep on increasing with the dose till saturation was achieved (Salah et. al., 2011).

Y.S. Vidya and B.N. Lakshminarasappa / Journal of Luminescence and Applications (2014) Vol. 1 No. 2 pp. 40-60
53
0.5 1.0 1.5 2.0 2.5 3.0 3.5 4.0 4.5
LiNaSO4: Eu
Na2SO4
Gamma Dose (kGy)
LiNaSO4
TL
In
ten
sity
(a.
u)
Fig. 12. Variation of TL intensity with γ – rayed Na2SO4, LiNaSO4 and LiNaSO4: Eu3+ nanophosphor.
In radiation dosimetry, efficiency and linearity with dose was highly useful. Therefore selection of the dopant / synthesis, possibly enhance the TL properties which was further deciding the usage of the material in different fields of dosimetry. In the present investigation, variations in TL glow peak temperature were observed. This might be attributed to type of irradiation, type of the sample used, amount of irradiation, charge state of the dopant, warming rate etc. Also, TL glow curve under a specific radiation type was characteristic of the exposed material. The traps and the glow curve structure were also dependent upon the morphology and particle size. It is important to notice that using the right dopant concentration, it is possible to maximize the TL efficiency and improve sensitivity and dose linearity for a specific irradiation type (Furetta, 2003; Chen et. al., 1997).
The increase / saturation in TL sensitivity with dose may be explained on the basis of track interaction model (TIM) (Lochab et. al., 2006; Horowitz et. al., 1996; Horowitz et. al., 2001, Premkumar et, al., 2012). This model suggests that the number of created traps as a result of irradiation depends on both the cross section of the tracks and the length of the track may be a few tens of nanometers; as a result the number of trap centers / luminescence centers will be less for lower doses than their microcrystalline form. However, if we increase the dose, more overlapped tracks occur that may not give extra TL, as a result of which saturation occurs. But in the case of nanomaterials there still exists some particles that would have been missed while being targeted by irradiation, due to their very tiny size. Thus on increasing the dose these nanoparticles which had earlier been left out from the radiation interaction, now generate trapping and luminescence centers. Thus we do not get saturation in nanomaterials even at higher doses. However, further higher doses result in saturation or even decrease in TL intensity due to the same reason of overlapping of tracks.

Y.S. Vidya and B.N. Lakshminarasappa / Journal of Luminescence and Applications (2014) Vol. 1 No. 2 pp. 40-60
54
High luminescence yield is a pre-requisite for any good TL phosphor. For this purpose an optimum incorporation of the luminescence centers into the host, local environment around the dopant and doping concentration plays an important role. Fig. 13 shows the concentration quenching curve between concentration of Li+ / Eu3+ ions and TL intensity of the samples. TL intensity was found to be maximum for 0.5 mol % of Li+ in Na2SO4 and 0.2 mol% of Eu3+ in LiNaSO4 and decreases on either side of this value. This may be assigned to the change in trap distribution due to lattice perturbation caused by the incorporation of more activator ions in the host lattice Na2SO4. A luminescence centre was surrounded by non-luminescent centres, so released charge carriers may not recombine directly with the luminescent centres and thus energy may be transferred non-radiatively. In other words, at higher activator concentration, free charge carriers may opt to relax non-radiatively to their ground states. Therefore, lithium (0.5 mol%) and Europium (0.5 mol%) has been found to be an optimized quantity for the maximum TL intensity. This may be assigned to the change in trap distribution due to lattice perturbation caused by the incorporation of more activator (Li+ / Eu3+) ions in the host lattice Na2SO4.
0.0 0.5 1.0 1.5
TL
In
ten
sity
(a.u
)
LiNaSO4: Eu
3+
Dopant Concentration (mol %)
Na2SO
4: Li
+
Fig. 13. Concentration quenching of TL in - irradiated Na2SO4: Li+ and LiNaSO4: Eu3+ (γ – ray dose
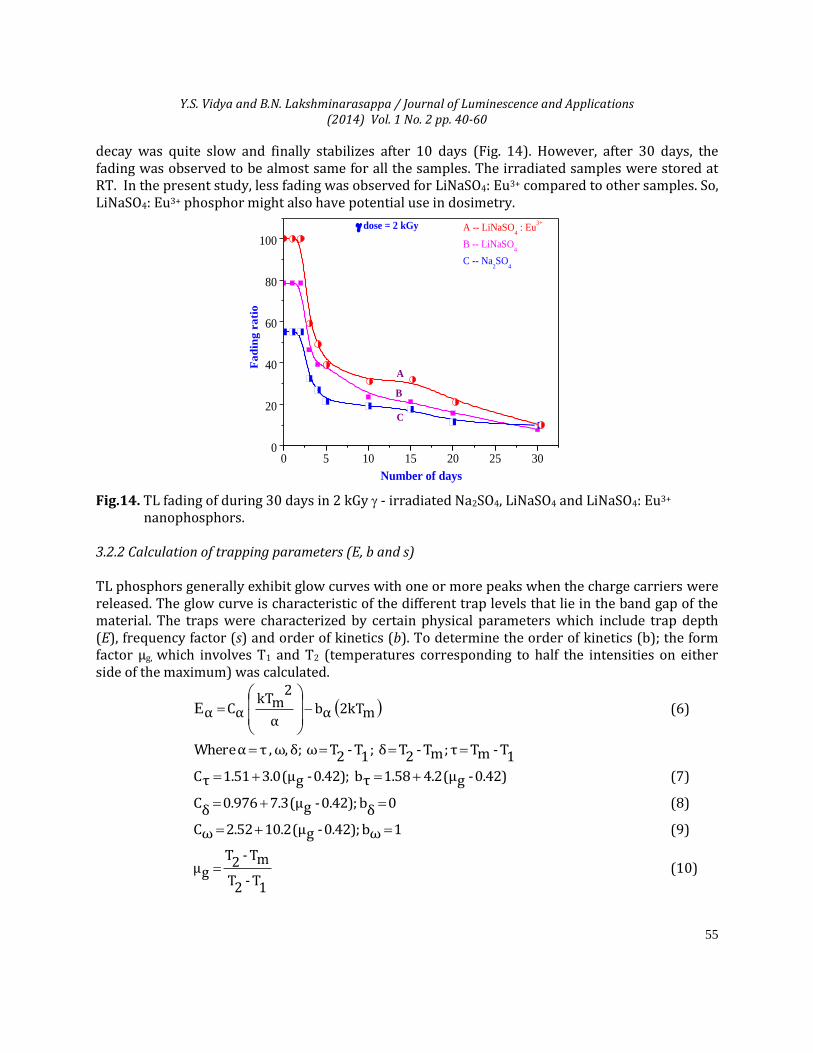
2 kGy) 3.2.1 Fading Fading is the unintentional loss of the TL signal. It leads to an under estimation of the absorbed dose. Fading may be due to several causes. Thermal fading originates from the fact that even at RT there is a certain probability of charge carriers escaping from their trapping centres. Fading may also be caused by optical stimulation. In general, high sensitivity materials should be handled carefully and stored in opaque containers to prevent fading from light exposure. Other types of fading which were not temperature dependent are caused by quantum mechanical tunneling of the trapped charge to recombination sites and transitions between localized states, i.e. transitions that do not take place via the delocalized bands (Jose et. al., 2011) To study the fading effect, the Na2SO4, LiNaSO4 and LiNaSO4: Eu3+ phosphors was given a test dose of 2 kGy from a γ - source, the TL signal was recorded at different intervals for nearly 30 days. Fig. 14 shows the plot of Fading ratio versus the number of days after γ – ray exposure. Strong fading was observed initially after 5 days and the
Y.S. Vidya and B.N. Lakshminarasappa / Journal of Luminescence and Applications (2014) Vol. 1 No. 2 pp. 40-60
55
decay was quite slow and finally stabilizes after 10 days (Fig. 14). However, after 30 days, the fading was observed to be almost same for all the samples. The irradiated samples were stored at RT. In the present study, less fading was observed for LiNaSO4: Eu3+ compared to other samples. So, LiNaSO4: Eu3+ phosphor might also have potential use in dosimetry.
0 5 10 15 20 25 300
20
40
60
80
100
C
B
Number of days
A
A -- LiNaSO4 : Eu
3+
B -- LiNaSO4
C -- Na2SO
4
dose = 2 kGy
Fa
din
g r
ati
o
Fig.14. TL fading of during 30 days in 2 kGy - irradiated Na2SO4, LiNaSO4 and LiNaSO4: Eu3+
nanophosphors.
3.2.2 Calculation of trapping parameters (E, b and s) TL phosphors generally exhibit glow curves with one or more peaks when the charge carriers were released. The glow curve is characteristic of the different trap levels that lie in the band gap of the material. The traps were characterized by certain physical parameters which include trap depth (E), frequency factor (s) and order of kinetics (b). To determine the order of kinetics (b); the form factor μg, which involves T1 and T2 (temperatures corresponding to half the intensities on either side of the maximum) was calculated.
m2kT αb α
2mkT
αC α
E (6)
1T - mT τ;mT - 2T δ ;1T - 2T ω δ; ω, , τα Where
0.42) - g(μ 4.2 1.58 τb 0.42); - g(μ 3.0 1.51 τC (7)
0 δb 0.42); - g(μ 7.3 0.976 δC (8)
1 ωb 0.42); - g(μ 10.2 2.52 ωC (9)
1T - 2T
mT - 2T gμ (10)

Y.S. Vidya and B.N. Lakshminarasappa / Journal of Luminescence and Applications (2014) Vol. 1 No. 2 pp. 40-60
56
Em2kT
1 - b 1
mkTE exp
2kTm
βE s (11)
1KeV 5-10 x 8.6 constant Boltzmann the isk where
50 100 150 200 250 300
16
12
8
4
-----
----
Tm2
Tm1
TL
In
ten
sity
(a.
u)
Temperature ( C)
0
Fig. 15. Typical representative diagram showing different quantities used in TL glow – curve shape
method in 2 kGy - irradiated LiNaSO4 to estimate TL parameters. Theoretically the form factor, which ranges between 0.42 and 0.52, was close to 0.42 for first order kinetics and 0.52 for second order kinetics; for other values it is considered to be general order. Form factor, μg is found to be independent of the activation energy (E) and strongly depends on the order of kinetics. The peak was generated theoretically using these parameters and separated from the main experimental glow curve. Trap depth (E) was calculated using the same set of equations. The procedure was repeated till all the peaks were deconvoluted and the theoretically convoluted curve overlapped the experimentally observed glow curve. The positions of the respective peaks, trapping parameters and order of kinetics for γ - doses and for Na2SO4, LiNaSO4 and LiNaSO4: Eu3+ was shown in Table 5. The theoretically fitted glow curve is shown in Fig. 15. After estimation of E, the frequency factor‘s’ can be obtained using the relation (7). The quality of fit has been tested with the figure of merit (FOM) and was found to be in the range of 0.031 - 0.029 for the theoretical curves were in good agreement and overlap considerably.

Y.S. Vidya and B.N. Lakshminarasappa / Journal of Luminescence and Applications (2014) Vol. 1 No. 2 pp. 40-60
57
Table 5 Kinetic parameters of Na2SO4, LiNaSO4 and LiNaSO4: Eu3+ nanophosphors.
Phosphors γ – dose
Peaks Order of kinetics
(μg)
Activation energy (eV) Frequency factor (s-1)
Eτ Eδ Eω Eaverage
0.5
1 2
2 (0.51) 2 (0.50)
0.743 1.171
0.765 1.232
0.781 1.168
0.763 1.190
1.2E+09 2.5E+13
1.0 1 2
2 (0.49) 2 (0.50)
0.813 1.156
0.823 1.252
0.815 1.172
0.817 1.193
1.3E+09 2.7E+13
Na2SO4 2.0 1 2
2 (0.51) 2 (0.52)
0.826 1.231
0.844 1.261
0.839 1.245
0.836 1.245
1.6E+09 2.9E+14
3.0 1 2
2 (0.49) 2 (0.50)
0.830 1.242
0.848 1.274
0.842 1.247
0.840 1.254
1.8E+09 3.1E+14
4.0 1 2
2 (0.49) 2 (0.50)
0.832 1.255
0.851 1.276
0.844 1.251
0.842 1.261
2.0E+09 2.9E+14
5.0 1 2
2 (0.51) 2 (0.49)
0.836 1.258
0.854 1.278
0.848 1.255
0.846 1.263
2.2E+09 2.8E+14
0.5 1 2
2 (0.50) 2 (0.51)
0.652 1.072
0.662 1.082
0.656 1.061
0.656 1.071
1.1E+9 3.1E+12
1.0 1 2
2 (0.49) 2 (0.50)
0.661 1.074
0.668 1.086
0.658 1.071
0.662 1.077
1.12E+10 3.5E+12
LiNaSO4 2.0 1 2
2 (0.51) 2 (0.51)
0.643 1.041
0.651 1.052
0.648 1.038
0.647 1.043
1.6E+10 3.23E+12
3.0 1 2
2 (0.52) 2 (0.49)
0.671 1.061
0.683 1.056
0.632 1.068
0.662 1.062
1.7E+10 3.4E+12
4.0 1 2
2 (0.51) 2 (0.52)
0.682 1.081
0.654 1.087
0.686 1.079
0.674 1.082
1.75E+10 3.5E+12
5.0 1 2
2 (0.49) 2 (0.52)
0.662 1.091
0.672 1.121
0.683 1.095
0.672 1.102
1.8E+10 3.55E+12
0.5 1 2
2 (0.51) 2 (0.49)
0.921 2.121
0.931 2.128
0.938 2.122
0.931 2.123
3.2E+13 5.1E+14
1.0 1 2
2 (0.51) 2 (0.52)
1.123 2.245
1.146 2.252
1.131 2.238
1.132 2.245
3.3E+13 5.3E+14
LiNaSO4: Eu3+ 2.0 1 2
2 (0.49) 2 (0.51)
1.432 2.321
1.421 2.316
1.411 2.291
1.421 2.309
3.42E+13 5.5E+14
3.0 1 2
2 (0.49) 2 (0.51)
0.983 2.162
0.986 2.181
0.991 2.192
0.987 2.178
3.5E+13 4.8E+14
4.0 1 2
2 (0.52) 2 (0.51)
0.956 2.119
0.917 2.098
0.923 2.115
0.932 2.111
3.1E+13 5.05E+14
5.0 1 2
2 (0.52) 2 (0.49)
0.830 2.049
0.856 2.056
0.813 2.042
0.833 2.049
3.7E+13 5.6E+14
Y.S. Vidya and B.N. Lakshminarasappa / Journal of Luminescence and Applications (2014) Vol. 1 No. 2 pp. 40-60
58
4. Conclusions Na2SO4, LiNaSO4 and LiNaSO4: Eu
3+ nanophosphors were synthesized economically by slow
evaporation technique at RT. The final products were well characterized by various spectroscopic
techniques such as PXRD, SEM, TEM, FTIR and UV-Vis. The size of the nanoparticles was estimated
from the Scherrer’s formula and Williamson – Hall method which was in good agreement with TEM
results. TIM model was used to explain the linear behavior with γ- dose. Finally, it can be concluded that
a easy method of preparation, good sensitivity, simple glow curve structure, linear response over a wide
range of γ exposure, low fading of LiNaSO4: Eu3+
compared to Na2SO4 and LiNaSO4 were the
characteristics of the prepared nanophosphors presented here making it useful for its dosimetric
applications.
Acknowledgements
One of the authors, Y. S. Vidya is thankful to “ISRO-ISEC, advanced devices and radiation cell, Bangalore” for providing γ-irradiation facility. The author also wishes to thank Dr. S. C. Prashantha, H. O. D, Department of Physics, EWIT, Bangalore and Department of Physics, Lal Bahadur Shastri Government First Grade College, R. T. Nagar, Bangalore for their support.
References
Braitsh, O., Entstehung, Salzlagerstallen, K. S. D., 1962. Springer–Verlag, Heidelberg, New York. http://dx.doi.org/10.1007/978-3-642-49196-2
Cao, H. Q., Qiu, X. Q., Luo, B., Liang, Y., Zhang, Y. H., Tan, Zhao, M. J., Zhu, Q. M., 2004. Synthesis and Room – Temperature Ultraviolet Photoluminescence Properties of Zirconia Nanowires. Adv. Funct. Mater. 14, 243-246. http://dx.doi.org/10.1002/adfm.200305033
Chen, R., Kirish, Y., 1981. Analysis of Thermally Stimulated Processes, Pergamon, NewYork.
Chen, R., Mckeever, S. W. S., 1997. Theory of Thermoluminescence and Related Phenomenon, World Scientific Press, Singapore. http://dx.doi.org/10.1142/2781
Choi, B. K., Lee, H. K., Kee, Y. W., 1998. Ionic conduction and structural phase transition of Na2SO4 - Doped with various Impurities. Solid State Ionics. Solid State Ionics 113 – 115, 493-499.
Correcher, V., Guinea, J. G., Arce, P. J., Ros, J. M. G., 2004. Luminescence emission spectra in the temperature range of the structural phase transitions of Na2SO4. Spectrochim. Acta A 60, 1431-1438. http://dx.doi.org/10.1016/j.saa.2003.08.008
Dhoble, S. J., Moharil, S. V., Gundu Rao, T. K., 2001. Correlated ESR, PL and TL studies onK3Na(SO4)2: Eu thermoluminescence dosimetry phosphor. J. Lumin. 93, 43-49. http://dx.doi.org/10.1016/S0022-2313(01)00176-4
Elder, J. P., 1980. Thermal Energy Storage Materials – A DSC Study. Thermochim. Acta 36, 67-77. http://dx.doi.org/10.1016/0040-6031(80)80110-9
Emeline, A., Kataeva, G. V., Litke, A. S., Rudakova, A. V., Ryabchuk, V. K., Serpone, N., 1998, Spectroscopic and Photoluminescence Studies of a Wide Band Gap Insulating Material: Powdered and Colloidal ZrO2 Sols. Langmuir. 14, 5011-5022. http://dx.doi.org/10.1021/la980083l

Y.S. Vidya and B.N. Lakshminarasappa / Journal of Luminescence and Applications (2014) Vol. 1 No. 2 pp. 40-60
59
Furetta, C., Handbook of Thermoluminescence, World Scientific, Singapore, 2003.
Gedam, S. C., 2013. Thermoluminescence study of CeSO4Cl: Dy phosphor. Research Journal ofEngineering Sciences, 2, 28-31.
Gomathy, S., Gopalan, P., Kulakarni, A. R., 1999. Effect of aliovalent doping on the electrical conductivity of the Li2SO4-Na2SO4. J. Solid State Chem. 146, 6-12. http://dx.doi.org/10.1006/jssc.1999.8258
Gundu Rao, T. K., Bhatt, B. C., Shrivastava, J. K., Nambi, K. S. V., 1993. Defect centres andthermoluminescence in CaSO4: Dy. J. Phys.: Condens. Matter 5, 1791-1800.
Hawthrone, F. C., Ferguson, R. B., 1975. The crystal structure data of anhydrous sodium sulphate. The Canandian Mineralogist 13, 181-187.
Horowitz, Y. S., Avila, O., Rodrigues, M., 2001. Nucl. Instrum. Methods B. 184, 85-112. http://dx.doi.org/10.1016/S0168-583X(01)00710-8
Horowitz, Y. S., Rosenkrantz, M., Mahajan, S., Yossian, D., 1996. J. Phys. D: Appl. Phys. 29, 205-217. http://dx.doi.org/10.1088/0022-3727/29/1/031
J. Tauc, in: F. Abeles (Ed.), Optical Properties of Solids, North – Holland Amsterdam, 1970.
Jose, M. T., Anishia, S. R., Annalakshmi, O., Ramaswamy, V., 2011. Rad. Meas. 46, 1026-1032. http://dx.doi.org/10.1016/j.radmeas.2011.08.001
Kher, R. S., Upadhyay, A. K., Dhoble, S. J., Khokhar, M. S. K., 2008. Luminescence studies of MgSO4: Dy phosphors. Ind. J. pure and Appl. Phys. 46, 607-610.
Kittis, G., Ros, J. M.G., 2000. Nucl. Instrum. Methods A 440, 224-231. http://dx.doi.org/10.1016/S0168-9002(99)00876-1
Klug, P., Alexander, L. E., 1953. X – ray Diffraction Procedure. Wiley, New York, 1954.
Kracek, F. C., Gibson, R. E., 1930. The polymorphism of Sodium Sulphate. III. J. Phys. Chem. 34, 188-206. http://dx.doi.org/10.1021/j150307a014
Lochab, S. P., Sahare, P. D., Chauhan, R. S., Salah, N., Pandey, A., 2006. Thermoluminescence and photoluminescence study of Ba0.97Ca0.03SO4: Eu. J. Phys. D: Appl. Phys. 39, 1786.
Magarabi, M., Finch, A. A., Townsend, P. D., 2008. Structural and impurity phase transitions of LiNaSO4: RE probed using cathodo-thermoluminescence. J. Phys. Condens. Matter 20, 455207. http://dx.doi.org/10.1088/0953-8984/20/45/455207
Navarro, C. R., Doehne, E., Sebastian, E., 2000. How does sodium sulphate crystallize? implications for the decay and testing of building materials. Cement and concrete research 30, 1527- 1534. http://dx.doi.org/10.1016/S0008-8846(00)00381-1
Pan, L. K., Chang, Q. S., Li, C. M., 2004. Elucidating Si-Si Dimmer vibration from the size – Dependent Raman Shift to Nanosolidi Si. J. Phys. Chem. B 108, 3404-3406. http://dx.doi.org/10.1021/jp037891s
Panigrahi, A. K., Dhoble, S. J., Kher, R. S., Moharil, S. V., 2003. Thermo and mechanoluminescence of Dy3+ activated K2Mg2(SO4)3 phosphor. Phys. Stat. Sol. A 198, 322-328. http://dx.doi.org/10.1002/pssa.200306605
Parhi, P., Munivannan, V., 2008. Novel microwave assisted solid state metathesis synthesis of KMF3 (MZn, Mn, Mg and Co) Mater. Lett. 62, 3468-3470. http://dx.doi.org/10.1016/j.matlet.2008.02.078
Periasamy, A., Murugananda, S., Palaniswamy, M., 2009. Vibrational studies of Na2SO4, K2SO4, NaHSO4 and KHSO4 crystals. J. Chem. 2, 981-989.
Premkumar, H. B., Sunitha, D. V., Nagabhushana, H., Sharma, S. C., Nagabhushana, B. M., Rao, J. L., Kinshuk Gupta., Chakradhar, R. P. S., 2012. YAlO3: Cr3+ nanophosphor: Synthesis, photoluminescence, EPR, dosimetric studies. Spectrochim. Acta A. 96, 154-162.

Y.S. Vidya and B.N. Lakshminarasappa / Journal of Luminescence and Applications (2014) Vol. 1 No. 2 pp. 40-60
60
http://dx.doi.org/10.1016/j.saa.2012.04.028
Quadri, S. B., Yang, J. P., Skelton, E. F., Ratan, B. R., 1997. Evidence of strain and lattice distortion in lead sulfide nanocrystals. Appl. Phys. Lett. 70, 1020 – 1021. http://dx.doi.org/10.1063/1.118470
Salah, N., Khan, Z. H., Habib, S. S., 2011. Nanoparticles of Al2O3: Cr as a sensitive thermoluminescent material for high exposures of gamma rays irradiations. Nucl.Instrm. Methods B 269 (2011) 401-404. http://dx.doi.org/10.1016/j.nimb.2010.12.054
Sharma, B. A., Singh, A. N., Singh, S. N., Singh, O. B. K., 2009. Rad. Meas. 44, 32-37. http://dx.doi.org/10.1016/j.radmeas.2008.06.001
Sidike, A., Niyazi, K., Zhu, Jiang, H., Atobe, K., Yamashita, N., 2009. Photoluminescence spectra of thenardite Na2SO4 activated with rare – earth ions, Ce3+, Sm3+, Tb3+, Dy3+ and Tm3+. Physics and Chemistry of Minerals 36, 119-126.
Vij, A., Lochab, S, P., Singh, S., Kumar, R., Singh, N., 2009. Thermoluminescence study of UV irradiated Ce doped SrS nanostructures.J. Alloys. Compds. 486, 554-558. http://dx.doi.org/10.1016/j.jallcom.2009.07.003
Vij, A., Lochab, S. P., Kumar, R., Singh, N., 2010. J. Alloys Compd. 490, L33-L36. http://dx.doi.org/10.1016/j.jallcom.2009.10.075
Wiedemann, H. G., 1981. Thermal Studies on Thenardite. Thermochim. Acta 50, 17-29. http://dx.doi.org/10.1016/0040-6031(81)85039-3
Zhang, C. X., Leung, P. L., Tang, Q., Luo, D. L., Stokes, M. J., 2001. Spectral comparison of MgSO4 doped with Dy, Mn, P and Cu. J. Phys. D: Appl. Phys. 34, 1533-1539. http://dx.doi.org/10.1088/0022-3727/34/10/313