Synthesis Characterization and Properties of Silica-Nickel Nanocomposites through Chemical Route
12
E. Moyo et al. Int. Journal of Engineering Research and Applications www.ijera.com ISSN: 2248-9622, Vol. 5, Issue 7, (Part - 4) July 2015, pp.62-73 www.ijera.com 62|P a g e Synthesis Characterization and Properties of Silica-Nickel Nanocomposites through Chemical Route A.K.Pramanick Metallurgical and Material Engineering Department Jadavpur University, Kolkata- 700032, India. Abstract: There has been an increasing demand for high performance Nanocomposites which can withstand several conditions such as low and high temperature, pressure and atmosphere in various applications. In order to meet these demands, SiO 2 -Nickel Nanocomposites can be explored for important applications in various industries. Metals having sizes of the order of a few nanometers dispersed in silica matrix and their sintering mechanism have been discussed in this work. A Niihara approach is chosen to measure the micro-fracture toughness of silica-nickel Nanocomposites for both type of cracks found in this work. Keywords: Nanocomposites, sintering, micro-fracture toughness, Palmqvist crack, Median crack, Nickel, Niihara Nanocomposites consist of two or more phases, at least one phase having nanometer dimensions. A particular case is the dispersion of nanometer size phase within a host ceramic matrix. Ceramic materials are inherently resilient to oxidation and deterioration at elevated temperature. Some of these materials would be ideal candidates for use in high- temperature and severe stress applications, especially for components in automobile, aircraft, gas turbine engines and cutting tools. Fracture toughness values for ceramics materials are low and typically lie between 1 and 5 Mpa m 1/2 . By way of contrast, Kc values for most metals are much higher and lie in the range 15-150 Mpa m ½ [1]. The fracture toughness of ceramics /Silica can also be improved significantly by the development of new generation of ceramic/silica based metal like Ni, Co, Cu, Fe etc Nanocomposites. Synthesis and characterization of nanostructured materials have recently been studied world over and effort has been given for basic understanding [2-4]. In the last two decades synthesis, characterization and understanding a material with lower dimensions have become the most interesting area of research due to their novel properties and potential applications in different fields [5-9]. The transition metal nanoparticles such as Fe, Co and Ni have been given much attention due to their various applications in electronic, optical, and magnetic, recording , superconductors, mechanical devices and so on [10- 14]. In this present work, Silica-Nickel Nanocomposites have been developed by chemical route followed by their characterizations to be established. Silica- Nickel Nanocomposites powders developed by chemical route were used as a starting material for the study of sintering mechanism. This work focused on the relationship between the densification parameters and material properties of Silica-Nickel Nanocomposites depending on the Nickel contents and sintering temperature. Micro indentation method which does not require any specific geometry for the test specimen was used to evaluate the fracture toughness in this work. I. Experimental procedure Silica – Nickel Nanocomposites was synthesized using commercial silica gel powder by chemical route. In this typical process, each one with 1.44gm powder silica powder in the size range (100-200 mesh) is mixed with a homogeneous solution with 1 ml of distilled water, containing required amount of NiCl 2 , 100% excess glucose over stoichiometric requirement of complete reduction of NiCl 2 and stirred manually to prepare a homogeneous mixture . The resulting mixture is left for drying at room temperature. By this process, we also prepare the samples for 5 wt%, 10 wt%, 15 wt%, 20 wt% of Nickel with 100% excess glucose over that required for the complete reduction of NiCl 2 . The chemical composition of the samples is summarized in Table-1. RESEARCH ARTICLE OPEN ACCESS
-
Upload
ijera-editor -
Category
Documents
-
view
214 -
download
0
description
There has been an increasing demand for high performance Nanocomposites which can withstand several conditions such as low and high temperature, pressure and atmosphere in various applications. In order to meet these demands, SiO2-Nickel Nanocomposites can be explored for important applications in various industries. Metals having sizes of the order of a few nanometers dispersed in silica matrix and their sintering mechanism have been discussed in this work. A Niihara approach is chosen to measure the micro-fracture toughness of silica-nickel Nanocomposites for both type of cracks found in this work.
Transcript of Synthesis Characterization and Properties of Silica-Nickel Nanocomposites through Chemical Route

E. Moyo et al. Int. Journal of Engineering Research and Applications www.ijera.com
ISSN: 2248-9622, Vol. 5, Issue 7, (Part - 4) July 2015, pp.62-73
www.ijera.com 62|P a g e
Synthesis Characterization and Properties of Silica-Nickel
Nanocomposites through Chemical Route
A.K.Pramanick
Metallurgical and Material Engineering Department Jadavpur University, Kolkata- 700032, India.
Abstract: There has been an increasing demand for high performance Nanocomposites which can withstand several
conditions such as low and high temperature, pressure and atmosphere in various applications. In order to meet
these demands, SiO2-Nickel Nanocomposites can be explored for important applications in various industries.
Metals having sizes of the order of a few nanometers dispersed in silica matrix and their sintering mechanism
have been discussed in this work. A Niihara approach is chosen to measure the micro-fracture toughness of
silica-nickel Nanocomposites for both type of cracks found in this work.
Keywords: Nanocomposites, sintering, micro-fracture toughness, Palmqvist crack, Median crack, Nickel,
Niihara
Nanocomposites consist of two or more phases, at
least one phase having nanometer dimensions. A
particular case is the dispersion of nanometer size
phase within a host ceramic matrix. Ceramic
materials are inherently resilient to oxidation and
deterioration at elevated temperature. Some of these
materials would be ideal candidates for use in high-
temperature and severe stress applications, especially
for components in automobile, aircraft, gas turbine
engines and cutting tools. Fracture toughness values
for ceramics materials are low and typically lie
between 1 and 5 Mpa m 1/2
. By way of contrast, Kc
values for most metals are much higher and lie in the
range 15-150 Mpa m ½
[1]. The fracture toughness of
ceramics /Silica can also be improved significantly by
the development of new generation of ceramic/silica
based metal like Ni, Co, Cu, Fe etc Nanocomposites.
Synthesis and characterization of nanostructured
materials have recently been studied world over and
effort has been given for basic understanding [2-4]. In
the last two decades synthesis, characterization and
understanding a material with lower dimensions have
become the most interesting area of research due to
their novel properties and potential applications in
different fields [5-9]. The transition metal
nanoparticles such as Fe, Co and Ni have been given
much attention due to their various applications in
electronic, optical, and magnetic, recording ,
superconductors, mechanical devices and so on [10-
14].
In this present work, Silica-Nickel Nanocomposites
have been developed by chemical route followed by
their characterizations to be established. Silica-
Nickel Nanocomposites powders developed by
chemical route were used as a starting material for the
study of sintering mechanism. This work focused on
the relationship between the densification parameters
and material properties of Silica-Nickel
Nanocomposites depending on the Nickel contents
and sintering temperature. Micro indentation method
which does not require any specific geometry for the
test specimen was used to evaluate the fracture
toughness in this work.
I. Experimental procedure
Silica – Nickel Nanocomposites was synthesized
using commercial silica gel powder by chemical
route. In this typical process, each one with 1.44gm
powder silica powder in the size range (100-200
mesh) is mixed with a homogeneous solution with 1
ml of distilled water, containing required amount of
NiCl2, 100% excess glucose over stoichiometric
requirement of complete reduction of NiCl2 and
stirred manually to prepare a homogeneous mixture .
The resulting mixture is left for drying at room
temperature. By this process, we also prepare the
samples for 5 wt%, 10 wt%, 15 wt%, 20 wt% of
Nickel with 100% excess glucose over that required
for the complete reduction of NiCl2. The chemical
composition of the samples is summarized in Table-1.
RESEARCH ARTICLE OPEN ACCESS

E. Moyo et al. Int. Journal of Engineering Research and Applications www.ijera.com
ISSN: 2248-9622, Vol. 5, Issue 7, (Part - 4) July 2015, pp.62-73
www.ijera.com 63|P a g e
Table 1: Chemical composition of samples
Samples Water(H2O)
(cc)
Amt. of NiCl2
(gm)
Amt. of Dextrose
(gm)
Commercial grade silica-5wt% Nickel 1 0.16 0.07
Commercial grade silica-10wt% Nickel 1 0.32 0.14
Commercial grade silica-15wt% Nickel 1 0.48 0.22
Commercial grade silica-20wt% Nickel 1 0.64 0.29
Each dried sample containing Nickel chloride was reduced in tubular furnace at a temperature of 550oC under
the controlled flow of nitrogen for a period of 12 minutes. During heating, the dextrose breaks into carbon and
water vapour which again react to produce in situ hydrogen. This in-situ generated H2 in the nanopores reduces
the NiCl2 to metallic Nickel[15] as per the following reactions.
C6H12O6 → 6C+ 6H2O. (1)
6H2O + 6C → 6CO + 6H2 (2)
NiCl2 + H2 → Ni + 2HCl (3)
The obtained Nanocomposites have been characterized by X-ray diffraction (XRD), transmission electron
microscopy (TEM). The phase composition of the powders was determined by XRD using Cu Kα
monochromatic radiation in Regaku make ultima III, XRD instrument. The TEM images have been recorded
with a JEOL JEM 1010 microscope. The sizes of nanoparticles from each TEM image were measured and the
corresponding size histograms have been realized using specific software.
For the study of sintering mechanism, pellets of 15mm dia & 10mm height of ground Silica-Nickel
Nanocomposites are ground thoroughly in a mortar pastle and then about 3 drops of water is added for per gram
of Nanocomposites powder and mixed thoroughly, followed by uniaxial 5-ton load to yield a It is to be noted
that friction is large among Silica-Nickel Nanocomposites powder during compaction. Thus, it is difficult to get
dense green compaction. The use of water acts as a lubricant to yield comparatively dense green compact.
The pellets made from different samples as isothermally heated over the temperature range 1100oC – 1250
oC for
a fixed period of sintering time of 120 minutes in nitrogen atmosphere. After sintering the diameter of the pellets
are measured. Densification is then calculated by the relative shrinkage given by
(di – df)
Densification = Δd/di = -------------------- (4)
di
Where di & df stand for the diameter of the cylindrical sample before and after sintering.
Samples for the indentation toughness measurements were polished with fine alumina powder on the glass until
mirror like surface is achieved. Vickers indentations were made at test loads of 300, 500, 1000, 2000, 5000gf
and 10,000gf using a commercial hardness testing machine. The loading time was fixed at 10s. the indentation
sizes and the crack lengths were measured immediately after unloading.
The Vickers micro-hardness were calculated by the following equation
Hv = 463.6 P/a2
(Gpa) (5)
The Elastic Modulus of the sample was measured using Dynamic Elastic Properties Analyzer(DEPA).
The identification of the type crack is essential to the evaluation of the fracture toughness by the indentation
micro fracture techniques. The relationship of crack length(l) and Indentation load(p) for the four different
silica-nickel Nanocomposites possesses a distinct knee of transition at critical test load.
Distinct linearity exists in the region where load P is less that of the knee. In the regions higher than the critical
load, linearity of data is not as good. Therefore, below this load, crack region is palmqvist and above is median
crack region. Using equation of Nihara et al [eq6] and Nihara et al [eq. 7] fracture toughness for above
samples were evaluated both for palmqvist and median type of crack respectively.
Palmqvist Cracks
Niihara et al [15]
KIC (φ /H a ½) (H/E φ)
0.4 = 0.035(l/a)
-1/2 (6)
Median cracks
Niihara et.al [15],
KIC (φ / Ha ½) (H / E φ) 0.4
= 0.129 (c/a ) -3/2
(7)
In the above equation φ is the ratio of the hardness to the yield stress, (Hv/σy), which is about 3.

E. Moyo et al. Int. Journal of Engineering Research and Applications www.ijera.com
ISSN: 2248-9622, Vol. 5, Issue 7, (Part - 4) July 2015, pp.62-73
www.ijera.com 64|P a g e
Results and discussion
Fig.1& Fig.2 represent the typical XRD patterns of commercial silica gel samples containing 5 wt% & 20 wt%
Nickel, respectively. The highest intensity peak in each case has been used to compute the size of the Nickel
using Scherrer formula[16] and tabulated in Table2.
The Table.2 contains the particle sizes of Nickel for different samples and it is found that 36 nm, 42 nm, 51 nm
and 61 nm for commercial silica-5 wt%, 10 wt% 15, wt%, and 20 wt% Nickel Nanocomposites respectively.
The dhkl value of each is computed and compared with the standard dhkl values of metallic Nickel. This
comparison is shown in Table 3. From the table we observe that the comparison is good. This suggests the
preparation of pure metallic Nickel. In each figure, peaks corresponding to Nickel are marked, The value of
Sinθ/λ in each of samples for the hump is 0.117, very close to 0.12 which is attributed to amorphous silica[17].
This is plausibly due to slow kinetics of crystallization of amorphous silica arising out of lower reduction
temperature for a shorter period of time.
Fig.3 & Fig4 represent the typical TEM image of the commercial silica - 5 wt% Nickel & 20wt% Nickel
Nanocomposites. Fig.3& Fig.4 showing the nickel particles of nanometric dimension are clearly visible in TEM
images.
Fig.5 & Fig. 6 represent the typical SAED (Selected Area Electron Diffraction) pattern for the commercial
silica - 5 wt% Nickel & 20wt% Nickel Nanocomposites. SAED pattern of the samples were used to compute the
interplanar spacing and compare with the standard dhkl of Nickel. Table 3 shows that the agreement between the
standard and experimental dhkl are good. This suggest that dhkl of Ni and this is agree mental with the findings of
XRD ( Ref. JCPDS)
Fig.7 Fig 8 represent the lattice image, from which the interplanar spacing were measured directly which
coincide with the standard value of metallic nickel.
0 10 20 30 40 50 60 70 80 90
100
200
300
400
500
600
700
800
900
Ni
Ni
Inte
nsity(a
.u)
2theta(degree)
Fig. 1 XRD pattern of sample containing commercial grade Silica - 5wt% Nickel heat treated at 550oC
for 12 minutes in nitrogen atmosphere

E. Moyo et al. Int. Journal of Engineering Research and Applications www.ijera.com
ISSN: 2248-9622, Vol. 5, Issue 7, (Part - 4) July 2015, pp.62-73
www.ijera.com 65|P a g e
0 10 20 30 40 50 60 70 80 90
0
500
1000
1500
2000
2500
3000
3500
NiNi
Ni
Ni
Inte
nsity(a
.u)
2theta(degree)
Fig. 2 XRD pattern of sample containing commercial grade Silica - 20wt% Nickel heat treated at 550oC
for 12 minutes in nitrogen atmosphere
Fig. 3 TEM image of sample containing commercial grade Silica - 5 wt% Nickel
Ni
SiO2
E. Moyo et al. Int. Journal of Engineering Research and Applications www.ijera.com
ISSN: 2248-9622, Vol. 5, Issue 7, (Part - 4) July 2015, pp.62-73
www.ijera.com 66|P a g e
Fig. 4 TEM image of sample containing commercial grade Silica - 20 wt% Nickel
Fig. 5 SAED pattern of sample containing commercial grade Silica -5 wt% Nickel
SiO2
Ni

E. Moyo et al. Int. Journal of Engineering Research and Applications www.ijera.com
ISSN: 2248-9622, Vol. 5, Issue 7, (Part - 4) July 2015, pp.62-73
www.ijera.com 67|P a g e
Fig. 6 SAED pattern of sample containing commercial grade Silica -20 wt% Nickel
Fig.7 Lattice image of sample containing commercial grade Silica -5 wt% Nickel

E. Moyo et al. Int. Journal of Engineering Research and Applications www.ijera.com
ISSN: 2248-9622, Vol. 5, Issue 7, (Part - 4) July 2015, pp.62-73
www.ijera.com 68|P a g e
Fig. 8 Lattice image of sample containing commercial grade Silica -20 wt% Nickel
Table 2 contains the particle sizes of Nickel
Samples Nickel crystallite
size from XRD
Nickel particle size from
TEM image
Commercial grade Silica-5wt% Nickel 36nm 38nm
Commercial grade Silica -10wt% Nickel 42nm 45nm
Commercial grade Silica -15wt% Nickel 51nm 54nm
Commercial grade Silica -20wt% Nickel 61nm 63nm
Table 3 contains interplanar spacing and compare with the standard dhkl of Nickel
Samples d (111) value
from XRD
d value from
TEM lattice
image
d (111) value from
SAED pattern
d (111) value from
JCPDS Card
No. 03-1051
Commercial grade Silica -5wt% Nickel 0.204 nm 0.211 nm 0.206 nm 0.202 nm
Commercial grade Silica -10wt% Nickel 0.203 nm 0.210 nm 0.212 nm 0.202 nm
Commercial grade Silica -15wt% Nickel 0.203 nm 0.208 nm 0.206 nm 0.202 nm
Commercial grade Silica -20wt% Nickel 0.203 nm 0.209 nm 0.209 nm 0.202 nm
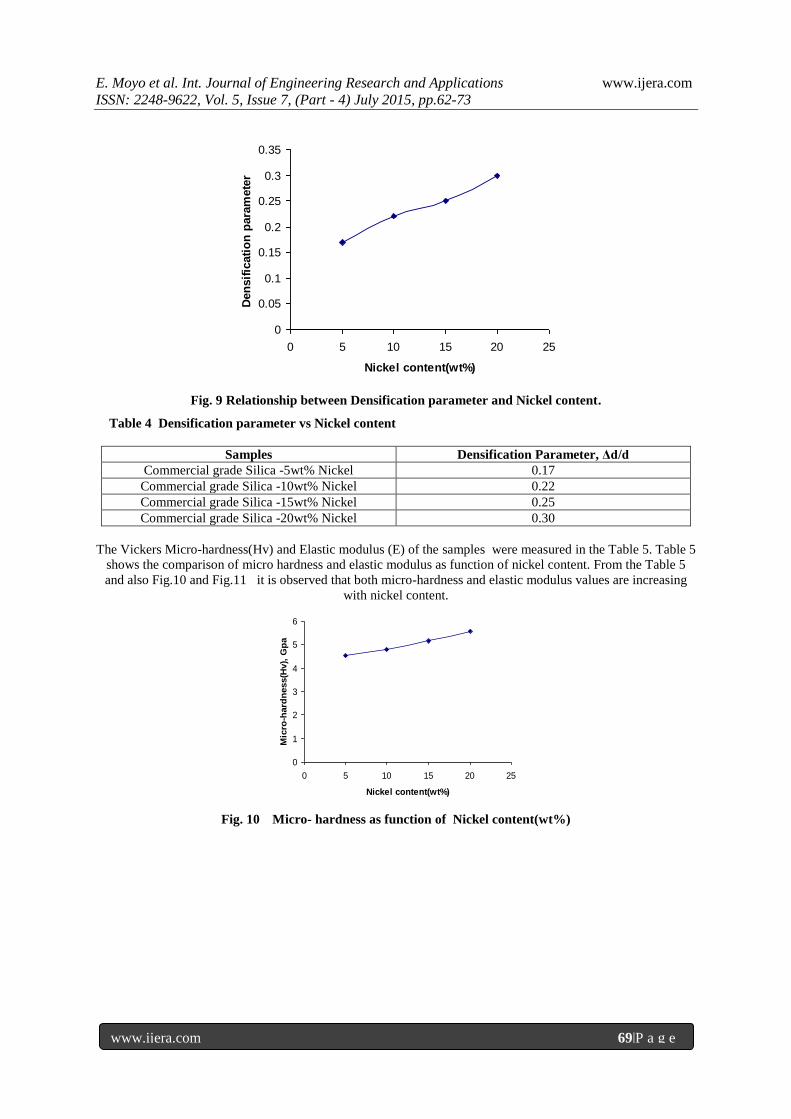
The densification as a function of nickel content at 1250 oC for 120 minutes is summarized in the table 4.
Table 4 and corresponding Fig 9 shows variation of densification as function of nickel content during
isothermally sintered at 1250oC for a fixed period of time. The kinetic of sintering is influenced by the
temperature and duration of time employed. The Fig exhibits that for any fixed content of nickel, initially the
rate is slow followed by slow rate of densification due to start with prior to formation of liquid, the system is
more porous. Thus, the formation of liquid with time increases which causes rearrangement of powder packing
by surface tension immediately and increases densification with increased amount of nickel content.
E. Moyo et al. Int. Journal of Engineering Research and Applications www.ijera.com
ISSN: 2248-9622, Vol. 5, Issue 7, (Part - 4) July 2015, pp.62-73
www.ijera.com 69|P a g e
Fig. 9 Relationship between Densification parameter and Nickel content.
Table 4 Densification parameter vs Nickel content
Samples Densification Parameter, Δd/d
Commercial grade Silica -5wt% Nickel 0.17
Commercial grade Silica -10wt% Nickel 0.22
Commercial grade Silica -15wt% Nickel 0.25
Commercial grade Silica -20wt% Nickel 0.30
The Vickers Micro-hardness(Hv) and Elastic modulus (E) of the samples were measured in the Table 5. Table 5
shows the comparison of micro hardness and elastic modulus as function of nickel content. From the Table 5
and also Fig.10 and Fig.11 it is observed that both micro-hardness and elastic modulus values are increasing
with nickel content.
Fig. 10 Micro- hardness as function of Nickel content(wt%)
0
0.05
0.1
0.15
0.2
0.25
0.3
0.35
0 5 10 15 20 25
Nickel content(wt%)
Den
sif
icati
on
para
mete
r
0
1
2
3
4
5
6
0 5 10 15 20 25
Nickel content(wt%)
Mic
ro-h
ard
ness(H
v),
Gp
a

E. Moyo et al. Int. Journal of Engineering Research and Applications www.ijera.com
ISSN: 2248-9622, Vol. 5, Issue 7, (Part - 4) July 2015, pp.62-73
www.ijera.com 70|P a g e
Fig. 11 Elastic modulus as function of Nickel content
Table 5 Comparison of micro- hardness and elastic modulus vs Nickel content(wt%)
Samples Micro-hardness(Hv)
Gpa
Elastic Modulus(E)
Gpa
Commercial grade Silica -5wt% Nickel 4.52 61.15
Commercial grade Silica -10wt% Nickel 4.80 65.20
Commercial grade Silica -15wt% Nickel 5.16 68.11
Commercial grade Silica -20wt% Nickel 5.57 73.60
Fracture toughness vs. different loads for both types of cracks for all compositions of samples and the
corresponding data are included in table 6 and table 7 and are depicted as the function of test load P in Fig.12 &
Fig.13 respectively. These results exhibit a range of values from 1.81-3.71 Mpa m -1/2
. The results indicate that
fracture toughness of Silica-Nickel Nanocomposites increases with nickel content. With increase in load, the
fracture toughness changes hardly (change is in two order of magnitude) whereas the increase in nickel content
there is significant change in fracture toughness This is amply clear from the visual inspection of Fig. 12 and
Fig. 13 This is attributed due to the fact that with more of nickel content, the probability of crack being arrested
during propagation is more and this makes the fracture toughness of the sample more.
Similar observation was found for median type of crack at high load. Only change of fracture toughness with
load is more when compared with palmqvist type of crack. Fig15 & Fig 16 represent the typical micro crack
indentation of Silica-5wt% and 20 wt% Nickel samples respectively.
Fig. 12 Fracture toughness(Mpa m ½) according to Palmqvist crack model and Median crack
model as function of indentation load.
0
10
20
30
40
50
60
70
80
0 5 10 15 20 25
Nickel content(wt%)
Ela
sti
c m
od
ulu
s(E
), G
pa
0
0.5
1
1.5
2
2.5
0 20 40 60
Indentation load(p), N
Fra
ctu
re t
ou
gh
ness(K
IC),
Mp
a m
1/2
Silica-5wt% Nickel
Silica-10wt% Nickel

E. Moyo et al. Int. Journal of Engineering Research and Applications www.ijera.com
ISSN: 2248-9622, Vol. 5, Issue 7, (Part - 4) July 2015, pp.62-73
www.ijera.com 71|P a g e
Table. 6 Indentation load(p) vs Fracture toughness(Mpa m ½)
Indentation
load(p),N
Fracture toughness( Mpa m ½)
Commercial grade Silica-5wt%Nickel Commercial grade Silica-10wt%Nickel
2.94 1.32 1.50
4.90 1.33 1.52
9.81 1.36 1.57
19.62 1.67 2.09
49.05 1.81 2.35
Fig. 13 Fracture toughness(Mpa m
½) according to Palmqvist crack model and Median crack model as
function of indentation load.
Table. 7 Indentation load(p) vs Fracture toughness(Mpa m ½)
Indentation
load(p),N
Fracture toughness( Mpa m ½)
Commercial grade Silica-15wt% Nickel Commercial grade Silica-20wt% Ni
4.90 1.91 2.23
9.81 1.97 2.38
19.62 2.12 2.56
49.05 2.89 3.36
98.10 2.99 3.71
Fig. 14 Fracture toughness as function of Nickel content
0
0.5
1
1.5
2
2.5
3
3.5
4
0 50 100 150
Indentation load(p), N
Fra
ctu
re t
ou
gh
ness(K
IC),
Mp
a m
1/2
Silica-15wt% Nickel
Silica-20wt% Nickel
0
0.5
1
1.5
2
2.5
3
3.5
4
0 5 10 15 20 25
Nickel content(wt%)
Fra
ctu
re t
ou
gh
ness(K
IC),
Mp
a m
1/2

E. Moyo et al. Int. Journal of Engineering Research and Applications www.ijera.com
ISSN: 2248-9622, Vol. 5, Issue 7, (Part - 4) July 2015, pp.62-73
www.ijera.com 72|P a g e
Table 8 Comparison of Fracture toughness(Mpa m 1/2
) vs Nickel content(wt%)
samples Fracture toughness
(Mpa m ½)
Commercial grade Silica-5wt% Nickel Nanocomposites 1.81
Commercial grade Silica-10wt% Nickel Nanocomposites 2.35
Commercial grade Silica-15wt% Nickel Nanocomposites 2.99
Commercial grade Silica-20wt% Nickel Nanocomposites 3.71
Fig. 15 Micro-crack indentation of sintered commercial grade Silica-5 wt% Nickel Nanocomposite
Fig. 16 Micro-crack indentation of sintered commercial grade Silica-20wt%Nickel Nanocomposite
Conclusions 1. Silica-Nickel Nanocomposites (using
commercial grade silica) have been
successfully synthesized via chemical route
through in-situ reduction at 550oC for
different percentage of Nickel phase pure
metallic has been confirmed by XRD & SAED
analysis.
2. The particle size of Nickel computed by
Scherrer formula is in the nanometric level as
observed from the X-ray diffraction patterns. It
is observed that the Nickel particle size
ranging from 36 to 61nm for different Nickel
content in the silica matrix from 5wt% to
20wt%, is in good agreement with obtained
from TEM analysis.
3. Study of sintering behaviour of commercial
grade Silica-Nickel powder shows that the
densification parameter increases with
temperature and maximum densification can
be obtained at 1250oC for 2 hours and also
shows that sintering temperature is the main
factor which determines densification.
4. Micro-hardness calculated from indentations is
almost constant regardless of the test load.

E. Moyo et al. Int. Journal of Engineering Research and Applications www.ijera.com
ISSN: 2248-9622, Vol. 5, Issue 7, (Part - 4) July 2015, pp.62-73
www.ijera.com 73|P a g e
5. The Micro hardness of Silica-Nickel
Nanocomposites increases as the Nickel
content in silica matrix increases and
maximum value is achieved in Silica – 20 wt%
Nickel Nanocomposites.
6. Fracture toughness of Silica-Nickel
Nanocomposites for different compositions
enhances significantly as Nickel content in the
silica matrix increases and maximum value is
achieved in Silica-20 wt% Nickel
Nanocomposites.
References [1.] Hull. D. T. W. Clyne. An Introduction to
Composite Materials, 2nd
edition, Cambridge
Universitypress, New York, 1996.
[2.] Gao Y.Q, Bando Y, Nature, 415, 599, 2002.
[3.] Gorla C.R,Emanetoglu N.W, Liang S, Mago
W.E, Lu Y, Wraback M, M..Shen M, Journal
of Applied Physics. 85, 2595, 1999.
[4.] Aldal J, Rico- Gracia J.M, Lopez-Alonso J.M,
Boreman S Nanotechnology 16, 230, 2005.
[5.] Gao Y.Q, Bando Y, Nature, 415 p. 599, 2002.
[6.] Rodriguez J. A, Jirsak T, J. Drorak,
S.Sambasivan, D. Fischer, J. Phys. Chem.B
104,319, 2000.
[7.] Corla C.R, Emanetoglu N.W. Liang S.,.Mago
W.E,.Wraback. Y.Lu, M, Shen H.J.Appl.
Phys. 85, 2595, 1999.
[8.] Aldal J., Rico-Garcia J, M.Lopez- Alonso J.M,
Boreman G, Nanotechlogy, 16 230, 2005.
[9.] .Lee J.H, Song W.C, Yi J.S., Yang K.J, Hang
W.D, Thin Solid Films, 349, 431, 2003.
[10.] Prinz G.A., Science, 282,1660, 1998.
[11.] Khizroev S, Litvinov D, Nanotechnology, 15,
7, 2004.
[12.] Klimenkov M, Von Borany J, Matz W, Eckert
D.,.Wolf M, Mueller K.H., Appl.Phys A 74
571, 2002.
[13.] Wagner M.L, Schmidt L.D, J.Phys.Chem,. 99,
805, 1995.
[14.] .Schmid G, Chi L.F, Adv. Mater,10, 515,
1998.
[15.] Das G.C, Basumallick A, Mukherjee S, 1990
Bulletin of Material Science, 13,255-258.
[16.] Cullity B.D, 1978 Elements of X-ray
Diffraction, Addison-Wesley, Reading, Mass.
[17.] Warren B.E and.Biscal J, Am 1938 J. Ceram.
Soc,21, 49